Embed Size (px)
Citation preview

1
THE DETERMINANT OF SAVINGS IN NIGERIA
(1985-2011)
BY
ONUOHA OZIOMA
EC/2009/681
BEING A RESEARCH PORJECT SUBMITTED TO THE
DEPARTMENT OF ECONOMICS
CARITAS UNIVERSITY AMORJI ENUGU STATE
SUBMITTED IN PARTIAL FULFILLMENT OF T HE
REQUIREMENT FOR THE AWARD OF BACHELOR OF
SCIENCE (B.SC) DEGREE IN ECONOMICS
AUGUST, 2013

2
APPROVAL PAGE
This project has been approved as satisfying the requirements of the
department/faculty of management and social science, Caritas University Enugu
State for the award of Bachelor of Science (B.Sc.) Degree in economics.
----------------------------- -------------------------
Mr. Odionye J. C. Date
(Project Supervisor)
Barr, P.C Onwudinjo ---------------------------
(Head of Department) Date
------------------------- ----------------------------
Dr. C.C. Umeh Date
Dean of Faculty
---------------------------- --------------------------
External Examiner Date

3
DEDICATION
This noble research work is faithfully dedicated to the Almighty God,
through the help of our mother Mary, and to my parents.

4
ACKNOWLEDGMENT
I am delighted to God Almighty for his blessing in my life. My profound
gratitude goes to my parent Mr. and Mrs. A.C. Onuoha, my brothers and sister for
their care and financial support.
My sincere appreciation goes to my project supervisor Mr. J.C. Odionye
who gave out his time to ensure the success of this research work.
To my humble Lectures Dr. C.C. Umeadi, Prof. Udabah, Prof.ONnah, Mr.
Uche, E.O, Mr. Odike, Mr. Ojike,Mr. Odo and Mr. Osoduru for all their support
and teachings.
My profound gratitude goes to my love ones, Modester Augustine, Prisca,
Faith, Wisdom and friends, Tochukwu, Oluchi, and Vivian and all my room mates.
And all who in one way or the other supported me in my academic life.
Thank you all.

5
ABSTRACT
The term savings refers to the part of income immediately spent or consumed but
reserved for futureconsumption, investment or unforeseen contingencies. This
study examines the determinants of savings in Nigeria between 1985-2011, which
will enable us to proffer solution for the improvement of savings in the economy,
since it is an important component of the economic development of any country.
The method of analysis used in testing the hypothesis are coefficient of multiple
determination {R2}, T –test,F-statistics. Data for the study was obtained from the
central bank of Nigeria statistical bulletin, the major findings was that per capita
disposable income{pdy} has a positive and significant impact on aggregate savings
in Nigeria. Based on the findings, some recommendations of policy and
suggestions have been made.
6
CHAPTER ONE
1:1 BACKGROUND OF THE STUDY
Capital formation is an important factor of an economy growth. For a
country like Nigeria to attain economic growth, serious effort should be geared
towards capital formation by encouraging savings.
The financial institution markets, regulators and instrument interact within an
economy to provide financial services such as foreign exchange transaction,
financial intermediation and resources mobilization and allocation.
The financial system in Nigeria can be categorized into two, the
formal (organized) and informal (unorganized) financial system. The formal
financial system is categorized into capital and money market institutions and these
comprises of the banks and non banks financial institution, while the informal
sector is made up of the local money lenders (Esusu), the thrifts and savings
associations, merchants, shopkeeper or traders, friends and relatives etc. here the
system is poorly developed, limited economic information, defective system of
accounting and not integrated into the formal financial system. But it is very
important and plays a major role in the Nigerian financial system.
7
Miracle and Cohen (1980) noted that a great bulk of the African population makes
little or no use of formal saving and lending institutions, because they offer
relatively low returns, savers are reluctant to use formal institutions.
The crucial role played by the financial system in the economic development
of an economy was recognized by Gold Smith (1955), Cameron (1967), McKinnon
(1973), and Shaw (1973), they demonstrated that the financial sector could be a
catalyst of economic growth if it is well developed and healthy. Over the past
decades, the declining rends in saving rates in Nigeria have been of great concern
to the policy makers and researchers. This is due to the critical importance of
savings for the maintenance of strong and sustainable growth in the world
economy especially in Nigeria. A sound, developed, healthy and reliable financial
system relate to saving mobilization efficient financial intermediaries roles, is first
to reduce hoarding and help spread the risk between household and firms.
Secondly, hey create liquidity in the economy by borrowing short term and
lending long term loan. Thirdly disseminate information between ultimate lenders
and ultimate borrowers there by mobilizing savings from surplus units and
channeling them to deficit units through the help of financial techniques,
instruments, and institution. Fourth, lower interest rate by bringing about stability
in capital market. Fifth, the intermediaries promote development in the financial
transaction. Gibson and Isiaka Lobos (1994). The Nigeria financial system

8
comprises he regulatory/supervisory authorities, bank and non bank financial
institution.
As at the end of 2007, the system comprised of the regulatory/supervisory
authority. The Central bank of Nigeria (CBN), the Nature Insurance Commission
(NAICOM), the Nigeria Deposit Insurance Corporation (NDIC). The Securities
and Exchange Commission (SEC) and finally the Federal Mortgage Bank of
Nigeria (FMBN). The CBN is the principal regulator and supervisor in the money
market followed by deposit money banks (DMBS), Discount Houses, the people
bank of Nigeria and Community Banks. The CBN exclusively regulates the
activities of the finance companies and promotes the establishment or specialized
or development financial institution.
The security and exchange commission (SEC) is the apex regulatory
authority in the capital market. The Nigeria stock exchange (NSE) is a self
regulatory or user regulatory institution. The issuing house, registrars and stock
brokers, who also interact with the money market, complete the chain the capital
the NAICOM is the regulatory authority in the insurance industry while FMBN
regulates mortgage finance activities in Nigeria.
Saving refers to the part of income not immediately spent or consumed
but reserved for future consumption, investment or unforeseen contingencies, it is
considered as an indispensable weapon for economic growth and development. Its

9
role is reflected in capital formation through increase in capital stock and the
impact its makes on the capacity to generate more and higher income.
Savings can also be known as a sacrifice of current consumption that
provides for the accumulation of capital, which in turn, provides additional output
that can potentially be used for consumption in the future(GERSOVIZ 1988).in
other words savings is the different between current earnings and consumption. We
can also define savings as he deposit and saving ability acquired by the organized
financial institution including bank and non banking financial intermediaries or it
is described as a financial accumulated by the public, both government and private
agents in the organized financial channels. These financial assets include savings
and time deposit in the banking institution provident funds, insurance premium
stocks and bonds etc.the intermediation process involves moving funds from
surplus sectors of the economy to deficits sector units(Nnann and Englama
2004).To expand financial savings involves shifting of fund from the personal and
household sector to the business or corporate sector which in turn leads to greater
investment, income growth, employment and capital formation, which cannot be
achieved without increasing the rate of savings.
Nigerians savings still falls below the requirement of its financial system
due to low per capital income, under investment in productive instruments, and
investment in unproductive channels e.g. Glod, jewel, income inequalities and

10
demonstration effects, etc.to remedy this problem depend on the level of
development of the financial sector mentioned above as well as the saving habit of
the citizens. The availability of investible funds can be a starting point for all
investment. In the economy which will eventually translate to economic growth
and development (Uremadu 2006).
The relationship among savings, investment and growth has historically been
very close, hence the unsatisfactory growth performance of several developing
countries, example Nigeria, has been attributed to poor savings and investment.
This poor growth performance has generally led to a dramatic decline in
investment. Domestic savings rates have not better, thus worsening the already
uncertain balance of payment position, the role of savings in the economic growth
of any country cannot be overemphasized (Cheta 1999). Conceptually, savings
represent that part of income not spent on current consumption.
Institutions in financial sector like deposit money banks (DMBS) commercial
Banks mobilize savings in an economy, the deposit rate must be relatively high and
inflation rate stabilized to ensure a high positive real interest rate which motivates
investors to save from their disposable income.
In Nigeria Odoko and Englama (2004) are of the view that the level of funds
mobilization by financial institution is quite low due to a number of reason,
ranging from low savings deposits rates of the poor banking habit or culture of

11
people. According to them another impediment to funds mobilization is the
attitudes of banks to small savers.
Another limitation of saving mobilization is the fact that the concentrations of
banks are heir offices are based in favour of urban areas. Among the reasons for
this, is the fact that the established banks under rate the volume of savings seeking
to be mobilized and channeled into productive investment in the rural areas. It is
often argued that since the rural economy operates at a near subsistence level, there
is very little that can be squeezed out of income and consumption. Because of this,
it has not been realized that the large volume of idle funds, through is small units
per individuals exist in the rural areas.
In Nigeria there is basically lack of incentives to savings which had
adversely affected savings. Some of these factors include poor banking habits,
attitude of banks to small savers, poor orientation, unemployment, instability in the
political system etc, corrupt taxation system, instability in banking system etc. one
of the problems of mobilizing savings and deposits has always been a major
problem for economic growth and development in Nigeria.
According to Friedman (1952) the impact of health on saving has been long
recognized in theory, but its effect on the aggregate savings have been considered
to be over shadowed by another factor, inflation causes price of tangible assets to
rise sharply and changes in net worth based on rising market value giving the

12
illusion of well being the magnitude of the impact of wealth on saving rate may
have the reassured experiences of economic crisis have highlighted the fact low
and declining saving rate have contributed to generate unsustainable current
account deficits in many countries.
The above arguments underscores the fact that there exist a link between savings
and the growth performance of the economy, both in Nigeria and in the world over.
This necessitates the need to carry out a detailed study of what actually determines
the rate of savings in the contexts of Nigeria economy.
1.2 STATEMENT OF THE PROBLEM
Saving is a macro-economic variable used to attain economic growth and
development (Wikipedia encyclopedia, 2009). In Nigeria, there is lasting need to
further step-up efforts in mobilizing small savings in both urban and rural areas,
given the poor savings culture of the Nigerian people and the theoretical link
between saving and investment which underscore the importance of savings on the
growth of every economy. When savings are low, interest rate increases and
investments becomes low there will be low income and decrease in the Gross
National Product (GNP) and Gross Domestic Product (GDP) of the nation which
leads to the poor living standard of the people and hinders the depositors from
savings.
13
This research work would attempt to examine the magnitude and nature of such
variable as interest rate, inflation, income, urbanization on savings in Nigeria.
1.3 RESEARCH QUESTION
Important research question that arise include what are then the determinant
of saving in Nigeria economy? Could it be that there are few dominant
determinants of saving due to our poor economy? Could these dominants be
consumption rather and interest or many more? Why is the rate of savings in
Nigeria very low? Is it as a result of saving in Nigeria very low? Is it as a result of
policies requiring further review to make if effective the study intends to answer
these questions?
1.4 OBJECTIVES OF THE STUDY
The broad objectives of the study are to examine the determinant of savings
in Nigeria economy. However, the specific objectives are as follows.
1. To determine the impact of savings on the economic growth
2. To determine whether consumption expenditure is a major determinant of
savings in Nigeria economy.
3. To determine the magnitude and nature of the elasticity’s of the savings
functions in Nigeria.

14
1.5 SIGNIFICANCE OF THE STUDY
The findings and subsequent proposal would be useful to policy makers in
policy formations. This study as believed by the researchers would go a long way
in contributing to the academic development of the theories of determinant of
savings in Nigeria, student of economics and other related fields, would find the
study very useful and would serve as a reference point to future researches who
might want to research further on the topic.
1.6 STATEMENT OF THE HYPOTHESES
H1: the determinant of savings in Nigeria cannot be ascertained
H2: the magnitude and nature of the elasticities of the savings functions in
Nigeria cannot be determined.
H1: the factor that influence savings have no significant determinant in
Nigeria.
H2: saving has no significant impact on economic growth.
1.7 SCOPE AND LIMITATION OF THE STUDY
The scope of this study is to estimate and evaluate the determinants of
savings in Nigeria (1980-2008). The research has been contained by lack of fund,

15
human error and limited time frame which imposed difficulties when serious
attempt to effect a general in depth towards the study of the determinants of saving
in Nigeria.
16
CHAPTER 2
This chapter deals with the literature review which entails, the theoretical
frame work, of savings in Nigeria including the empirical evidence of savings in
Nigeria.
THEORETICAL LITERATURE
There are a number of determinants of savings; these are the major forces
that shape the economic scenario of the country. All the sometime, determinants of
savings are also responsible for the development or down fall of the investment
sector of a country. There are a number of factors that are termed as the
determinants of savings. Some of the factors are the demographics of a particular
region or county.
A life – cycle hypothesis was formulated by modighani (1970) and is the
principle theoretical under pining that has guided the study of savings behavior
over the years. A critical analysis of this theory however shows that it seems to
indicate what happens in developing countries like Nigeria.
There are number of reasons that make it imperative for savings behavior in
developing countries to be modeled.
17
Separately from that in developed countries. First, at the microeconomics level,
developing country households tend to be large and poor. They have different
demographics, structure, most of them are likely to be engaged in agriculture and
their income prospects are much more uncertain. Second, at the macroeconomics
level both developing and developed courtiers are concerned with savings and
growth, with the possible distribution of aggregate savings and with savings as a
measure of economic performance. Third, much of the literature in the past five
decades expresses the belief that he saving is too low and that development and
growth are impeded by the shortfall. Sometimes the problem is blamed on the lack
of government policy. Lastly saving is more difficult to measure in developing
economics than in advanced economics.
2.1 CONCEPTS OF SAVINGS
Saving is the process of withholding current income for future use and
results in the accumulation of tangible and financial assets. The amount
accumulated over past period is referred to as savings. According to Green Wald
1982 he states that the reverse of saving is when current expenditure exceeds
current income is termed disserving savings and dissaving occur within all major
groups of the country individuals business and government, two concepts of
savings are used in national income accounting net and gross savings.

18
On net basic individuals save when personal income after taxes exceed
personal out lays, business save through rational profit and governments save when
current receipts exceeds current expenditures.
According to Feldstein (1976:77) gross national savings is the source for
additions to stock of tangible assets, including investment in homes as well as in
business inventories and plant and equipment, He further states that for the
economy as a whole gross saving equals gross investment.
Duisenberg (1949:840) complement by stating that by far the major portion
of gross saving consists of capital consumption allowance, which accrue chiefly to
the business sector.
Friedman (1975:840) defines personal savings in the national income
accounts represents the residual obtain subtracting personal outlays from
disposable person income consists of the after tax income of individual from wage
and salaries (including fringe benefits or other labour income). Further defined
personal saving to represent the changes in net worth of individuals place the
amount saved from currents income into tangible and financial assets and debt in
the process of acquiring assets the change in net worth should equal to the amount
of personal saving out of income.

19
2.1.2 THE DETERMINANTS OF SAVING
Many theories have been advanced and especially studied to explain the
saving behavior of individual both as separate entities or groups and in the
aggregate. Basically, individual forgo spending all of their income, and thus save
in order to have assets in the future to meet unexpected emergencies, to purchase
goods and services in the future to provide retirement income, or leave to
beneficiaries.However, in practice, preferred for future over current consumption
vary wide with some consumption being dissevers and other average or high
savers.
Green wale (1982:839) lay emphasizes that empirical studies have shown
that the percentage of income saved rises. The order the age group up to time of
retirement. Green wale further emphasized that it has been demonstrated that not
only the amount but also the percentage saved tends to be higher saving rate. Fried
man (1957) argues that classical economic theory revolves around the
consumption, Fried man goes on by stating that under Keynesian theory, it is
assumed that consumption is a stable and dependable function of real income and
that as the aggregate real income of the economy increases, consumption will not
rise proportionally causing the saving rate of rise.

20
2.1.3 MOBILIZATION OF PRIVATE SAVINGS OTHERR
GOVERNMENT ACTIONS
Adams (1978:559) reasons that since one important share of private saving
generally is contributed by business government and can attempt to increase
business savings by policy actions favourable to private firms, tax incentives e.g
accurate depreciation allowance, tax credit.
The purchase of capital goods or tariff for reduction are frequently used for this
purpose while subsidy can be Justified on the grounds that it off sets the
disincentives effects of imperfect capital market which make the cost of
borrowing high indiscriminate use of tax incentive tend to be provided for the
purchase of machinery and equipment but not for the hiring of labour. Thirdly,
Adam (1975:559)further states that problems are created for the government
budgets which would be faced with a decline in tax incentives can be an important
toile for mobilizing savings.
Zuvekas is of the view that government can also encourage the development
of co – operatives, and loan association and other private institute to mobilize the
saving of lender and middle income groups. A secondary effect has been the
creation of a considerable number of Jobs in constitution thus benefiting lower.

21
Zuvekas concludes saying that government sometime play a more direct role in
the Mobilization of small savings, postal savings scheme, for example, have made
significant contribution to domestic savings in Japan and Taiwan, and they have
also been successful in other African countries.
Government has experimented with variety of other measures to encourage
greater private saving to some extent the measures described above can mobilize
private savings indecently or financial liberalization.
2.1.4 STYLIZED EVOLUTION OF SAVINGS IN NIGERIA
The Nigerian economy comprises of the public and private
sector with both engaging in investment expenditure. Both sectors borrow in order
to meet their investment requirements.
The immediate source of funds is personal or own saving and others are the
government which represents the public sector collects revenue from both tax and
non tax sources. After meeting USA expenditure requirement on purchases of
goods and services the government uses whatever surphes they gave to increase its
stock of capital for investment purposes. When investment expenditure exceeds the
level of savings the private and the public sectors mainly borrow from the financial
institutions. The financial institutions in providing funds or credit for investment in
Nigeria include deposit money banks (OMBS) mortgage institutions and
development finance institutions. Other sources include non – bank financial

22
institution like the insurance companies, the capital and equipment leasing
companies (mural trust fund, pension fund). The provide the largest portion of the
domestic funds for investment.
In the late 1970’s and early 1980’s Nigeria witnessed tremendous economic
growth as a result of the oil boom, which gave rise to investment boom especially
in the public sector. However when the oil markets collapsed in the 1980’s
investment equally feel thereby resulting to fail in economic growth.
Although the rise in price of oil during the 1990 – 1991 periods was
supposed to spark off and investment boom but that was not the case.
The evolution of financial system Nigeria can be characterized on the basis
of the following features.
First the Nigerian financial system is mainly dominated by bank institution
which handles more than 90% of the total financial assets.
In Nigeria, unlike the government in the developed countries where bonds
are used in financing projects and acquiring assets. The government stocks
contribution to the capital market had declined tremendously from 94% in 1961 to
roughly 3% by 1994 and further fail in 1995.
Second, the financial system has a weak regulatory structure which stems for
the fact that it originates in the preponderance of state owned banking and non –
banking institution by the government. (World Bank 1994). The government uses

23
their control of the banking system particularly to direct credit so some sectors
mainly industry. Agriculturally and construction etc. the regulatory authority for
the financial system in Nigeria only began to be recognized by the 1980’s in the
wake of structural adjustment programmed. (SAP) up to recent years.
Thirdly, there is a significant presence of an informal financial market
characterized by small – scale transactions and often based on pre – existing
financial social and economic relationship.
Fourthly, there is a negative saving by the public sector. This to do with the
fact that the private sector, households and firms constitute the sole sources of
services in which the bulk of the capital funds of the public sector came from
internal and external borrowing.
Fifth, the state borrowing through “debt instrument” does seem to present on
generation of saving from private, particularly household savings, that otherwise
would have been consumed through it is doubtful. This has been an explicit
objective of economic policy.
Finally, financial repression, by the late 1980 financial liberalization had
begun a component of the SAP Key element of this Financial Liberalization
include Relaxation of direct credit allocations, removal of interest controls by the
CBN etc.

24
2.2 EMPIRICAL REVIEW
There is an abundance of empirical studies that deal with the impact of the
different variables of interest on savings Mobilizations. Some authors have found a
strong positive relationship between real per capital growth and saving rate (for
example, see Modigliani 1970, Bosworth, 1993, and Carroll and Weil 1994).
However, its structural interpretation is controversial since it is viewed both as
evidences that growth drives saving (Modigliani, 1970, Carroll and Weil, 1994)
and that saving drives growth through the saving investment link (Levine and
Decent, 1992, and Mankiw, Romer and wail, 1992).
Given the importance of controlling for the joint endogen city of saving and
income growth using panel instrumental variable approach to estimate the effect
of income growth on saving was carried out by Loayza, Schmidt – Hebbel, and
seven (2000). They found that a one percentage point rise in growth rate increase
the private savings rate by a similar amount although this effect may b transitory
in their study, they utilized the World saving data base whose broad coverage
makes it the largest and most systematic collection of annual time series on
country saving rates and saving related variables, spanning 35years (1960-1994)
and 134 countries (112) developing both graphical analysis as well as granger
causality tests to determine the impact of growth on saving. Their results revealed

25
that growth of income does not granger cause saving. Suggesting that saving is not
income induced in Nigeria. Evidence on the reverse causation argument also
shows that saving does not granger cause growth. The findings therefore do not
show any direct relationship between saving and income growth.
The Seminal Work in the early seventies of McKinnon (1973) and show
(1973) place at the heart of the development debate the issue of financial and
monetary policy. At the centre of the debate was interest rate policy which often
resulted in the imposition of below market rates thereby creating a disincentive to
save and retarding the process of financial deepening. The result where a shortage
of investible resources and growth retardation. Several studies have done of the
McKinnon – show model. The empirical results have not provided a consensus on
the validity of the model. Rey (1980) and Watson (1992) have found some
empirical support for the McKinnon – Shaw model.
One of the more innovative and interesting approaches to testing the
McKinnon show model or hypothesis has that of Routine and Salami Martin
(1992) who expanding on the growth model of Varro (1994) Showed – that
financial repression, peroxide by dummy variables capturing three ranges of the
real interest rate, has been a factor in the retarding growth in Latin American
during 19960 to 1985. On the other hand, Giro banni (1985), and Watson (1992),
have not found empirical support for McKinnon – Shaw hypotheses. Asakaie and

26
odusola (1995), utilized quotably data for Nigeria from 180 to 1993 to investigate
the impact of the real interest rate on saving rate. Their result showed that the
coefficient of real deposit rate was statistically insignificant even at 70% and was
wrongly signed for one of the two interest rate regimes. Analytically, the effect of
financial liberalization on private saving rate works previously credit constrained
private agents. This allows household and small firms to use collateral more
widely, and reduces down payments on loan for consumer durable and housing.
Quantitative evidence strongly supports the theoretical prediction that the
expansion of credit should reduce private saving as individuals are able to finance
higher consumption at their current income level.
Loayza, Schmidt, Hebbel, and Seven (2000), find that a percentage point
increases in the ratio of private credit follows to income reduces the long – term
private saving rate by 0.75% percentage point. Bandiers and others (2000), on
carrying out a deeper analysis of eight episodes of financial liberalization, failed
to find a systematic direct effect on saving rate, its positive income cases (Ghana
and Turkey), clearly negative in others (Mexico and Korea), and negligible in the
rest.
Keynes (1936), defined savings as the excess of income over expenditure on
consumption. Meaning that savings is the part of the disposable income which is
not consumed in a particular period (umoh, 2003 and uremadu, 2005). Given that

27
income is equal to the value of current output; and the current investment (ie.
Gross capital formation) is equal to the value of that part which is equal to the
excess of income over consumption.
Keynes maintains that on the aggregate, the excess of income over
consumption (otherwise called saving) cannot differ from the addition to capital
equipment (i.e. Gross fixed capital formation or gross domestic investment).
Savings if therefore a mere residuals and the decision to consume or invest
determines the volume of national income accumulated in a period. In Keynesian
view, therefore, secularly riding income would result in higher saving rate. As a
matter of fact, savings is regarded as being complementary to the consumption
function is its simplest form, the saving function is derived from the linear
consumption function when the autonomous consumption expenditure is separated
off (Umoh, 2003).
Keynes (1936), however, brought in the opportunity cost variable the rate of
interest, which the classical economist regards the rate of interest as the factor that
brings the demand for investment and the willingness to save into equilibrium
with one another (Umoh, 2003). The classical view accepts the fact that savings
and investment are necessarily equal (although this view is still a debatable point).
They, however, held that every act of increased saving by an individual
necessarily bring into existences a corresponding act of increased investments.
28
There is the permanent income Hypothesis (PIH). This is one of the two
dominant paradigms which provided the point of departure for most modern
research on consumption and savings. The PIH focuses on a representative lived
consumer while the other paradigm is the life Cycle hypothesis (LCH), which is
derived from the aggregation of finitely lived over lapping generations. This
theory views individual as choosing a life time stream of consumptions and
savings in a way what present value of their consumption equal the present value
of their lifetime earnings and inheritance (Deaton, 1990). There abound numerous
theoretical evidences concerning the functional relationship between savings and
wide range of causal variable for instance, Jester and Taylor (1975 report that
savings is an increasing function income. Moreover, Modigliani (1970). Madison
(1992), Bosworth (1993), Carroll and Weil (1993) Schmidt – Hebbel, seven and
salesman (1994), Modigliani (1995), Collins (1995), Edwards (1995), and
uremadu (2000), maintain that there exists a positive relationship between savings
and income growth rates.
In addition, studies dealing with savings and interest rates are categorized
into two those who argue that high interest rates include savings include
McKinnon (1993), Shaw (1993), Molto (1980), Balassa (1980), Buskin (1978),
Howard (1978), and Uremadu (2006) found negative correlation between real
interest rates and national savings. Inflation has been found to exert dual
29
influences on savings. First it encourages the hiding of real assets rather than an
asset fixed in naormal values, and thus reduces savings (Howard, 1978).
Secondly, inflation creates a feeling of uncertainty and pessimision about the
future and thereby encourages savings Deaton, 1997 and cyfason, (1981).
2.2.1 FACTORS INFLUENCING SAVING IN NIGERIA
As earlier stated that there is abundant theoretical and empirical
literature on the factors that determine saving in Nigeria. Analysts however
identified two broad levels of determinant.
First, there are analyses stressing micro – level determinants. These relates
to the attribute of the household or individual such factors as the age composition
of the household (demographic processes), customs and religious norms which
influence ability to save, people’s perception of wealth and hence willingness or
motivation, to save.
Secondly, there are analyses stressing macro – economic or structure
relation. Here the level of financial markets development nature and level of
economic growth, price stability, interest rate, fiscal relations condition in the
external sector which links the economy to the World market, etc are cited. The
following are some of the determinants of savings in Nigeria.
30
GROWTH
The life cycle model of hypothesis predicts that an increase in the rate of
growth of income per capital will lead to an increase in the aggregate saving rate.
This is because it increases the lifetime resources and saving of the younger
population relative to that of the older one (Modighani 1970, Maisian 1992,
Carroil and Weil 1994). However, controversy is still raging as to its structural
interpretation, since some see it as evidence that saving drives growth through the
savings. Investment links and others as evidence that it is growth that drives
savings.
A panel instrumental variable method was explored by Loayza, Schmidt –
Hebbel and Seven (2000) to estimate the impact of income growth on savings.
Besides they observed that increase in saving rate do not always come before
increases in growth. Lastly, they found that when additional controls were put in
place, current income growth has a negative impact on lagged saving rates.
INCOME
The principle assumption of the life cycle hypothesis is that an individual
who seeks to maximize the present value of life time utility subject to the budget
constraint must first prepare his scale of preference then maximize his utility
based on his ranking. The budget constraint is equal to the current net worth plus
the present value of expected income from work over the remaining working life

31
of the individual. The theory predicts that consumption in each period depends on
expectations about lifetime income. Given that income fluctuates over the course
of an agent’s life, one stage in the life cycle is an important determinant of saving
behavior.
Empirical evidence shows that the level of real per capital income has a
positive impact on saving rates and that this is usually greater. In low income
countries as against richer ones. Loayza (2000) found that in developing countries
a doubling of income per capital is estimated to rise long – run private saving by
10% points of disposable income. Lewis (1954) and Bassinette (1962) have
argued that income inequality is an important determinant of saving.
INTEREST RATE
A high interest rate increases the current prices of consumption viz – visa the
future price. Thus leading to an increase in saving. This is the substitution effect if
on the other hand the household is a net lender, an increase in interest rate will
increase lifetime. This is the income effect. Thus, saving will have a positive
relationship with interest rate only when the subsisting effect surpasses the income
effect.
Some authors show (1973) and Seri (2004) argued that the relationship
between real interest rate and saving is positive for a developing economy such as

32
Nigeria. In an environment where self financing and bank loans make up. The
bulk of investment fund, accumulation of financial saving is determined merely by
the desire to invest than the desire to live on interest income.
INFLATION
Inflation means increase in the average price of goods and services
(Mankiw, 1999). The percentage change in the overall level of price which varies
overtime and across countries is what is meant by the rate of inflation. Inflation
rate measures the percentage change in the average level of price when the
inflation rate is above zero, prices are rising. When it is below zero, prices are
falling (Osuala, 2002).
Wai (1992:334) assets that there is a good deal of controversy growth and
development.
Some economic focusing on the demand for long – term loan able funds
have argued that investment is stimulated when inflation is accelerating because
the real costs of interest and principal payment are lowered, it’s nominal interest
rates are controlled real interest might even become negative. Inflation it is said
causes domestic financial assets (demand as well as time deposits) to be converted
to consumption goods, relatively unproductive investment goods such as housing
and foreign financial assets. If fixed as is common under what Shaw calls
“shallow finance,” the domestic currency will become overvalued if the domestic

33
inflation rate exceeds the rise in international price. This makes export less
completive and imports more attractive and led the country towards a balance of
payment crisis.
FINANCIAL DEVELOPMENT
Until recently, financial development was assumed to enhance the saving
rate. It consists of elimination of credits ceilings, interest rate liberalization, easing
of entry for foreign financial institutions, enhanced prudential guidelines and
supervision and the development of capital market. Loayza and Shaw (2000)
found that financial development has led the private sector to increases the durable
goods component to their assets. The effect of financial development on savings
rate can be separated into a direct short rum impact, which is generally positive.
However, whether increased financial development itself significantly increase
overall propensity to save depending on the extent of substitution between saving
and other item in the household asset portfolio.
Consequently the expected signs of this relationship in the private saving function
are ambiguous (Alhukarala and Seri 2004).

34
URBANIZATION
Urbanization is a requisite for any financial development of a country. It
create the opportunities for the populace to develop the habit of saving, some
degree of their need for future purposes and mainly for those that are suited or can
find themselves in large cities such as Lagos, Port - Harcourt, Abuja, Kano Onitsha
etc and is due to the closeness of these financial institution to individuals thereby
minimizing the consumption stream of people in order to inculcate the sence of
domestic saving habit.
CONCLUSION.
From the foregoing, one could say that the rising urbanization, and
financial development are the most positive significant influence on saving while
rapid population growth exit the most adverse influence relating the finding to
what existing literatures says on financial saying sin Nigeria. The influence of
interest rate will not be neglected in this because it emerges or plays no significant
role in financial savings in Nigeria.
Therefore policy strategies to mobilize savings which improves people’s
ability to save through raising per capital income and reducing real income or
reducing rapid population growth that increase the dependency ratio among

35
household, as well as increase savings opportunity and at the same time,
incorporating those that improve incentives (through keeping real interest rate on
saving positive) should be pursued and at the same time encouraged.
2.3 LIMITATIONS OF PREVIOUS STUDIES.
A few empirical works exist in the literature that focused on the
determinants of saving in the context of the Nigeria economy and a number of
variable have been examined. However, the extensive review of literature
undertaken in this study revealed the absence of investigation in the possible effect
of two key variables on aggregate saving in Nigeria, the effect of broad money
supply and budget deficit. This forms the existing literature gap which the study.

36
CHAPTER 3
3.1 MODEL SPECIFICATIONS:
Model specification is expressing or showing the mathematical and
econometric relationship (S) that exist between the dependent and the independent
variables which will be included in the model, as well as the apriority expected of
the size and Sign of the parameters of the function.
As evidence by literature, there are some other macro economics variables
which serve as influence to financial saving other than interest rate, such as;
Financial development (FD), Real per capital GDP (Y), Export capital (EXP) or
Trade openness (TDP) Net capital Inflow (NCI) and others. The model is
recognition of the fact that it will be intellectually, statistically, and economically
unreasonable to assume that financial saving is explained single by interest rate in
a multiple repression model and it state thus.
MODEL I
S= F (Y, TDO, RINT, NCI)
It can be stated thus:
S=B0+ B1PDY + B2TDO + B3RINT + B4NCI + ET

37
Where
S= Aggregate Financial Savings.
Bo= Intercept of the Function (Constant term).
B1 – B4 = Regression co – efficient.
GDP = Gross Domestic Product
PDI = Per capital Disposable Income
TDO = Trade openness.
RINT = Real Interest rate (returns on financial investment.
NCI = Net capital inflow which is the balance between the Inflow and Outflow of
Foreign Investment.
ET = Error terms
MODEL 2
GDP = F (S, RINT, FPI, INFT, EXR, INR)
This can also be stated thus:
GDP = B0 + B2RINT + B3INFT + B4EXR + B6INR + ET

38
Where
GDP = Gross Domestic Product.
B0 = Intercept of the Function (Constant term)
B1 – B5 = Regression Co – efficient
As = Aggregate Savings
RINT = Real Interest Rate
FPI = Foreign Private Investment
INFT = Inflation Rate
EXR = Exchange Rate
INR = Investment Rate
ET = Error Terms
3.2 METHODE OF EVALUATION
The aim at the evaluation of the statistical reliability of the estimated
parameters. In this case, co – efficient of multiple determination (R2), T –
statistics and F – statistics.
3.2.1 CO – EFFICIENT OF MULTIPLE DETERMINANTS
The R2 is used to test for the goodness of fit of the model in the economy.
That is to show the percentage of total variation independent variable explained by
39
the regression plane. The value between O and I. the R2 is expressed
mathematically as:
R2
= B1 E1y + B2 E2y + B3 E3y -----------------bn E xny
Ey2
The higher the value of R2, the higher percentage of variation of the
dependent variable that is explained by the regression plane. The goodness of fit of
the regression plane to the sample observation, while the closer to zero, the worse
the goodness to fit.
3.2.2 T – STATISTICS
That T test is used to test the statistical significant or reliability of the
estimates of the regression co – efficient.
If the probability at which T cal is significant in our regression result for
any independent variable is less or equal to our chosen level of significant (0.05)
we reject the min hypothesis (Ho) which says that the independent variable is no
significant. The invariably means accepting the alternative hypothesis (H1) which
states that the independent variable in question is statistical. Significant in our
Model.

40
3.23 F – STATISTICS
The F – Statistics is used to test for the overall significance of the
regression result that is, the test aims at finding out whether the explanatory
variables (x1-------------------xn) do actually have any significant influence on the
dependent variable.
If the probability at which the cal is significant in the regression result is
less than our chosen level of significant (0.05) we resect the non hypothesis (Ho)
which states that the regression is significant. But if the probability at which the F
cal is significant in the regression result is greater than our chosen level of
significance (0.05) it then implies that the overall regression is insignificant.
3.3 ECONOMIC APPIORI CRITERIA
This shows whether each independent variable in the equations in
comparable with the postulation of economic theory (i.e. If the signs follow with
the postulate of economic theory).
Using the OLS technique to estimate our model, we expect the co –
efficient to appear as follows:
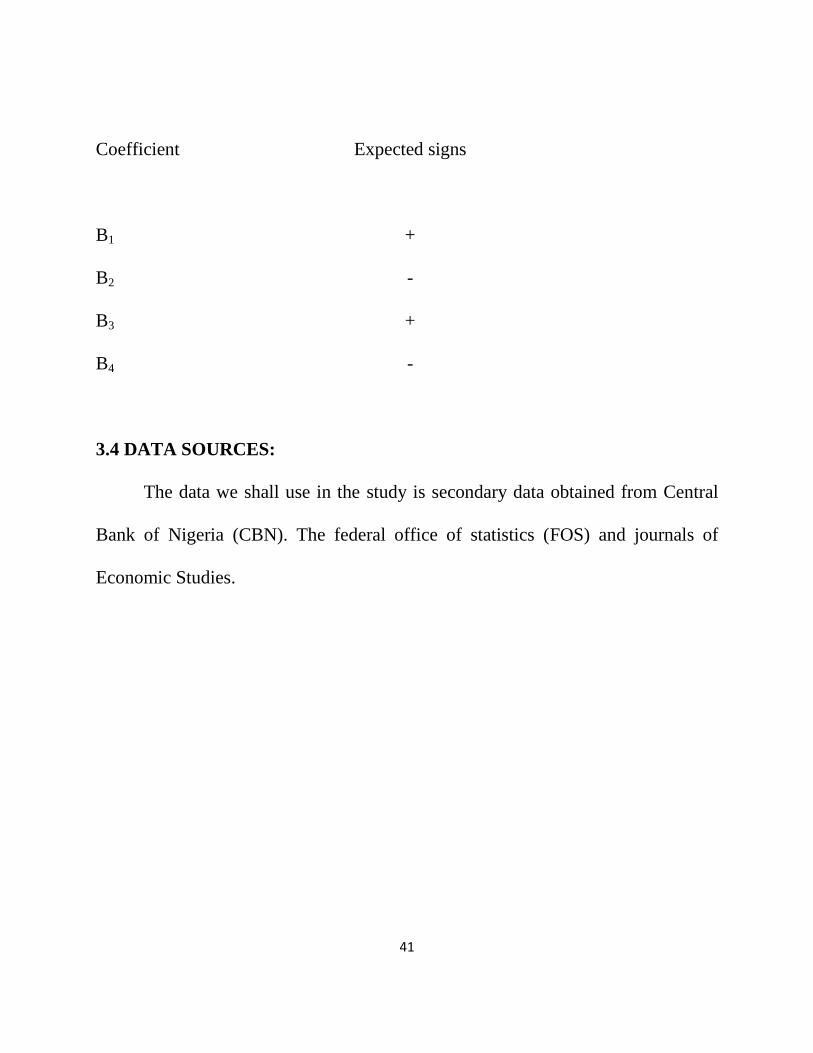
41
Coefficient Expected signs
B1 +
B2 -
B3 +
B4 -
3.4 DATA SOURCES:
The data we shall use in the study is secondary data obtained from Central
Bank of Nigeria (CBN). The federal office of statistics (FOS) and journals of
Economic Studies.

42
CHAPTER FOUR
4.1 PRESENTATION AND ANALYSIS OF RESULT.
4.1.1 Interpretation of Result:
Dependent variable: AS.
Method: Ordinary Least Square.
Period of study: 1985 – 2011
Included Observations: 27
Variable Coefficient Standard error t-statistics t-prob.
Constant -147246.2 9696037.1 -0.211549 0.8344
PDY 34028.03 3824.975 8.896275 0.0000
TDO -482641.4 1256982 -0.383968 0.7047
RINT -5240.734 10925.33 -0.479687 0.6362
NCI -6.777130 3.935546 -1.722030 0.0991
R-squared 0.850610 Mean dependent var. 1199686
Adjusted R-squared 0.823449 S. D. Dependent var. 2046293
S. E. Of regression 859812.0 Akaike info criterion 30.33239

43
Sum squared resid. 1.63E + 13 Schwarz criterion 30.57236
Log likelihood -404.4873 F-statistics 31.31646
Durbin Watson 0.869584 Prob (F-statistic) 0.000000
From the above, the interpretation of the result as regard the coefficient of
various regressors is stated as follows:
The value of the intercept which is -147246.2 shows that the Nigerian
economy will experience a -147246.2 decrease when all other variables are
held constant.
The estimate coefficients units are 34028.03 for {PDY} shows that a unit
increase will cause a 34028.03 increase in AS, -482641.4 for {TDO} shows
that a unit increase will cause a -482641.4 unit decrease in AS, -5240.734 for
{RINT} shows that a unit increase will cause a -483641 decrease in AS, -
6.777130 for {NCI} shows that a unit increase will cause a -6.777130
decrease in AS.
44
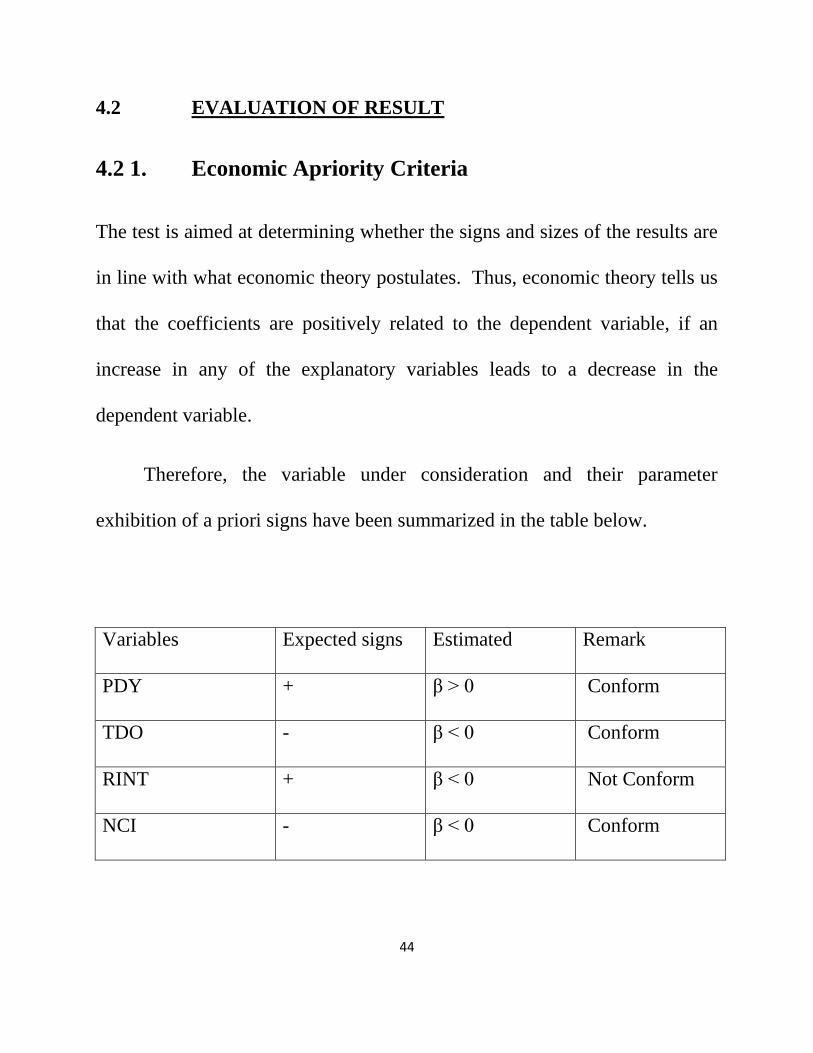
4.2 EVALUATION OF RESULT
4.2 1. Economic Apriority Criteria
The test is aimed at determining whether the signs and sizes of the results are
in line with what economic theory postulates. Thus, economic theory tells us
that the coefficients are positively related to the dependent variable, if an
increase in any of the explanatory variables leads to a decrease in the
dependent variable.
Therefore, the variable under consideration and their parameter
exhibition of a priori signs have been summarized in the table below.
Variables Expected signs Estimated Remark
PDY + β > 0 Conform
TDO - β < 0 Conform
RINT + β < 0 Not Conform
NCI - β < 0 Conform

45
From the above table, it is observed that PDY, TDO and NCI conform
while RINT does not conform to the economic theories.
A positive relationship which exists between PDY, TDO and NCI indicates
that an increase in PDY, TDO and NCI will result in a positive change in the
Growth Rate. This conforms to the apriority expectation because an
increased or high PDY, TDO and NCI over the years will increase Inflation
in the economy.
4.2.2. Statistical Criteria {First order test}
4.2. 2.1. Coefficient of Multiple Determination {R2}:
The R2 {R-Squared} which measures the overall goodness of fit of the entire
regression, shows the value as 0.850610 = 85.0610% approximately 85%.
This indicates that the independent variables accounts for about 85% of the
variation in the dependent variable. This means that the variable included in
the model are the major determinants of savings as it accounts for the
variation in savings.
46
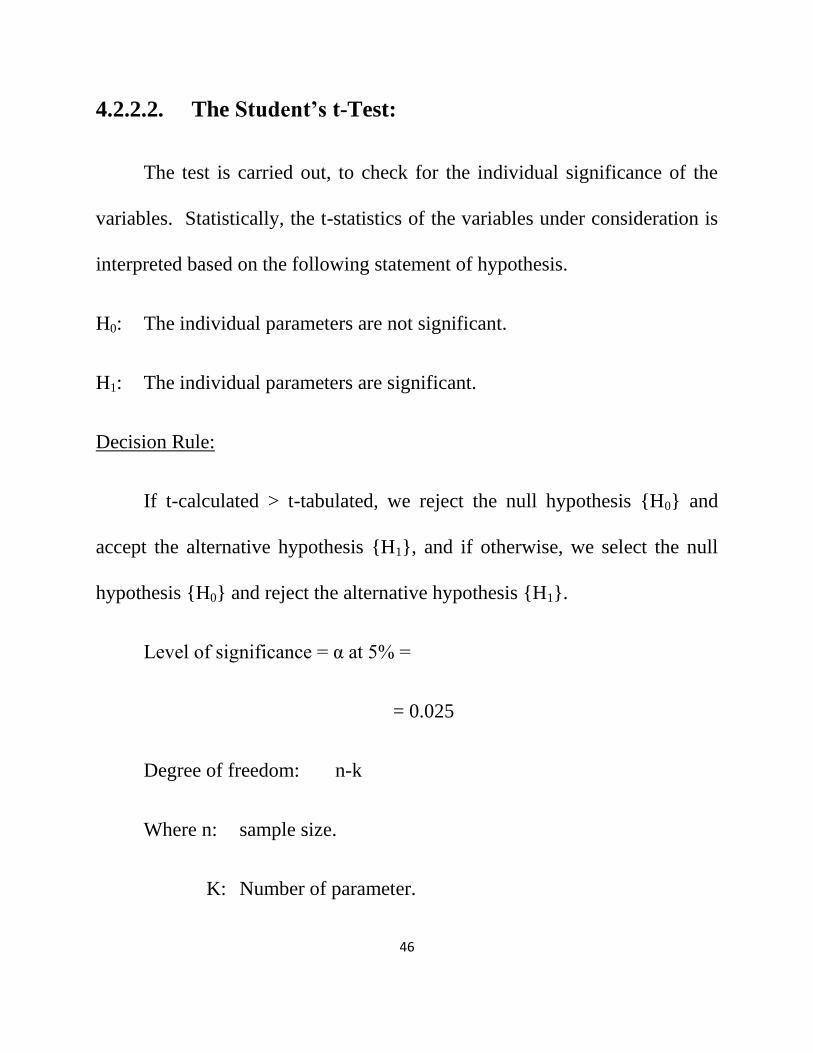
4.2.2.2. The Student’s t-Test:
The test is carried out, to check for the individual significance of the
variables. Statistically, the t-statistics of the variables under consideration is
interpreted based on the following statement of hypothesis.
H0: The individual parameters are not significant.
H1: The individual parameters are significant.
Decision Rule:
If t-calculated > t-tabulated, we reject the null hypothesis {H0} and
accept the alternative hypothesis {H1}, and if otherwise, we select the null
hypothesis {H0} and reject the alternative hypothesis {H1}.
Level of significance = α at 5% =
= 0.025
Degree of freedom: n-k
Where n: sample size.
K: Number of parameter.

47
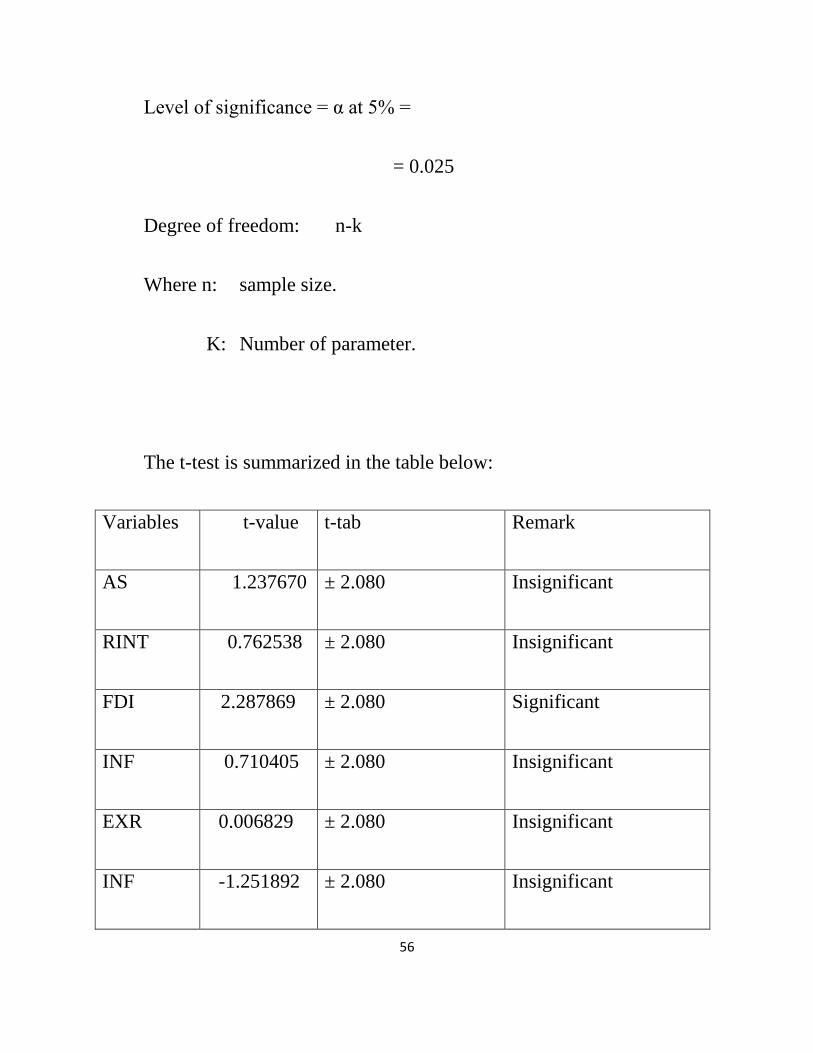
The t-test is summarized in the table below:
Variables t-value t-tab Remark
PDY 8.896275 ± 2.069 Significant
TDO -0.383968 ± 2.069 Insignificant
RINT 0.479687 ± 2.069 Insignificant
NCI -1.722030 ± 2.069 Insignificant
The t-statistics is used to test for individual significance of the estimated
parameters {β1, β2, β3, and β4}.
From the table above, we can deduce that PDY {8.896275} is greater than
2.069 which represent the t-tabulated implying that only PDY is statistically
significant.
On the other hand, the intercept {-0.211549}, TDO {-0.383968},
RINT {-0.479687} and NCI {0-1.722030} are less than the t-tabulated
{±2.069} signifying that the intercept, TDO, RINT, and NCI are statistically
insignificant.

48
4.2.3. F-Statistics:
The F-statistics is used to test for simultaneous significance of all the
estimated parameters.
The hypothesis is stated;
H0: β1 = β2 =β3=β4
H1: β1 ≠ β2≠ β3≠ β4
Level of significance: α at 5%
Degree of freedom: V1 = k-1 V2 = N-K d/f
Decision Rule:
If the f-calculated is greater than the f-tabulated {f-cal > f-tab} reject
the null hypothesis {H0} that the overall estimate is not significant and
conclude that the overall estimate is statistically significant.

49
From the result, f-calculated {31.31646} is greater that the f-tabulated
{2.69}, that is, f-cal > f-tab. Hence, we reject the null hypothesis {H0} that
the overall estimate has a good fit which implies that our independent
variables are simultaneously signify cant.
4.3 Econometrics Criteria.
4.3.1. Test for Autocorrelation:
One of the underlying assumptions of the ordinary least regression is
that the succession values of the random variables are temporarily
independent. In the context of the series analysis, this means that an error
{Ut} is not correlated with one or more of previous errors {Ut-1}. The
problem is usually dictated with Durbin-Watson {DW} statistics.
The durbin-watson’s test compares the empirical d* and du in d-u
tables to their transforms {4-dL} and {4-dU}.
Decision Rule:
• If d* < DL, then we reject the null hypothesis of no correlation and
accept that there is positive autocorrelation of first order.

50
• If d* > {4-dL}, we reject the null hypothesis and accept that there is
negative autocorrelation of the first order.
• If dU< d* < {4-dU}, we accept the null hypothesis of no autocorrelation.
• If dL < d* < dU or if {4-dU} < {4-dL}, that test is inconclusive.
Where: dL = Lower limit
DU = Upper limit
D* = Durbin Watson.
From our regression result, we have;
D* = 0.869584
DL = 1.084
DU = 1.753
4-dL = 2.916
4-dU = 2.247
Conclusion:
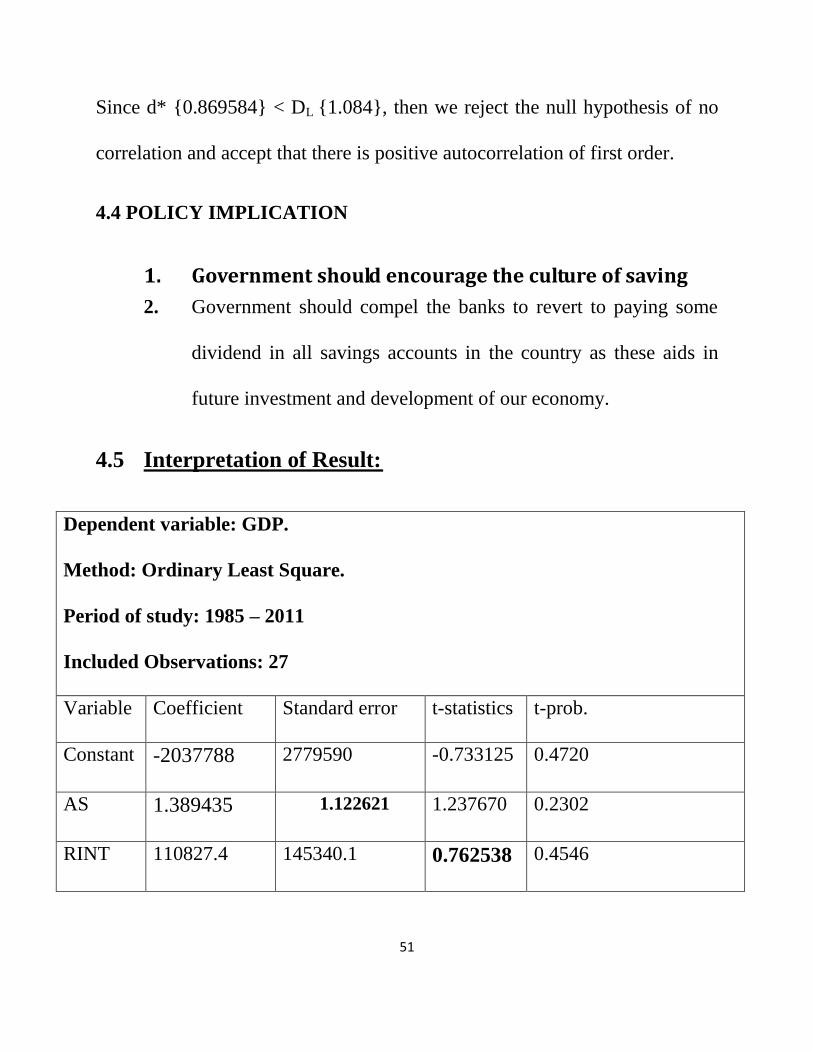
51
Since d* {0.869584} < DL {1.084}, then we reject the null hypothesis of no
correlation and accept that there is positive autocorrelation of first order.
4.4 POLICY IMPLICATION
1. Government should encourage the culture of saving
2. Government should compel the banks to revert to paying some
dividend in all savings accounts in the country as these aids in
future investment and development of our economy.
4.5 Interpretation of Result:
Dependent variable: GDP.
Method: Ordinary Least Square.
Period of study: 1985 – 2011
Included Observations: 27
Variable Coefficient Standard error t-statistics t-prob.
Constant -2037788 2779590 -0.733125 0.4720
AS 1.389435 1.122621 1.237670 0.2302
RINT 110827.4 145340.1 0.762538 0.4546

52
FDI 38.81513 16.96562 2.287869 0.0332
INF 94857.86 133526.4 0.710405 0.4857
EXR -167.1723 24478.98 -0.006829 0.9946
INR -14.81159 11.83137 -1.251892 0.2251
R-squared 0.930930 Mean dependent var. 7437534
Adjusted R-squared 0.910209 S. D. Dependent var. 10012498
S. E. Of regression 3000264 Akaike info criterion 32.88471
Sum squared resid. 1.80E+14 Schwarz criterion 33..22067
Log likelihood -436.9436 F-statistics 44.92677
Durbin Watson 2.673227 Prob (F-statistic) 0.000000
From the above, the interpretation of the result as regard the coefficient of
various regressors is stated as follows:
The value of the intercept which is -2037788 shows that the Nigerian
economy will experience a -203778 decrease when all other variables are
held constant.
The estimate coefficients which are 1.389435 {AS} shows that a unit
increase will cause a 1.389435 increase in GDP, 110827.4 {RINT} shows
53
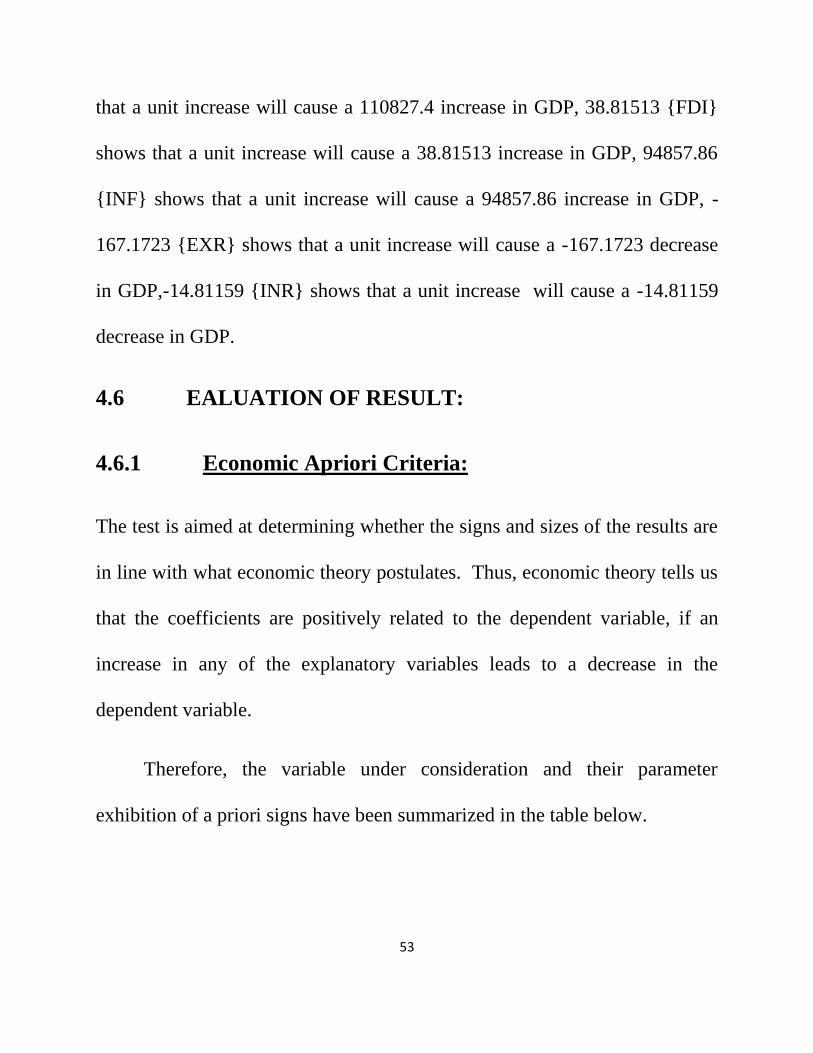
that a unit increase will cause a 110827.4 increase in GDP, 38.81513 {FDI}
shows that a unit increase will cause a 38.81513 increase in GDP, 94857.86
{INF} shows that a unit increase will cause a 94857.86 increase in GDP, -
167.1723 {EXR} shows that a unit increase will cause a -167.1723 decrease
in GDP,-14.81159 {INR} shows that a unit increase will cause a -14.81159
decrease in GDP.
4.6 EALUATION OF RESULT:
4.6.1 Economic Apriori Criteria:
The test is aimed at determining whether the signs and sizes of the results are
in line with what economic theory postulates. Thus, economic theory tells us
that the coefficients are positively related to the dependent variable, if an
increase in any of the explanatory variables leads to a decrease in the
dependent variable.
Therefore, the variable under consideration and their parameter
exhibition of a priori signs have been summarized in the table below.

54
Variables Expected signs Estimated sign Remark
AS + β > 0 Conform
RINT - β > 0 Not Conform
FDI + β > 0 Conform
INF - β > 0 Not Conform
EXR - β < 0 Conform
INR + B <0 Not conform
From the above table, it is observed that AS, FDI and EXR conforms
while, RINT, INF and INR do not conform to the economic theories.
A positive relationship which exists between AS, FDI, EXR and Gross
Domestic Product indicates that an increase in AS, FDI and EXR will result
in a positive change in the Gross Domestic Product. This conforms to the
apriori criteria because an increased or high AS, FDI and EXR over the years
will increase Inflation in the economy.
4.6.2 Statistical Criteria {First order test}
4.6.2.1. Coefficient of Multiple Determinants {R2}:

55
The R2 {R-Squared} which measures the overall goodness of fit of the entire
regression, shows the value as 0.930930 = 93.0930% approximately 93%.
This indicates that the independent variables accounts for about 93% of the
variation in the dependent variable. This means that the variables included in
the model are the major determinant of GDP as it account for the variation in
GDP.
4.6.2.2 The Student’s t-Test:
The test is carried out, to check for the individual significance of the
variables. Statistically, the t-statistics of the variables under consideration is
interpreted based on the following statement of hypothesis.
H0: The individual parameters are not significant.
H1: The individual parameters are significant.
Decision Rule:
If t-calculated > t-tabulated, we reject the null hypothesis {H0} and
accept the alternative hypothesis {H1}, and if otherwise, we select the null
hypothesis {H0} and reject the alternative hypothesis {H1}.
56
Level of significance = α at 5% =
= 0.025
Degree of freedom: n-k
Where n: sample size.
K: Number of parameter.
The t-test is summarized in the table below:
Variables t-value t-tab Remark
AS 1.237670 ± 2.080 Insignificant
RINT 0.762538 ± 2.080 Insignificant
FDI 2.287869 ± 2.080 Significant
INF 0.710405 ± 2.080 Insignificant
EXR 0.006829 ± 2.080 Insignificant
INF -1.251892 ± 2.080 Insignificant

57
The t-statistics is used to test for individual significance of the estimated
parameters {β1, β2, β3, β4, β5 and β6}.
From the table above, we can deduce that FDI {2.287869} is greater than
2.080 which represent the t-tabulated implying that only FDI is statistically
significant.
On the other hand, the intercept {-0.733125}, AS {1.237670},
RINT {0.762538}, INF {0.710405}, EXR {-0.006829} and INR {-1.251892}
are less than the t-tabulated {±2.080} signifying that the intercept, AS, RINT,
INF, EXR and INR are statistically insignificant.
4.6.3. F-Statistics:
The F-statistics is used to test for simultaneous significance of all the
estimated parameters.
The hypothesis is stated;
H0: β1 = β2 =β3=β4=β5=β6
H1: β1 ≠ β2≠ β3≠ β4≠ β5 ≠ β6

58
Level of significance: α at 5%
Degree of freedom: V1 = k-1 V2 = N-K d/f
Decision Rule:
If the f-calculated is greater than the f-tabulated {f-cal > f-tab} reject
the null hypothesis {H0} that the overall estimate is not significant and
conclude that the overall estimate is statistically significant.
From the result, f-calculated {44.92677} is greater that the f-tabulated {2.42},
that is, f-cal > f-tab. Hence, we reject the null hypothesis {H0} that the
overall estimate has a good fit which implies that our independent variables
are simultaneously significant.
4.7 Econometrics Criteria.
4.7.1. Test for Autocorrelation:

59
One of the underlying assumptions of the ordinary least regression is
that the succession values of the random variables are temporarily
independent. In the context of the series analysis, this means that an error
{Ut} is not correlated with one or more of previous errors {Ut-1}. The
problem is usually dictated with Durbin-Watson {DW} statistics.
The durbin-watson’s test compares the empirical d* and du in d-u
tables to their transforms {4-dL} and {4-dU}.
Decision Rule:
• If d* < DL, then we reject the null hypothesis of no correlation and
accept that there is positive autocorrelation of first order.
• If d* > {4-dL}, we reject the null hypothesis and accept that there is
negative autocorrelation of the first order.
• If dU< d* < {4-dU}, we accept the null hypothesis of no autocorrelation.
• If dL < d* < dU or if {4-dU} < {4-dL}, that test is inconclusive.
Where: dL = Lower limit
DU = Upper limit

60
D* = Durbin Watson.
From our regression result, we have;
D* = 2.673227
DL = 0.925
DU = 1.974
4-dL = 3.075
4-dU = 2.026
Conclusion:
Since If dL {3.075} < d*{2.673227} < {1.974} dU or if {4-dU} {2.026} <
{3.075} {4-dL}, that test is inconclusive

61
CHAPTER 5
5.0 SUMMARY, RECOMMENDATIONS AND CONCLUSION.
5.1 SUMMARY OF FINDINGS
This paper has attempted to address some of the conceptual and theoretical
issues of determinant of savings in Nigeria.
Consequently, some of the broad conclusion from the research can be
summarized as follows:
1 Per Capital disposable income has a positive and Significant impact on
Aggregate Savings.
2 Trade openness has a negative and insignificant impact on Aggregate
Savings.
3 There is a negative and insignificant impact of the Real Interest rate on the
Aggregate Savings.
4 The net capital inflow according to the empirical findings have a negative
and insignificant impact on Aggregate Savings.
5.2 POLICY RECOMMENDATIONS.
Emanating from the result of this study the following policy options are
recommended.
62
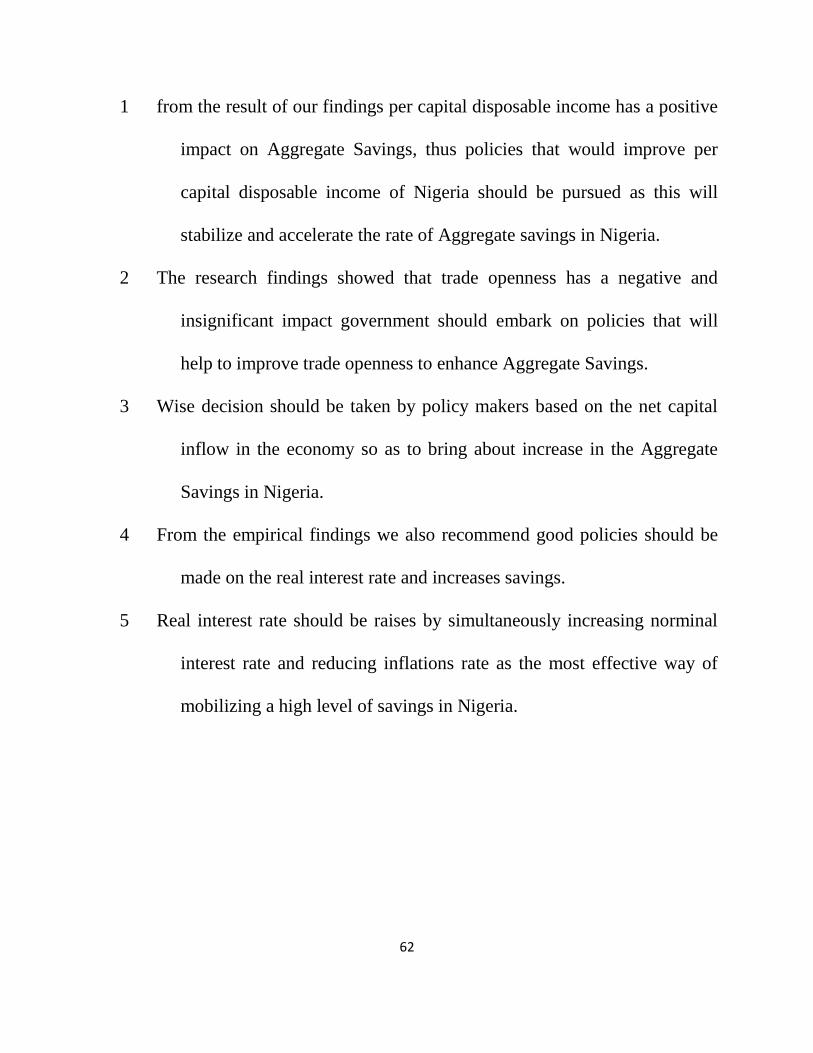
1 from the result of our findings per capital disposable income has a positive
impact on Aggregate Savings, thus policies that would improve per
capital disposable income of Nigeria should be pursued as this will
stabilize and accelerate the rate of Aggregate savings in Nigeria.
2 The research findings showed that trade openness has a negative and
insignificant impact government should embark on policies that will
help to improve trade openness to enhance Aggregate Savings.
3 Wise decision should be taken by policy makers based on the net capital
inflow in the economy so as to bring about increase in the Aggregate
Savings in Nigeria.
4 From the empirical findings we also recommend good policies should be
made on the real interest rate and increases savings.
5 Real interest rate should be raises by simultaneously increasing norminal
interest rate and reducing inflations rate as the most effective way of
mobilizing a high level of savings in Nigeria.

63
5.3 CONCLUSION.
This study so far, econometrically analyzed the determinant of savings
behavior in Nigeria over the period of 1985 – 2011; the empirical findings have
some serious policy implications relevant to the growth and development of the
nation. For the Nigerian economy to break away from its current level of savings
policy makers must recognize the importance of theses variable real interest rate,
per capital disposable income, trade openness and net capital inflow. Per capital
disposable income has a significant factor that contribute to the determining the
level of saving.
Thus the effective manipulations of this variable through consistent and
effective target policies for facilitating adequate mobilization of savings are
necessary for productive investment.

64
BIBLIOGRAPHY
Bosworth, B. P. (1993). “Saving and investment in a Global Economy”.
Washington, D. C. Brookings Institution.
Carroll, Christopher, and David Weil. (1994). “Saving and Growth: a
Reinterpretation”. Carnegie – Rochester Conference Series on Public
Policy.
Dueseberry, J. S. (1949). Income, Saving and the Theory of Consumer Behavior.
Cambridge: Harvard University Press.
Feldstein, M. (1976). Security and Savings. A Journal of American Economic. Vol.
66, no. 2.
Friedman, M. (1957). A Theory of Consumption function. Nairobi: Princeton
University Press.
Fry, Maxwell. (1980). “Saving, Investment, Growth and the Cost of Financial
Regression”. World Development.
Giorannini, Alberto. (1985). “Saving and the Real Interest Rate”. USA: University
of Chicago Press.
Lewis, A. W. (1995). The Theory of Education ltd. New York: Oxford University
Press.
McKinnon, R. (1973). “Money and Capital in Economic Development”.
Washington, D. C: the Brooking Institution.
Shaw, E. S. (1973). Financial Deepening in Economic Development: New York:
Oxford University Press.
Wai, U. T. (1972). Financial Intermediaries and National Savings in Developing
Countries: New York: Pager Publishers.
65
Zuvekas, C. (1999). An Introduction of Economic Development London:
Macmillan Press Ltd.
JOURNALS
Ando, A and Modigliani, F. (1963). The Life Circle Hypothesis of Aggregate
Savings. Implication and test. Journal American Economics, vol. 53, No. 1
Adam, D. W. (1978). Mobilizing Household through Rural Financial Markets: A
Journal of Economic and Cultural Change. Vol. 26, No. 2.
Essen, E. and Onwiodyokita (1998). “Recent Developments in Econometrics: An
Application to Financial Liberalization and Saving in Nigeria”. NDIC
Quarterly, vol. 8, no. 112.
Giovanni, Alberto. (1985). “Saving and the Real Interest Rates in LDCS.” Journal
of Development Economics 18 (2-3): 197 .217

66
Dependent Variable: AS
Method: least Squares
Date: 07/22/13 Time: 11:15
Sample: 1985 2011
Included observations: 27
Variable Coefficient Std. Error t – Statistic Prob.
C -177246.2 696037.1 -0.211549 0.8344
PDY 34028.03 3824.975 8.896275 0.0000
TDO -482641.4 1256982. -0.383968 0.7047
RINT -5240.734 10925.33 -0.479687 0.6362
NCI -6.777130 3.935546 -1.722030 0.0991
R-squared 0.850610 Mean Dependent Var 1199688.
Adjusted R- squared 0.823449 S.D dependent Var 2046293.
S. E. of Regression 859812.0 Alkaline info criterion 30.33239
Sum squared reside 1.36e+13 Schwarz criterion 30.57236
Log likelihood -404.4873 F- statistic 31.31646
Durbin – Watson stat 0.869584 Prob (F – statistic) 0.000000
Dependent Variable: GDP
Method: least squares
Date: 07/22/13 Time: 11:18

67
Included Observations: 27
Variable Coefficient Std. Error t – Statistic Prob
C -2037788. 2779590. -0.733125 0.4720
AS 1.389435 1.22621 1.237670 0.2302
RINT 110827.4 145340.1 0.710405 0.4546
FDI 38.81513 16.96562 2.287869 0.0332
INF 94857.86 133526.4 0.710405 0.4857
EXR -167.1723 24478.98 -0.006829 0.9946
INR -14.81159 11.83137 -1.251892 0.2251
R – squared 0.930930 Mean Dependent Var 7437534.
Adjusted r – squared 0.910209 S. D Dependent Var 10012498
S. E. of Regression 3000264. Akaike info criterion 32.88471
Sum squared resid 1.80e+14 Schwarz criterion 33.22067
Log likelihood -436.9436 F – statistic 44.92677
Durbin – Watson stat 2.673227 Prob (F – statistic) 0.000000
YEA

68
R AS INF GDP FDI INR EXR RINT NCI PDY TDO
0.88 0.27
1985 12522 5.5 67908.55 6804 6804 4 3.75 329.7 0.81 7
2.02 0.21
1986 13934 5.4 69146.99 9313.6 5313.6 1 5.1 2499.6 0.80 6
4.01 0.45
1987 18676 10.2 105222.8 9993.6 9993.6 8 7.3 680 1.17 8
4.53 0.37
1988 23249 38.3 139085.3 11339.2 11339.2 7 -21.8 1345.6 1.51 8
7.39 0.58
1989 23801 40.9 216797.9 10899.6 10900 2 -14.1 -439.4 2.25 0.41
8.03 0.58
1990 29651 7.5 267550 10436.1 10436 8 18 -464.3 2.62 2
0.67
1991 37738 13 312139.7 12243.5 12244 9.91 7.01 1808 3.11 6
0.65
1992 55117 44.5 532613.8 20512.7 20513 17.3 -14.7 8269.2 5.16 5
-
22.0 38.8 0.56
1993 85028 57.2 683869.8 66781 66787 5 8 32994.4 6.52 2
57.0 21.8
1994 108461 3 899863.2 70714.6 70715 9 -36 3907.2 8.41 0.14
-
72.8 119391. 11939 21.8 52.6 0.88
1995 108490 1 1933212 6 2 9 2 18677 17.02 2
29.2 122600. 12260 21.8 0.69
1996 134503 9 2702719 9 1 9 -9.56 2731 23.83 3
128331. 12833 21.8 0.74
1997 177649 8.5 2801973 8 2 9 5.04 5730.9 23.78 5
152409. 12833 21.8 0.58
1998 200065 10 2708431 6 6 9 8.29 24078 22.69 7
154188. 15418 92.6 14.7 0.64
1999 277668 6.62 3194015 6 9 1 2 1779.1 25.56 5
157535. 15753 102. 11.0
2000 385191 6.94 4582127 4 5 1 8 3347 35.60 0.64
18.8 162342. 16234 111. 0.68
2001 488045 7 4725086 4 3 9 -0.61 3377 31.62 3
12.8 166631. 16603 11.9 0.47
2002 592094 9 6912381 6 2 121 5 8205.5 51.04 1
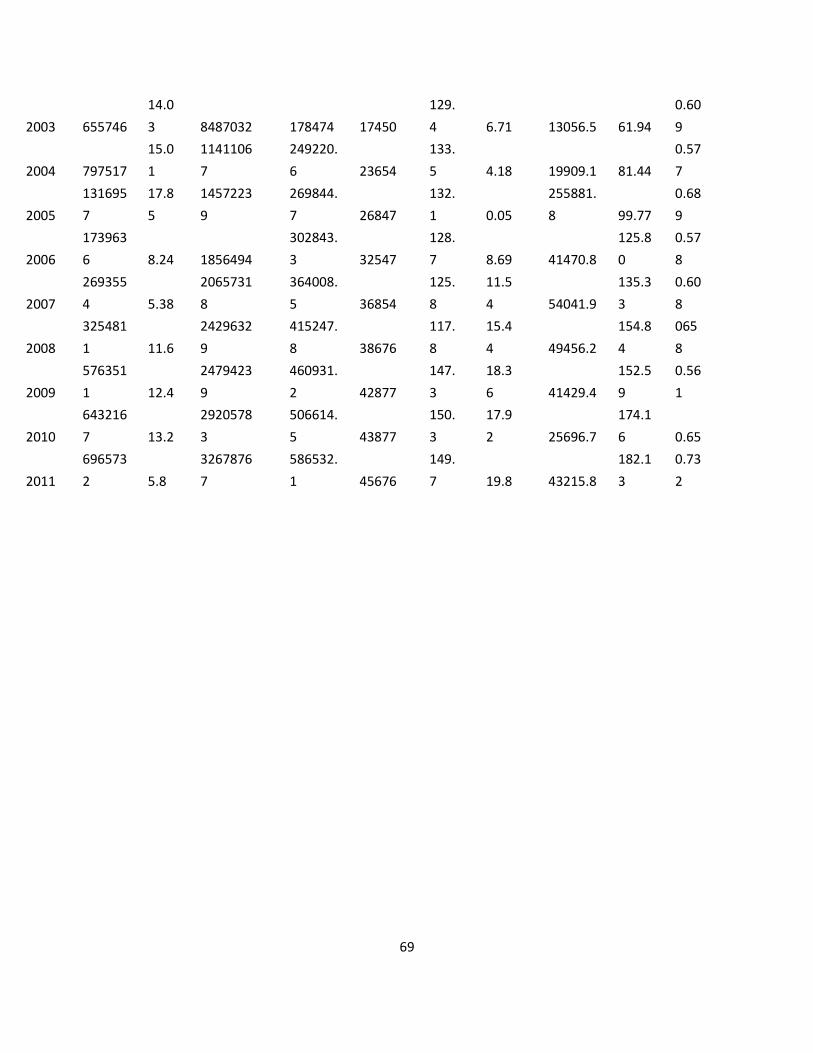
69
14.0 129. 0.60
2003 655746 3 8487032 178474 17450 4 6.71 13056.5 61.94 9
15.0 1141106 249220. 133. 0.57
2004 797517 1 7 6 23654 5 4.18 19909.1 81.44 7
131695 17.8 1457223 269844. 132. 255881. 0.68
2005 7 5 9 7 26847 1 0.05 8 99.77 9
173963 302843. 128. 125.8 0.57
2006 6 8.24 1856494 3 32547 7 8.69 41470.8 0 8
269355 2065731 364008. 125. 11.5 135.3 0.60
2007 4 5.38 8 5 36854 8 4 54041.9 3 8
325481 2429632 415247. 117. 15.4 154.8 065
2008 1 11.6 9 8 38676 8 4 49456.2 4 8
576351 2479423 460931. 147. 18.3 152.5 0.56
2009 1 12.4 9 2 42877 3 6 41429.4 9 1
643216 2920578 506614. 150. 17.9 174.1
2010 7 13.2 3 5 43877 3 2 25696.7 6 0.65
696573 3267876 586532. 149. 182.1 0.73
2011 2 5.8 7 1 45676 7 19.8 43215.8 3 2