Embed Size (px)
Citation preview
The Demography of Latino The Demography of Latino Immigration:Immigration:
Trends and Implications for the Trends and Implications for the FutureFuture
Rogelio SaenzRogelio SaenzTexas A&M UniversityTexas A&M University
Department of SociologyDepartment of SociologyCollege Station, TX 77843-4351College Station, TX 77843-4351
E-Mail: E-Mail: [email protected]@tamu.edu
Presented at the ASA Congressional Presented at the ASA Congressional Briefing on Immigration. April 19, 2004.Briefing on Immigration. April 19, 2004.

Unique Features of Latino Unique Features of Latino ImmigrationImmigration
Sustained immigration throughout 20th Sustained immigration throughout 20th century.century.Mexican prominence in U.S. foreign-born Mexican prominence in U.S. foreign-born population.population.Major impact of Latino immigration on the Major impact of Latino immigration on the demography of the U.S.demography of the U.S.Historical context surrounding Mexican Historical context surrounding Mexican and Latin American immigration to the and Latin American immigration to the U.S.U.S.

Demographic Trends Related to Demographic Trends Related to Latino ImmigrationLatino Immigration
Population ChangesPopulation Changes

Figure 1. Percentage Change in the Latino Population Between 1990 and 2000 by Nativity Status and Region.
81.463.7 62.9
152.0
116.6
240.2
44.050.035.8
82.1 99.1
62.7
0.0
50.0
100.0
150.0
200.0
250.0
300.0
Source: 2000 5% PUMS.
Pct
. C
hg
.
Foreign-Born
Native-Born

Figure 2. Percentage Change in the Mexican Population Between 1990 and 2000 by Nativity Status and Region.
95.864.5
258.9
168.8
496.6
262.2
27.2
124.8
61.0
120.285.3
36.3
0.0
100.0
200.0
300.0
400.0
500.0
600.0
Source: 2000 5% PUMS.
Pct
. C
hg.
Foreign-Born
Native-Born

Figure 3. Percentage of Latino Population that is Foreign-Born by Region, 1990 and 2000.
34.9 33.328.9
51.5
26.2
40.137.5 38.7 39.9
35.7 37.8
53.6
0
10
20
30
40
50
60
Source: 2000 5% PUMS.
Pct
. F
ore
ign-B
orn
1990
2000

Demographic Trends Related to Demographic Trends Related to Latino ImmigrationLatino Immigration
Ten Fastest Growing States in Latino Population Ten Fastest Growing States in Latino Population Between 1990 and 2000.Between 1990 and 2000. North Carolina (394%)North Carolina (394%) Arkansas (337%)Arkansas (337%) Georgia (300%)Georgia (300%) Tennessee (278%)Tennessee (278%) Nevada (217%)Nevada (217%) South Carolina (211%)South Carolina (211%) Alabama (208%)Alabama (208%) Kentucky (173%)Kentucky (173%) Minnesota (166%)Minnesota (166%) Nebraska (155%)Nebraska (155%)

Demographic Trends Related to Demographic Trends Related to Latino ImmigrationLatino Immigration
Changes in Distribution Patterns of Latino Changes in Distribution Patterns of Latino ImmigrationImmigration Latinoization/Mexicanization of U.S.Latinoization/Mexicanization of U.S.

Figure 4. Percentage Distribution of Latino Foreign-Born Population Across Regions, 1990 and 2000.
60.4
15.5
6.1
15.5
2.4
54.5
13.9
8.5
18.5
4.4
0.0
10.0
20.0
30.0
40.0
50.0
60.0
70.0
Southwest Northeast Midwest South Oth. WestSource: 2000 5% PUMS.
Pct
. 1990
2000

Figure 5. Percentage Distribution of Mexican Foreign-Born Population Across Regions, 1990 and 2000.
84.0
1.8
8.13.1 3.1
70.6
3.3
11.1 9.45.7
0.0
10.0
20.0
30.0
40.0
50.0
60.0
70.0
80.0
90.0
Southwest Northeast Midwest South Oth. WestSource: 2000 5% PUMS.
Pct
. 1990
2000

Demographic Trends Related to Demographic Trends Related to Latino ImmigrationLatino Immigration
Age/Sex Composition of Latino ImmigrantsAge/Sex Composition of Latino Immigrants Median Age in 2000Median Age in 2000
Latino Foreign-Born (33)/Native-Born (18)Latino Foreign-Born (33)/Native-Born (18)Mex. Foreign-Born (31)/Native-Born (16)Mex. Foreign-Born (31)/Native-Born (16)U.S. Population (35)U.S. Population (35)U.S. Non-Latino White (38)U.S. Non-Latino White (38)
Sex Ratio (Males per 100 Females) in 2000Sex Ratio (Males per 100 Females) in 2000Latino Foreign-Born (113)/Native-Born (100)Latino Foreign-Born (113)/Native-Born (100)Mex. Foreign-Born (126)/Native-Born (102)Mex. Foreign-Born (126)/Native-Born (102)U.S. Population (96)U.S. Population (96)U.S. Non-Latino White (96)U.S. Non-Latino White (96)

Figure 6. Age-Sex Pyramid for the U.S. Latino Immigrant Population, 2000.
10 8 6 4 2 0 2 4 6 8 10
0 to 4
10 to 14
20 to 24
30 to 34
40 to 44
50 to 54
60 to 64
70 to 74
80 to 84
Ag
e G
rou
p
Pct. of U.S. Total Latino Immigrant Population
Females
Males

Figure 7. Age-Sex Pyramid for the U.S. Mexican Immigrant Population, 2000.
10 8 6 4 2 0 2 4 6 8 10
0 to 4
10 to 14
20 to 24
30 to 34
40 to 44
50 to 54
60 to 64
70 to 74
80 to 84
Age
Gro
up
Pct. of U.S. Total Mexican Immigrant Population
Females
Males

Trends in the Labor Patterns of Trends in the Labor Patterns of Latino ImmigrantsLatino Immigrants
Labor Force Participation RatesLabor Force Participation Rates

Figure 8. Percentage of Latino Foreign-Born Persons 16 and Older in Labor Force by Sex, 1990 and 2000.
83.5
47.7
54.4
71.4
0.0
10.0
20.0
30.0
40.0
50.0
60.0
70.0
80.0
90.0
Males FemalesSource: 2000 5% PUMS.
Pct
. in
Lab
or F
orce
1990
2000

Trends in the Labor Patterns of Trends in the Labor Patterns of Latino ImmigrantsLatino Immigrants
Gender and Work Gender and Work

Figure 9. Percentage Distribution of Latino Foreign-Born Persons 16 and Older in the Labor Force by Sex,
2000.
63.0
37.0
Male
Female

Trends in the Labor Patterns of Trends in the Labor Patterns of Latino ImmigrantsLatino Immigrants
Latino Immigrant Industrial NichesLatino Immigrant Industrial Niches 20 industries where Latino immigrants 20 industries where Latino immigrants
disproportionately represented with a specific disproportionately represented with a specific volume of Latino immigrant workers in the volume of Latino immigrant workers in the industry.industry.
Nearly half (47.3%) Latino immigrant workers Nearly half (47.3%) Latino immigrant workers employed in these 20 industries.employed in these 20 industries.
Trends in the Labor Patterns of Trends in the Labor Patterns of Latino ImmigrantsLatino Immigrants
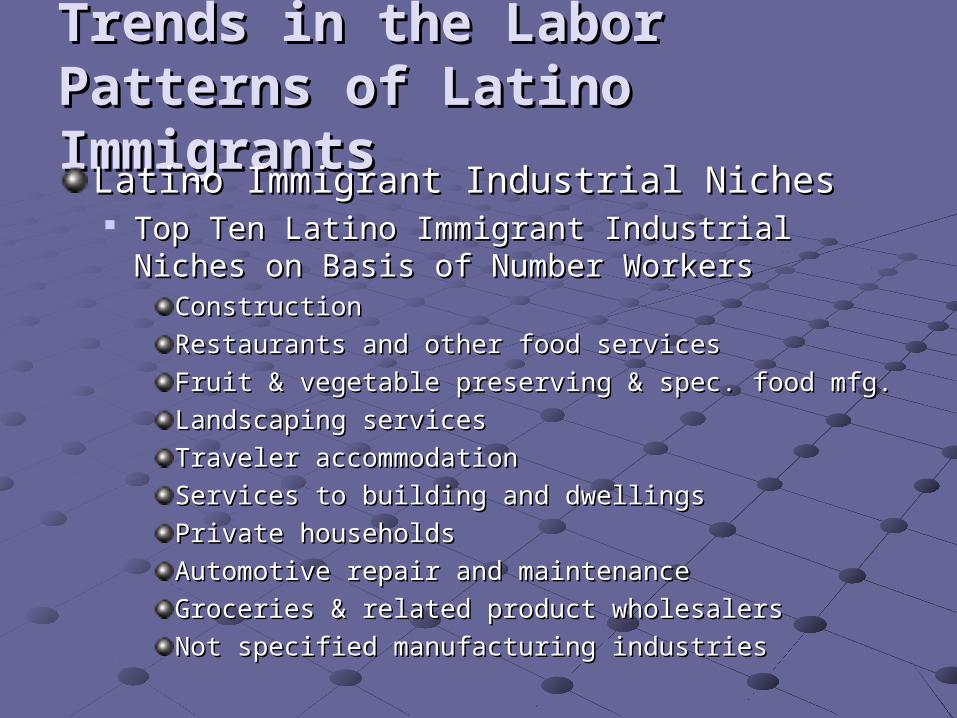
Latino Immigrant Industrial NichesLatino Immigrant Industrial Niches Top Ten Latino Immigrant Industrial Niches on Basis Top Ten Latino Immigrant Industrial Niches on Basis
of Number Workersof Number WorkersConstructionConstruction
Restaurants and other food servicesRestaurants and other food services
Fruit & vegetable preserving & spec. food mfg.Fruit & vegetable preserving & spec. food mfg.
Landscaping servicesLandscaping services
Traveler accommodationTraveler accommodation
Services to building and dwellingsServices to building and dwellings
Private householdsPrivate households
Automotive repair and maintenanceAutomotive repair and maintenance
Groceries & related product wholesalersGroceries & related product wholesalers
Not specified manufacturing industriesNot specified manufacturing industries

Figure 10. Percentage of Foreign-Born Latino and Mexican Workers Employed in Ethnic-Gender-Specific Immigrant
Industrial Niches, 2000.
55.5
46.6
62.0
51.8
0
10
20
30
40
50
60
70
80
90
100
Latino Males Latino Females Mexican Males MexicanFemales
Source: 2000 5% PUMS.
Pct
. in
Indu
stri
al N
iche
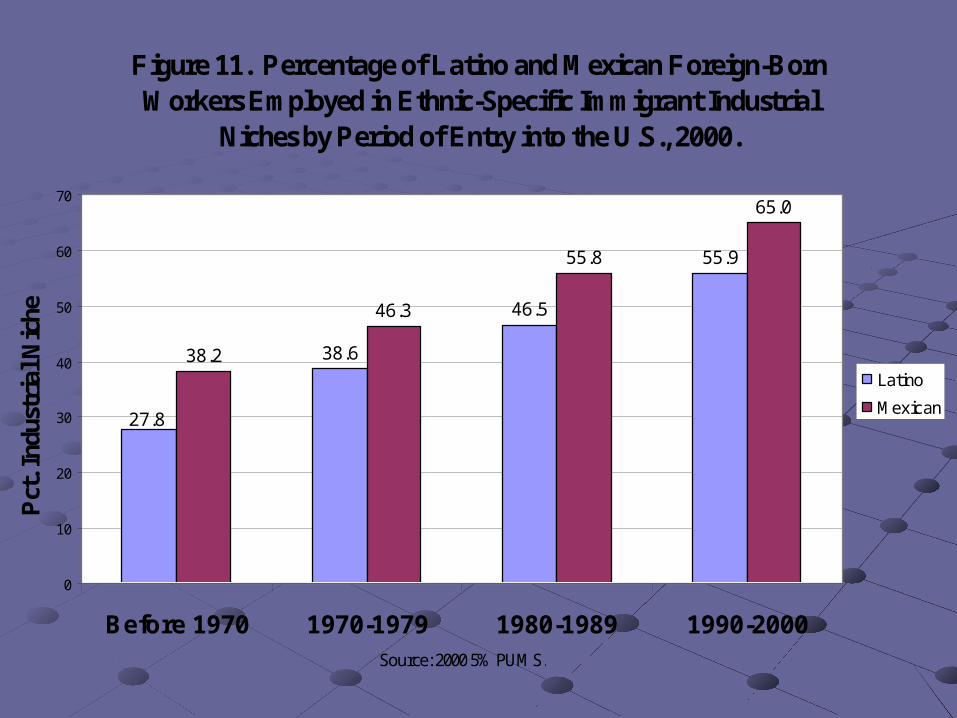
Figure 11. Percentage of Latino and Mexican Foreign-Born Workers Employed in Ethnic-Specific Immigrant Industrial
Niches by Period of Entry into the U.S., 2000.
38.6
46.5
55.9
27.8
65.0
55.8
46.3
38.2
0
10
20
30
40
50
60
70
Before 1970 1970-1979 1980-1989 1990-2000Source: 2000 5% PUMS.
Pct
. Ind
ustr
ial N
iche
Latino
Mexican

The Special Case of Mexicans The Special Case of Mexicans and Length of U.S. Residenceand Length of U.S. Residence
Population 25-44 Years of AgePopulation 25-44 Years of AgePeriod of Arrival in the U.S.:Period of Arrival in the U.S.: Before 1970; 1970-1979; 1980-1989; 1990-2000Before 1970; 1970-1979; 1980-1989; 1990-2000
With increasing time in the U.S., Mexican With increasing time in the U.S., Mexican immigrants have….:immigrants have….: higher rates of naturalization.higher rates of naturalization. higher rates of English fluency.higher rates of English fluency. higher rates of female labor force participation.higher rates of female labor force participation. higher presence in higher-status occupations.higher presence in higher-status occupations. higher labor market wages.higher labor market wages. lower poverty rates.lower poverty rates.

Broad Trends in Latino Broad Trends in Latino Immigration and Implications for Immigration and Implications for the Futurethe Future
Population projections and the increasing Population projections and the increasing Latinoization of the U.S. Latinoization of the U.S. 2000: 12.6% 2000: 12.6% 2010: 15.5% 2010: 15.5% 2020: 17.8%2020: 17.8% 2030: 20.1%2030: 20.1% 2040: 22.3%2040: 22.3% 2050: 24.4%2050: 24.4%
Source: U.S. Census Bureau. 2004. Source: U.S. Census Bureau. 2004. U.S. Interim U.S. Interim Projections by Age, Sex, Race, and Hispanic OriginProjections by Age, Sex, Race, and Hispanic Origin. . Washington, DC: U.S. Census Bureau.Washington, DC: U.S. Census Bureau.

Broad Trends in Latino Broad Trends in Latino Immigration and Implications for Immigration and Implications for the Futurethe Future
Latino immigration and impact on societal Latino immigration and impact on societal institutions.institutions.Latino immigration and the “blurring of Latino immigration and the “blurring of boundaries.”boundaries.” Transnational migrationTransnational migration RemittancesRemittances Nationality/CitizenshipNationality/Citizenship GeographyGeography FamilyFamily Nativity StatusNativity Status LanguageLanguage