Embed Size (px)
Citation preview
The Dedicated Highway and Bridge Trust Fund:
Where Did the Money Go?
October 2009
Thomas P. DiNapoli
New York State Comptroller
Additional copies of this report may be obtained from:
Office of the State Comptroller Public Information Office 110 State Street Albany, New York 12236 (518) 474-4015
Or through the Comptroller’s website at: www.osc.state.ny.us
Please notify the Office of Budget and Policy Analysis at (518) 473-4333 if you would like your name to be deleted from the mailing list or if your address has changed.
Table of Contents INTRODUCTION........................................................................................................................ 1 FUNDING NEW YORK STATE HIGHWAYS............................................................................. 5 Revenue......................................................................................................................................................6 Disbursements..........................................................................................................................................10 Back-Door Borrowing and Increased Debt Service Obligations...............................................................15 CONCLUSION ......................................................................................................................... 23 APPENDICES.......................................................................................................................... 25 Appendix A: Dedicated Revenue Sources ..............................................................................................25 Appendix B: Statutory Changes in Revenue Sources and Uses.............................................................27 Appendix C: Thruway General Highway and Bridge Trust Fund Bonds .................................................28 Appendix D: Dedicated Highway and Bridge Trust Fund Receipts and Disbursements.........................29


1
Introduction New York State and its local governments are responsible for the care and maintenance of more than 113,000 miles of highways and more than 17,400 bridges. Funding for the State portion—some 15,000 miles of highways and more than 7,600 bridges—is the responsibility of the State’s Dedicated Highway and Bridge Trust Fund (Fund). However, as a result of the State’s ongoing practice of spending in excess of available revenues, this Fund is now used to pay for State agency operations and for debt service payments. As a result, the amount available to directly pay for highway and bridge capital projects is limited. According to the Division of the Budget (DOB), by State Fiscal Year (SFY) 2013-14, debt service as a percentage of the Fund’s dedicated tax and fee revenue will reach approximately 72.4 percent. Debt service expressed as a percentage of all Fund disbursements (including bond proceeds and General Fund transfers) will reach 39.2 percent at that time, while spending for State Operations will reach 40.2 percent. Capital projects disbursements will be just 20.6 percent of the total. The Dedicated Highway and Bridge Trust Fund, enacted in 1991, was intended to be the primary funding source for the construction and rehabilitation of State-owned roads and bridges. Initially, it was anticipated that the Fund would rely primarily on pay-as-you-go financing to support its programs and purposes, using revenue from highway taxes, motor vehicle taxes and fees, petroleum business taxes and a number of smaller resources. In fact, Governor Cuomo’s approval memorandum said, “This reliable, predictable stream of revenues will allow us to provide for the orderly development and management of transportation programs and projects, without reliance upon periodic bond issues.”1 Despite this stated intention, in 1993 the decision was made to issue bonds for State highway and bridge projects.2 The Thruway Authority acted as the State’s agent for the bonds, which were first issued in 1994, and the Fund was obligated to pay the debt service on the bonds. New bonds—using this same debt repayment mechanism—have been issued every year since. As a result, a growing portion of the Fund has been diverted to pay for debt service instead of the direct pay-as-you-go capital spending, as was designed. A growing portion of the Fund has also been used to pay for other noncapital transportation activities, such as annual Department of Transportation snow and ice removal costs and Department of Motor Vehicles operations. As a result, the original intent of the Fund, which was to provide a reliable, dedicated stream of revenue for pay-as-you-go funding for State highway and bridge projects, is no longer being met.
1 Executive Approval Memorandum filed to accompany Chapters 329, 330 and 331 of the Laws of 1991, July 15, 1991. 2 The initial legislation permitted the Fund to be used to pay debt service costs for State aid to local highway programs—the Consolidated Local Street and Highway Improvement Program (CHIPs) and the Marchiselli Aid programs.
2
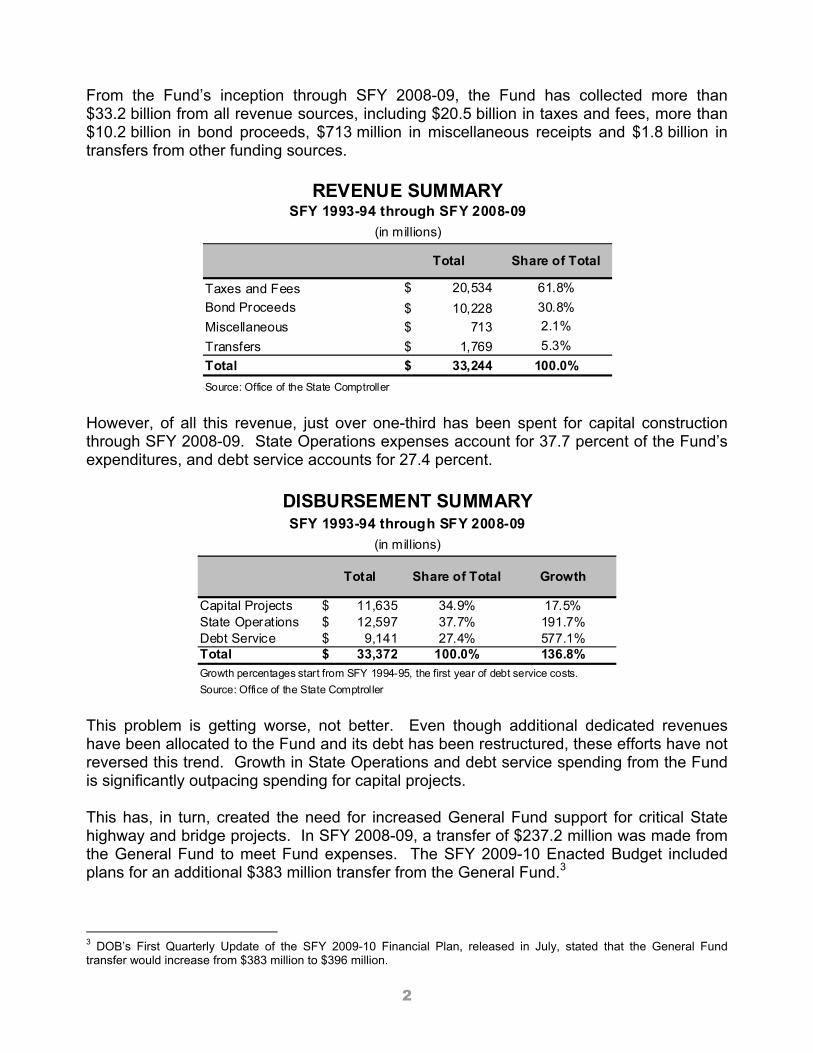
From the Fund’s inception through SFY 2008-09, the Fund has collected more than $33.2 billion from all revenue sources, including $20.5 billion in taxes and fees, more than $10.2 billion in bond proceeds, $713 million in miscellaneous receipts and $1.8 billion in transfers from other funding sources.
Total Share of Total
Taxes and Fees 20,534$ 61.8%Bond Proceeds 10,228$ 30.8%Miscellaneous 713$ 2.1%Transfers 1,769$ 5.3%Total 33,244$ 100.0%Source: Office of the State Comptroller
(in millions)
REVENUE SUMMARYSFY 1993-94 through SFY 2008-09
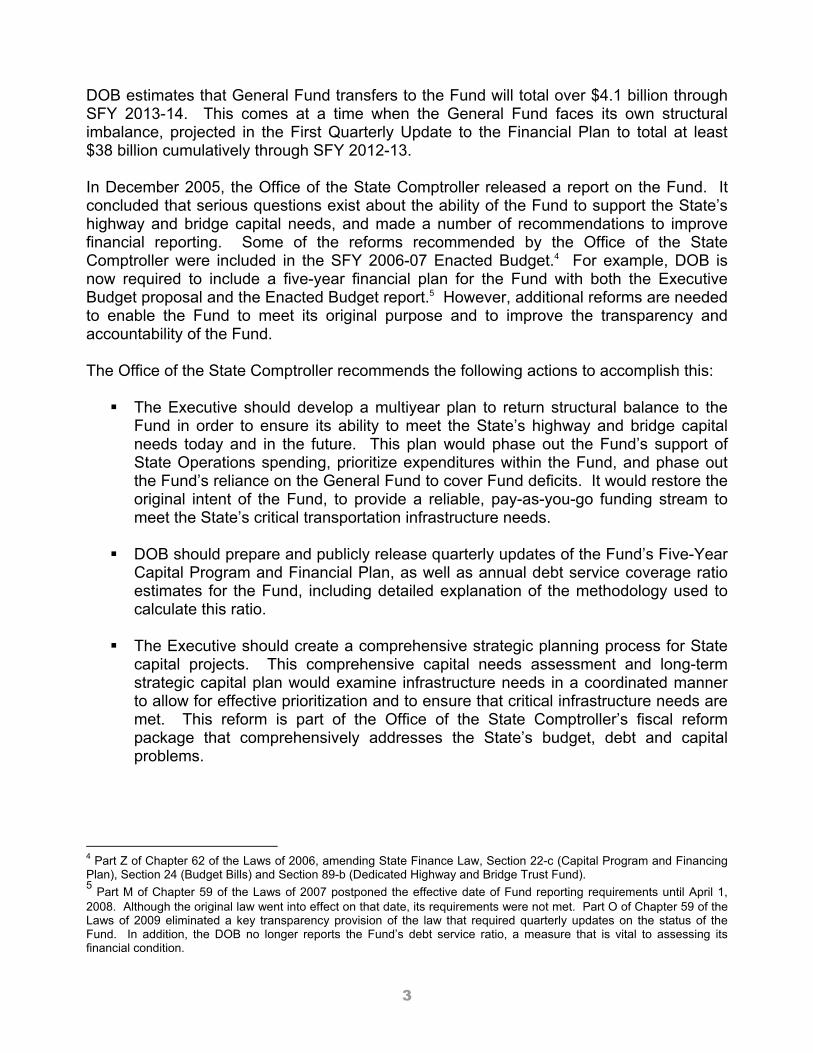
However, of all this revenue, just over one-third has been spent for capital construction through SFY 2008-09. State Operations expenses account for 37.7 percent of the Fund’s expenditures, and debt service accounts for 27.4 percent.
Total Share of Total Growth
Capital Projects 11,635$ 34.9% 17.5%State Operations 12,597$ 37.7% 191.7%Debt Service 9,141$ 27.4% 577.1%Total 33,372$ 100.0% 136.8%Growth percentages start from SFY 1994-95, the first year of debt service costs.Source: Office of the State Comptroller
(in millions)
DISBURSEMENT SUMMARYSFY 1993-94 through SFY 2008-09
This problem is getting worse, not better. Even though additional dedicated revenues have been allocated to the Fund and its debt has been restructured, these efforts have not reversed this trend. Growth in State Operations and debt service spending from the Fund is significantly outpacing spending for capital projects. This has, in turn, created the need for increased General Fund support for critical State highway and bridge projects. In SFY 2008-09, a transfer of $237.2 million was made from the General Fund to meet Fund expenses. The SFY 2009-10 Enacted Budget included plans for an additional $383 million transfer from the General Fund.3
3 DOB’s First Quarterly Update of the SFY 2009-10 Financial Plan, released in July, stated that the General Fund transfer would increase from $383 million to $396 million.
3
DOB estimates that General Fund transfers to the Fund will total over $4.1 billion through SFY 2013-14. This comes at a time when the General Fund faces its own structural imbalance, projected in the First Quarterly Update to the Financial Plan to total at least $38 billion cumulatively through SFY 2012-13. In December 2005, the Office of the State Comptroller released a report on the Fund. It concluded that serious questions exist about the ability of the Fund to support the State’s highway and bridge capital needs, and made a number of recommendations to improve financial reporting. Some of the reforms recommended by the Office of the State Comptroller were included in the SFY 2006-07 Enacted Budget.4 For example, DOB is now required to include a five-year financial plan for the Fund with both the Executive Budget proposal and the Enacted Budget report.5 However, additional reforms are needed to enable the Fund to meet its original purpose and to improve the transparency and accountability of the Fund. The Office of the State Comptroller recommends the following actions to accomplish this:
The Executive should develop a multiyear plan to return structural balance to the Fund in order to ensure its ability to meet the State’s highway and bridge capital needs today and in the future. This plan would phase out the Fund’s support of State Operations spending, prioritize expenditures within the Fund, and phase out the Fund’s reliance on the General Fund to cover Fund deficits. It would restore the original intent of the Fund, to provide a reliable, pay-as-you-go funding stream to meet the State’s critical transportation infrastructure needs.
DOB should prepare and publicly release quarterly updates of the Fund’s Five-Year
Capital Program and Financial Plan, as well as annual debt service coverage ratio estimates for the Fund, including detailed explanation of the methodology used to calculate this ratio.
The Executive should create a comprehensive strategic planning process for State
capital projects. This comprehensive capital needs assessment and long-term strategic capital plan would examine infrastructure needs in a coordinated manner to allow for effective prioritization and to ensure that critical infrastructure needs are met. This reform is part of the Office of the State Comptroller’s fiscal reform package that comprehensively addresses the State’s budget, debt and capital problems.
4 Part Z of Chapter 62 of the Laws of 2006, amending State Finance Law, Section 22-c (Capital Program and Financing Plan), Section 24 (Budget Bills) and Section 89-b (Dedicated Highway and Bridge Trust Fund). 5 Part M of Chapter 59 of the Laws of 2007 postponed the effective date of Fund reporting requirements until April 1, 2008. Although the original law went into effect on that date, its requirements were not met. Part O of Chapter 59 of the Laws of 2009 eliminated a key transparency provision of the law that required quarterly updates on the status of the Fund. In addition, the DOB no longer reports the Fund’s debt service ratio, a measure that is vital to assessing its financial condition.

5
Funding New York State Highways The more than 113,000 miles of highway in New York include more than 15,000 miles owned by the New York State Department of Transportation (DOT), more than 20,000 miles owned by counties, and nearly 77,000 miles owned by cities, towns and villages. There are also more than 17,400 highway bridges, of which over 7,600 are owned by the State and the remainder by local governments and other agencies. New York’s roadways supported 133.72 billion vehicle miles of travel in 2008, a 5.4 percent decrease from the 2006 peak.6 Not only is the State responsible for the maintenance, repair and building of all State-owned highways and bridges, it also provides significant financial assistance for local highway construction and rehabilitation through the Consolidated Local Street and Highway Improvement Program (CHIPs) and the Marchiselli Program. In 1991, prior to the creation of the Dedicated Highway and Bridge Trust Fund (Fund), New York was one of only three states without such a dedicated fund. The State had used a combination of funding sources that included the General Fund, Special Revenue Funds and voter-approved General Obligation Bonds to meet its highway and bridge building needs. The Fund was established to provide a reliable funding source for the State’s highway capital program. It was created in conjunction with the Dedicated Mass Transportation Trust Fund, which provides State support for regional mass transit systems.7 The original legislation established the Fund as a pay-as-you-go capital projects fund to be supported primarily through dedicated taxes and fees. However, the law was amended in 1993 to authorize the Thruway Authority to issue bonds for State highway capital construction.8 This change opened the door to transforming the State’s transportation capital program from a primarily pay-as-you-go system to one that has become substantially debt-financed. The law was amended again in 2001, when disbursements for Department of Motor Vehicles (DMV) operating expenses and the DOT snow and ice removal program were added as permitted uses of the Fund.9 In 2003, a greater proportion of DMV fee revenue was allocated to the Fund to offset the impact of this shift in expenditures and to improve the debt service coverage ratio in the Fund. This series of amendments has served to undermine the original purpose of the Fund.
6 New York State Department of Transportation, SFY 2007-08 Annual Report of Bridge Management and Inspection Programs, 2007 Pavement Condition of New York’s Highways, and 2009 Vehicle Miles of Travel (VMT) statistics, accessed on October 8, 2009. 7 Chapters 329, 330 and 331 of the Laws of 1991. 8 Chapter 56 of the Laws of 1993. The original Chapter did authorize the State to enter into an agreement with the Thruway Authority to issue bonds for support of the CHIPs and Marchiselli programs. 9 Chapter 151 of the Laws of 2001.
6
State Operations costs within the Fund have grown steadily while capital projects disbursements have stagnated:
• Of more than $33.4 billion in total Fund spending through the end of SFY 2008-09, only $11.6 billion, or 34.9 percent, was used for direct expenditures on DOT capital projects.
Spending for capital as a percentage of total spending has declined from 49.5 percent in SFY 1993-94 to 27.4 percent in SFY 2008-09.
• State Operations spending has accounted for nearly $12.6 billion, or
37.7 percent, of Fund disbursements over the same period.
Spending for State Operations as a percentage of total spending has declined from 50.5 percent in SFY 1993-94 to 42.1 percent in SFY 2008-09.
• Debt service continues to be the fastest growing component of Fund
disbursements. Since the Fund’s inception through SFY 2008-09, over $9.1 billion, or 27.4 percent, of Fund spending has gone to pay debt service.
There was no debt service paid from the Fund in 1993-94. However, spending for debt service was 30.5 percent of total spending in SFY 2008-09, representing nearly one third of total spending.
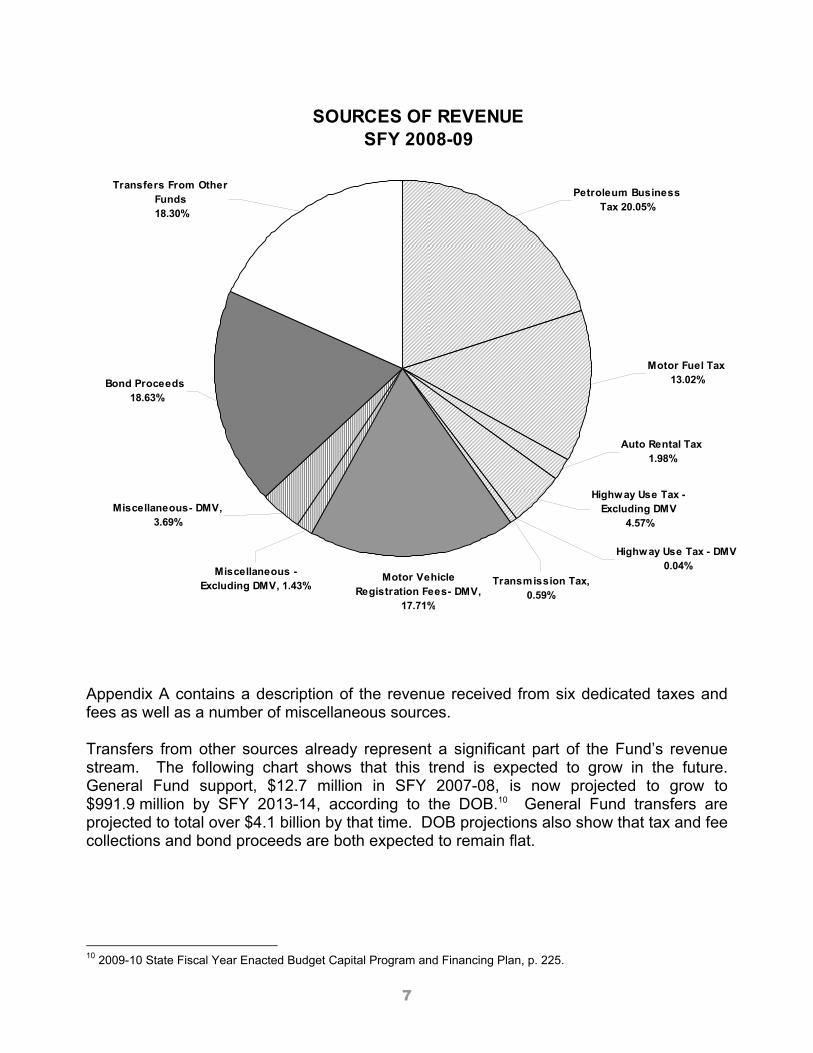
Revenue There are four major sources of revenue in the Fund, including taxes and fees, bond proceeds, transfers from other funds, and miscellaneous revenue. During SFY 2008-09, taxes and fees provided over $1.77 billion. However, this represents a $60.5 million decrease from the $1.83 billion in taxes and fees collected in the prior year, reflecting the effects of the current recession. In SFY 2008-09, bond proceeds accounted for $570 million; transfers from other funds, including the General Fund, contributed $560 million and miscellaneous revenues totaled $156 million. The following chart shows the Fund’s major sources of revenue in SFY 2008-09. Taxes and fees provided the majority of the funds, including: the Petroleum Business Tax, the Motor Fuel Tax, the Auto Rental Tax, Highway and Fuel Use Taxes, Transmission and Transportation Taxes and Motor Vehicle Fees.
7
SOURCES OF REVENUE SFY 2008-09
Transfers From Other Funds 18.30%
Petroleum Business Tax 20.05%
Bond Proceeds 18.63%
Transmission Tax, 0.59%
Highway Use Tax - DMV 0.04%
Highway Use Tax - Excluding DMV
4.57%Miscellaneous- DMV,
3.69%
Miscellaneous -Excluding DMV, 1.43%
Auto Rental Tax 1.98%
Motor Fuel Tax 13.02%
Motor Vehicle Registration Fees- DMV,
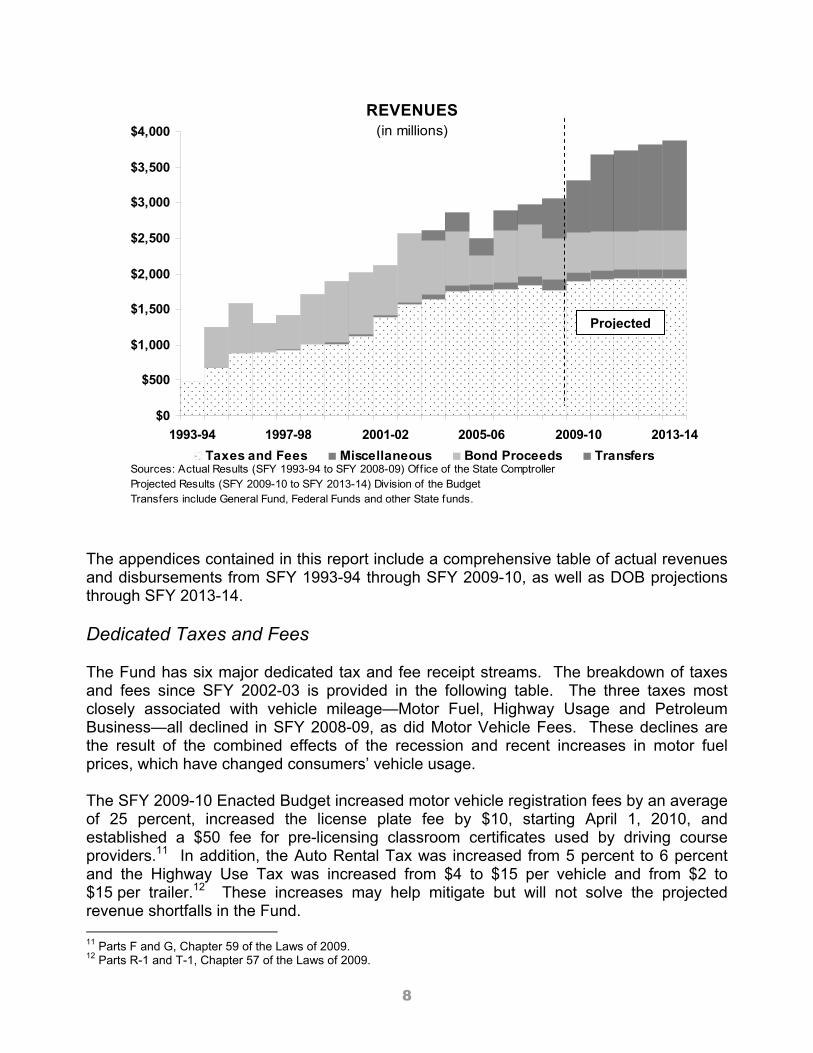
17.71% Appendix A contains a description of the revenue received from six dedicated taxes and fees as well as a number of miscellaneous sources. Transfers from other sources already represent a significant part of the Fund’s revenue stream. The following chart shows that this trend is expected to grow in the future. General Fund support, $12.7 million in SFY 2007-08, is now projected to grow to $991.9 million by SFY 2013-14, according to the DOB.10 General Fund transfers are projected to total over $4.1 billion by that time. DOB projections also show that tax and fee collections and bond proceeds are both expected to remain flat.
10 2009-10 State Fiscal Year Enacted Budget Capital Program and Financing Plan, p. 225.
8
REVENUES(in millions)
$0
$500
$1,000
$1,500
$2,000
$2,500
$3,000
$3,500
$4,000
1993-94 1997-98 2001-02 2005-06 2009-10 2013-14Taxes and Fees Miscellaneous Bond Proceeds Transfers
Sources: Actual Results (SFY 1993-94 to SFY 2008-09) Office of the State ComptrollerProjected Results (SFY 2009-10 to SFY 2013-14) Division of the BudgetTransfers include General Fund, Federal Funds and other State funds.
The appendices contained in this report include a comprehensive table of actual revenues and disbursements from SFY 1993-94 through SFY 2009-10, as well as DOB projections through SFY 2013-14. Dedicated Taxes and Fees The Fund has six major dedicated tax and fee receipt streams. The breakdown of taxes and fees since SFY 2002-03 is provided in the following table. The three taxes most closely associated with vehicle mileage—Motor Fuel, Highway Usage and Petroleum Business—all declined in SFY 2008-09, as did Motor Vehicle Fees. These declines are the result of the combined effects of the recession and recent increases in motor fuel prices, which have changed consumers’ vehicle usage. The SFY 2009-10 Enacted Budget increased motor vehicle registration fees by an average of 25 percent, increased the license plate fee by $10, starting April 1, 2010, and established a $50 fee for pre-licensing classroom certificates used by driving course providers.11 In addition, the Auto Rental Tax was increased from 5 percent to 6 percent and the Highway Use Tax was increased from $4 to $15 per vehicle and from $2 to $15 per trailer.12 These increases may help mitigate but will not solve the projected revenue shortfalls in the Fund. 11 Parts F and G, Chapter 59 of the Laws of 2009. 12 Parts R-1 and T-1, Chapter 57 of the Laws of 2009.
Projected
9
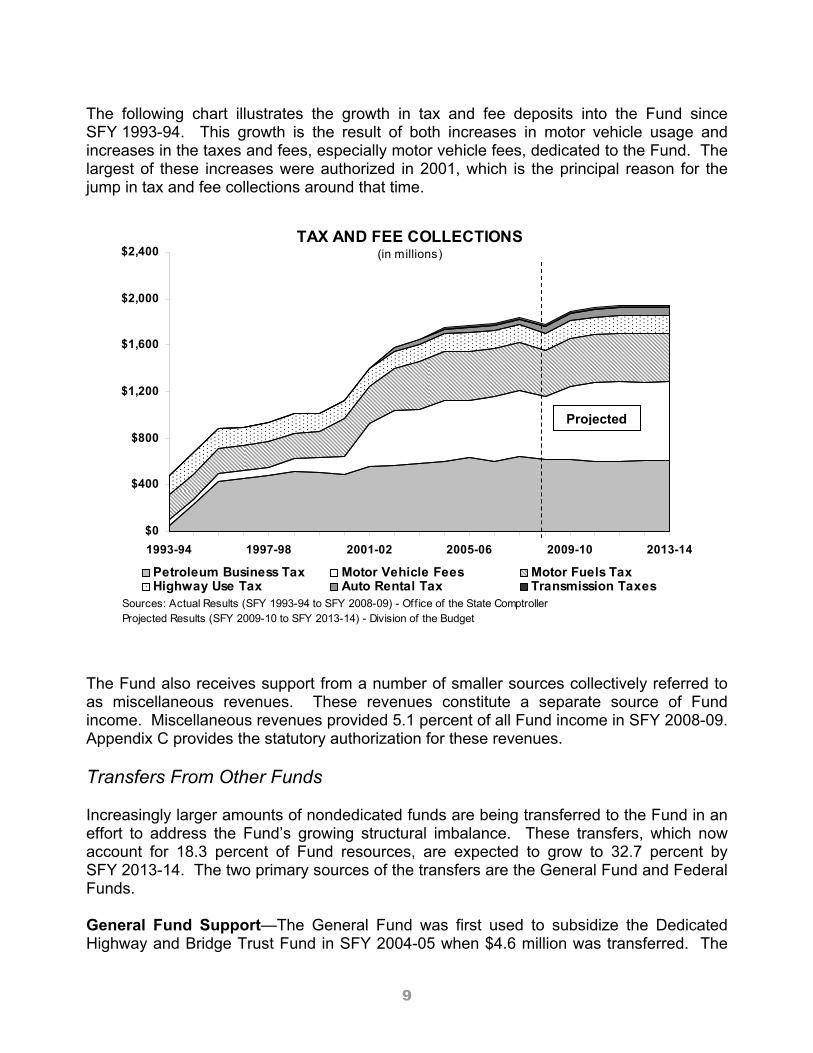
The following chart illustrates the growth in tax and fee deposits into the Fund since SFY 1993-94. This growth is the result of both increases in motor vehicle usage and increases in the taxes and fees, especially motor vehicle fees, dedicated to the Fund. The largest of these increases were authorized in 2001, which is the principal reason for the jump in tax and fee collections around that time.
TAX AND FEE COLLECTIONS(in millions)
$0
$400
$800
$1,200
$1,600
$2,000
$2,400
1993-94 1997-98 2001-02 2005-06 2009-10 2013-14
Petroleum Business Tax Motor Vehicle Fees Motor Fuels TaxHighway Use Tax Auto Rental Tax Transmission Taxes
Sources: Actual Results (SFY 1993-94 to SFY 2008-09) - Off ice of the State ComptrollerProjected Results (SFY 2009-10 to SFY 2013-14) - Division of the Budget
The Fund also receives support from a number of smaller sources collectively referred to as miscellaneous revenues. These revenues constitute a separate source of Fund income. Miscellaneous revenues provided 5.1 percent of all Fund income in SFY 2008-09. Appendix C provides the statutory authorization for these revenues. Transfers From Other Funds Increasingly larger amounts of nondedicated funds are being transferred to the Fund in an effort to address the Fund’s growing structural imbalance. These transfers, which now account for 18.3 percent of Fund resources, are expected to grow to 32.7 percent by SFY 2013-14. The two primary sources of the transfers are the General Fund and Federal Funds. General Fund Support—The General Fund was first used to subsidize the Dedicated Highway and Bridge Trust Fund in SFY 2004-05 when $4.6 million was transferred. The
Projected Projected
10
General Fund subsidy reappeared and increased to $12.7 million in SFY 2007-08, and then jumped to $237.2 million in SFY 2008-09. The subsidy has become a regular and increasingly important source of the Fund’s revenue. The SFY 2009-10 Enacted Capital Program and Financing Plan estimates that General Fund transfers would amount to $383 million in the current fiscal year, but that amount was increased to $396 million in the First Quarterly Financial Plan Update.13 Further, the General Fund subsidy is projected to increase in each year of the five-year Capital Plan, and is projected to total $3.9 billion from SFY 2009-10 through SFY 2013-14. Federal Funds—Since SFY 2003-04, DOB has directed the transfer of significant amounts of federal funds to the Fund. Prior to that time, some federal highway aid money had been transferred to a State fund referred to as the Department of Transportation Engineering Services Fund to offset the costs of engineering work performed by State employees. Now these federal funds are transferred to the Fund to reimburse it for engineering services. Transfers from federal funds are estimated to amount to $276.6 million in SFY 2009-10. Future levels of federal support will depend on the aid approved by Congress in the next federal aid highway law. The current law, the Safe, Accountable, Flexible, Efficient Transportation Equity Act: A Legacy for Users (SAFETEA-LU) was scheduled to expire in 2009. Congress is working on a temporary extension and will consider a new, permanent bill next year. Another major source of Fund revenue, bond proceeds, is discussed in the Back-Door Borrowing section of this report. The appendices provide complete detail on all past and projected transfers through SFY 2013-14. Disbursements Initially, the Fund’s 1991 enabling legislation was narrowly focused: Moneys in the dedicated highway and bridge trust fund shall, following appropriation by the legislature, be utilized for reconstruction, replacement, reconditioning and preservation of highways and bridges thereon, to restore such facilities to their intended functions, and construction, reconstruction and improvement of highways and bridges thereon, to address current and projected severe capacity problems.14
13 SFY 2009-10 Enacted Budget Capital Program and Financing Plan, p. 225, and 2009 First Quarter Financial Plan Update, July 2009, p. 26. 14 Chapter 329 of the Laws of 1991.
11
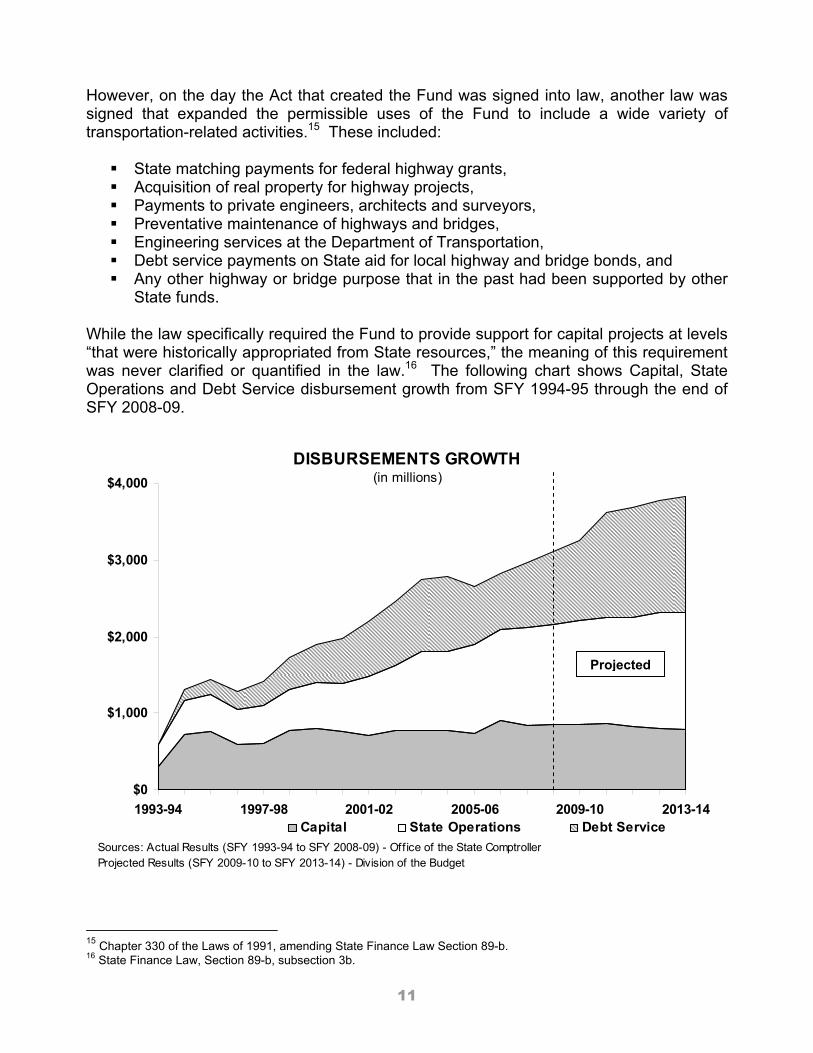
However, on the day the Act that created the Fund was signed into law, another law was signed that expanded the permissible uses of the Fund to include a wide variety of transportation-related activities.15 These included:
State matching payments for federal highway grants, Acquisition of real property for highway projects, Payments to private engineers, architects and surveyors, Preventative maintenance of highways and bridges, Engineering services at the Department of Transportation, Debt service payments on State aid for local highway and bridge bonds, and Any other highway or bridge purpose that in the past had been supported by other
State funds. While the law specifically required the Fund to provide support for capital projects at levels “that were historically appropriated from State resources,” the meaning of this requirement was never clarified or quantified in the law.16 The following chart shows Capital, State Operations and Debt Service disbursement growth from SFY 1994-95 through the end of SFY 2008-09.
DISBURSEMENTS GROWTH (in millions)
$0
$1,000
$2,000
$3,000
$4,000
1993-94 1997-98 2001-02 2005-06 2009-10 2013-14Capital State Operations Debt Service
Sources: Actual Results (SFY 1993-94 to SFY 2008-09) - Off ice of the State ComptrollerProjected Results (SFY 2009-10 to SFY 2013-14) - Division of the Budget
15 Chapter 330 of the Laws of 1991, amending State Finance Law Section 89-b. 16 State Finance Law, Section 89-b, subsection 3b.
Projected
12
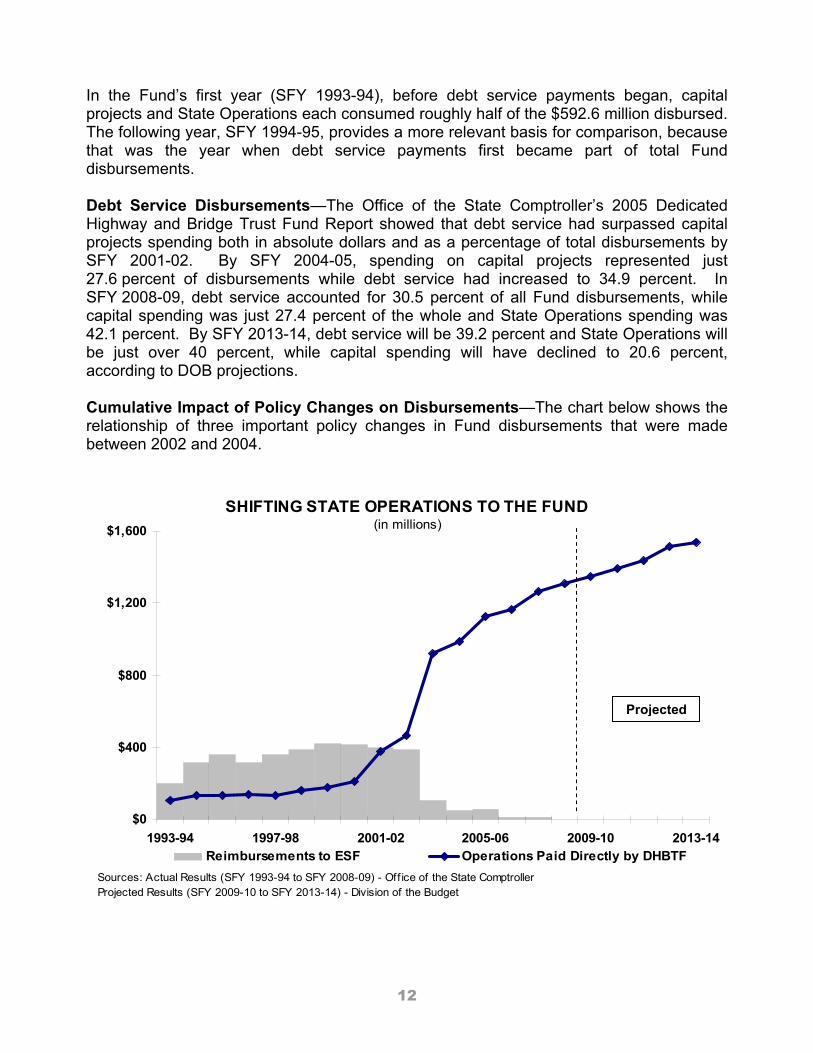
In the Fund’s first year (SFY 1993-94), before debt service payments began, capital projects and State Operations each consumed roughly half of the $592.6 million disbursed. The following year, SFY 1994-95, provides a more relevant basis for comparison, because that was the year when debt service payments first became part of total Fund disbursements. Debt Service Disbursements—The Office of the State Comptroller’s 2005 Dedicated Highway and Bridge Trust Fund Report showed that debt service had surpassed capital projects spending both in absolute dollars and as a percentage of total disbursements by SFY 2001-02. By SFY 2004-05, spending on capital projects represented just 27.6 percent of disbursements while debt service had increased to 34.9 percent. In SFY 2008-09, debt service accounted for 30.5 percent of all Fund disbursements, while capital spending was just 27.4 percent of the whole and State Operations spending was 42.1 percent. By SFY 2013-14, debt service will be 39.2 percent and State Operations will be just over 40 percent, while capital spending will have declined to 20.6 percent, according to DOB projections. Cumulative Impact of Policy Changes on Disbursements—The chart below shows the relationship of three important policy changes in Fund disbursements that were made between 2002 and 2004.
SHIFTING STATE OPERATIONS TO THE FUND(in millions)
$0
$400
$800
$1,200
$1,600
1993-94 1997-98 2001-02 2005-06 2009-10 2013-14Reimbursements to ESF Operations Paid Directly by DHBTF
Sources: Actual Results (SFY 1993-94 to SFY 2008-09) - Off ice of the State ComptrollerProjected Results (SFY 2009-10 to SFY 2013-14) - Division of the Budget
Projected
13
The first change was the decision to transfer federal funds to the Dedicated Highway and Bridge Trust Fund, rather than the Engineering Services Fund (ESF), to pay for State engineering services performed on federal aid projects. This shift accounts for approximately one-quarter to one-third of State Operations disbursements made by the Fund after 2003. In SFY 1994-95, capital spending made up 55.1 percent of total spending, whereas State Operations made up 34.2 percent and debt service 10.7 percent. The second policy change was the decision to pay the cost of engineering services on State-funded projects from the Fund, rather than from the ESF. This did not have a net impact on the disbursements of the Fund but shifted the type of disbursement from Transfers to State Operations. This accounts for approximately a third of all State Operations disbursements from the Fund. The third policy change was the decision to use the Fund to pay for normal departmental operations at DOT (snow and ice removal) and DMV. State Operations Disbursements—State Operations costs now consume the greatest share of the Fund. Resources were added in 2001 and 2002 to support some of this increased spending for State Operations, but it is difficult to determine whether the amount of this additional support has been enough to offset the increase in additional spending that has occurred. Although State Operations disbursements for engineering services are considered a legitimate use of a dedicated capital fund, the uses of the Fund have expanded over the years in ways that are not consistent with capital construction purposes. For example, the Fund law was amended in 2001 to permit DOT’s annual snow and ice removal operations to be paid out of the Fund. Snow and ice removal are ongoing maintenance costs and should not be paid with capital funds. The 2001 amendments also permit the Fund to pay for the ongoing operational expenses of DMV. DMV first received Fund support in SFY 2002-03, when $14.7 million was disbursed. This increased to $114.4 million by SFY 2003-04 and to $207.2 million by SFY 2008-09. Although DMV fee collections dedicated to the Fund more than cover the amount of DMV State Operations disbursements, such expenditures were not part of the Fund’s original purpose. As part of the SFY 2009-10 Enacted Budget, DOT and DMV were given a five-year extension of their authority to use Fund revenues for department operations.17 Capital Projects Disbursements—In SFY 1994-95, the share of spending for capital projects increased, from 49.5 percent to 55.1 percent of all disbursements. Since capital projects have a longer disbursement period than other types of spending, with payments normally spread over several years, the first year of Fund capital disbursements would
17 Part E, Chapter 59, Laws of 2009, amending Part B, Chapter 84 of the Laws of 2002, as amended by Part A of Chapter 63 of the Laws of 2005, and Part P, Chapter 59 of the Laws of 2009, amending Part U1 of Chapter 62 of the Laws of 2003.
14
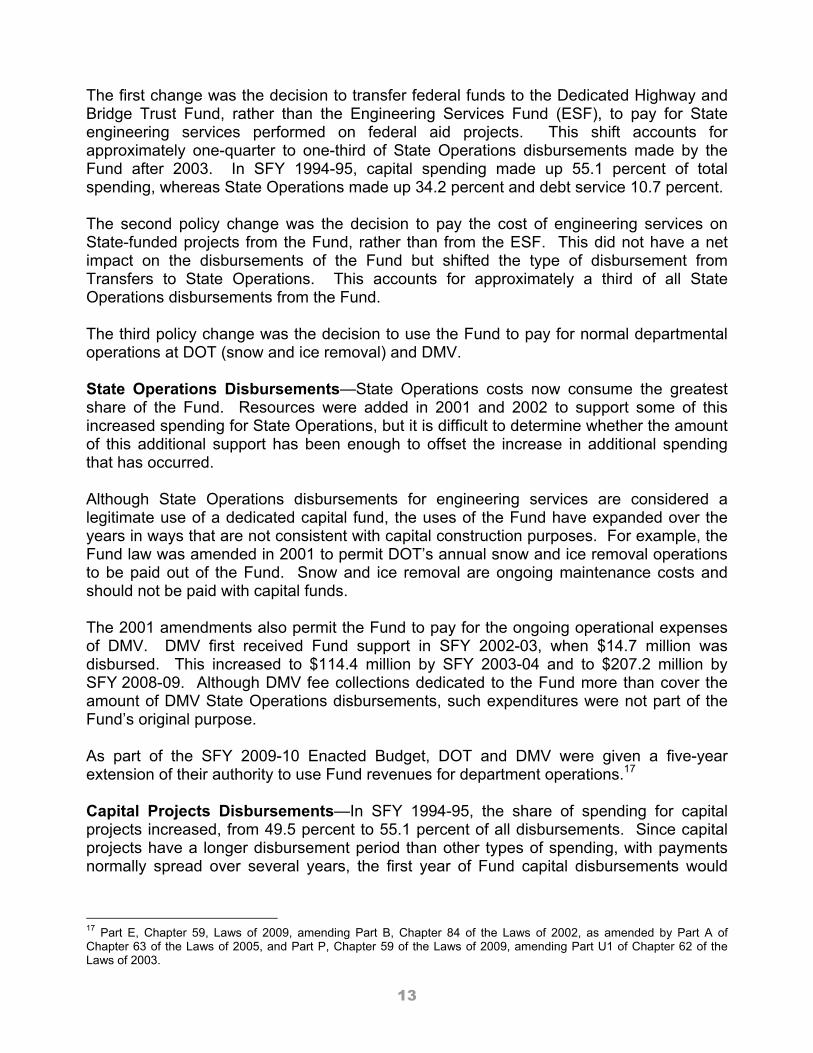
likely have paid only for a small part of projects begun at that time. Capital disbursements have remained essentially flat since SFY 1994-95. This, however, does not reflect the impact of inflation. Capital construction is subject to a rate of inflation that is typically higher than the rate of inflation experienced by the average consumer.18 When capital spending is adjusted for inflation, the amount of capital construction that has been supported by the Fund since SFY 1994-95 has essentially eroded.
IMPACT OF INFLATION ON CAPITAL DISBURSEMENTS (in millions)
$0
$400
$800
$1,200
$1,600
$2,000
1993-94 1996-97 1999-00 2002-03 2005-06 2008-09Additional Amount Needed to Keep Pace with InflationAmount of Actual Capital Disbursements
Source: Disbursements - OSC; Inflation - Bureau of Labor Statistics, Producer Price Index for Highw ay and Street Construction
As this chart shows, capital disbursements would need to have grown substantially to keep pace with inflation. The Fund would have needed to disburse $15.17 billion, or an additional $3.6 billion, to keep pace with inflation between SFY 1993-94 and SFY 2008-09. The Fund did not lack these additional resources. Motor vehicle fees have been increased periodically and a number of new tax resources have been given to the Fund, but these have been needed to support increased State Operations and debt service spending. The Fund, which was intended to be a capital projects Fund, has in essence become an all-purpose highway financing fund. 18 The federal Bureau of Labor Statistics calculates a special Producer Price Index for Highway and Street Construction. This index reflects the impact of increases in such basic materials as concrete, steel and petroleum, all of which have experienced higher rates of inflation than the Consumer Price Index.
15
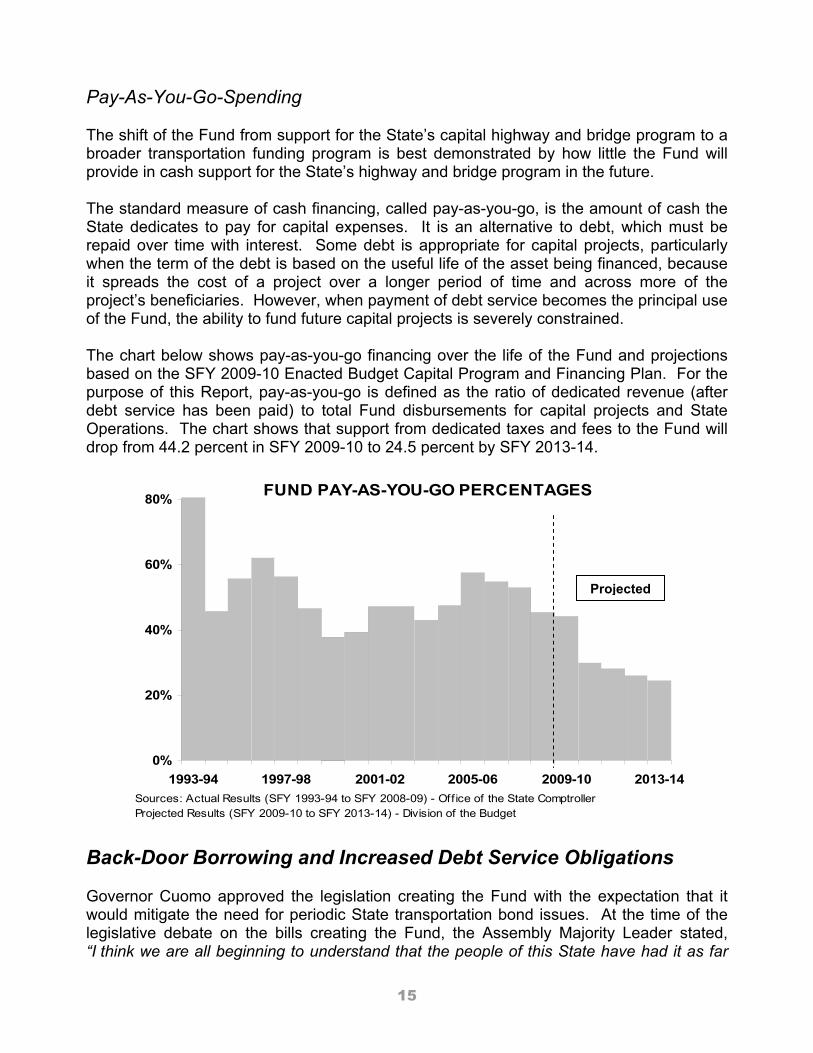
Pay-As-You-Go-Spending The shift of the Fund from support for the State’s capital highway and bridge program to a broader transportation funding program is best demonstrated by how little the Fund will provide in cash support for the State’s highway and bridge program in the future. The standard measure of cash financing, called pay-as-you-go, is the amount of cash the State dedicates to pay for capital expenses. It is an alternative to debt, which must be repaid over time with interest. Some debt is appropriate for capital projects, particularly when the term of the debt is based on the useful life of the asset being financed, because it spreads the cost of a project over a longer period of time and across more of the project’s beneficiaries. However, when payment of debt service becomes the principal use of the Fund, the ability to fund future capital projects is severely constrained. The chart below shows pay-as-you-go financing over the life of the Fund and projections based on the SFY 2009-10 Enacted Budget Capital Program and Financing Plan. For the purpose of this Report, pay-as-you-go is defined as the ratio of dedicated revenue (after debt service has been paid) to total Fund disbursements for capital projects and State Operations. The chart shows that support from dedicated taxes and fees to the Fund will drop from 44.2 percent in SFY 2009-10 to 24.5 percent by SFY 2013-14.
FUND PAY-AS-YOU-GO PERCENTAGES
0%
20%
40%
60%
80%
1993-94 1997-98 2001-02 2005-06 2009-10 2013-14Sources: Actual Results (SFY 1993-94 to SFY 2008-09) - Off ice of the State ComptrollerProjected Results (SFY 2009-10 to SFY 2013-14) - Division of the Budget
Back-Door Borrowing and Increased Debt Service Obligations Governor Cuomo approved the legislation creating the Fund with the expectation that it would mitigate the need for periodic State transportation bond issues. At the time of the legislative debate on the bills creating the Fund, the Assembly Majority Leader stated, “I think we are all beginning to understand that the people of this State have had it as far
Projected
16
as large or major bond issues are concerned. They no longer want to pay the debt service, the interest that almost equals the money being spent on the project or the programs themselves. They want to pay as you go.”19 Nevertheless, in 1993 legislation was enacted authorizing the Thruway Authority to issue bonds for the State’s highway and bridge program.20 These bonds are a special obligation of the Authority, issued pursuant to a cooperative agreement with the Department of Transportation. This agreement requires the State to pay the Authority an amount equal to the bond debt service plus expenses. The Thruway Authority is one of several public authorities that issue bonds pursuant to such agreements with the State. Public authorities are not subject to the State constitutional provision that requires all State debt issuances to be approved by the voters. Therefore, debt issued by public authorities on behalf of the State, also known as back-door borrowing, bypasses that constitutional safeguard. The 1993 legislation placed a cap of $2.93 billion on the amount of bonds that could be issued for State highway and bridge projects. That cap has since been raised a number of times, most recently in 2005, and is now $16.5 billion (excluding refunding and renewal obligations). DOB estimates that the Thruway Authority will have issued just over $10.9 billion of these “General Highway and Bridge Trust Fund Bonds” by the end of SFY 2009-10. A total of $7.2 billion will remain in outstanding principal at that time, leaving slightly less than $5.6 billion in available bonding authority for the future. DOB projects that another $3.8 billion in new bonds will be issued between SFY 2010-11 and SFY 2013-14. CHIPs and Marchiselli Debt—The State’s capital highway and bridge program is not the only source of the Fund’s debt burden. It also pays debt service for two State-funded local highway programs. The largest, known as the Consolidated Local Street and Highway Improvement Program (CHIPs), was implemented in 1982. CHIPs provides direct aid to municipalities for capital improvements to local streets and highways. The other program, the Marchiselli Aid Program, uses State funds to help localities pay their share of federal aid highway matching grant requirements. Initially, these State aid programs were cash-financed using annual General Fund appropriations. Starting in 1991, the State began issuing a new type of Thruway bonds to finance CHIPs and Marchiselli payments to the localities.21 By SFY 2002-03, the CHIPs and Marchiselli programs had become entirely bond supported. There have been two types of CHIPs and Marchiselli bonds. The first, issued between 1991 and 2001, was called Local Highway and Bridge Service Contract Bonds. These bonds were issued pursuant to a contractual agreement between the Authority and the State. Like the Thruway’s General Highway and Bridge Trust Fund Bonds, these CHIPs and Marchiselli bonds enabled the State to bypass the constitutional requirement for voter approval of State debt issuances. 19 Transcript of Assembly Floor Debate, June 4, 1991, pp. 35-36. 20 Chapter 56 of the Laws of 1993 created section 385 of Public Authorities Law. 21 Chapter 330 of the Laws of 1991. Thruway Authority bond issuances for CHIPs and Marchiselli Aid are authorized in Public Authorities Law Section 380. CHIPs is authorized in Highway Law Section 10-c; Marchiselli Aid is a federal highway aid program for municipalities that requires a local matching contribution. New York State provides funds to help localities pay their Marchiselli share, and these payments are authorized in Highway Law Section 80-b. The Fund also supports payments for the State’s multi-modal program, which provides aid for rail, port and aviation projects, and for a smaller but now dormant program known as SHIPs (Suburban Highway Improvement Program).
17
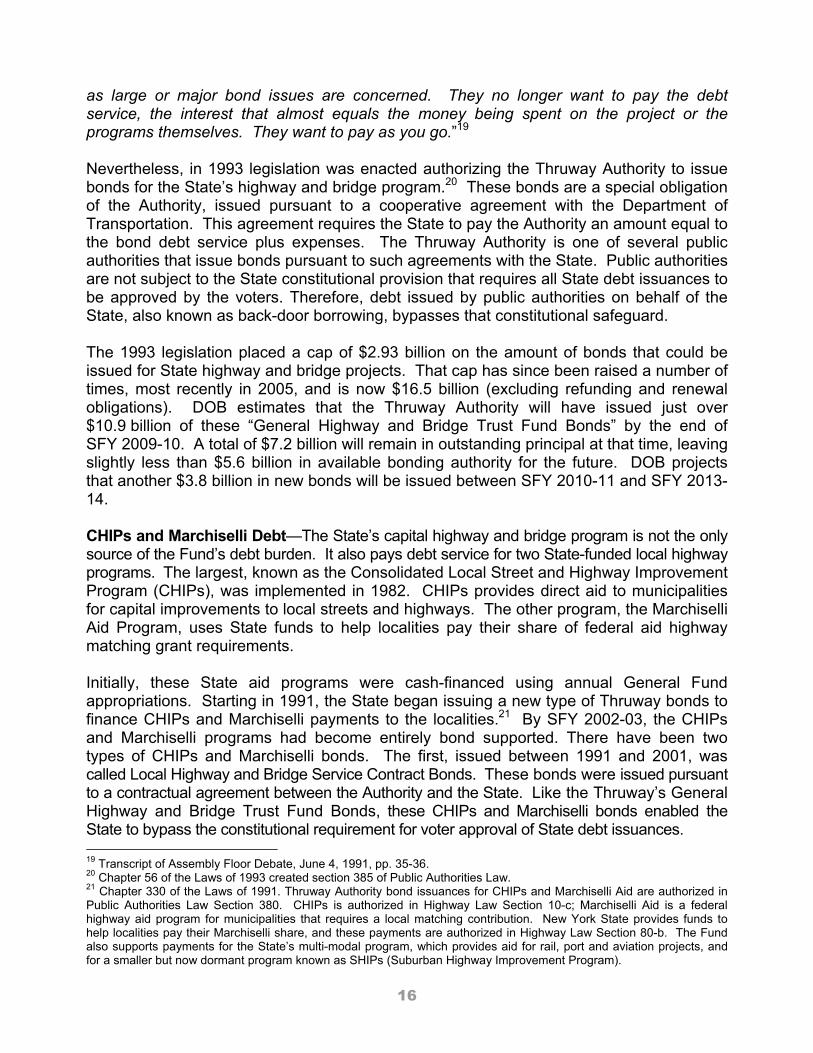
In 2002, the State began using a new debt program called the Personal Income Tax Revenue Bond Financing Program.22 Repayment of these bonds is supported by a dedication of one-quarter of the State’s Personal Income Tax. The Thruway Authority participates in this program and now issues “State Personal Income Tax Revenue Bonds (Transportation),” also known as PIT bonds, for CHIPs and Marchiselli support (referred to below as CHIPs PIT Bonds). Although these PIT bonds rely on the State’s Personal Income Tax as a means to guarantee debt service payment, the actual source of the revenue to pay for the bonds is the Fund. These bonds are also considered back-door borrowing, as they bypass constitutional voter approval requirements. The CHIPs and Marchiselli programs have a bond cap of $5.861 billion. A combined total of just under $3.7 billion will have been issued against that cap by the end of SFY 2009-10. DOB estimates that an additional $1.6 billion will be issued through SFY 2013-14. Combined Debt Burdens—The following chart shows the amount of outstanding bonded indebtedness for each year since the inception of the Fund and projections for the next five years, including all types of bonds issued by the Thruway Authority for the State. In the coming years, the amount of outstanding debt is projected to flatten. Since the early part of the decade, revenue collections have been basically flat.
DEDICATED TAX AND FEE RECEIPTS vs.
TOTAL OUTSTANDING DEBT(in billions)
$0
$2
$4
$6
$8
$10
$12
1993-94 1997-98 2001-02 2005-06 2009-10 2013-14Total Debt Outstanding Annual Receipts
Sources: Actual Results (SFY 1993-94 to SFY 2008-09) - Off ice of the State ComptrollerProjected Results (SFY 2009-10 to SFY 2013-14) - Division of the Budget
22 Chapter 383 of the Laws of 2001.
Projected
18
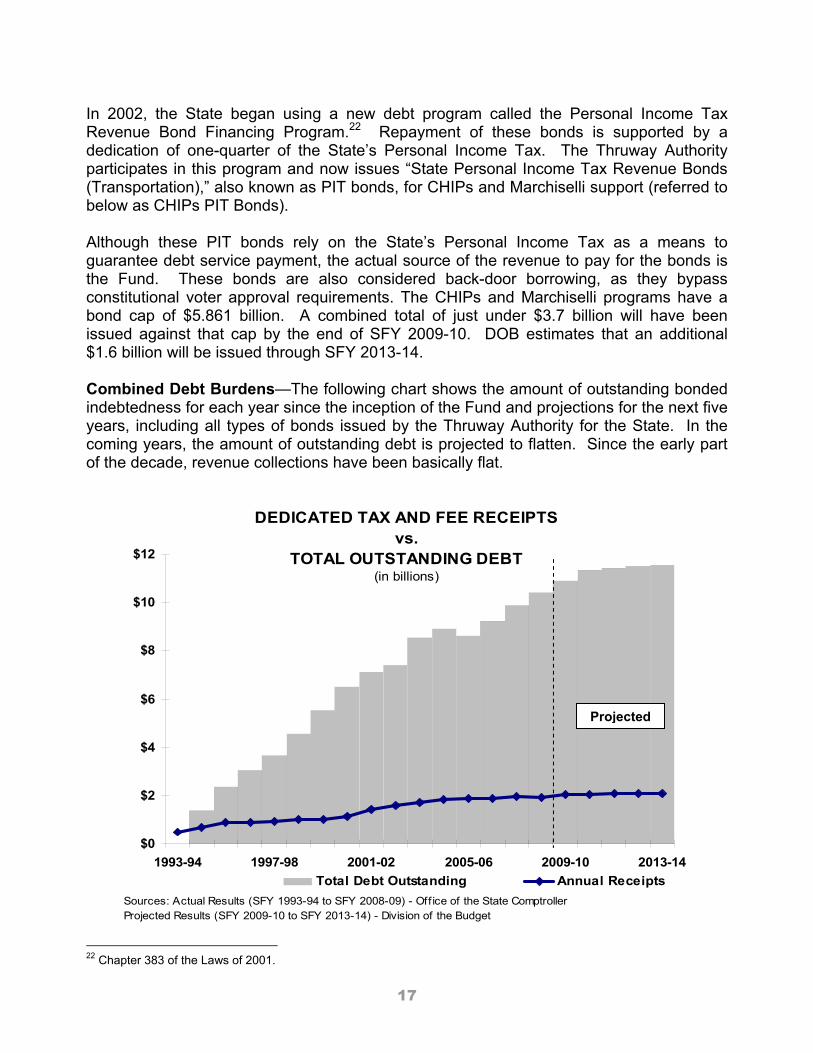
All of this debt is the result of back-door borrowing. As a result of reforms first recommended by the Office of the State Comptroller in its 2005 report, DOB now provides a capital plan for the Fund in the Executive Budget proposal and the Enacted Budget Financial Plan reports that shows the amount of this back-door borrowing. See Appendix C in this Report for tables showing Thruway Authority Bonds issued for the State since 1993, as well as anticipated issuances through SFY 2013-14. Debt Service The Fund pays all debt service on Thruway Authority bonds issued for the State highway capital and bridge program. The chart below shows the size and composition of this debt service obligation since SFY 1994-95.
DEBT SERVICE BY BOND TYPE (in millions)
$0
$400
$800
$1,200
$1,600
1993-94 1997-98 2001-02 2005-06 2009-10 2013-14
Highway and Bridge Bonds CHIPs Bonds CHIPs PIT BondsSources: Actual Results (SFY 1993-94 to SFY 2008-09) - Off ice of the State ComptrollerProjected Results (SFY 2009-10 to SFY 2013-14) - Division of the Budget
The decline in debt service between SFY 2004-05 and SFY 2005-06 reflects the restructuring of Fund debt in 2005, which allowed a five-year delay in principal payments resulting in short-term reductions in debt service payments in SFYs 2005-06 and 2006-07. As noted previously in the 2005 Report, the Thruway Authority, as part of the restructuring plan, also modified its debt service structure to slow the repayment schedule of existing debt. The original, more aggressive repayment schedules paid off the principal more rapidly, which rejuvenates borrowing capacity more quickly by requiring higher principal
Projected
19
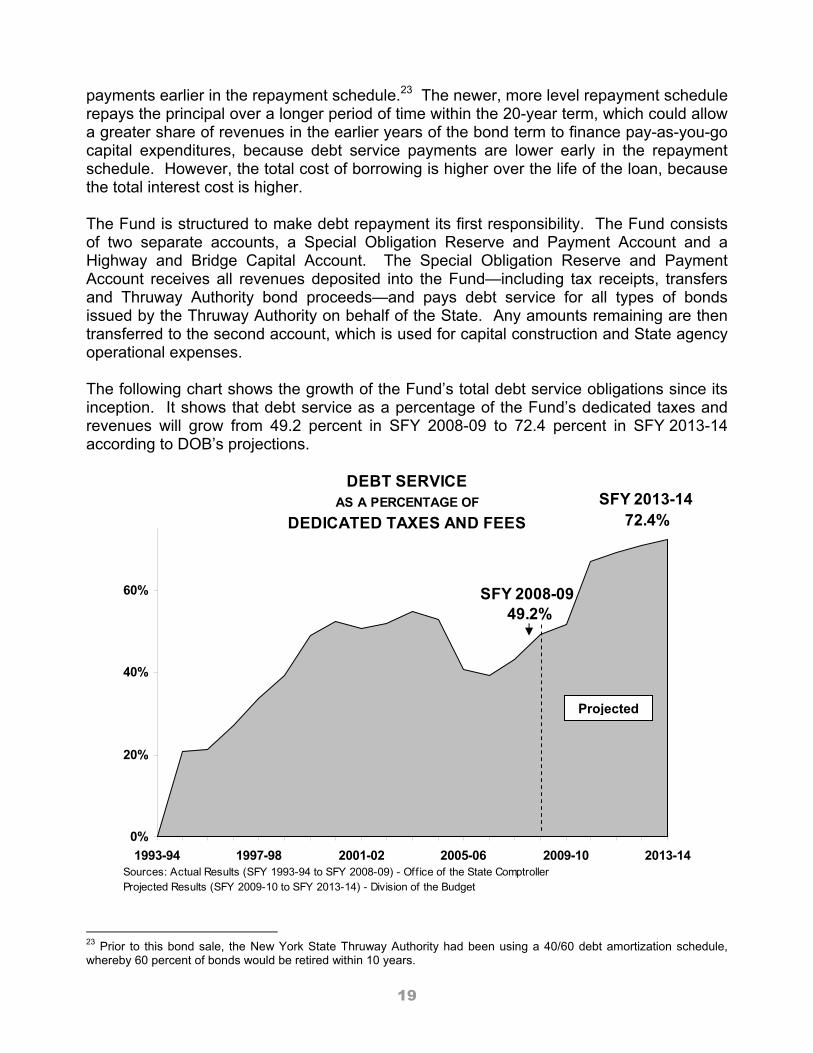
payments earlier in the repayment schedule.23 The newer, more level repayment schedule repays the principal over a longer period of time within the 20-year term, which could allow a greater share of revenues in the earlier years of the bond term to finance pay-as-you-go capital expenditures, because debt service payments are lower early in the repayment schedule. However, the total cost of borrowing is higher over the life of the loan, because the total interest cost is higher. The Fund is structured to make debt repayment its first responsibility. The Fund consists of two separate accounts, a Special Obligation Reserve and Payment Account and a Highway and Bridge Capital Account. The Special Obligation Reserve and Payment Account receives all revenues deposited into the Fund—including tax receipts, transfers and Thruway Authority bond proceeds—and pays debt service for all types of bonds issued by the Thruway Authority on behalf of the State. Any amounts remaining are then transferred to the second account, which is used for capital construction and State agency operational expenses. The following chart shows the growth of the Fund’s total debt service obligations since its inception. It shows that debt service as a percentage of the Fund’s dedicated taxes and revenues will grow from 49.2 percent in SFY 2008-09 to 72.4 percent in SFY 2013-14 according to DOB’s projections.
DEBT SERVICE AS A PERCENTAGE OF
DEDICATED TAXES AND FEES
49.2%
72.4%
0%
20%
40%
60%
1993-94 1997-98 2001-02 2005-06 2009-10 2013-14Sources: Actual Results (SFY 1993-94 to SFY 2008-09) - Off ice of the State ComptrollerProjected Results (SFY 2009-10 to SFY 2013-14) - Division of the Budget
SFY 2008-09
SFY 2013-14
23 Prior to this bond sale, the New York State Thruway Authority had been using a 40/60 debt amortization schedule, whereby 60 percent of bonds would be retired within 10 years.
Projected
20
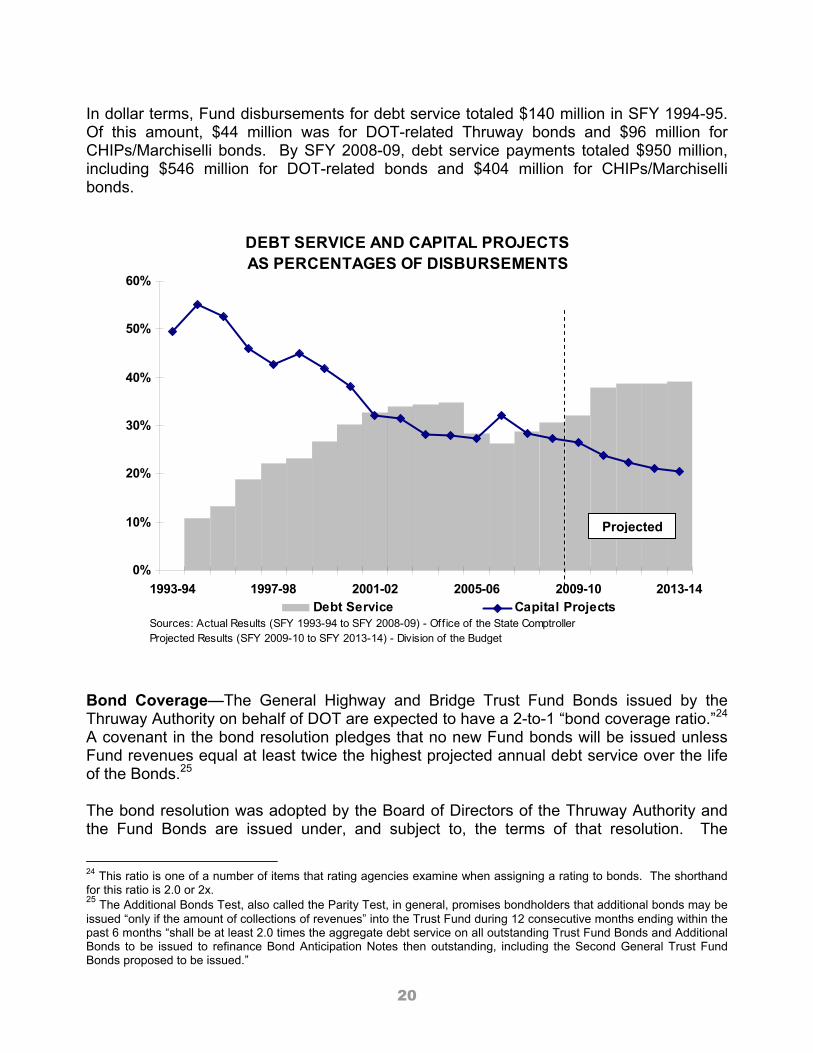
In dollar terms, Fund disbursements for debt service totaled $140 million in SFY 1994-95. Of this amount, $44 million was for DOT-related Thruway bonds and $96 million for CHIPs/Marchiselli bonds. By SFY 2008-09, debt service payments totaled $950 million, including $546 million for DOT-related bonds and $404 million for CHIPs/Marchiselli bonds.
DEBT SERVICE AND CAPITAL PROJECTS AS PERCENTAGES OF DISBURSEMENTS
0%
10%
20%
30%
40%
50%
60%
1993-94 1997-98 2001-02 2005-06 2009-10 2013-14Debt Service Capital Projects
Sources: Actual Results (SFY 1993-94 to SFY 2008-09) - Off ice of the State ComptrollerProjected Results (SFY 2009-10 to SFY 2013-14) - Division of the Budget
Bond Coverage—The General Highway and Bridge Trust Fund Bonds issued by the Thruway Authority on behalf of DOT are expected to have a 2-to-1 “bond coverage ratio.”24 A covenant in the bond resolution pledges that no new Fund bonds will be issued unless Fund revenues equal at least twice the highest projected annual debt service over the life of the Bonds.25 The bond resolution was adopted by the Board of Directors of the Thruway Authority and the Fund Bonds are issued under, and subject to, the terms of that resolution. The
24 This ratio is one of a number of items that rating agencies examine when assigning a rating to bonds. The shorthand for this ratio is 2.0 or 2x. 25 The Additional Bonds Test, also called the Parity Test, in general, promises bondholders that additional bonds may be issued “only if the amount of collections of revenues” into the Trust Fund during 12 consecutive months ending within the past 6 months “shall be at least 2.0 times the aggregate debt service on all outstanding Trust Fund Bonds and Additional Bonds to be issued to refinance Bond Anticipation Notes then outstanding, including the Second General Trust Fund Bonds proposed to be issued.”
Projected
21
covenant regarding the bond coverage ratio is also disclosed in the Thruway Authority’s Official Statement, the document that provides material information on the offering of the Bonds to investors and to the public. Investors use this information to evaluate the credit quality of the Bonds and to make investment decisions. Debt service payments on CHIPs/Marchiselli bonds are not considered for the purpose of calculating this bond coverage ratio.26 As part of the SFY 2002-03 Enacted Budget, the Legislature approved an Executive proposal that shifted a substantial portion of DMV operations—and all remaining DMV fees—from the General Fund to the Fund. Then, in 2005, the Executive implemented a plan to restructure the Fund’s outstanding debt to produce debt service savings in the near-term by deferring principal payments. If at any time the resources of the Fund are insufficient to pay debt service obligations, the Office of the State Comptroller is required to transfer an amount equal to the deficiency from the General Fund. This transfer would occur without further appropriation. Furthermore, although the Legislature is not required to make appropriations for the payment of debt service on these bonds, the Cooperative Agreement between DOT and the Thruway states that no Fund resources will be available for the State’s highway and bridge capital program or any other purpose without such appropriations, meaning that the Fund could not be used for capital purposes if it is not meeting its debt service obligations. These limitations provide further assurance to bondholders that debt service will be paid. In addition, excess revenues in the Local Government Assistance Corporation Tax Fund (LGAC) would also be held back from State use. These provisions mean that although Thruway bonds issued for the Fund are not legally defined as State debt, the terms of the bond covenants and the Cooperative Agreement create strong practical incentives to treat them as such. The Division of the Budget no longer provides estimates of the bond coverage ratio for the Fund over the life of the Plan. In the past, this calculation was included in the Executive Budget presentation. When DOB last made this calculation public, as part of the SFY 2008-09 Executive Budget, it estimated that the ratio would fall to 2.0 by SFY 2011-2012.
26 The Fund reimburses the State’s Debt Service Fund for all payments on CHIPs/Marchiselli bonds only after all debt service on the Fund’s General Highway and Bridge Trust Fund Bonds has been paid or set aside. Because CHIPs/Marchiselli bonds are not issued on parity with General Highway and Bridge Trust Fund Bonds, their debt service is not counted in the Fund bond coverage ratio. Debt service on CHIPs PIT bond issuances is paid, in the first instance, with revenues from the State Revenue Bond Tax Fund, which is a subfund of the General Debt Service Fund. These costs are reimbursed via transfers from the Fund after payment or set aside of General Highway and Bridge Trust Fund Bond debt service.

23
Conclusion The Dedicated Highway and Bridge Trust Fund was established to provide a reliable and predictable revenue source to support road and bridge capital spending in New York State. However, the Fund is now facing an increasing structural imbalance that is also having an impact on the State’s overall financial stability, reflected by the increasing need for General Fund subsidies. If present trends continue, the Fund may soon use nearly all of its dedicated resources for the payment of debt service obligations. If this happens, New York will be forced to either curtail its road and bridge program or find new resources to pay for it. In light of the State’s current budget crisis, such new resources will be difficult to identify. Furthermore, the decision to use the General Fund to meet the needs of the Fund in the short run has not solved the problem; it has merely added to the State’s structural deficit. A problem of this size cannot be resolved without addressing other aspects of the State’s financial structure, including the budget, capital planning and the use of debt. The Office of the State Comptroller recommends that the State develop a plan that addresses the Fund’s growing and unsustainable debt burden, returns structural balance to the Fund and restores the original intent of the Fund to provide a reliable, pay-as-you go funding stream to meet the State’s critical transportation infrastructure needs. Additionally, a comprehensive capital needs assessment and long-term strategic capital planning process must be established to examine and prioritize infrastructure needs across the State in a coordinated, cohesive manner to ensure that critical infrastructure needs are met. The need for more reliable and current financial information also remains an imperative. Therefore, the statutory requirement for DOB to provide quarterly updates of the Fund’s Five-Year Capital Program and Financial Plan should be restored. Furthermore, since the growing debt burden is at the heart of the present crisis, the Executive should resume releasing timely and accurate bond coverage ratio estimates. The Office of the State Comptroller has repeatedly warned that the State’s current budget practices cannot be sustained. The Dedicated Highway and Bridge Trust Fund is a prime example of how a well-designed, responsible funding strategy to provide for long-term needs can be thwarted through a series of decisions driven by short-term expediency. The Trust Fund was established to provide a reliable, self-sustaining, primarily pay-as-you-go source of funds to support the State’s roads and bridges, but its purpose has been eroded through a series of actions that have created significant long-term problems, including unsustainable debt service growth and a structural imbalance. The State must act now to address this mounting problem. The longer it delays a solution, the more difficult the task will become.

25
Appendices Appendix A: Dedicated Revenue Sources
The Dedicated Highway and Bridge Trust Fund (Fund) receives revenues from six dedicated taxes and fees, as well as a number of miscellaneous sources. Receipts accruing from four of the six are split with one or more other State funds, as explained below.
Petroleum Business Tax (PBT): This tax is the largest contributor to the Fund and accounted for 34.6 percent of tax and fee collections (or 20 percent of all Fund revenues) in SFY 2008-09.
• Statutory authority: Article 13-A of the Tax Law imposes base and supplemental petroleum business taxes, which are levied as privilege taxes on petroleum businesses operating in New York State and are imposed at different points in the distribution cycle, depending on the type of fuel.
Motor Vehicle Fees: Various fees charged for motor vehicle licenses accounted
for 30.6 percent of total tax and fee collections (17.7 percent of all Fund revenues) in SFY 2008-09.
• Statutory authority: Article 14 of the Vehicle and Traffic Law authorizes a number of motor vehicle fees, including vehicle registrations, driver licensing fees and other types of fees.
Motor Fuel Tax (MFT): This tax accounted for 22.5 percent of tax and fee
collections (13 percent of all Fund revenues) in SFY 2008-09. • Statutory authority: Article 12-A of the Tax Law imposes a tax of eight
cents per gallon on gasoline (comprising a four-cent regular tax, a three-cent additional tax and a one-cent supplemental tax). The tax is also imposed on diesel motor fuel; this rate had been ten cents per gallon until it was lowered to eight cents in 1996.
Highway and Fuel Use Taxes: These taxes accounted for 7.9 percent of total tax
and fee collections (4.6 percent of all Fund revenues) in SFY 2008-09. • Statutory authority: Articles 21 and 21-a of the Tax Law impose highway
and fuel use taxes comprising three distinct revenue streams: the truck mileage tax (base tax plus supplemental tax) is roughly 75 percent of these revenues, the fuel use tax (on fuel purchased outside New York, but used on New York highways) is approximately 20 percent of revenues, and highway use permit fees make up the remainder.
Auto Rental Tax: This tax accounted for 3.4 percent of tax and fee collections
(2.0 percent of all Fund revenues) in SFY 2008-09. • Statutory authority: Article 28-A of the Tax Law imposes a 5.0 percent tax
on car rentals.
26
Transmission and Transportation Taxes: These taxes collectively accounted for 1.0 percent of tax and fee collections (0.6 percent of all Fund revenues) in SFY 2008-09.
• Statutory authority: Article 9 of the Tax Law imposes franchise taxes on transmission and transportation companies, including telecommunications, trucking, railroad and other transportation companies.
Miscellaneous Revenues Miscellaneous revenues accounted for 5.1 percent of all Fund revenues in SFY 2008-09:
Fines, fees and penalties for working without a permit in State highway rights-of-way (Highway Law, Section 52),
Fees for participation in “Official Business Directional Sign Program” [Highway Law, Section 88, Subsections (5), (8) and (12)],
DOT permits and lease revenue [Public Authorities Law, Section 385(1) (a)], Inspector application fees [Vehicle and Traffic Law, Section 304-a (d)], Certification of Inspection fee between April 1, 2004 and March 31, 2010 [Vehicle
and Traffic Law, Section 415 (6-a)], Dealer or Transporter registration fees between April 1, 2004 and March 31, 2010
(Vehicle and Traffic Law, Section 415), Title application fees [Vehicle and Traffic Law, Section 2125(g)], DOT document fees (State Finance Law, Section 89-b), Overweight vehicle fees, fines and penalties [Vehicle and Traffic Law, Section
385(15)], and Any other moneys credited or transferred into the Fund (State Finance Law, Section
89-b).

27
Appendix B: Statutory Changes in Revenue Sources and Uses
Year Revenue Amounts Dedicated to DHBTF Effective Date1993 Highway Use Tax 100 percent to DHBTF April 1, 1993
Motor Fuel Tax 50 percent (4 cents per gallon) of the gasoline MFT to DHBTF April 1, 1993Motor Vehicle Fees 13 percent to DHBTF April 1, 1993Petroleum Business Tax 54 percent allocated to dedicated funds pool (DHBTF receives 63 percent
of pool).April 1, 1993
1994 Petroleum Business Tax 59 percent allocated to dedicated funds pool but revenue neutral due to new exemptions.
September 1, 1994
1995 Petroleum Business Tax 62.8 percent allocated to dedicated funds pool but revenue neutral due to new exemptions.
September 1, 1995
Motor Vehicle Fees Percent allocated to DHBTF increased to 17 percent. January 1, 19951996 Petroleum Business Tax 63.3 percent allocated to dedicated funds pool but revenue neutral. April 1, 1996
Motor Vehicle Fees Percent allocated to DHBTF increased from 17 percent to 20 percent. January 1, 19961997 Petroleum Business Tax 66.2 percent allocated to dedicated funds pool but revenue neutral. January 1, 19971998 Petroleum Business Tax 68.1 percent allocated to dedicated funds pool but revenue neutral. January 1, 1998
Motor Vehicle Fees Percent allocated to DHBTF increased from 20 percent to 28 percent. April 1, 1998Motor Vehicle Fees Percent allocated to DHBTF increased from 28 percent to 34 percent. July 1, 1998
1999 Petroleum Business Tax 69.8 percent allocated to dedicated funds pool but revenue neutral. April 1, 1999Motor Vehicle Fees Percent allocated to DHBTF increased from 34 percent to 45.5 percent. February 1, 1999.Certain Special Revenues 100 percent of CSRs (special permits, fees, etc.) to DHBTF April 1, 1999
2000 Motor Fuel Tax 67.7 percent of the gasoline MFT (an additional 2.25 cents per gallon) and 31.5 percent of the diesel MFT (4 cents) to DHBTF.
April 1, 2000
Motor Vehicle Fees 23.5 percent of additional registration fees allocated to DHBTF, for a total of 45.5 percent
April 1, 2001
2001 Petroleum Business Tax $7.5 million of basic PBT, formerly allocated to the General Fund, now allocated to dedicated funds pool; 80.3 percent of remaining tax allocated to dedicated funds pool.
April 1, 2001
Motor Fuel Tax 49.2 percent (an additional 2.25 cents) of diesel MFT to DHBTF. April 1, 20012002 Motor Vehicle Fees Percentage allocated to dedicated funds pool increased to 54.4 percent. April 1, 2002
DMV and DOT Use of DHBTF Revenues
Permits the use of DHBTF fees for the normal operations of the Department of Motor Vehicles and the Department of Transportation
April 1, 2002
Auto Rental Tax 100 percent allocated to DHBTF April 1, 20022003 Motor Fuel Tax 81.5 percent of the gasoline MFT and 63 percent of the diesel MFT (the
remaining 1.75 cent of both the gasoline and diesel MFT) to DHBTF.April 1, 2003
Motor Vehicle Fees Additional fee collections allocated to the DHBTF April 1, 20042004 Transmission and
Transportation Taxes20 percent of receipts allocated to DHBTF April 1, 2004
2005 Motor Vehicle Fees 100% of fee increases to the dedicated funds pool October 1, 20052008 Intermunicipal Cooperation
ContractsAny moneys collected by NYS DOT for contractual services to muncipalities provided pursuant to General Municipal Law Sec 99-r to DHBTF.
July 7, 2008
2009 Motor Vehicle Fees 25 percent increase in most fees to DHBTF. September 1, 2009Auto Rental Tax Increased from 5 to 6 percent to DHBTF. June 1 2009Highway Use Tax Increased from $4 to $15 per vehicle and from $2 to $15 per trailer to
DHBTF.April 1, 2009
DMV and DOT Use of DHBTF Revenues
Extends permission for DMV and DOT to use DHBTF revenues for normal agency operations and extends statutory use of various revenues, both to March 31, 2015.
April 1, 2009
Sources: Enacted Budgets, Division of the Budget, Thruway Authority; LexisNexis
28
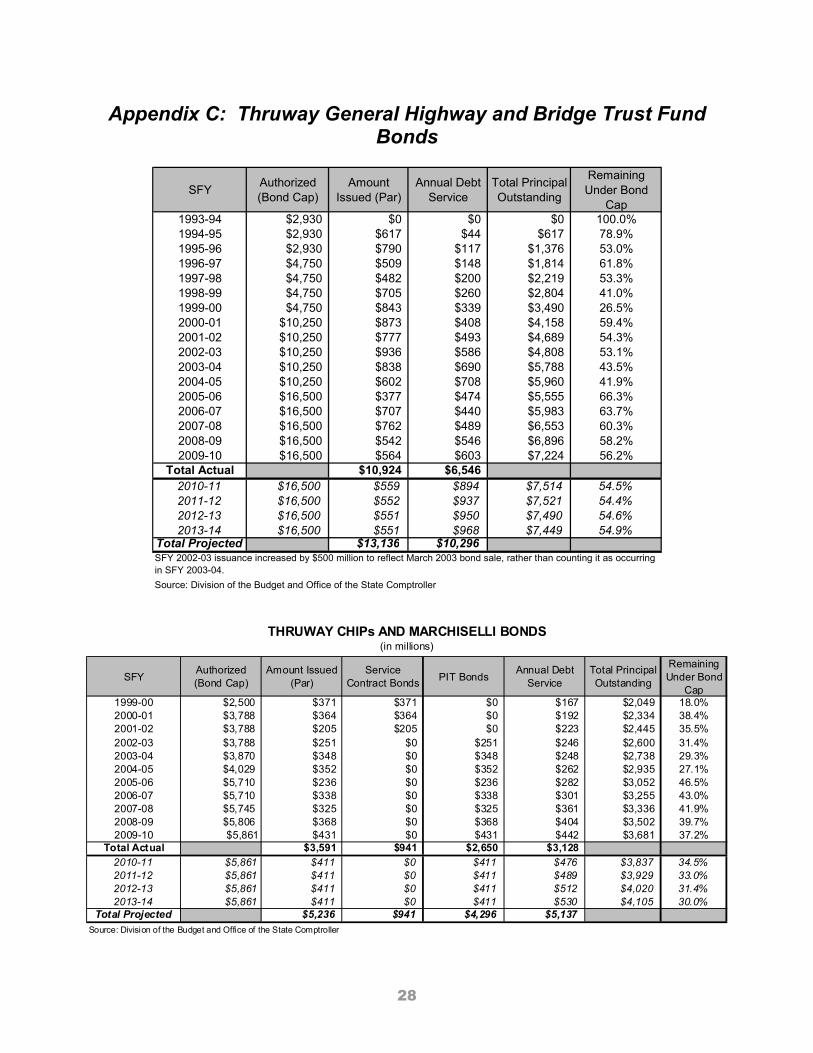
Appendix C: Thruway General Highway and Bridge Trust Fund Bonds
SFY Authorized (Bond Cap)
Amount Issued (Par)
Annual Debt Service
Total Principal Outstanding
Remaining Under Bond
Cap1993-94 $2,930 $0 $0 $0 100.0%1994-95 $2,930 $617 $44 $617 78.9%1995-96 $2,930 $790 $117 $1,376 53.0%1996-97 $4,750 $509 $148 $1,814 61.8%1997-98 $4,750 $482 $200 $2,219 53.3%1998-99 $4,750 $705 $260 $2,804 41.0%1999-00 $4,750 $843 $339 $3,490 26.5%2000-01 $10,250 $873 $408 $4,158 59.4%2001-02 $10,250 $777 $493 $4,689 54.3%2002-03 $10,250 $936 $586 $4,808 53.1%2003-04 $10,250 $838 $690 $5,788 43.5%2004-05 $10,250 $602 $708 $5,960 41.9%2005-06 $16,500 $377 $474 $5,555 66.3%2006-07 $16,500 $707 $440 $5,983 63.7%2007-08 $16,500 $762 $489 $6,553 60.3%2008-09 $16,500 $542 $546 $6,896 58.2%2009-10 $16,500 $564 $603 $7,224 56.2%
Total Actual $10,924 $6,5462010-11 $16,500 $559 $894 $7,514 54.5%2011-12 $16,500 $552 $937 $7,521 54.4%2012-13 $16,500 $551 $950 $7,490 54.6%2013-14 $16,500 $551 $968 $7,449 54.9%
Total Projected $13,136 $10,296
Source: Division of the Budget and Office of the State Comptroller
SFY 2002-03 issuance increased by $500 million to reflect March 2003 bond sale, rather than counting it as occurring in SFY 2003-04.
SFYAuthorized (Bond Cap)
Amount Issued (Par)
Service Contract Bonds PIT Bonds
Annual Debt Service
Total Principal Outstanding
Remaining Under Bond
Cap1999-00 $2,500 $371 $371 $0 $167 $2,049 18.0%2000-01 $3,788 $364 $364 $0 $192 $2,334 38.4%2001-02 $3,788 $205 $205 $0 $223 $2,445 35.5%2002-03 $3,788 $251 $0 $251 $246 $2,600 31.4%2003-04 $3,870 $348 $0 $348 $248 $2,738 29.3%2004-05 $4,029 $352 $0 $352 $262 $2,935 27.1%2005-06 $5,710 $236 $0 $236 $282 $3,052 46.5%2006-07 $5,710 $338 $0 $338 $301 $3,255 43.0%2007-08 $5,745 $325 $0 $325 $361 $3,336 41.9%2008-09 $5,806 $368 $0 $368 $404 $3,502 39.7%2009-10 $5,861 $431 $0 $431 $442 $3,681 37.2%
Total Actual $3,591 $941 $2,650 $3,1282010-11 $5,861 $411 $0 $411 $476 $3,837 34.5%2011-12 $5,861 $411 $0 $411 $489 $3,929 33.0%2012-13 $5,861 $411 $0 $411 $512 $4,020 31.4%2013-14 $5,861 $411 $0 $411 $530 $4,105 30.0%
Total Projected $5,236 $941 $4,296 $5,137Source: Division of the Budget and Office of the State Comptroller
THRUWAY CHIPs AND MARCHISELLI BONDS(in millions)
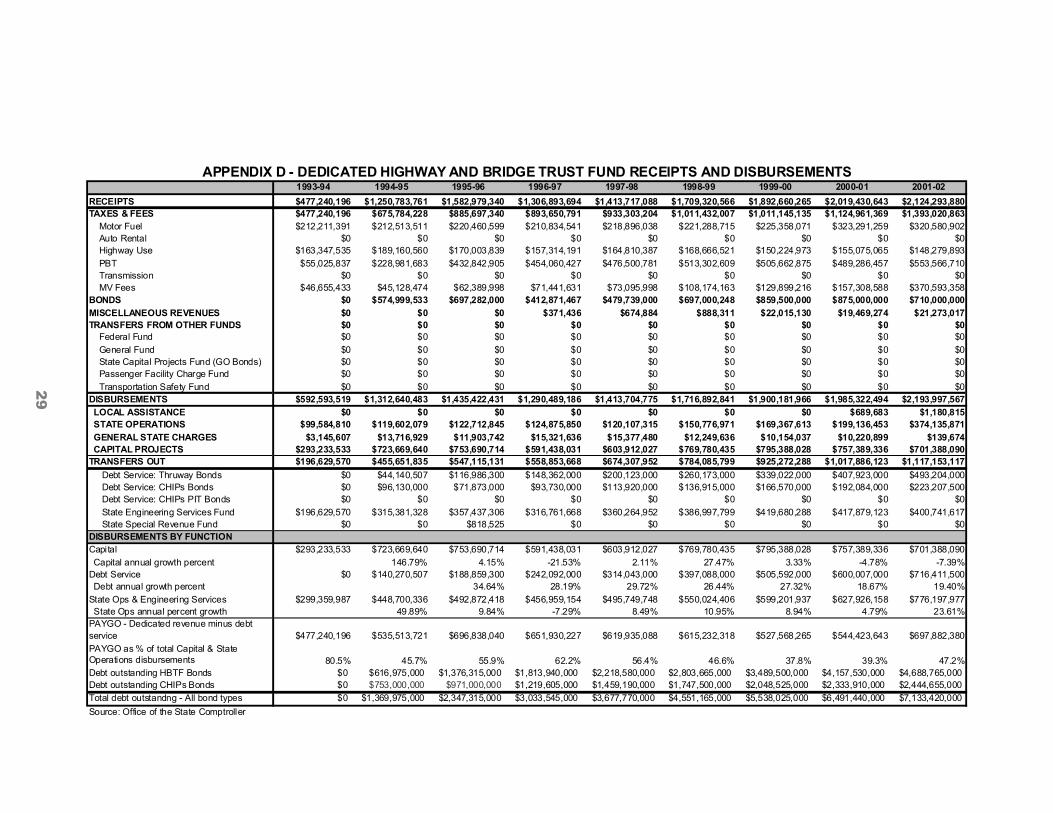
1993-94 1994-95 1995-96 1996-97 1997-98 1998-99 1999-00 2000-01 2001-02RECEIPTS $477,240,196 $1,250,783,761 $1,582,979,340 $1,306,893,694 $1,413,717,088 $1,709,320,566 $1,892,660,265 $2,019,430,643 $2,124,293,880TAXES & FEES $477,240,196 $675,784,228 $885,697,340 $893,650,791 $933,303,204 $1,011,432,007 $1,011,145,135 $1,124,961,369 $1,393,020,863 Motor Fuel $212,211,391 $212,513,511 $220,460,599 $210,834,541 $218,896,038 $221,288,715 $225,358,071 $323,291,259 $320,580,902 Auto Rental $0 $0 $0 $0 $0 $0 $0 $0 $0 Highway Use $163,347,535 $189,160,560 $170,003,839 $157,314,191 $164,810,387 $168,666,521 $150,224,973 $155,075,065 $148,279,893 PBT $55,025,837 $228,981,683 $432,842,905 $454,060,427 $476,500,781 $513,302,609 $505,662,875 $489,286,457 $553,566,710 Transmission $0 $0 $0 $0 $0 $0 $0 $0 $0 MV Fees $46,655,433 $45,128,474 $62,389,998 $71,441,631 $73,095,998 $108,174,163 $129,899,216 $157,308,588 $370,593,358BONDS $0 $574,999,533 $697,282,000 $412,871,467 $479,739,000 $697,000,248 $859,500,000 $875,000,000 $710,000,000MISCELLANEOUS REVENUES $0 $0 $0 $371,436 $674,884 $888,311 $22,015,130 $19,469,274 $21,273,017TRANSFERS FROM OTHER FUNDS $0 $0 $0 $0 $0 $0 $0 $0 $0 Federal Fund $0 $0 $0 $0 $0 $0 $0 $0 $0 General Fund $0 $0 $0 $0 $0 $0 $0 $0 $0 State Capital Projects Fund (GO Bonds) $0 $0 $0 $0 $0 $0 $0 $0 $0 Passenger Facility Charge Fund $0 $0 $0 $0 $0 $0 $0 $0 $0 Transportation Safety Fund $0 $0 $0 $0 $0 $0 $0 $0 $0DISBURSEMENTS $592,593,519 $1,312,640,483 $1,435,422,431 $1,290,489,186 $1,413,704,775 $1,716,892,841 $1,900,181,966 $1,985,322,494 $2,193,997,567 LOCAL ASSISTANCE $0 $0 $0 $0 $0 $0 $0 $689,683 $1,180,815 STATE OPERATIONS $99,584,810 $119,602,079 $122,712,845 $124,875,850 $120,107,315 $150,776,971 $169,367,613 $199,136,453 $374,135,871 GENERAL STATE CHARGES $3,145,607 $13,716,929 $11,903,742 $15,321,636 $15,377,480 $12,249,636 $10,154,037 $10,220,899 $139,674 CAPITAL PROJECTS $293,233,533 $723,669,640 $753,690,714 $591,438,031 $603,912,027 $769,780,435 $795,388,028 $757,389,336 $701,388,090TRANSFERS OUT $196,629,570 $455,651,835 $547,115,131 $558,853,668 $674,307,952 $784,085,799 $925,272,288 $1,017,886,123 $1,117,153,117 Debt Service: Thruway Bonds $0 $44,140,507 $116,986,300 $148,362,000 $200,123,000 $260,173,000 $339,022,000 $407,923,000 $493,204,000 Debt Service: CHIPs Bonds $0 $96,130,000 $71,873,000 $93,730,000 $113,920,000 $136,915,000 $166,570,000 $192,084,000 $223,207,500 Debt Service: CHIPs PIT Bonds $0 $0 $0 $0 $0 $0 $0 $0 $0 State Engineering Services Fund $196,629,570 $315,381,328 $357,437,306 $316,761,668 $360,264,952 $386,997,799 $419,680,288 $417,879,123 $400,741,617 State Special Revenue Fund $0 $0 $818,525 $0 $0 $0 $0 $0 $0DISBURSEMENTS BY FUNCTIONCapital $293,233,533 $723,669,640 $753,690,714 $591,438,031 $603,912,027 $769,780,435 $795,388,028 $757,389,336 $701,388,090 Capital annual growth percent 146.79% 4.15% -21.53% 2.11% 27.47% 3.33% -4.78% -7.39%Debt Service $0 $140,270,507 $188,859,300 $242,092,000 $314,043,000 $397,088,000 $505,592,000 $600,007,000 $716,411,500 Debt annual growth percent 34.64% 28.19% 29.72% 26.44% 27.32% 18.67% 19.40%State Ops & Engineering Services $299,359,987 $448,700,336 $492,872,418 $456,959,154 $495,749,748 $550,024,406 $599,201,937 $627,926,158 $776,197,977 State Ops annual percent growth 49.89% 9.84% -7.29% 8.49% 10.95% 8.94% 4.79% 23.61%PAYGO - Dedicated revenue minus debt service $477,240,196 $535,513,721 $696,838,040 $651,930,227 $619,935,088 $615,232,318 $527,568,265 $544,423,643 $697,882,380PAYGO as % of total Capital & State Operations disbursements 80.5% 45.7% 55.9% 62.2% 56.4% 46.6% 37.8% 39.3% 47.2%Debt outstanding HBTF Bonds $0 $616,975,000 $1,376,315,000 $1,813,940,000 $2,218,580,000 $2,803,665,000 $3,489,500,000 $4,157,530,000 $4,688,765,000Debt outstanding CHIPs Bonds $0 $753,000,000 $971,000,000 $1,219,605,000 $1,459,190,000 $1,747,500,000 $2,048,525,000 $2,333,910,000 $2,444,655,000Total debt outstandng - All bond types $0 $1,369,975,000 $2,347,315,000 $3,033,545,000 $3,677,770,000 $4,551,165,000 $5,538,025,000 $6,491,440,000 $7,133,420,000Source: Office of the State Comptroller
APPENDIX D - DEDICATED HIGHWAY AND BRIDGE TRUST FUND RECEIPTS AND DISBURSEMENTS
29
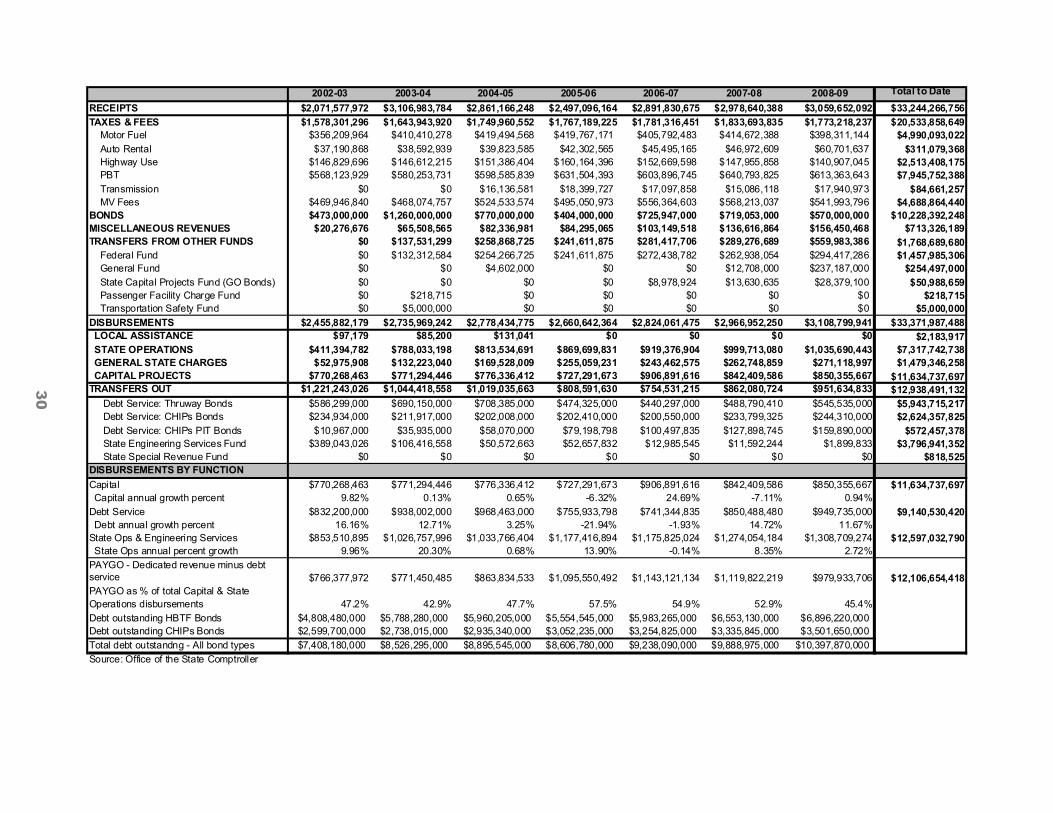
2002-03 2003-04 2004-05 2005-06 2006-07 2007-08 2008-09 Total to DateRECEIPTS $2,071,577,972 $3,106,983,784 $2,861,166,248 $2,497,096,164 $2,891,830,675 $2,978,640,388 $3,059,652,092 $33,244,266,756TAXES & FEES $1,578,301,296 $1,643,943,920 $1,749,960,552 $1,767,189,225 $1,781,316,451 $1,833,693,835 $1,773,218,237 $20,533,858,649 Motor Fuel $356,209,964 $410,410,278 $419,494,568 $419,767,171 $405,792,483 $414,672,388 $398,311,144 $4,990,093,022 Auto Rental $37,190,868 $38,592,939 $39,823,585 $42,302,565 $45,495,165 $46,972,609 $60,701,637 $311,079,368 Highway Use $146,829,696 $146,612,215 $151,386,404 $160,164,396 $152,669,598 $147,955,858 $140,907,045 $2,513,408,175 PBT $568,123,929 $580,253,731 $598,585,839 $631,504,393 $603,896,745 $640,793,825 $613,363,643 $7,945,752,388 Transmission $0 $0 $16,136,581 $18,399,727 $17,097,858 $15,086,118 $17,940,973 $84,661,257 MV Fees $469,946,840 $468,074,757 $524,533,574 $495,050,973 $556,364,603 $568,213,037 $541,993,796 $4,688,864,440BONDS $473,000,000 $1,260,000,000 $770,000,000 $404,000,000 $725,947,000 $719,053,000 $570,000,000 $10,228,392,248MISCELLANEOUS REVENUES $20,276,676 $65,508,565 $82,336,981 $84,295,065 $103,149,518 $136,616,864 $156,450,468 $713,326,189TRANSFERS FROM OTHER FUNDS $0 $137,531,299 $258,868,725 $241,611,875 $281,417,706 $289,276,689 $559,983,386 $1,768,689,680 Federal Fund $0 $132,312,584 $254,266,725 $241,611,875 $272,438,782 $262,938,054 $294,417,286 $1,457,985,306 General Fund $0 $0 $4,602,000 $0 $0 $12,708,000 $237,187,000 $254,497,000 State Capital Projects Fund (GO Bonds) $0 $0 $0 $0 $8,978,924 $13,630,635 $28,379,100 $50,988,659 Passenger Facility Charge Fund $0 $218,715 $0 $0 $0 $0 $0 $218,715 Transportation Safety Fund $0 $5,000,000 $0 $0 $0 $0 $0 $5,000,000DISBURSEMENTS $2,455,882,179 $2,735,969,242 $2,778,434,775 $2,660,642,364 $2,824,061,475 $2,966,952,250 $3,108,799,941 $33,371,987,488 LOCAL ASSISTANCE $97,179 $85,200 $131,041 $0 $0 $0 $0 $2,183,917 STATE OPERATIONS $411,394,782 $788,033,198 $813,534,691 $869,699,831 $919,376,904 $999,713,080 $1,035,690,443 $7,317,742,738 GENERAL STATE CHARGES $52,975,908 $132,223,040 $169,528,009 $255,059,231 $243,462,575 $262,748,859 $271,118,997 $1,479,346,258 CAPITAL PROJECTS $770,268,463 $771,294,446 $776,336,412 $727,291,673 $906,891,616 $842,409,586 $850,355,667 $11,634,737,697TRANSFERS OUT $1,221,243,026 $1,044,418,558 $1,019,035,663 $808,591,630 $754,531,215 $862,080,724 $951,634,833 $12,938,491,132 Debt Service: Thruway Bonds $586,299,000 $690,150,000 $708,385,000 $474,325,000 $440,297,000 $488,790,410 $545,535,000 $5,943,715,217 Debt Service: CHIPs Bonds $234,934,000 $211,917,000 $202,008,000 $202,410,000 $200,550,000 $233,799,325 $244,310,000 $2,624,357,825 Debt Service: CHIPs PIT Bonds $10,967,000 $35,935,000 $58,070,000 $79,198,798 $100,497,835 $127,898,745 $159,890,000 $572,457,378 State Engineering Services Fund $389,043,026 $106,416,558 $50,572,663 $52,657,832 $12,985,545 $11,592,244 $1,899,833 $3,796,941,352 State Special Revenue Fund $0 $0 $0 $0 $0 $0 $0 $818,525DISBURSEMENTS BY FUNCTIONCapital $770,268,463 $771,294,446 $776,336,412 $727,291,673 $906,891,616 $842,409,586 $850,355,667 $11,634,737,697 Capital annual growth percent 9.82% 0.13% 0.65% -6.32% 24.69% -7.11% 0.94%Debt Service $832,200,000 $938,002,000 $968,463,000 $755,933,798 $741,344,835 $850,488,480 $949,735,000 $9,140,530,420 Debt annual growth percent 16.16% 12.71% 3.25% -21.94% -1.93% 14.72% 11.67%State Ops & Engineering Services $853,510,895 $1,026,757,996 $1,033,766,404 $1,177,416,894 $1,175,825,024 $1,274,054,184 $1,308,709,274 $12,597,032,790 State Ops annual percent growth 9.96% 20.30% 0.68% 13.90% -0.14% 8.35% 2.72%PAYGO - Dedicated revenue minus debt service $766,377,972 $771,450,485 $863,834,533 $1,095,550,492 $1,143,121,134 $1,119,822,219 $979,933,706 $12,106,654,418PAYGO as % of total Capital & State Operations disbursements 47.2% 42.9% 47.7% 57.5% 54.9% 52.9% 45.4%Debt outstanding HBTF Bonds $4,808,480,000 $5,788,280,000 $5,960,205,000 $5,554,545,000 $5,983,265,000 $6,553,130,000 $6,896,220,000Debt outstanding CHIPs Bonds $2,599,700,000 $2,738,015,000 $2,935,340,000 $3,052,235,000 $3,254,825,000 $3,335,845,000 $3,501,650,000Total debt outstandng - All bond types $7,408,180,000 $8,526,295,000 $8,895,545,000 $8,606,780,000 $9,238,090,000 $9,888,975,000 $10,397,870,000Source: Office of the State Comptroller
30
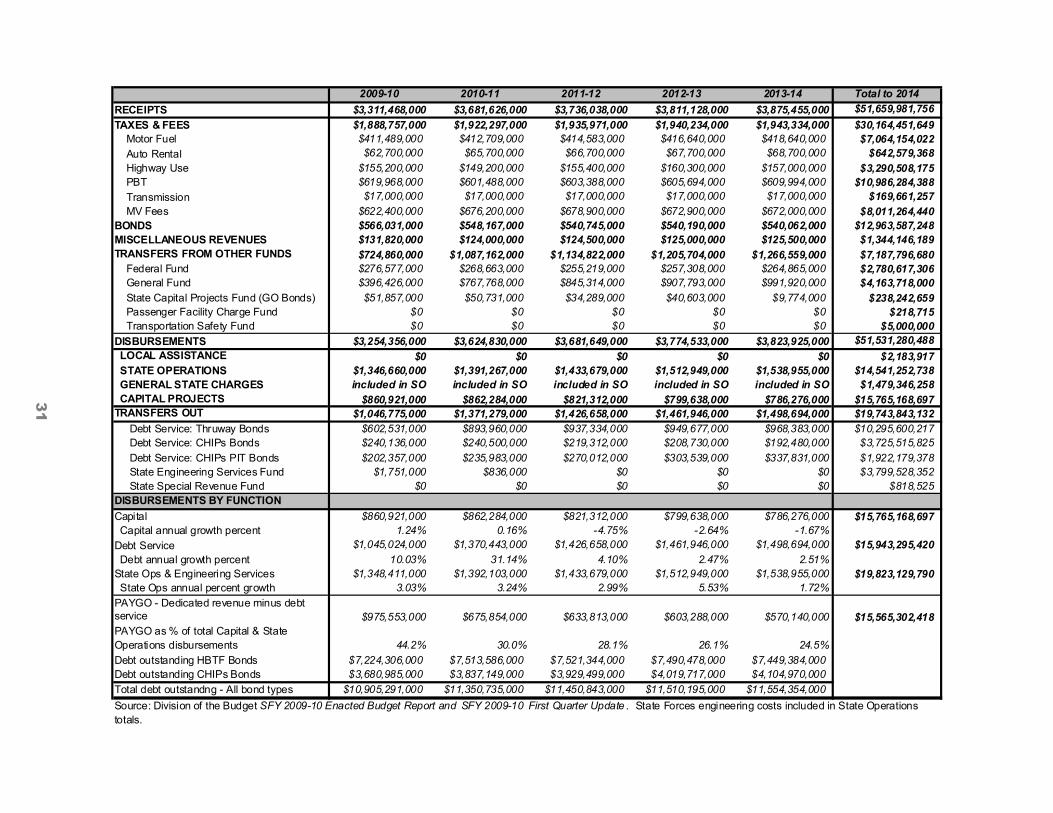
2009-10 2010-11 2011-12 2012-13 2013-14 Total to 2014RECEIPTS $3,311,468,000 $3,681,626,000 $3,736,038,000 $3,811,128,000 $3,875,455,000 $51,659,981,756TAXES & FEES $1,888,757,000 $1,922,297,000 $1,935,971,000 $1,940,234,000 $1,943,334,000 $30,164,451,649 Motor Fuel $411,489,000 $412,709,000 $414,583,000 $416,640,000 $418,640,000 $7,064,154,022 Auto Rental $62,700,000 $65,700,000 $66,700,000 $67,700,000 $68,700,000 $642,579,368 Highway Use $155,200,000 $149,200,000 $155,400,000 $160,300,000 $157,000,000 $3,290,508,175 PBT $619,968,000 $601,488,000 $603,388,000 $605,694,000 $609,994,000 $10,986,284,388 Transmission $17,000,000 $17,000,000 $17,000,000 $17,000,000 $17,000,000 $169,661,257 MV Fees $622,400,000 $676,200,000 $678,900,000 $672,900,000 $672,000,000 $8,011,264,440BONDS $566,031,000 $548,167,000 $540,745,000 $540,190,000 $540,062,000 $12,963,587,248MISCELLANEOUS REVENUES $131,820,000 $124,000,000 $124,500,000 $125,000,000 $125,500,000 $1,344,146,189TRANSFERS FROM OTHER FUNDS $724,860,000 $1,087,162,000 $1,134,822,000 $1,205,704,000 $1,266,559,000 $7,187,796,680 Federal Fund $276,577,000 $268,663,000 $255,219,000 $257,308,000 $264,865,000 $2,780,617,306 General Fund $396,426,000 $767,768,000 $845,314,000 $907,793,000 $991,920,000 $4,163,718,000 State Capital Projects Fund (GO Bonds) $51,857,000 $50,731,000 $34,289,000 $40,603,000 $9,774,000 $238,242,659 Passenger Facility Charge Fund $0 $0 $0 $0 $0 $218,715 Transportation Safety Fund $0 $0 $0 $0 $0 $5,000,000DISBURSEMENTS $3,254,356,000 $3,624,830,000 $3,681,649,000 $3,774,533,000 $3,823,925,000 $51,531,280,488 LOCAL ASSISTANCE $0 $0 $0 $0 $0 $2,183,917 STATE OPERATIONS $1,346,660,000 $1,391,267,000 $1,433,679,000 $1,512,949,000 $1,538,955,000 $14,541,252,738 GENERAL STATE CHARGES included in SO included in SO included in SO included in SO included in SO $1,479,346,258 CAPITAL PROJECTS $860,921,000 $862,284,000 $821,312,000 $799,638,000 $786,276,000 $15,765,168,697TRANSFERS OUT $1,046,775,000 $1,371,279,000 $1,426,658,000 $1,461,946,000 $1,498,694,000 $19,743,843,132 Debt Service: Thruway Bonds $602,531,000 $893,960,000 $937,334,000 $949,677,000 $968,383,000 $10,295,600,217 Debt Service: CHIPs Bonds $240,136,000 $240,500,000 $219,312,000 $208,730,000 $192,480,000 $3,725,515,825 Debt Service: CHIPs PIT Bonds $202,357,000 $235,983,000 $270,012,000 $303,539,000 $337,831,000 $1,922,179,378 State Engineering Services Fund $1,751,000 $836,000 $0 $0 $0 $3,799,528,352 State Special Revenue Fund $0 $0 $0 $0 $0 $818,525DISBURSEMENTS BY FUNCTIONCapital $860,921,000 $862,284,000 $821,312,000 $799,638,000 $786,276,000 $15,765,168,697 Capital annual growth percent 1.24% 0.16% -4.75% -2.64% -1.67%Debt Service $1,045,024,000 $1,370,443,000 $1,426,658,000 $1,461,946,000 $1,498,694,000 $15,943,295,420 Debt annual growth percent 10.03% 31.14% 4.10% 2.47% 2.51%State Ops & Engineering Services $1,348,411,000 $1,392,103,000 $1,433,679,000 $1,512,949,000 $1,538,955,000 $19,823,129,790 State Ops annual percent growth 3.03% 3.24% 2.99% 5.53% 1.72%PAYGO - Dedicated revenue minus debt service $975,553,000 $675,854,000 $633,813,000 $603,288,000 $570,140,000 $15,565,302,418PAYGO as % of total Capital & State Operations disbursements 44.2% 30.0% 28.1% 26.1% 24.5%Debt outstanding HBTF Bonds $7,224,306,000 $7,513,586,000 $7,521,344,000 $7,490,478,000 $7,449,384,000Debt outstanding CHIPs Bonds $3,680,985,000 $3,837,149,000 $3,929,499,000 $4,019,717,000 $4,104,970,000Total debt outstandng - All bond types $10,905,291,000 $11,350,735,000 $11,450,843,000 $11,510,195,000 $11,554,354,000Source: Division of the Budget SFY 2009-10 Enacted Budget Report and SFY 2009-10 First Quarter Update . State Forces engineering costs included in State Operations totals.
31

Major contributors to this report include: Mary Louise Mallick First Deputy Comptroller Office of Budget and Policy Analysis Andrea Miller Assistant Comptroller Patricia Warrington Assistant Comptroller Steven Jongeling Director, Budget Studies and Debt Policy Steven Elliott Assistant Director, Economic Analysis John Clarkson Policy Research Analyst Jody Dixon Policy Research Analyst Christine Blackman Research Assistant Special thanks to the Bureau of State Accounting Operations, Division of Local Government and School Accountability and the Office of the State Deputy Comptroller.