Embed Size (px)
Citation preview
197
Paper No. 742
A COMPARATIVE STUDY ON HIGHWAY BRIDGE BARRIERS
REINFORCED WITH STEEL AND GFRP BARS
Rao Arsalan Khushnood, Giuseppe Andrea Ferro, Sajjad Ahmad, Fawad Ahmed Najam

198 Rao Arsalan Khushnood, Giuseppe Andrea Ferro, Sajjad Ahmad, Fawad Ahmed Najam
72nd
Annual Session of Pakistan Engineering Congress 199
A COMPARATIVE STUDY ON HIGHWAY BRIDGE BARRIERS REINFORCED WITH STEEL AND GFRP BARS
By
Rao Arsalan Khushnood1, Giuseppe Andrea Ferro2, Sajjad Ahmad3, Fawad Ahmed Najam4
ABSTRACT
The expansion of highway systems increased the need to provide corrosion-free reinforced concrete components for highway bridges. One of the main safety features in Highway Bridges is barrier wall which is typically reinforced with steel bars. Researchers such as Nanni, Benmokrane et al., and Cosenza et al. have established glass fiber reinforced polymer (GFRP) bars as an alternative of steel bars to be used where corrosion and other durability issues are of main concern.
This paper describes a detailed comparative review on bridge barrier walls and their connections reinforced with steel and GFRP bars. In this paper, code provisions, reinforcement detailing and to date research information concerning reinforced bridge barriers and their connections have been discussed. Some future research areas have also been highlighted such as repairing process of bridge barriers reinforced with GFRP bars in case of damage situation, predicting mode of failure and developing ultimate capacity equations of GFRP reinforced barrier wall.
Key words: Bridge Barrier, Steel Reinforced, GFRP Reinforced, Fiber Reinforced
1. INTRODUCTION
The purpose of a concrete bridge barrier is to redirect vehicle in a controlled manner in the event of a collision. The vehicle shall not over turn or rebound across traffic lanes. The barrier shall have sufficient strength to survive the initial impact of the collision and to remain effective in redirecting the vehicle (Ahmed et al. 2011). This concrete bridge barrier is typically being reinforced with steel bars for over the years. Different codes such as Canadian Highway Bridge Design Code (CHBDC) CAN/CSA-S6-06 and AASHTO (American Association of State Highway and Transportation Officials) Guide Specifications for Bridge Railings deal with different aspects of this steel reinforced concrete bridge barrier. These aspects include functions, types, ultimate capacity and test requirements of barrier.
Now-a-days concrete bridge barrier is being widely reinforced with internal glass fiber-reinforced polymer (GFRP) bars. Using GFRP bars instead of conventional steel bars results in some obvious advantages such as higher tensile strength of GFRP bars, lower unit weight and
Corresponding Author ([email protected]) 1 Rao Arsalan Khushnood, PhD, Department of Structural Geotechnical and Building Engineering (DISEG),
Politecnico di Torino, Italy 2 Prof. Dr. Giuseppe Andrea Ferro, PhD, Department of Structural Geotechnical and Building Engineering
(DISEG), Politecnico di Torino, Italy 3 Sajjad Ahmad, PhD, Department of Structural Geotechnical and Building Engineering (DISEG), Politecnico di
Torino, Italy 4 Fawad Ahmed Najam, PhD, School of Engineering and Technology, Asian Institute of Technology (AIT)
Bangkok, Thailand.

200 Rao Arsalan Khushnood, Giuseppe Andrea Ferro, Sajjad Ahmad, Fawad Ahmed Najam
corrosion-free in nature (Alves et al. 2011). Different aspects of GFRP reinforced bridge barrier such as ultimate capacity, crash test requirements, static test, mode of failure and cracking pattern etc have been investigated by researchers and results of those research made GFRP reinforced bridge barrier a practical alternative of conventional steel reinforced concrete bridge barrier. Design of barriers with internal GFRP reinforcement is now well established and incorporated in current CAN/CSA-S6-06 code provisions.
This paper is aimed to delineate all the aspects associated with steel and GFRP reinforced concrete bridge barrier as well as make comparisons between them based on previous research.
2. RESEARCH SIGNIFICANCE
Fiber reinforced polymer (FRP) is becoming more popular these days because of its corrosion free nature, light weight and compatible price with steel bars. Construction people are now using FRP instead of steel in reinforced concrete structures as a practical alternative of steel. Highway bridge barrier is one of such structures. Researchers have shown that GFRP can be used successfully in bridge barrier instead of steel (El-Salakawy et al. 2004). This paper will highlight to date code and research information on GFRP reinforced barrier and comprehensive comparisons between steel and GFRP reinforced barrier based on previous research.
3. FIBER REINFORCED POLYMER (FRP) COMPOSITES
FRP bars are made by combination of different fibers and matrixes. Minimum volume of fiber in FRP should be 10%. Two different types of FRP such as GFRP (glass fiber reinforced polymer) and CFRP (carbon fiber reinforced polymer) are being widely used for civil infrastructures. Stress-strain behavior of FRP composites is different from its constituent fibers and matrix (Hassan et al. 2004). Stress-strain curve of FRP composite is shown below in Figure 1.
Fig 1 Stress Strain Curve of FRP Composites

72nd
Annual Session of Pakistan Engineering Congress 201
3.1. Physical Properties of FRP
Typical physical properties of FRP bars are discussed in the following portion.
Density
Density of GFRP bars are ranging from 77.8-131.3 lb/ft3, which is four to six times lower than that of steel. Typical densities of different FRP bars are given below in Table 1.
Table-1: Densities of steel and FRP bars (CAN/CSA-S6-06)
Steel (lb/ft3) GFRP (lb/ft3) CFRP (lb/ft3) AFRP (lb/ft3)
492.5 77.8-131.3 93.3-100.2 77.8-88.1
Co-efficient of Thermal Expansion
Typical co-efficient of thermal expansions (CTE) of different FRP bars are shown in Table-2.
Table-2: CTE of FRP bars (CAN/CSA-S6-06)
CTE ( C06 /10 )
Direction Steel GFRP CFRP AFRP
Longitudinal 11.7 6 to 10 -1 to 0 -6 to -2
Transverse 11.7 30 to 38 30 to 38 60 to 80
Differences in CTE in longitudinal and transverse direction of FRP bars can be attributed to the absence of any FRP bars in transverse direction.
Effect of Elevated Temperature
The temperature at which polymer loses its glass rigidity and softens is called glass transition temperature. Typically this temperature ranges between 110-175OC. Time required for a fire to create this temperature at the FRP reinforcement level is called fire rating. Adequate concrete cover is required to protect FRP from such condition. The CSA provides design charts and these design charts are used to determine the thickness of concrete cover to FRP reinforcement that is necessary to satisfy a particular fire rating.
Tensile Properties
FRP bar has linearly elastic stress strain curve until failure and has no yield point like steel bar. Fiber volume fraction, rate of curing, manufacturing process and manufacturing quality control influence the tensile properties of FRP bars. Typical tensile

202 Rao Arsalan Khushnood, Giuseppe Andrea Ferro, Sajjad Ahmad, Fawad Ahmed Najam
properties of different FRP bars are given below in Table-3 and stress-strain curve of steel and different FRP bars is shown below in the Figure-2
Table-3: Tensile properties of steel and FRP bars (CAN/CSA-S6-06)
Steel GFRP CFRP AFRP
Yield strength
(MPa) 276-414
Ultimate strength (MPa)
483-690 483-1035 600-2900 1000-1400
Elastic Modulus (GPa)
200 35-45 120-300 60-87
Rupture Strain (%) >10 1.2-2.7 0.5-1.7 1.4-1.9
steel
600 HFRP NEFMAC grid
770 GFRP C-bar
1300
AFRP NEFMAC grid
1400
CFRP NEFMAC grid
CFRP Isorod bar
1500
2550
CFRP leadline tendon
Strain
Ten
sile
str
en
gth
[M
Pa]
0 0.005 0.01 0.015 0.02 0.025 0.030
500
1000
1500
2000
2500
3000
Figure-2: Stress-strain curve of steel and different FRP bars (Quayyum, 2010)
Creep Rupture
If FRP bars are subjected to a constant load for a long time, then it can suddenly fail. This phenomenon is called creep rupture. GFRP bar is vulnerable to this creep rupture. CFRP is the least vulnerable to creep rupture. To avoid this incidence FRP bars stress

72nd
Annual Session of Pakistan Engineering Congress 203
at service stage is being limited to specific value. These values are given below in Table-4.
Table-4: Creep rupture stress limit of different FRP bars (CAN/CSA-S6-06)
FRP Type GFRP CFRP AFRP
Creep rupture stress limit
0.20 fuf 0.55 fuf 0.30 fuf
4. Bridge Barrier Reinforced with Steel
4.1. General
Traffic barriers are to be provided on both sides of highway bridges to delineate the superstructure edge and thus reducing the consequences of vehicles leaving the roadway upon the occurrence of an accident (CAN/CSA-S6-06). Crash tests are used to determine barrier adequacy in reducing the consequences of vehicles leaving the roadway. The adequacy of a traffic barrier in reducing the consequences of a vehicle leaving the roadway is based on the level of protection provided to the occupants of the vehicle, to other vehicles on the roadway and to people and property beneath the bridge. This protection is provided by various ways: by retaining the vehicle and its cargo on the bridge, by smoothly redirecting the vehicle away from the barrier, and by limiting the rebound of the vehicle back into traffic.
4.2. Performance Level
The requirement for traffic barrier is dependent on the site as well as on the expected frequency and consequences of vehicle accidents at that site. This procedure assumes that the frequencies and consequences of vehicle accidents at bridge sites are a function of the percentage of trucks, design speed, highway type, curvatures, grades, and superstructure height. The ranking system used in CHBDC to determine the bridge site condition is categorized into three levels:
4.2.1. Performance Level 1 (PL-1): The performance level for traffic barriers on bridges where the expected frequency and consequences of vehicles leaving the roadway are similar to that expected on low traffic volume roads.
4.2.2. Performance Level 2 (PL-2): The performance level for traffic barriers on bridges where the expected frequency and consequences of vehicles leaving the roadway are similar to that expected on high to moderate traffic volume highways.
4.2.3. Performance Level 3 (PL-3): The performance level for traffic barriers on bridges where the expected frequency and consequences of vehicles leaving the roadway are similar to that expected on high traffic volume highways with high percentage of trucks.
4.3. Crash Test Requirements
In Section 12.5.2.3 of the CHBDC, it is specified that, with the defined performance level, the crash test requirements should be in accordance with the crash test requirements of AASHTO Guide Specifications for Bridge Railing. Those crash test requirements shall be satisfied along the entire length of a traffic barrier, including at any changes in barrier type, shape, alignment, or strength that may affect the barrier performance. Alternative performance levels shall meet the crash test requirements of the optimum performance level or of a more severe performance level as considered. The specifics of the crash

204 Rao Arsalan Khushnood, Giuseppe Andrea Ferro, Sajjad Ahmad, Fawad Ahmed Najam
test are outlined in the National Cooperative Highway Research Program (NCHRP) Report 350: Recommended Procedures for the Safety Performance evaluation of Highway Features. The crash test requirements for barrier Test Levels 2, 4, and 5 of NCHRP Report 350 shall be taken as meeting the crash test requirements for Performance Level 1, 2, and 3, respectively. According to Section 12.5.2.3.4 in CHBDC, any changes in details affecting the geometry, strength, or behaviour of the traffic barrier or traffic barrier transition that meets the aforementioned requirements can be demonstrated to not adversely affect barrier-vehicle interaction.
4.4. Anchorages and Load Capacity
The performance of the traffic barrier anchorage during crash testing is the basis for its capability. The anchorage is considered to be acceptable if no significant damage occurs in the anchorage or deck during crash testing. If crash test results for the anchorages are not available, the anchorage and deck shall be designed to resist the maximum bending, shear and punching loads that can be transmitted to them by the traffic barrier (Ahmed et al 2011). The loads should be applied as in Figure 3.
Fig 3 Application of design loads to traffic barriers (CAN/CSA-S6-06)
However, the loads have to be greater than those resulting from the loads defined in Section-3.8.8 of the CHBDC (Barrier Loads). The transverse, longitudinal, and vertical loads should be applied simultaneously and are specified as shown in Table-5. According to AASHTO LRFD Bridge Design Specifications, design forces for traffic railings, from Table A13.2-1, are given in Table-6.
Table-5: Traffic barrier loads (Figure 3.8.8.1, CAN/CSA-S6-06)
Direction
PL-1 PL-2 PL-3
Force (kN)
Length (mm)
Height (mm)
Force (kN)
Length (mm)
Height (mm)
Force (kN)
Length (mm)
Height (mm)
Transverse 50 1200
600
100 1050
700
210 2400
900 Longitudinal 20 1200 30 1050 70 2400
Vertical 10 5500 30 5500 90 12000

72nd
Annual Session of Pakistan Engineering Congress 205
Table-6: Traffic barrier loads (AASHTO)
Direction
PL-1 PL-2 PL-3
Force (kN)
Length (mm)
Height (mm)
Force (kN)
Length (mm)
Height (mm)
Force (kN)
Length (mm)
Height (mm)
Transverse 120 1220
508
240 1070
813
516 2440
1016 Longitudinal 40 1220 80 1070 173 2440
Vertical 20 5500 80 5500 222 12200
4.5. Mode of Failure and Ultimate Capacity (Yield Line Theory)
The capacity of the concrete bridge barrier is estimated based on the formation of yield lines at limit state. The yield-line method is a procedure where the slab is assumed to behave inelastically and exhibits adequate ductility to sustain the applied load until the slab reaches a plastic collapse mechanism. This assumption is realistic because the reinforcement proportionality required by AASHTO results in an under-reinforced ductile system. The slab is assumed to collapse at a certain ultimate load through a system of plastic hinges called yield line.
The yield lines form a pattern in the slab creating the mechanism. The ultimate load can be determined by using the equilibrium approach or the energy approach. The energy approach is an upper-bound approach, which means that the ultimate load established with the method is either equal to or greater than the actual. The fundamentals and the primary assumptions of the yield line theory are as follows (Ghali and Neville, 1989):
In the mechanism, the bending moment per unit length along all yield lines is
constant and equal to the moment capacity of the section.
The slab parts (area between yield lines) rotate as rigid bodies along the
supported edges.
The elastic deformations are considered small relative to the deformation
occurring in the yield lines.
The yield lines on the sides of two adjacent slab parts pass through the point of
intersection of their axes of rotation.
The lateral load carrying capacity of a uniform thickness solid concrete barrier was analyzed by Hirsh (1978). The expressions developed for the strength of the barrier are based on the formation of yield lines at the limit state. The assumed yield line pattern caused by a truck collision that produces a force, Ft, which is distributed over a length Lt, is shown below in Figure 4.

206 Rao Arsalan Khushnood, Giuseppe Andrea Ferro, Sajjad Ahmad, Fawad Ahmed Najam
Fig 4 Application of design loads to traffic barriers (CAN/CSA-S6-06)
The resisting moment along the yield lines is a resultant of the moment resistance about the vertical axis from the longitudinal reinforcement (Mw) and the moment resistance about the horizontal axis from the transverse reinforcement (Mc) as shown in Figure 5.
Mb
Mw
McMc
Mw
Mb
Lc
Fig 5 Moment resistance about vertical and horizontal axis
With some algebraic manipulation based on the principle of virtual work, the critical wall length over which the yield line mechanism occurs, Lc, can be taken as:
c
wbttc
M
MMHLLL
)(8
22
2

72nd
Annual Session of Pakistan Engineering Congress 207
within a wall segment. The nominal railing resistance to transverse load, Rw within a wall segment, can be calculated as:
H
LMMM
LLR cc
wb
tc
w
2
882
2
For end of wall or at joint, the critical wall length is:
c
wbtt
cM
MMHLLL
)(
22
2
H
LMMM
LLR cc
wb
tc
w
2
2
2
With:
Ft = transverse force specified by code
H = height of wall
Lc = critical length of yield line failure pattern
Lt = longitudinal length of distribution of impact force Ft
Mb = additional flexural resistance of beam in addition to Mw, if any, at top of wall
Mc = flexural resistance of cantilevered walls about an axis parallel to the longitudinal axis of the bridge
Mw = flexural resistance of the wall about its vertical axis
Rw = total transverse resistance of the railing
4.6. Barrier Test
To determine mode of failure and ultimate capacity of barrier there are several tests available. They are Crash test, Impact Pendulum test and Static load test. Subsequent portions will discuss code requirements of crash test and give some examples of these three test methods on barrier.
4.6.1. Test Levels and Crash Test Requirements in AASHTO
There are six test levels described in AASHTO. They are as follows:
Test Level 1 (TL-1)
Low posted speeds and low volume of traffic
Mainly in local roads
Test Level 2 (TL-2)
Small number of heavy vehicles is expected and posted speeds are reduced
Local and collector roads

208 Rao Arsalan Khushnood, Giuseppe Andrea Ferro, Sajjad Ahmad, Fawad Ahmed Najam
Test Level 3 (TL-3)
Low mixtures of heavy vehicles
Wide range of high speed arterial highways
Test Level 4 (TL-4)
Mixture of trucks and heavy vehicles
High speed highways, freeways, expressways and interstate highways
Test Level 5 (TL-5)
Large trucks make up a significant portion of daily traffic
High speed highways, freeways, expressways and interstate highways
Test Level 6 (TL-6)
Tanker type trucks or similar high center of gravity vehicles are anticipated.
The testing criteria for the chosen test level shall correspond to vehicle weights and speeds and angles of impact outlined in the Table 7.
Table-7: Crash test criteria according to AASHTO
Vehicle Characteristics
Small Automobiles
Pickup Truck
Single-Unit Van Truck
Van-Type Tractor-Trailer
Tractor-Tanker Trailer
W (N) 7000 8000 20000 80000 220000 355000 355000
B (mm) 1700 1700 2000 230 2450 2450 2450
G (mm) 550 550 700 1250 1630 1850 2050
Crash angle,
020
020 025
015 015
015 015
Test Level Test Speeds (km/hr.)
TL-1 50 50 50 N/A N/A N/A N/A
TL-2 70 70 70 N/A N/A N/A N/A
TL-3 100 100 100 N/A N/A N/A N/A
TL-4 100 100 100 80 N/A N/A N/A
TL-5 100 100 100 N/A N/A 80 N/A
TL-6 100 100 100 N/A N/A N/A 80

72nd
Annual Session of Pakistan Engineering Congress 209
4.6.2. Barrier Test in USA
A series of three crash tests complying with National Co-operative and Highway Research Program (NCHRP) Report 350, Test Level 4, were performed at the Texas A&M University sponsored by Texas Transportation Institute (TTI) followed by a series of static testing. (2004)
The Center for Transportation Research (CTR) at the University of Texas at Austin, sponsored by Texas Transportation Institute (TTI), performed the pendulum test and equivalent static tests for the T203 and T501 barriers with mechanical anchors. (2006)
4.6.2.1. TTI (test level 4-12, 4-11) test
Crash Test
In test level 4-12 single-unit van-truck, traveling at 50.6 mi/h (81.4 km/h),
impacted the Florida bridge rail 5.6 ft (1.7 m) upstream of the first joint at an
impact angle of 14.3 degrees.
In test level 4-11 the 4544-lb (2063 kg) pickup truck, traveling at a speed of 61.1
mi/h (98.3 km/h), impacted the Florida Jersey safety shaped bridge rail 4.1 ft
(1.25 m) upstream of the joint at an impact angle of 26.4 degrees.
Static Load Test
The static load tests were performed with a hydraulic ram attached to a braced
load frame, pushing on a load cell, and placed against a spreader beam,
W12×50 (W310×74), 42 inches (1067 mm) long.
4.6.2.2. Pendulum Impact Test and Equivalent Static Test by (CTR at UTA)
Investigators for this project developed an impact pendulum test setup to
represent a surrogate vehicle for Test Level 3 of NCHRP Report 350.
Tests were conducted on stand-alone cast-in-place and retrofit T203 and T501
barrier specimens.
A quasi-static test was also conducted.
Finite element models of the cast-in-place and retrofit T203 and T501 barrier
specimens were developed using LS-DYNA, and they were validated using the
pendulum impact tests. Using those models, vehicular crash simulations were
conducted to NCHRP Report 350 Test Level-3 and Test Level-4 standards to
predict the performance and robustness of the retrofit T203 and T501 barrier
designs when subjected to large impact forces.
210 Rao Arsalan Khushnood, Giuseppe Andrea Ferro, Sajjad Ahmad, Fawad Ahmed Najam
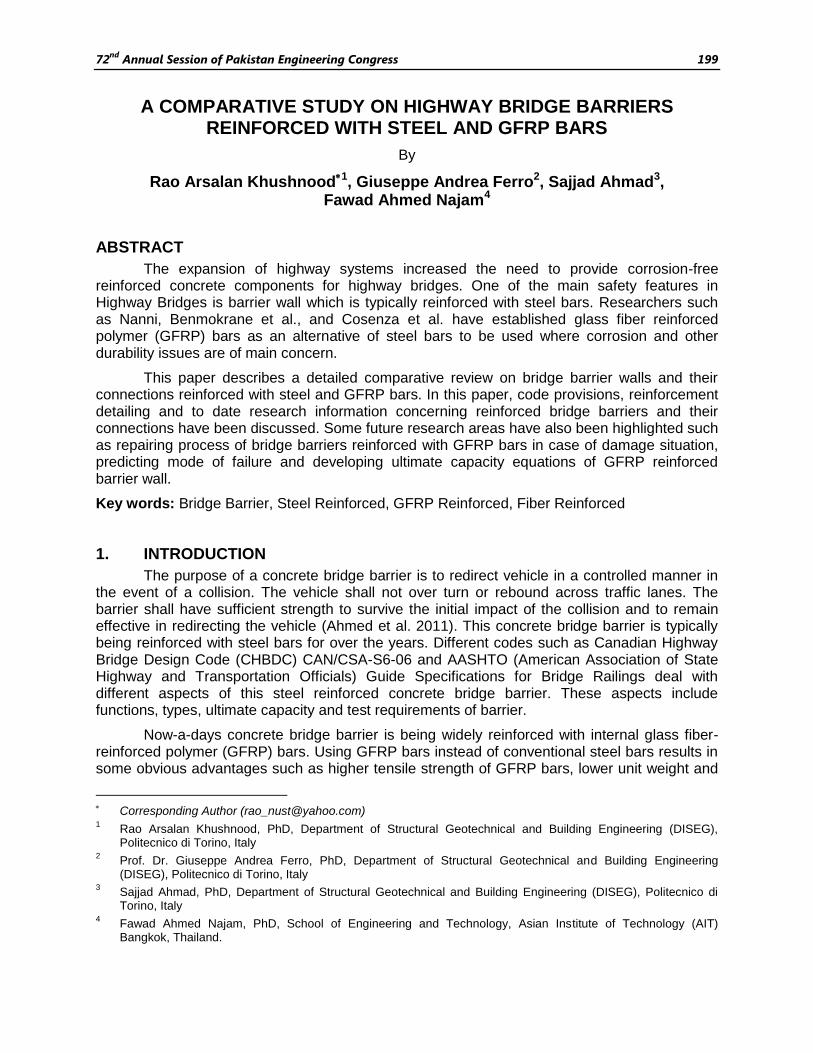
4.6.2.3. Barrier Test Results and Discussion
Results of barrier tests mentioned above are tabulated in Table-8 and Table-9
Table-8: TTI test results
TTI test Level 4 results
Location of test Yield line capacity (kN) Static test capacity (kN)
Middle 276 325
Left end 185
201
Right end 156
Table-9: CTR test results
CTR test result
Barrier type Dynamic capacity (kN) Static test capacity (kN)
T203 271 267
T501 287 258
It can be concluded from the test results that the static analysis using yield line theory provides good estimates of failure loads. Dynamic crash testing may not be necessary in the future for certifying the actual barrier capacities. In addition, dynamic effects such as strain rates do not play a role in the relatively slow loading of the barrier. A concrete barrier does not require large displacements to achieve its maximum capacity; therefore inertia effects are not critical. Therefore, static testing is considered an accurate and reproducible way of assessing barrier behaviour and ultimate capacity (Alberson et al. 2004).
5. Bridge barrier reinforced with GFRP
5.1. General
Usage of GFRP bars in concrete bridge barrier as internal reinforcement were investigated by El-Salakawy et al. (2004), Ahmed et al. (2011), Soliman et al.(2011) and Alves et al. (2011). In these researches both bridge barrier and its connection were reinforced with GFRP bars. Findings of these researchers validated the use of GFRP bars as practical alternative of steel reinforcement in concrete bridge barrier. The findings of El-Salakawy et al. (2004) were incorporated in CAN/CSA-S6-06. Now code provides GFRP reinforcement detailing of concrete bridge barrier and its connection with bridge overhang. This section will discuss about that pioneer research and various code provisions for GFRP reinforced concrete bridge barrier.

72nd
Annual Session of Pakistan Engineering Congress 211
5.2. Review of Research
In the research done by El-Salakawy et al. (2004) both PL-2 and PL-3 bridge barrier
were investigated using both GFRP bars and steel bars. A total of eight full-scale 10-m-
long barrier prototypes were constructed and tested. Among them four were PL-2 and
other four were PL-3 prototypes. For each type of barrier, two prototypes were reinforced
with GFRP sand-coated bars and the other two were reinforced with steel bars. To
estimate the ultimate capacity of these barriers pendulum impact test was done instead
of vehicle crash test. Various aspect of this research such as reinforcement detailing of
the prototypes, test setup and instrumentation, pendulum impact test will be discussed
here.
5.2.1. Reinforcement Detailing
Reinforcement detailing of both PL-2 and PL-3 barrier with GFRP and steel bars used in
that research are given figure 6 and figure 7 below.
1500
25
0
35
88
0
18
01
45
55
5
410
22560
12575
CL
EA
R
M15 (No. 16)
M15 (No. 16) @ 200
SHAPE D1
R255
M15 (No. 16) @ 200SHAPE P1
M15 (No. 16) @ 200 SHAPE D2
Fig 6 Reinforcement detailing of PL-2 barrier (El-Salakawy et al. 2004)
Strength equivalence was used to replace steel bars with GFRP bars in these
prototypes. The height and the breadth of the base of the barrier wall were 880 and 410 mm for
PL-2 and 1140 and 435 mm for PL-3, respectively, as shown in Fig. 6 & 7. In these barriers four
different shapes of GFRP bars were used. For vertical reinforcement three shapes D1, D2, P1
were used and fourth shape H1 was used as horizontal bar. For both types of barriers, the
horizontal spacing between bars D1, D2, and P1 was 200 mm and the vertical spacing between

212 Rao Arsalan Khushnood, Giuseppe Andrea Ferro, Sajjad Ahmad, Fawad Ahmed Najam
bars H1 was 181 and 141 mm for PL-2 and PL-3 barriers, respectively. Thickness of the slab
was 250 mm and it was reinforced with two steel layers. 15M steel bars at 100 mm and 200 mm
spacing was provided in short direction and long direction respectively.
1500
25
0
81
51
80
14
5
11
40
435
225
85
125
75
CL
EA
R3
5
75 CLEAR
CHANFER 15x15 (TYPE)
M20 (No. 19) @ 200 SHAPE P1
M15 (No. 16)
M15 (No. 16) @ 200
SHAPE D1
R255
M20 (No. 19) @ 200 SHAPE D2
Fig 7 Reinforcement detailing of PL-3 barrier (El-Salakawy et al. 2004)
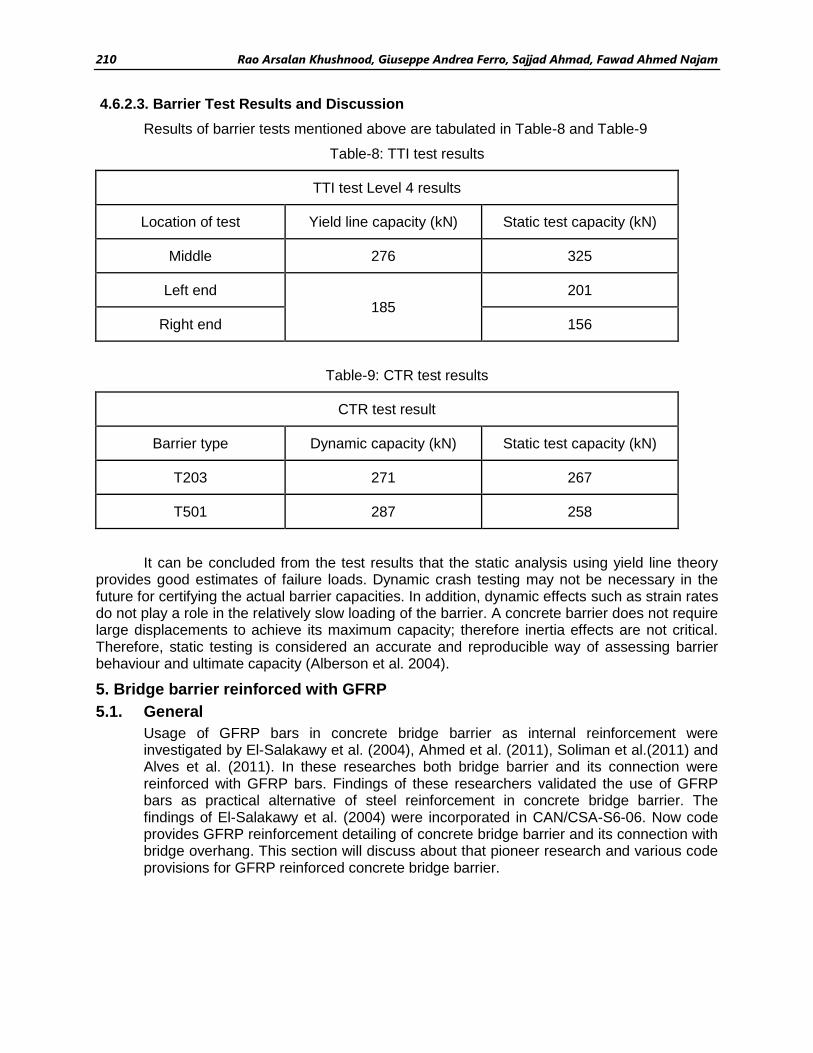
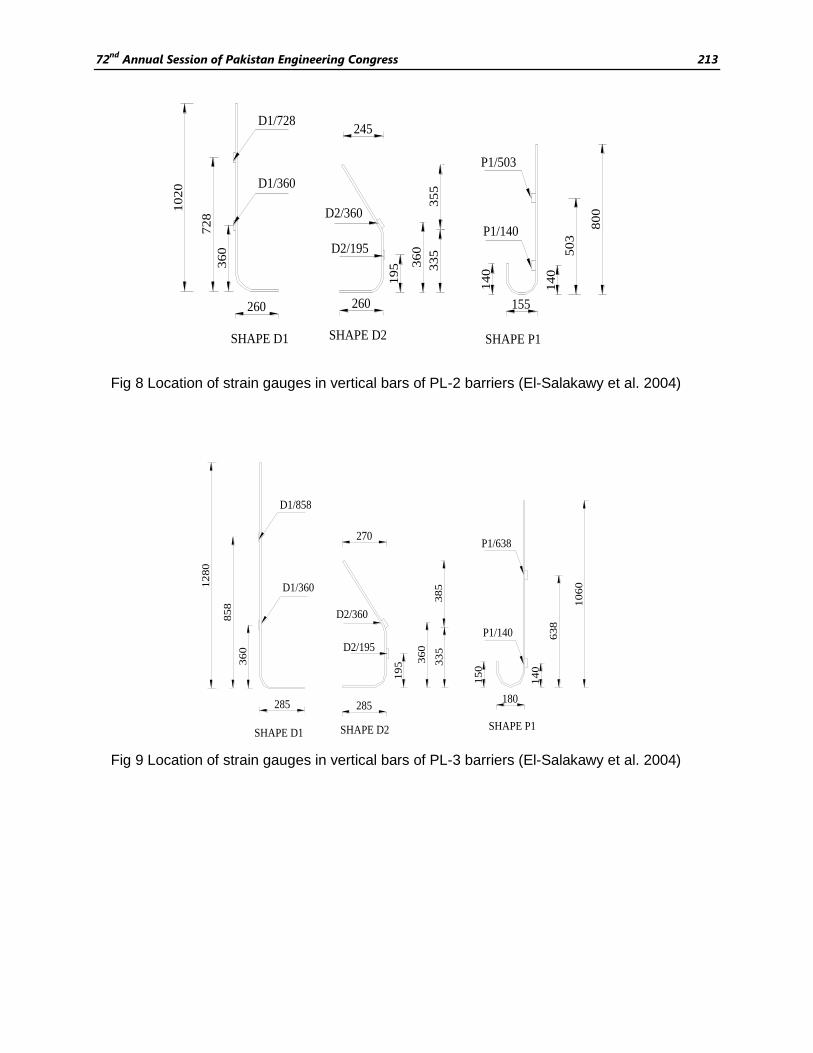
5.2.2 Test Setup and Instrumentations
5-mm long strain gauges were attached at different critical locations of the reinforcing
bars to measure strains at those locations, as shown in Figure 8 & 9.
Each shape D1, D2 and P1 had two strain gauges attached on them and they were located
at three different sections C, D and E at the middle part of the wall as shown in figure 10.
For shape H1, the strain gauges were installed on the second and third bars from the top
of the wall for types PL-2 and PL-3, respectively, at four different locations, A, B, F, and
G, in the front and back layers.
An accelerometer was also used to measure acceleration and its location was at the
back (compression) face of the wall directly behind the point of strike.
After each test, crack widths were measured and recorded on both faces of the wall.
72nd
Annual Session of Pakistan Engineering Congress 213
10
20
72
8
36
0
260
D1/728
D1/360
SHAPE D1 SHAPE D2
260
19
5 36
0
33
53
55
245
D2/360
D2/195
SHAPE P1
155
14
0
14
0
50
3
80
0
P1/503
P1/140
Fig 8 Location of strain gauges in vertical bars of PL-2 barriers (El-Salakawy et al. 2004)
SHAPE D1 SHAPE D2 SHAPE P1
D1/858
D1/360
D2/360
D2/195
P1/638
P1/140
12
80
85
8
36
0
285 285
19
5 36
0
33
53
85
270
180
15
0
14
0
63
8
10
60
Fig 9 Location of strain gauges in vertical bars of PL-3 barriers (El-Salakawy et al. 2004)

214 Rao Arsalan Khushnood, Giuseppe Andrea Ferro, Sajjad Ahmad, Fawad Ahmed Najam
2500 1875 25001875
PLAN VIEW
FRONT FACE
BACK FACE
C.L.
C.L.
A B C D EG
A B
HAV/625-
HAR/625-HAR/2500-
HAV/2500-
HAR/625-F
HAV/625-F
HAV/2500-G
HAR/2500-G
325300100
200
325
Fig 10 Location of strain gauges in vertical bars of PL-2 & PL-3 barriers (El-Salakawy et al. 2004)
5.2.3. Pendulum Impact Test
To test these barriers it is recommended in the code that a full scale vehicle crash test
should be carried out. But in that research pendulum impact test was carried out instead
of vehicle crash test. One reason for that is the costing of crash test and other one is
several tests showed that Pendulum impact test could reasonably predict barrier
behaviour.
A pear shaped iron ball of 3.0 ton weight was used. 80 ton mobile crane was used to
suspend this iron ball. The crane is positioned such that the first point on the ball that
hits the wall is at 0.75 and 0.90 m above the base of the wall for the PL-2 and PL-3
series, respectively.
Two steel plates were raised up by timber beam were placed in full contact with the
upper sloping portion of the barrier wall. 3.0 ton steel ball was swung from a height of 3.0
m and 3.5 m for PL-2 and PL-3 barrier respectively.
Obtained test results are given below in Table-10 and schematic diagram of the Impact
pendulum test setup is shown in Figure-11.

72nd
Annual Session of Pakistan Engineering Congress 215
Table-10: Summary of test results of Impact pendulum test (El-Salakawy et al. 2004)
Barrier Type Reinforcement
Type
Acceleration
( )/ 2sm
Impact Load (kN)
Maximum measured crack width
Front face (mm)
Back face (mm)
PL-2
Steel
257 758 0.65 0.70
234 690 0.45 0.46
GFRP
248 731 0.75 0.66
245 728 0.85 0.90
PL-3
Steel
243 716 0.60 0.45
173 511 0.56 0.65
GFRP
252 744 0.54 0.55
220 649 0.80 0.55
5.3 Code Provisions
Based on this research of El-Salakawy et al. (2004) CAN/CSA-S6-06 now provides
reinforcement detailing of both PL-2 and PL-3 bridge barrier reinforced with GFRP in its
commentary. Full reinforcement detailing along with connection with overhang slab is now
possible with GFRP bars. These reinforcement layout and other important aspects such as
performance level, anchorage, and load capacity associated with GFRP reinforced bridge
barrier are described in the following portions.

216 Rao Arsalan Khushnood, Giuseppe Andrea Ferro, Sajjad Ahmad, Fawad Ahmed Najam
5.3.1. Reinforcement Detailing
According to CAN/CSA-S6-06 reinforcement detailing for both PL-2 and PL-3 barrier are shown in the Figure-11 and 12 respectively.
410
225 125
60
88
0
55
51
80
145
150
20
35 clear
15
15
12- #5
# 5 @ 200*
75 clear (typ)
Chamfer 15x15 (typ)
# 5 @ 200*
R= 255
R= 25
Waterproofing
Pavement
# 5 @ 200*
Figure-12: Reinforcement detailing for PL-2 barrier (Reproduced from CAN/CSA-S6-06)
5.3.2 Performance Level, Anchorage and Load Capacity
Code requirements of performance level, anchorage and load carrying capacity of both PL-2 and PL-3 barrier reinforced with GFRP bars is same as specified for steel reinforced barrier. Article 4.2., 4.3. and 4.4. discussed about these requirements in details.
5.4 Barrier Test
To date three different tests have been evolved to test bridge barrier and estimate its
ultimate capacity. They are vehicle crash test, Impact pendulum test and static load test.
Though code requires that any new type of barrier should be tested using vehicle crash test but
because of its high costing and availability of alternate way of evaluating barrier, researchers
are now using either impact pendulum test or static load test. (Deitz et al. 2004, El-Salakawy et
al. 2004, Matta et al. 2009, Alberson et al. 2004, Ahmed et al. 2011). Again based on the same
argument it’s now trend to use static load test to simulate vehicle impact instead of pendulum
impact test. (Deitz et al. 2004, Mitchell et al. 2006) So GFRP reinforced bridge barrier can be
tested using static load test.

72nd
Annual Session of Pakistan Engineering Congress 217
5.4.1. Static Load Test
In static load test load is applied in a monotonic way to the barrier up to the failure point. Typically load is applied at the middle and two edges of the barrier. (Alberson et al. 2004) Now load application point, amount of load and other associated things for PL-2 and PL-3 barrier are discussed below.
5.4.1.1. Static Test Requirements for PL-2 Barrier
According to CAN/CSA-S6-06 PL-2 barrier must withstand the loading requirements shown in Table (11). These loading positions are shown in Figure (13).
Table-11: Loading requirements for PL-2 barrier
Performance Level Transverse Load,
Kn Longitudinal Load,
kN Vertical Load, kN
PL-2 100 30 30
The effect of the vertical and longitudinal loads in regard to the failure mode and capacity of the parapet can be deemed to be negligible. Therefore, in the experiment, the barrier is subjected to transverse load only.
Transverse Load has to apply on the barrier at a height of 700 mm from the top of the overhang slab.
Transverse load has to apply over a length of 1050 mm of the barrier wall.
Load can be applied either by displacement rate or loading rate up to the failure point.
1050 mm
Ft= 100 kN
Fl= 30 kN
700m
m
Fv= 30 kN
Fig 13 Locations of load on PL-2 barrier as per CAN/CSA-S6-06

218 Rao Arsalan Khushnood, Giuseppe Andrea Ferro, Sajjad Ahmad, Fawad Ahmed Najam
5.4.1.2. Static Test Requirements for PL-3 Barrier
According to CAN/CSA-S6-06 PL-2 barrier must withstand the loading requirements shown in Table-12. These loading positions are shown in Figure-14.
Table-12: Loading requirements for PL-3 barrier
Performance Level Transverse Load,
kN Longitudinal Load,
kN Vertical Load, kN
PL-3 210 70 90
The effect of the vertical and longitudinal loads in regard to the failure mode and capacity of the parapet can be deemed to be negligible. Therefore, in the experiment, the barrier is subjected to transverse load only.
Transverse Load has to apply on the barrier at a height of 900 mm from the top of the overhang slab.
Transverse load has to apply over a length of 2400 mm of the barrier wall.
Load can be applied either by displacement rate or loading rate up to the failure point.
2400 mm
Ft= 210 kN
Fl= 70 kN
900m
m
Fv= 90 kN
Fig 14 Locations of load on PL-3 barrier as per CAN/CSA-S6-06

72nd
Annual Session of Pakistan Engineering Congress 219
6. Comparisons between steel reinforced and GFRP reinforced barrier
6.1. General
Performance of GFRP reinforced bridge barrier and its connection with the bridge overhang deck slab will be discussed in this section and will be compared with its counterpart steel reinforced barrier. Performance evaluation and comparisons criteria are:
Ultimate capacity
Connection with the slab
Crack width and crack pattern
Strain in reinforcing bars
These criteria will be discussed based on the research conducted by El-Salakawy et al. (2004).
6.2. Ultimate Capacity
Impact load carrying capacity obtained from pendulum impact test of PL-2 and PL-3 barriers reinforced with both steel and GFRP bars are tabulated below in Table-13.
Table-13: Results of Impact pendulum test and yield line capacity
Barrier type Reinforcement
type Impact Load
(kN) Yield line
capacity (kN) Code
requirements (kN)
PL-2
Steel 758
535.6
100 690
GFRP 731
782.0 728
PL-3
Steel 716
906.0
210 511
GFRP 744
1175.0 649
Both PL-2 and PL-3 barriers either reinforced by steel or GFRP showed large load carrying capacity than CAN/CSA-S6-06 requirements.
Both steel and GFRP reinforced PL-2 barrier carried almost equal amount of impact load.
Both steel and GFRP reinforced PL-3 barrier carried almost equal amount of impact load.

220 Rao Arsalan Khushnood, Giuseppe Andrea Ferro, Sajjad Ahmad, Fawad Ahmed Najam
Yield line predictions regarding ultimate capacity is higher than the actual capacity of both PL-2 and PL-3 barrier either reinforced by steel or GFRP.
6.3 Connection with the Slab
Both steel and GFRP reinforced barrier did not show any sign of failure in the connection level. It means that connection between slab and barrier wall can sustain and transfer the load coming from the barrier wall successfully.
6.4. Crack Width and Crack Pattern
Symmetrically distributed diagonal cracks around the vertical axis, were formed through the point of strike on the wall after impact load was applied.
The length over which cracks spread after the impact load is defined by AASHTO (1994) as critical length. This critical length for PL-2 and PL-3 barrier either reinforced by steel or GFRP bars are shown in Table-14:
Table-14: Critical length of PL-2 and PL-3 barrier
Barrier type
Critical length (m)
GFRP & steel Yield line Prediction
Top Bottom Steel GFRP
PL-2 2.9-3.3 0.9-1.2 2.60 2.77
PL-3 3.7-4.1 1.0-1.3 4.4 4.6
These measured critical lengths match well with the values predicted by the yield line approach.
Crack widths were larger in GFRP reinforced barrier than steel reinforced one. But spacing between cracks was smaller in GFRP reinforced barrier than steel reinforced one. Crack widths are given in Table-15.
Table-15: Crack width of steel and GFRP reinforced barrier
Reinforcement type
Crack width (mm)
PL-2 Barrier PL-3 Barrier
Front face Back face Front face Back face
Steel 0.65 0.70 0.60 0.45
0.45 0.46 0.56 0.65
GFRP 0.75 0.66 0.54
0.55 0.85 0.90 0.80

72nd
Annual Session of Pakistan Engineering Congress 221
For barriers reinforced with GFRP bars, the intensity of cracks is higher than steel reinforced barriers. This higher crack intensity spread over the same area, results in higher strains in the GFRP bars than steel bars. This may be attributed to the low stiffness of the GFRP bars (about one fifth that of steel).
Crack distribution in GFRP reinforced barriers is uniform and it shows that the GFRP bars exhibited good bond characteristics.
6.4 Strain in Reinforcing Bars
Strains in horizontal and vertical bars of both steel and GFRP reinforced barrier were investigated by El-Salakawy et al. (2004) and the obtained values are given in Table 16.
In both PL-2 and PL-3 steel reinforced barrier, horizontal bars near the back face experience less strain than the horizontal bars of GFRP reinforced PL-2 and PL-3 barrier.
In both PL-2 and PL-3 steel reinforced barrier, vertical bars near the front face experience higher strain than the vertical bars of GFRP reinforced PL-2 and PL-3 barrier.
It can be concluded that most of the impact force is carried by the vertical steel reinforcement in the steel reinforced barrier, which is closer to the concrete surface and it can be attributed to the high stiffness of the steel reinforced barriers.
For GFRP reinforced barriers horizontal reinforcement has more contribution in carrying the impact load and it can be attributed to the lower stiffness of these barriers.
Table-16: Strains in horizontal and vertical bars of barrier
Barrier type
Horizontal bars (back face)
Strain ( )
Vertical bars (front face)
Strain ( )
Steel GFRP Steel GFRP
PL-2 1170 2300 5280 4150
PL-3 2760 3540 4900 4720
7. Field Applications
Now-a-days GFRP bars are being widely used in bridge barrier as internal reinforcement specifically in Canada and USA. Name of some bridges in Canada using GFRP bars in barrier as internal reinforcement are listed below:
Red river flood way bridge on TCH #1E- Winnipeg, MB Canada
South Perimeter Bridge of the Red River- Winnipeg, MB Canada
Clarks Mill Bridge- Summer side, PE Canada
Baden Creek Bridge- Toronto, ON Canada
County Road 17 Bridge- Hawkesbury, ON Canada
Val-Alain on the Highway 20 East, crosses over the Henri River in Quebec, Canada
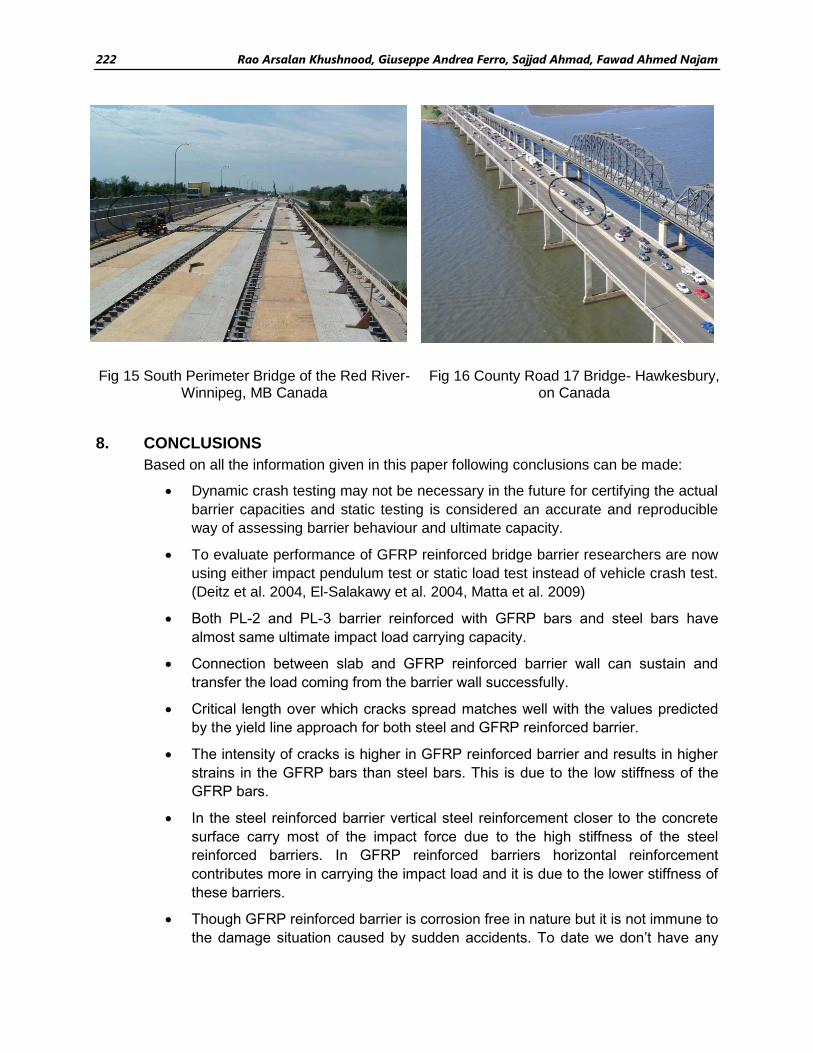
222 Rao Arsalan Khushnood, Giuseppe Andrea Ferro, Sajjad Ahmad, Fawad Ahmed Najam
Fig 15 South Perimeter Bridge of the Red River-
Winnipeg, MB Canada Fig 16 County Road 17 Bridge- Hawkesbury,
on Canada
8. CONCLUSIONS
Based on all the information given in this paper following conclusions can be made:
Dynamic crash testing may not be necessary in the future for certifying the actual
barrier capacities and static testing is considered an accurate and reproducible
way of assessing barrier behaviour and ultimate capacity.
To evaluate performance of GFRP reinforced bridge barrier researchers are now
using either impact pendulum test or static load test instead of vehicle crash test.
(Deitz et al. 2004, El-Salakawy et al. 2004, Matta et al. 2009)
Both PL-2 and PL-3 barrier reinforced with GFRP bars and steel bars have
almost same ultimate impact load carrying capacity.
Connection between slab and GFRP reinforced barrier wall can sustain and
transfer the load coming from the barrier wall successfully.
Critical length over which cracks spread matches well with the values predicted
by the yield line approach for both steel and GFRP reinforced barrier.
The intensity of cracks is higher in GFRP reinforced barrier and results in higher
strains in the GFRP bars than steel bars. This is due to the low stiffness of the
GFRP bars.
In the steel reinforced barrier vertical steel reinforcement closer to the concrete
surface carry most of the impact force due to the high stiffness of the steel
reinforced barriers. In GFRP reinforced barriers horizontal reinforcement
contributes more in carrying the impact load and it is due to the lower stiffness of
these barriers.
Though GFRP reinforced barrier is corrosion free in nature but it is not immune to
the damage situation caused by sudden accidents. To date we don’t have any

72nd
Annual Session of Pakistan Engineering Congress 223
information regarding the repair process of this GFRP reinforced barrier. So
effective repairing process must be found out through future research.
To date no full scale static test has been done on the GFRP reinforced barrier.
Therefore full scale static test must be carried out and develop complete new
sets of equations to predict failure pattern and ultimate capacity of GFRP
reinforced bridge barrier.
References
1. AASHTO (2005). "LRFD Bridge Design Specifications," 3rd ed., American Association of State Highway and Transportation Officials, Washington, DC.
2. AASHTO (1989). "Guide Specifications for Bridge Railing," American Association of State Highway and Transportation Officials, Washington, DC.
3. Ahmed, E., Benmokrane, B. (2011). “Static Testing of Full-Scale Concrete Bridge Barriers Reinforced with GFRP Bars.” 10th International Symposium on Fibre Reinforced Polymer Reinforcement for Concrete Structures, ACI, SP-275, pp. 1-20.
4. Alberson, D.C., Williams, W.F., Menges, W.L. and Haug, R.R. (2004). “Testing and Evaluation of The Florida Jersey Safety Shaped Bridge Rail,” Report No. 9-8132-1, February, Texas Transportation Institute (TTI), The Texas A&M University System, College Station, Texas.
5. Alves, J., El-Ragaby, A. and El-Salakawy, E.(2011). “Durability of GFRP Bars Bond to Concrete under Different Loading and Environmental Conditions,” Journal of Composites for Construction, ASCE, V. 15, No. 3, pp. 249-262.
6. CHBDC (2006). "Canadian Highway Bridge Design Code," CAN/CSA-S6-06, Canadian Standard Association, Rexdale, Toronto, Ontario, Canada, 800p.
7. CHBDC (2006). " Commentary on CAN/CSA-S6-06, Canadian Highway Bridge Design Code," S6.1-06, Canadian Standard Association, Rexdale, Toronto, Ontario, Canada, 662p.
8. Deitz, D.H., Harik, I.E., Gesund, H. and Zatar, W.A. (2004). “Barrier Wall Impact Simulation of Reinforced Concrete Decks with Steel and Glass Fiber Reinforced Polymer Bars,” Journal of composites for construction, American Society of Civil Engineers (ASCE), vol. 8, No. 4, pp 369-371.
9. El-Salakawy, E.F., Masmoudi, R., Benmokrane, B., Brière, F. and Desgagné, G. (2004). “Pendulum Impacts into Concrete Bridge Barriers Reinforced with Glass Fibre Reinforced Polymer Composite Bars,” Canadian Journal of Civil Engineering, vol. 31, pp 539–
10. El-Salakawy, E.F., Mufti, A. and Elragaby, A. (2010). “Laboratory Investigations on the Repair of GFRP-Reinforced Concrete Bridge Deck Slabs,” in Recent Advances in Maintenance and Repair of Concrete Bridges, American Concrete Institute (ACI), SP-235, Detroit, Michigan, 20 p.
11. Hassan T. and Rizkalla S. (2004) “Bond Mechanism of NSM FRP Bars for Flexural Strengthening of Concrete Structures,” ACI Structural Journal, V. 101, No. 6, pp. 830–839

224 Rao Arsalan Khushnood, Giuseppe Andrea Ferro, Sajjad Ahmad, Fawad Ahmed Najam
12. Hirsch, T.J. (1978). “Analytical evaluation of Texas bridge rails to contain buses and trucks,” Tex. Research Report 230-2, Texas Transportation Institute, Texas A&M University, College Station, Texas.
13. Jeon, S.J., Choi, M.S. and Kim, Y.J. (2011). “Failure Mode and Ultimate Strength of Precast Concrete Barrier,” American Concrete Institute (ACI) structural Journal, V.108, No. 1, pp. 99-107.
14. Matta, F. and Nanni, A. (2009). “Connection of Concrete Railing Post and Bridge Deck with Internal FRP Reinforcement,” Journal of Bridge Engineering, American Society of Civil Egineers (ASCE), Vol. 14, No. 1, pp 66-76.
15. Mitchell, G., Tolnai, M., Gokani, V., Picon, R., Yang, S., Klingner, R.E. and Williamson, E.B. (2006). “Design of Retrofit Vehicular Barriers Using Mechanical Anchors,” Report No. 0-4823-CT-1, October, Centre for Transportation Research (CTR), The University of Texas at Austin, Red River, Austin.
16. Quayyum, S. (2010). “Bond Behaviorof Fiber Reinforced Polymer (FRP) Rebars in Concrete’” M.Sc. Thesis, The University of British Columbia, Okanagan, British Columbia, Canada.
17. Soliman, S.M., El-Salakawy, E.F., and Benmokrane, B. (2011). “Bond Performance of NearSurface-Mounted FRP Bars,” Journal of Composites for Construction, ASCE, V. 15, No. 1, pp. 103-111.