Embed Size (px)
Citation preview

The Data Checking Engine: Complex Rules for DataQuality Monitoring
Felix Heine, Carsten Kleiner, Arne KoschelUniversity of Applied Sciences & Arts Hannover
Faculty IV, Department of Computer Science, Hannover, GermanyEmail: [email protected]
Jorg WestermayerSHS Viveon
GermanyEmail: [email protected]
Abstract—In the context of data warehousing and businessintelligence, data quality is of utmost importance. However, manymid-size data warehouse (DWH) projects do not implement aproper data quality process due to huge up-front investments.Nevertheless, assessing and monitoring data quality is necessaryto establish confidence in the DWH data. In this paper, wedescribe a data quality monitoring system: The “Data CheckingEngine” (DCE). The goal of the system is to provide DWHprojects with an easy and quickly deployable solution to as-sess data quality while still providing highest flexibility in thedefinition of the assessment rules. It allows to express complexquality rules and implements a two-staged template mechanism tofacilitate the deployment of large numbers of similar rules. Whilethe rules themselves are SQL statements the tool guides the dataquality manager through the process of creating rule templatesand rules so that it is rather easy for him to create large sets ofquality rules. The rule definition language is illustrated in thispaper and we also demonstrate the very flexible capabilities ofthe DCE by presenting examples of advanced data quality rulesand how they can be implemented in the DCE. The usefulnessof the DCE has been proven in practical implementations atdifferent clients of SHS Viveon. An impression of the actualimplementations of the system is given in terms of the systemarchitecture and GUI screenshots in this paper.
Keywords—Data Quality, Quality Rules, Data Analysis, DataQuality Monitoring, Data Warehouses
I. INTRODUCTION
Data quality (DQ) is of utmost importance for a successfuldata warehouse project. In this context, continuous monitoringis an integral part of any DQ initiative. In this paper, we de-scribe a data quality monitoring system called Data CheckingEngine (DCE) developed collaboratively at the University ofApplied Sciences & Arts Hannover and SHS Viveon. The maingoal is to provide a flexible, yet simple tool to monitor dataquality in DWH projects, which can also be used during theDWH development to test its Extract Transform Load (ETL)process. Implementations of the system have already been usedat some key pilot customers of SHS Viveon and continuousimprovements of the technical as well as the conceptual partsof the system are based on feedback from those customersgathered during daily usage of the system.
Data rules are used in order to constantly monitor thequality of data of a database. For the definition of these rules, aflexible language is necessary. Quality rules are either derivedfrom business rules or found via profiling or data mining. Theyare executed either in regular intervals or based on specificevents like the completion of an ETL job. The results of
checking the rules are recorded in a result repository, whichalso keeps historical data so that users can evaluate the qualityof data over time. As rules will evolve over time, it is necessaryto keep a history of rule definitions so that historic results canbe related to the correct version of the rule’s definition.
We believe that the ability to express complex rules iscrucial. A set of hard-coded rule types found in some dataquality tools is typically only suitable to detect rather simplequality problems on the attribute or single tuple level. However,there are more complex data quality problems, which cannotbe detected using such rules. As an example, consider an errorlocated in the logic of an ETL process. Due to this error, theprocess fails to reference the correct product group for some ofthe records of a sales fact cube. The bug is subtle and does notshow up very often. At the attribute level all sales records arecorrect. However, the trend of the time series showing the salessum with respect to individual product groups will indicate aquality problem. Other advanced data quality problems andaccording check rules will be explained in sec. IV, which isalso one of the major extensions of this article in comparisonto [1].
It requires skilled users to write such rules, but larger setsof rules will look similar in structure. They differ only in thetables and attributes they are applied to. Therefore, a templatemechanism is useful to help users define such rules. The ideais that only the template creator has to cope with the fullcomplexity; template users can then apply these templates totheir tables and attributes.
To avoid discontinuity of the reporting environment forDWH users, re-using existing Business Intelligence (BI) toolsis superior over building a specialized quality reporting GUI.Still, it is sufficient to export rule results to a quality datamart, which can then be accessed by any standard BI tool.However, the plain rule results have to be aggregated to morecomprehensive quality metrics in a flexible and user definedway.
Furthermore, the rules themselves have to be tested inthe development environment before deployment. Thus, anautomated transfer and synchronization with the productionsystem is necessary.
In a nutshell, we target the following requirements:
• Express complex rules• Reduce complexity of rules for end users (by utilizing
a template mechanism)
171
International Journal on Advances in Software, vol 7 no 1 & 2, year 2014, http://www.iariajournals.org/software/
2014, © Copyright by authors, Published under agreement with IARIA - www.iaria.org

• Execute the rules regularly or upon specific events• Keep a history of rule definitions and execution results• Store this history in a quality data mart persistently• Aggregate the rule results to quality metrics• Provide export/import mechanism for rule meta data
This paper is an extended version of the paper [1]. Theexample section has been included to describe new qualityrule types and to underline the flexibility of our approach,and the related work section has been revised and extendedsignificantly as well.
The remainder of this paper is organized as follows:In the following section, we give an overview of relatedwork. Section III focuses on the definition of quality rulesand explains our template mechanism in general, whereasSection IV illustrates the rule definition language in detailby discussing how to implement frequently occurring samplerules. This section is the major extension of this article incomparison to the earlier version [1]. Section V describes theDCE architecture and in the subsequent section we brieflyelaborate on quality metrics. Finally, Section VII (which isalso an addition in comparison to [1]) illustrates the DCEconcept and GUI in more detail, before we summarize ourachievements and give an outlook to our future plans in thefinal section.
II. RELATED WORK
Over the last decade, much research in the data qualitydomain has been conducted, see for example [2], [3], [4], or[5]. Research areas related to data quality are outlier detection,data deduplication, data quality monitoring, data cleansing,and data mining to detect quality rules. We are specificallyinterested in monitoring and reporting data quality, and inalgorithms to detect quality rules automatically from existingdata. In general, we follow the approach of Kimball [6] whooutlines an approach to DQ assessment in DWH systems.
For our work, ideas and formalisms to describe qualityrules are highly relevant. Many types of quality rules stemfrom the field of database constraints, as described by Bertossiand Bravo in their survey [7]. As classical constraints arenot very flexible, numerous new kinds of constraints havebeen proposed in the literature. In [3], Fan describes multipleformalisms that target specific quality problems. Conditionalfunctional dependencies are used to express more complexrules spanning multiple tuples of a relation (see also [8], [9]),while conditional inclusion dependencies are generalizationsof referential integrity checks. The classical edit rules ofFellegi and Holt are concerned with the integrity of individualrecords [10]. In [11], Fan defines editing rules to matchrecords with master data. Further rule types include differen-tial dependencies [12], multidimensional conditional functiondependencies [13], and probabilistic, approximate constraints[14]. From our point of view, these are examples of specifictypes of rules. We aim to provide a framework that is ableto express any of these rules. As all these approaches can bereformulated to SQL, the DCE is able to execute these rules.However, this leads to rather complicated rule definitions. Tomake life easier for the end users, we further provide a templateapproach. With this approach, we can define a template foreach of the rule types, so that rules can be instantiated in aneasy way.
In the domain of data deduplication (also called recordlinkage), rules are important to describe matching criteria.As an example, the IntelliClean [15] system uses rules like<if> condition <then> action with probability p to matchduplicates. Fan et al. [16] introduce matching dependencies todescribe criteria that are used to identify duplicate records. Fora survey of duplicate record detection, see [17].
Another approach is to extend SQL to incorporate dataquality features. An example is the FraQL [18] language thatspecifies pivoting features and allows to integrate user definedgrouping and aggregate functions that allow to analyze datamore comfortably. The drawback is that a special executionengine is required. Thus, the features of existing relationaloptimizers are not available or have to be reproduced.
Furthermore, many prototypic research systems and com-mercial tools are present. For an overview, see [19]. Mostexisting tools focus on dimension data only and thus stresssingle record problems and deduplication. The profiling com-ponent of existing data quality tools currently provides onlybasic algorithms to detect quality rules, see [20]. We think thatmore advanced profiling techniques are necessary to detectquality rules automatically. Basic approaches are found inthe domains of data mining and outlier detection, also calledanomaly detection. An overview can be found in [21] as wellas in the recent book of Aggarwal [22]. We plan to integratethese concepts in a later version of the DCE. For this, weare especially interested in finding outliers in time series (see,e.g., [23], [24]) and algorithms to analyze multidimensionaldata (see, e.g., [25], [26], or [27]). However, to the best of ourknowledge, no tool provides a similar mechanism that allowsto build complex rule templates, which can, for example, beused to test indicator values against time series models.
III. RULE DEFINITION LANGUAGE
A central issue is the language to define the quality rules.On the one hand, it has to be expressive to allow complex ruleslike time series tests. On the other hand, fast definitions ofsimple rules like NULL value checks has to be possible. Also,the rule execution is typically critical with respect to executiontime and resource consumption. As large datasets have to bechecked, an efficient rule execution engine is needed.
Thus, we decided to rely on the native SQL executor of theDBMS. This means, the core of each rule is an SQL statement,which collects the required information from the underlyingtables. This statement is written by the DCE user, allowingeven vendor-specific optimizations like optimizer hints.
DCE defines a standard attribute set for the result tuples.The rule statements have to adhere to this standard. Eachstatement computes a result value, which is the basis for therule check. For a NULL rule, the result value might be thepercentage of NULL values of the checked values. There mighteither be a single result value or multiple values, broken downby dimensional hierarchies. The latter case might for exampleyield a percentage of NULL values for each product group ineach region. Furthermore, two base values can be returned.They can provide additional information for the rule outcome.This might be helpful when interpreting the rule results.
For each rule, multiple bounds can be defined, specifyingvalid ranges for the observed values. The bounds can be
172
International Journal on Advances in Software, vol 7 no 1 & 2, year 2014, http://www.iariajournals.org/software/
2014, © Copyright by authors, Published under agreement with IARIA - www.iaria.org

Fig. 1. Instantiating a template
activated or deactivated with respect to all values contained inthe result tuple, including both base values and the dimensionvalues. In this way, the bound for NULL values can benormally defined to be 5 percent, however, for specific productgroups it might be higher. A specific application for this featureis to change bounds for business metrics, e.g., according tothe week day. Typically, the revenue sum for traditional storesmight be zero on Sundays.
A severity can be assigned to each rule bound, and multiplebounds with different severity can be defined for a rule. Theseverity information of failed rules is returned to the scheduler.Based on this information, the scheduler might, e.g., decide tointerrupt an ETL process or to alert the DWH team.
Each rule’s SQL statement can have multiple parameters,which are set at execution time. These parameters can forexample be used to determine the range of data to be checked.In this way, a quality rule running after an ETL job might belimited to check only the new records in a fact table.
A. Sample rule
In the following, we show how a rule that checks NULL-values does look like. The target is to check the number ofNULL value in the middle name in the customer records. Asthe typical percentage of people that have a middle name variesfrom country to country, we calculate the values per country.Thus, the country code is used as a dimension value and oneresult record per country is generated. The two base value
fields are used to count the overall number of customers in eachcountry and the number of customers without middle name,respectively. The result value is the percentage of customersin each country without middle name.
SELECTtrunc(sysdate, ’dd’) Result_date,countrycode dimValues,sum(1) baseValue1,sum(case when middlename is null
then 1else 0 end) baseValue2,
round(sum(case when middlename is nullthen 1 else 0 end) /
sum(1) * 100) resultValueFROM customerWHERE created >
to_date($date$, ’YYYY-MM-DD’)GROUP BY countrycode
Fig. 2. Sample rule code
The SQL for this check is shown in Fig. 2. The result valueis then checked against different bounds that are defined on aper-country basis. The rule uses a parameter $date$ that isused to narrow the check to customers which have been createdafter the specified date.
173
International Journal on Advances in Software, vol 7 no 1 & 2, year 2014, http://www.iariajournals.org/software/
2014, © Copyright by authors, Published under agreement with IARIA - www.iaria.org

SELECTtrunc(sysdate, ’dd’) Result_date,§reftable1_refdimension1§ dimValues,sum(1) baseValue1,sum(case when §reftable1_refattribute1§
is null then 1else 0 end) baseValue2,
round(sum(case when §reftable1_refattribute1§
is null then 1else 0 end) /
sum(1) * 100) resultValueFROM §reftable1§WHERE §reftable1_refattribute2§ >
to_date($date$, ’YYYY-MM-DD’)GROUP BY §reftable1_refdimension1§
Fig. 3. Sample template code
B. Templating
In typical environments, there is often a need to definea number of equivalent rules over a large number of tablesand attributes. To accommodate for this requirement, weimplemented a template concept.
A template looks quite similar to a normal rule. It con-tains an SQL statement producing the same set of standardcolumns, and it might also contain bound definitions. However,instead of the target table and attribute names, the template’sSQL statement contains special markers. For attributes, thesemarkers declare the purpose of the attribute within the rule.Once the user has defined a template, she can instantiate it formultiple sets of tables and attributes. During this process, sheeither defines new bounds or uses the predefined bounds fromthe template for the generated rules. The engine forwards ruleparameters defined within the template to the generated rules.
C. Example continued
The sample statement is a good candidate for a template.In the template, there is another type of parameters called tem-plate parameters that are replaced at template instantiation (i.e.,rule creation time). These are used to define placeholders forthe table and attribute names, like §reftable1§ (cf. Fig. 3).
A GUI assists unexperienced users with defining the tem-plate parameters, as shown in Fig. 1. In this dialog, the GUIreads the database catalog and lets the user map the templateparameters to catalog objects. E.g., §reftable1§ is replacedwith sales_fact. Note though that in the current versionof the system data type integrity between catalog objectsand template parameters is not automatically enforced by thesystem. I. e. the expert assigning catalog objects to templateparameters has to take care that the data types are compatible.If they are not, the execution of the rule will fail with acorresponding SQL error message that will be recorded as arule execution result in the result repository (cf. Section V).This issue never caused problems in the actual implementationsof the system so far, but is a candidate for a future extension,e. g. by providing the opportunity for the template developerto place hints on the expected data type in the template that
can assist the person actually creating the rules in the selectionprocess.
IV. RULE EXAMPLES
In this section, we illustrate how the rule definition lan-guage introduced in the previous section can be used foradvanced quality checks. In order to do so, we give examplesfor quality rules and show how they can be defined withinthe Data Checking Engine. The section has two purposes:On the one hand, we want to demonstrate that the DCEsupports well-known rule types from the data quality literature.On the other hand, we want to introduce new rule typeswhose capabilities to detect possible quality problems are moresophisticated compared with the well-known rules. We usethe AdventureWorks2008DW (in short AWDW) database fromMicrosoft [28] for our examples.
Data rules are found either by profiling and mining existingdata, or by looking at business rules. The mining approachassumes that you either have a data set that is a-priori knownto be correct, or you have to do outlier detection and datacleansing on the way. Currently, mining is out of scope forthe DCE. This means that we performed the rule mining usingexternal tools (in our case the GNU R tool). However, we planto integrate this step further with the DCE system in the future,cf. Section VIII.
In general, we distinguish two kinds of rules. Hard rulesare those that can clearly identify wrong data. As an example,the violation of a pattern for product codes confirms that thegiven product code is apparently incorrect. In the same sense,testing a foreign key relationship is a hard constraint. However,there are many quality problems that cannot be detected usinghard rules. For this, we need another kind of rule, which wecall value rules, according to Jack Olsen [5]:
There are additional tests you can construct that point tothe presence of inaccurate data that are not as precise inestablishing a clear boundary between right and wrong. Theseare called value rules.
We are going to present some examples of this kind ofrules in the last subsections. However, we start with examplesfor simpler rules that are hard constraints.
A. Pattern for customer alternate key
SELECTtrunc(sysdate, ’dd’) Result_date,§reftable1_refdimension1§ dimValues,0 baseValue1,0 baseValue2,CASE WHENregexp_like(§reftable1_refattribute1§,
’$regexp$’)THEN 1 ELSE 0 END resultValue
FROM §reftable1§
Fig. 4. Template for regular expression checking
In AWDW, each customer has an attributeCUSTOMERALTERNATEKEY that contains the business
174
International Journal on Advances in Software, vol 7 no 1 & 2, year 2014, http://www.iariajournals.org/software/
2014, © Copyright by authors, Published under agreement with IARIA - www.iaria.org
key consisting of the letters ‘A’ and ‘W’ followed by 8 digits.Such a pattern can be validated using a regular expression.
The template shown in Fig. 4 is used for all rules that checkregular expressions. To check the alternate key, we instantiatethis template using the dim_customer table and set the$regexp$-parameter to ˆAW[0-9]{8}$.
B. Consistency of translated attributes
SELECTtrunc(sysdate, ’dd’) Result_date,t1.§reftable1_refdimension1§ dimValues,0 baseValue1,0 baseValue2,count(t2.§reftable1_refdimension1§)
resultValueFROM §reftable1§ t1LEFT JOIN §reftable1§ t2
ON t1.§reftable1_refattribute1§ =t2.§reftable1_refattribute1§
AND t1.§reftable1_refattribute2§ !=t2.§reftable1_refattribute2§
GROUP BY t1.§reftable1_refdimension1§
Fig. 5. Template for functional dependency checking
In the AWDW dimension tables, some descriptions arepresent in multiple languages. As the same English text isexpected to have always the same translation, a functionaldependency (FD) is present. To check FDs, we have writtena template (see Fig. 5). The template searches for tuplecombinations that agree upon the first attribute’s value anddisagree upon the second attribute. For each tuple, the numberof tuples that have a different value in the second attribute iscounted.
We instantiated the template, e.g., for the attributesENGLISHEDUCATION and SPANISHEDUCATION in thedim_customer-table. For each tuple in the table, therule counts the number of tuples that match the currenttuple with respect to ENGLISHEDUCATION but disagreein SPANISHEDUCATION. We have modified the text forSPANISHEDUCATION in a single tuple. As there are 5099tuples that share the same text in ENGLISHEDUCATION, eachof these tuples gets a resultValue of 1, while the modified tuplegets a value of 5098. Although the probability is high that thetranslation is correct for 5099 tuples and it is wrong for onlya single tuple, the rule cannot make this distinction. Thus,the bound for the rule is zero, meaning each of the tuples isregarded to be a potential quality error.
C. Sales count of clothing and accessories
Now we start with examples for value rules. First, we aregoing to check whether the sales count (items per day) of thetwo product categories clothing and accessories is reasonable.A scatter plot of the counts per day in Fig. 6 indicates thatthere is a correlation between the two variables. Indeed, thecorrelation coefficient is 0.7469.
We are going to exploit this to build a quality rule. Theidea is to estimate a bivariate normal distribution from the data
●●
●●
●
●
●
●
●●
●
●
●
●
●
●
●
●
●
●
●
●
●
●
●
●
●●
●
●
●●
●
●
●
●
●
●
●
●
●
●
●
●●
●
●
●
●
●
●
●
●
●
●
●
●
●
●
●
●
●
●
●
●
● ●
●●
●
●
●
●
●●
●●
●
●
●
●
●
●
●
●
●
●
●
●
●
●
●
●
●
●●
● ●
●●
●
●
●
●
●
●
●
●●
●
●
●
●
●●
●
●
●
●
●
●
●
●●
●
●
●
●
●
●
●●
●
●●
●
●
●
●
●
●
●
●
●
●
●
●
●
●
●
●
●
●
●●
●
●
●
●
●
●
●
● ●
●
●
●
●
●
●
●
●
●
●
●
●
●
●
●
●
●
●●
●
●
●
●
●
●
●
●
●
●
●●●
●
●
●
●
●
●
●
●
●
●
●
●
●
●
●
●
●●
●
●
●
●●
●
●
●●
●
●
●
●
●
●
●●
●
●
●
●
●
●
●
●
●
●
● ●
●
●
●●
●
●●
●
●
●
●
●
●
●
●
●
●
●
●
●
●
●●
●
●
●●
●
●
●
●
●
●
●●
●
●
●
●
●●●
●
●
●
●●
●
●
●
●
●
●
●●●
●
●
●
●●
●
●
●
●
●
●
●
●
●
●
●
●
● ● ●
●●
●
●
●
●
●
●
● ●
●●
●
●
●
●
●
●
●
●●
●
●
●
●
●
●
●●
●
●
●
●
●
●● ●
●
●
●
●
●
●● ●●
●
●
●
●
●●
●●
●
●
● ●
●
●
●
●
●
●
●
●
●
●
●
●
●
●
●
●
●
●
●
●
0 10 20 30 40 50
5010
015
0
Clothing (count)
Acc
esso
ries
(cou
nt)
Fig. 6. Item sales per day in two categories
●●
●●
●
●
●
●
●●
●
●
●
●
●
●
●
●
●
●
●
●
●
●
●
●
●●
●
●
●●
●
●
●
●
●
●
●
●
●
●
●
●●
●
●
●
●
●
●
●
●
●
●
●
●
●
●
●
●
●
●
●
●
● ●
●●
●
●
●
●
●●
●●
●
●
●
●
●
●
●
●
●
●
●
●
●
●
●
●
●
●●
● ●
●●
●
●
●
●
●
●
●
●●
●
●
●
●
●●
●
●
●
●
●
●
●
●●
●
●
●
●
●
●
●●
●
●●
●
●
●
●
●
●
●
●
●
●
●
●
●
●
●
●
●
●
●●
●
●
●
●
●
●
●
● ●
●
●
●
●
●
●
●
●
●
●
●
●
●
●
●
●
●
●●
●
●
●
●
●
●
●
●
●
●
●●●
●
●
●
●
●
●
●
●
●
●
●
●
●
●
●
●
●●
●
●
●
●●
●
●
●●
●
●
●
●
●
●
●●
●
●
●
●
●
●
●
●
●
●
● ●
●
●
●●
●
●●
●
●
●
●
●
●
●
●
●
●
●
●
●
●
●●
●
●
●●
●
●
●
●
●
●
●●
●
●
●
●
●●●
●
●
●
●●
●
●
●
●
●
●
●●●
●
●
●
●●
●
●
●
●
●
●
●
●
●
●
●
●
● ● ●
●●
●
●
●
●
●
●
● ●
●●
●
●
●
●
●
●
●
●●
●
●
●
●
●
●
●●
●
●
●
●
●
●● ●
●
●
●
●
●
●● ●●
●
●
●
●
●●
●●
●
●
● ●
●
●
●
●
●
●
●
●
●
●
●
●
●
●
●
●
●
●
●
●
0 10 20 30 40 50
5010
015
0
Clothing (count)
Acc
esso
ries
(cou
nt)
1e−04
2e−04
3e−04
4e−04
5e−04
6e−04
7e−04
8e−04
9e−
04
m=16m=8m=0
Fig. 7. Estimated distribution and distance
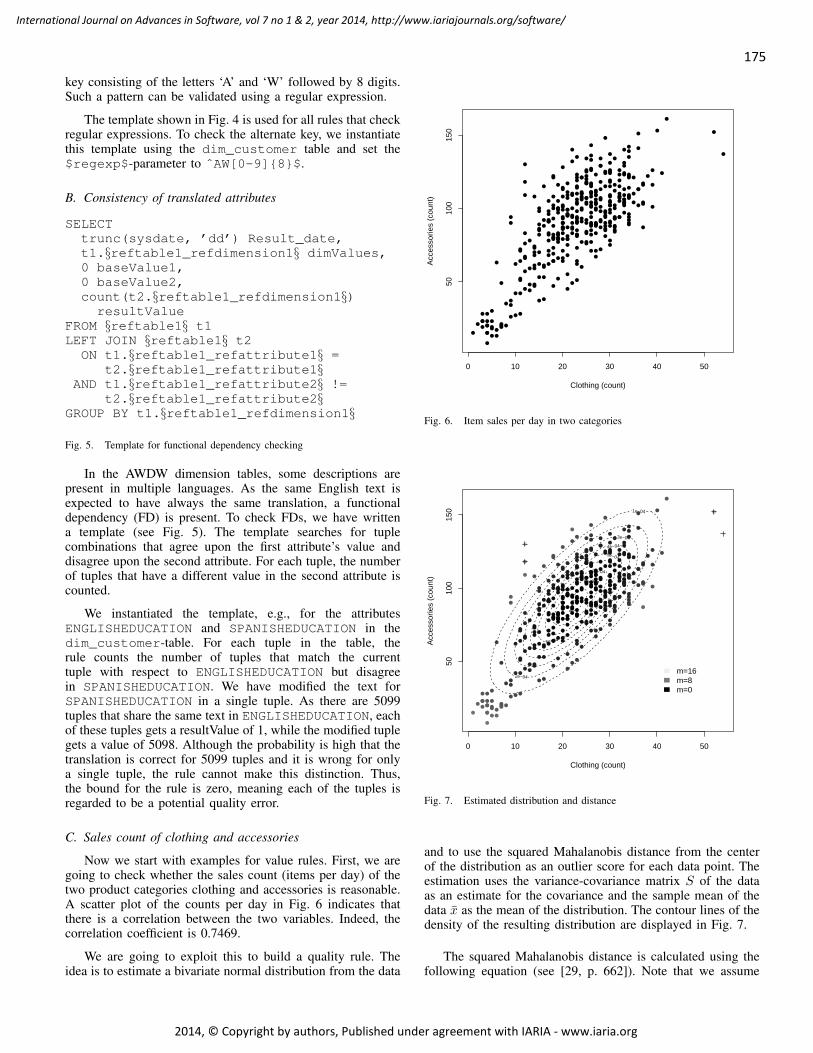
and to use the squared Mahalanobis distance from the centerof the distribution as an outlier score for each data point. Theestimation uses the variance-covariance matrix S of the dataas an estimate for the covariance and the sample mean of thedata x as the mean of the distribution. The contour lines of thedensity of the resulting distribution are displayed in Fig. 7.
The squared Mahalanobis distance is calculated using thefollowing equation (see [29, p. 662]). Note that we assume
175
International Journal on Advances in Software, vol 7 no 1 & 2, year 2014, http://www.iariajournals.org/software/
2014, © Copyright by authors, Published under agreement with IARIA - www.iaria.org

that x is a column vector.
m2 = (x− x)TS−1(x− x) (1)
The distance values are shown in the figure using a grey scale.An important property of the Mahalanobis distance is that ittakes the correlation between the attributes into account. As anexample, the point (40, 153) is not an outlier, while the point(12, 118) is an outlier although it is more close to the center interms of a Euclidean distance. This is because (40, 153) betterfits with the distribution of the data.
SELECT trunc(sysdate, ’dd’) Result_date,key dimValues,x1 baseValue1,x2 baseValue2,msq resultValue
FROM(SELECT (xn1*(xn1*$si11$ + xn2*$si21$) +
xn2*(xn1*$si12$ + xn2*$si22$))msq,x1, x2, key
FROM(SELECT x1-$xm1$ as xn1,
x2-$xm2$ as xn2, x1, x2, keyFROM(SELECT §reftable1_refattribute1§ x1,
§reftable1_refattribute2§ x2,§reftable1_refdimension1§ key
FROM §reftable1§))
)
Fig. 8. Template to calculate Mahalanobis distances
The rule template in Fig. 8 calculates the squared Maha-lanobis distance. It is based on a view c34 that aggregatesthe sales count in both categories on a daily basis. The entriesof S−1 are provided as parameters $si11$, etc. and x isprovided using the parameters $xm1$ and $xm2$.
We instantiated the template and used a bound of 9 on thedistance. So each data point with a distance greater than 9is declared to be suspicious. The corresponding points whichare detected as errors by the rule are marked with a plus inFig. 7. Please note that these errors have to be interpreteddifferently compared to the previous errors. Errors reportedby value rules are unusual values that have to be investigatedfurther by domain experts but do not immediately mean thata data quality issue has been detected.
D. Age distribution of customers
As another example for a value rule, we want to checkwhether the ages of our customers are reasonable. We assumethat the current age distribution is correct and use it asa reference distribution. Our goal is to develop a qualityrule that generates a warning when the distribution changessignificantly. To achieve this, we start by creating a viewthat displays the current age distribution. The view is calledcustomer_age. The distribution initially looks as shownin Fig. 9 (light gray bars labeled “original”). Note that infact the distribution shows that AdventureWork’s customers
98−
88−97
78−87
68−77
58−67
48−57
38−47
28−37
original1st test2nd test
0 1000 2000 3000 4000 5000 6000
Fig. 9. Original age distribution and test modifications
SELECT trunc(sysdate, ’dd’) result_date,1 dimValues,0 baseValue1,0 baseValue2,sum((N1-E1)*(N1-E1)/E1 +
(N2-E2)*(N2-E2)/E2) resultValueFROM (SELECT nvl(N1, 0) N1, nvl(N2, 0) N2,
N1SUM * (nvl(N1, 0) + nvl(N2, 0))/ (N1SUM+N2SUM) E1,
N2SUM * (nvl(N1, 0) + nvl(N2, 0))/ (N1SUM+N2SUM) E2
FROM(SELECT §reftable1_refattribute1§ key,
§reftable1_refattribute2§ N1FROM §reftable1§) D1FULL OUTER JOIN(SELECT §reftable2_refattribute1§ key,
§reftable2_refattribute2§ N2FROM §reftable2§) D2ON (D1.key = D2.key),(SELECT sum(§reftable1_refattribute2§)
N1SUM FROM §reftable1§) N1,(SELECT sum(§reftable2_refattribute2§)
N2SUM FROM §reftable2§) N2)
Fig. 10. Template for χ2 homogeneity test
are quite old, which might already indicate a data qualityproblem. However, we ignore this for the sake of the exampleand assume that the initial distribution is correct.
We now store a snapshot of the view in the tablecustomer_age_ref. This table will serve as a reference forthe current age distribution. Now we can use a χ2 homogeneitytest to see whether the current customer’s ages are similarly
176
International Journal on Advances in Software, vol 7 no 1 & 2, year 2014, http://www.iariajournals.org/software/
2014, © Copyright by authors, Published under agreement with IARIA - www.iaria.org

distributed. The test statistic is defined as follows:
χ2 =
k∑j=1
m∑i=1
(nij − Eij)2
Eij(2)
In this formula, k is the number of samples to be compared.As we have two samples (the reference age distribution vs. thecurrent distribution), we have k = 2. Furthermore, m is thenumber of groups, in our case m = 8 as we have eight agegroups. nij is the number of customers in sample j belongingto age group i. Eij is the expected number of customers insample j in age group i. It is calculated using the margins:
Eij =ni·n·jn
(3)
Here, ni· is the overall number of items in group i in bothsamples and n·j is the size of sample j.
Again, we define a rule template to calculate the statistic.It is shown in Fig. 10.
The result of this statement is the test statistic for the χ2
test. Its value has to be compared with an appropriate quantileof the χ2 distribution: χ2
(k−1)(m−1);0.95 = χ27;0.95 = 14.067.
We use this value as an upper bound. All values above thisone will generate a quality error.
When we initially run the rule, the output is (as expected) 0.This is due to the fact that we compare two identical samples.To test the rule, we first insert 20 customers of age 59. They arein age group 58-67, which already has nearly 2600 customers.The rule now yields a value of 0.066, which is way belowour bound, as expected. Now we start to insert more unusualcustomers of age 99. As we insert 5 of them, the value alreadybecomes 2.33. With 15 more customers of this age, we reach15.418, which generates a quality error.
2006 2007 2008
020
6010
0
whole time series
reve
nue
(T$)
2006 2007
020
6010
0
subseries used for modeling
reve
nue
(T$)
Fig. 11. Daily internet revenue
E. Check the revenue time series
In our final example, we check the overall daily Internetrevenue of the AdventureWorks company. It can be calculatedby aggregating the facts in fact_internet_sales. Again,the underlying idea of the rule is to define a model for the dataand to check that the new data does not contradict the modelsignificantly. For this example, we use the data up to the endof 2006 to define the model and then check the data from 2007on against the model. Fig. 11 shows the complete time seriesand an enlarged plot of the part used for modelling.
In this case, a time series model is appropriate and weuse the ARIMA family of models [30]. These are stochasticmodels that are composed of an auto-regessive part (AR), anintegration part (I), and a moving average part (MA). When theintegration part is present, the differenced time series is usedinstead of the original one. The basis for the series is a seriesof random components. They are assumed to be independentand normally distributed. The AR part captures dependenciesbetween the current value and the preceding values, while theMA part is used to model a moving average of the past randomcomponents.
A first look at the plots indicates that the series is non-stationary, as there seems to be a trend, at least from mid-2007 on. The variance looks fairly large and there is no signof seasonality.
We use the auto.arima function of R to select anappropriate ARIMA model and to estimate the parameters. Theresult is an ARIMA(0,1,2) model. This means that no AR partis present, the original series is differentiated once, and theMA part averages over the past two random components. Thefollowing coefficients are estimated:
yt − yt−1 = et +−1.0012et−1 + 0.0626et−2 (4)
The random components are denoted by et. We can seethat the negative last random value has a huge influence onthe current observation (coefficient -1.0012). The estimatedstandard deviation is s = 7951.597. The AIC value is ratherlarge (11407).
The basic idea of the rule is to use the model to calculateeach day a one step forecast and to check whether the newlyobserved value is within the forecast interval. If it is outside,then we generate an error, as the value is rather unlikely. Forthe forecast, we use equation (4) and set et = 0, as we knownothing about the current random component. The past twovalues et−1 and et−2 are estimated using the past residuals(i.e., the differences between the past forecasts and observedvalues). We denote the residuals with et−1 and et−2. Thisyields the following equation for the point forecast yt:
yt = yt−1 +−1.0012et−1 + 0.0626et−2 (5)
The 95% forecast interval can be computed as yt ± s ∗ 1.96.
In order to build a DCE rule using this model we haveto store the past residuals so that we can access them duringthe current rule execution. We use the DCE repository’s ruleoutcome table for this task. In this way, each day’s run storesthe current residual in the repository. We have to bootstrap therule by feeding at least two residuals in the results table sothat the rule can start to calculate the next forecasts. These
177
International Journal on Advances in Software, vol 7 no 1 & 2, year 2014, http://www.iariajournals.org/software/
2014, © Copyright by authors, Published under agreement with IARIA - www.iaria.org

past residuals are included in the R object generated by theauto.arima function. Currently, we have to store them inthe repository by hand. Later, we plan to automate this task ina profiling phase.
SELECTtrunc(sysdate, ’dd’) Result_date,datekey dimValues,extendedamount baseValue1,0 baseValue2,get_residual(’$checkdate$’) resultValue
FROM daily_revenueWHERE fulldatealternatekey =
to_date(’$checkdate$’, ’YYYY-MM-DD’)
Fig. 12. Rule to check a time series
We implemented the forecast equation (5) as a storedfunction get_residual within the database. The functiononly returns the residual, as this is all we need to checkthe rule bounds and to prepare for the next run of the rule.Using this stored function, the rule’s SQL is quite simple, asshown in Fig. 12. The view daily_revenue calculates dailyaggregates of the internet sales revenue.
The rule uses a parameter $checkdate$ that specifiesthe target date. Each rule run checks a single day. As the ruledepends on the past two runs we have to ensure that the ruleruns every day without omissions.
2007 2008
2040
6080
100
date
reve
nue
(T$)
●●●
●
●●●
●●
●●●
●
●●
●
●
●
●
●●●
●
●
●
●
●●
●
●
●●
●●
●
●
●
●
●
●
●
●
●
●
●
●
●●
●
●●
●
●
●
●
●
●
●
●
●●
●
●
●● ●
●●●
●
●
●
●
●
●●
●
●
●
●
● ●
●
●
●●
●
●
●
●
●
Fig. 13. Prediction intervals and warned values
Fig. 13 shows the second part of the time series and theforecast intervals calculated from the above formula for 95%(dashed) and 99% (dotted). Circles indicate data points thatare outside the 95%; filled circles indicate those that are alsooutside the 99% interval. Depending on the bounds specifiedin the rule, the DCE reports these values.
V. ARCHITECTURE
In this section, we will illustrate the system architecture ofthe current DCE implementation, which is capable of checkingthe previously explained data quality rules. We also show howthe DCE fits into a typical enterprise DWH implementation.Fig. 14 shows an overview of the DCE overall architecture. TheDCE itself is organized as a classical three-tier application. Itinteracts with the enterprise data warehouse system in orderto compute quality indicators. Also, results of the data qualitychecks may be propagated into another external databasesystem, the data quality data mart. This database in itself isalso organized as a data mart and provides long term storageof computed data quality indicators in order to be used forlong term analysis of enterprise wide data quality. In a senseit is a meta-data warehouse for data quality. There is alsoan external scheduling component (typically standard systemscheduling capabilities), which triggers computation of dataquality indicators at previously defined points in time.
Fig. 14. Data checking engine architecture overview
Within the DCE itself the main entry point for data qualitymanagers is the GUI of the DCE web application (shown atthe bottom of Fig. 14). The GUI is used to manage users of theDCE application, to manage data quality rules, and to managedata rule executions. As typically the execution of data qualitychecks is not triggered manually, there is also a command-lineclient library for the rule execution engine that is triggered byan external scheduler. The schedule to be used is managed inthe web application as well.
The main data checking business logic can be found inthe middle tier. This logic is used by the web application
178
International Journal on Advances in Software, vol 7 no 1 & 2, year 2014, http://www.iariajournals.org/software/
2014, © Copyright by authors, Published under agreement with IARIA - www.iaria.org
as described above. Note that there is a strict separationbetween user management, rule management and rule exe-cution management in the middle tier as well. Whereas theuser administration component provides standard functionality,note that the rule management component contains advancedfeatures. For instance the template mechanism described in theprevious section is implemented here.
The execution engine is also managed by the web appli-cation: on the one hand, rules can be manually executed fromthe web application, on the other hand, scheduled executioncan be defined here.
During rule execution, the engine replaces the parametersin the rule’s SQL statement with their current values and thenruns the statement using the target database. Thus, movinglarge amounts of data into the DCE engine is avoided. Theresult of the SQL statement is then further processed. Thisincludes checking the currently applicable bounds and testingtheir severity.
In the execution engine, it is also defined, which rulesare executed on what data warehouse database under whoseprivileges. Note that multiple different data warehouses (ordatabase systems) may be used as source, because the connec-tion information is also managed by the web application.
Note that the performance of the engine itself is notcritical. All rules are finally translated to SQL and executedon the target database. Compared to the execution time of theSQL statement (which perhaps runs on large data sets), thepreparation phase and the interpretation of the results, whichincludes bound checking, is negligible. Thus, the scalabilityof the DCE depends heavily on the scalability of the targetdatabase. In case of performance problems, typical databasetuning options like indexing or materialization of views areused.
Finally, the database layer consists of three separate areas:
• Rule repository, which holds the data quality rules aswell as base templates
• Result repository holding results of rule execution• User database which is used for access management
to only the DCE itself
Once results of the executed data quality rules have beenstored in the result repository they may be propagated to thedata quality data mart that aggregates the results into qualityindicators.
This data mart is not part of the DCE but located withinthe standard DWH infrastructure of the company. Thus, stan-dard interfaces such as reporting and BI tools can be usedto further present and analyze the data quality status. Thisway the additional effort for data quality monitoring can bekept minimal as access to data quality indicators followswell established processes and uses well-known tools, whichare used for regular monitoring of enterprise performanceindicators as well. In addition, the concept of viewing dataquality indicators similar to regular performance indicators isvery fitting, as these have to be tracked accordingly in orderto ensure reliability of data in the data warehouse. Ultimately,this is necessary to make the right entrepreneurial decisionsbased on reliable information.
VI. DATA QUALITY METRICS
The result repository contains large amounts of specificresults that individually describe only a very small fractionof the overall data quality of the DWH. In order to get aquick overview of the quality level, a small set of metricsthat aggregate the rule results is required.
In the literature, there are various approaches to definedata quality indicators, for example [31]. Thus, we decidedto provide a flexible approach that enables the user to defineher own indicator hierarchies. The engine stores indicatordefinition meta data and calculates the resulting indicatorvalues.
An important issue here is to take incremental checks intoaccount. As an example, consider a rule that checks the numberof dimension foreign keys in a fact table that reference adummy instead of a real dimension entry. As the fact tableis large, the daily rule just checks the new fact records loadedin the previous ETL run. Thus, the indicator has to aggregateover the current and past runs to provide an overall view ofthe completeness of the dimension values.
VII. DCE ’LOOK AND FEEL’ IMPRESSIONS
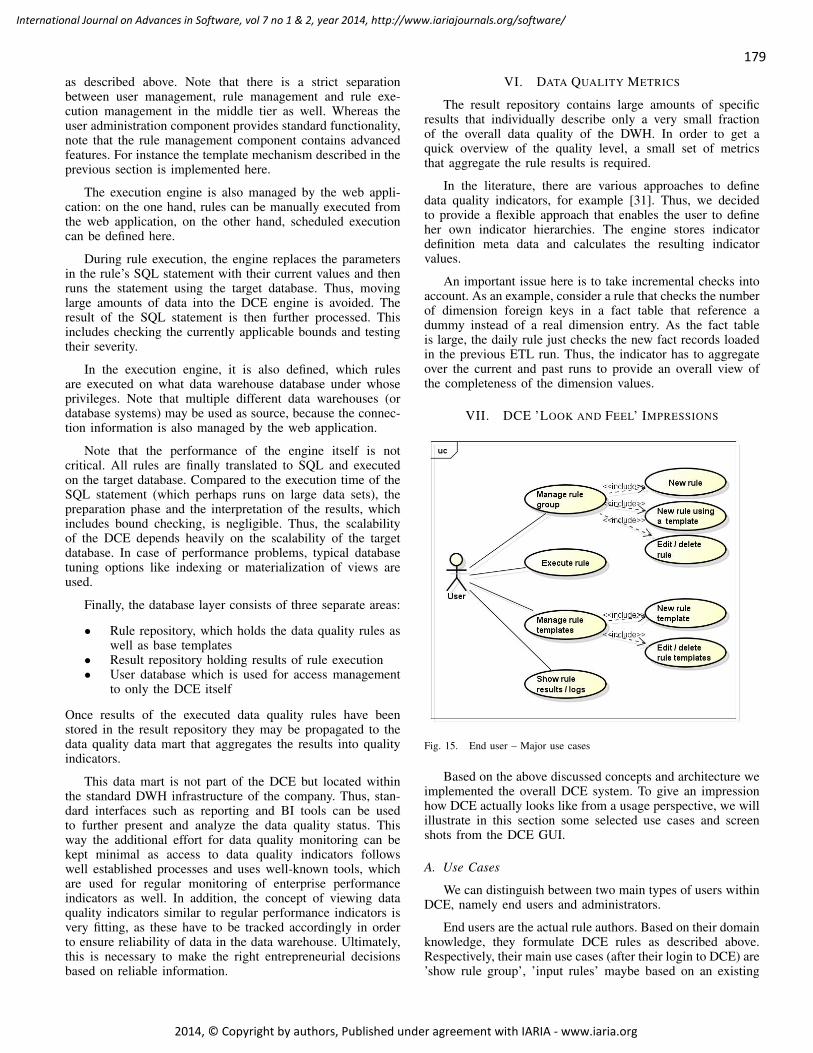
Fig. 15. End user – Major use cases
Based on the above discussed concepts and architecture weimplemented the overall DCE system. To give an impressionhow DCE actually looks like from a usage perspective, we willillustrate in this section some selected use cases and screenshots from the DCE GUI.
A. Use Cases
We can distinguish between two main types of users withinDCE, namely end users and administrators.
End users are the actual rule authors. Based on their domainknowledge, they formulate DCE rules as described above.Respectively, their main use cases (after their login to DCE) are’show rule group’, ’input rules’ maybe based on an existing
179
International Journal on Advances in Software, vol 7 no 1 & 2, year 2014, http://www.iariajournals.org/software/
2014, © Copyright by authors, Published under agreement with IARIA - www.iaria.org

Fig. 16. User’s central menu
Fig. 17. User’s rule insert / edit screen
one, ’edit rule’, and ’show rule results’. As explained, rulescould be based on rule templates. The main use cases areillustrated in Fig. 15.
Administrators have as their main responsibilities the man-agement of user accounts, database connections, and generalsettings.
Fig. 18. Execution results 1
Fig. 19. Execution results 2
B. Screen Shots
To give an impression of the ’look and feel’ of the DCEGUI, we show a few screen shots here.
Fig. 16 shows the central menu options for a DCE enduser, namely rule and template management, rule execution,execution results inspection, and edit user account.
A typical DCE end user task is the insertion of new rules.Fig. 17 shows the corresponding screen, which allows a DCEend user to edit new rules.
Two typical result screens from rule execution are shown inFig. 18 and Fig. 19. In Fig. 19 results from failed rule checks(errors) are shown as well.
In addition, further options exist, e. g., to edit rule tem-plates, to group rules, and options for administrators as well.
VIII. CONCLUSION AND FUTURE WORK
In this paper, we have presented a motivation why complexdata quality rules are required in most practical enterpriseapplication scenarios. We have developed a rule definitionlanguage with a two-stage templating mechanism in order tobe able to express most of these rules for SQL-based datasources. The language along with the templating mechanismis both powerful enough to express complex rules as well assimple enough to be used by domain experts in practice. Thishas been proven by a prototypical implementation based on thedescribed architecture. This tool has been validated by inter-viewing teams of different DWH projects and building projectspecific prototypical setups in a real world environment. Ourengine has been able to support their quality monitoringrequirements. Especially, the flexibility in rule definition wasappreciated. We have not only detected quality problems ontuple level but also more complex issues, e.g., checking thetrend of indicators stored in a fact table. As expected, ourtemplate mechanism has proven to be an important way tosimplify rule definition.
The engine keeps a comprehensive history of rule resultsand rule meta data, which allows to monitor data quality overtime and to check whether quality improvement projects weresuccessful. This quality data is exposed to external BI tools for
180
International Journal on Advances in Software, vol 7 no 1 & 2, year 2014, http://www.iariajournals.org/software/
2014, © Copyright by authors, Published under agreement with IARIA - www.iaria.org

reporting and further analysis. This integration of quality datainto tools for further analysis will be significantly improvedand simplified in the future. We aim to provide semi-automatedaggregation features that provide the data quality manager inan enterprise with a set of traffic lights on a dashboard-likeportal in order to get an impression of the overall data qualityquickly and easily.
An important consequence of the flexibility of our approachis that the DCE can also be used during DWH/ETL develop-ment to test the result processes. The testing rules developedduring this project phase may also be used during normaloperation later on, reducing the overall cost of data quality.Practical experiences with this kind of dual use of rules willbe gathered in the future. An advantage of this approach mightbe an improved quality of the quality rules themselves as theirdefinition will be based on thoroughly developed concepts.
Our approach is currently working on any relationaldatabase system. In the future, we plan to also integratedata in other data sources such as Big Data systems likeHadoop and other NoSQL database systems, as more andmore relevant data will be stored there. Thus, data qualityshould be monitored there as well. As there is currently nouniversal query language standard like SQL in the relationalsector, we will have to devise a flexible way to cope withvarious rule definition languages and/or define a generic ruledefinition language together with automated translations intothe languages of the source systems.
We will also work further on the process of determiningquality rules. For newly defined rules the data quality managerfaces the issue that it is difficult to determine whether there isan actual data quality problem or an inaccuracy in the rule.Consequently, we plan to further explore the possibility tosemi-automatically derive data quality rules by advanced dataprofiling methods. These may even be enhanced by integratingdata mining processes.
Finally, there is still a need for even more advanced dataquality rules that are based on more sophisticated statisticalmodels (both static and dynamic) as well as multi-variate timeseries data. While basic ideas for this have been presented inSection IV, in the future we would like to extend this approachand also reduce the manual effort by semi-automated steps.
REFERENCES
[1] F. Heine, C. Kleiner, A. Koschel, and J. Westermayer, “The datachecking engine: Monitoring data quality,” in DATA ANALYTICS 2013,The Second International Conference on Data Analytics, 2013, pp. 7–10.
[2] S. Sadiq, Ed., Handbook of Data Quality, 1st ed. Springer, 2013.[3] W. Fan and F. Geerts, Foundations of Data Quality Management,
ser. Synthesis Lectures on Data Management. Morgan & ClaypoolPublishers, 2012.
[4] C. Batini and M. Scannapieco, Data Quality: Concepts, Methodologiesand Techniques, 1st ed. Springer, 2006.
[5] J. Olson, Data Quality. The Accuracy Dimension. Morgan Kaufmann,2002.
[6] R. Kimball and J. Caserta, The data warehouse ETL toolkit. Wiley,2004.
[7] L. Bertossi and L. Bravo, Handbook of Data Quality, 1st ed. Springer,2013, ch. Generic and Declarative Approaches to Data Quality Man-agement, pp. 181–211.
[8] P. Z. Yeh and C. A. Puri, “An efficient and robust approach fordiscovering data quality rules,” in 22nd International Conference onTools with Artificial Intelligence, 2010.
[9] F. Chiang and R. J. Miller, “Discovering data quality rules,” in Pro-ceedings of the VLDB 08, 2008.
[10] I. P. Fellegi and D. Holt, “A systematic approach to automatic edit andimputation,” Journal of the American Statistical Association, vol. 71,no. 353, pp. 17–35, 1976.
[11] W. Fan, J. Li, S. Ma, N. Tang, and W. Yu, “Towards certainfixes with editing rules and master data,” The VLDB Journal,vol. 21, no. 2, pp. 213–238, Apr. 2012. [Online]. Available:http://dx.doi.org/10.1007/s00778-011-0253-7
[12] S. Song and L. Chen, “Differential dependencies: Reasoningand discovery,” ACM Transactions on Database Systems,vol. 36, no. 3, pp. 16:1–16:41, Aug. 2011. [Online]. Available:http://doi.acm.org/10.1145/2000824.2000826
[13] S. Bruggemann, “Addressing internal consistency with multidimen-sional conditional functional dependencies,” in International Conferenceon Management of Data COMAD 2010, Nagpur, India, 2010.
[14] F. Korn, S. Muthukrishnan, and Y. Zhu, “Checks and balances: Monitor-ing data quality problems in network traffic databases,” in Proceedingsof the 29th VLDB Conference, Berlin, 2003.
[15] M. L. Lee, T. W. Ling, and W. L. Low, “Intelliclean: A knowledge-basedintelligent data cleaner,” in ACM SIGKDD, Boston, 2000, 2000.
[16] W. Fan, H. Gao, X. Jia, J. Li, and S. Ma, “Dynamic constraints forrecord matching,” The VLDB Journal, vol. 20, pp. 495–520, 2011.
[17] A. K. Elmagarmid, P. G. Ipeirotis, and V. S. Verykios, “Duplicaterecord detection: A survey,” IEEE Transactions on Knowledge and DataEngineering, vol. 19, 2007.
[18] K. Sattler, S. Conrad, and G. Saake, “Adding conflict resolutionfeatures to a query language for database federations,” in Proc. 3ndInt. Workshop on Engineering Federated Information Systems, EFIS’00,Dublin, Ireland, June, 2000, pp. 41–52.
[19] J. Barateiro and H. Galhardas, “A survey of data quality tools,”Datenbank-Spektrum, vol. 14, 2005.
[20] F. Naumann, “Data profiling revisited,” SIGMOD Record, 2013.[21] V. Chandola, A. Banerjee, and V. Kumar, “Anomaly detection: A
survey,” ACM Comput. Surv., vol. 41, no. 3, pp. 15:1–15:58, Jul. 2009.[Online]. Available: http://doi.acm.org/10.1145/1541880.1541882
[22] C. C. Aggarwal, Outlier Analysis. Springer, 2013.[23] K. Yamanishi and J. Takeuchi, “A unifying framework for detecting
outliers and change points from non-stationary time series data,” inProceedings of the Eighth ACM SIGKDD-02, 2002.
[24] C. S. Hilas, I. T. Rekanos, S. K. Goudos, P. A. Mastorocostas, andJ. N. Sahalos, “Level change detection in time series using higherorder statistics,” in 16th International Conference on Digital SignalProcessing, 2009.
[25] S. Sarawagi, R. Agrawal, and N. Megiddo, “Discovery-driven explo-ration of olap data cubes,” in Advances in Database Technology —EDBT’98, 1998.
[26] E. Muller, M. Schiffer, and T. Seidl, “Statistical selection of relevantsubspace projections for outlier ranking,” in 27th IEEE InternationalConference on Data Engineering (ICDE), 2011.
[27] C. Ordonez and Z. Chen, “Evaluating statistical tests on olap cubesto compare degree of disease,” IEEE Transactions on InformationTechnology in Biomedicine, vol. 13, no. 5, 2009.
[28] Microsoft. (2014, Feb) Microsoft sql server database product samples.[Online]. Available: http://msftdbprodsamples.codeplex.com
[29] P.-N. Tan, M. Steinbach, and V. Kumar, Introduction to Data Mining.Pearson, 2006.
[30] A. C. Harvey, Time Series Models. Pearson Education, 1993.[31] B. Heinrich, M. Kaiser, and M. Klier, “Metrics for measuring data
quality - foundations for an economic oriented management of dataquality,” in Proceedings of the 2nd International Conference on Soft-ware and Data Technologies (ICSOFT). INSTICC/Polytechnic Instituteof Setubal, J. Filipe, B. Shishkov, and M. Helfert, Eds., 2007.
181
International Journal on Advances in Software, vol 7 no 1 & 2, year 2014, http://www.iariajournals.org/software/
2014, © Copyright by authors, Published under agreement with IARIA - www.iaria.org