Embed Size (px)
Citation preview
The Current State of Connecticut’s
Transportation SystemJune 19, 2019
Commissioner Joseph Giulietti
Transportation Network in Connecticut
• 3719 Centerline Miles of State-Maintained
Roadways
• 103 Miles of State-Owned Rail Service
• CTtransit Bus in 8 Service Areas
• 488 Highway Buildings – CTDOT Owned
• 2783 Traffic Signals
• 4016 Roadway Bridges
Other State Assets Include:
• 263,000 Signs
• Pavement Markings
• 163 Million LF of
Line Striping
• 2.2 Million SF of
Symbol and
Legends
• 1625 Overhead Sign
Supports
• 600 Busses
• 486 M8s & Rail Cars
• 28 Locomotives
• Service to 51
Rail Stations
2
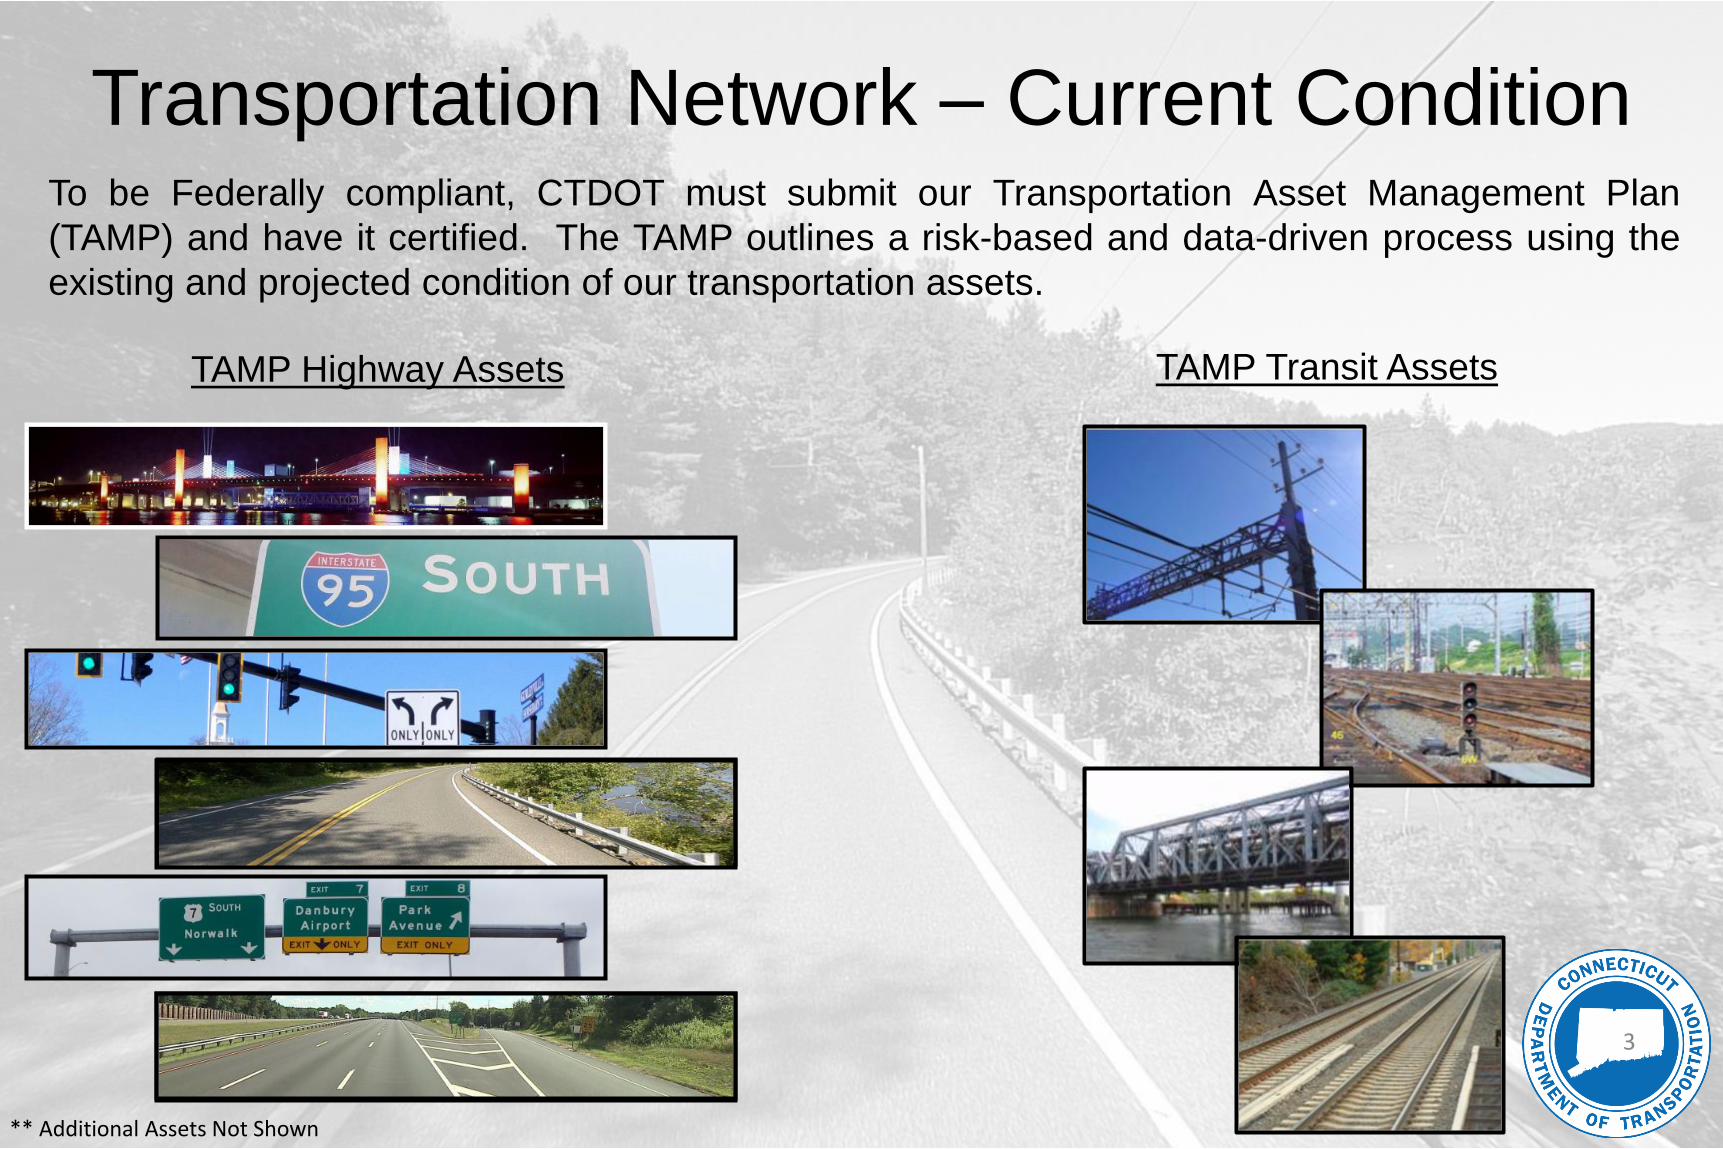
TAMP Highway Assets TAMP Transit Assets
Transportation Network – Current ConditionTo be Federally compliant, CTDOT must submit our Transportation Asset Management Plan
(TAMP) and have it certified. The TAMP outlines a risk-based and data-driven process using the
existing and projected condition of our transportation assets.
** Additional Assets Not Shown
3
Transportation Network – Current Condition
CT – Building Boom
in 1950s and 1960s
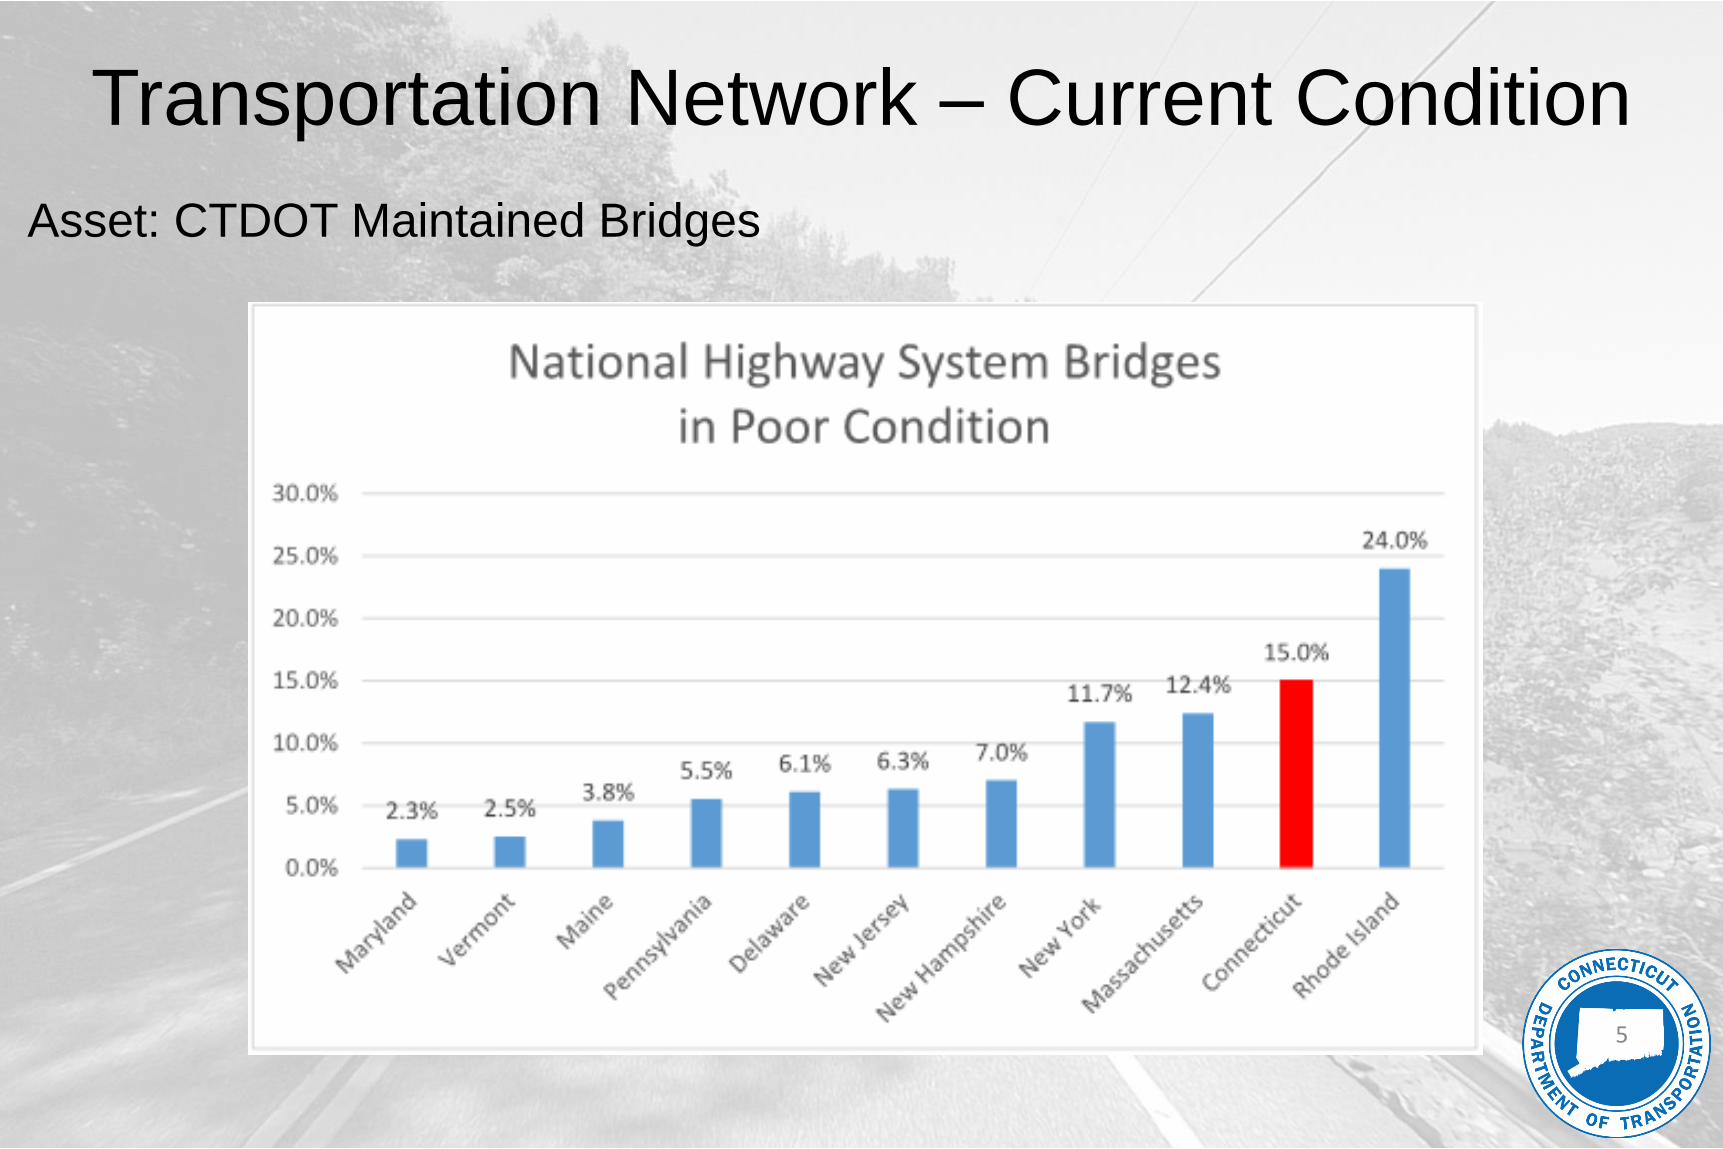
Below National
Numbers from
1970s to Today
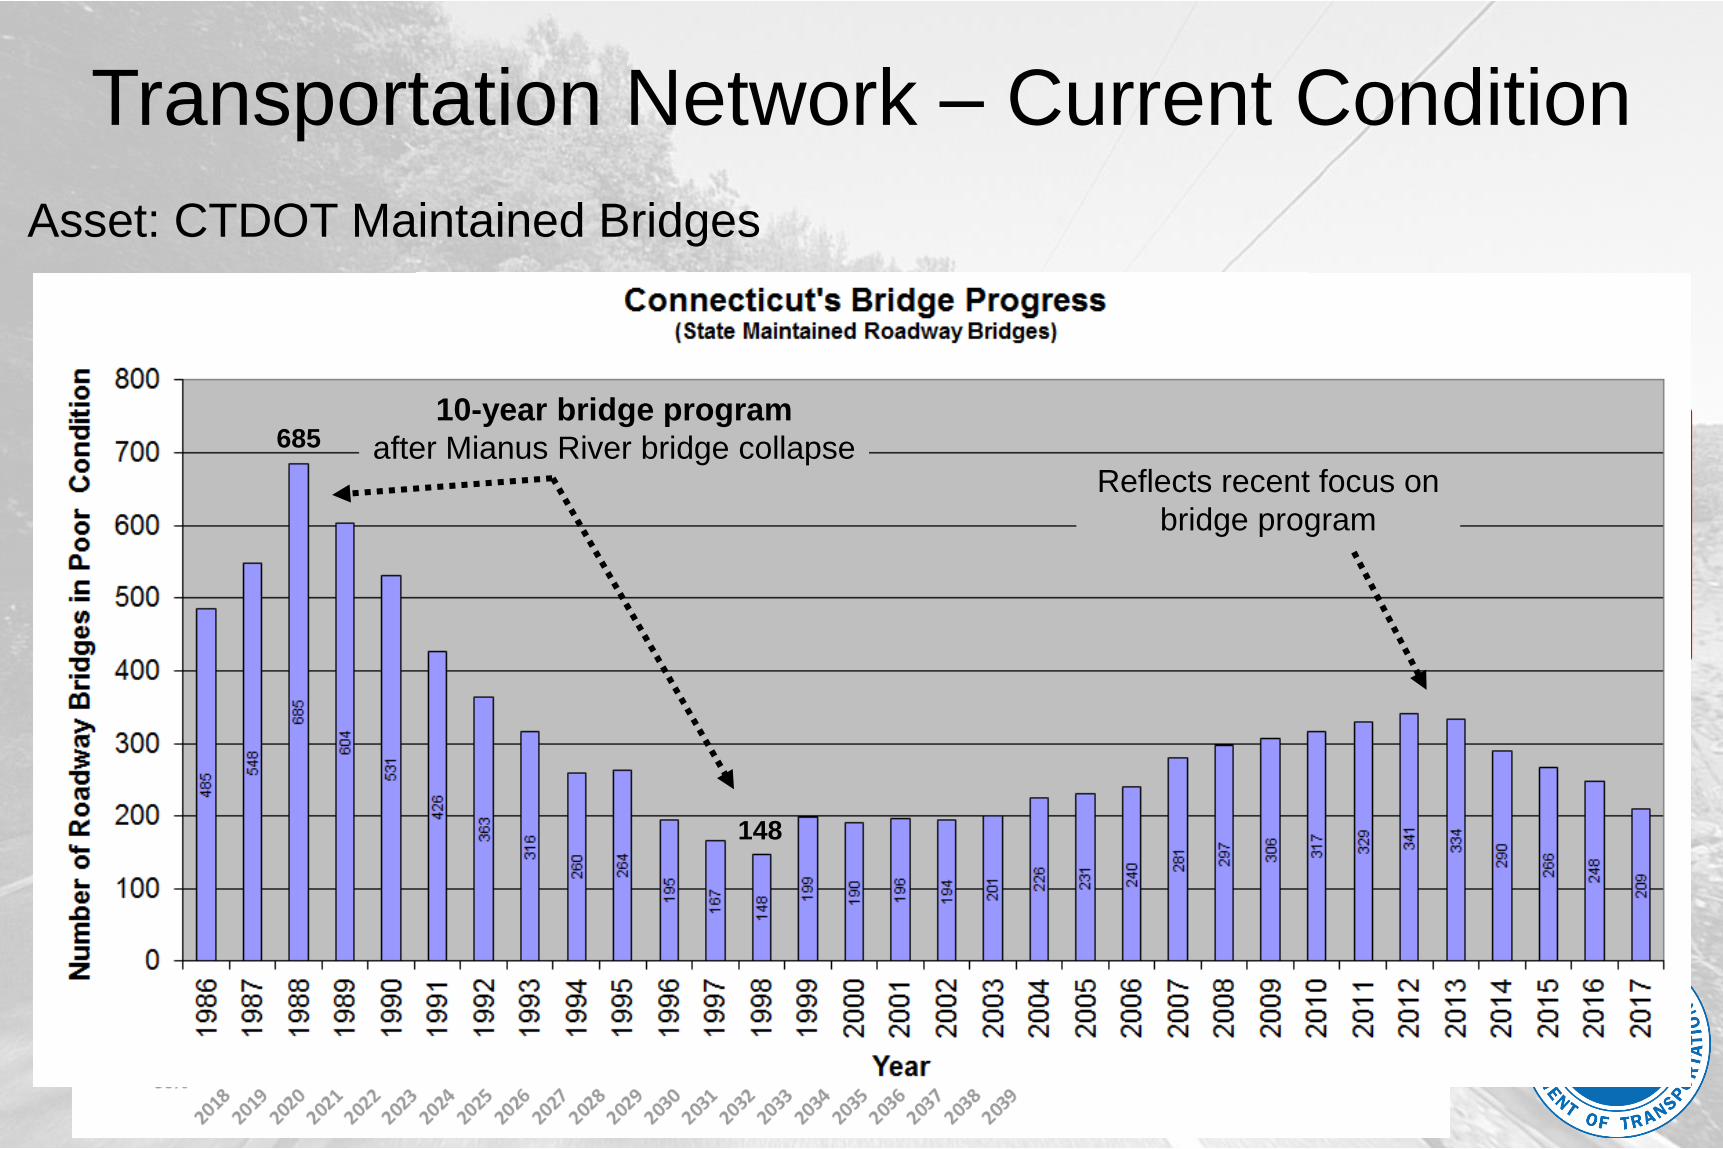
Asset: CTDOT Maintained Bridges
Difference of
362 Bridges at a
SOGR in 2039
Current Funding = below
Goal by 2030
Preferred Funding = Maintain
Goal through 2039
$650 Million
Per Year
Preferred
~70% of State
Maintained Bridges
were Built Before 1970
4
685
148
10-year bridge program
after Mianus River bridge collapseReflects recent focus on
bridge program
5
Transportation Network – Current Condition
Asset: CTDOT Maintained Bridges
5
Transportation Network – Current Condition
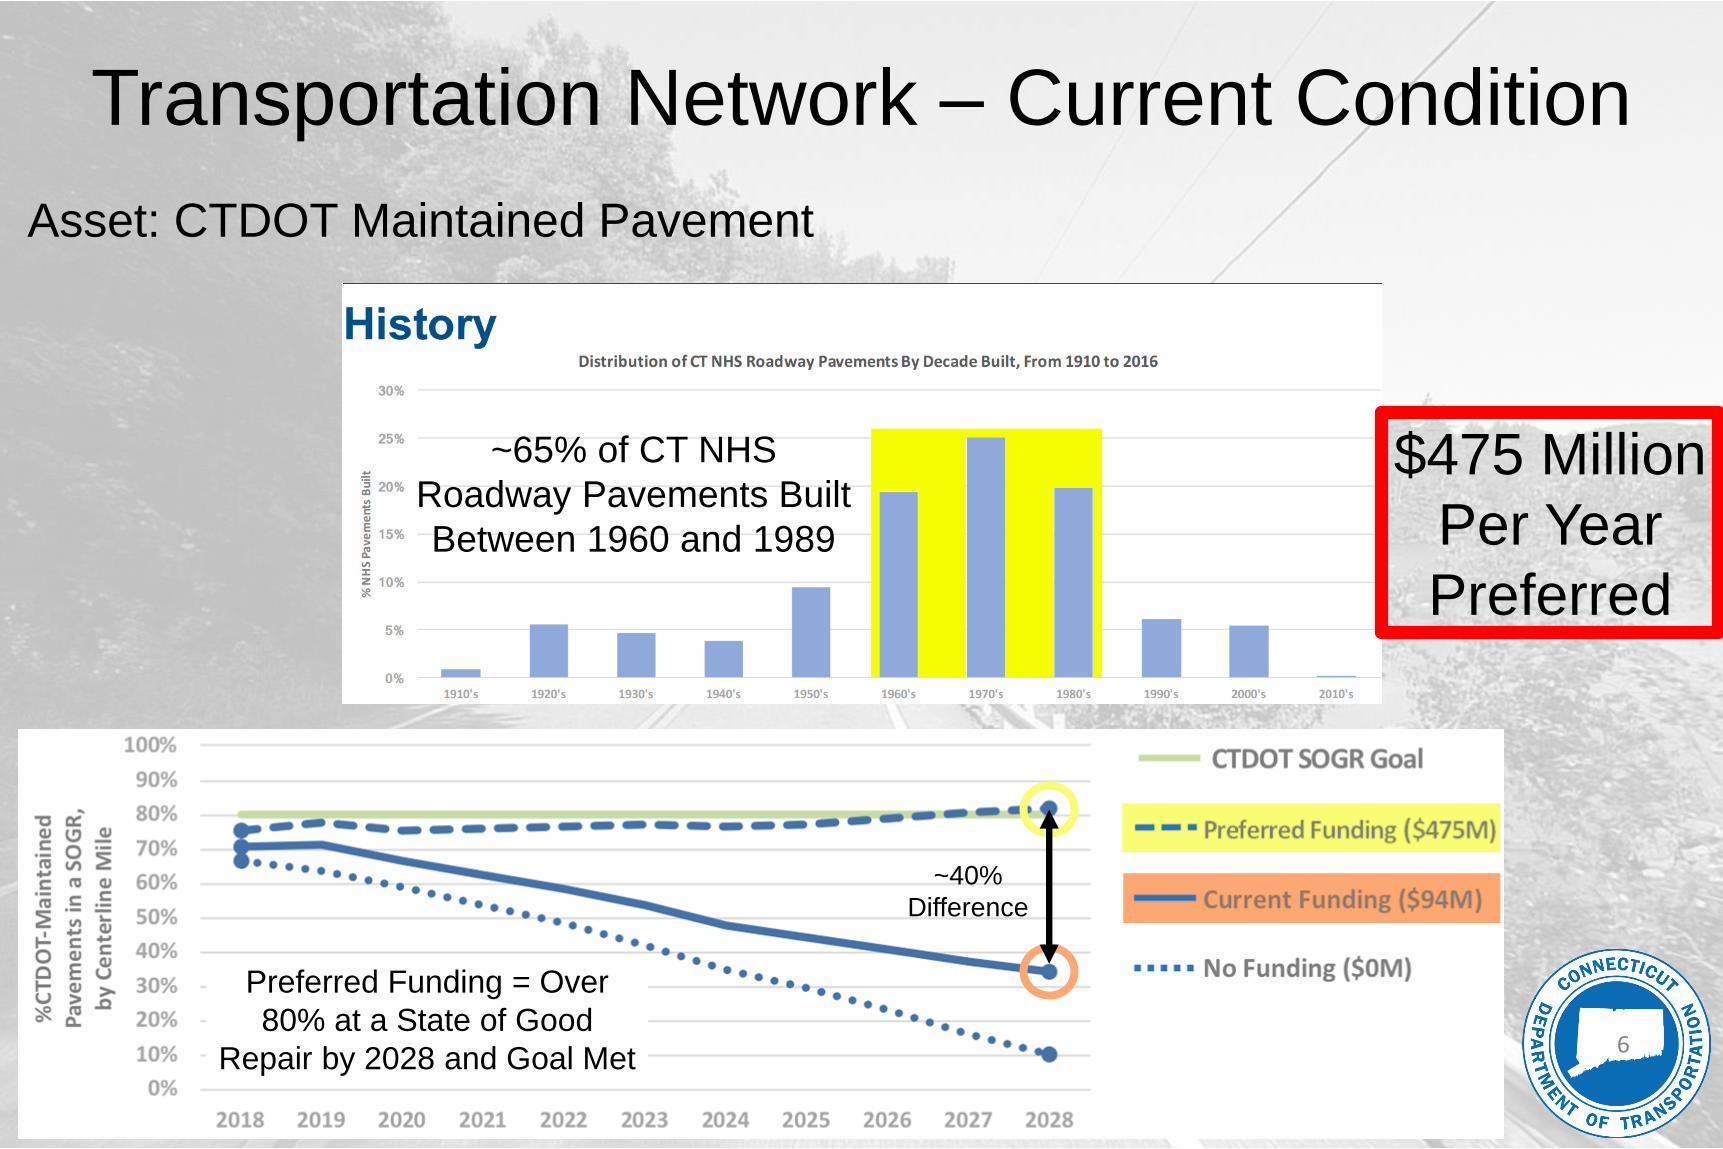
Asset: CTDOT Maintained Pavement
~65% of CT NHS
Roadway Pavements Built
Between 1960 and 1989
Current Funding = Less Than
40% at a State of Good
Repair by 2028
Preferred Funding = Over
80% at a State of Good
Repair by 2028 and Goal Met
~40%
Difference
$475 Million
Per Year
Preferred
6
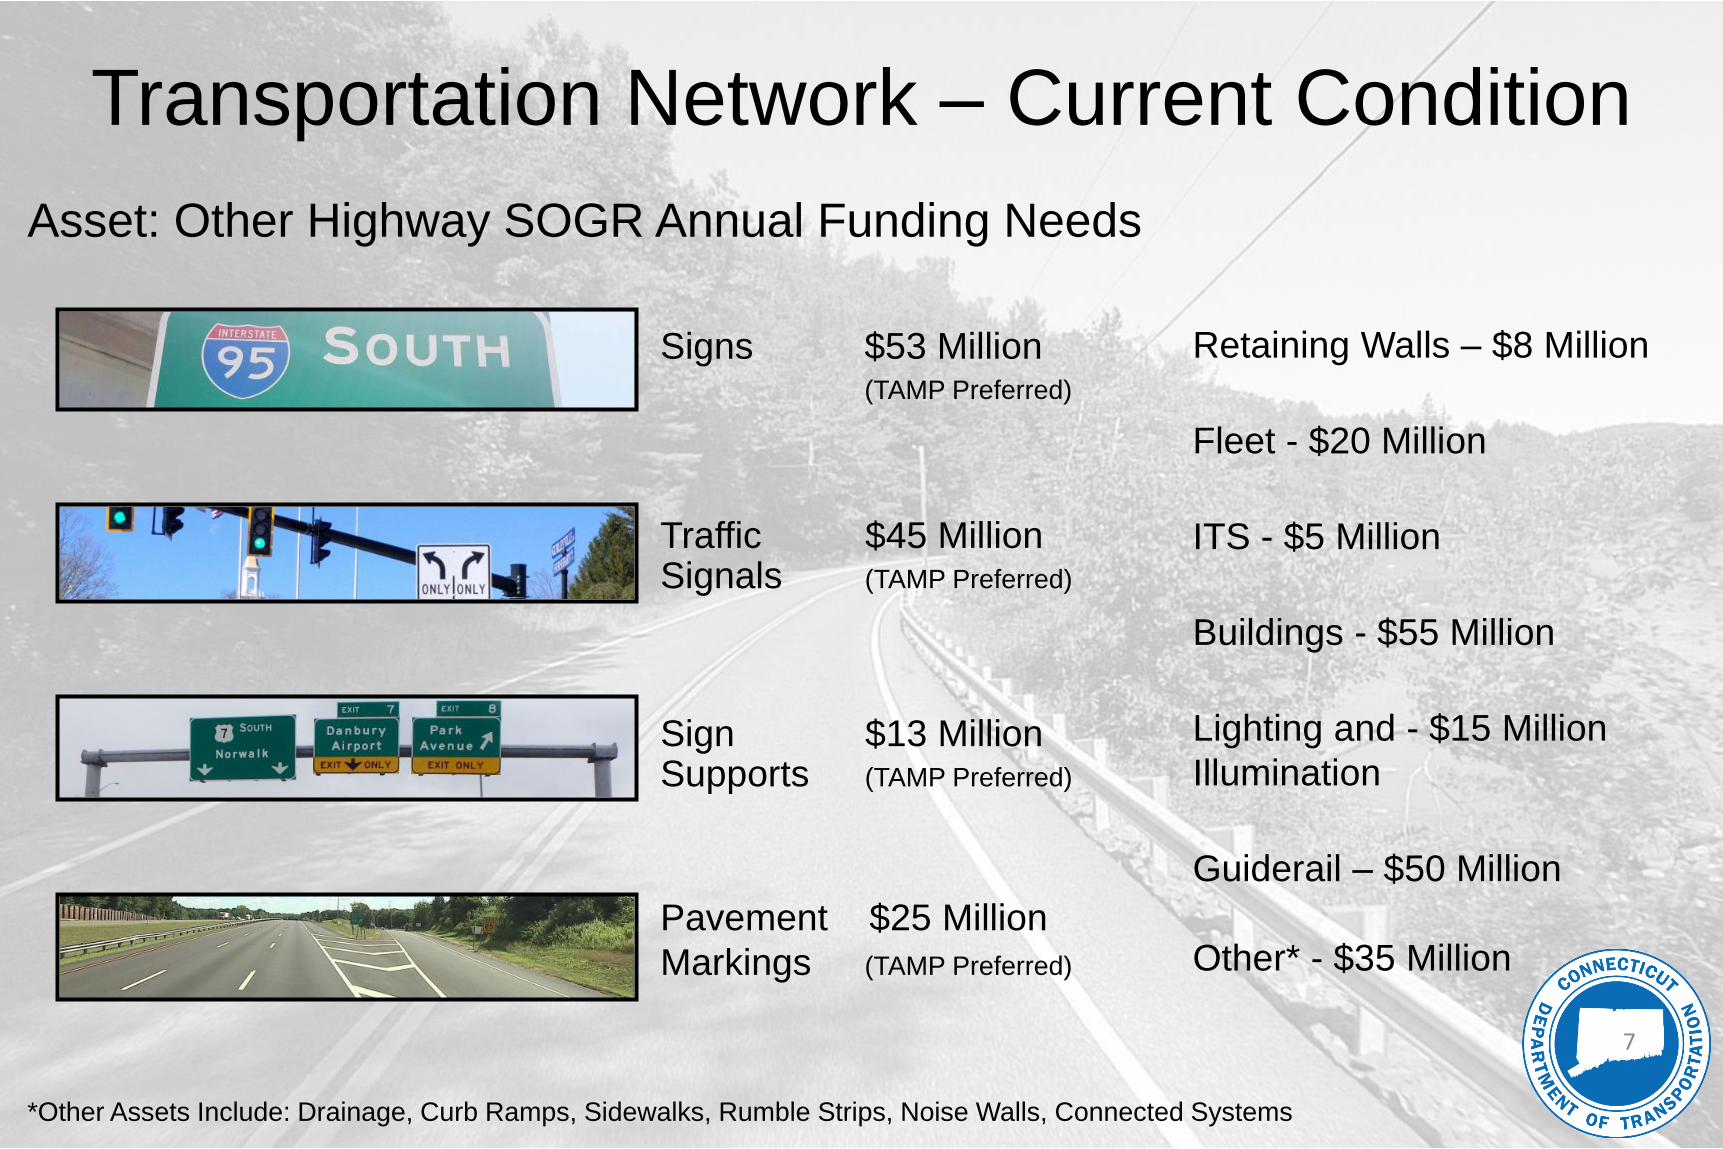
Transportation Network – Current Condition
Asset: Other Highway SOGR Annual Funding Needs
Signs $53 Million (TAMP Preferred)
Sign $13 Million Supports (TAMP Preferred)
Pavement $25 Million
Markings (TAMP Preferred)
Traffic $45 Million Signals (TAMP Preferred)
Retaining Walls – $8 Million
Fleet - $20 Million
ITS - $5 Million
Buildings - $55 Million
Lighting and - $15 Million
Illumination
Guiderail – $50 Million
Other* - $35 Million
7
*Other Assets Include: Drainage, Curb Ramps, Sidewalks, Rumble Strips, Noise Walls, Connected Systems
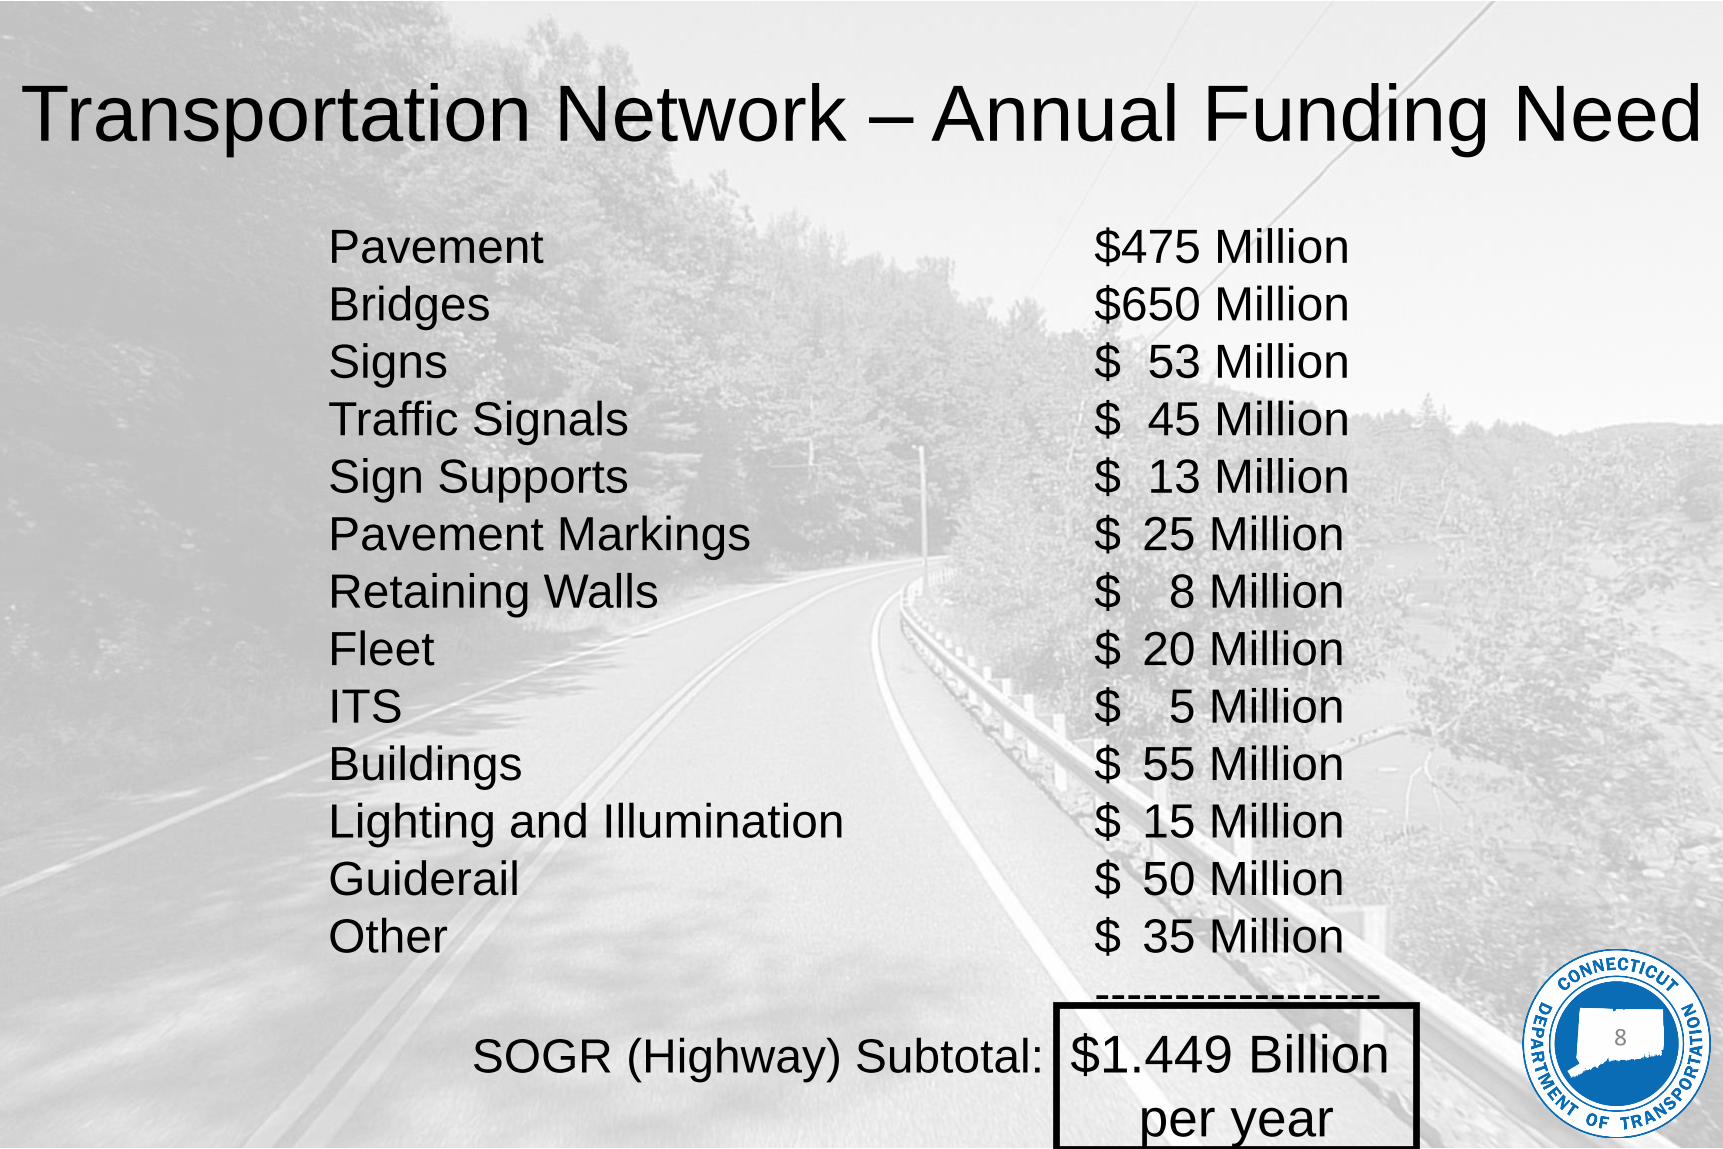
Pavement $475 Million
Bridges $650 Million
Signs $ 53 Million
Traffic Signals $ 45 Million
Sign Supports $ 13 Million
Pavement Markings $ 25 Million
Retaining Walls $ 8 Million
Fleet $ 20 Million
ITS $ 5 Million
Buildings $ 55 Million
Lighting and Illumination $ 15 Million
Guiderail $ 50 Million
Other $ 35 Million
------------------
SOGR (Highway) Subtotal: $1.449 Billion
per year
Transportation Network – Annual Funding Need
8
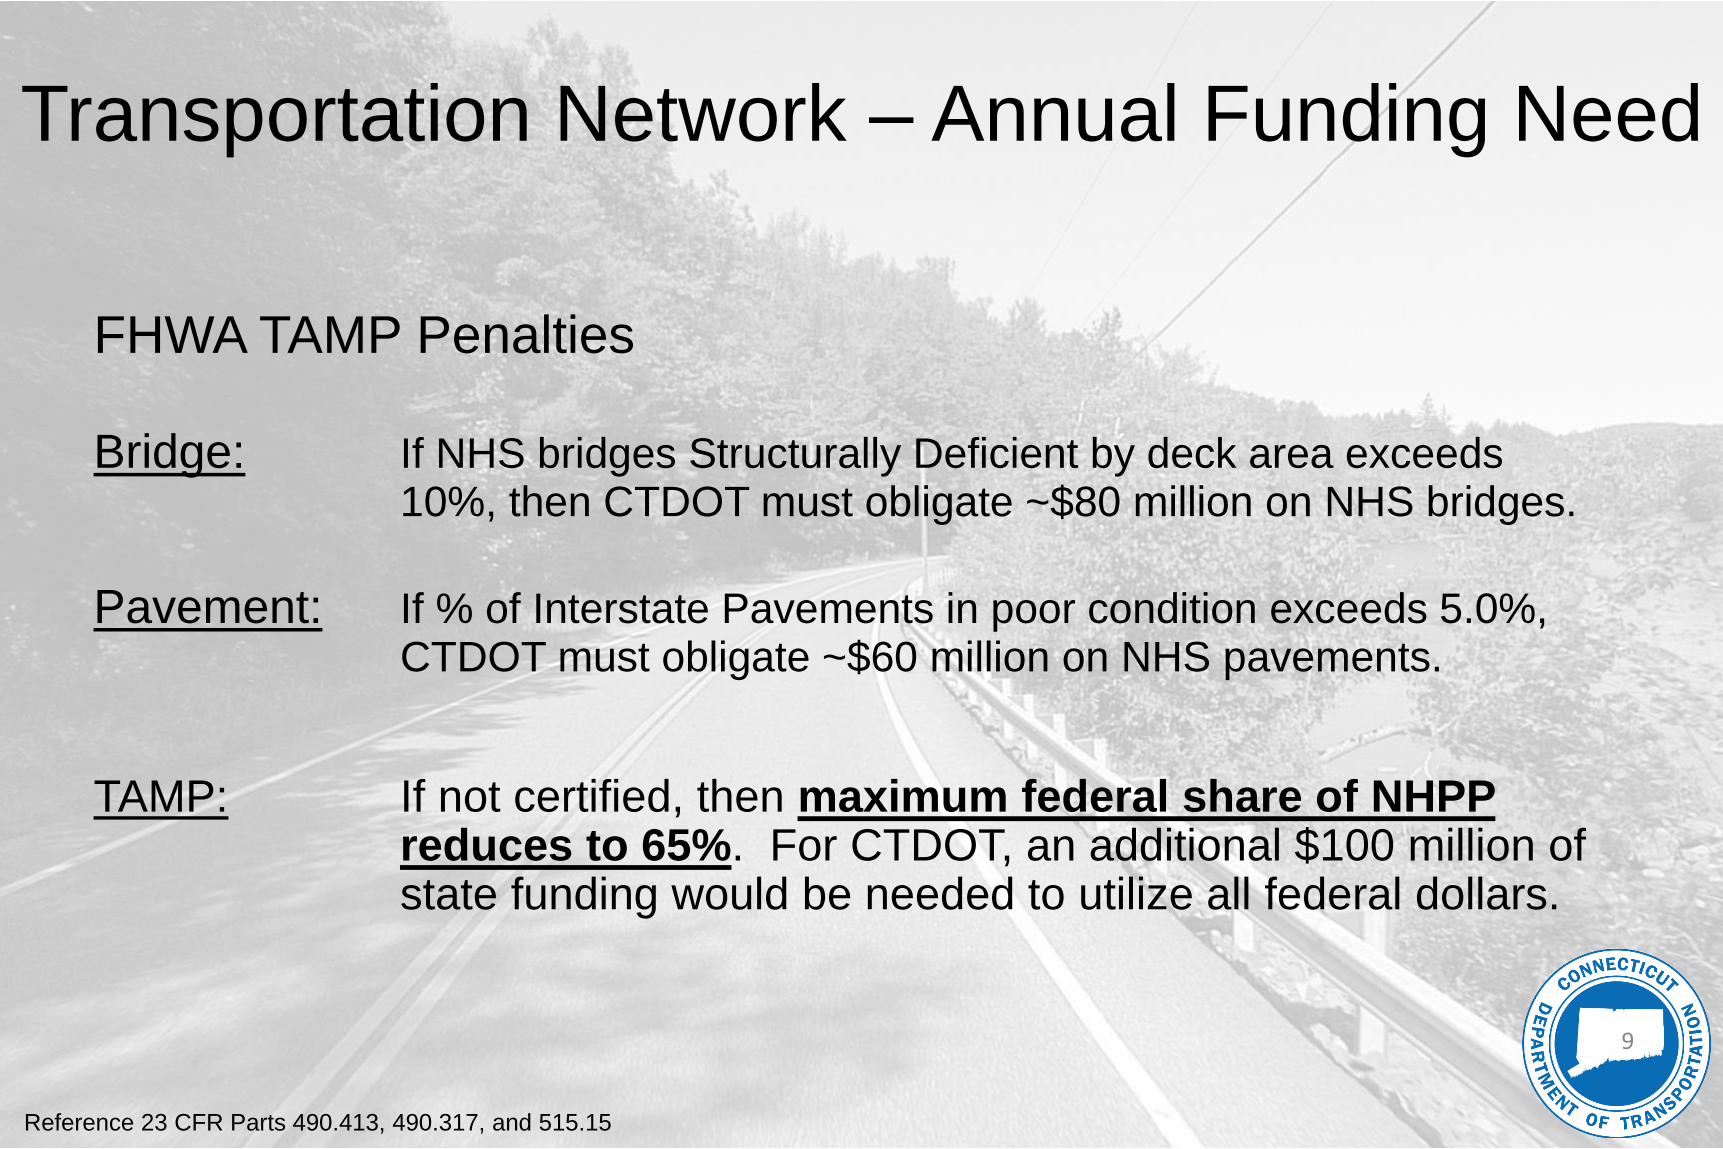
• Penalty slideFHWA TAMP Penalties
Bridge: If NHS bridges Structurally Deficient by deck area exceeds 10%, then CTDOT must obligate ~$80 million on NHS bridges.
Pavement: If % of Interstate Pavements in poor condition exceeds 5.0%, CTDOT must obligate ~$60 million on NHS pavements.
TAMP: If not certified, then maximum federal share of NHPPreduces to 65%. For CTDOT, an additional $100 million of state funding would be needed to utilize all federal dollars.
Transportation Network – Annual Funding Need
9
Reference 23 CFR Parts 490.413, 490.317, and 515.15
• Penalty slide
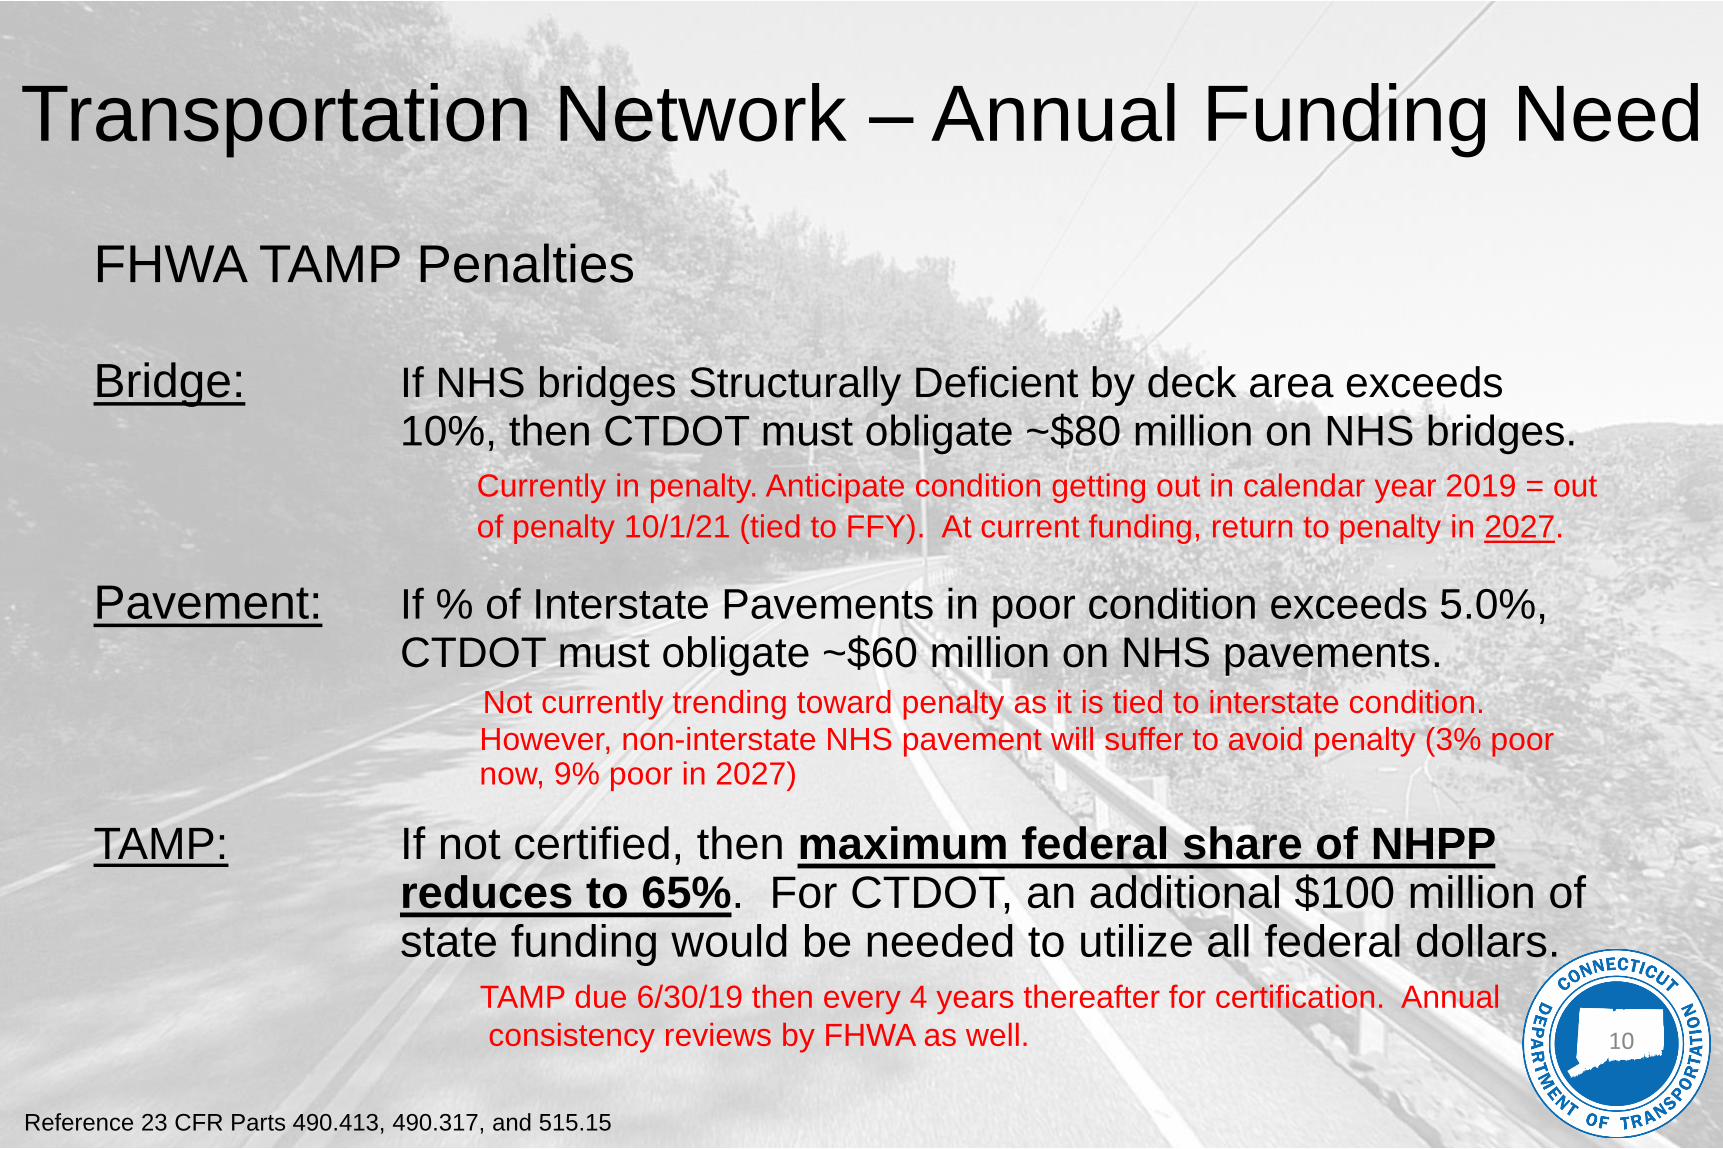
FHWA TAMP Penalties
Bridge: If NHS bridges Structurally Deficient by deck area exceeds 10%, then CTDOT must obligate ~$80 million on NHS bridges.
Currently in penalty. Anticipate condition getting out in calendar year 2019 = out
of penalty 10/1/21 (tied to FFY). At current funding, return to penalty in 2027.
Pavement: If % of Interstate Pavements in poor condition exceeds 5.0%, CTDOT must obligate ~$60 million on NHS pavements.
Not currently trending toward penalty as it is tied to interstate condition. However, non-interstate NHS pavement will suffer to avoid penalty (3% poor now, 9% poor in 2027)
TAMP: If not certified, then maximum federal share of NHPPreduces to 65%. For CTDOT, an additional $100 million of state funding would be needed to utilize all federal dollars.
TAMP due 6/30/19 then every 4 years thereafter for certification. Annual
consistency reviews by FHWA as well.
Transportation Network – Annual Funding Need
10
Reference 23 CFR Parts 490.413, 490.317, and 515.15
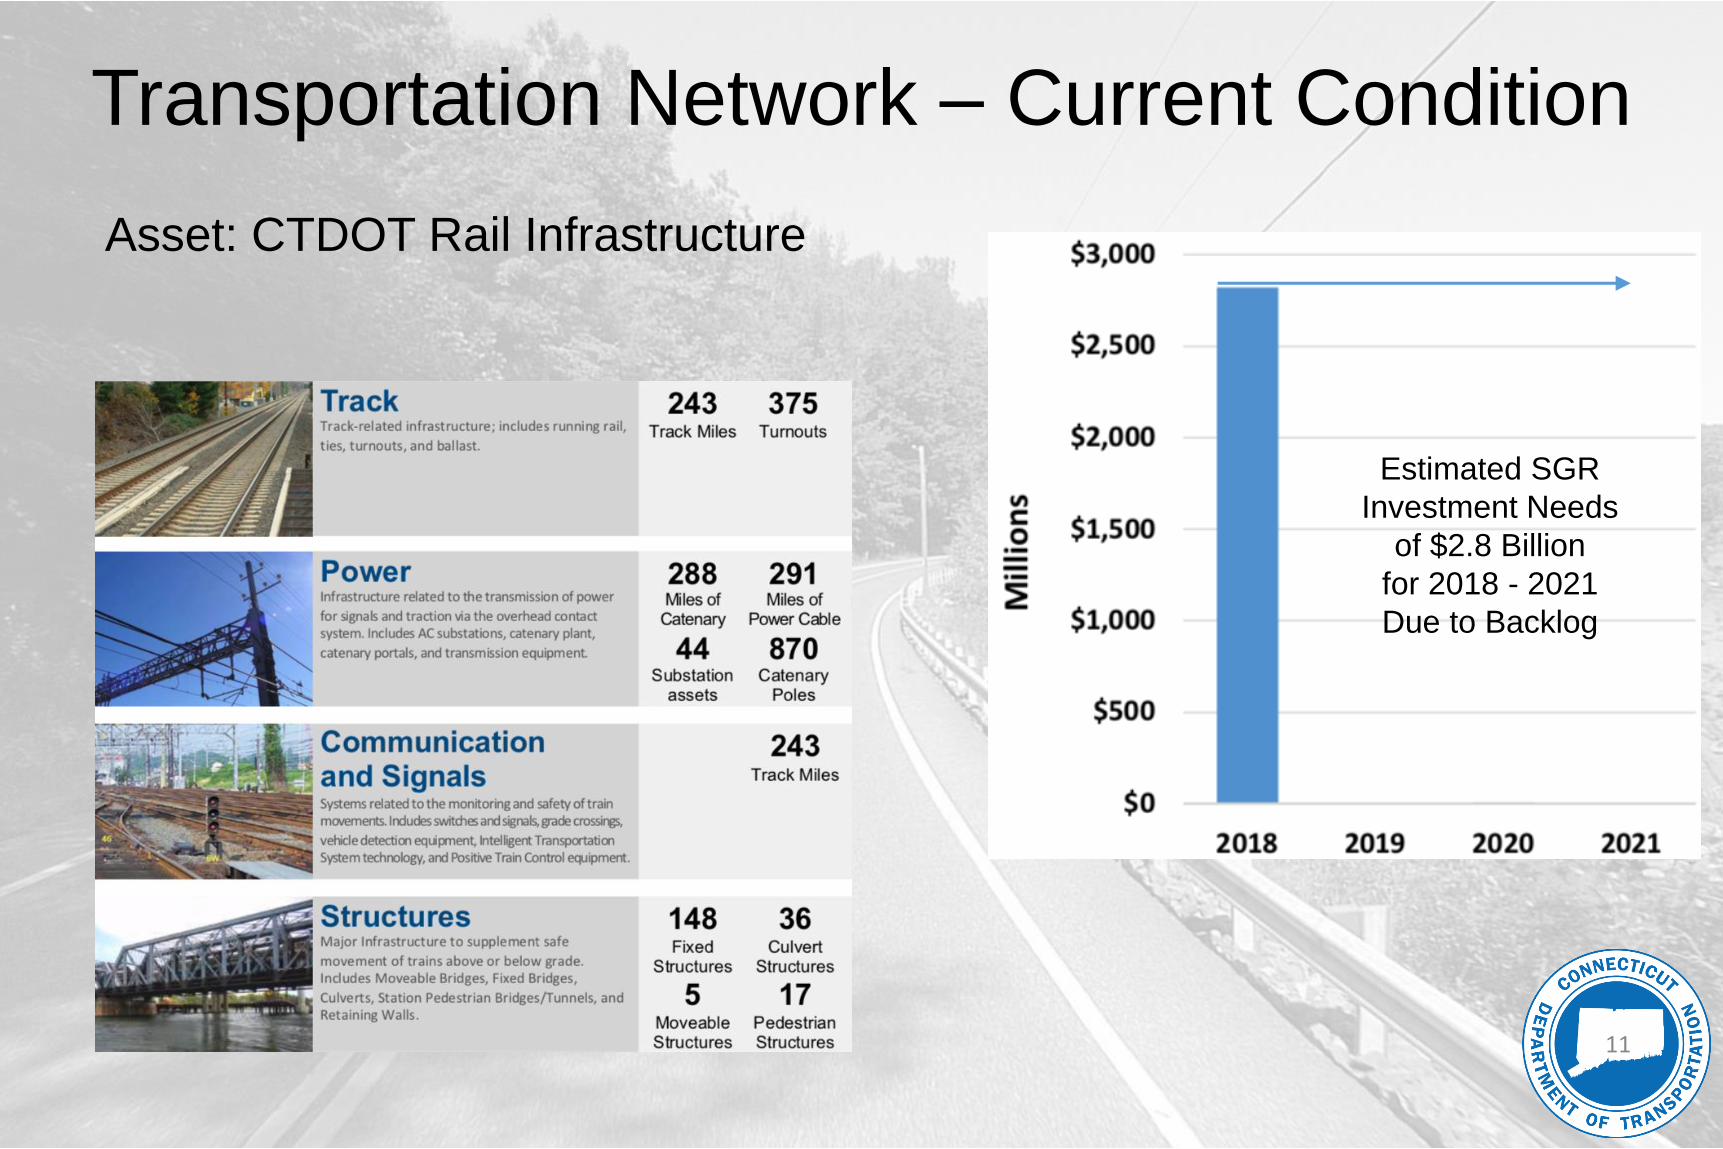
Transportation Network – Current Condition
Asset: CTDOT Rail Infrastructure
Estimated SGR
Investment Needs
of $2.8 Billion
for 2018 - 2021
Due to Backlog
11
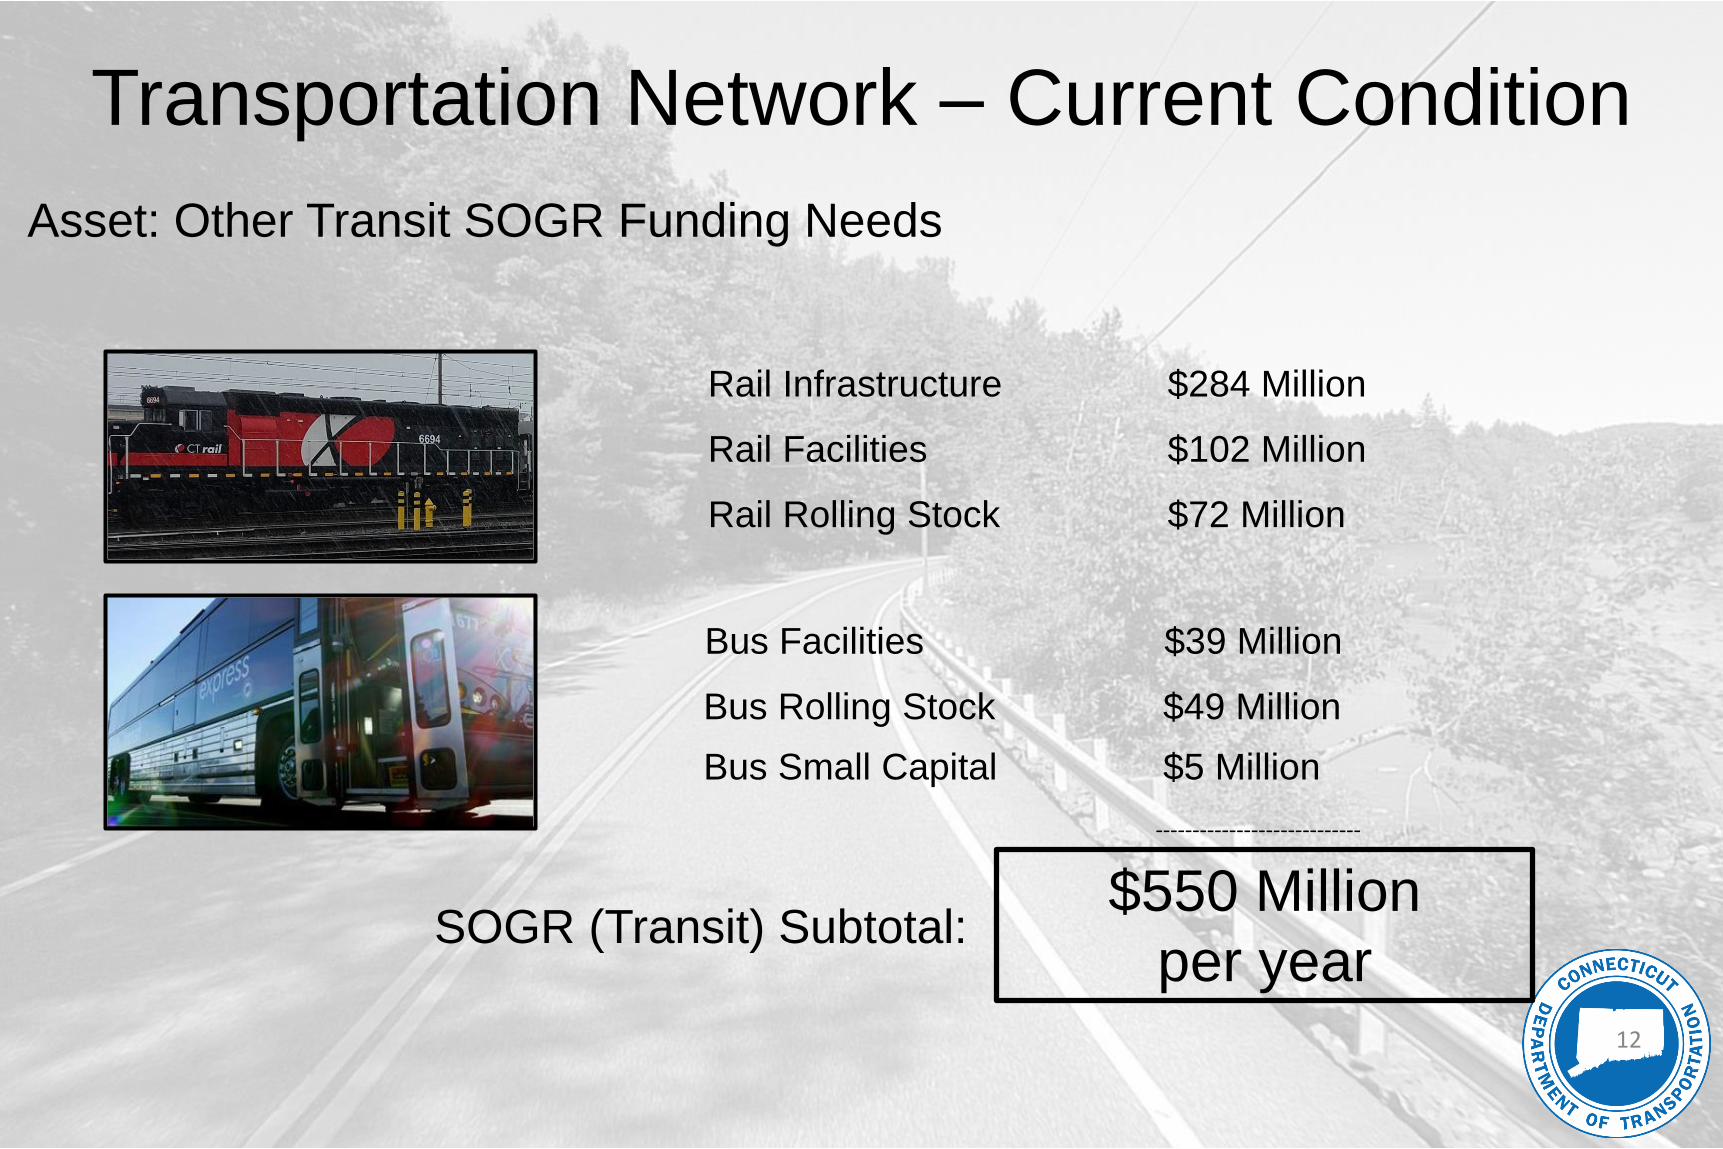
Transportation Network – Current Condition
Asset: Other Transit SOGR Funding Needs
Rail Infrastructure $284 Million
Rail Rolling Stock $72 Million
Rail Facilities $102 Million
Bus Small Capital $5 Million
Bus Rolling Stock $49 Million
Bus Facilities $39 Million
----------------------------
$550 Million
per year12
SOGR (Transit) Subtotal:
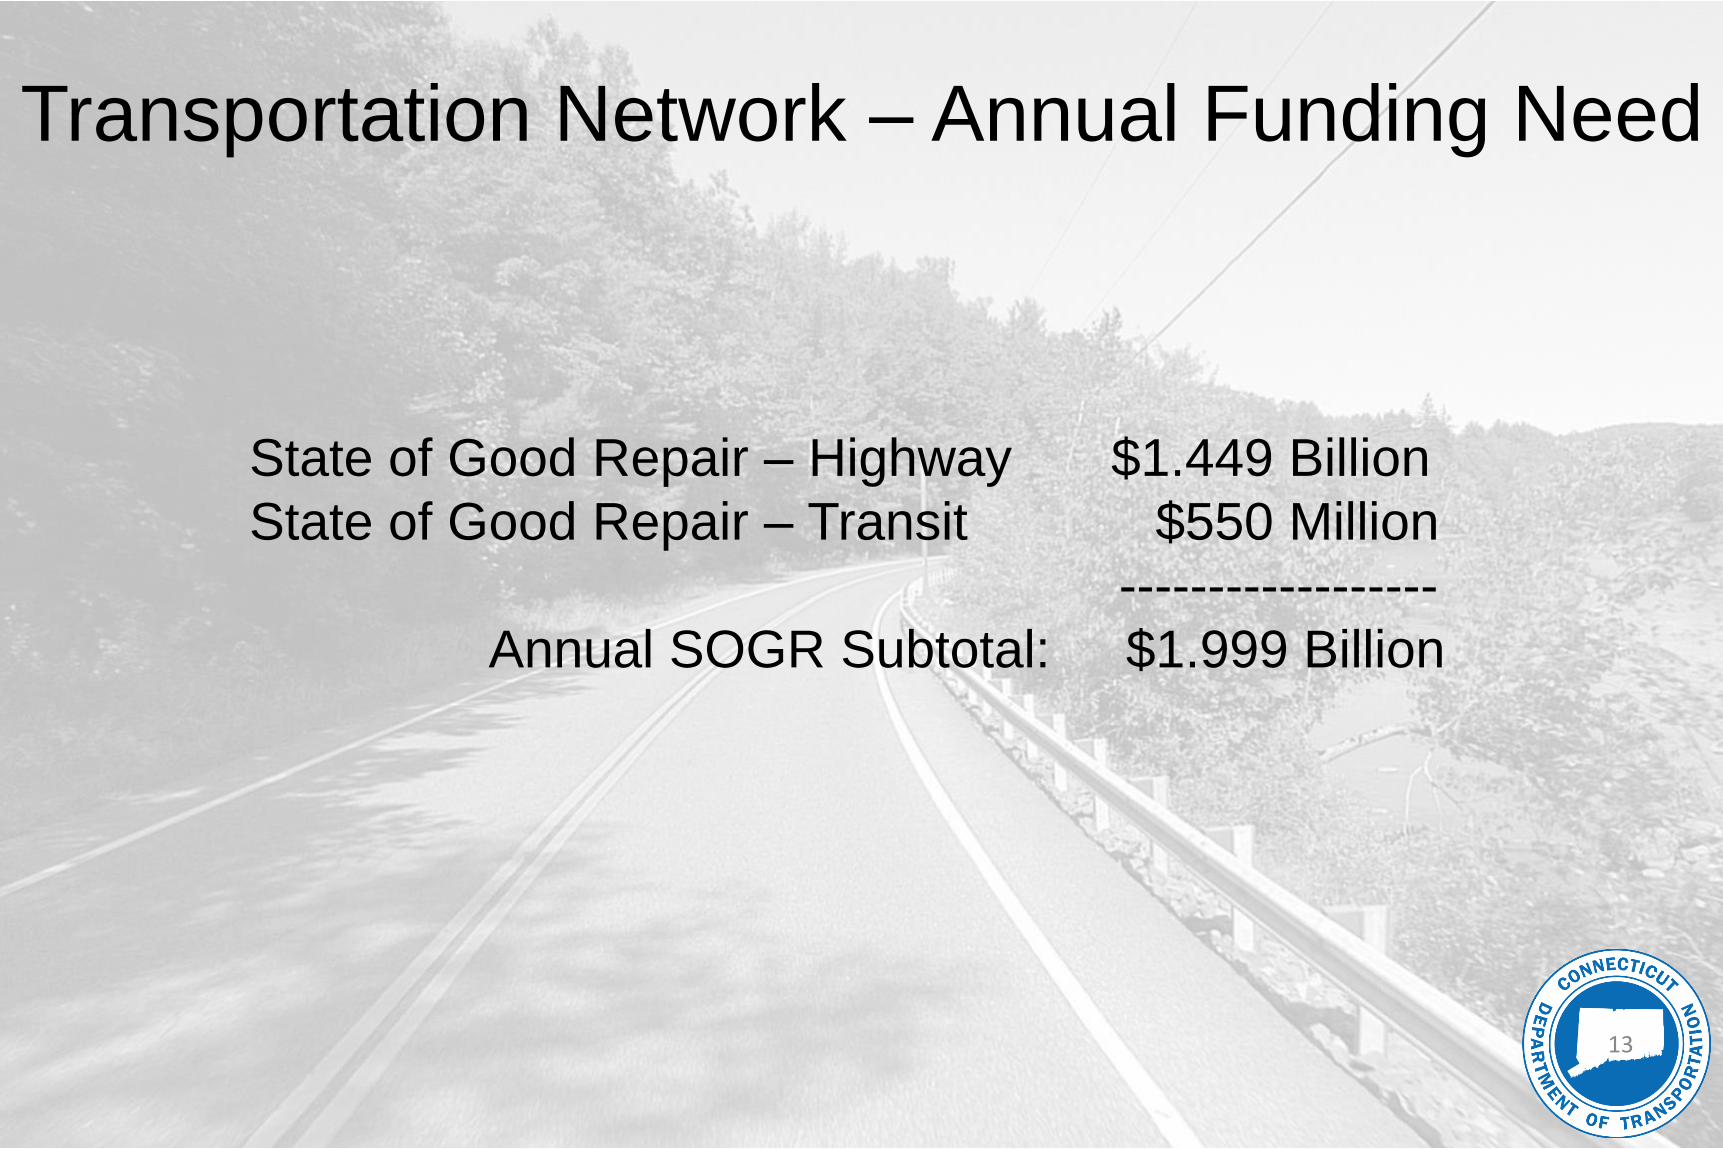
State of Good Repair – Highway $1.449 Billion
State of Good Repair – Transit $550 Million
------------------
Annual SOGR Subtotal: $1.999 Billion
Transportation Network – Annual Funding Need
13
Congested Corridors:
Impacts on Economic Vitality and Quality of Life
14
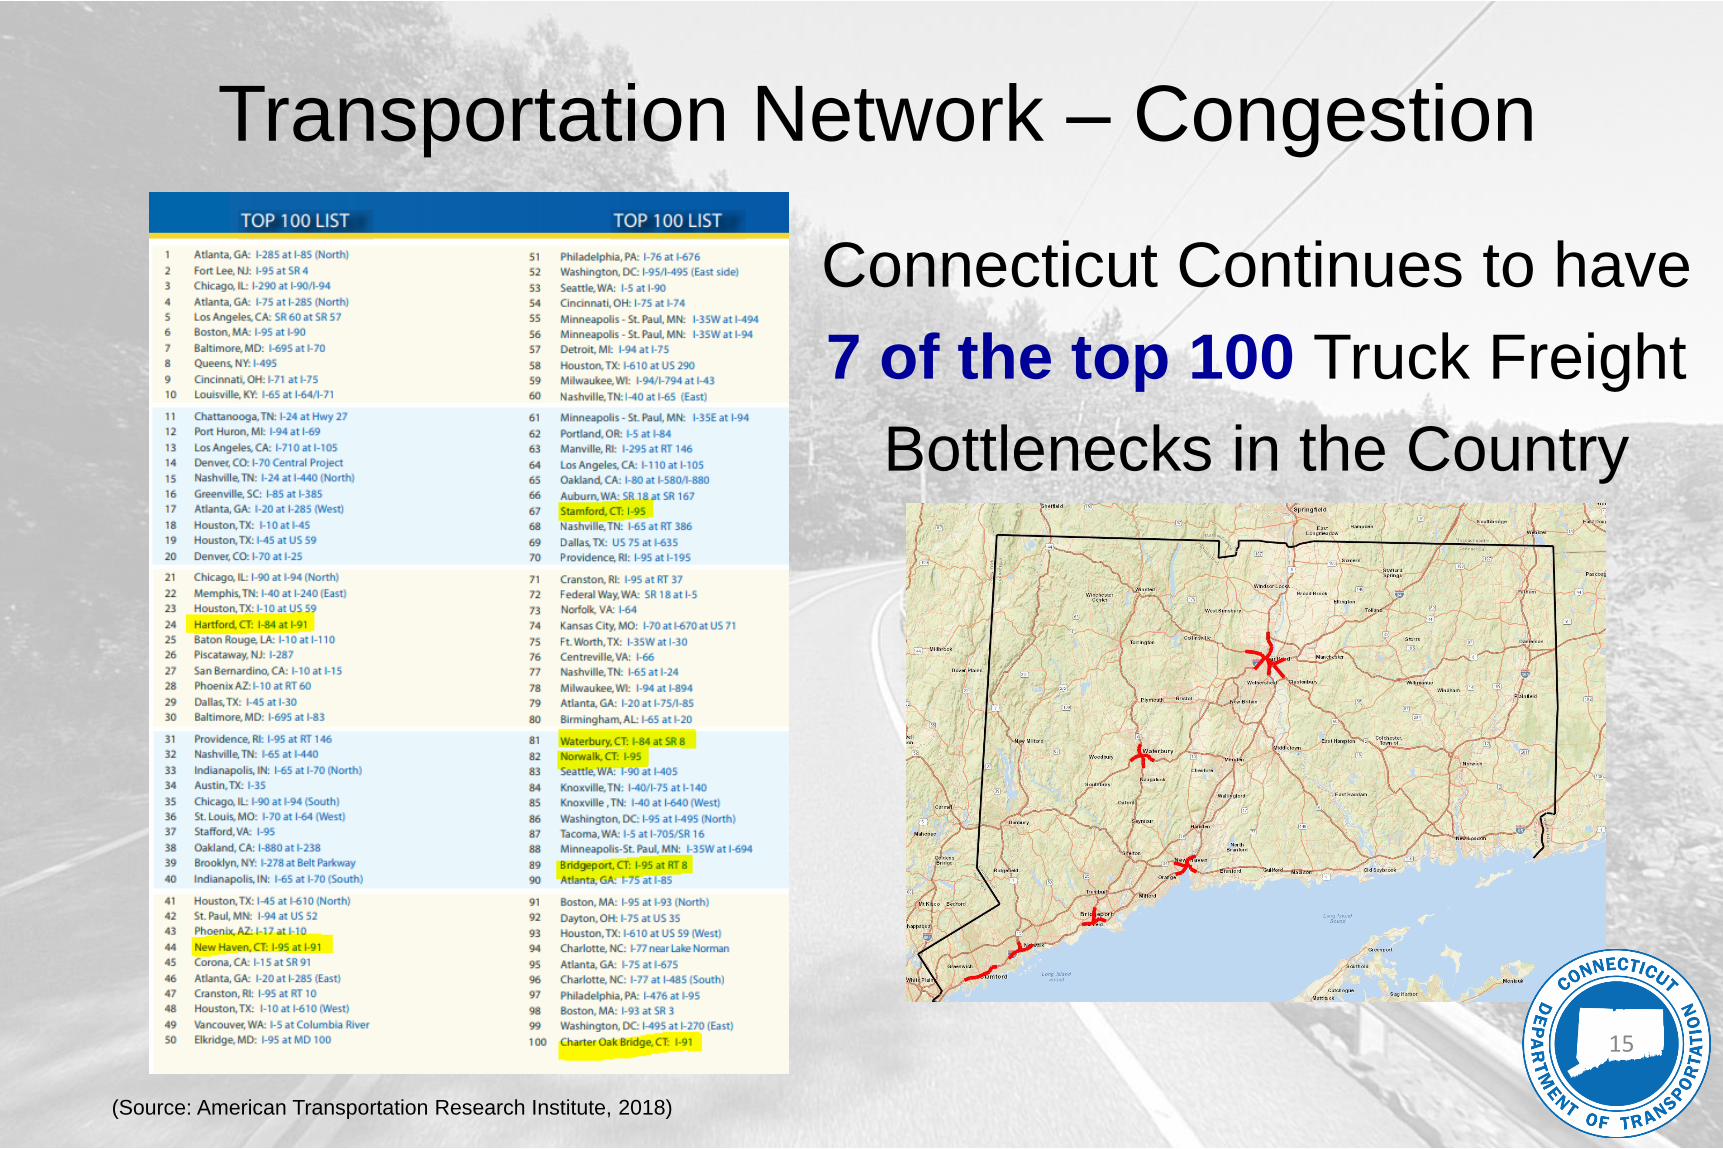
Connecticut Continues to have
7 of the top 100 Truck Freight
Bottlenecks in the Country
Transportation Network – Congestion
(Source: American Transportation Research Institute, 2018)
15
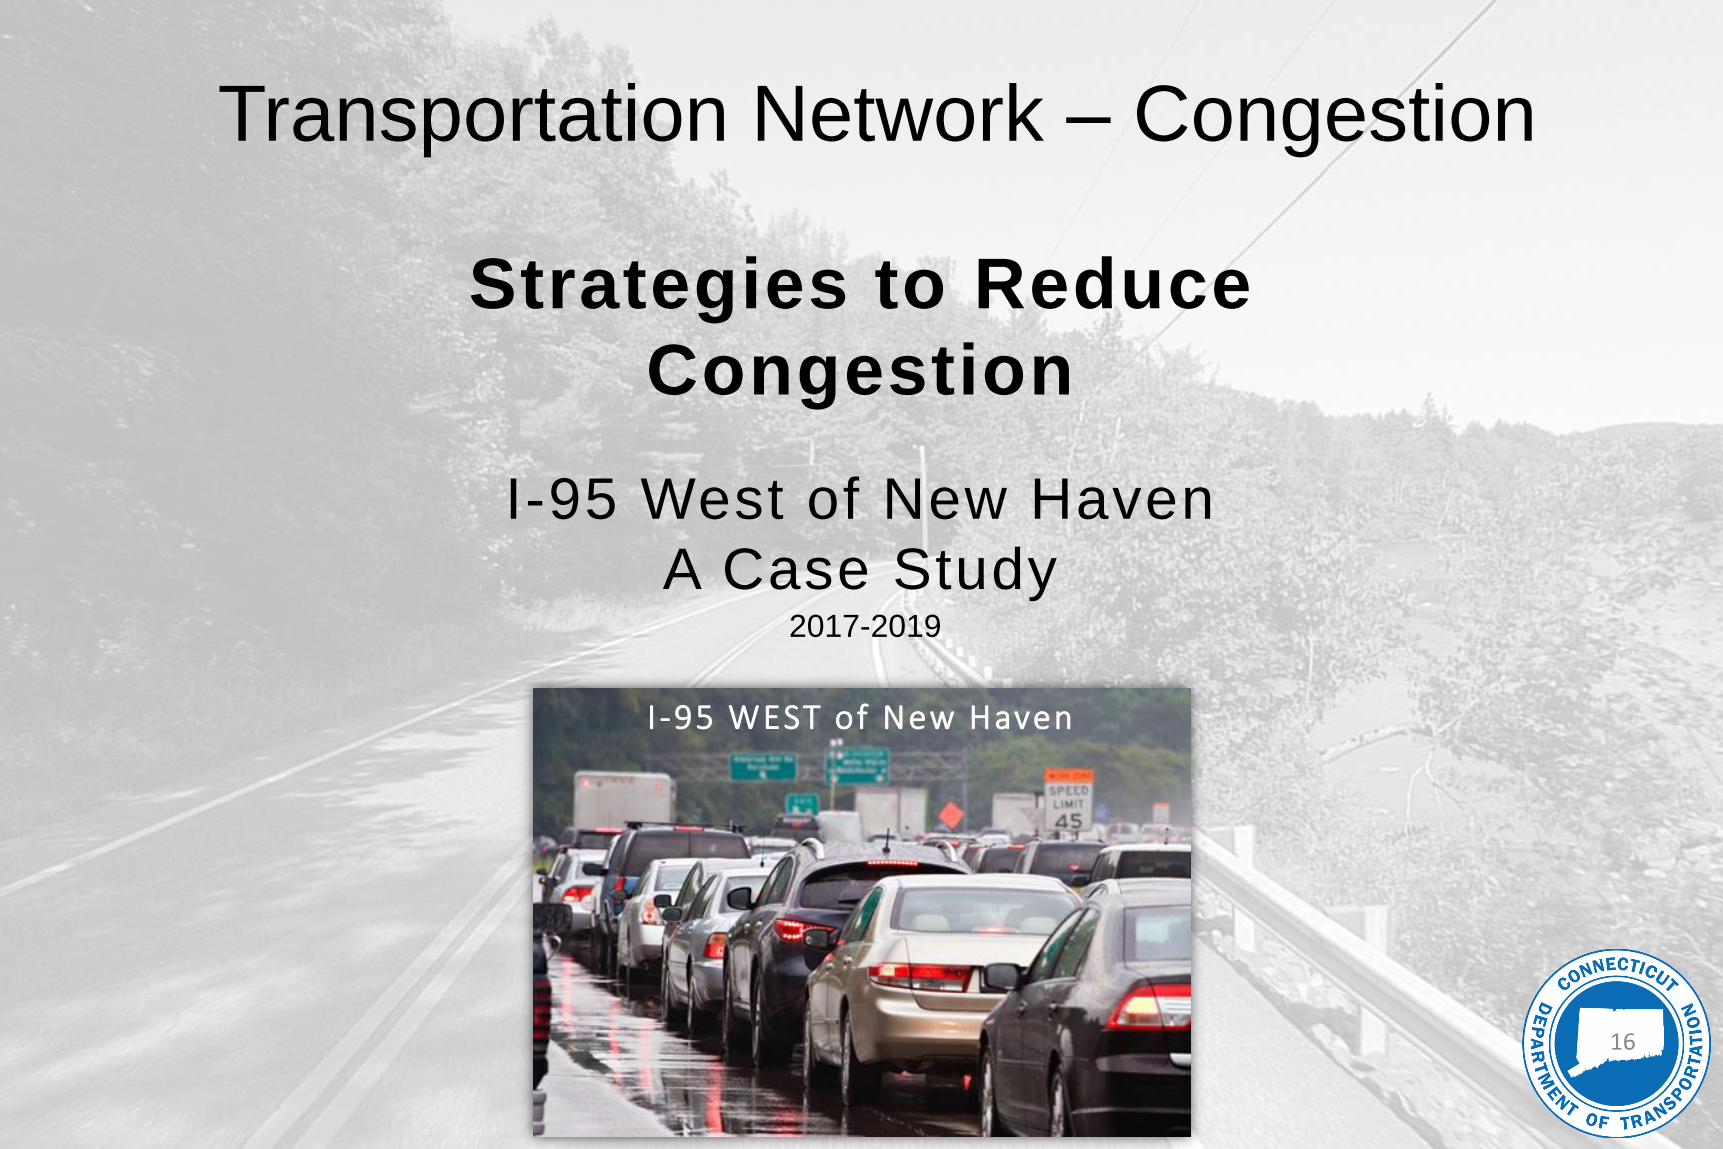
Strategies to Reduce
Congestion
I-95 West of New Haven
A Case Study
I -95 WEST of New Haven
Transportation Network – Congestion
2017-2019
16
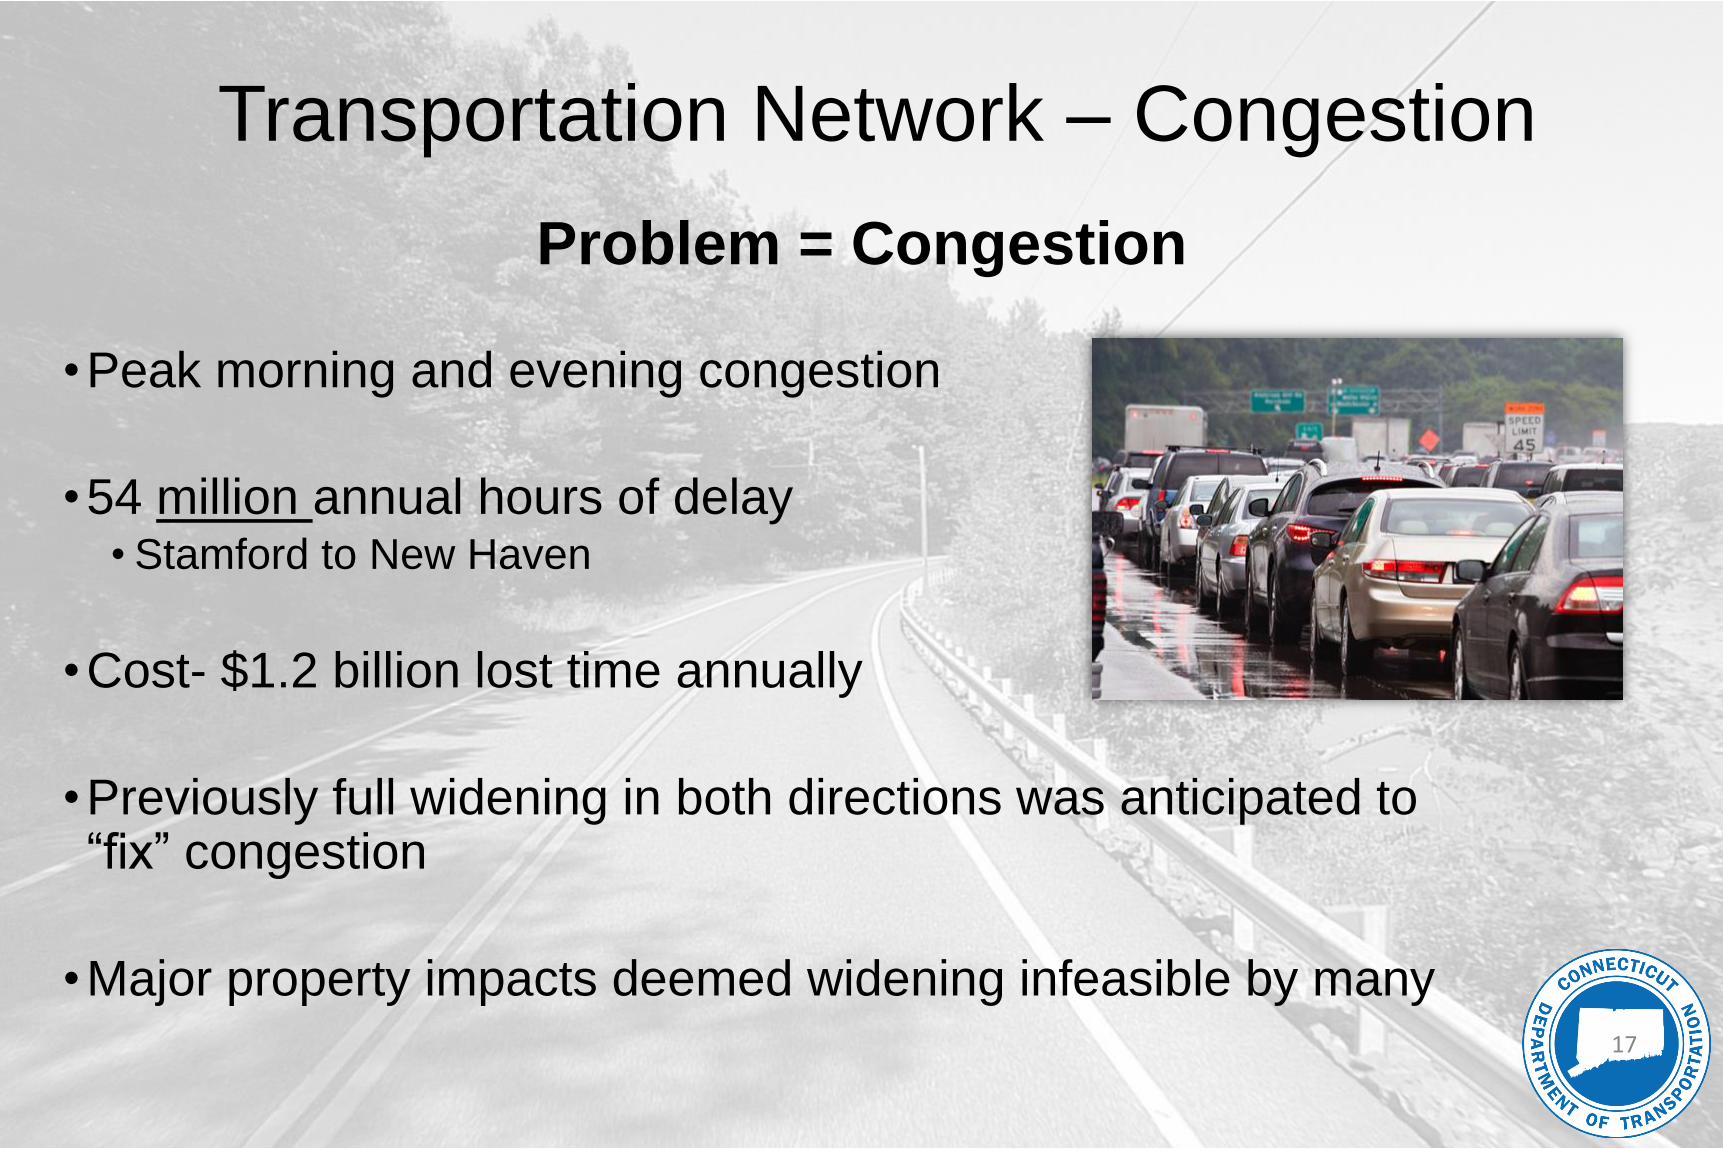
Problem = Congestion
•Peak morning and evening congestion
•54 million annual hours of delay• Stamford to New Haven
•Cost- $1.2 billion lost time annually
•Previously full widening in both directions was anticipated to “fix” congestion
•Major property impacts deemed widening infeasible by many
Transportation Network – Congestion
17
I-95 Widening Feasibility Study West of New Haven
New Findings:
• Limited, directional & strategic widening yields major benefits
• Can be constructed within EXISTING DOT property
Transportation Network – Congestion
18
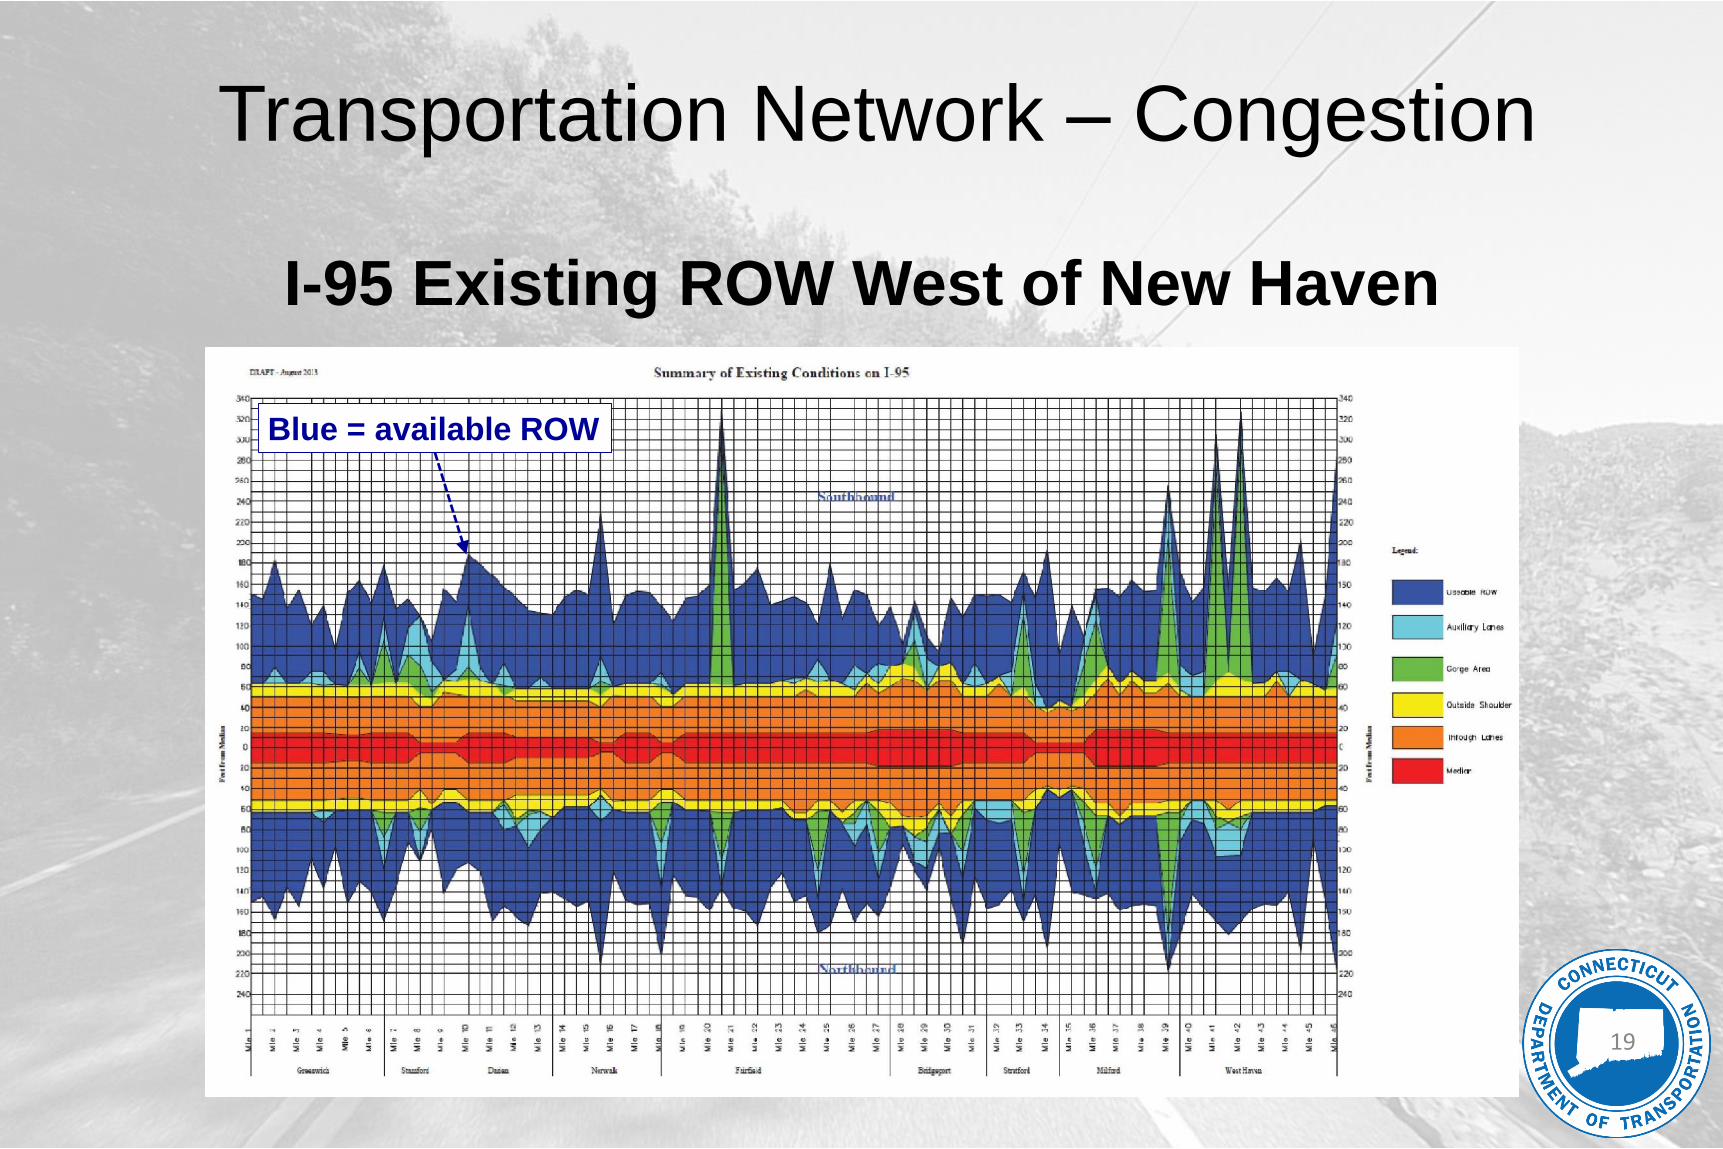
I-95 Existing ROW West of New Haven
Blue = available ROW
Transportation Network – Congestion
19
20
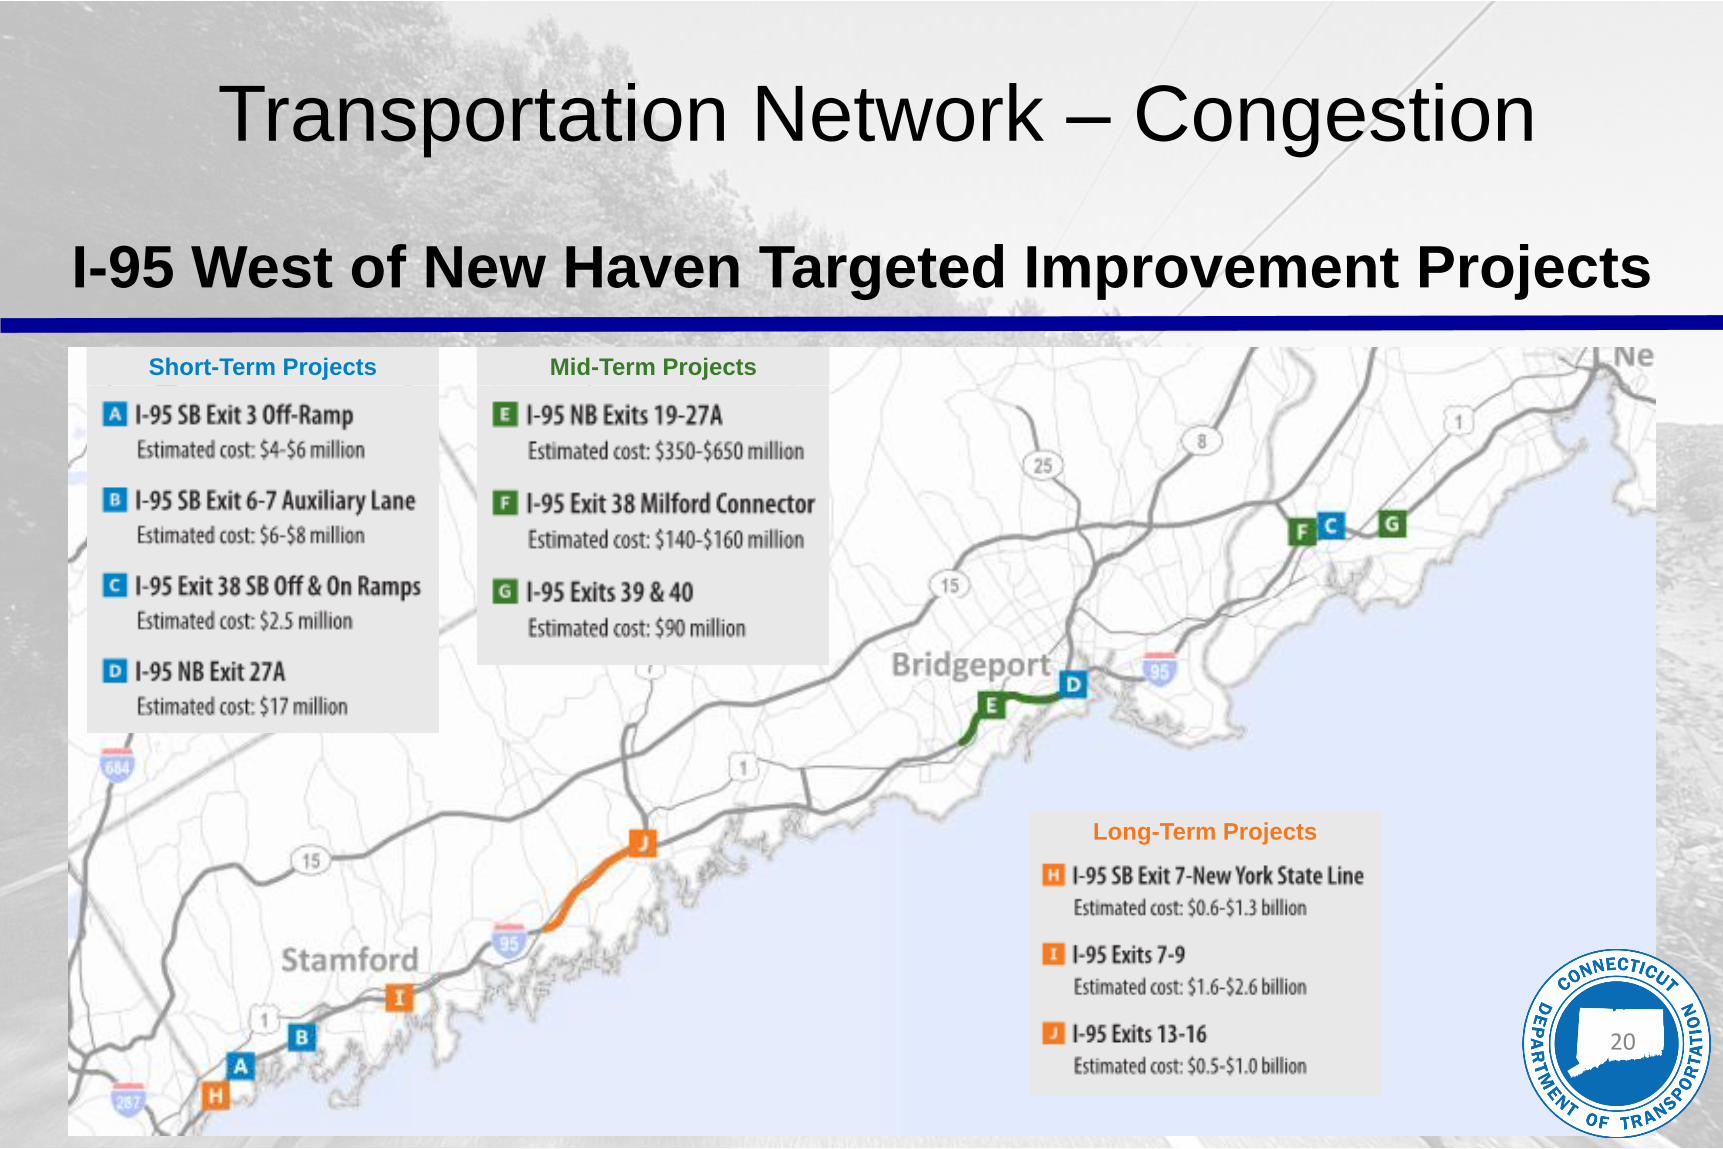
I-95 West of New Haven Targeted Improvement Projects
Transportation Network – Congestion
Short-Term Projects Mid-Term Projects
Long-Term Projects
20
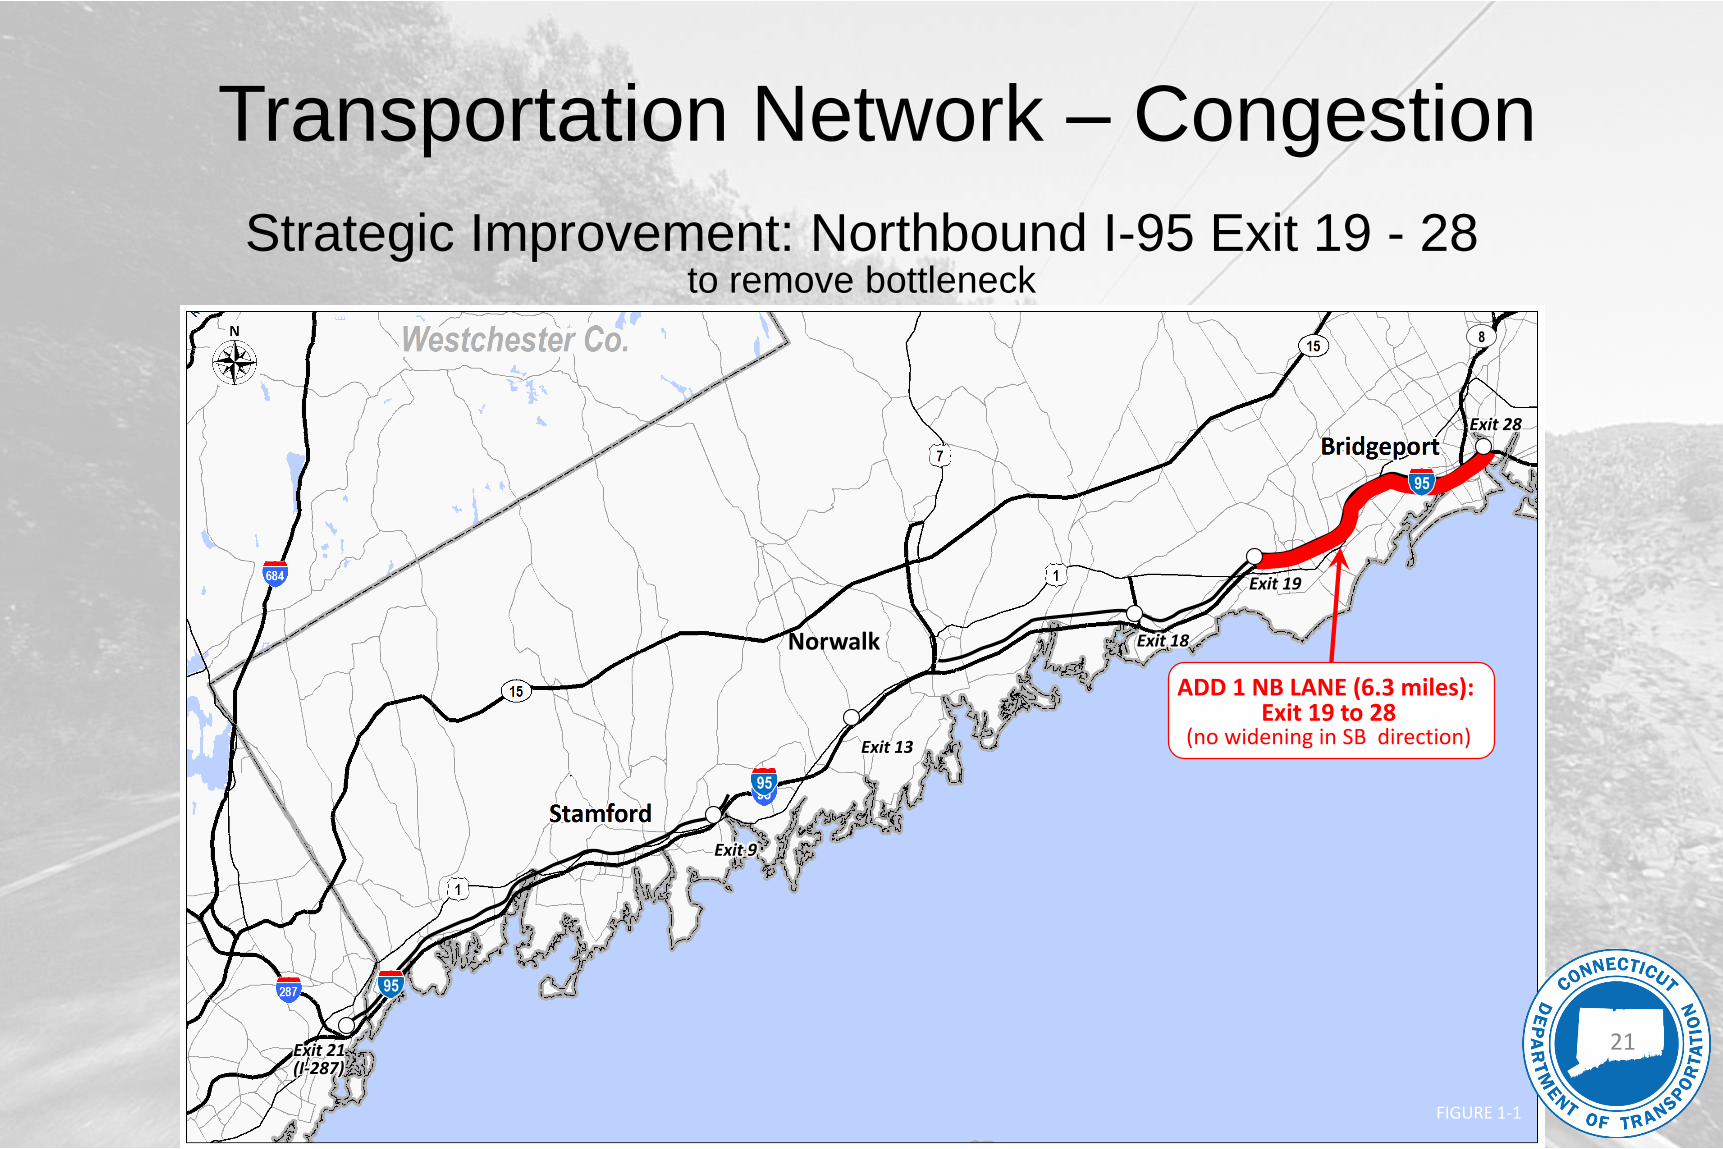
Strategic Improvement: Northbound I-95 Exit 19 - 28to remove bottleneck
FIGURE 1-1
Norwalk
8
Exit 9
Exit 21(I-287)
Exit 13
Exit 18
Exit 19
Exit 28
ADD 1 NB LANE (6.3 miles): Exit 19 to 28
(no widening in SB direction)
Transportation Network – Congestion
21
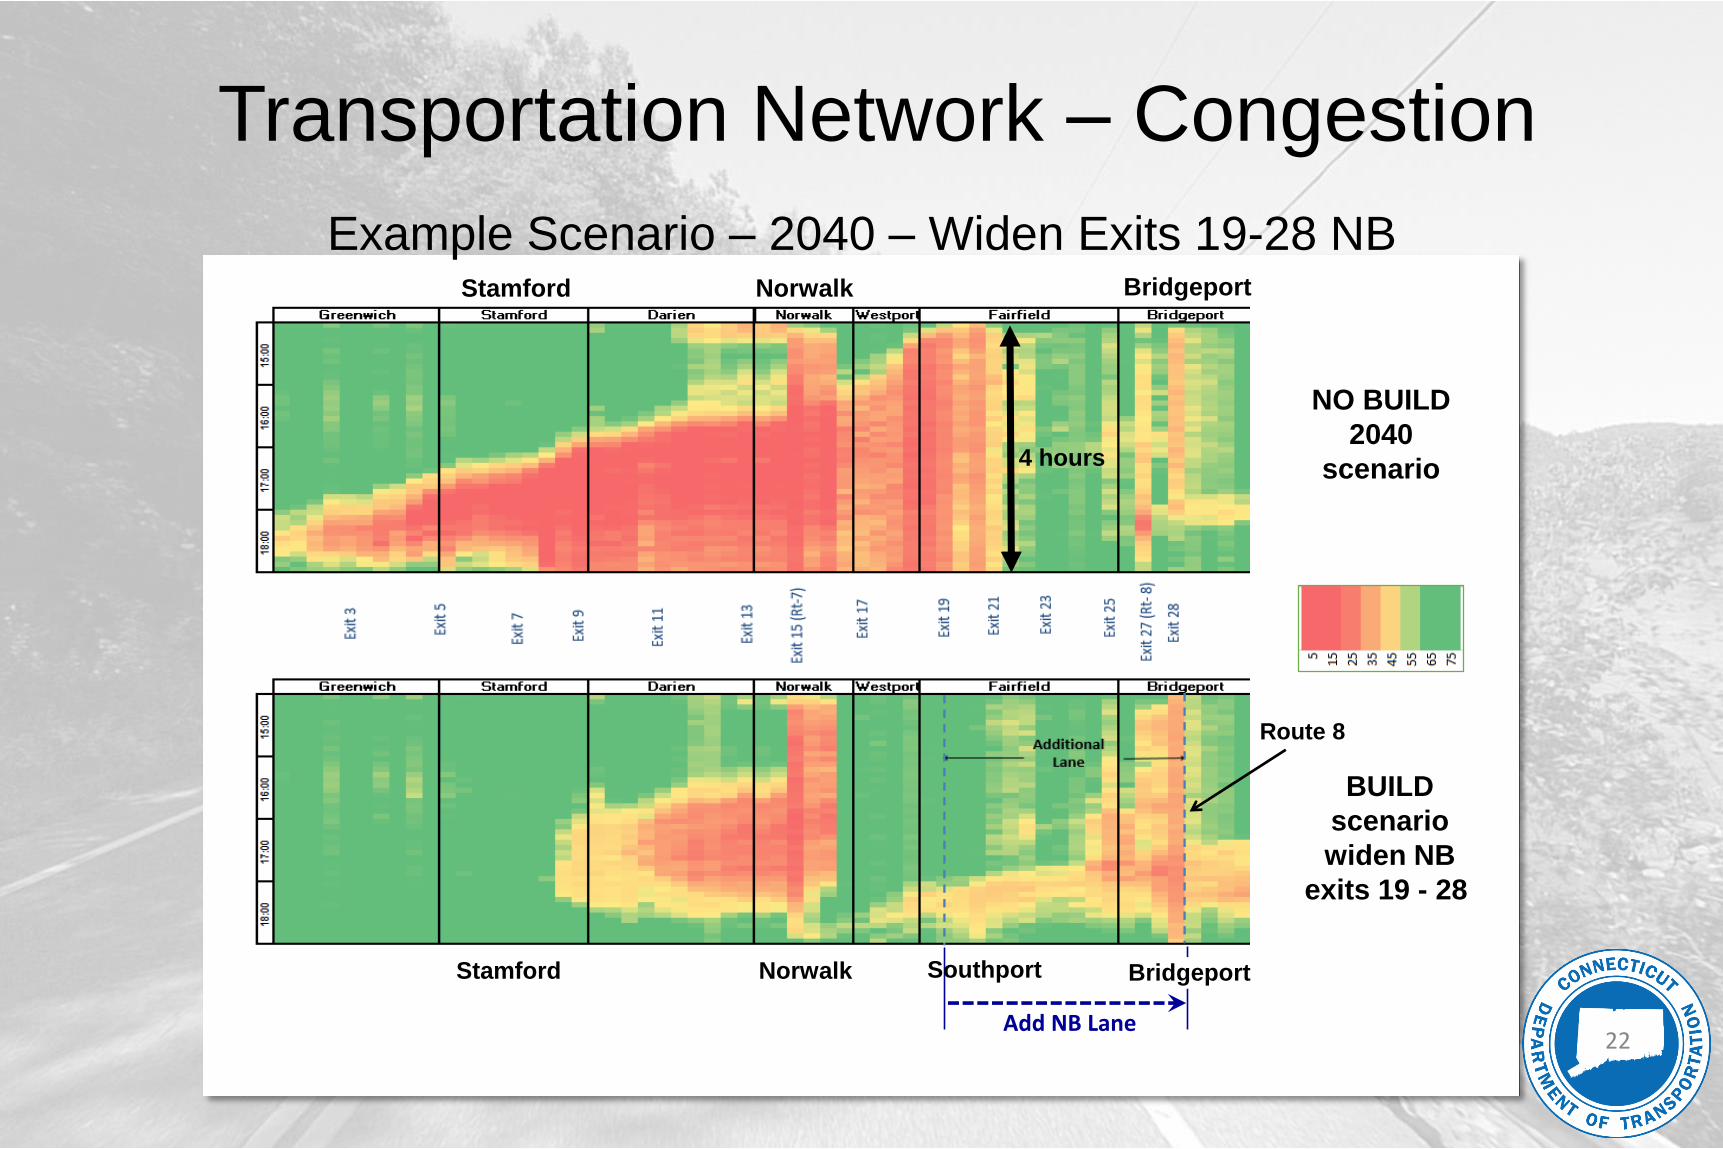
Example Scenario – 2040 – Widen Exits 19-28 NB
NO BUILD
2040
scenario
Add NB Lane
Stamford Norwalk Bridgeport
BUILD
scenario
widen NB
exits 19 - 28
Stamford Norwalk Bridgeport
Route 8
Southport
Transportation Network – Congestion
22
4 hours
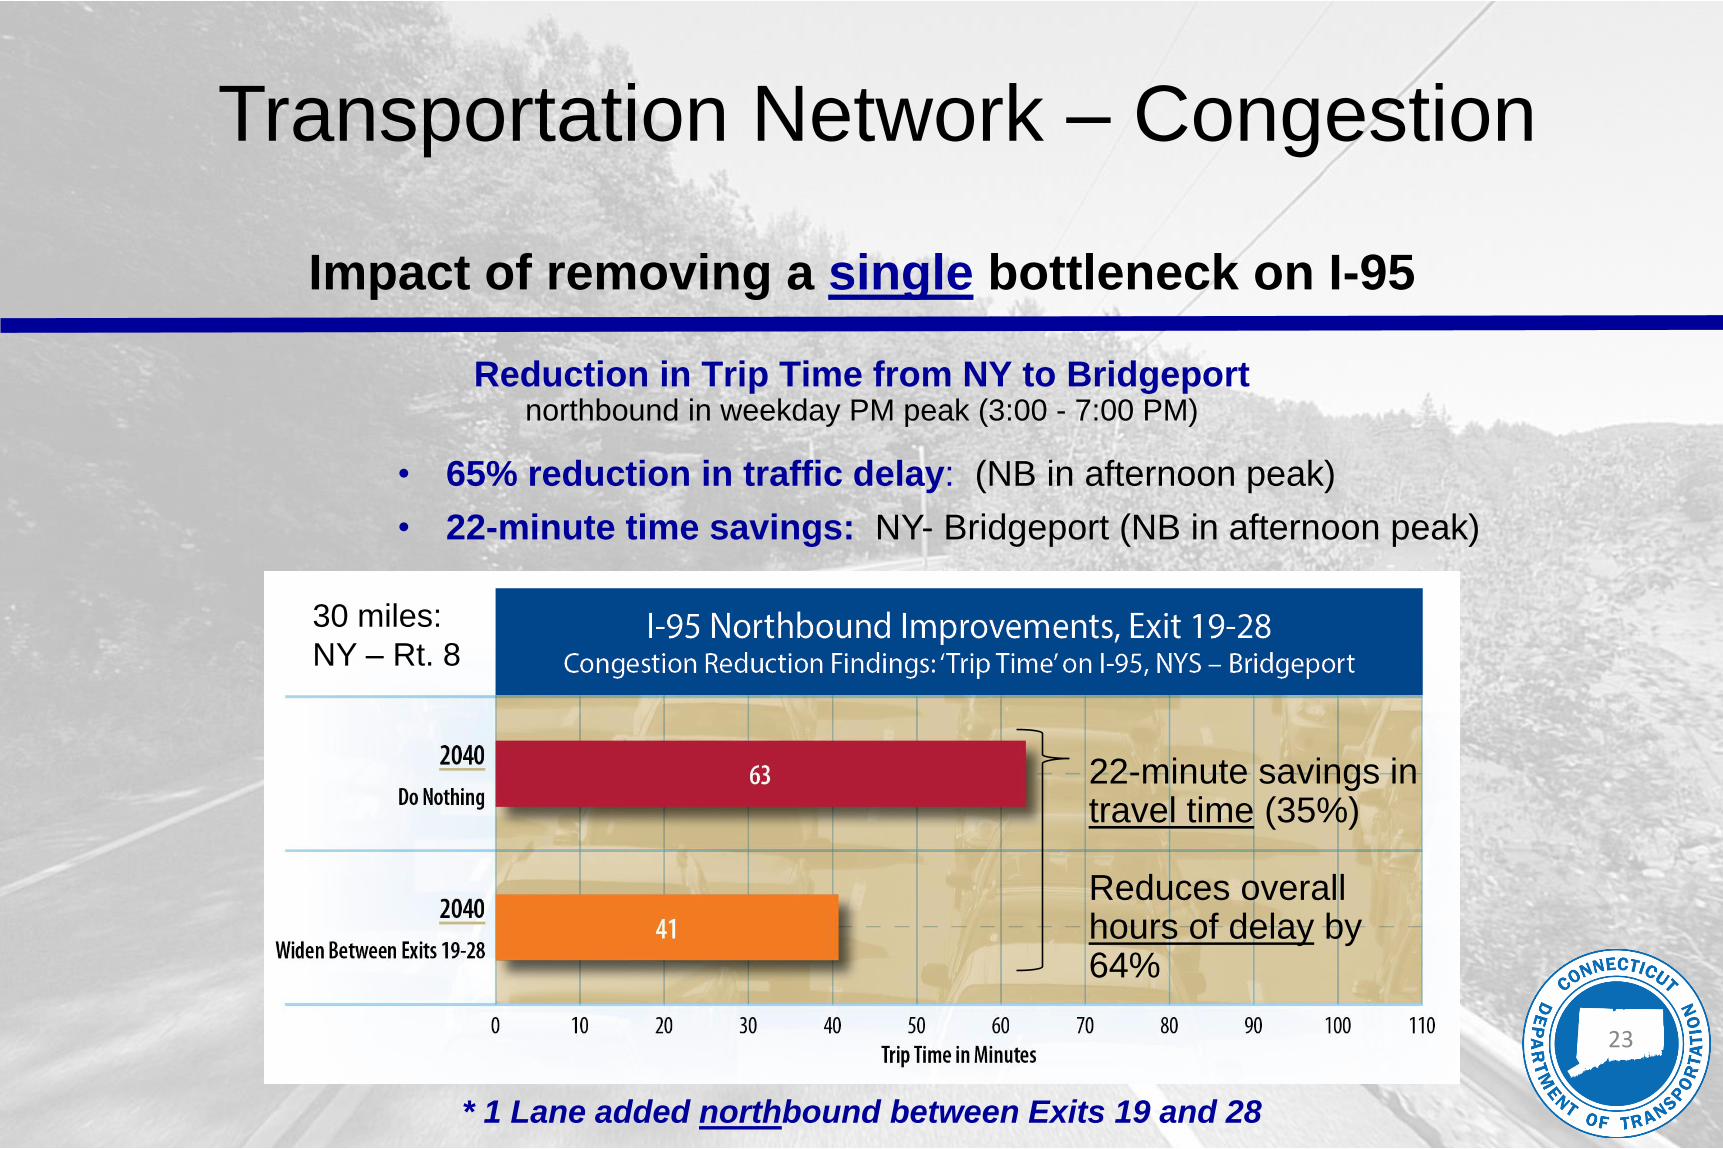
Impact of removing a single bottleneck on I-95
23
Reduction in Trip Time from NY to Bridgeportnorthbound in weekday PM peak (3:00 - 7:00 PM)
* 1 Lane added northbound between Exits 19 and 28
*
22-minute savings in travel time (35%)
Reduces overall hours of delay by 64%
• 65% reduction in traffic delay: (NB in afternoon peak)
• 22-minute time savings: NY- Bridgeport (NB in afternoon peak)
30 miles:
NY – Rt. 8
Transportation Network – Congestion
23
24
I-95 Congestion Relief/VPPP Study(2015-2016)
*NOT the Current Congestion Pricing Included in Draft legislation*
For illustration purposes only
Analyzed the effectiveness of
Widening & Congestion Pricing(NYS Line to New Haven)
Funded under FHWA’s
Value Pricing Pilot Program (VPP)
Transportation Network – Congestion
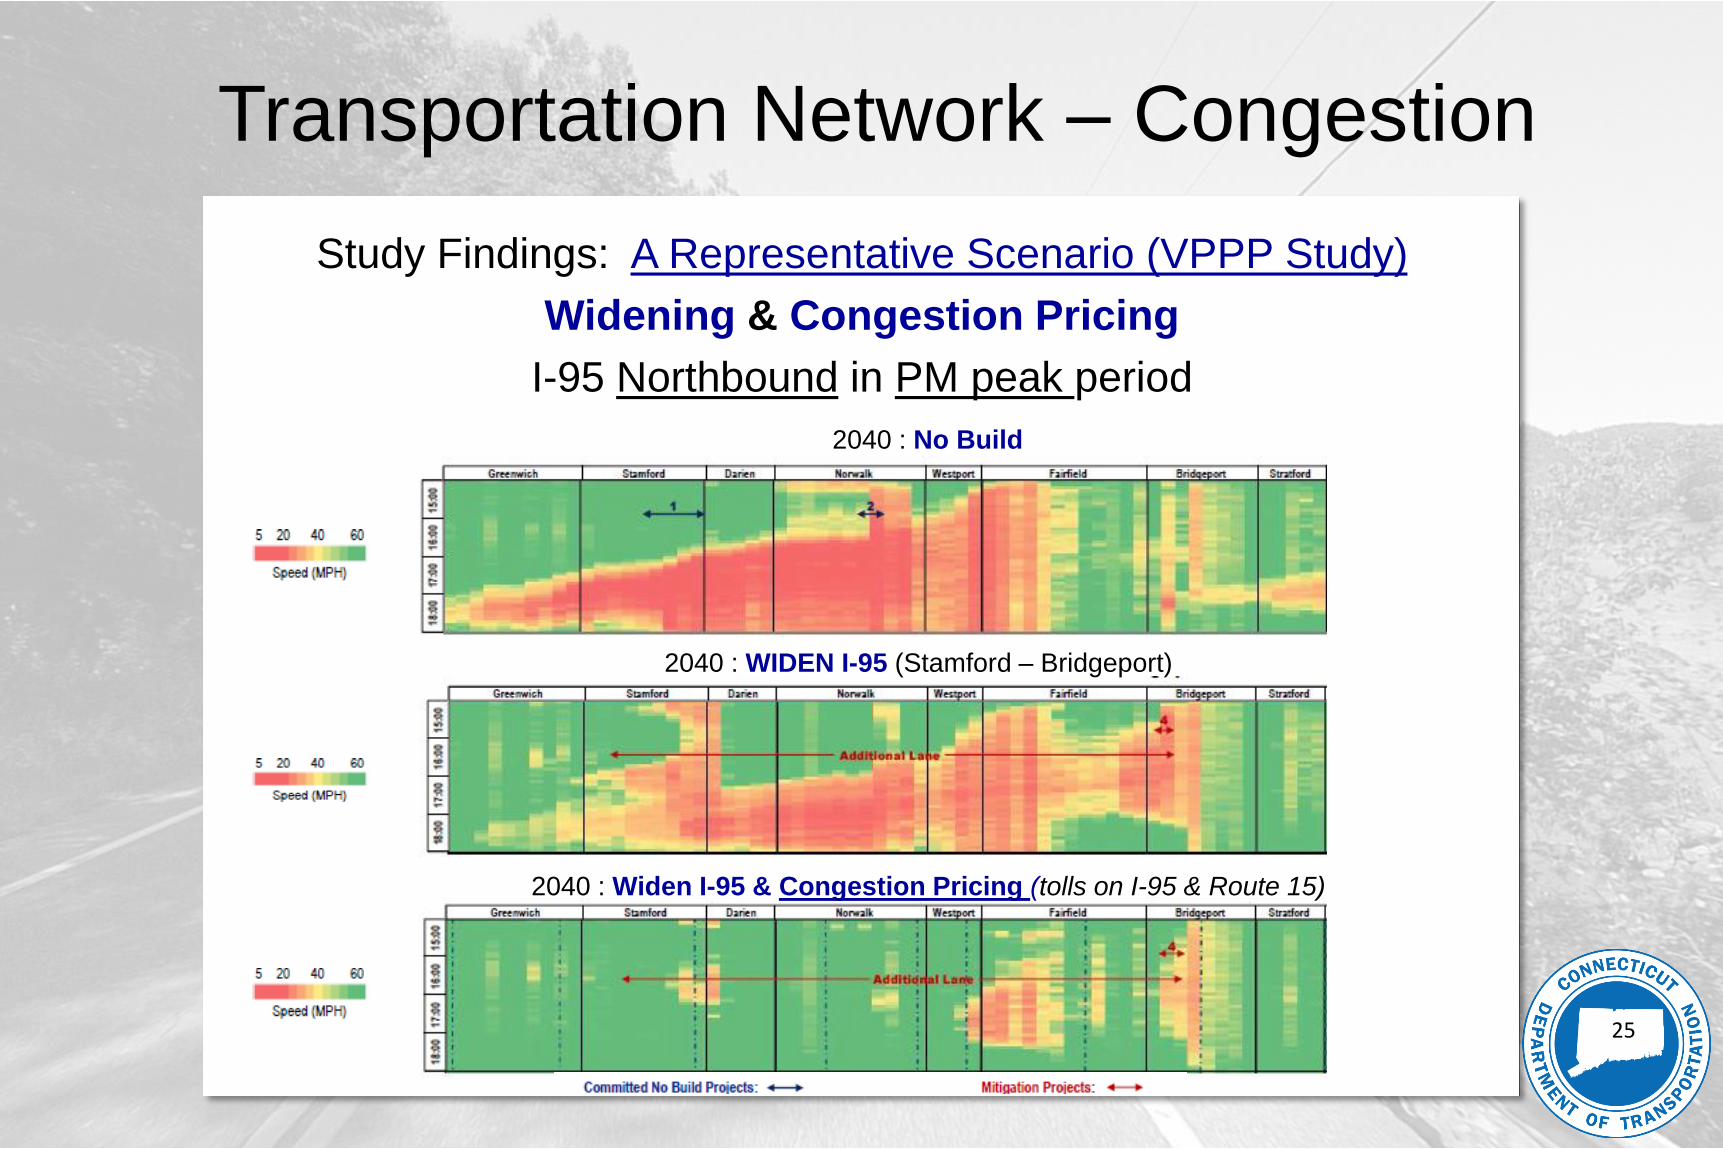
Study Findings: A Representative Scenario (VPPP Study)
Widening & Congestion Pricing
I-95 Northbound in PM peak period
2040 : No Build
2040 : WIDEN I-95 (Stamford – Bridgeport)
2040 : Widen I-95 & Congestion Pricing (tolls on I-95 & Route 15)
Transportation Network – Congestion
25
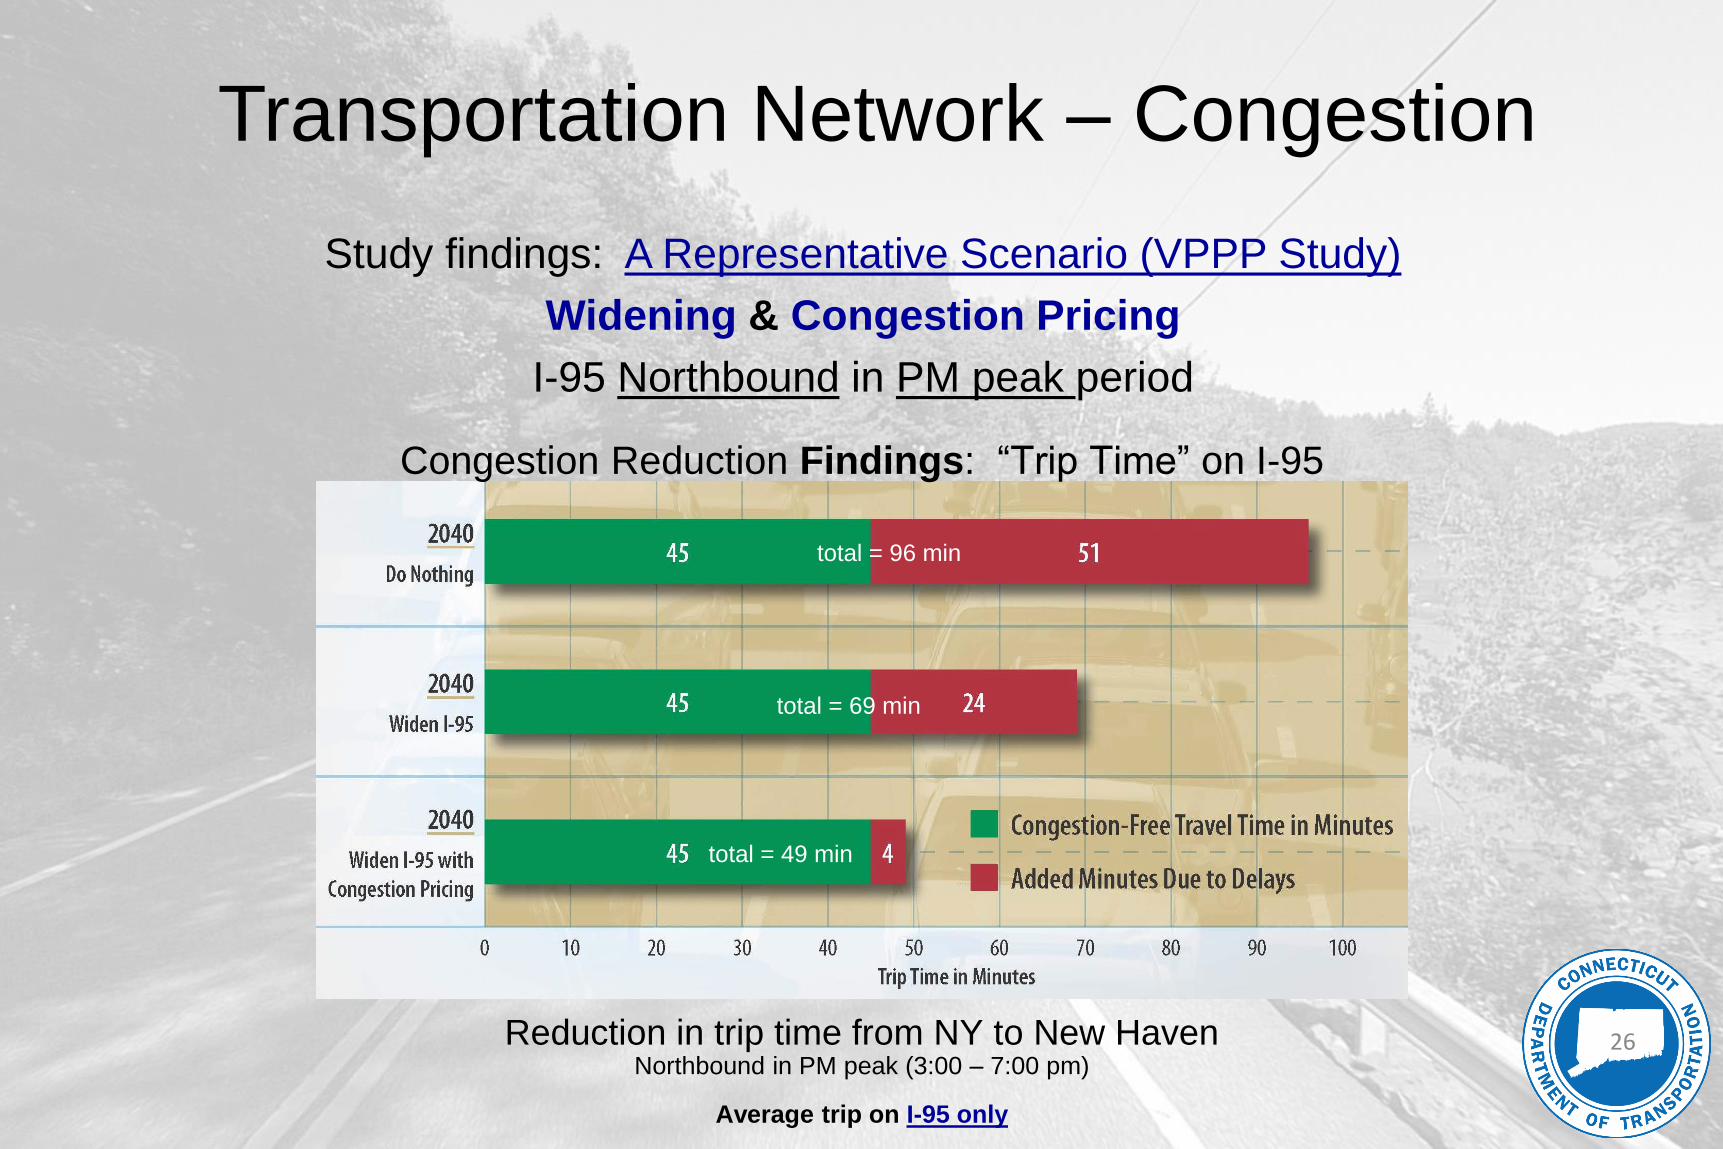
Reduction in trip time from NY to New HavenNorthbound in PM peak (3:00 – 7:00 pm)
Average trip on I-95 only
Congestion Reduction Findings: “Trip Time” on I-95
total = 96 min
total = 69 min
total = 49 min
Study findings: A Representative Scenario (VPPP Study)
Widening & Congestion Pricing
I-95 Northbound in PM peak period
Transportation Network – Congestion
26
Transportation Network – Congestion
27
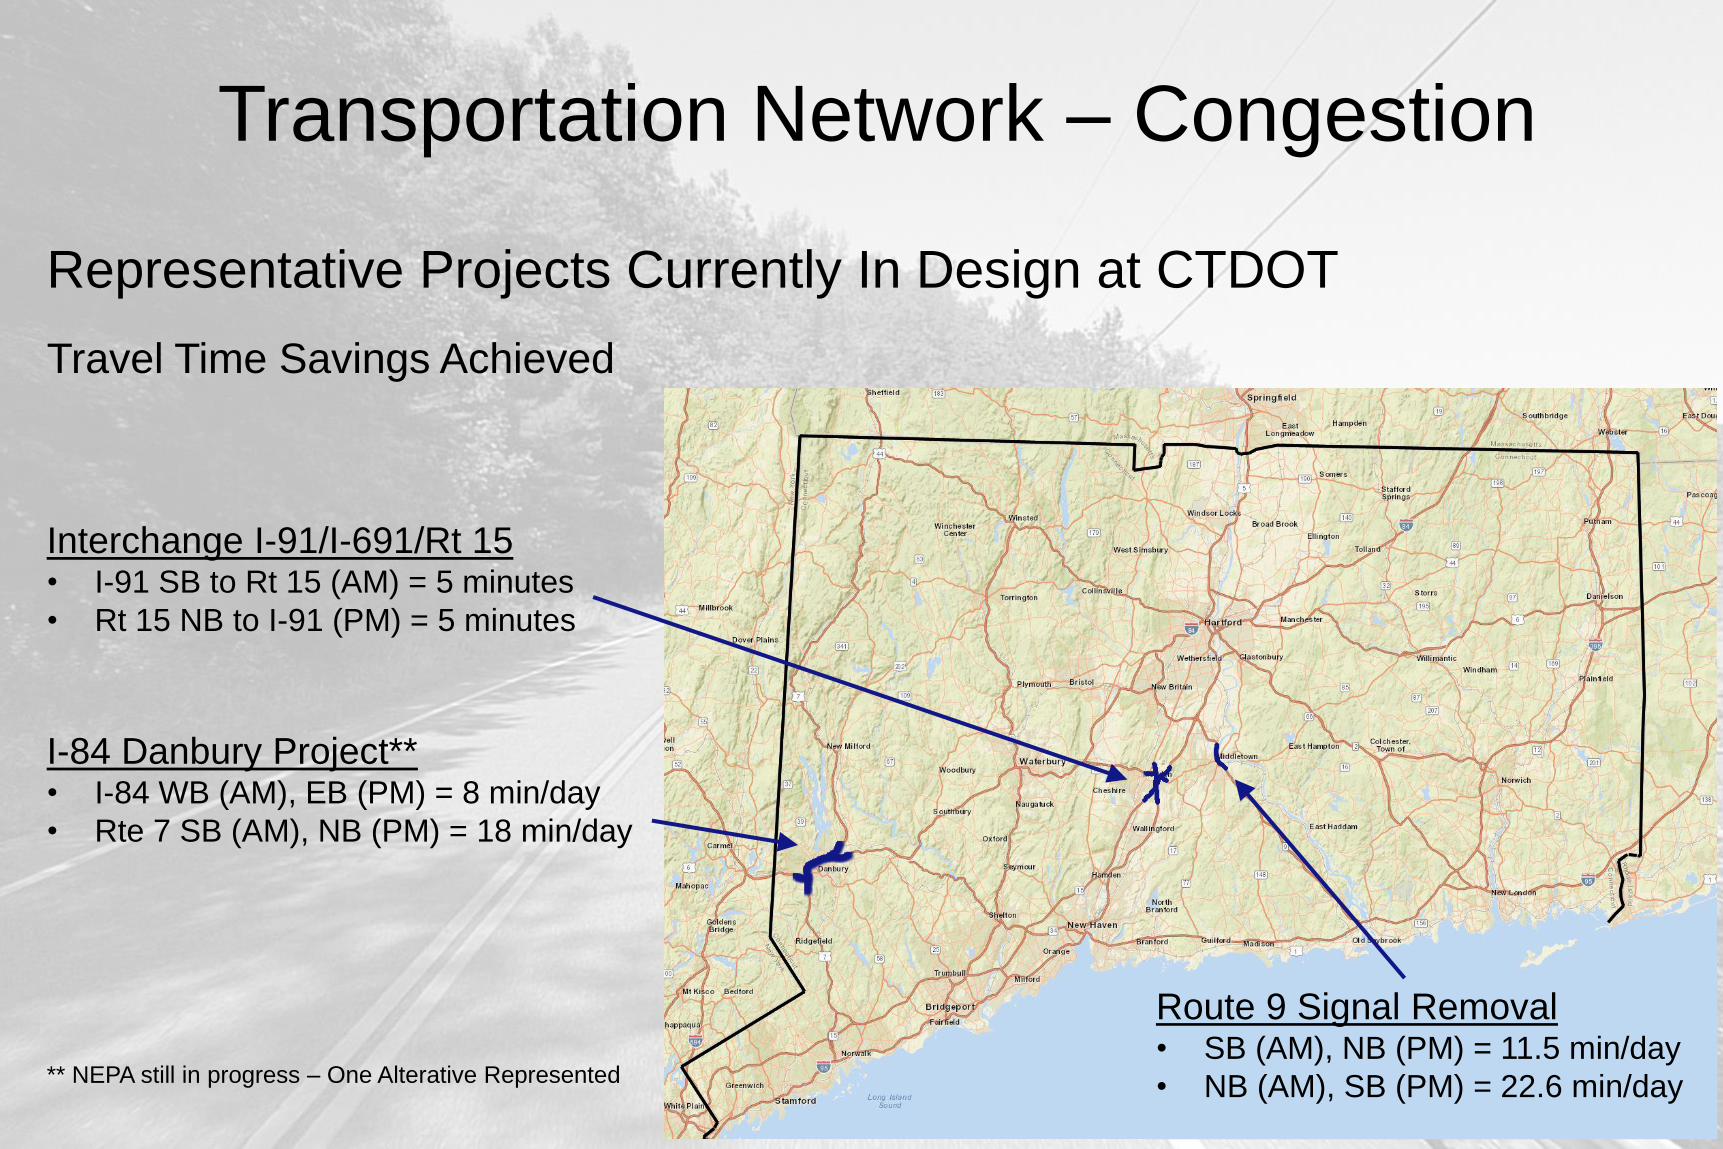
Representative Projects Currently In Design at CTDOT
Travel Time Savings Achieved
Interchange I-91/I-691/Rt 15• I-91 SB to Rt 15 (AM) = 5 minutes
• Rt 15 NB to I-91 (PM) = 5 minutes
I-84 Danbury Project**• I-84 WB (AM), EB (PM) = 8 min/day
• Rte 7 SB (AM), NB (PM) = 18 min/day
** NEPA still in progress – One Alterative Represented
Route 9 Signal Removal• SB (AM), NB (PM) = 11.5 min/day
• NB (AM), SB (PM) = 22.6 min/day
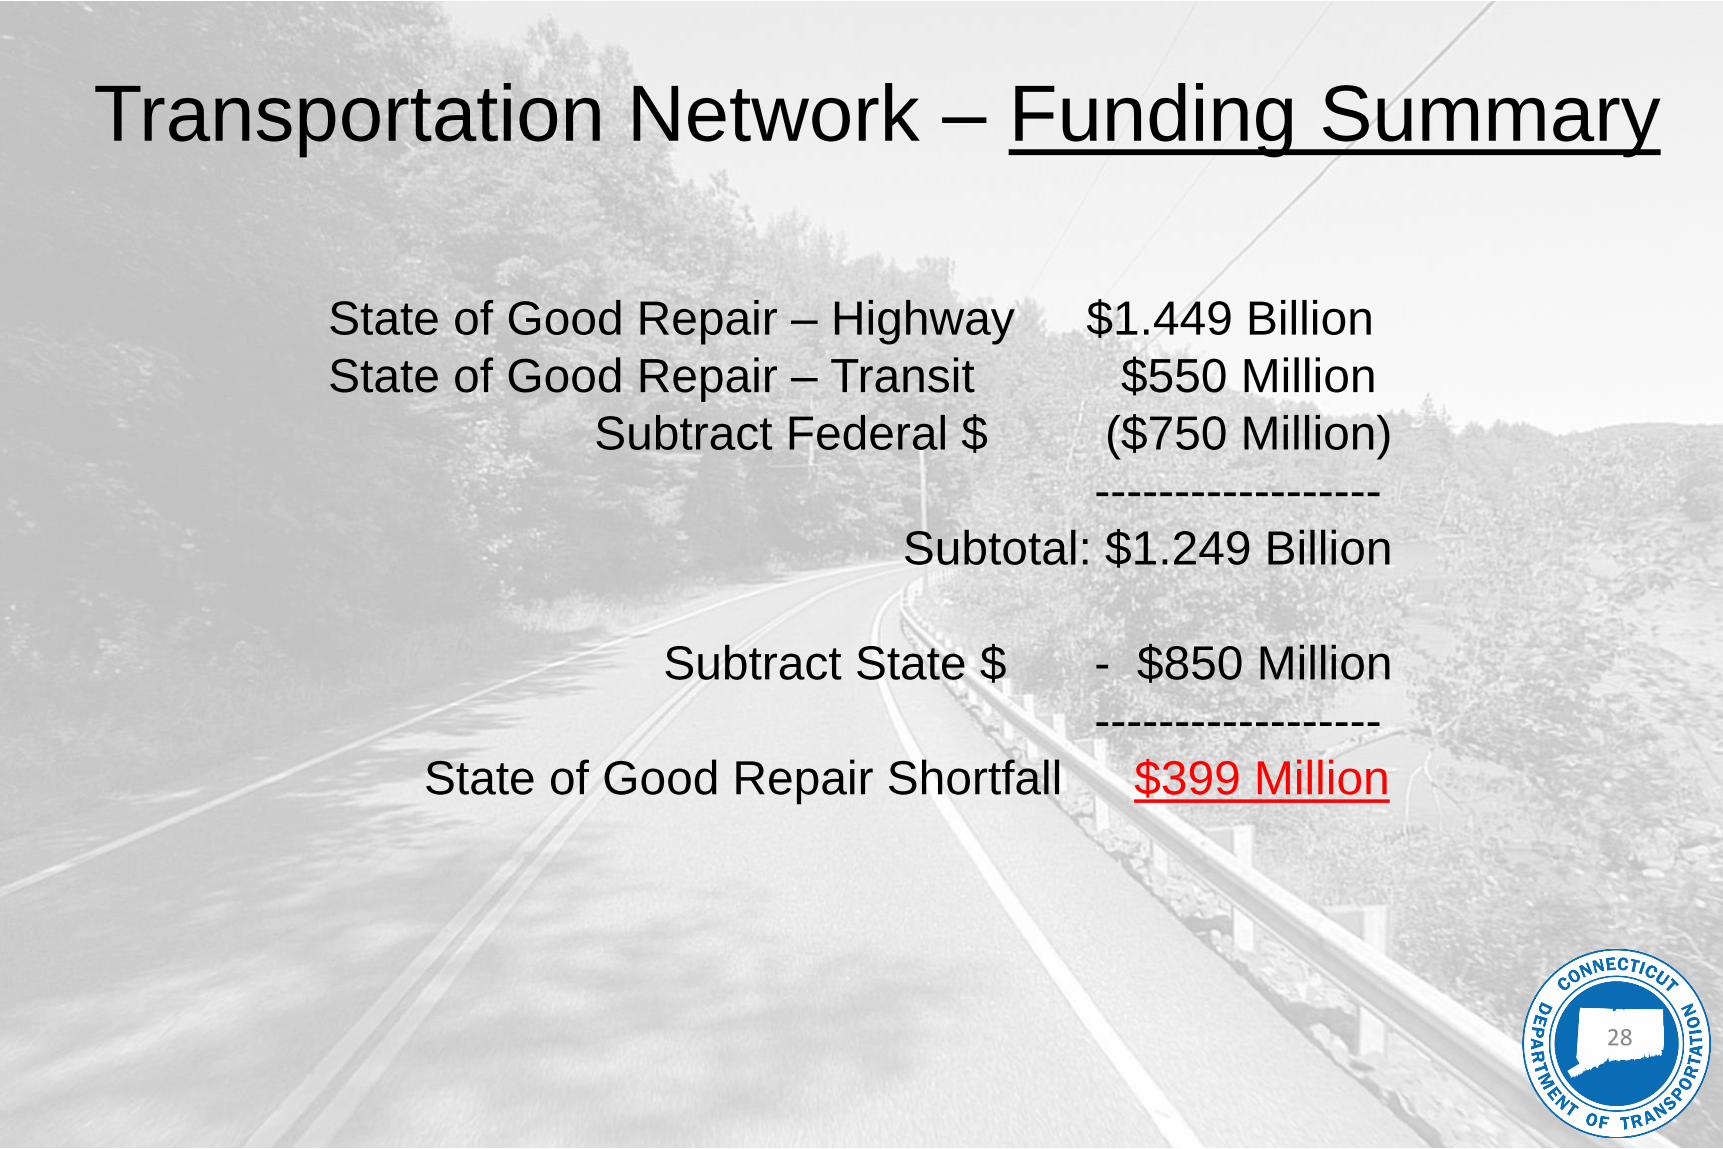
State of Good Repair – Highway $1.449 Billion
State of Good Repair – Transit $550 Million
Subtract Federal $ ($750 Million)
------------------
Subtotal: $1.249 Billion
Subtract State $ - $850 Million
------------------
State of Good Repair Shortfall $399 Million
Transportation Network – Funding Summary
28
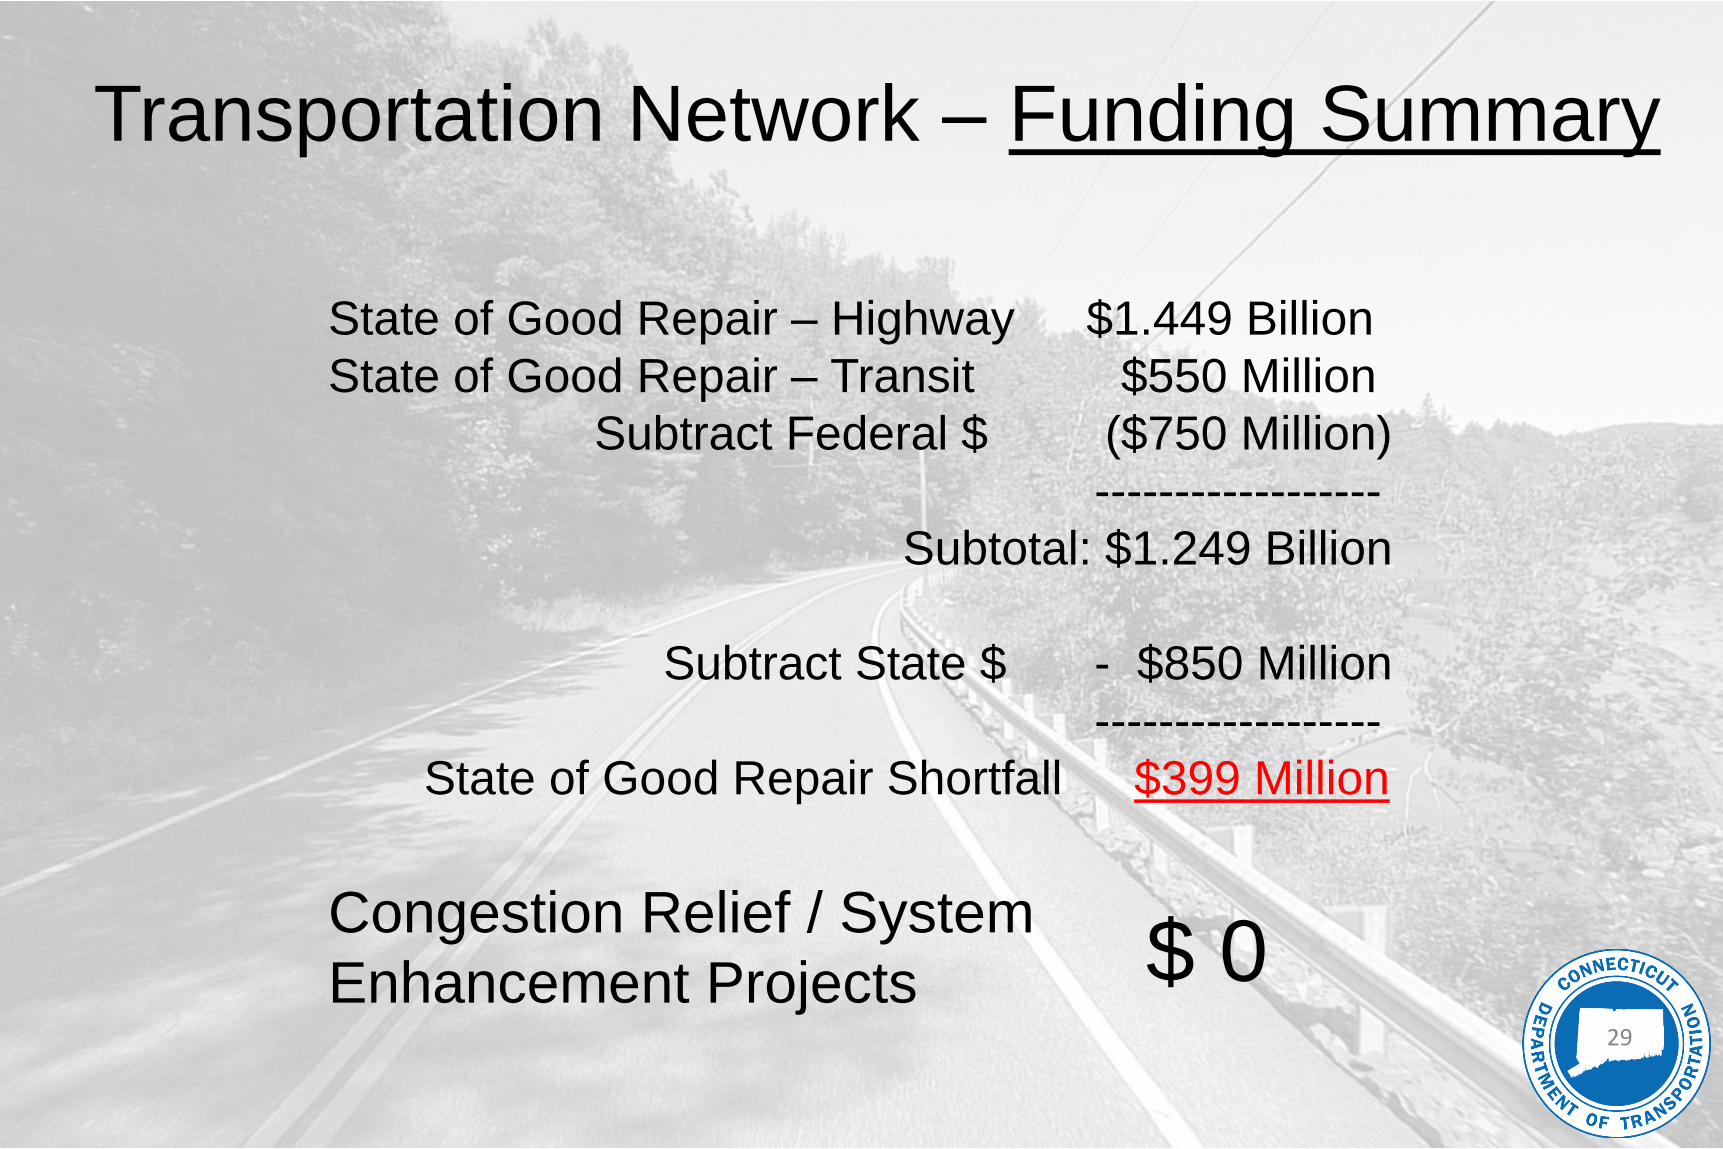
State of Good Repair – Highway $1.449 Billion
State of Good Repair – Transit $550 Million
Subtract Federal $ ($750 Million)
------------------
Subtotal: $1.249 Billion
Subtract State $ - $850 Million
------------------
State of Good Repair Shortfall $399 Million
Congestion Relief / System
Enhancement Projects $ 0
Transportation Network – Funding Summary
29
The Current Financial Condition of
Connecticut’s Transportation SystemJune 19, 2019
Secretary Melissa McCaw
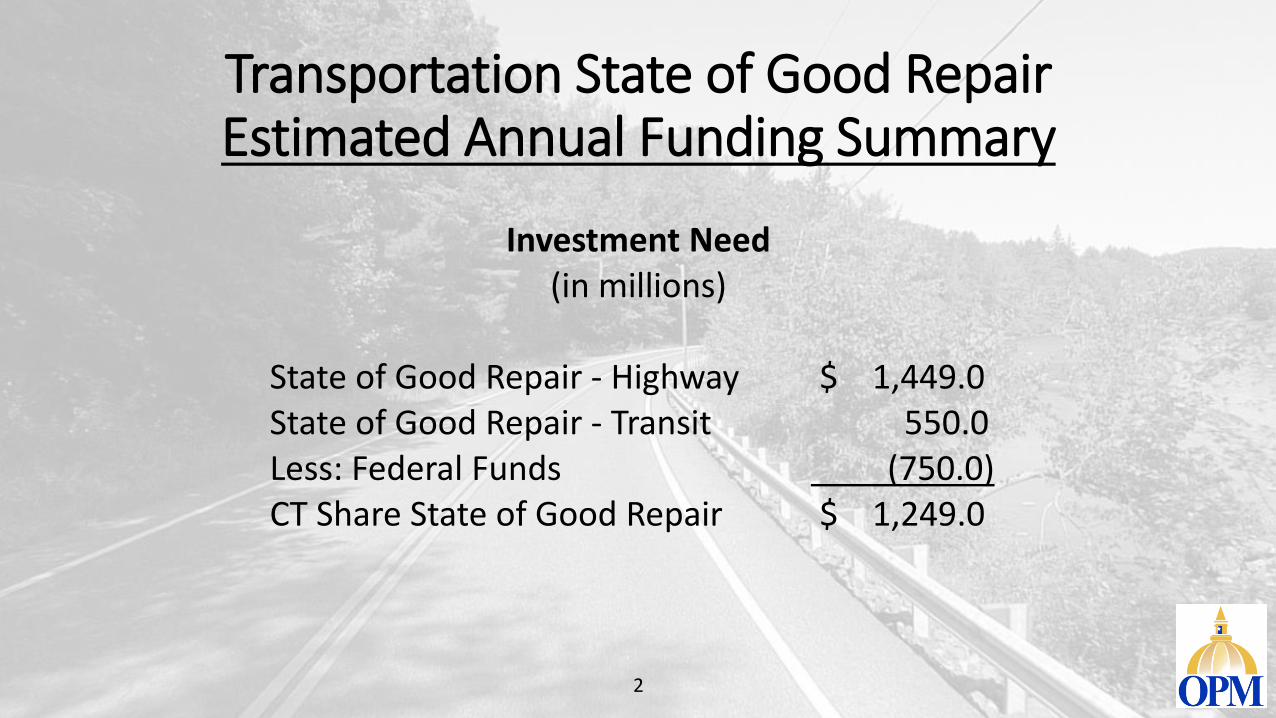
Transportation State of Good RepairEstimated Annual Funding Summary
2
Investment Need(in millions)
State of Good Repair - Highway $ 1,449.0 State of Good Repair - Transit 550.0 Less: Federal Funds (750.0)CT Share State of Good Repair $ 1,249.0
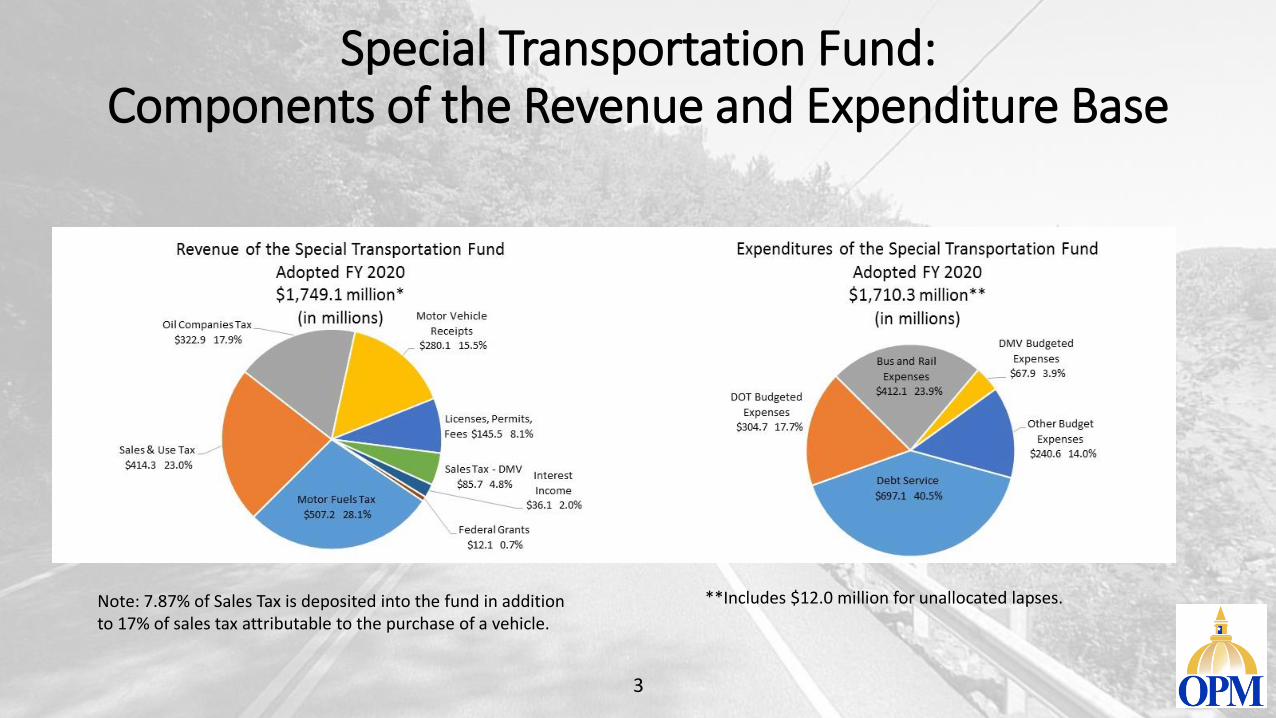
Special Transportation Fund:Components of the Revenue and Expenditure Base
Note: 7.87% of Sales Tax is deposited into the fund in addition to 17% of sales tax attributable to the purchase of a vehicle.
**Includes $12.0 million for unallocated lapses.
3
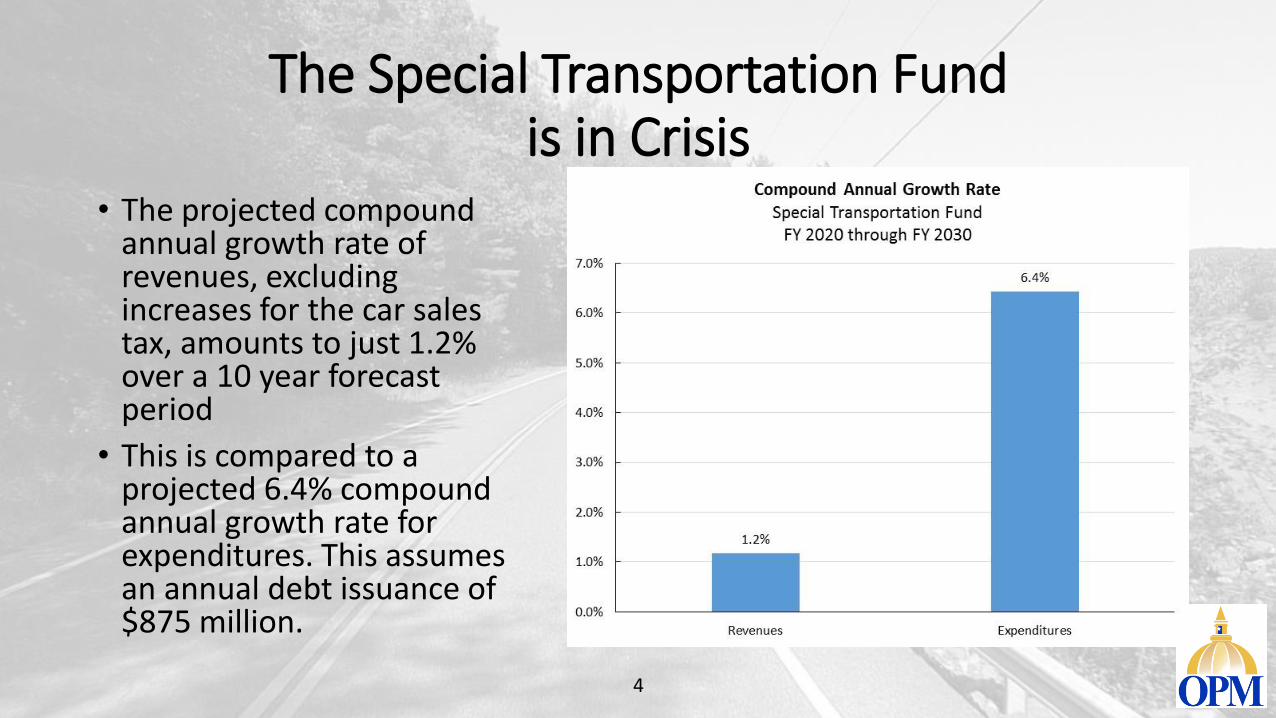
The Special Transportation Fundis in Crisis
• The projected compound annual growth rate of revenues, excluding increases for the car sales tax, amounts to just 1.2% over a 10 year forecast period
• This is compared to a projected 6.4% compound annual growth rate for expenditures. This assumes an annual debt issuance of $875 million.
4
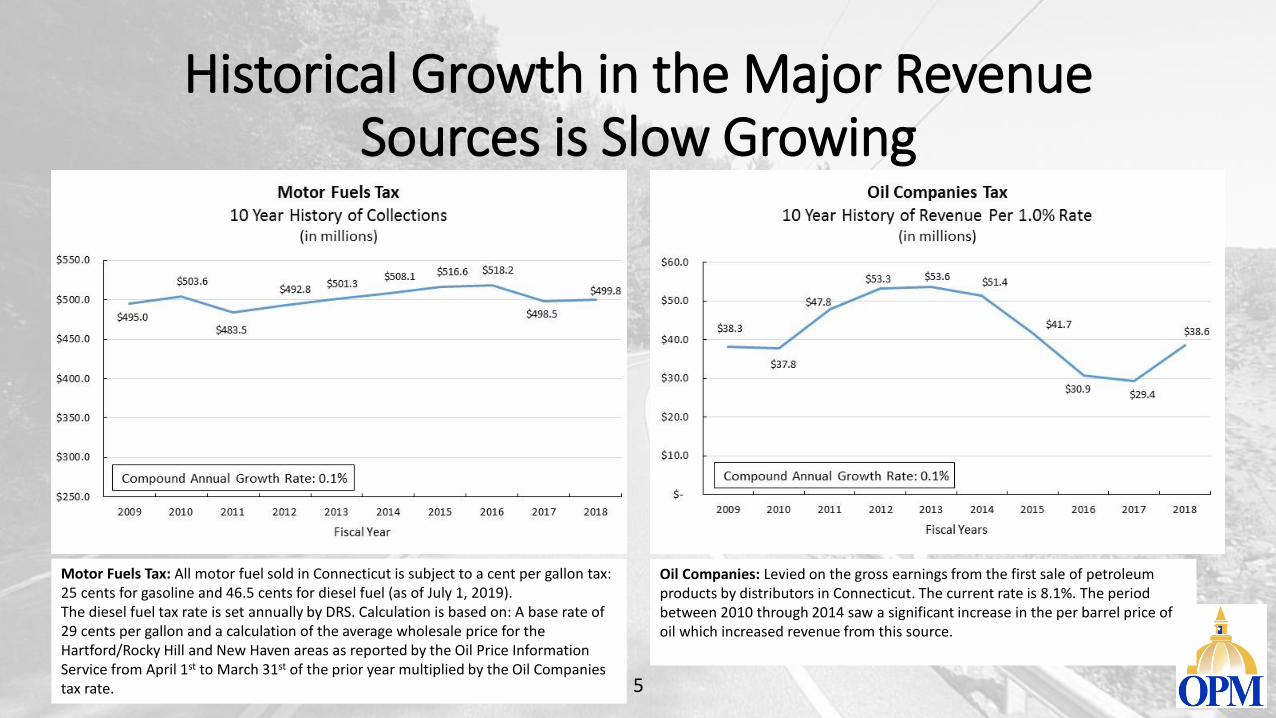
Historical Growth in the Major Revenue Sources is Slow Growing
Motor Fuels Tax: All motor fuel sold in Connecticut is subject to a cent per gallon tax: 25 cents for gasoline and 46.5 cents for diesel fuel (as of July 1, 2019). The diesel fuel tax rate is set annually by DRS. Calculation is based on: A base rate of 29 cents per gallon and a calculation of the average wholesale price for the Hartford/Rocky Hill and New Haven areas as reported by the Oil Price Information Service from April 1st to March 31st of the prior year multiplied by the Oil Companies tax rate.
Oil Companies: Levied on the gross earnings from the first sale of petroleum products by distributors in Connecticut. The current rate is 8.1%. The period between 2010 through 2014 saw a significant increase in the per barrel price of oil which increased revenue from this source.
5
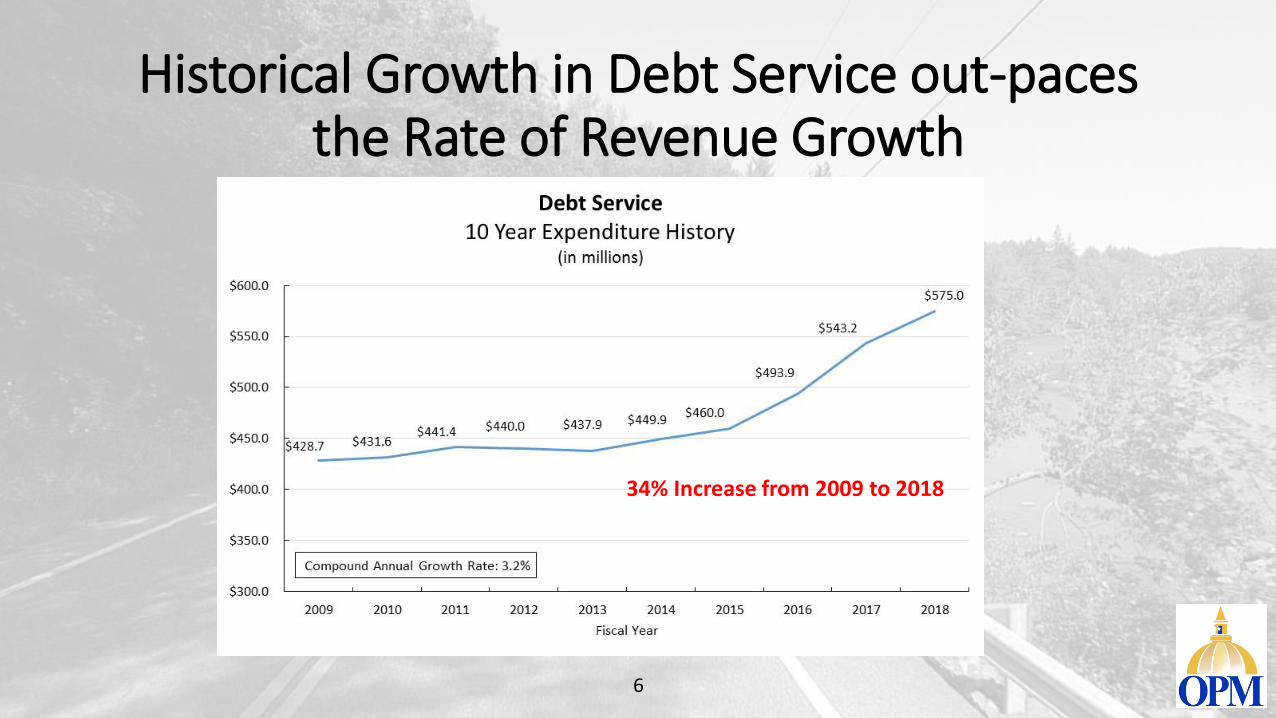
Historical Growth in Debt Service out-paces the Rate of Revenue Growth
6
34% Increase from 2009 to 2018
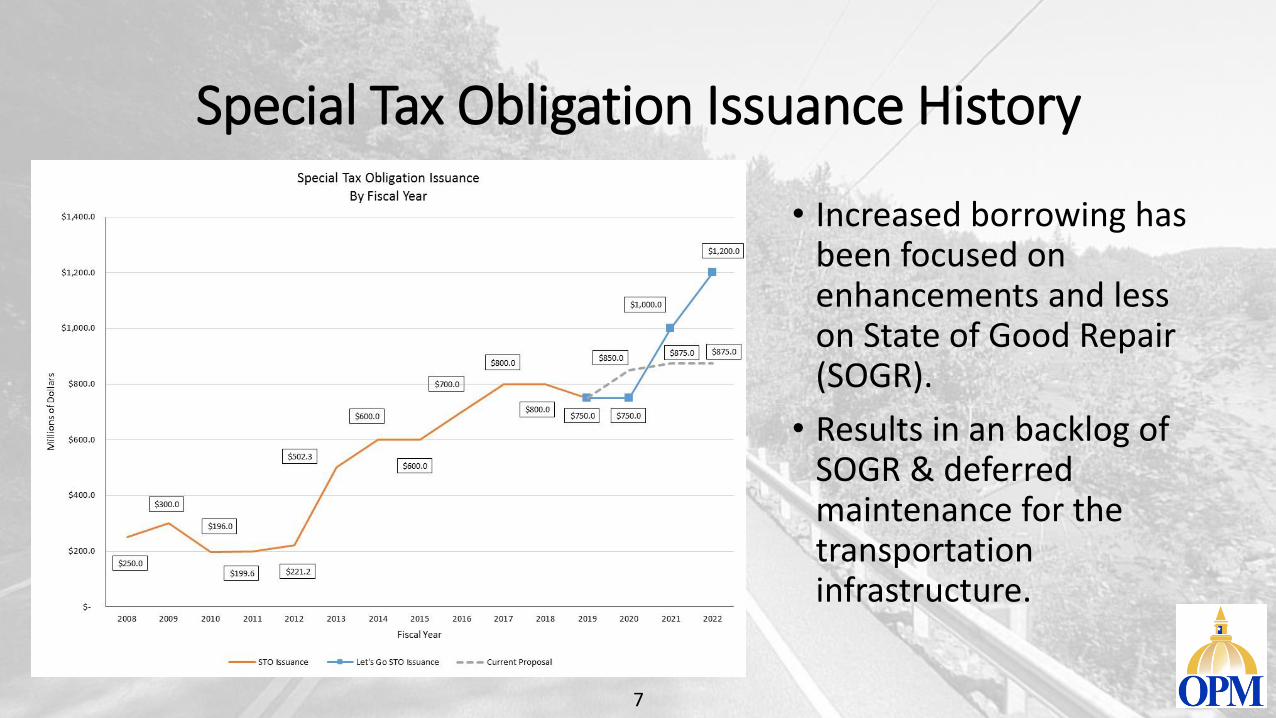
Special Tax Obligation Issuance History
7
• Increased borrowing has been focused on enhancements and less on State of Good Repair (SOGR).
• Results in an backlog of SOGR & deferred maintenance for the transportation infrastructure.
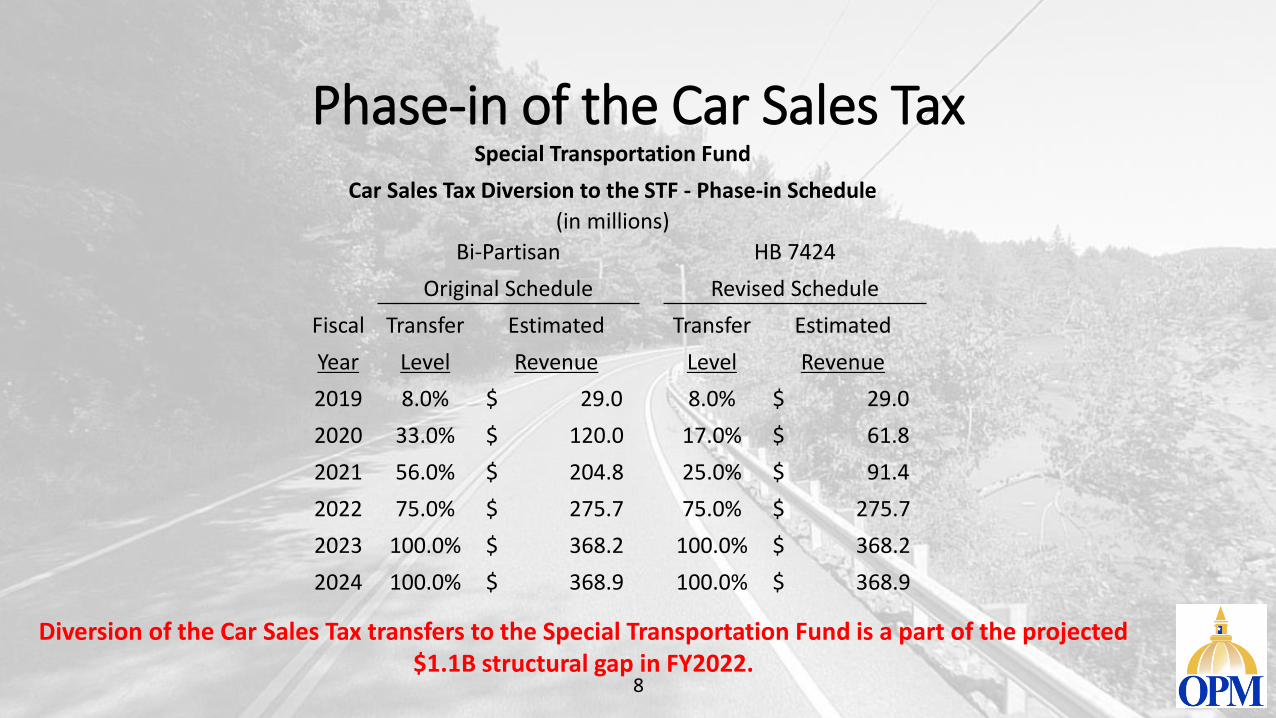
Phase-in of the Car Sales TaxSpecial Transportation Fund
Car Sales Tax Diversion to the STF - Phase-in Schedule
(in millions)
Bi-Partisan HB 7424
Original Schedule Revised Schedule
Fiscal Transfer Estimated Transfer Estimated
Year Level Revenue Level Revenue
2019 8.0% $ 29.0 8.0% $ 29.0
2020 33.0% $ 120.0 17.0% $ 61.8
2021 56.0% $ 204.8 25.0% $ 91.4
2022 75.0% $ 275.7 75.0% $ 275.7
2023 100.0% $ 368.2 100.0% $ 368.2
2024 100.0% $ 368.9 100.0% $ 368.9
8
Diversion of the Car Sales Tax transfers to the Special Transportation Fund is a part of the projected $1.1B structural gap in FY2022.
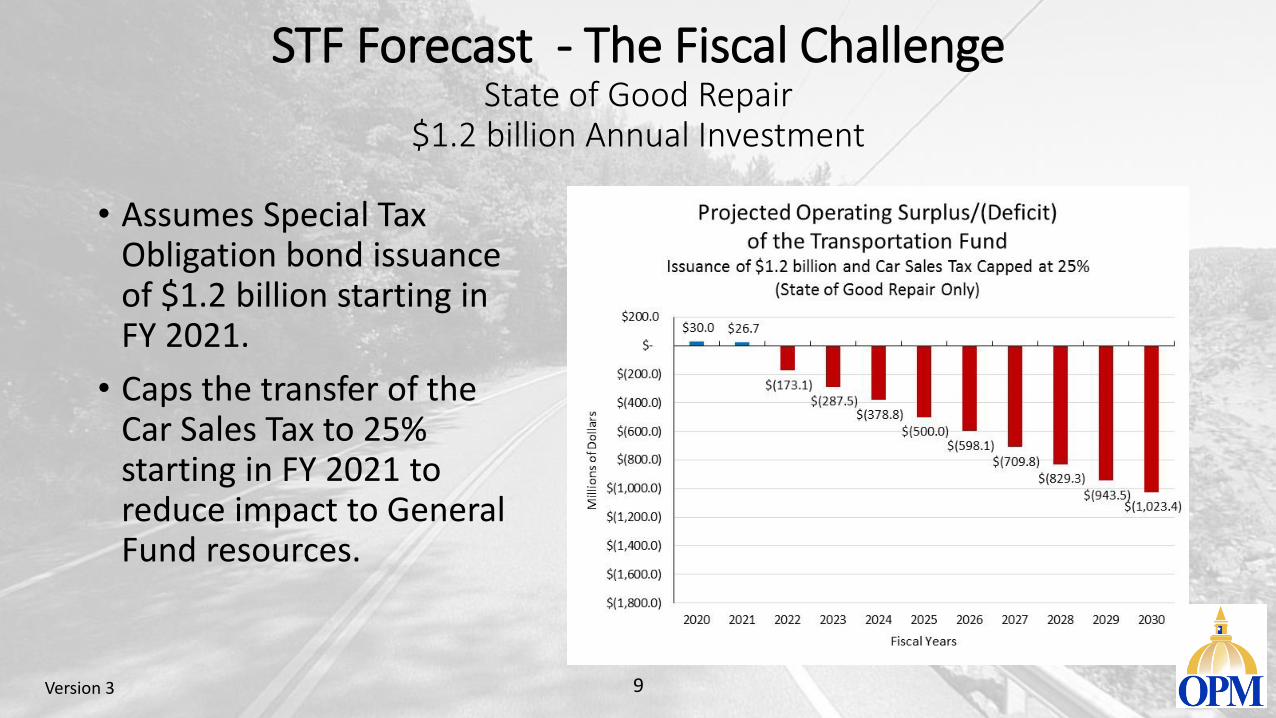
STF Forecast - The Fiscal ChallengeState of Good Repair
$1.2 billion Annual Investment
• Assumes Special Tax Obligation bond issuance of $1.2 billion starting in FY 2021.
• Caps the transfer of the Car Sales Tax to 25% starting in FY 2021 to reduce impact to General Fund resources.
Version 3 9
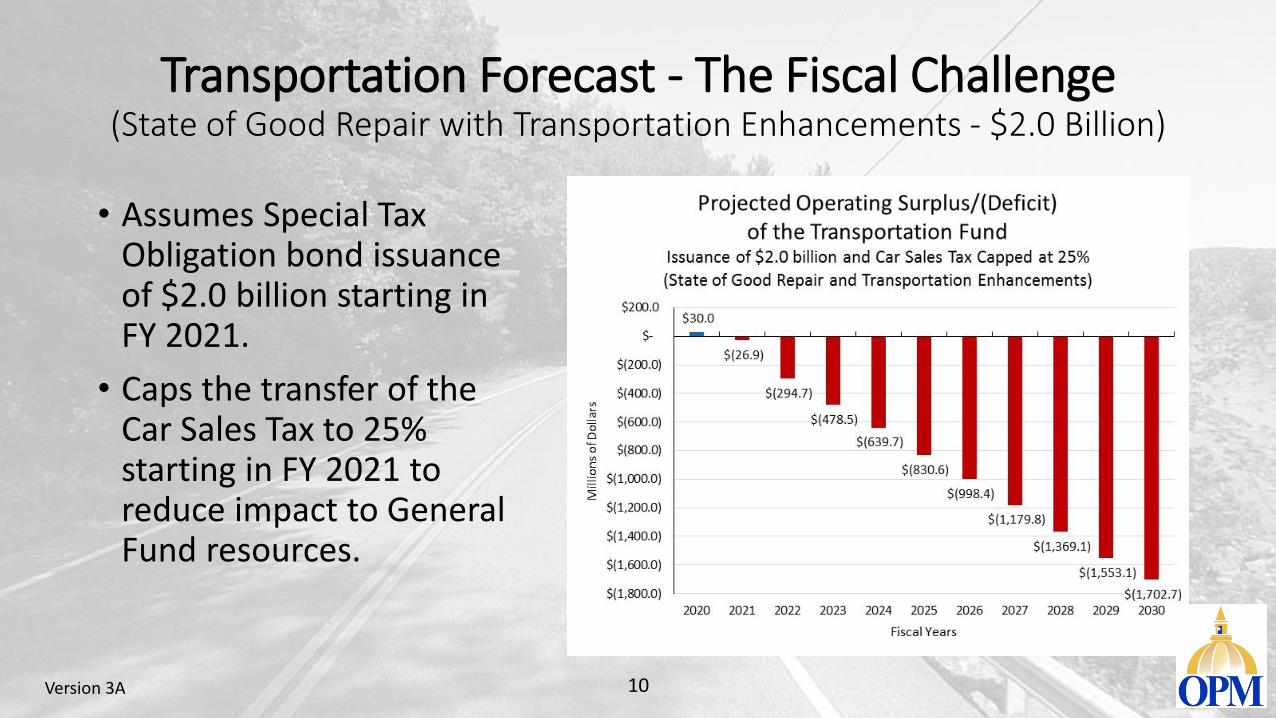
Transportation Forecast - The Fiscal Challenge(State of Good Repair with Transportation Enhancements - $2.0 Billion)
• Assumes Special Tax Obligation bond issuance of $2.0 billion starting in FY 2021.
• Caps the transfer of the Car Sales Tax to 25% starting in FY 2021 to reduce impact to General Fund resources.
Version 3A 10
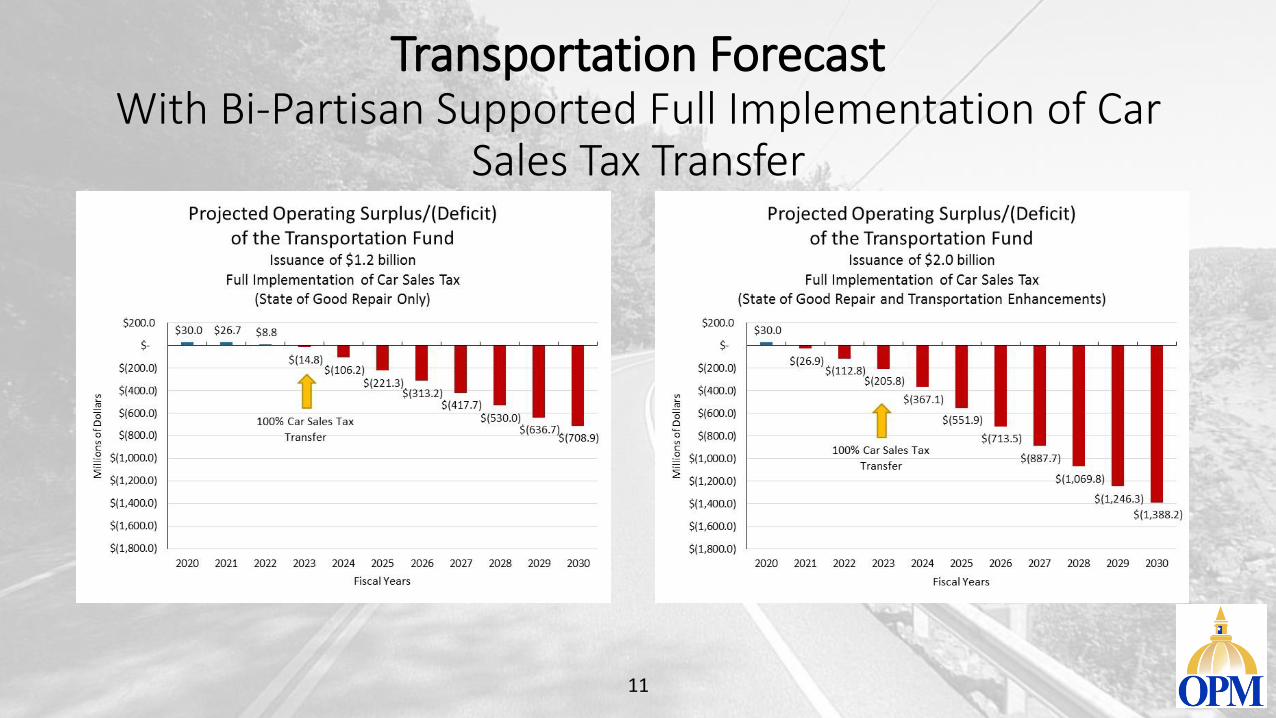
Transportation ForecastWith Bi-Partisan Supported Full Implementation of Car
Sales Tax Transfer
11
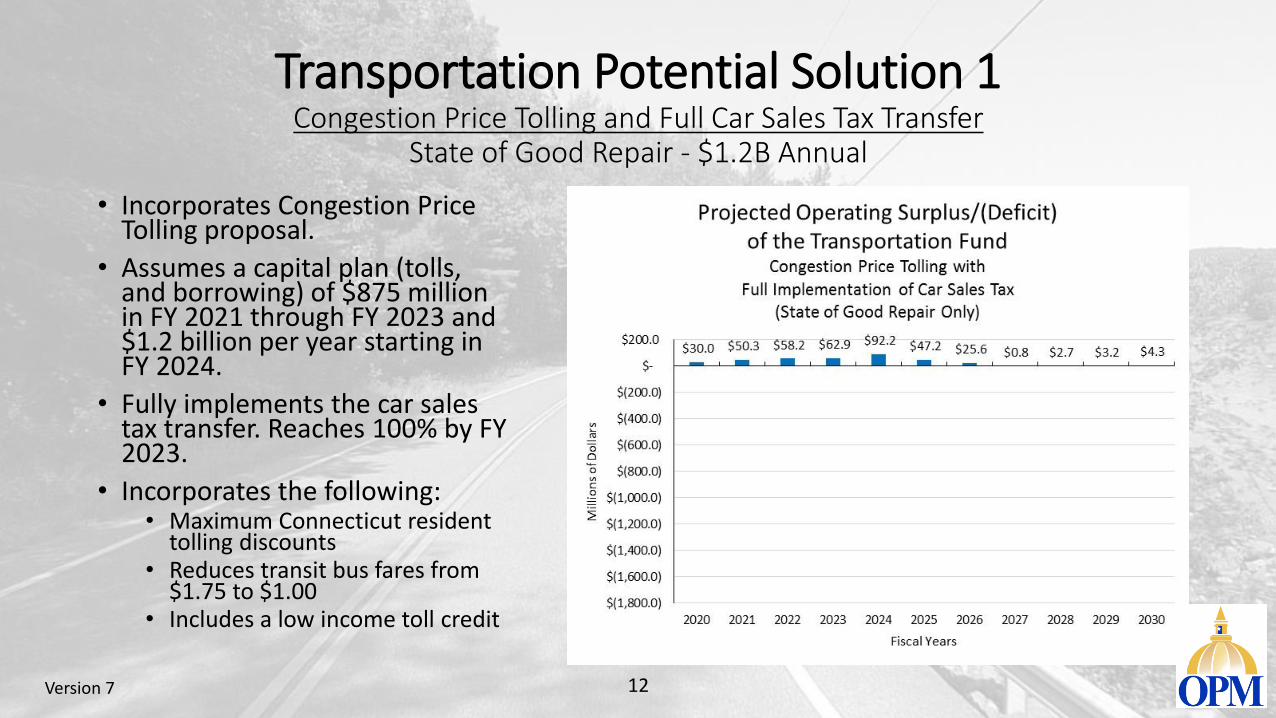
Transportation Potential Solution 1Congestion Price Tolling and Full Car Sales Tax Transfer
State of Good Repair - $1.2B Annual
• Incorporates Congestion Price Tolling proposal.
• Assumes a capital plan (tolls, and borrowing) of $875 million in FY 2021 through FY 2023 and $1.2 billion per year starting in FY 2024.
• Fully implements the car sales tax transfer. Reaches 100% by FY 2023.
• Incorporates the following:• Maximum Connecticut resident
tolling discounts• Reduces transit bus fares from
$1.75 to $1.00• Includes a low income toll credit
Version 7 12
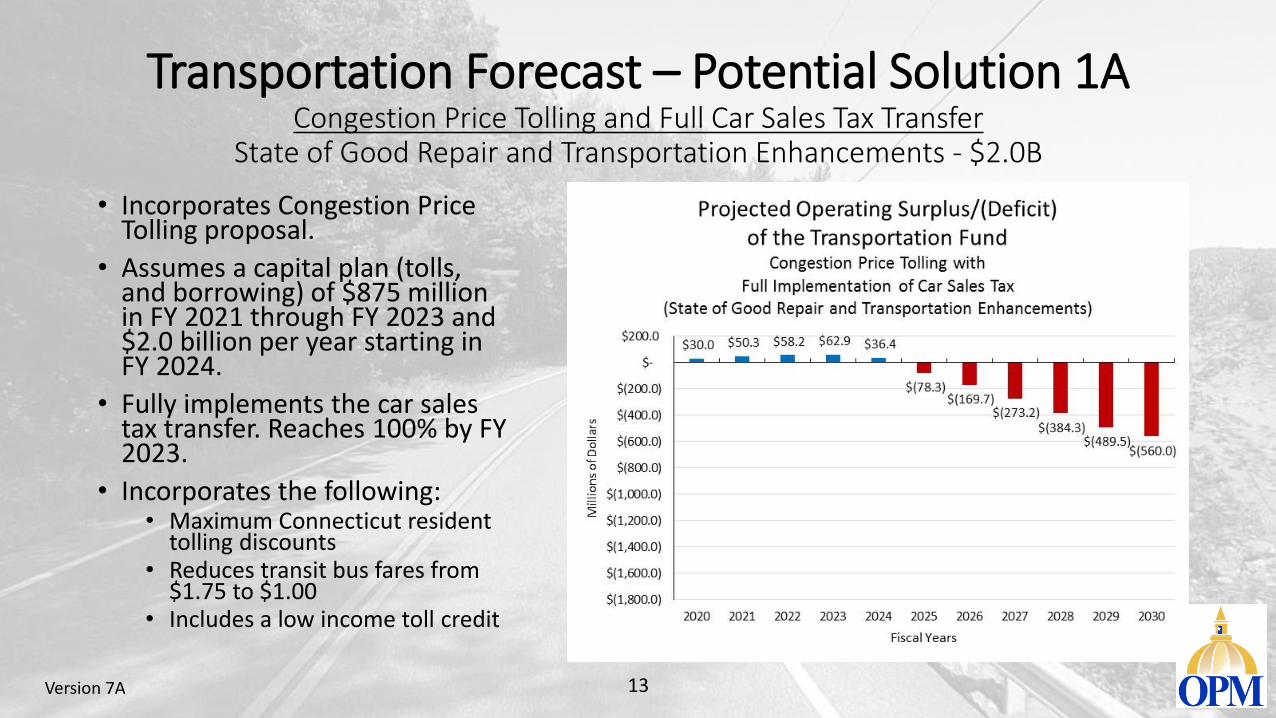
Transportation Forecast – Potential Solution 1ACongestion Price Tolling and Full Car Sales Tax Transfer
State of Good Repair and Transportation Enhancements - $2.0B
• Incorporates Congestion Price Tolling proposal.
• Assumes a capital plan (tolls, and borrowing) of $875 million in FY 2021 through FY 2023 and $2.0 billion per year starting in FY 2024.
• Fully implements the car sales tax transfer. Reaches 100% by FY 2023.
• Incorporates the following:• Maximum Connecticut resident
tolling discounts• Reduces transit bus fares from
$1.75 to $1.00• Includes a low income toll credit
Version 7A 13
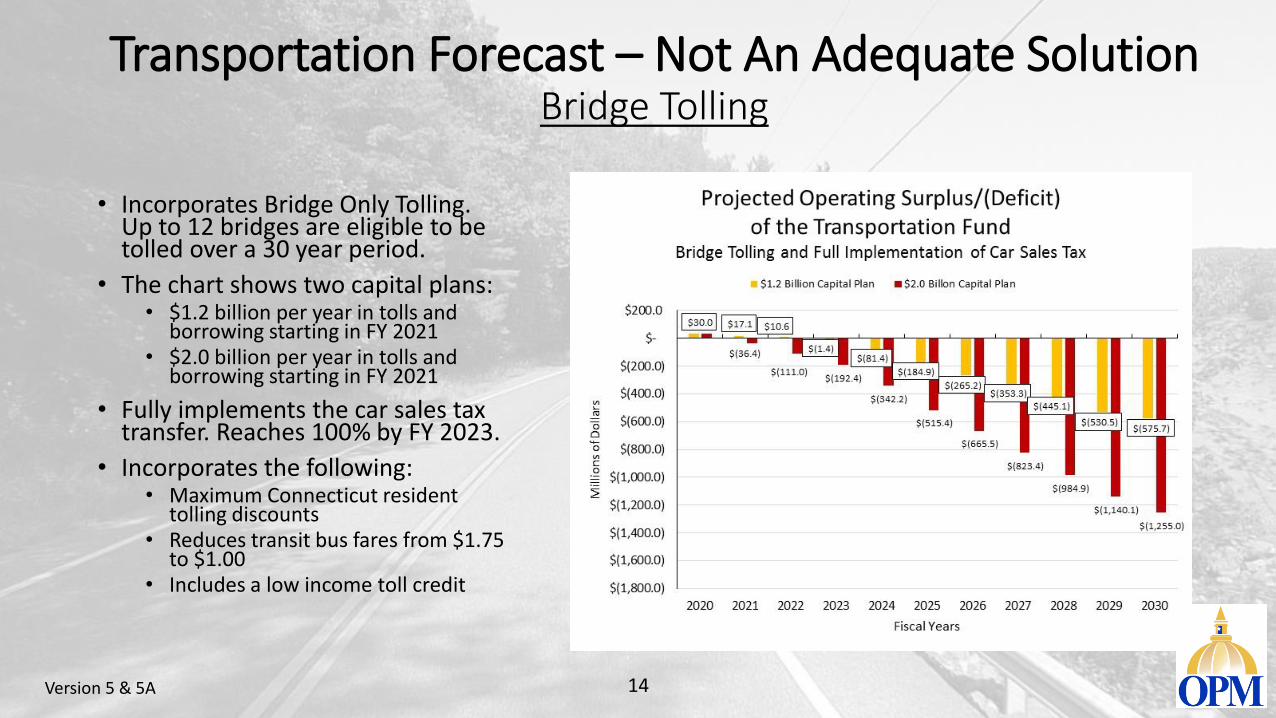
Transportation Forecast – Not An Adequate SolutionBridge Tolling
• Incorporates Bridge Only Tolling. Up to 12 bridges are eligible to be tolled over a 30 year period.
• The chart shows two capital plans:• $1.2 billion per year in tolls and
borrowing starting in FY 2021• $2.0 billion per year in tolls and
borrowing starting in FY 2021
• Fully implements the car sales tax transfer. Reaches 100% by FY 2023.
• Incorporates the following:• Maximum Connecticut resident
tolling discounts• Reduces transit bus fares from $1.75
to $1.00• Includes a low income toll credit
Version 5 & 5A 14
Rating Agency Comments
• Rating Agencies have concerns over the interdependence of the Special Transportation Fund and the General Fund• General Fund needs to show structural improvement before the Special Tax
Obligation bond ratings could improve
• Each rating agency has noted the slow growing nature of the Special Transportation Fund’s revenue streams. There are concerns that significant increases in investment would not be able to be covered by the current revenues within the fund.
15
Concerns• Transportation expenses are outpacing revenue by a ratio of 5:1.
• Most of our infrastructure is near or past its expected life span.
• Past expenditures did not keep up with maintenance needs.
• There is a cost to “kicking the can.”
• Congestion now threatens the state’s economic development.
• Every year we delay action puts us further behind other states, exacerbating the economic development challenges and puts CT at a disadvantage.
• The current economic expansion will come to an end eventually, at which time asking for new revenue from the public will be even more difficult.
16
Conclusion• In order to put Connecticut on a path to growth, our transportation
infrastructure must be addressed. We have to get CT moving again!
• This is about growth, quality of life and fiscal responsibility.
• The financials demonstrate that the Special Transportation Fund is in crisis without any action
• The infrastructure conditions assessment indicates we are on a declining path.
• In order to achieve the economic growth goals and fiscal sustainability the Special Transportation Fund would require the 100% fulfillment of the car sales tax transfer AND congestion price tolling in order to achieve a state of good repair for the existing transportation network. Additional enhancements will require further financing and/or additional revenues.
17
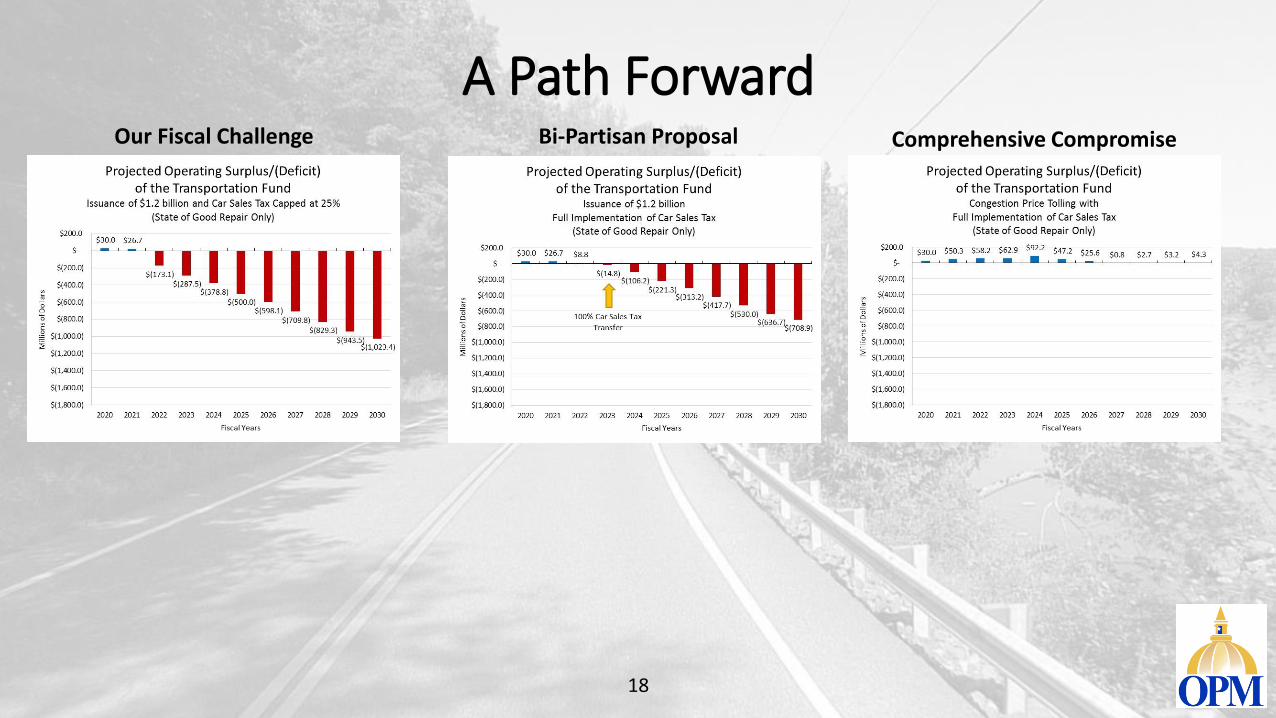
A Path Forward
18
Our Fiscal Challenge Bi-Partisan Proposal Comprehensive Compromise
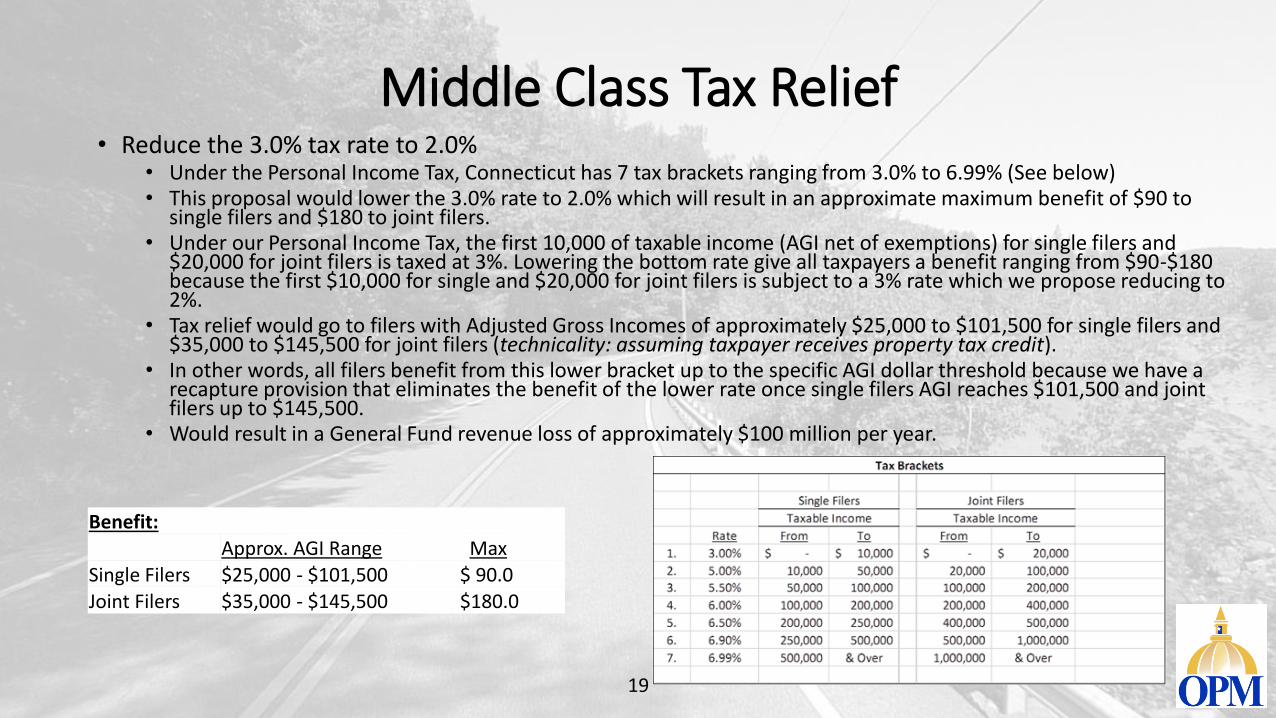
Middle Class Tax Relief• Reduce the 3.0% tax rate to 2.0%
• Under the Personal Income Tax, Connecticut has 7 tax brackets ranging from 3.0% to 6.99% (See below)• This proposal would lower the 3.0% rate to 2.0% which will result in an approximate maximum benefit of $90 to
single filers and $180 to joint filers. • Under our Personal Income Tax, the first 10,000 of taxable income (AGI net of exemptions) for single filers and
$20,000 for joint filers is taxed at 3%. Lowering the bottom rate give all taxpayers a benefit ranging from $90-$180 because the first $10,000 for single and $20,000 for joint filers is subject to a 3% rate which we propose reducing to 2%.
• Tax relief would go to filers with Adjusted Gross Incomes of approximately $25,000 to $101,500 for single filers and $35,000 to $145,500 for joint filers (technicality: assuming taxpayer receives property tax credit).
• In other words, all filers benefit from this lower bracket up to the specific AGI dollar threshold because we have a recapture provision that eliminates the benefit of the lower rate once single filers AGI reaches $101,500 and joint filers up to $145,500.
• Would result in a General Fund revenue loss of approximately $100 million per year.
19
Benefit:Approx. AGI Range Max
Single Filers $25,000 - $101,500 $ 90.0 Joint Filers $35,000 - $145,500 $180.0
20
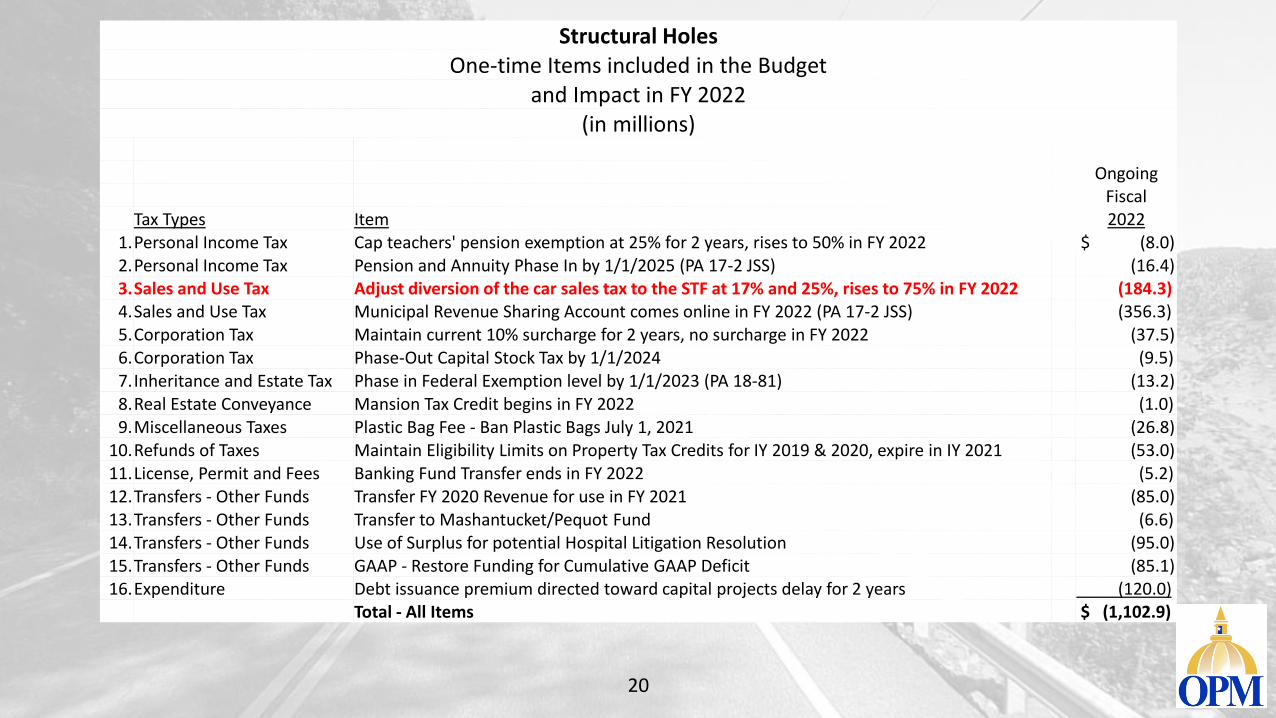
Structural HolesOne-time Items included in the Budget
and Impact in FY 2022(in millions)
OngoingFiscal
Tax Types Item 20221.Personal Income Tax Cap teachers' pension exemption at 25% for 2 years, rises to 50% in FY 2022 $ (8.0)2.Personal Income Tax Pension and Annuity Phase In by 1/1/2025 (PA 17-2 JSS) (16.4)3.Sales and Use Tax Adjust diversion of the car sales tax to the STF at 17% and 25%, rises to 75% in FY 2022 (184.3)4.Sales and Use Tax Municipal Revenue Sharing Account comes online in FY 2022 (PA 17-2 JSS) (356.3)5.Corporation Tax Maintain current 10% surcharge for 2 years, no surcharge in FY 2022 (37.5)6.Corporation Tax Phase-Out Capital Stock Tax by 1/1/2024 (9.5)7.Inheritance and Estate Tax Phase in Federal Exemption level by 1/1/2023 (PA 18-81) (13.2)8.Real Estate Conveyance Mansion Tax Credit begins in FY 2022 (1.0)9.Miscellaneous Taxes Plastic Bag Fee - Ban Plastic Bags July 1, 2021 (26.8)
10.Refunds of Taxes Maintain Eligibility Limits on Property Tax Credits for IY 2019 & 2020, expire in IY 2021 (53.0)11.License, Permit and Fees Banking Fund Transfer ends in FY 2022 (5.2)12.Transfers - Other Funds Transfer FY 2020 Revenue for use in FY 2021 (85.0)13.Transfers - Other Funds Transfer to Mashantucket/Pequot Fund (6.6)14.Transfers - Other Funds Use of Surplus for potential Hospital Litigation Resolution (95.0)15.Transfers - Other Funds GAAP - Restore Funding for Cumulative GAAP Deficit (85.1)16.Expenditure Debt issuance premium directed toward capital projects delay for 2 years (120.0)
Total - All Items $ (1,102.9)
21
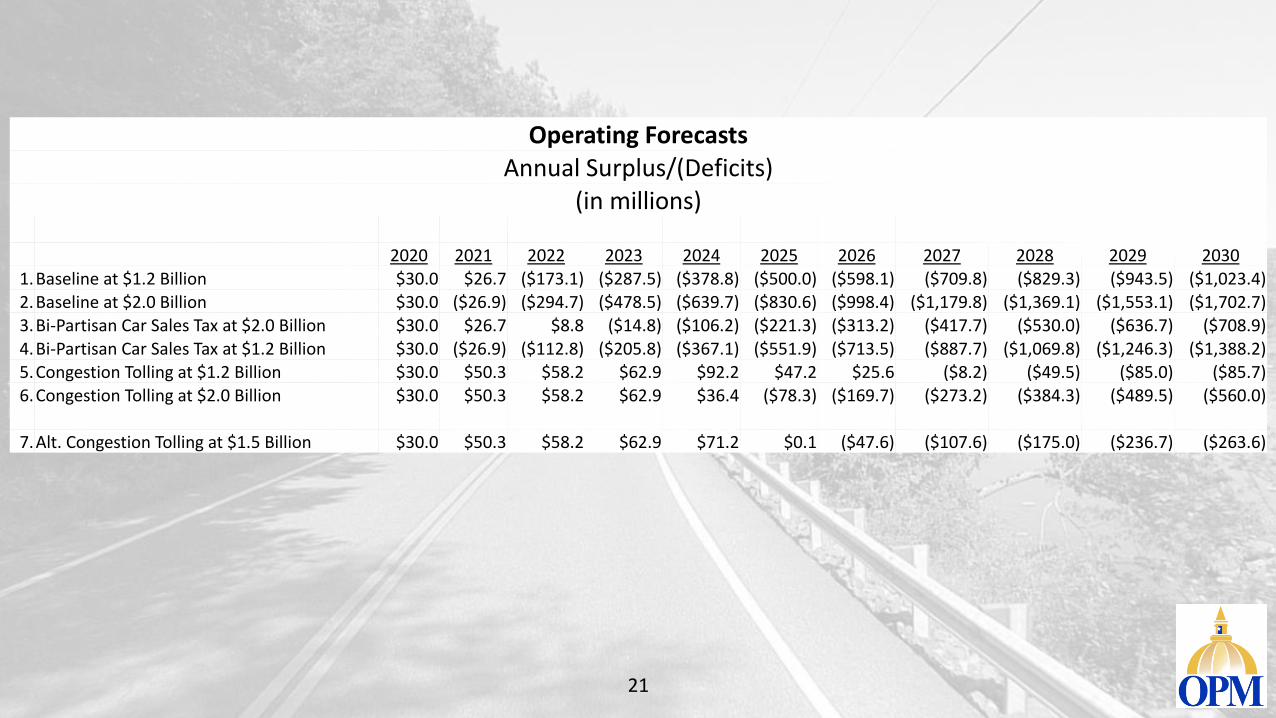
Operating Forecasts Annual Surplus/(Deficits)
(in millions)
2020 2021 2022 2023 2024 2025 2026 2027 2028 2029 2030
1.Baseline at $1.2 Billion $30.0 $26.7 ($173.1) ($287.5) ($378.8) ($500.0) ($598.1) ($709.8) ($829.3) ($943.5) ($1,023.4)2.Baseline at $2.0 Billion $30.0 ($26.9) ($294.7) ($478.5) ($639.7) ($830.6) ($998.4) ($1,179.8) ($1,369.1) ($1,553.1) ($1,702.7)3.Bi-Partisan Car Sales Tax at $2.0 Billion $30.0 $26.7 $8.8 ($14.8) ($106.2) ($221.3) ($313.2) ($417.7) ($530.0) ($636.7) ($708.9)
4.Bi-Partisan Car Sales Tax at $1.2 Billion $30.0 ($26.9) ($112.8) ($205.8) ($367.1) ($551.9) ($713.5) ($887.7) ($1,069.8) ($1,246.3) ($1,388.2)5.Congestion Tolling at $1.2 Billion $30.0 $50.3 $58.2 $62.9 $92.2 $47.2 $25.6 ($8.2) ($49.5) ($85.0) ($85.7)
6.Congestion Tolling at $2.0 Billion $30.0 $50.3 $58.2 $62.9 $36.4 ($78.3) ($169.7) ($273.2) ($384.3) ($489.5) ($560.0)
7.Alt. Congestion Tolling at $1.5 Billion $30.0 $50.3 $58.2 $62.9 $71.2 $0.1 ($47.6) ($107.6) ($175.0) ($236.7) ($263.6)
Prioritize Progress
• Prioritize Progress would lead to growing levels of General Obligation debt service which are not currently anticipated nor funded.
• By the end of just the first 10 years, the Office of Policy and Management estimates that the debt service cost would exceed $600 million per year and result in more than $7.0 billion additional GO debt issued by 2030.• This is nearly equivalent to a 1.0% increase in the Sales and Use tax.
• Would require significant reduction in other bond priorities in order to achieve the debt service levels described in the biennial budget.
• Prioritize Progress would place the bill squarely with the taxpayers of the State of Connecticut by increasing the state’s fixed costs and crowding out other essential programs.
22
Tolling – Making it Easier for CT Residents
• 30% In-State Discount for all Connecticut based E-ZPass
• 20% Frequent Driver Discount (Commuter Discount)
• Lowers Bus Fares from $1.75 to $1.00, a 43% discount
• 20% Low Income Toll Credit up to 125% of Federal Poverty Level (AGI of $15,612 to $32,187)
23