Embed Size (px)
Citation preview

Towards a healthy and sustainable workforce for the futureThe current health and wellbeing of the nursing and midwifery workforce in Wales.
Benjamin J. Gray, Diana Bright, Sian Bolton, Alisha R. Davies
Towards a healthy and sustainable workforce for the future
Towards a healthy and sustainable workforce for the futureThe current health and wellbeing of the nursing and midwifery workforce in Wales.
AuthorsBenjamin J. Gray, Diana Bright, Sian Bolton, Alisha R. Davies.
AffiliationResearch and Evaluation Division, Knowledge Directorate, Public Health Wales
AcknowledgementsWe would like to thank all the respondents for taking part in this survey. We would also like to thank the following: Candace Imison (personal capacity), Dr Richard Kyle (Edinburgh Napier University), Helen Rogers (Royal College of Midwives Wales), Helen Whyley (Royal College of Nursing Wales) and our colleague within Public Health Wales, Rhiannon Beaumont-Wood who peer-reviewed and provided valuable comments on earlier drafts of this report.
Suggested CitationGray BJ, Bright D, Bolton S and Davies AR. (2020). Towards a healthy and sustainable workforce for the future. The current health and wellbeing of the nursing and midwifery workforce in Wales. Cardiff: Public Health Wales NHS Trust
ISBN 978-1-78986-154-62
© 2020 Public Health Wales. Material contained in this document may be reproduced under the terms of the Open Government Licence (OGL) www.nationalarchives.gov.uk/doc/open-government-licence/version/3/ provided it is done so accurately and is not used in a misleading context. Acknowledgement to Public Health Wales to be stated.Copyright in the typographical arrangement, design and layout belongs to Public Health Wales.
Research and Evaluation Division Knowledge DirectoratePublic Health Wales Number 2 Capital QuarterTyndall StreetCardiff CF10 4BZ
Tel: +44 (0)29 2022 7744
phw.nhs.wales/NursingMidwiferyWorkforce
Towards a healthy and sustainable workforce for the future
i
Foreword
One of the four core aims that underpins A Healthier Wales (2018), the ten year plan for health and social services, specifically relates to supporting and developing the workforce, as it is recognised that without such investment the strategy will fail to deliver the services the population needs now and in the future. Nursing and midwifery staff make up the largest proportion of clinical NHS staff and play a significant role in social care services, specifically where individuals need nursing care. It is therefore essential that studies, such as this one conducted by Public Health Wales and described in this report, are undertaken so that we can understand the challenges facing front line staff, with the ultimate goal to take action to improve their overall health and wellbeing while in work.
The work undertaken by nursing and midwifery staff is at times rewarding as well as physically and emotionally challenging. Clearly enabling individual staff to make healthy lifestyle choices and achieve a balance between work and home-life is good for the practitioner as well as ensuring we have a healthy workforce. Equally important, however, is how employers support staff who find themselves unwell, undergoing life experiences such as childbirth or bereavement, or are struggling to cope with their mental health.
Welsh Government has been developing policies aimed at improving the health and wellbeing of the population, which includes the section of the population in work. The most recent of these is the Healthy Weight: Healthy Wales (2019) strategy, which is a 10 year long-term plan to prevent and reduce obesity in Wales. There are four themes included in the plan: healthy environments; healthy settings; healthy people; and leadership and enabling change. The strategy sets out incremental changes designed to enable individuals to care for themselves as well as actions we can take to improve our environment.
While there is much that an individual can do to promote their own health and wellbeing, eg not smoking, maintaining a healthy weight, moderation in alcohol consumption or taking regular exercise, there are also actions that employers can take to support its workforce. Healthy Working Wales (http://www.healthyworkingwales.wales.nhs.uk/home) is a programme that helps employers to develop and sustain environments, policies and cultures that promote good health and support the appropriate and timely return to work of those who are absent from work due to sickness or who have fallen out of employment due to periods of ill health. This is an underused tool in the workplace that should be utilised further.
This descriptive study looked at the views of approximately 5% of the nursing and midwifery workforce in Wales at a specific point in time and although its findings cannot be generalised to the workforce at large, it does provide an indication of the challenges some staff are facing in our health and social care services. The findings provide food for thought for readers who have responsibilities for the management of staff or are involved in redesigning our services for the future.
Prof Jean White CBE MStJChief Nursing Officer
Towards a healthy and sustainable workforce for the future
ii
Towards a healthy and sustainable workforce for the future
1
Contents
Executive Summary 2
1 Introduction 7
2 Methodology 8
3 Findings 10
3.1 Characteristics of the nursing and midwifery workforce respondents ......................... 10
3.2 Current health and wellbeing ................................................................................................. 11
3.3 Health and wellbeing in the workplace ................................................................................ 13
3.3.1 Work-related stress .................................................................................................. 133.3.2 Presenteeism ............................................................................................................. 143.3.3 Barrierswhenaccessinghealthcareandfluvaccination .................................. 153.3.4 Working environment and health .......................................................................... 183.3.5 Improvements for health and wellbeing .............................................................. 19
3.4 Job satisfaction and future plans .......................................................................................... 20
3.4.1 Feelings towards career and perceptions of value ............................................ 203.4.2 Feelings towards the profession/job in the past 12 months ........................... 22
3.5 Financial situation ..................................................................................................................... 25
4 Discussion 29
4.1 Current health and wellbeing ................................................................................................. 29
4.2 The working environment ....................................................................................................... 30
4.2.1 The impact of the working environment on health and wellbeing ................ 30
4.3 Feelings towards career and perceptions of value ............................................................ 32
4.4 Financial pressures and the associations with health and wellbeing ............................. 33
4.5 Identificationoftwoworkingpopulationsofconcern ...................................................... 34
4.5.1 Younger members of the nursing and midwifery workforce ........................... 344.5.2 Members of the workforce within NHS Pay Bands 5 and 6 .............................. 34
4.6 Wider implications for the future of the nursing workforce in Wales ........................... 35
4.7 Limitations of the study ........................................................................................................... 36
4.8 Conclusions ................................................................................................................................. 36
References 37
Appendices 39
Appendix 1. Detailed Methodology .............................................................................................. 39
Appendix 2. Supplementary Data .................................................................................................. 42

Towards a healthy and sustainable workforce for the future
2
Executive Summary
Background
• The nursing and midwifery workforce accounts for the largest occupational group within the healthcare workforce in Wales, with over 30,000 nurses, midwives and health care support workers currently working for the National Health Service (NHS).
• These health professionals have physically and mentally demanding roles, and the working pressures are reflected in high levels of sickness absence and presenteeism. More specifically, nurses have reported feeling overworked, underpaid, and unable to provide the level of care they would like, with many considering leaving the profession before retirement age.
• The long-term ambition of the Welsh Government is to transform healthcare in Wales from a hospital-based care and treatment model to a service that is predominantly based in the community and more focused on health, wellbeing, prevention and early intervention. The health and wellbeing, and ultimately, the sustainability of the health and social care workforce forms an integral component of these ambitions.
• In order to better understand the health and wellbeing of the nursing and midwifery workforce in Wales and the contributing factors, Public Health Wales carried out a national survey amongst the wider workforce in 2019.
• The cross-sectional survey was accessed online and invitations were sent via the Royal College of Nursing Wales and Royal College of Midwives Wales to their members in addition to being circulated via Directors of Nursing for each of the seven Health Boards and three NHS Trusts. In total, responses from 1,642 individuals from the nursing and midwifery workforce (nurses, midwives and health care support workers) were included in this study.
• It should be noted that as it was not possible to select a representative sample of the nursing and midwifery workforce in Wales from a sampling framework, the study design was cross-sectional. Therefore a key limitation is that the findings are unadjusted (to workforce distribution in Wales), and therefore descriptive and not generalisable to the entire nursing and midwifery workforce in Wales.
30,000+nurses,
midwives
& health caresupport workers
work for NHS Wales

Towards a healthy and sustainable workforce for the future
3
Findings
Current health and wellbeing (Sections 3.2 and 4.1)• Overall, a total of 1,642 valid responses were received and of
these, 89.5% were nurses, 5.4% were midwives and 5.1% were health care support workers. The majority of the nursing and midwifery workforce who responded (71.1%) indicated having good or very good general health. However, 36.5% reported they have a longstanding illness or condition.
• Low mental wellbeing was reported in 14.4% of all respondents and more specifically, 36.8% indicated that they had trouble feeling relaxed.
• Physical inactivity was reported in 38.9% of respondents, 9.2% reported being a current smoker, 9.6% reported binge drinking and 69.4% did not eat at least 5 fruit or vegetables daily.
Overall, other than a lower prevalence of current smokers and those experiencing limiting illnesses, the health of the nursing and midwifery workforce was similar to the working age population of Wales. However, within our respondents, there were certain subgroups that reported higher levels of poorer mental health, in particular, younger members of the nursing and midwifery workforce.
The working environment (Sections 3.3 and 4.2)Respondents were asked to reflect on their current work environment and impact on their health and wellbeing. These include work-related stress, presenteeism, barriers to health care and access to healthy food options.
• Over half of respondents (62.1%) reported suffering from work-related stress, and this was highest amongst female and younger staff members, and those in NHS Pay Bands 5 and 6 (64.4%, compared to 49.4% amongst Band 4 and below, and 60.1% amongst Band 7 and higher).
• Over half of respondents (61.0%) attended work when feeling unwell twice or more in the last 12 months. The three main reasons for attending work when unwell were preventable in part, namely (i) stress, (ii) respiratory illness, such as flu or cold and (iii) musculoskeletal conditions.
• The vast majority of the nursing workforce (89.0%) reported experiencing barriers when accessing healthcare appointments. Lack of time (75.4%), no cover/staff shortages (39.8%), waiting lists (31.5%), accessibility of services (28.0%) and concerns about their job (26.1%) were all commonly reported reasons.
• Just over two thirds (69.5%) of respondents reported having the flu vaccination in the last winter season. Amongst those not vaccinated (500/1,642), the three most reported barriers to uptake of the flu vaccination were fear of side effects (22.4%), not believing it works (19.8%) and lack of time (17.2%).
• Frequently missing breaks was reported by over half of respondents (50.6%) and this increased with pay bands. The majority of respondents reported that drinking water was readily available at their workplace (72.5%), yet only 58.5% stated they felt adequately hydrated. The opportunity to purchase healthy food, drink and snack options was lower in evening working hours.
Towards a healthy and sustainable workforce for the future
4
The nursing and midwifery workforce were provided with seven examples of interventions that could help to improve their health and wellbeing. The most popular suggestions were related to time (i.e. time to exercise and/or time to prepare meals) and financial incentives to support health such as reduced gym membership.
Feelings towards career and perceptions of value (Sections 3.4 and 4.3)• Three quarters of those who responded reported their
occupation was a rewarding career (75.3%), and over two thirds were enthusiastic about their job (69.1%). Over half would recommend a nursing, midwifery or health care support worker career to others (55.4%).
• A high proportion of respondents expressed feeling valued by patients (80.0%) and families of patients (69.8%), but felt less valued by senior staff (42.9%).
• A higher proportion of respondents in NHS Pay Bands 5 and 6 had considered leaving the profession in the past 12 months (54.4%, compared to 36.8% amongst Pay Band 4 and below, and 43.2% amongst Pay Band 7 and higher). Those within Pay Bands 5 and 6 also expressed lower levels of enthusiasm (towards the job) and feelings of value compared to other pay bands.
Financial pressures (Sections 3.5 and 4.4)• More than half of all respondents (50.7%) have needed to take some
action to meet daily living expenses in the last 12 months, this included 30.7% who worked overtime in their main job, 25.5% who borrowed money from family or friends, and 11.8% who worked an additional job.
• Over one third (38.2%) experienced financial difficulty in the last 12 months and the main consequences were cutting back on food or travel costs (31.1%) and struggling to pay gas or electricity bills (11.5%).
Financial pressures are a real concern for the nursing and midwifery workforce with 42.3% experiencing financial worries in the last 12 months. This was greater amongst males, younger members of the nursing workforce (18-39 years of age), those employed at NHS Pay Band 4 and below and those with poorer health outcomes.
Towards a healthy and sustainable workforce for the future
5
Considerations for future action
This report is one of the largest and most comprehensive cross-sectional surveys undertaken amongst the nursing and midwifery workforce in Wales and provides an understanding of their health and wellbeing. It explores the underlying challenges to health and wellbeing, including the impact of the work environment, including feelings towards their career and financial pressures. This survey includes the views from 1,642 nurses, midwives and health care workers across Wales who responded to the questionnaire, and whilst not a representative sample, it equates to ~5% of the Welsh NHS workforce. The results reflect a nursing and midwifery workforce who enjoy and are enthusiastic about their career but are also experiencing high levels of work-related stress, other work pressures and wider implications (e.g. financial concerns) that could lead to poorer health outcomes. In addition, there are specific groups who are experiencing these pressures more than others are. Key considerations for future action are:
1 Given that the working environment has a huge influence on health and wellbeing; managers, administrators and policy-makers are urged to develop and maintain supportive work environments in order to improve staff and patient outcomes. Two main areas of focus are outlined below:
• Support the mental wellbeing of the workforce: High levels of stress amongst the workforce is a concern, in particular amongst female staff, younger members of the workforce and those employed in NHS Pay Bands 5 and 6. There is a need to better understand and address the factors contributing to stress including system and cultural drivers of presenteeism (e.g. staffing pressures) and to ensure settings are healthy working environments, for example by enforcing work breaks and providing access to healthy food and drinks.
• Strengthen prevention of ill health: Levels of flu vaccine uptake are low amongst the nursing and midwifery workforce, and attending work when suffering from respiratory illness such as flu or a cold is common. Action is needed to address barriers to vaccination (e.g. informed by behavioural insights) and to encourage sick employees to stay at home.
2 Recognise and value the nursing and midwifery workforce:
• Over two thirds of the nursing and midwifery workforce felt the occupation was a rewarding career, and valued by patients and families, but fewer felt valued by senior staff. Action is needed to better understand the underlying contributing factors to inform action to address this imbalance. Following the concepts of fair work and adequately rewarding staff, with the potential for real and meaningful progression, could be important first steps.
3 Understand the root cause of financial pressures:
• The proportion of the nursing and midwifery workforce reporting financial pressure is of concern, given the links between financial pressures and poor health and wellbeing. Action is needed to understand the root causes of these pressures and co-produce solutions. Alongside, ensuring early access to financial advice and support for those currently in need.
Towards a healthy and sustainable workforce for the future
6
4 A focus on supporting the younger members of the nursing and midwifery workforce and those employed in NHS Pay Bands 5 and 6:
• These two groups of our respondents consistently reported poorer health and wellbeing outcomes. The need for targeted approaches should be considered in the development of actions to support the health and wellbeing of the workforce as a whole.
Our findings provide useful insights into the health and wellbeing of the Welsh nursing and midwifery workforce. The health and wellbeing of the nursing and midwifery workforce is not only important at a personal level, but also for the population that requires their services. The ageing demographics of the nursing and midwifery workforce, its declining health status mirroring the ageing of the population, balanced against increasing care needs, suggests that effective wellbeing strategies for nurses and midwives are essential not only to safeguard their health but to ensure a healthy and sustainable nursing and midwifery workforce for the future.
The findings and recommendations outlined in this report will help Welsh Government achieve their ambition of creating ‘a motivated and sustainable health and social care workforce’ that contributes to making the health and social care system fit for the future.
Towards a healthy and sustainable workforce for the future
7
1 Introduction
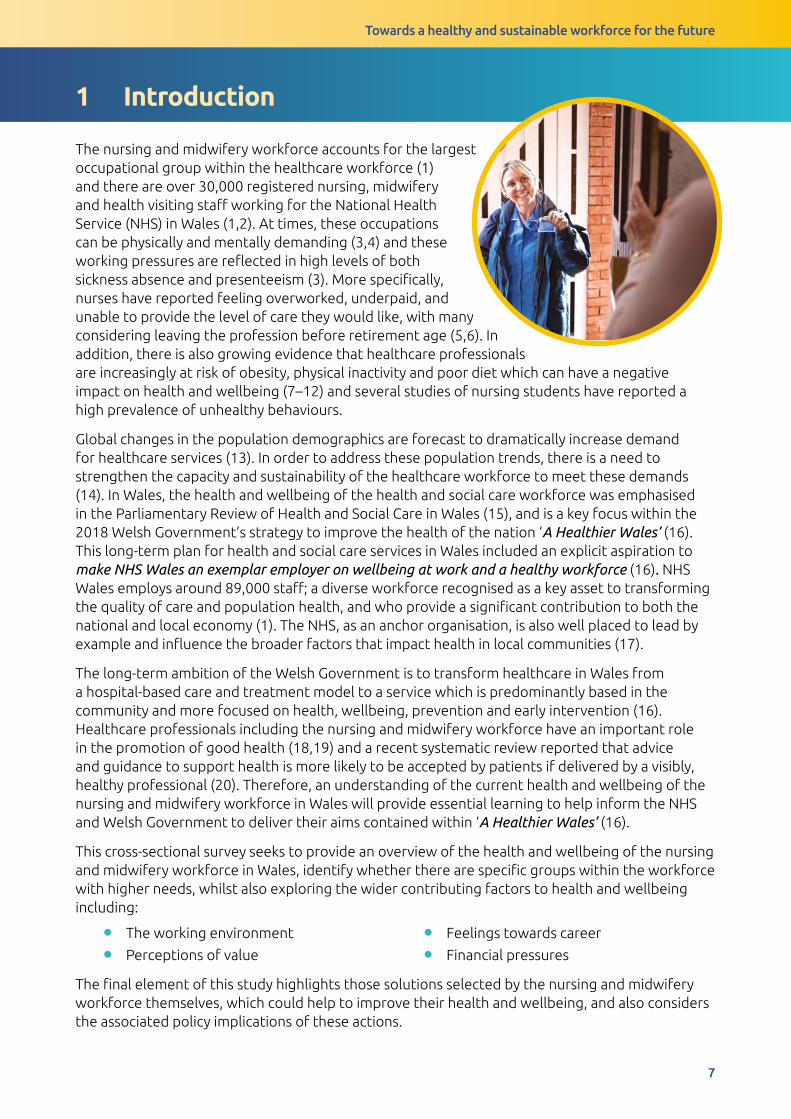
The nursing and midwifery workforce accounts for the largest occupational group within the healthcare workforce (1) and there are over 30,000 registered nursing, midwifery and health visiting staff working for the National Health Service (NHS) in Wales (1,2). At times, these occupations can be physically and mentally demanding (3,4) and these working pressures are reflected in high levels of both sickness absence and presenteeism (3). More specifically, nurses have reported feeling overworked, underpaid, and unable to provide the level of care they would like, with many considering leaving the profession before retirement age (5,6). In addition, there is also growing evidence that healthcare professionals are increasingly at risk of obesity, physical inactivity and poor diet which can have a negative impact on health and wellbeing (7–12) and several studies of nursing students have reported a high prevalence of unhealthy behaviours.
Global changes in the population demographics are forecast to dramatically increase demand for healthcare services (13). In order to address these population trends, there is a need to strengthen the capacity and sustainability of the healthcare workforce to meet these demands (14). In Wales, the health and wellbeing of the health and social care workforce was emphasised in the Parliamentary Review of Health and Social Care in Wales (15), and is a key focus within the 2018 Welsh Government’s strategy to improve the health of the nation ‘A Healthier Wales’ (16). This long-term plan for health and social care services in Wales included an explicit aspiration to make NHS Wales an exemplar employer on wellbeing at work and a healthy workforce (16). NHS Wales employs around 89,000 staff; a diverse workforce recognised as a key asset to transforming the quality of care and population health, and who provide a significant contribution to both the national and local economy (1). The NHS, as an anchor organisation, is also well placed to lead by example and influence the broader factors that impact health in local communities (17).
The long-term ambition of the Welsh Government is to transform healthcare in Wales from a hospital-based care and treatment model to a service which is predominantly based in the community and more focused on health, wellbeing, prevention and early intervention (16). Healthcare professionals including the nursing and midwifery workforce have an important role in the promotion of good health (18,19) and a recent systematic review reported that advice and guidance to support health is more likely to be accepted by patients if delivered by a visibly, healthy professional (20). Therefore, an understanding of the current health and wellbeing of the nursing and midwifery workforce in Wales will provide essential learning to help inform the NHS and Welsh Government to deliver their aims contained within ‘A Healthier Wales’ (16).
This cross-sectional survey seeks to provide an overview of the health and wellbeing of the nursing and midwifery workforce in Wales, identify whether there are specific groups within the workforce with higher needs, whilst also exploring the wider contributing factors to health and wellbeing including:
• The working environment • Feelings towards career
• Perceptions of value • Financial pressures
The final element of this study highlights those solutions selected by the nursing and midwifery workforce themselves, which could help to improve their health and wellbeing, and also considers the associated policy implications of these actions.
Towards a healthy and sustainable workforce for the future
8
2 Methodology
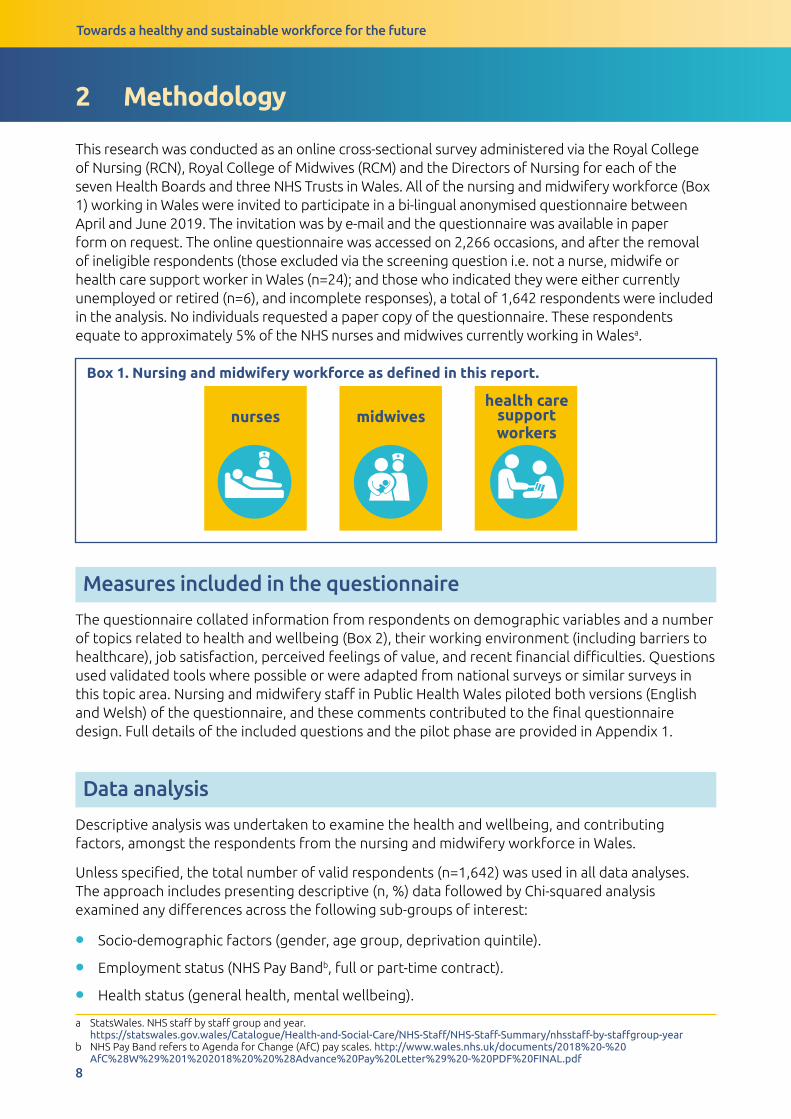
This research was conducted as an online cross-sectional survey administered via the Royal College of Nursing (RCN), Royal College of Midwives (RCM) and the Directors of Nursing for each of the seven Health Boards and three NHS Trusts in Wales. All of the nursing and midwifery workforce (Box 1) working in Wales were invited to participate in a bi-lingual anonymised questionnaire between April and June 2019. The invitation was by e-mail and the questionnaire was available in paper form on request. The online questionnaire was accessed on 2,266 occasions, and after the removal of ineligible respondents (those excluded via the screening question i.e. not a nurse, midwife or health care support worker in Wales (n=24); and those who indicated they were either currently unemployed or retired (n=6), and incomplete responses), a total of 1,642 respondents were included in the analysis. No individuals requested a paper copy of the questionnaire. These respondents equate to approximately 5% of the NHS nurses and midwives currently working in Walesa.
Box 1. Nursing and midwifery workforce as defined in this report.
Measures included in the questionnaire
The questionnaire collated information from respondents on demographic variables and a number of topics related to health and wellbeing (Box 2), their working environment (including barriers to healthcare), job satisfaction, perceived feelings of value, and recent financial difficulties. Questions used validated tools where possible or were adapted from national surveys or similar surveys in this topic area. Nursing and midwifery staff in Public Health Wales piloted both versions (English and Welsh) of the questionnaire, and these comments contributed to the final questionnaire design. Full details of the included questions and the pilot phase are provided in Appendix 1.
Data analysis
Descriptive analysis was undertaken to examine the health and wellbeing, and contributing factors, amongst the respondents from the nursing and midwifery workforce in Wales.
Unless specified, the total number of valid respondents (n=1,642) was used in all data analyses. The approach includes presenting descriptive (n, %) data followed by Chi-squared analysis examined any differences across the following sub-groups of interest:
• Socio-demographic factors (gender, age group, deprivation quintile).
• Employment status (NHS Pay Bandb, full or part-time contract).
• Health status (general health, mental wellbeing).
a StatsWales. NHS staff by staff group and year. https://statswales.gov.wales/Catalogue/Health-and-Social-Care/NHS-Staff/NHS-Staff-Summary/nhsstaff-by-staffgroup-year
b NHS Pay Band refers to Agenda for Change (AfC) pay scales. http://www.wales.nhs.uk/documents/2018%20-%20AfC%28W%29%201%202018%20%20%28Advance%20Pay%20Letter%29%20-%20PDF%20FINAL.pdf
nurses midwiveshealth care
supportworkers
Towards a healthy and sustainable workforce for the future
9
In the NHS, typically age and pay band are concomitantly linked i.e. the older the person, the higher their pay band and vice versa. To examine the independent associations between these variables, odds ratios with 95% confidence intervals crude and adjusted (gender, deprivation, age group/pay band) for age group and pay bands were calculated. The key findings are described in the Results section; supplementary results are presented in Tables A1-A15 (see Appendix 2).
It should be noted that as it was not possible to select a representative sample of the nursing and midwifery workforce in Wales from a sampling framework, the study design was cross-sectional. Therefore a key limitation is that the findings are unadjusted (to workforce distribution in Wales), and therefore descriptive and not generalisable to the entire nursing and midwifery workforce in Wales.
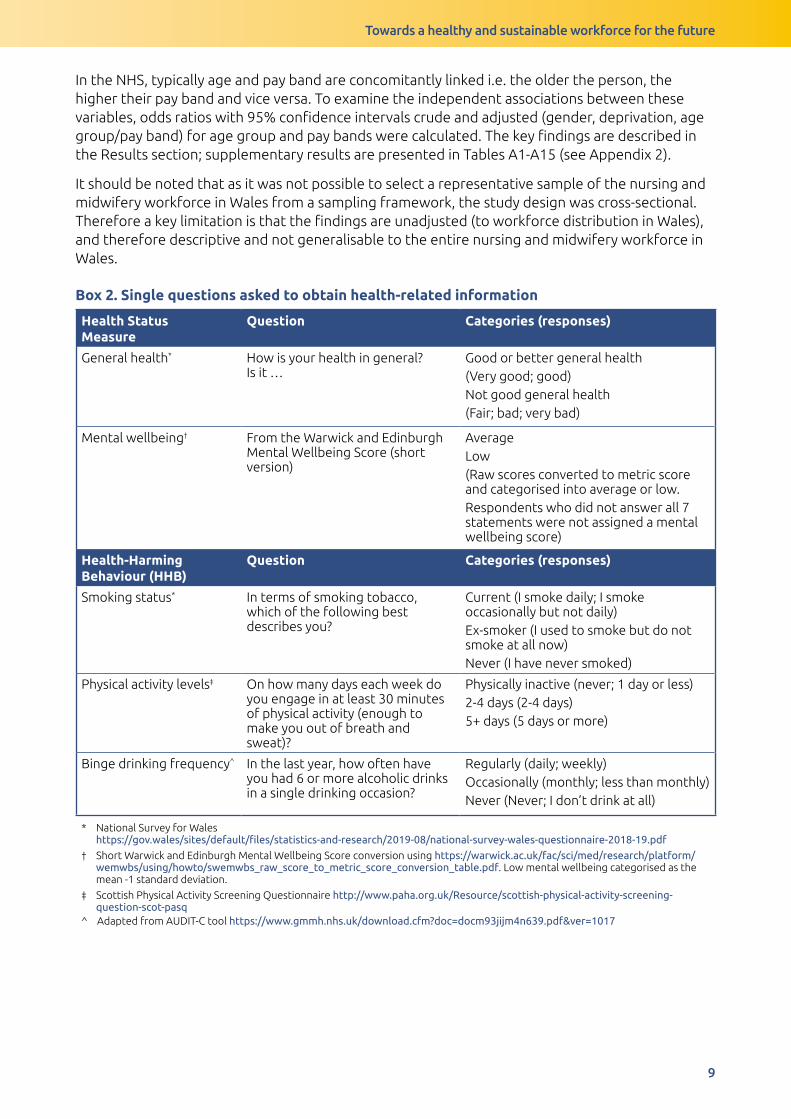
Box 2. Single questions asked to obtain health-related information
Health Status Measure
Question Categories (responses)
General health* How is your health in general? Is it …
Good or better general health (Very good; good)Not good general health(Fair; bad; very bad)
Mental wellbeing† From the Warwick and Edinburgh Mental Wellbeing Score (short version)
AverageLow(Raw scores converted to metric score and categorised into average or low.Respondents who did not answer all 7 statements were not assigned a mental wellbeing score)
Health-Harming Behaviour (HHB)
Question Categories (responses)
Smoking status* In terms of smoking tobacco, which of the following best describes you?
Current (I smoke daily; I smoke occasionally but not daily)Ex-smoker (I used to smoke but do not smoke at all now)Never (I have never smoked)
Physical activity levels‡ On how many days each week do you engage in at least 30 minutes of physical activity (enough to make you out of breath and sweat)?
Physically inactive (never; 1 day or less)2-4 days (2-4 days)5+ days (5 days or more)
Binge drinking frequency^ In the last year, how often have you had 6 or more alcoholic drinks in a single drinking occasion?
Regularly (daily; weekly)Occasionally (monthly; less than monthly)Never (Never; I don’t drink at all)
* National Survey for Wales https://gov.wales/sites/default/files/statistics-and-research/2019-08/national-survey-wales-questionnaire-2018-19.pdf
† Short Warwick and Edinburgh Mental Wellbeing Score conversion using https://warwick.ac.uk/fac/sci/med/research/platform/wemwbs/using/howto/swemwbs_raw_score_to_metric_score_conversion_table.pdf. Low mental wellbeing categorised as the mean -1 standard deviation.
‡ Scottish Physical Activity Screening Questionnaire http://www.paha.org.uk/Resource/scottish-physical-activity-screening-question-scot-pasq
^ Adapted from AUDIT-C tool https://www.gmmh.nhs.uk/download.cfm?doc=docm93jijm4n639.pdf&ver=1017

Towards a healthy and sustainable workforce for the future
10
3 Findings
3.1 Characteristics of the nursing and midwifery workforce respondents
The majority of respondents were registered nurses (89.5%), followed by midwives (5.4%) and health care support workers (5.1%). Overall the majority were female (88.3%), aged 40 years or older (77.0%), of White ethnicity (94.6%) (Table 1). A high proportion of respondents were in NHS employment (88.3%), at NHS Pay Bands 5 and 6 (57.1%), working full-time (68.5%).
Table 1. Socio-demographic factors and employment status of respondents (n=1,642. % of total respondents)
Variable Frequency n (%)Gender
FemaleMaleNot provided
1450 (88.3)164 (10.0)28 (1.7)
Age
18-29 years30-39 years40-49 years50-59 years60 years and olderNot provided
123 (7.5)237 (14.4)452 (27.5)658 (40.1)154 (9.4)18 (1.1)
Deprivation Quintile
1 (Most Deprived)2345 (Least Deprived)Not provided
141 (8.6)234 (14.3)308 (18.8)265 (16.1)315 (19.2)379 (23.0)
Staff Grade (NHS Pay band)
Managerial and Senior Staff (Pay Band 7 and higher )Registered Nurses and Midwives (Pay Bands 5 and 6)Healthcare Support Workers or equivalent (Pay Band 4 and below)Not provided
576 (35.0)937 (57.1)87 (5.3)42 (2.6)
Employment status
Full-timePart-timeEmployed, but not currently working*OtherNot provided
1124 (68.5)441 (26.9)28 (1.7)47 (2.8)2 (0.1)
* includes both on long-term sickness absence and maternity leave
Towards a healthy and sustainable workforce for the future
11
3.2 Current health and wellbeing
Key messages:
• The majority of the nursing and midwifery workforce who responded (71.1%) indicated having good or very good general health. However, 36.5% reported having a longstanding illness or condition.
• Over one-third of respondents indicated they had trouble feeling relaxed (36.8%) and almost half reported at least one health-harming behaviour (49.1%).
• Members of the nursing and midwifery workforce within the youngest age groups (from 18 to 29 years) tended to report poorer general health and lower mental wellbeing than those in the older age groups.
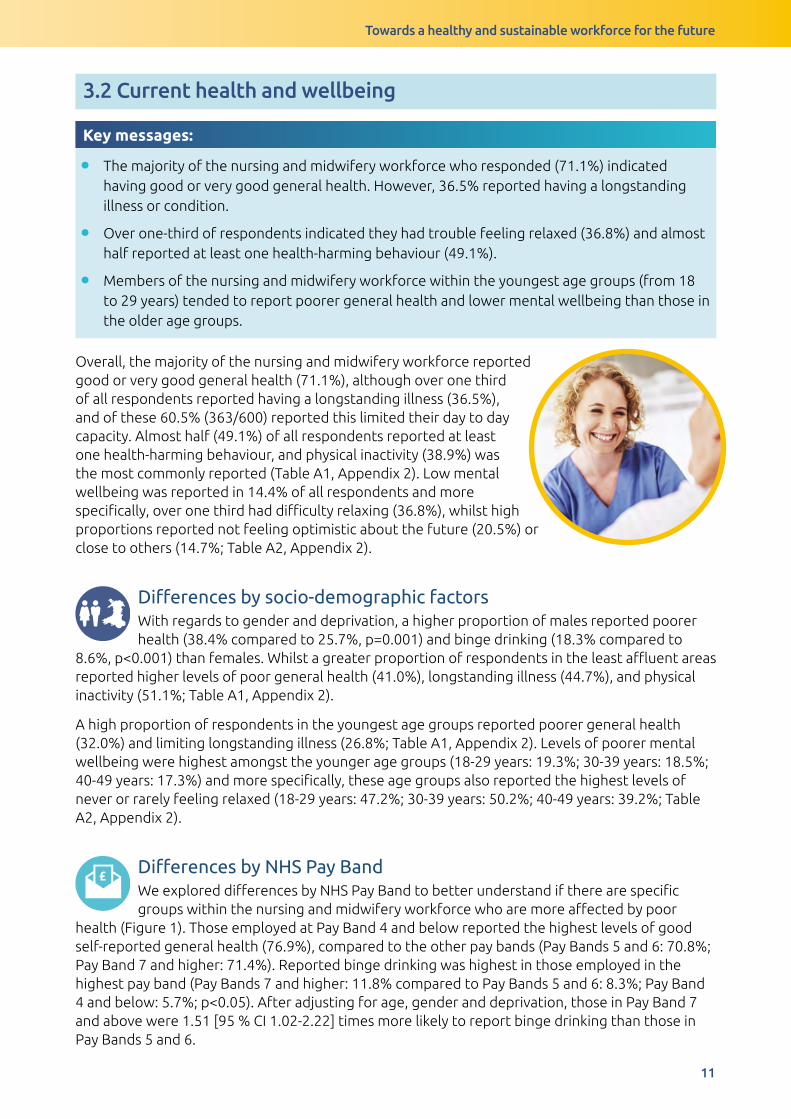
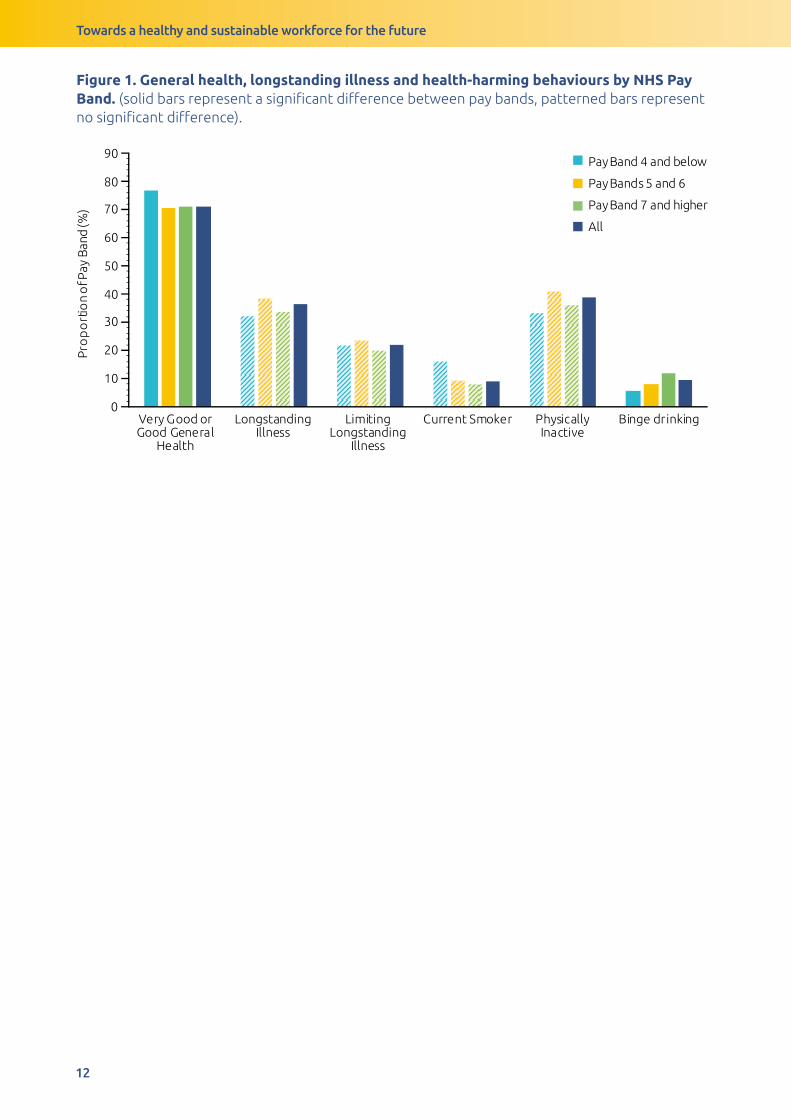
Overall, the majority of the nursing and midwifery workforce reported good or very good general health (71.1%), although over one third of all respondents reported having a longstanding illness (36.5%), and of these 60.5% (363/600) reported this limited their day to day capacity. Almost half (49.1%) of all respondents reported at least one health-harming behaviour, and physical inactivity (38.9%) was the most commonly reported (Table A1, Appendix 2). Low mental wellbeing was reported in 14.4% of all respondents and more specifically, over one third had difficulty relaxing (36.8%), whilst high proportions reported not feeling optimistic about the future (20.5%) or close to others (14.7%; Table A2, Appendix 2).
Differencesbysocio-demographicfactorsWith regards to gender and deprivation, a higher proportion of males reported poorer health (38.4% compared to 25.7%, p=0.001) and binge drinking (18.3% compared to
8.6%, p<0.001) than females. Whilst a greater proportion of respondents in the least affluent areas reported higher levels of poor general health (41.0%), longstanding illness (44.7%), and physical inactivity (51.1%; Table A1, Appendix 2).
A high proportion of respondents in the youngest age groups reported poorer general health (32.0%) and limiting longstanding illness (26.8%; Table A1, Appendix 2). Levels of poorer mental wellbeing were highest amongst the younger age groups (18-29 years: 19.3%; 30-39 years: 18.5%; 40-49 years: 17.3%) and more specifically, these age groups also reported the highest levels of never or rarely feeling relaxed (18-29 years: 47.2%; 30-39 years: 50.2%; 40-49 years: 39.2%; Table A2, Appendix 2).
£DifferencesbyNHSPayBandWe explored differences by NHS Pay Band to better understand if there are specific groups within the nursing and midwifery workforce who are more affected by poor
health (Figure 1). Those employed at Pay Band 4 and below reported the highest levels of good self-reported general health (76.9%), compared to the other pay bands (Pay Bands 5 and 6: 70.8%; Pay Band 7 and higher: 71.4%). Reported binge drinking was highest in those employed in the highest pay band (Pay Bands 7 and higher: 11.8% compared to Pay Bands 5 and 6: 8.3%; Pay Band 4 and below: 5.7%; p<0.05). After adjusting for age, gender and deprivation, those in Pay Band 7 and above were 1.51 [95 % CI 1.02-2.22] times more likely to report binge drinking than those in Pay Bands 5 and 6.
Towards a healthy and sustainable workforce for the future
12
Figure 1. General health, longstanding illness and health-harming behaviours by NHS Pay Band. (solid bars represent a significant difference between pay bands, patterned bars represent no significant difference).
0
10
20
30
40
50
60
70
80
90
Very Good orGood General
Health
LongstandingIllness
LimitingLongstanding
Illness
Current Smoker PhysicallyInactive
Binge drinking
Pro
po
rtio
no
fPa
yB
an
d(%
)
Pay Band 4 and below
Pay Bands 5 and 6
Pay Band 7 and higher
All
Towards a healthy and sustainable workforce for the future
13
3.3 Health and wellbeing in the workplace
3.3.1 Work-related stress
Key messages:
• Over half of respondents (62.1%) reported suffering from work-related stress.
• Stress was highest in NHS Pay Bands 5 and 6 (64.4%) compared to other pay bands (Pay Band 4 and below: 49.4%; Pay Band 7 and higher: 60.1%).
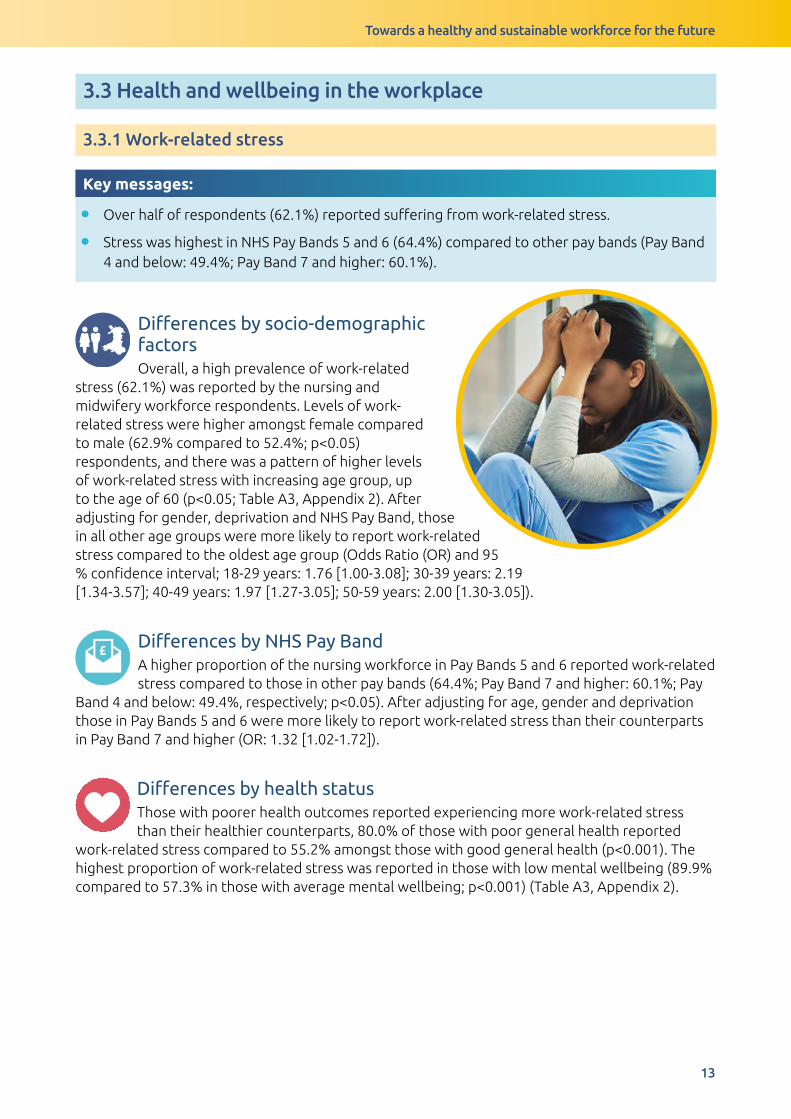
Differencesbysocio-demographicfactors Overall, a high prevalence of work-related
stress (62.1%) was reported by the nursing and midwifery workforce respondents. Levels of work-related stress were higher amongst female compared to male (62.9% compared to 52.4%; p<0.05) respondents, and there was a pattern of higher levels of work-related stress with increasing age group, up to the age of 60 (p<0.05; Table A3, Appendix 2). After adjusting for gender, deprivation and NHS Pay Band, those in all other age groups were more likely to report work-related stress compared to the oldest age group (Odds Ratio (OR) and 95 % confidence interval; 18-29 years: 1.76 [1.00-3.08]; 30-39 years: 2.19 [1.34-3.57]; 40-49 years: 1.97 [1.27-3.05]; 50-59 years: 2.00 [1.30-3.05]).
£DifferencesbyNHSPayBandA higher proportion of the nursing workforce in Pay Bands 5 and 6 reported work-related stress compared to those in other pay bands (64.4%; Pay Band 7 and higher: 60.1%; Pay
Band 4 and below: 49.4%, respectively; p<0.05). After adjusting for age, gender and deprivation those in Pay Bands 5 and 6 were more likely to report work-related stress than their counterparts in Pay Band 7 and higher (OR: 1.32 [1.02-1.72]).
DifferencesbyhealthstatusThose with poorer health outcomes reported experiencing more work-related stress than their healthier counterparts, 80.0% of those with poor general health reported
work-related stress compared to 55.2% amongst those with good general health (p<0.001). The highest proportion of work-related stress was reported in those with low mental wellbeing (89.9% compared to 57.3% in those with average mental wellbeing; p<0.001) (Table A3, Appendix 2).
Towards a healthy and sustainable workforce for the future
14
3.3.2 Presenteeism
Key messages:
• Over half of respondents (61%) attended work when feeling unwell twice or more in the last 12 months.
• The three main reasons for attending work when unwell were (i) stress, (ii) respiratory illness such as flu or cold and (iii) musculoskeletal (MSK) conditions.
• A greater proportion of NHS Pay Bands 5 and 6 reported attending work when unwell 2 to 5 times, whereas a greater proportion of NHS Pay Band 4 and below attending work when unwell more than five times.
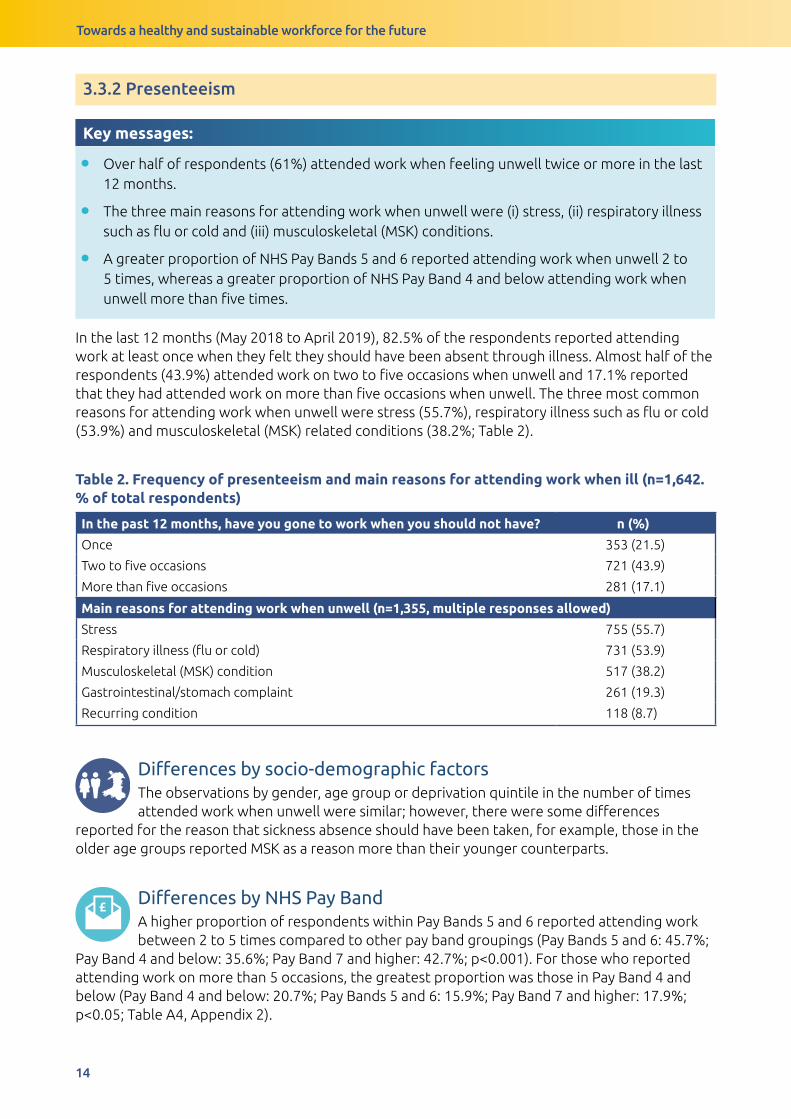
In the last 12 months (May 2018 to April 2019), 82.5% of the respondents reported attending work at least once when they felt they should have been absent through illness. Almost half of the respondents (43.9%) attended work on two to five occasions when unwell and 17.1% reported that they had attended work on more than five occasions when unwell. The three most common reasons for attending work when unwell were stress (55.7%), respiratory illness such as flu or cold (53.9%) and musculoskeletal (MSK) related conditions (38.2%; Table 2).
Table 2. Frequency of presenteeism and main reasons for attending work when ill (n=1,642. % of total respondents)
In the past 12 months, have you gone to work when you should not have? n (%)
Once 353 (21.5)
Two to five occasions 721 (43.9)
More than five occasions 281 (17.1)
Main reasons for attending work when unwell (n=1,355, multiple responses allowed)
Stress 755 (55.7)
Respiratory illness (flu or cold) 731 (53.9)
Musculoskeletal (MSK) condition 517 (38.2)
Gastrointestinal/stomach complaint 261 (19.3)
Recurring condition 118 (8.7)
Differencesbysocio-demographicfactorsThe observations by gender, age group or deprivation quintile in the number of times attended work when unwell were similar; however, there were some differences
reported for the reason that sickness absence should have been taken, for example, those in the older age groups reported MSK as a reason more than their younger counterparts.
£DifferencesbyNHSPayBandA higher proportion of respondents within Pay Bands 5 and 6 reported attending work between 2 to 5 times compared to other pay band groupings (Pay Bands 5 and 6: 45.7%;
Pay Band 4 and below: 35.6%; Pay Band 7 and higher: 42.7%; p<0.001). For those who reported attending work on more than 5 occasions, the greatest proportion was those in Pay Band 4 and below (Pay Band 4 and below: 20.7%; Pay Bands 5 and 6: 15.9%; Pay Band 7 and higher: 17.9%; p<0.05; Table A4, Appendix 2).
Towards a healthy and sustainable workforce for the future
15
DifferencesbyhealthstatusA higher proportion of those with poorer general health and low mental wellbeing attended work when they were unwell than those in better health (Table A4, Appendix 2).
3.3.3 Barriers when accessing healthcare and flu vaccination
Key messages:
• The vast majority of the nursing workforce (89%) reported experiencing barriers when accessing healthcare appointments.
• Lack of time (75.4%), no cover/staff shortages (39.8%), waiting lists (31.5%), accessibility of services (28.0%) and concerns about their job (26.1%) were all commonly reported barriers.
• Over two thirds (69.5%) of respondents reported having the flu vaccination in the last winter season. Amongst those vaccinated, the most commonly reported location for receiving the vaccination was the workplace (83.5%).
Overall, 89% of respondents had experienced barriers to attending health-related appointments. The most commonly reported barriers were work-related such as lack of time (75.4%), no cover (39.8%) and concerns about the impact of their job (26.1%) or related to health service provisions such as waiting lists (31.5%) and accessibility of services (28.0%).
Differencesbysocio-demographicfactorsA higher proportion in the younger age groups compared to the oldest age group reported lack of time as the main barrier to attending health appointments (18-29 years:
78.0%; 30-39 years: 84.0%; 60 years and older: 68.8%). The younger age groups also cited personal reasons such as job fears, embarrassment and pride or denial more commonly than their older peers (Table A5, Appendix 2). Accessibility of services was more of a barrier for the oldest age group (60 years and older: 36.4%).
£DifferencesbyNHSPayBandA high proportion across all pay bands reported at least one perceived barrier to attending health appointments (Table 3). There were some differences in reasons
perceived as barriers. For example, after adjusting for age, gender and deprivation those in Band 5 or 6 were more likely to report no cover (1.59 [1.24-2.04]), waiting lists (1.49 [1.15-1.93]) and impact on job (1.70 [1.24-2.32]) as barriers compared to those in Band 7 and higher, but however, were less likely to report lack of time as a barrier (0.74 [0.55-0.99]).
DifferencesbyhealthstatusThose in poorer health (poor general health or low mental wellbeing) also reported barriers to health appointments compared to those with better health statuses (Table 3).

Towards a healthy and sustainable workforce for the future
16
Tab
le 3
. Bar
rier
s to
hea
lth
app
oin
tmen
ts r
epo
rted
by
NH
S P
ay B
and
, gen
eral
hea
lth
and
men
tal w
ellb
eing
(n=1
,642
. % o
f to
tal r
esp
ond
ents
, m
ulti
ple
res
po
nses
all
ow
ed)
Lack
of
tim
eN
o c
ove
rW
aiti
ng
List
sA
cces
sib
ilit
y o
f se
rvic
esJo
b f
ears
Co
nfid
enti
alit
y fe
ars
Em
bar
rass
men
tP
rid
e o
r d
enia
lN
o b
arri
ers
All
n
1238
653
517
459
428
239
215
206
181
%75
.439
.831
.528
26.1
14.6
13.1
12.5
11
NH
S P
ay B
and
Pay
Ban
d 7
and
hi
gher
79.2
33.9
27.3
28.5
19.4
14.1
11.8
1212
.2
Pay
Ban
ds
5 an
d 6
74.2
43.6
34.2
28.3
3014
.814
.214
.110
.2
Pay
Ban
d 4
and
b
elo
w67
.835
.631
2326
.413
.812
.62.
311
.5
χ²7.
869
14.9
327.
868
1.18
20.6
250.
209
1.8
10.3
951.
348
p-v
alue
0.02
0.00
10.
020.
554
<0.0
010.
901
0.40
70.
006
0.51
Gen
eral
Hea
lth
Go
od
or
bet
ter
(%)
72.3
35.4
2925
.219
.411
10.3
9.3
13.2
No
t go
od
(%)
82.4
50.6
38.1
34.6
42.5
23.2
2020
.46
χ²16
.881
30.5
2911
.898
13.8
8787
.535
38.5
9826
.283
35.8
1516
.122
p-v
alue
<0.0
01<0
.001
0.00
1<0
.001
<0.0
01<0
.001
<0.0
01<0
.001
<0.0
01
Men
tal w
ellb
eing
Ave
rage
men
tal
wel
lbei
ng (%
)73
.735
.730
.426
.421
.311
.810
.610
.612
.5
Low
men
tal
wel
lbei
ng (%
)86
.161
.238
.838
51.9
3027
.824
.53.
4
χ²16
.681
54.6
956.
666
13.4
98.4
0553
.403
52.2
734
.973
17.0
67
p-v
alue
<0.0
01<0
.001
0.01
<0.0
01<0
.001
<0.0
01<0
.001
<0.0
01<0
.001
Towards a healthy and sustainable workforce for the future
17
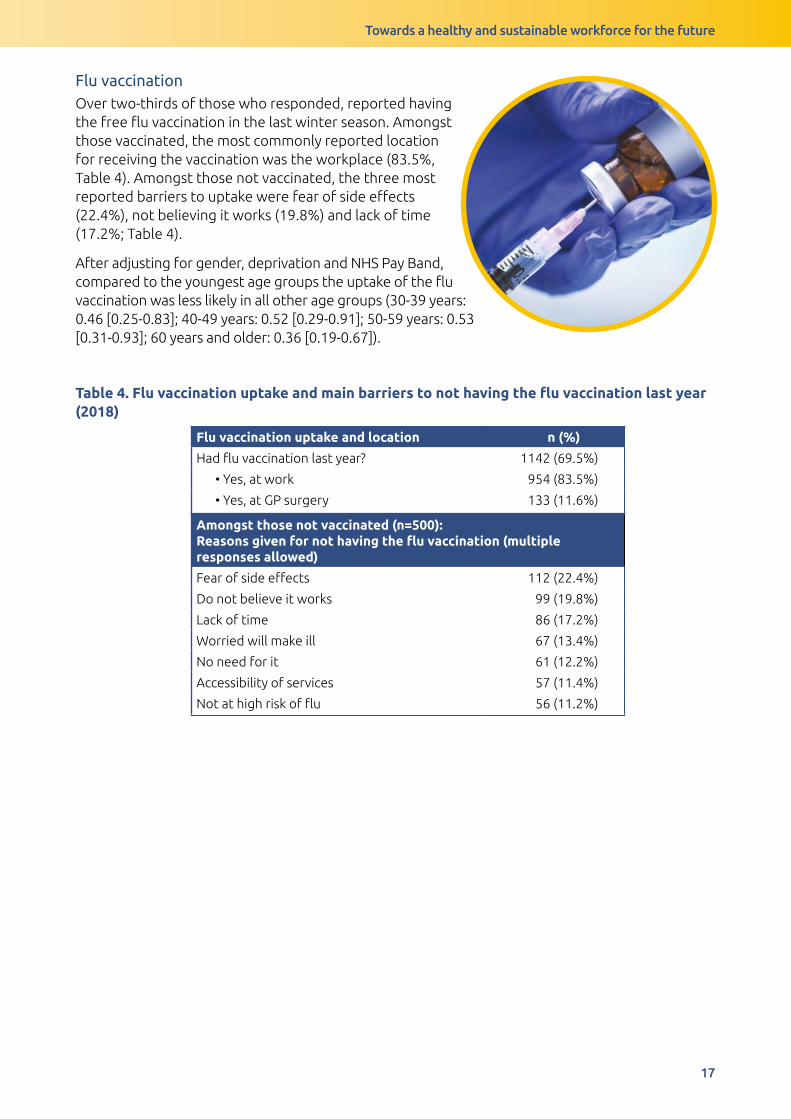
Flu vaccination Over two-thirds of those who responded, reported having the free flu vaccination in the last winter season. Amongst those vaccinated, the most commonly reported location for receiving the vaccination was the workplace (83.5%, Table 4). Amongst those not vaccinated, the three most reported barriers to uptake were fear of side effects (22.4%), not believing it works (19.8%) and lack of time (17.2%; Table 4).
After adjusting for gender, deprivation and NHS Pay Band, compared to the youngest age groups the uptake of the flu vaccination was less likely in all other age groups (30-39 years: 0.46 [0.25-0.83]; 40-49 years: 0.52 [0.29-0.91]; 50-59 years: 0.53 [0.31-0.93]; 60 years and older: 0.36 [0.19-0.67]).
Table 4. Flu vaccination uptake and main barriers to not having the flu vaccination last year (2018)
Flu vaccination uptake and location n (%)
Had flu vaccination last year? 1142 (69.5%)
• Yes, at work 954 (83.5%)
• Yes, at GP surgery 133 (11.6%)
Amongst those not vaccinated (n=500): Reasons given for not having the flu vaccination (multiple responses allowed)
Fear of side effects 112 (22.4%)
Do not believe it works 99 (19.8%)
Lack of time 86 (17.2%)
Worried will make ill 67 (13.4%)
No need for it 61 (12.2%)
Accessibility of services 57 (11.4%)
Not at high risk of flu 56 (11.2%)
Towards a healthy and sustainable workforce for the future
18
3.3.4 Working environment and health
Key messages:
• Over half (50.6%) of the nursing and midwifery workforce who responded, reported that they frequently miss in-work breaks.
• Respondents reported greater availability of healthy food (65.2% compared to 13.2%), healthy drinks (70.5% compared to 34.9%), and healthy snacks (61.9% compared to 14.1%) during the day compared to options available during the evening working hours.
Overall, over half of respondents (50.6%) reported frequently missing breaks. The majority of respondents reported that there was drinking water readily available at their workplace (72.5%), however, despite this availability, only 58.5% stated that they felt adequately hydrated (Table A3, Appendix 2). Compared to the day, the opportunity to purchase healthy food (Evening: 13.2%; Day: 65.2%), drinks (Evening: 34.9%; Day: 70.5%) or snacks (Evening: 14.9%; Day: 61.9%) is much lower in the evening. Less than one third (30.6%) of those who responded reported managing to eat healthily, through eating 5 or more fruit and vegetables a day (Table A6, Appendix 2).
£DifferencesbyNHSPayBandThe proportion of missing breaks increased with an increase in NHS Pay Band (Pay Band 4 and below:
16.1%; Pay Bands 5 and 6: 46.7%; Pay Band 7 and higher: 61.1%; p<0.001). A lower proportion of those in Pay Bands 5 and 6 reported having less access to drinking water (69.4% compared to Pay Band 4 and below: 78.2%; Pay Band 7 and higher: 76.7%; p<0.01) and being less hydrated (54.0% compared to Pay Band 4 and below: 57.5%; Pay Band 7 and higher: 66.1%; p<0.01; Table A3, Appendix 2). These observations remained after adjusting for age, gender and deprivation. Healthier eating habits decreased with NHS Pay Band with highest proportions reported in Pay Band 7 (35.9% compared to Pay Band 5 and 6: 27.7%; Pay Band 4 and below: 26.4%; p<0.01; Table A6, Appendix 2)
DifferencesbyhealthstatusThose with poorer health status reported less access to drinking water and were less hydrated at work (Table A3, Appendix 2). Those with lower mental wellbeing reported
missing breaks more often than those with average mental wellbeing (60.8% compared to 48.9%; p=0.001). Whereas, healthier eating habits were reported more by those in better general health (32.8% compared to 25.1%; p<0.05).
Towards a healthy and sustainable workforce for the future
19
3.3.5 Improvements for health and wellbeing
Key messages
• Most popular suggestions to improve wellbeing at work were related to time (i.e. time to exercise and/or time to prepare meals) and financial incentives.
• All of the suggestions were more popular in younger members of the nursing and midwifery workforce (aged 49 years and below), and those with poorer general health would like the options in both environments (home and work).
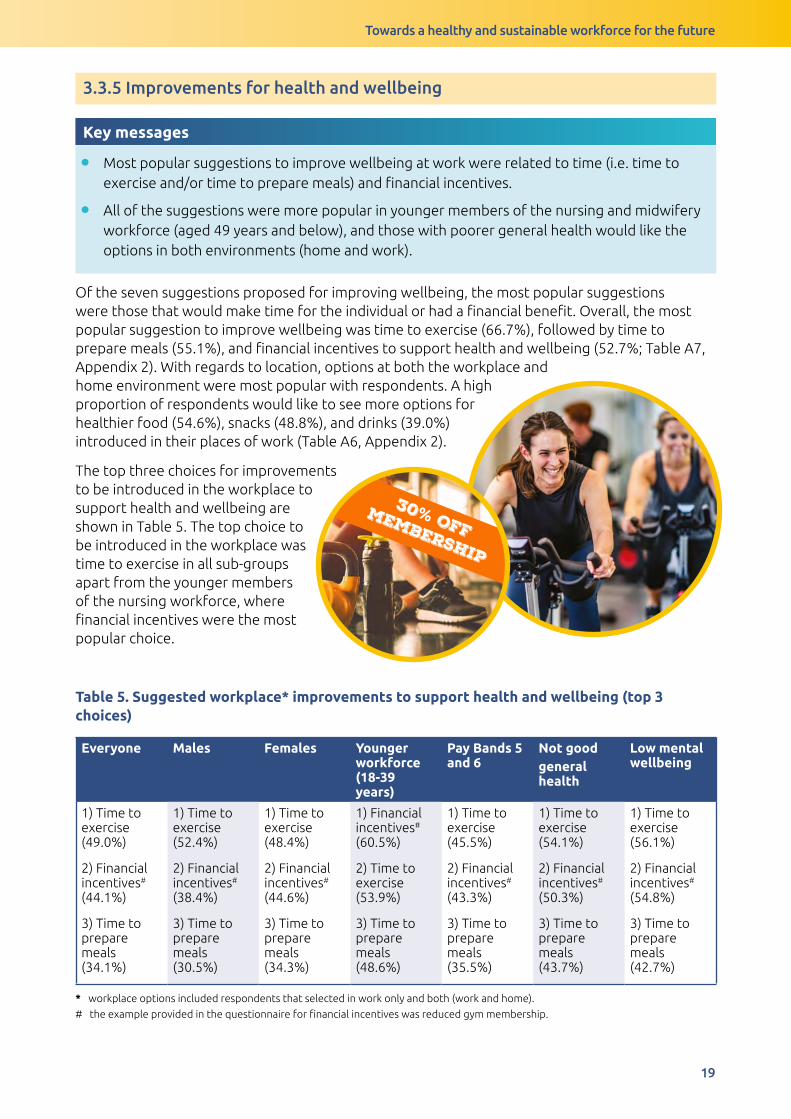
Of the seven suggestions proposed for improving wellbeing, the most popular suggestions were those that would make time for the individual or had a financial benefit. Overall, the most popular suggestion to improve wellbeing was time to exercise (66.7%), followed by time to prepare meals (55.1%), and financial incentives to support health and wellbeing (52.7%; Table A7, Appendix 2). With regards to location, options at both the workplace and home environment were most popular with respondents. A high proportion of respondents would like to see more options for healthier food (54.6%), snacks (48.8%), and drinks (39.0%) introduced in their places of work (Table A6, Appendix 2).
The top three choices for improvements to be introduced in the workplace to support health and wellbeing are shown in Table 5. The top choice to be introduced in the workplace was time to exercise in all sub-groups apart from the younger members of the nursing workforce, where financial incentives were the most popular choice.
Table 5. Suggested workplace* improvements to support health and wellbeing (top 3 choices)
Everyone Males Females Younger workforce (18-39 years)
Pay Bands 5 and 6
Not good general health
Low mental wellbeing
1) Time to exercise (49.0%)
2) Financial incentives# (44.1%)
3) Time to prepare meals (34.1%)
1) Time to exercise (52.4%)
2) Financial incentives# (38.4%)
3) Time to prepare meals (30.5%)
1) Time to exercise (48.4%)
2) Financial incentives# (44.6%)
3) Time to prepare meals (34.3%)
1) Financial incentives# (60.5%)
2) Time to exercise (53.9%)
3) Time to prepare meals (48.6%)
1) Time to exercise (45.5%)
2) Financial incentives# (43.3%)
3) Time to prepare meals (35.5%)
1) Time to exercise (54.1%)
2) Financial incentives#
(50.3%)
3) Time to prepare meals (43.7%)
1) Time to exercise (56.1%)
2) Financial incentives# (54.8%)
3) Time to prepare meals (42.7%)
* workplace options included respondents that selected in work only and both (work and home).
# the example provided in the questionnaire for financial incentives was reduced gym membership.
30% offmembership
Towards a healthy and sustainable workforce for the future
20
3.4 Job satisfaction and future plans
3.4.1 Feelings towards career and perceptions of value
Key messages:
• Overall, 75.3% of respondents reported that their job was a rewarding career, 69.1% reported they were enthusiastic about the job, and 55.4% respondents reported they would recommend the job as a career.
• A high proportion of respondents felt valued by patients (80.0%) and families of patients (69.8%) but less valued by senior staff (42.9%).
• Job satisfaction and the perceived value were lower in the nursing workforce employed as NHS Pay Bands 5 and 6 compared to other Pay Bands, this was especially apparent in recommending their job as a career and feeling valued by senior members of staff.
• Lower levels of job satisfaction and feelings of value were reported amongst those with poorer general health and mental wellbeing.
Overall, the nursing workforce reported that their current jobs were a rewarding career choice (75.3%), felt enthusiastic about their jobs (69.1%) and over half of the respondents (55.4%) reported that they would recommend their job as a career. The majority felt valued by both patients (80%) and families of patients (69.8%), but less than half of the respondents (42.9%) reported feeling valued by senior staff (Figure 2).
Differencesbysocio-demographicfactorsA higher proportion of female respondents reported feeling enthusiastic about their job compared to male respondents (70.5% compared to 61.0%; p<0.05). The proportion
of the workforce feeling valued tended to increase with age (18-29 years: 67.5%; 50-59 years: 72.4%; 60 years and older: 84.0%) and these observations remained after adjusting for gender, deprivation and NHS Pay Band (Table A11, Appendix 2).

Towards a healthy and sustainable workforce for the future
21
Figure 2. Job satisfaction and perceived feelings of value, overall and by NHS Pay Band. (solid bars represent a significant difference between pay bands).
Recommendjob as career
Job is rewardingcareer
Enthusiasticabout job
Valued bysenior staff
Valued bypatients
Valued byfamilies of patients
0
10
20
30
40
50
60
70
80
90
Pro
po
rtio
n o
f P
ay
Ba
nd
(%
)
100 Pay Band 4 and below Pay Bands 5 and 6 Pay Band 7 and higher All
£DifferencesbyNHSPayBandPositivity and enthusiasm about their job, and feelings of being valued were lowest amongst the nursing and midwifery workforce in Pay Bands 5 and 6 (Figure 2). Amongst
Pay Bands 5 and 6, only 47.7% would recommend their job as a career (compared to Pay Band 4 and below: 72.4%; Pay Band 7 and higher: 66.0%; p<0.001) and only 37.0% felt valued by senior members of staff (compared to Pay Band 4 and below: 51.7%; Pay Band 7 and higher: 51.2%; p<0.001). After adjusting for age, gender and deprivation, those in Pay Band 4 and below (2.05 [1.30-3.49]) and Pay Band 7 and higher (2.19 [1.71-2.80]) were more than twice as likely to recommend their job as a career than those in Pay Bands 5 and 6.
DifferencesbyhealthstatusBetter health was associated with better job satisfaction (Table A11, Appendix 2). Those who reported being in good or better general health were more enthusiastic about
their job (73.5% compared to 56.6%) and felt their job was a rewarding career in comparison to those in poorer health (78.3% compared to 67.5%). They also felt more valued by patients (82.2% compared to 73%; p<0.001), by families of patients (72.5% compared to 61.9%; p<0.001), and by senior staff (47.6% compared to 31.1%; p<0.001).
These differences were more evident when comparing mental wellbeing. Compared to those with average mental wellbeing, 22.4% with low mental wellbeing agreed to recommending the job as a career (compared to 61.4%; p<0.001), 49.4% felt the job is rewarding (compared to 80.5%; p<0.001), 35.4% feeling enthusiastic (compared to 74.8%). In turn, a higher proportion of those with average mental wellbeing reported feeling valued by patients (82.4% compared to 67.6%; p<0.001), families of patients (72.4% compared to 55.7%; p<0.001) and by senior staff (48.5% compared to 13.5%; p<0.001).

Towards a healthy and sustainable workforce for the future
22
3.4.2 Feelings towards the profession/job in the past 12 months
Key messages:
• A high proportion of respondents (49.8%) have considered leaving the profession within the 12 months preceding our survey. This was more apparent in those employed in NHS Pay Bands 5 and 6 or with poorer health (poor general health and low mental wellbeing).
Over the past 12 months prior to completing the survey, almost half of all respondents (49.8%) had considered leaving the profession, whilst 37.9% had considered decreasing hours in their present job, and 31.2% had considered moving to another job within NHS Wales (Table A12, Appendix 2).
£DifferencesbyNHSPayBandThere were differences in feelings towards the profession/job in the past 12 months between pay bands and type of employment. For instance, more than half in Pay Bands
5 and 6 (54.5%) reported having considered leaving the profession, whilst those in Pay Band 4 and below were the least likely to report leaving the profession (36.8%). After adjusting for age, gender and deprivation these differences remained evident. Those within Pay Bands 5 and 6 also reported they have considered moving within/to the private sector in Wales (Pay Bands 5 and 6: 24.8%; Pay Band 4 and below: 14.9%; Pay Band 7 and higher: 18.4%; p<0.05), and decreasing hours at work (Pay Bands 5 and 6: 40.0%; Pay Band 4 and below: 27.6%; Pay Band 7 and higher: 36.3%; p<0.05) more than other pay bands (Figure 5). After adjusting for age, gender and deprivation, compared to Pay Bands 5 and 6, those in Pay Band 4 and below were more likely to have considered increasing hours at work (2.92 [1.21-7.06]), whereas those in Pay Band 7 and above were more likely to have considered retirement (1.72 [1.27-2.33]).
Figure 3. Feelings towards the profession/job in the past 12 months by NHS Pay Band. (solid bars represent a significant difference between pay bands, patterned bars represent no significant difference).
LeavingProfession
Movingwithin
NHS Wales
Movingwithin/to
Private Sector(Wales)
Movingoutside of
Walesfor work
Increasinghours
at work
Decreasinghours
at work
Retirement Noneof these
Pay Band 4 and below Pay Bands 5 and 6 Pay Band 7 and higher All
Pro
po
rtio
n o
f P
ay
Ba
nd
(%
)
0
10
20
30
40
50
60
Towards a healthy and sustainable workforce for the future
23
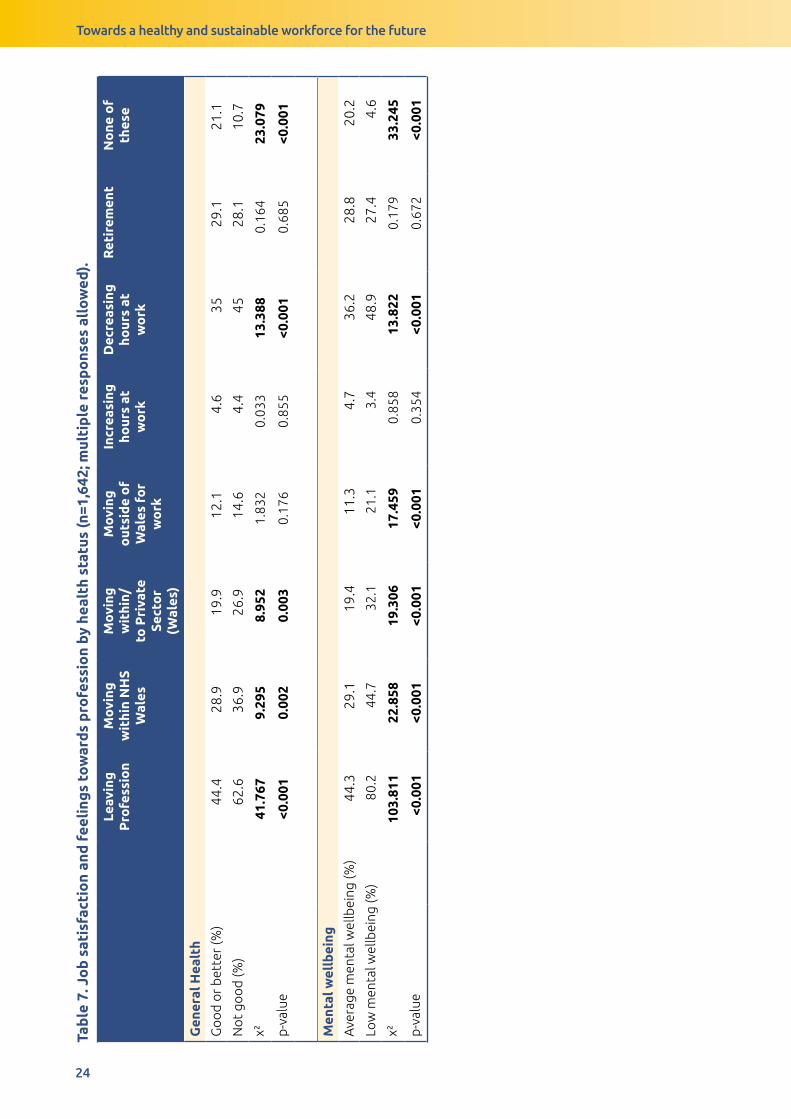
DifferencesbyhealthstatusCompared to those in good health and average mental wellbeing, a higher proportion of those who reported poorer health have considered leaving the profession, moving jobs
within Wales or decreasing their working hours compared to those in better health (Table 7).
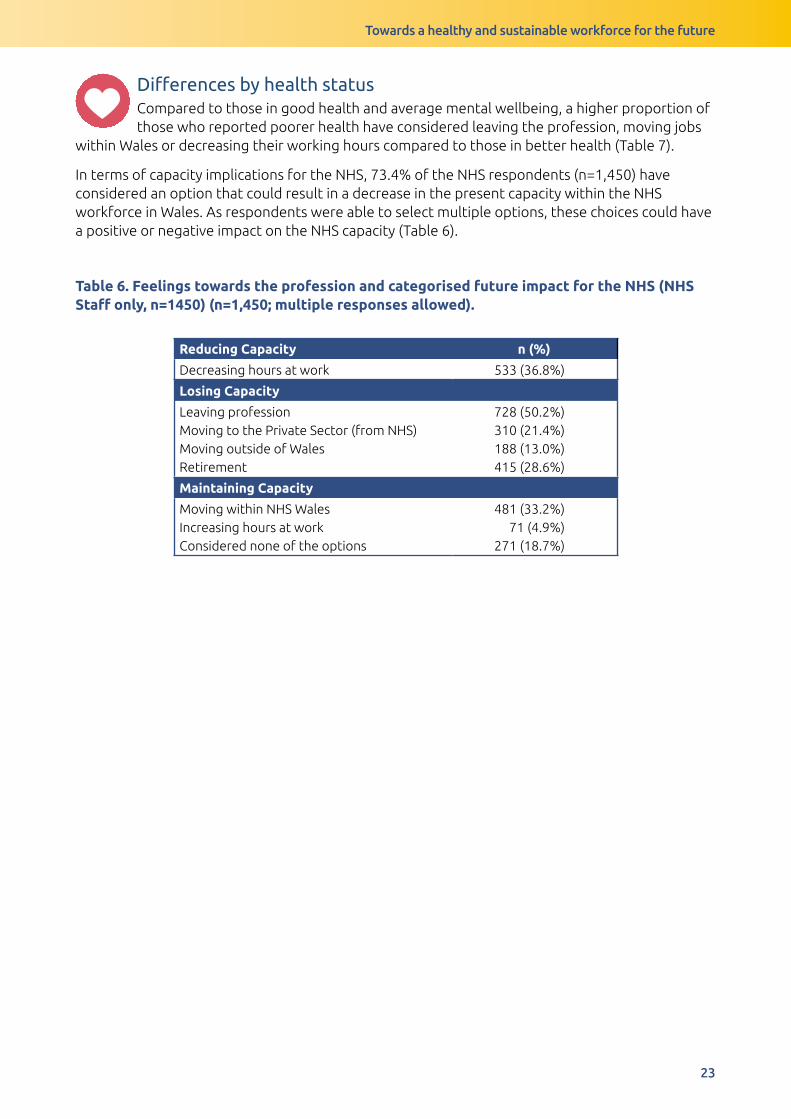
In terms of capacity implications for the NHS, 73.4% of the NHS respondents (n=1,450) have considered an option that could result in a decrease in the present capacity within the NHS workforce in Wales. As respondents were able to select multiple options, these choices could have a positive or negative impact on the NHS capacity (Table 6).
Table 6. Feelings towards the profession and categorised future impact for the NHS (NHS Staff only, n=1450) (n=1,450; multiple responses allowed).
Reducing Capacity n (%)
Decreasing hours at work 533 (36.8%)
Losing Capacity
Leaving professionMoving to the Private Sector (from NHS)Moving outside of WalesRetirement
728 (50.2%)310 (21.4%)188 (13.0%)415 (28.6%)
Maintaining Capacity
Moving within NHS WalesIncreasing hours at workConsidered none of the options
481 (33.2%)71 (4.9%)
271 (18.7%)
Towards a healthy and sustainable workforce for the future
24
Tab
le 7
. Jo
b s
atis
fact
ion
and
fee
ling
s to
war
ds
pro
fess
ion
by h
ealt
h st
atus
(n=1
,642
; mul
tip
le r
esp
ons
es a
llo
wed
).
Leav
ing
P
rofe
ssio
nM
ovi
ng
wit
hin
NH
S W
ales
Mo
ving
w
ithi
n/to
Pri
vate
Se
cto
r (W
ales
)
Mo
ving
o
utsi
de
of
Wal
es f
or
wo
rk
Incr
easi
ng
hour
s at
w
ork
Dec
reas
ing
ho
urs
at
wo
rk
Ret
irem
ent
No
ne o
f th
ese
Gen
eral
Hea
lth
Go
od
or
bet
ter
(%)
44.4
28.9
19.9
12.1
4.6
3529
.121
.1
No
t go
od
(%)
62.6
36.9
26.9
14.6
4.4
4528
.110
.7
χ²41
.767
9.29
58.
952
1.83
20.
033
13.3
880.
164
23.0
79
p-v
alue
<0.0
010.
002
0.00
30.
176
0.85
5<0
.001
0.68
5<0
.001
Men
tal w
ellb
eing
Ave
rage
men
tal w
ellb
eing
(%)
44.3
29.1
19.4
11.3
4.7
36.2
28.8
20.2
Low
men
tal w
ellb
eing
(%)
80.2
44.7
32.1
21.1
3.4
48.9
27.4
4.6
χ²10
3.81
122
.858
19.3
0617
.459
0.85
813
.822
0.17
933
.245
p-v
alue
<0.0
01<0
.001
<0.0
01<0
.001
0.35
4<0
.001
0.67
2<0
.001
Towards a healthy and sustainable workforce for the future
25
3.5 Financial situation
Key messages:
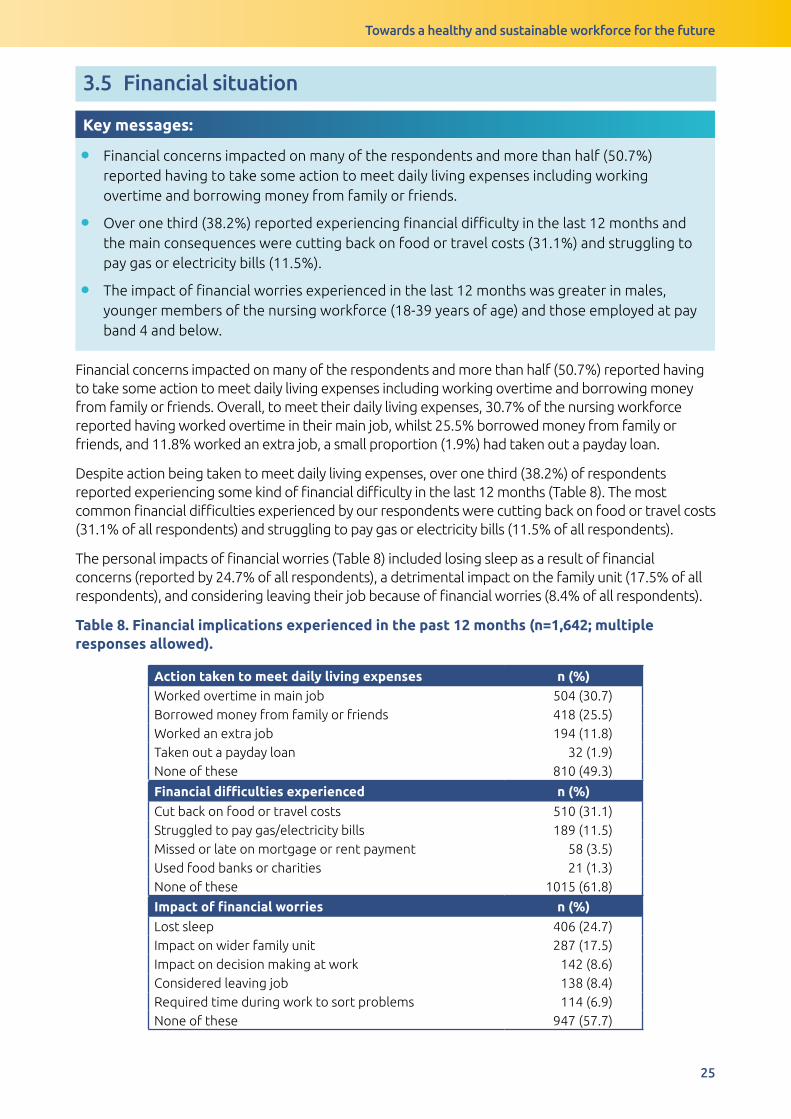
• Financial concerns impacted on many of the respondents and more than half (50.7%) reported having to take some action to meet daily living expenses including working overtime and borrowing money from family or friends.
• Over one third (38.2%) reported experiencing financial difficulty in the last 12 months and the main consequences were cutting back on food or travel costs (31.1%) and struggling to pay gas or electricity bills (11.5%).
• The impact of financial worries experienced in the last 12 months was greater in males, younger members of the nursing workforce (18-39 years of age) and those employed at pay band 4 and below.
Financial concerns impacted on many of the respondents and more than half (50.7%) reported having to take some action to meet daily living expenses including working overtime and borrowing money from family or friends. Overall, to meet their daily living expenses, 30.7% of the nursing workforce reported having worked overtime in their main job, whilst 25.5% borrowed money from family or friends, and 11.8% worked an extra job, a small proportion (1.9%) had taken out a payday loan.
Despite action being taken to meet daily living expenses, over one third (38.2%) of respondents reported experiencing some kind of financial difficulty in the last 12 months (Table 8). The most common financial difficulties experienced by our respondents were cutting back on food or travel costs (31.1% of all respondents) and struggling to pay gas or electricity bills (11.5% of all respondents).
The personal impacts of financial worries (Table 8) included losing sleep as a result of financial concerns (reported by 24.7% of all respondents), a detrimental impact on the family unit (17.5% of all respondents), and considering leaving their job because of financial worries (8.4% of all respondents).
Table 8. Financial implications experienced in the past 12 months (n=1,642; multiple responses allowed).
Action taken to meet daily living expenses n (%)Worked overtime in main job 504 (30.7)Borrowed money from family or friends 418 (25.5)Worked an extra job 194 (11.8)Taken out a payday loan 32 (1.9)None of these 810 (49.3)
Financial difficulties experienced n (%)
Cut back on food or travel costs 510 (31.1)Struggled to pay gas/electricity bills 189 (11.5)Missed or late on mortgage or rent payment 58 (3.5)Used food banks or charities 21 (1.3)None of these 1015 (61.8)
Impact of financial worries n (%)
Lost sleep 406 (24.7)Impact on wider family unit 287 (17.5)Impact on decision making at work 142 (8.6)Considered leaving job 138 (8.4)Required time during work to sort problems 114 (6.9)None of these 947 (57.7)
Towards a healthy and sustainable workforce for the future
26
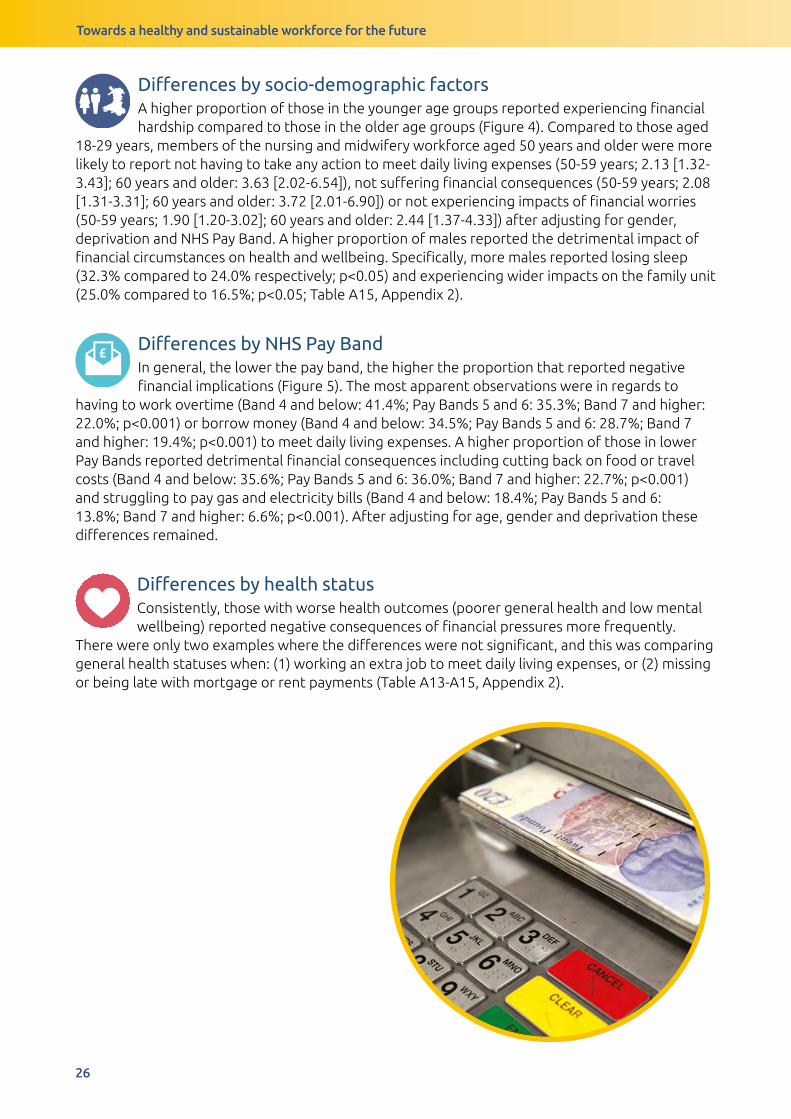
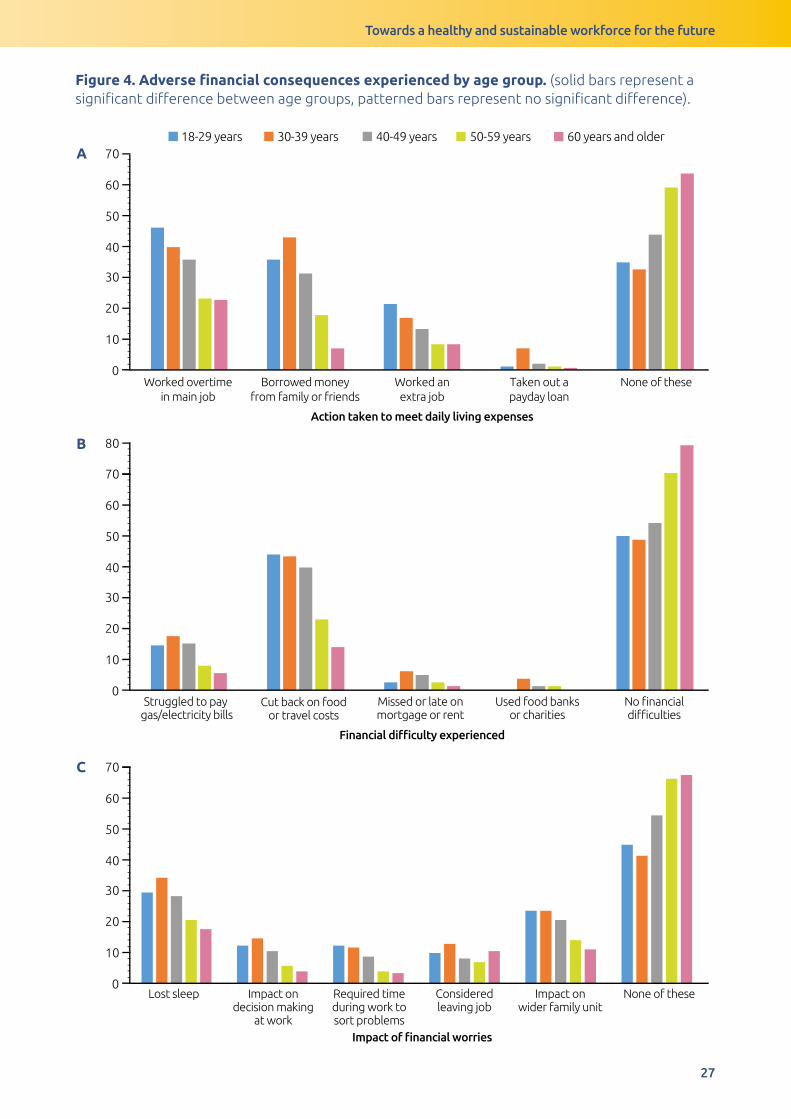
Differencesbysocio-demographicfactorsA higher proportion of those in the younger age groups reported experiencing financial hardship compared to those in the older age groups (Figure 4). Compared to those aged
18-29 years, members of the nursing and midwifery workforce aged 50 years and older were more likely to report not having to take any action to meet daily living expenses (50-59 years; 2.13 [1.32-3.43]; 60 years and older: 3.63 [2.02-6.54]), not suffering financial consequences (50-59 years; 2.08 [1.31-3.31]; 60 years and older: 3.72 [2.01-6.90]) or not experiencing impacts of financial worries (50-59 years; 1.90 [1.20-3.02]; 60 years and older: 2.44 [1.37-4.33]) after adjusting for gender, deprivation and NHS Pay Band. A higher proportion of males reported the detrimental impact of financial circumstances on health and wellbeing. Specifically, more males reported losing sleep (32.3% compared to 24.0% respectively; p<0.05) and experiencing wider impacts on the family unit (25.0% compared to 16.5%; p<0.05; Table A15, Appendix 2).
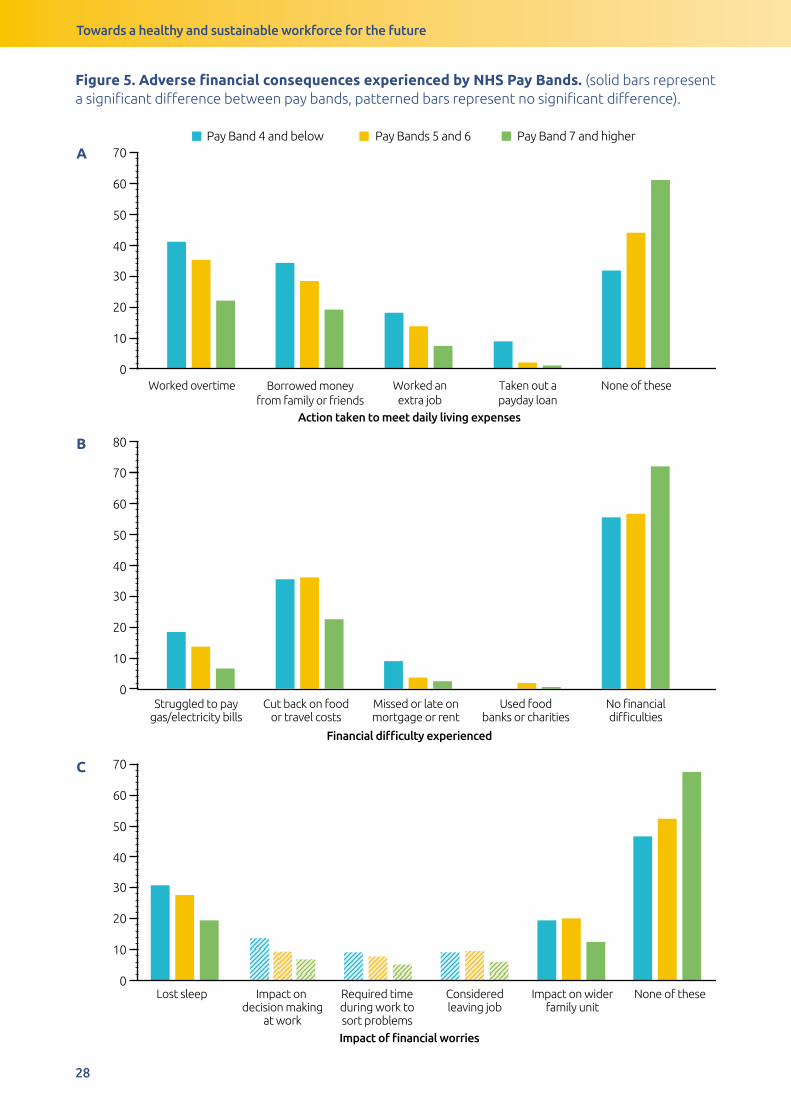
£DifferencesbyNHSPayBandIn general, the lower the pay band, the higher the proportion that reported negative financial implications (Figure 5). The most apparent observations were in regards to
having to work overtime (Band 4 and below: 41.4%; Pay Bands 5 and 6: 35.3%; Band 7 and higher: 22.0%; p<0.001) or borrow money (Band 4 and below: 34.5%; Pay Bands 5 and 6: 28.7%; Band 7 and higher: 19.4%; p<0.001) to meet daily living expenses. A higher proportion of those in lower Pay Bands reported detrimental financial consequences including cutting back on food or travel costs (Band 4 and below: 35.6%; Pay Bands 5 and 6: 36.0%; Band 7 and higher: 22.7%; p<0.001) and struggling to pay gas and electricity bills (Band 4 and below: 18.4%; Pay Bands 5 and 6: 13.8%; Band 7 and higher: 6.6%; p<0.001). After adjusting for age, gender and deprivation these differences remained.
DifferencesbyhealthstatusConsistently, those with worse health outcomes (poorer general health and low mental wellbeing) reported negative consequences of financial pressures more frequently.
There were only two examples where the differences were not significant, and this was comparing general health statuses when: (1) working an extra job to meet daily living expenses, or (2) missing or being late with mortgage or rent payments (Table A13-A15, Appendix 2).
Towards a healthy and sustainable workforce for the future
27
Figure 4. Adverse financial consequences experienced by age group. (solid bars represent a significant difference between age groups, patterned bars represent no significant difference).
B
C
Worked overtime
in main job
Borrowed money
from family or friends
Worked an
extra job
Taken out a
payday loan
None of these
18-29 years 30-39 years 40-49 years 50-59 years 60 years and older
Struggled to pay gas/electricity bills
Cut back on foodor travel costs
Missed or late onmortgage or rent
Used food banksor charities
No financialdifficulties
0
10
20
30
40
50
60
70
Pay Band 4 and below
Pay Bands 5 and 6
Pay Band 7 and higher
All
0
10
20
30
40
50
60
70
80
Lost sleep Impact ondecision making
at work
Required timeduring work tosort problems
Consideredleaving job
Impact onwider family unit
None of these0
10
20
30
40
50
60
70
Action taken to meet daily living expenses
Financial difficulty experienced
Impact of financial worries
A
B
C
Towards a healthy and sustainable workforce for the future
28
Figure 5. Adverse financial consequences experienced by NHS Pay Bands. (solid bars represent a significant difference between pay bands, patterned bars represent no significant difference).
A
B
C
Worked overtime Borrowed money
from family or friends
Worked an
extra job
Taken out a
payday loan
None of these
Pay Band 4 and below Pay Bands 5 and 6 Pay Band 7 and higher
Struggled to paygas/electricity bills
Cut back on foodor travel costs
Missed or late onmortgage or rent
Used foodbanks or charities
No financialdifficulties
Lost sleep Impact on decision making
at work
Required timeduring work tosort problems
Consideredleaving job
Impact on widerfamily unit
None of these
0
10
20
30
40
50
60
70
80
0
10
20
30
40
50
60
70
0
10
20
30
40
50
60
70
Action taken to meet daily living expenses
Financial difficulty experienced
Impact of financial worries
Towards a healthy and sustainable workforce for the future
29
4 Discussion This report is one of the largest and most comprehensive cross-sectional surveys undertaken amongst the nursing and midwifery workforce in Wales and provides a valuable understanding of their health and wellbeing. It explores the underlying challenges to health, including the impact of the work environment, financial pressures, and job satisfaction and career plans. This survey includes the views from 1,642 nurses, midwives and health care workers across Wales who responded to the questionnaire, and whilst not a representative sample, it equates to ~5% of the Welsh NHS workforce.
Here we summarise the key findings and reflect on what our study adds within the context of the wider literature. We also draw together the key themes in two specific groups of respondents who consistently reported poorer health and wellbeing outcomes: a) younger members of the nursing and midwifery workforce and b) those employed in NHS Pay Bands 5 and 6. Finally, considering the implications, we identify a number of recommendations to improve the health and wellbeing of the nursing and midwifery workforce.
4.1 Current health and wellbeing
Overall, our findings indicate that the self-reported health of the nursing and midwifery workforce is similar to that of the working-age Welsh population (21). In our study, 37% reported having a longstanding illness and 22% a limiting longstanding illness, although these were slightly lower than that of the general working-age Welsh population (longstanding illness: 46%; limiting, longstanding illness: 33%; (21)).
In our study, 49% of the nursing workforce reported at least one health-harming behaviour, the most commonly reported was physical inactivity (39% reported not being physically active, compared to 33% in the general population; (21)). Although regular physical activity can help to prevent the well-known high levels of stress, fatigue, and burnout caused by their occupation (22), previous research in agreement with our findings, demonstrates nurses and midwives do not regularly exercise (19, 24–27). Occupational factors such as job speciality, work status, work hours, shift work, and job demand, can all significantly contribute to physical inactivity amongst the nursing and midwifery workforce (27). Only 9% of respondents reported being a current smoker, which is lower than the 17% of Welsh working-age adults who currently smoke (21) and substantially lower to what has been found in the nursing workforce of several European countries (28,29) including Scotland (12). Binge-drinking was reported by 10% of respondents (compared to 27% in the UK general population; (30)) but was higher in males (compared to females) and those in Pay Band 7 and higher (compared to other Pay Bands). Alcohol consumption has been previously described as a way to relax and recover from shifts amongst experienced nurses (31); however, drinking alcohol is an ineffective strategy to recover from shift work (32).
Overall, other than a lower prevalence of current smokers and those experiencing limiting illnesses, the health of the nursing and midwifery workforce does not appear to be any worse (or better) than the general population of Wales. The most telling factor in poorer levels of health and wellbeing, was deprivation status, and as widely reported in the literature, health outcomes were worse in those resident in the most deprived areas (33). However, within our respondents, there were certain subgroups that reported higher levels of poorer mental wellbeing, in particular, younger members of the nursing and midwifery workforce (see Section 4.5.1).
Towards a healthy and sustainable workforce for the future
30
4.2 The working environment
4.2.1 The impact of the working environment on health and wellbeing
The working environment had a number of potential impacts on the health and wellbeing of the nursing and midwifery workforce. Notably, 62% of our sample reported experiencing work-related stress. It has been widely reported that stress and mental health issues account for a high proportion of health problems in nurses and midwives (5,7). Nurses have consistently reported feeling exhausted and burnt out as they often arrive early for their shifts and finish late, and many are unable to take breaks due to staff shortages (34,35). Data from the 2018 NHS Staff Survey (6) indicated that almost 40% of NHS staff in England reported feeling unwell as a result of work-related stress, with this figure being the highest in five years. However, less than 30% reported feeling that their NHS Trust takes positive action to improve staff health and wellbeing (6).
Although the workplace is recognised as an appropriate setting for health promotion and disease prevention (36), the physical environment and the nature of the nursing occupation have been found to play a significant role in determining nurses’ healthy eating behaviours in the workplace (37–39). For instance, over half of our respondents reported missing breaks, and this practice at work may promote the consumption of energy-dense foods (40), having irregular meal patterns and being unable to drink enough water at work (41). Working in a fast-paced environment, unhealthy snacks may be viewed as a quick release of energy when time is limited (37). Respondents highlighted the lack of available healthy food and snacks at work, and research elsewhere has reported that increasing the availability of healthy food, particularly in the evening working hours, would encourage healthy eating (42). Provision of adequate food preparation and storage facilities could also prevent nurses and midwives from changing their regular meal choices (37). In Wales, the Corporate Health Standard (CHS) is one of the Healthy Working Wales programmes and is recognised nationally as a mark of quality for health and wellbeing in the workplace (43). For instance, the CHS has guidance to support business/organisations to make positive changes to the provision of food and drink in vending machines. Having more refrigerated vending machines with a selection of healthier options as well as adequate water dispenses would reduce important barriers to healthy eating in the nursing and midwifery profession (44). Furthermore, the National Institute for Health and Care Excellence (NICE) recommendations on obesity prevention in the workplace state the need to support action to improve healthy food and drink provision (45).
The high proportion who reported suffering from work-related stress and missing breaks in our survey suggests that organisational factors such as lack of time and high workloads have an impact on ability to maintain a healthy lifestyle (46). Since lack of time is one of the main barriers reported by health professionals to engage in healthy lifestyles, system-level interventions such as releasing staff to participate in exercise sessions during their working hours could aid in improving their health and wellbeing (46). Studies exploring the impact of system-level interventions have reported significant reductions in nurses’ body mass index (BMI) post-intervention (47,48). These interventions can also be expanded to focus on healthy eating and meal preparation. Ultimately, these interventions benefit not only employees but also employers through reduced absenteeism and lower health care costs (48). We also identified a number of proposals that could be implemented in the workplace to improve health and wellbeing. The more popular choices were those that provided time for staff in the workday to either exercise or prepare healthier meals. These options were reported here by those with the poorest health outcomes and could, therefore, have a significant impact on the health and wellbeing of the nursing workforce.
Our findings also suggest that organisational factors such as lack of time/being too busy, staff shortages and waiting lists are impacting on the ability of staff to attend personal medical appointments. Barriers to attending medical appointments during working hours were reported
Towards a healthy and sustainable workforce for the future
31
more by Pay Bands 5 and 6 employees and those with poor general health or low mental wellbeing. It is not surprising that lack of time was reported as the main barrier, since nurses and midwives tend to work overtime due to staff shortages and pressures in meeting targets (5,49). Having support from managers and peers may eliminate key barriers that prevent nurses and midwives considering their own health, particularly in younger and less experienced members of the workforce (3). In-house occupational services could also increase the health and wellbeing of the nursing and midwifery staff by providing rapid access to diverse services designed to help staff to return to work or manage a health condition in work (50).
High levels of stress have also been linked to presenteeism, with a high proportion of nurses going to work when feeling unwell (3,5). Attending work when unwell has associated economic burden not only for the NHS, but for societies due to loss of productivity (51,52). Other studies have shown that the pressure for nurses to attend work when feeling unwell has been found to be self-directed i.e. feelings of letting down colleagues and patients/services if they are away from work (3,53) but has also been related to ‘intimidating’ managerial environment in which nurses are encouraged to return to work before they are ready (3).
For example, almost half of the nurses surveyed for the 2017 RCN Employment Survey reported going to work when feeling unwell at least twice a year (5). In the 2018 NHS Wales Staff Survey, 64% of staff reported that they have come to work despite not feeling well enough (54). Overall, 83% of nurses in our study reported attending work at least once when they felt unwell and the main reasons for attending were largely preventable: stress, respiratory illness (e.g. flu/cold) or musculoskeletal conditions. Notably, the main causes of both presenteeism and absenteeism in the wider NHS are similar to our findings (MSK conditions [25%], and stress [23%]; (55)) and highlight the need for a more focused approach on prevention by promoting a culture of health, wellbeing and safety in the workplace (56,57).
Our survey found that the overall uptake of the free annual flu vaccination was only 70% and this number decreased with increasing age. Consistent with previous studies (58,59), two of the commonly reported barriers was that either they did not believe that the vaccine works or that they were worried that the vaccine would make them ill. These attitudes may have the effect of undermining the health protection offered by the vaccination within the hospital and healthcare settings and may contribute to the low flu vaccination coverage among healthcare professionals, particularly in nurses (58,59). This demonstrates the need for further action to better inform and engage the nursing and midwifery workforce in prevention of ill-health.
Consideration for actionGiven that, the working environment has a significant influence on health and wellbeing; managers, administrators and policy-makers are urged to develop and maintain supportive work environments in order to improve staff and patient outcomes. Two main areas of focus are outlined below:
• Support the mental wellbeing of the workforce: High levels of stress amongst the workforce is a concern, in particular amongst female staff, younger members of the workforce and those employed in NHS Pay Bands 5 and 6. There is a need to better understand and address the factors contributing to stress including system and cultural drivers of presenteeism (e.g. staffing pressures) and to ensure settings are healthy working environments, for example by enforcing work breaks, and providing access to healthy food and drinks.
• Strengthen prevention of ill health: Levels of flu vaccine uptake are low amongst the nursing and midwifery workforce, and attending work when suffering from respiratory illness such as flu or a cold is common. Action is needed to address barriers to vaccination (e.g. informed by behavioural insights) and to encourage sick employees to stay at home.
Towards a healthy and sustainable workforce for the future
32
4.3 Feelings towards career and perceptions of value
Despite the high levels of work-related stress and other working pressures, positivity towards their career was still relatively high amongst our respondents, with 75% reporting that their job was rewarding and 69% felt enthusiastic about their job. It is well known that nurses tend to describe nursing as a rewarding and fulfilling profession (34,60). However, according to the 2017 RCN Employment Survey, the proportion of nurses recommending nursing as a career (41%) was the lowest reported at any point in the last decade (5). Our findings were slightly higher with 55% of our respondents stating that they would recommend their job as a career.
In our study, a high proportion reported feeling valued by patients and families of patients but felt less valued by senior members of the staff. Lower levels of job satisfaction and feelings of value, particularly from senior staff, were found in Pay Bands 5 and 6 and in those with poorer general health and low mental wellbeing. Nurses have consistently reported that they do not feel valued (34). Feelings of value are important to increase job satisfaction and reduce emotional exhaustion and stress amongst nurses and midwives (26,61). In Scotland, authors found that nurses were less stressed if they felt in control of their activities and felt that their work was valued (62).
Half of our respondents reported considering leaving the profession (50%, compared to similar results from the recent NHS England Staff Survey at 51%) and 22% considered moving to the private sector (compared to 21% thinking of quitting the NHS altogether; (6)). High levels of stress, job dissatisfaction and disillusionment have been previously reported in the UK nursing and midwifery workforce (6,63,64). Dissatisfaction with pay band/grade is closely related to the sense that pay does not match the level of responsibility, the duties or the intensity of the job (65). Lack of support, particularly from senior staff (66) as well as lack of development opportunities previously found among UK nurses (5) may also explain why we observed a high proportion in the youngest age groups and in NHS Pay Bands 5 and 6 in our study that reported having considered leaving the profession. Welsh Government have recently published their “Employability plan” (67) which promotes the concept of fair work which seeks to adequately reward and offer real and meaningful opportunities for progression. This represents an opportunity to consider how best to implement the aspirations of Fair Work within the context of the NHS.
The Nursing & Midwifery Council (NMC) reported that working conditions, exacerbated by staffing shortages are the main reason for nurses and midwives leaving the profession before retirement (68). On the other hand, a positive perception of the work environment is associated with approximately 30% less intention to leave the profession (69). Poor physical health and mental wellbeing have been linked to low levels of satisfaction and feelings of value (70). This, in turn, has been associated with the intention to leave the profession, which has implications for workforce retention (60,65,71).
Staff shortages and turnover represent a major problem for health and social care in terms of the ability to care for patients and the quality of care (72). There are significant cost implications associated with a burdened healthcare service (64). Turnover of nursing staff produces costs due to refilling the position, arranging introductory programmes for new employees and loss of organisational productivity and knowledge (72). For instance, it has been recently estimated that in England, one in eight nursing positions are currently vacant (73), with the average cost of recruiting a band 5 to 6 staff nurse between £1000 and £9000 (74,75). To retain qualified staff, it is important that staff feel valued and that the high levels of job satisfaction are reflected in better physical and mental health outcomes (76). Evidence shows that it may take nursing staff up to 3
Towards a healthy and sustainable workforce for the future
33
years before they make the final decision to leave (77,78) and therefore, managers have a window of opportunity to implement preventative action to discourage nurses from making the final decision to leave the profession.
Consideration for actionRecognise and value the nursing and midwifery workforce: Over two thirds of the nursing and midwifery workforce felt the occupation was a rewarding career, and were valued by patients and families, but fewer felt valued by senior staff. Action is needed to better understand the underlying contributing factors to inform action to address this imbalance. Following the concepts of fair work and adequately rewarding staff, with the potential for real and meaningful progression, could be important first steps.
4.4 Financial pressures and the associations with health and wellbeing
Undue financial pressures is another external consideration that can have adverse consequences for health and wellbeing. Of the respondents to our survey, 38% experienced some sort of financial difficulties and 42% expressed financial worries in the last 12 months. These difficulties were more apparent in the younger age groups (18-49 years) and those in lower pay bands (less than Pay Band 7). A quarter of all respondents have lost sleep over money worries but the impact of financial worries including impact on decision-making at work, impact on the wider family unit and considering leaving the job was also significantly higher in males, in those aged between 18 and 49 years old and those in lower pay bands.
Our findings are consistent with findings from the Cavell Nurses’ Trust survey which indicated that UK nurses are twice as likely to suffer financial hardship (e.g. unable to afford basic necessities) than the general population, especially healthcare assistants who are in the lower pay bands/grades (79). Evidence suggests that even for those nurses who are more able to afford these necessities they are still generally more financially deprived than the general UK population (79). Data from the RCN also reflect the financial pressure nurses (and midwives) are currently experiencing, with increasing numbers of nurses having to seek financial help (80). In 2016, the RCN Foundation awarded more than £250,000 to applicants of their hardship funding streams, up from £56,000 only a decade ago (72).
The RCN has also recognised that staffing shortages, not getting a pay rise, and cuts in education funding are all some of the main reasons for poor nurse staff retention (68). We demonstrate in this report that financial circumstances are also associated with poorer health and wellbeing and considerations of leaving the workforce. On a positive note, NHS Wales (and the wider UK) have just seen new pay scales introduced (81) which may alleviate some of these pressures.
Interventions with financial incentives were also reported by our respondents as a way to help improve their health and wellbeing. Financial incentives have already been tested in the NHS through the ‘Pounds for Pounds’ trial available for NHS staff and the general public with mixed results (82). Clinically significant weight changes and positive changes to dietary behaviours and physical activity were noted. However, the drop-out rate was higher in comparison to other commercial weight loss programmes and there is no data on sustained weight and long-term behavioural changes (46). More research is needed to demonstrate the success of financial incentives to improve lifestyle behaviours in the nursing and midwifery workforce.
Towards a healthy and sustainable workforce for the future
34
Consideration for actionUnderstand the root cause of financial pressures: The proportion of the nursing and midwifery workforce reporting financial pressure is of concern, given the links between financial pressures and poor health and wellbeing. Action is needed to understand the root causes of these pressures and co-produce solutions. Alongside, ensuring early and timely access to financial advice and support for those currently in need.
4.5 Identification of two working populations of concern
4.5.1 Younger members of the nursing and midwifery workforce
Currently, the nursing and midwifery workforce are experiencing several socio-political challenges from the very beginning of their career (64). Younger individuals are entering the workforce with more disadvantages (i.e. funding cuts, staff shortages) than those who entered the workforce 20 or 30 years ago. Given the increasing demands for healthcare in our ageing population and predicted nursing and midwifery workforce shortages (64), nurses’ ability to provide services and their capacity to act as role models in health-promoting behaviour will be limited by their poor health status (19,83).
A decline in the health and mental wellbeing of nurses will inevitably impact the capacity of the NHS to provide the health and social care services that the population needs. Self-rated poor health and lower mental wellbeing in the youngest age group in our study could place them at higher risk of adverse physical and mental health as they continue employment in the profession because their health status is already comprised at a young age (19). The impact of financial concerns were also high in this demographic and it is also important to consider that some of the younger workforce are likely to still be experiencing financial worries, which have been established as a major stressor on mental health in student nurses and midwives (34).
4.5.2 Members of the workforce within NHS Pay Bands 5 and 6
The health and wellbeing of the nursing and midwifery workforce currently employed in NHS Pay Bands 5 and 6 is also of concern. This population typically make up the majority of the workforce, and are usually in frontline/patient facing positions (5).
The levels of work-related stress were highest in this Pay Band and we have already touched upon working pressures leading to job dissatisfaction within the NHS workforce. More specifically, in the NHS, there are particularly low scores for job satisfaction among nurses in Pay Band 5 (5). This could explain why feelings of leaving the profession were higher in our respondents within Pay Bands 5 and 6.
Poor health and mental wellbeing have been linked to low levels of satisfaction and feelings of value (71). This, in turn, has been associated with the intention to leave the profession with important implications for workforce retention (62, 67, 72). Such research findings were reflected in our observations, those within Pay Bands 5 and 6 reported lowest levels of job satisfaction and
Towards a healthy and sustainable workforce for the future
35
feeling valued, and were the highest proportion that expressed a desire to leave the profession. This specific workforce population also experienced more frequent barriers to their own healthcare needs which were reflective of current staff shortages (no cover to allow attendance)
or fears about a personal impact on their job or career.
Further considerationA focus on supporting the younger members of the nursing and midwifery workforce and those employed in NHS Pay Bands 5 and 6: These two groups of our respondents consistently reported poorer health and wellbeing outcomes. The need for targeted approaches should be considered in the development of actions to support the health and wellbeing of the workforce as a whole.
4.6 Wider implications for the future of the nursing workforce in Wales
At a time when the UK needs more nurses and midwives, a high proportion have expressed a desire to leave the profession (64). It has been recognised that nursing and midwifery staff feel overworked, underpaid and unable to provide the level of care they would like which has resulted in low morale and overall job dissatisfaction (3,5). Early retirement is yet another factor contributing to losing capacity in the NHS (5). Experienced nurses and midwives possess intellectual and institutional memory (84), they are more equipped to handle difficult situations (85), they enhance the quality of care, and provide vital mentorship for inexperienced staff entering the workforce (86). Creating a more supportive work environment for an ageing workforce is crucial to delay the retirement of older and more experienced nurses and midwives (87).
It is also worth noting that the challenge is not only staff retention but encouraging young people to enter nursing or midwifery as a career (64). Recent data has shown that one in four student nurses drop out of their degrees before graduation (88) and over half of midwifery undergraduates have considered dropping their studies, generally as a result of financial pressures (89). Despite Wales retaining the bursary for student nurses, the number of applicants to 2017/18 undergraduate nursing courses was down by 10% compared to 2016 (64). All of these factors contribute to the nurse shortages in the UK that have been exacerbated by the decrease of EU nurses working in the UK since 2016/17 (63).
Towards a healthy and sustainable workforce for the future
36
4.7 Limitations of the study
This study has some limitations which we do acknowledge. Respondents were self-selected and whilst their demographic characteristics resembled those of the nursing and midwifery workforce (e.g. nine in ten nurses are female) (68), it is not possible to confirm the representative nature of the respondents. Therefore the findings are descriptive and not generalisable to the entire nursing and midwifery workforce in Wales.
The majority of our respondents were nurses so we were unable to make any comparisons between occupations and health and wellbeing as in previous UK studies (12).
In addition, this was a self-report survey, with the usual limitations of participant recall and potential bias. Qualitative methods might have been more advantageous to explore feelings about the profession and working conditions in detail. Finally, our study relied on cross-sectional data and therefore could not definitively establish causality.
4.8 Conclusions
Our findings provide useful insights into the health and wellbeing of the Welsh nursing and midwifery workforce. Although, respondents self-rated their general health similarly to that of the general population and reported high levels of job satisfaction, they are experiencing high levels of work-related stress, with a third of them experiencing financial pressures.
A high proportion of respondents have considered leaving the profession, particularly in NHS Pay Bands 5 and 6 and those with poorer health and low mental wellbeing. The health and wellbeing of the nursing and midwifery workforce is not only important at a personal level, but for the population that requires their services.
The ageing demographics of the nursing and midwifery workforce, its declining health status mirroring the ageing of the population, balanced against increasing care needs, suggests that effective wellbeing strategies for nurses and midwives are essential not only to safeguard their health but to ensure a healthy and sustainable nursing and midwifery workforce for the future.
Given that the working environment has a huge influence on health and wellbeing; managers, administrators and policy-makers are urged to develop and maintain supportive work environments in order to improve staff and patient outcomes.
The findings and recommendations outlined in this report will help Welsh Government achieve their ambition of creating ‘a motivated and sustainable health and social care workforce’ (16) that contributes to making the health and social care system fit for the future.

Towards a healthy and sustainable workforce for the future
37
References1. Welsh NHS Confederation. Our greatest asset: The NHS
Wales Workforce. 2017;1–6. 2. The Health Committee. The Nursing Workforce: Second
Report of Session 2017-19. 2018;55. 3. Royal College of Nursing. Beyond breaking point? 2013. 4. Creedy DK, Sidebotham M, Gamble J, Pallant J, Fenwick
J. Prevalence of burnout, depression, anxiety and stress in Australian midwives: A cross-sectional survey. BMC Pregnancy Childbirth [Internet]. 2017;17(1):1–8.
5. Royal College of Nursing. Royal College of Nursing Employment Survey 2017.pdf.
6. National Health Service. NHS Staff Survey. 2018. 7. Jones-Berry S. Too much pressure: NHS employers must
invest in nurses’ wellbeing. Nurs Stand. 2013;28(2):12-13. 8. Michael West. The NHS crisis of caring for staff | The King’s
Fund. The Kings Fund Blog. 2019. 9. Lehmann F, Von Lindeman K, Klewer J, Kugler J. BMI,
physical inactivity, cigarette and alcohol consumption in female nursing students: A 5-year comparison. BMC Med Educ. 2014;14(1):1–6.
10. Kyle RG, Neall RA, Atherton IM. Prevalence of overweight and obesity among nurses in Scotland: A cross-sectional study using the Scottish Health Survey. Int J Nurs Stud. 2016;53:126–33.
11. Kyle RG, Wills J, Mahoney C, Hoyle L, Kelly M, Atherton IM. Obesity prevalence among healthcare professionals in England: A cross-sectional study using the Health Survey for England. BMJ Open. 2017;7(12):1–7.
12. Schneider A, Bak M, Mahoney C, Hoyle L, Kelly M, Atherton IM, et al. Health-related behaviours of nurses and other healthcare professionals: A cross-sectional study using the Scottish Health Survey. J Adv Nurs. 2019;75(6):1239–51.
13. Prince MJ, Wu F, Guo Y, Gutierrez Robledo LM, O’Donnell M, Sullivan R, et al. The burden of disease in older people and implications for health policy and practice. Lancet. 2015;385(9967):549–62.
14. World Health Organization. Global strategic directions for strengthening nursing and midwifery 2016–2020. 2020.
15. Welsh Government. Parliamentary Review of Health and Social Care in Wales. A Revolution from Within: Transforming Health and Care in Wales. 2018.
16. Welsh Government. A Healthier Wales: Our Plan for Health and Social Care. 2018.
17. Reed S, Göpfert A, Wood S, Allwood D, Warburton W. Building healthier communities: the role of the NHS as an anchor institution. 2019.
18. Kemppainen V, Tossavainen K, Turunen H. Nurses’ roles in health promotion practice: An integrative review. Health Promot Int. 2013;28(4):490-501.
19. Perry L, Gallagher R, Duffield C. The health and health behaviours of Australian metropolitan nurses: An exploratory study. BMC Nurs. 2015;14(1):1–11.
20. Kelly M, Wills J, Sykes S. Do nurses’ personal health behaviours impact on their health promotion practice? A systematic review. Int J Nurs Stud. 2017;76(August):62–77.
21. Welsh Government. National Survey for Wales, 2018-2019. Adult lifestyles by age and gender. Welsh government; 2019.
22. Torquati L, Kolbe-Alexander T, Pavey T, Persson C, Leveritt M. Diet and physical activity behaviour in nurses: a qualitative study. Int J Heal Promot Educ. 2016;54(6):268-282
23. Arias OE, Umukoro PE, Stoffel SD, Hopcia K, Sorensen G, Dennerlein JT. Associations between trunk flexion and physical activity of patient care workers for a single shift: A pilot study. Work. 2017;56(2):247–55.
24. Reed JL, Prince SA, Pipe AL, Attallah S, Adamo KB, Tulloch HE, et al. Influence of the workplace on physical activity and cardiometabolic health: Results of the multi-centre cross-sectional Champlain Nurses’ study. Int J Nurs Stud. 2018;81:49–60.
25. Babiolakis CS, Kuk JL, Drake JDM. Differences in lumbopelvic control and occupational behaviours in female nurses with and without a recent history of low back pain due to back injury. Ergonomics. 2015;58(2):235–45.
26. Mollart L, Skinner VM, Newing C, Foureur M. Factors that may influence midwives work-related stress and burnout. Women and Birth. 2013;26(1):26–32.
27. Blake H, Stanulewicz N, McGill F. Predictors of physical activity and barriers to exercise in nursing and medical students. J Adv Nurs. 2017;73(4):917–29.
28. La Torre G. Is there an emergency of tobacco smoking among health professionals in the European region? Eur J Public Heal. 2013;23(2):189–90.
29. Mujika A, Forbes A, Canga N, de Irala J, Serrano I, Gascó P, et al. Motivational interviewing as a smoking cessation strategy with nurses: An exploratory randomised controlled trial. Int J Nurs Stud. 2014;51(8):1074–82.
30. Office for National Statistics. Adult drinking habits in Great Britain: 2005 to 2016. Office for National Statistics; 2017.
31. Gifkins J, Johnston A, Loudoun R. The impact of shift work on eating patterns and self-care strategies utilised by experienced and inexperienced nurses. Chronobiol Int. 2018;35(6):811–20.
32. Matheson A, O’Brien L, Reid JA. The impact of shiftwork on health: A literature review. J Clin Nurs 2014;23(23-24):3309-20.
33. Bennett JE, Pearson-Stuttard J, Kontis V, Capewell S, Wolfe I, Ezzati M. Contributions of diseases and injuries to widening life expectancy inequalities in England from 2001 to 2016: a population-based analysis of vital registration data. Lancet Public Heal. 2018;3(12):e586-e597.
34. Parliament UK. The Nursing Workforce. London; 2018. 35. MacPhee M, Dahinten V, Havaei F. The Impact of Heavy
Perceived Nurse Workloads on Patient and Nurse Outcomes. Adm Sci. 2017;7(1):7.
36. Phiri LP, Draper CE, Lambert E V., Kolbe-Alexander TL. Nurses’ lifestyle behaviours, health priorities and barriers to living a healthy lifestyle: A qualitative descriptive study. BMC Nurs. 2014;13(1):38.
37. Nicholls R, Perry L, Duffield C, Gallagher R, Pierce H. Barriers and facilitators to healthy eating for nurses in the workplace: an integrative review. J Adv Nurs. 2017;73(5):1051–65.
38. Bonnell EK, Huggins CE, Huggins CT, McCaffrey TA, Palermo C, Bonham MP. Influences on dietary choices during day versus night shift in shift workers: A mixed methods study. Nutrients. 2017;9(3):193.
39. Yoshizaki T, Kawano Y, Noguchi O, Onishi J, Teramoto R, Sunami A, et al. Association of eating behaviours with diurnal preference and rotating shift work in Japanese female nurses: A cross-sectional study. BMJ Open. 2016;6(11):e011987.
40. Persson M, Mårtensson J. Situations influencing habits in diet and exercise among nurses working night shift. J Nurs Manag. 2006;14(5):414–23.
41. Gifkins J, Johnston A, Loudoun R. The impact of shift work on eating patterns and self-care strategies utilised by experienced and inexperienced nurses. Chronobiol Int. 2018;35(6):811-820.
42. Perry L, Xu X, Gallagher R, Nicholls R, Sibbritt D, Duffield C. Lifestyle health behaviors of nurses and midwives: The ‘fit for the future’ study. Int J Environ Res Public Health. 2018;15(5).
43. Welsh Assembly Government. Health at Work. The Corporate Health Standard. Cardiff; 2010.
44. Faugier J, Lancaster J, Pickles D, Dobson K. Barriers to healthy eating in the nursing profession: Part 2. Nurs Stand. 2001;15(37);33-5.
Towards a healthy and sustainable workforce for the future
38
45. National Institute for Health and Clinical Excellence. CG43 Obesity: The Prevention, Identification, Assessment and Management of Overweight and Obesity in Adults and Children. London: National Institute for Health and Clinical Excellence; 2006.
46. Kelly M, Wills J. Systematic review: What works to address obesity in nurses? Occup Med (Chic Ill). 2018;68(4):228–38.
47. Speroni KG, Williams DA, Seibert DJ, Gibbons MG, Earley C. Helping nurses care for self, family, and patients through the nurses living fit intervention. Nurs Adm Q. 2013;37(4):286-94.
48. Tucker SJ, Lanningham-Foster LM, Murphy JN, Thompson WG, Weymiller AJ, Lohse C, et al. Effects of a worksite physical activity intervention for hospital nurses who are working mothers. AAOHN J. 2011;59(9):377-86.
49. UNISON. NHS Pay Review Body 2017-18 September 2016 Introduction Fair pay in Agenda for Change – moving towards a fairer pay structure. 2017. p. 1–9.
50. NHS Wales. Healthy Working Wales. 2016. 51. Demou E, Smith S, Bhaskar A, Mackay DF, Brown J,
Hunt K, et al. Evaluating sickness absence duration by musculoskeletal and mental health issues: A retrospective cohort study of Scottish healthcare workers. BMJ Open. 2018;8(1):e018085.
52. Imai C, Toizumi M, Hall L, Lambert S, Halton K, Merollini K. A systematic review and meta-analysis of the direct epidemiological and economic effects of seasonal influenza vaccination on healthcare workers. PLoS One. 2018;13(6):e0198685.
53. Krane L, Larsen EL, Nielsen CV, Stapelfeldt CM, Johnsen R, Risør MB. Attitudes towards sickness absence and sickness presenteeism in health and care sectors in Norway and Denmark: A qualitative study. BMC Public Health. 2014;14:880.
54. NHS Wales. NHS Wales Staff Survey 2018. 2018. 55. Workforce, Education and Development Services. Focus on
Sickness Absence Trends in NHS Wales. 2015. p. 1–24. 56. To KW, Lai A, Lee KCK, Koh D, Lee SS. Increasing the
coverage of influenza vaccination in healthcare workers: review of challenges and solutions. J Hosp Infect. 2016;94(2):133-42.
57. Awa WL, Plaumann M, Walter U. Burnout prevention: A review of intervention programs. Patient Educ Couns. 2010;78(2):184-90.
58. Zhang J, While AE, Norman IJ. Seasonal influenza vaccination knowledge, risk perception, health beliefs and vaccination behaviours of nurses. Epidemiol Infect. 2012;140(9):1569-77.
59. Pless A, McLennan SR, Nicca D, Shaw DM, Elger BS. Reasons why nurses decline influenza vaccination: A qualitative study. BMC Nurs. 2017;16:20.
60. Sabanciogullari S, Dogan S. Relationship between job satisfaction, professional identity and intention to leave the profession among nurses in Turkey. J Nurs Manag. 2015;23(8):1076–85.
61. Sherring S, Knight D. An exploration of burnout among city mental health nurses. Br J Nurs. 2009;18(20):1234–40.
62. Johnston D, Bell C, Jones M, Farquharson B, Allan J, Schofield P, et al. Stressors, Appraisal of Stressors, Experienced Stress and Cardiac Response: A Real-Time, Real-Life Investigation of Work Stress in Nurses. Ann Behav Med. 2016;50(2):187–97.
63. West M. The health care workforce in England. 2018. 64. Buchan J, Charlesworth A, Gershlick B, Seccombe I. A Critical
Moment: NHS staffing trends, retention and attrition. 2019. 38 p.
65. Chan ZCY, Tam WS, Lung MKY, Wong WY, Chau CW. A systematic literature review of nurse shortage and the intention to leave. J Nurs Manag. 2013;21:605–13.
66. Khamisa N, Peltzer K, Ilic D, Oldenburg B. Work related stress, burnout, job satisfaction and general health of nurses: A follow-up study. Int J Nurs Pract. 2016;12(1):652–66.
67. Welsh Government. Employability plan. 2018. 68. Nursing and Midwifery Council. The NMC register.
2019;(March):28.
69. Heinen MM, van Achterberg T, Schwendimann R, Zander B, Matthews A, Kózka M, et al. Nurses’ intention to leave their profession: A cross sectional observational study in 10 European countries. Int J Nurs Stud. 2013;50(2):174–84.
70. Lai HL, Lin YP, Chang HK, Wang SC, Liu YL, Lee HC, et al. Intensive care unit staff nurses: Predicting factors for career decisions. J Clin Nurs. 2008;17(14):1886–96.
71. Perry L, Gallagher R, Duffield C, Sibbritt D, Bichel-Findlay J, Nicholls R. Does nurses’ health affect their intention to remain in their current position? J Nurs Manag. 2016;24(8):1088–97.
72. Flinkman M, Leino-Kilpi H, Salanterä S. Nurses’ intention to leave the profession: Integrative review. J Adv Nurs. 2010;66(7):1422-34.
73. Beech J, Bottery S, Charlesworth A, Evans H, Gershlick B, Hemmings N, et al. Closing the Gap. London; 2019.
74. Szeremeta L, Shamash N. Improving staff retention and career progression. Nurs Times. 2016;112(18):18–20.
75. NHS Employers. NHS registered Nurses Supply and demand Survey findings report to inform the migration advisory Committee (MAC) on the partial review of the shortage occupation list. 2015.
76. Faragher EB, Cass M, Cooper CL. The relationship between job satisfaction and health: A meta-analysis. Occup Environ Med. 2005;62(2):105–12.
77. Cortese CG. Predictors of critical care nurses’ intention to leave the unit, the hospital, and the nursing profession. Open J Nurs. 2012;2:311–326.
78. Flinkman M, Leino-Kilpi H, Salanterä S. Nurses’ intention to leave the profession: Integrative review. J Adv Nurs. 2010;66(7):1422–34.
79. Cavell Nurses Trust. But who is caring for our nurses? 2016. p. 60.
80. Royal College of Nursing. More nurses apply for financial help. 2017.
81. NHS Wales Employers. NHS Wales. Agenda for Change - Pay agreement and contract refresh 2018. [Internet]. 2018. Available from: https://www.nhsconfed.org/-/media/Confederation/Files/Wales-Confed/Wales-Employers/AfC-Pay-Agreement---2018-21-Outline-Communication-FINAL-260918.pdf
82. Samdal GB, Eide GE, Barth T, Williams G, Meland E. Effective behaviour change techniques for physical activity and healthy eating in overweight and obese adults; systematic review and meta-regression analyses. Int J Behav Nutr Phys Act. 2017.14(1):42.
83. Lamont S, Brunero S, Perry L, Duffield C, Sibbritt D, Gallagher R, et al. ‘Mental health day’ sickness absence amongst nurses and midwives: workplace, workforce, psychosocial and health characteristics. J Adv Nurs. 2017;73(5):1172-1181.
84. Duffield C, Graham E, Donoghue J, Griffiths R, Bichel-Findlay J, Dimitrelis S. Workforce shortages and retention of older nurses. Aust Nurs midwifery J. 2015;22(7):18.
85. Wu S, Singh-Carlson S, Odell A, Reynolds G, Su Y. Compassion fatigue, burnout, and compassion satisfaction among oncology nurses in the United States and Canada. Oncol Nurs Forum. 2016;43(4):E161–9.
86. Hayward D, Bungay V, Wolff AC, Macdonald V. A qualitative study of experienced nurses’ voluntary turnover: Learning from their perspectives. J Clin Nurs. 2016;25(9–10):1336–45.
87. Wargo-Sugleris M, Robbins W, Lane CJ, Phillips LR. Job satisfaction, work environment and successful ageing: Determinants of delaying retirement among acute care nurses. J Adv Nurs. 2018;74(4):900–13.
88. Perry S. One in four student nurses drop out of their degrees before graduation. The Health Foundation. 2018.
89. Royal College of Midwives. Half of student midwives consider leaving training over financial concerns reveals RCM [Internet]. 2019. Available from: https://www.rcm.org.uk/media-releases/2019/september/half-of-student-midwives-consider-leaving-training-over-financial-concerns-reveals-rcm/
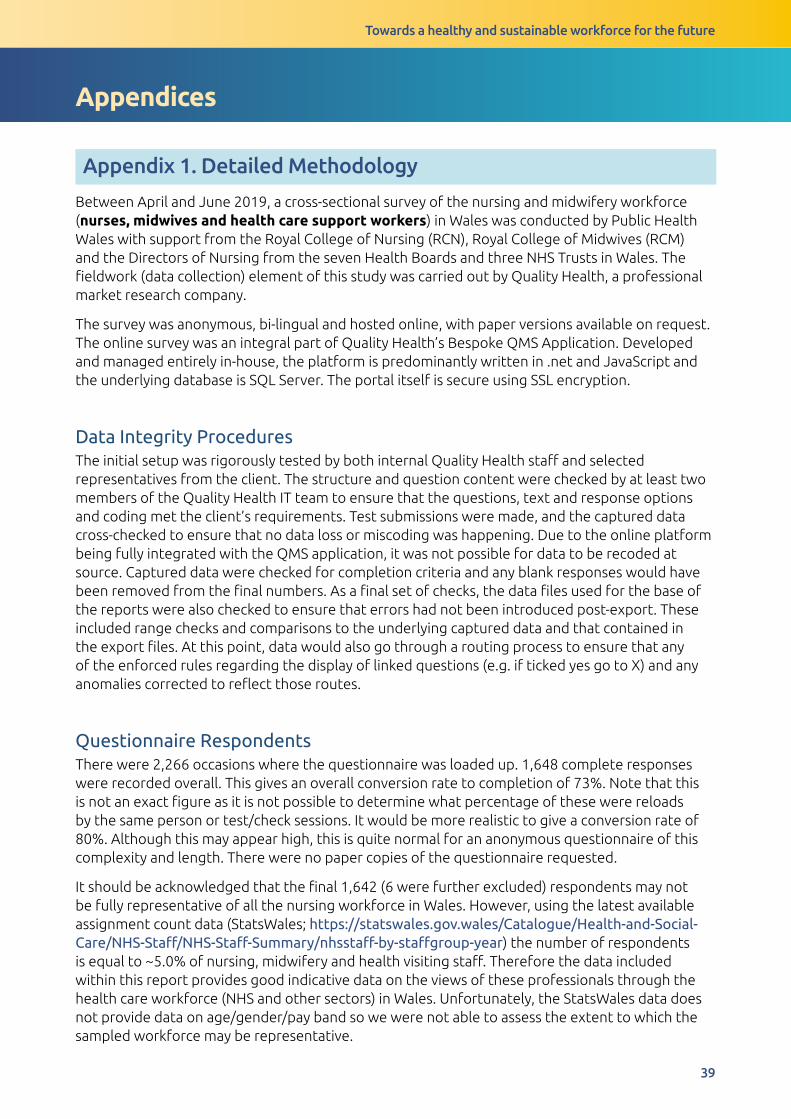
Towards a healthy and sustainable workforce for the future
39
Appendices
Appendix 1. Detailed Methodology
Between April and June 2019, a cross-sectional survey of the nursing and midwifery workforce (nurses, midwives and health care support workers) in Wales was conducted by Public Health Wales with support from the Royal College of Nursing (RCN), Royal College of Midwives (RCM) and the Directors of Nursing from the seven Health Boards and three NHS Trusts in Wales. The fieldwork (data collection) element of this study was carried out by Quality Health, a professional market research company.
The survey was anonymous, bi-lingual and hosted online, with paper versions available on request. The online survey was an integral part of Quality Health’s Bespoke QMS Application. Developed and managed entirely in-house, the platform is predominantly written in .net and JavaScript and the underlying database is SQL Server. The portal itself is secure using SSL encryption.
Data Integrity ProceduresThe initial setup was rigorously tested by both internal Quality Health staff and selected representatives from the client. The structure and question content were checked by at least two members of the Quality Health IT team to ensure that the questions, text and response options and coding met the client’s requirements. Test submissions were made, and the captured data cross-checked to ensure that no data loss or miscoding was happening. Due to the online platform being fully integrated with the QMS application, it was not possible for data to be recoded at source. Captured data were checked for completion criteria and any blank responses would have been removed from the final numbers. As a final set of checks, the data files used for the base of the reports were also checked to ensure that errors had not been introduced post-export. These included range checks and comparisons to the underlying captured data and that contained in the export files. At this point, data would also go through a routing process to ensure that any of the enforced rules regarding the display of linked questions (e.g. if ticked yes go to X) and any anomalies corrected to reflect those routes.
Questionnaire RespondentsThere were 2,266 occasions where the questionnaire was loaded up. 1,648 complete responses were recorded overall. This gives an overall conversion rate to completion of 73%. Note that this is not an exact figure as it is not possible to determine what percentage of these were reloads by the same person or test/check sessions. It would be more realistic to give a conversion rate of 80%. Although this may appear high, this is quite normal for an anonymous questionnaire of this complexity and length. There were no paper copies of the questionnaire requested.
It should be acknowledged that the final 1,642 (6 were further excluded) respondents may not be fully representative of all the nursing workforce in Wales. However, using the latest available assignment count data (StatsWales; https://statswales.gov.wales/Catalogue/Health-and-Social-Care/NHS-Staff/NHS-Staff-Summary/nhsstaff-by-staffgroup-year) the number of respondents is equal to ~5.0% of nursing, midwifery and health visiting staff. Therefore the data included within this report provides good indicative data on the views of these professionals through the health care workforce (NHS and other sectors) in Wales. Unfortunately, the StatsWales data does not provide data on age/gender/pay band so we were not able to assess the extent to which the sampled workforce may be representative.

Towards a healthy and sustainable workforce for the future
40
Questionnaire DevelopmentThe related questions for each of the sections contained within the questionnaire are shown in Box A1. Where possible the questionnaire content was taken or adapted from existing sources or developed internally drawing on expertise. The questionnaire was piloted (bi-lingually) with nursing and midwifery staff from Public Health Wales by Quality Health prior to implementation and some of the feedback contributed to the final questionnaire design.
Box A1. Questionnaire sections, questions and sources
Sections Questions Source
Current health and wellbeing
• Self-reported health status• Presence of long-term health condition or
illness• Impact of health condition or illness on
activities of daily living• Mental health status
• Smoking tobacco• Alcohol consumption• Physical activity participation
National Survey for WalesNational Survey for Wales National Survey for Wales
Short Warwick Edinburgh Mental Wellbeing ScaleNational Survey for WalesAUDIT-CScottish Physical Activity Screening Questionnaire
Health and wellbeing in the workplace
• Work-related stress• Presenteeism - Over the past 12 months
how often, if ever, have you gone to work despite feeling you should really have taken sick leave?
• Barriers when accessing healthcare - Do you feel that any of the following are barriers when accessing healthcare for yourself (select all that apply)?
• Flu jab uptake, location and barriers• Missed breaks (How often?)• Access to water at work• Feelings of adequate hydration• Access to healthy food choices (during the
day, during the evening, would like more options)
• Eat 5 fruit or vegetables per day
Internal questionRCN Employment Questionnaire 2017
Options from Ipsos MORI Fitness to Practice Report
Internal questionInternal questionInternal questionInternal questionStay Well in Wales Survey
Financial pressures
• In the past 12 months (choose all that apply)• To meet daily living expenses• Financial consequences experienced• Impact of financial concerns
RCN Employment Questionnaire 2017
Job satisfaction and feelings of value
• To what extent do you agree/disagree with the following statements?
RCN Employment Questionnaire 2017 and Internal
Feelings towards the profession/job in the past 12 months
• Have you seriously considered any of the following in the past 12 months? (Select all that apply)
Internal
Improvements for health and wellbeing
List of options available;Choose either work, home or both
Internal question
Towards a healthy and sustainable workforce for the future
41
Socio-demographic measures (Deprivation)The Index of Multiple Deprivation (IMD) Quintiles were derived by linking the postcodes of respondents with the February 2019 version of the ONS Postcode data (http://geoportal.statistics.gov.uk/datasets/ons-postcode-directory-february-2019). The IMD rank was then grouped into the prescribed deciles and finally merged to form the quintile value. Postcodes were provided by 1,263 (77.0%) of the respondents.
Data AnalysisAll statistical analysis was undertaken using IBM SPSS Statistics 24.
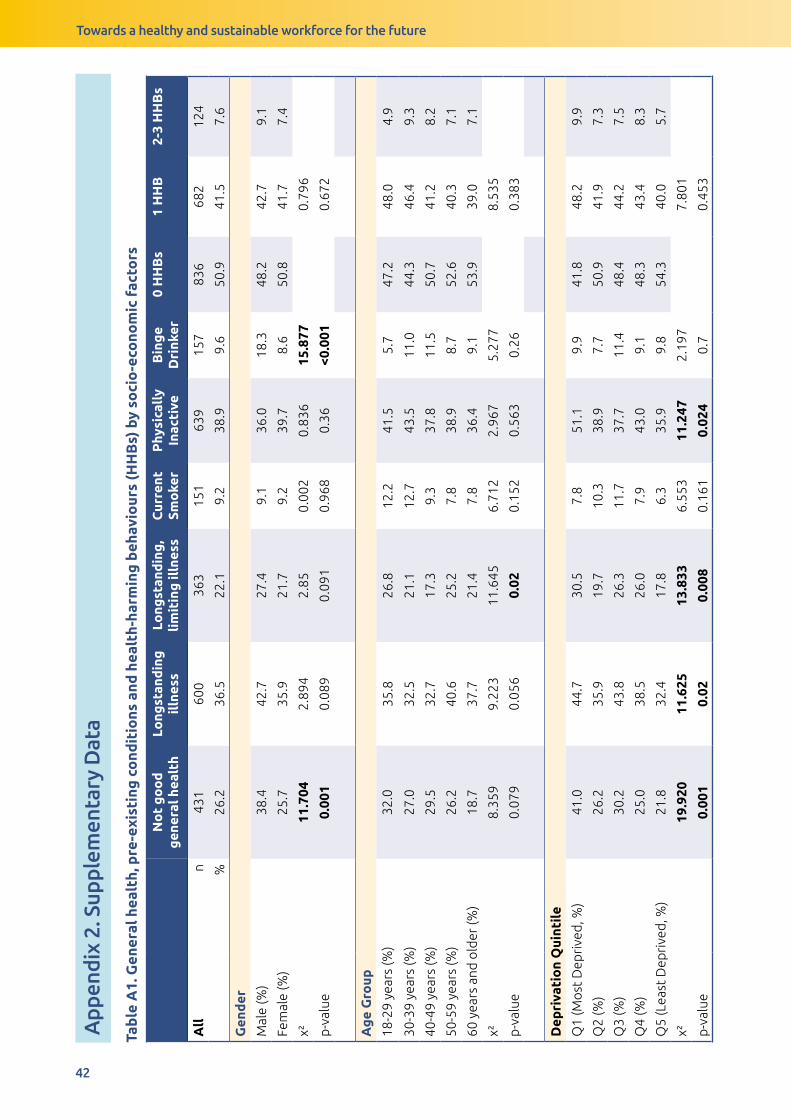
Towards a healthy and sustainable workforce for the future
42
Tab
le A
1. G
ener
al h
ealt
h, p
re-e
xist
ing
co
ndit
ions
and
hea
lth-
harm
ing
beh
avio
urs
(HH
Bs)
by
soci
o-e
cono
mic
fac
tors
No
t g
oo
d
gen
eral
hea
lth
Long
stan
din
g
illn
ess
Long
stan
din
g,
lim
itin
g il
lnes
sC
urre
nt
Smo
ker
Phy
sica
lly
Inac
tive
Bin
ge
Dri
nker
0 H
HB
s1
HH
B2-
3 H
HB
s
All
n
431
600
363
151
639
157
836
682
124
%26
.236
.522
.19.
238
.99.
650
.941
.57.
6
Gen
der
Mal
e (%
)38
.442
.727
.49.
136
.018
.348
.242
.79.
1
Fem
ale
(%)
25.7
35.9
21.7
9.2
39.7
8.6
50.8
41.7
7.4
χ²11
.704
2.89
42.
850.
002
0.83
615
.877
0.79
6
p-v
alue
0.00
10.
089
0.09
10.
968
0.36
<0.0
010.
672
Ag
e G
roup
18-2
9 ye
ars
(%)
32.0
35.8
26.8
12.2
41.5
5.7
47.2
48.0
4.9
30-3
9 ye
ars
(%)
27.0
32.5
21.1
12.7
43.5
11.0
44.3
46.4
9.3
40-4
9 ye
ars
(%)
29.5
32.7
17.3
9.3
37.8
11.5
50.7
41.2
8.2
50-5
9 ye
ars
(%)
26.2
40.6
25.2
7.8
38.9
8.7
52.6
40.3
7.1
60 y
ears
and
old
er (%
)18
.737
.721
.47.
836
.49.
153
.939
.07.
1
χ²8.
359
9.22
311
.645
6.71
22.
967
5.27
78.
535
p-v
alue
0.07
90.
056
0.02
0.15
20.
563
0.26
0.38
3
Dep
riva
tio
n Q
uint
ile
Q1
(Mo
st D
epri
ved
, %)
41.0
44.7
30.5
7.8
51.1
9.9
41.8
48.2
9.9
Q2
(%)
26.2
35.9
19.7
10.3
38.9
7.7
50.9
41.9
7.3
Q3
(%)
30.2
43.8
26.3
11.7
37.7
11.4
48.4
44.2
7.5
Q4
(%)
25.0
38.5
26.0
7.9
43.0
9.1
48.3
43.4
8.3
Q5
(Lea
st D
epri
ved
, %)
21.8
32.4
17.8
6.3
35.9
9.8
54.3
40.0
5.7
χ²19
.920
11.6
2513
.833
6.55
311
.247
2.19
77.
801
p-v
alue
0.00
10.
020.
008
0.16
10.
024
0.7
0.45
3
App
endi
x 2.
Sup
plem
enta
ry D
ata
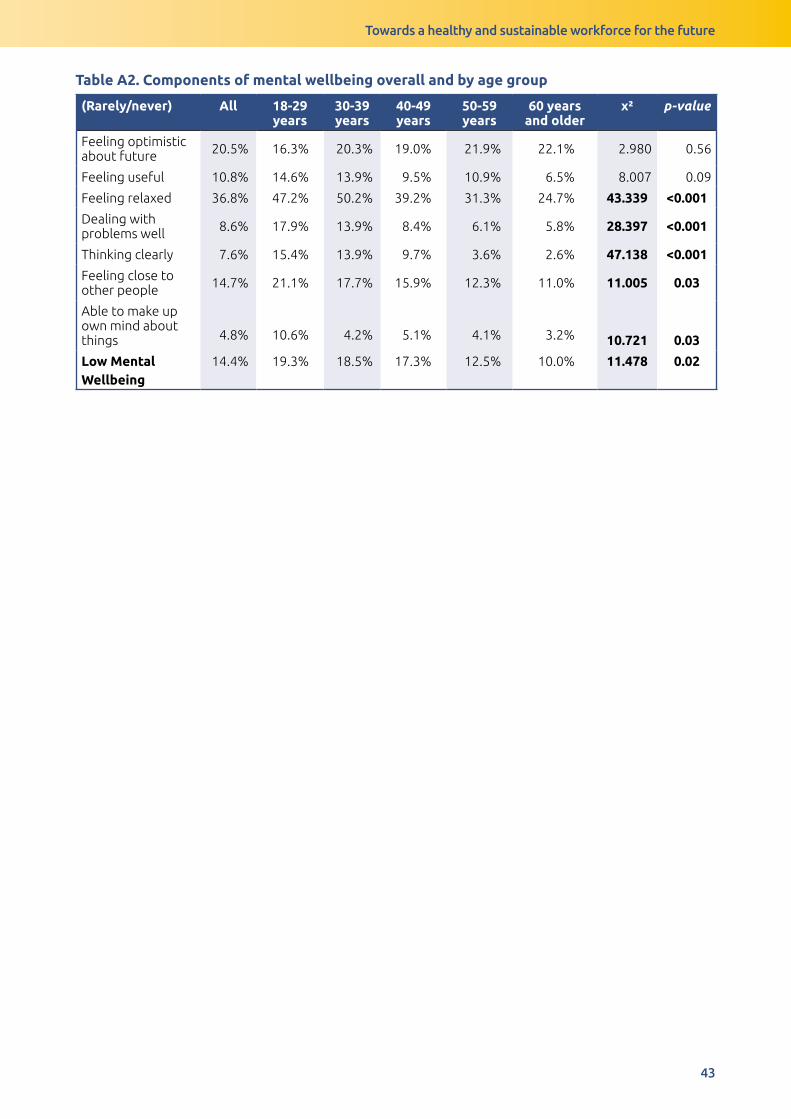
Towards a healthy and sustainable workforce for the future
43
Tab
le A
1. G
ener
al h
ealt
h, p
re-e
xist
ing
co
ndit
ions
and
hea
lth-
harm
ing
beh
avio
urs
(HH
Bs)
by
soci
o-e
cono
mic
fac
tors
No
t g
oo
d
gen
eral
hea
lth
Long
stan
din
g
illn
ess
Long
stan
din
g,
lim
itin
g il
lnes
sC
urre
nt
Smo
ker
Phy
sica
lly
Inac
tive
Bin
ge
Dri
nker
0 H
HB
s1
HH
B2-
3 H
HB
s
All
n
431
600
363
151
639
157
836
682
124
%26
.236
.522
.19.
238
.99.
650
.941
.57.
6
Gen
der
Mal
e (%
)38
.442
.727
.49.
136
.018
.348
.242
.79.
1
Fem
ale
(%)
25.7
35.9
21.7
9.2
39.7
8.6
50.8
41.7
7.4
χ²11
.704
2.89
42.
850.
002
0.83
615
.877
0.79
6
p-v
alue
0.00
10.
089
0.09
10.
968
0.36
<0.0
010.
672
Ag
e G
roup
18-2
9 ye
ars
(%)
32.0
35.8
26.8
12.2
41.5
5.7
47.2
48.0
4.9
30-3
9 ye
ars
(%)
27.0
32.5
21.1
12.7
43.5
11.0
44.3
46.4
9.3
40-4
9 ye
ars
(%)
29.5
32.7
17.3
9.3
37.8
11.5
50.7
41.2
8.2
50-5
9 ye
ars
(%)
26.2
40.6
25.2
7.8
38.9
8.7
52.6
40.3
7.1
60 y
ears
and
old
er (%
)18
.737
.721
.47.
836
.49.
153
.939
.07.
1
χ²8.
359
9.22
311
.645
6.71
22.
967
5.27
78.
535
p-v
alue
0.07
90.
056
0.02
0.15
20.
563
0.26
0.38
3
Dep
riva
tio
n Q
uint
ile
Q1
(Mo
st D
epri
ved
, %)
41.0
44.7
30.5
7.8
51.1
9.9
41.8
48.2
9.9
Q2
(%)
26.2
35.9
19.7
10.3
38.9
7.7
50.9
41.9
7.3
Q3
(%)
30.2
43.8
26.3
11.7
37.7
11.4
48.4
44.2
7.5
Q4
(%)
25.0
38.5
26.0
7.9
43.0
9.1
48.3
43.4
8.3
Q5
(Lea
st D
epri
ved
, %)
21.8
32.4
17.8
6.3
35.9
9.8
54.3
40.0
5.7
χ²19
.920
11.6
2513
.833
6.55
311
.247
2.19
77.
801
p-v
alue
0.00
10.
020.
008
0.16
10.
024
0.7
0.45
3
Table A2. Components of mental wellbeing overall and by age group
(Rarely/never) All 18-29 years
30-39 years
40-49 years
50-59 years
60 years and older
χ² p-value
Feeling optimistic about future 20.5% 16.3% 20.3% 19.0% 21.9% 22.1% 2.980 0.56
Feeling useful 10.8% 14.6% 13.9% 9.5% 10.9% 6.5% 8.007 0.09
Feeling relaxed 36.8% 47.2% 50.2% 39.2% 31.3% 24.7% 43.339 <0.001
Dealing with problems well 8.6% 17.9% 13.9% 8.4% 6.1% 5.8% 28.397 <0.001
Thinking clearly 7.6% 15.4% 13.9% 9.7% 3.6% 2.6% 47.138 <0.001
Feeling close to other people 14.7% 21.1% 17.7% 15.9% 12.3% 11.0% 11.005 0.03
Able to make up own mind about things 4.8% 10.6% 4.2% 5.1% 4.1% 3.2% 10.721 0.03
Low Mental Wellbeing
14.4% 19.3% 18.5% 17.3% 12.5% 10.0% 11.478 0.02
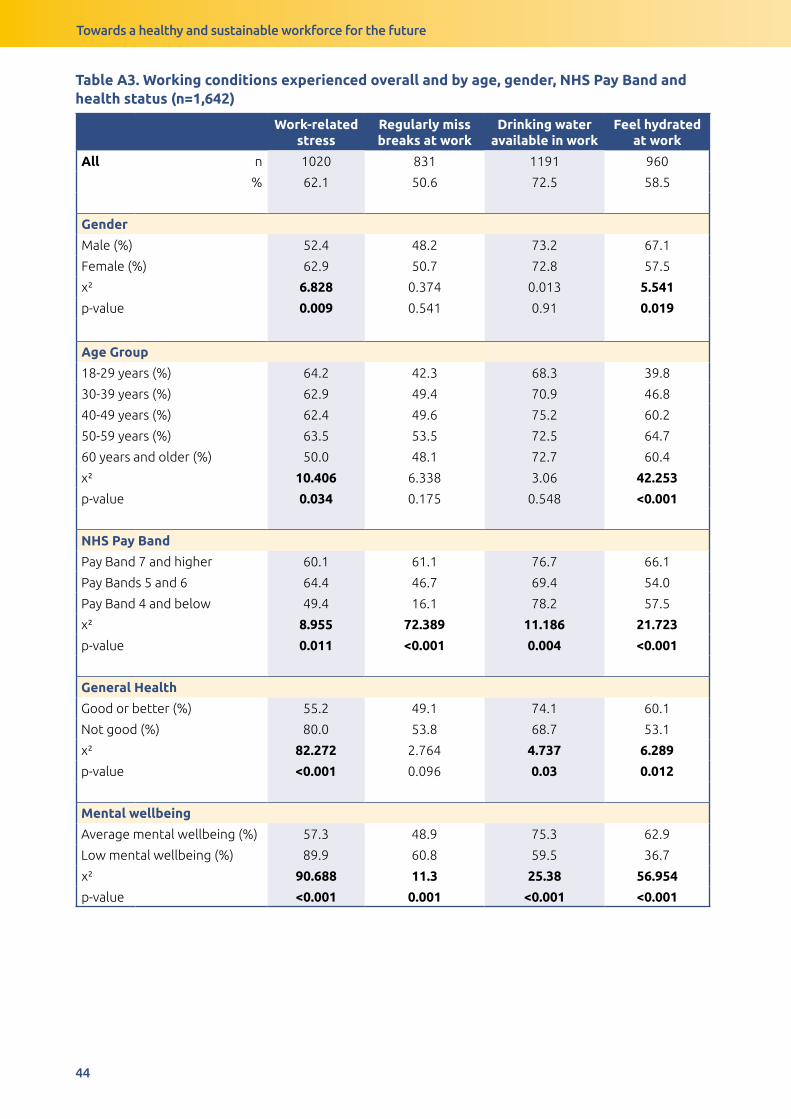
Towards a healthy and sustainable workforce for the future
44
Table A3. Working conditions experienced overall and by age, gender, NHS Pay Band and health status (n=1,642)
Work-related stress
Regularly miss breaks at work
Drinking water available in work
Feel hydrated at work
All n 1020 831 1191 960
% 62.1 50.6 72.5 58.5
Gender
Male (%) 52.4 48.2 73.2 67.1
Female (%) 62.9 50.7 72.8 57.5
χ² 6.828 0.374 0.013 5.541
p-value 0.009 0.541 0.91 0.019
Age Group
18-29 years (%) 64.2 42.3 68.3 39.8
30-39 years (%) 62.9 49.4 70.9 46.8
40-49 years (%) 62.4 49.6 75.2 60.2
50-59 years (%) 63.5 53.5 72.5 64.7
60 years and older (%) 50.0 48.1 72.7 60.4
χ² 10.406 6.338 3.06 42.253
p-value 0.034 0.175 0.548 <0.001
NHS Pay Band
Pay Band 7 and higher 60.1 61.1 76.7 66.1
Pay Bands 5 and 6 64.4 46.7 69.4 54.0
Pay Band 4 and below 49.4 16.1 78.2 57.5
χ² 8.955 72.389 11.186 21.723
p-value 0.011 <0.001 0.004 <0.001
General Health
Good or better (%) 55.2 49.1 74.1 60.1
Not good (%) 80.0 53.8 68.7 53.1
χ² 82.272 2.764 4.737 6.289
p-value <0.001 0.096 0.03 0.012
Mental wellbeing
Average mental wellbeing (%) 57.3 48.9 75.3 62.9
Low mental wellbeing (%) 89.9 60.8 59.5 36.7
χ² 90.688 11.3 25.38 56.954
p-value <0.001 0.001 <0.001 <0.001
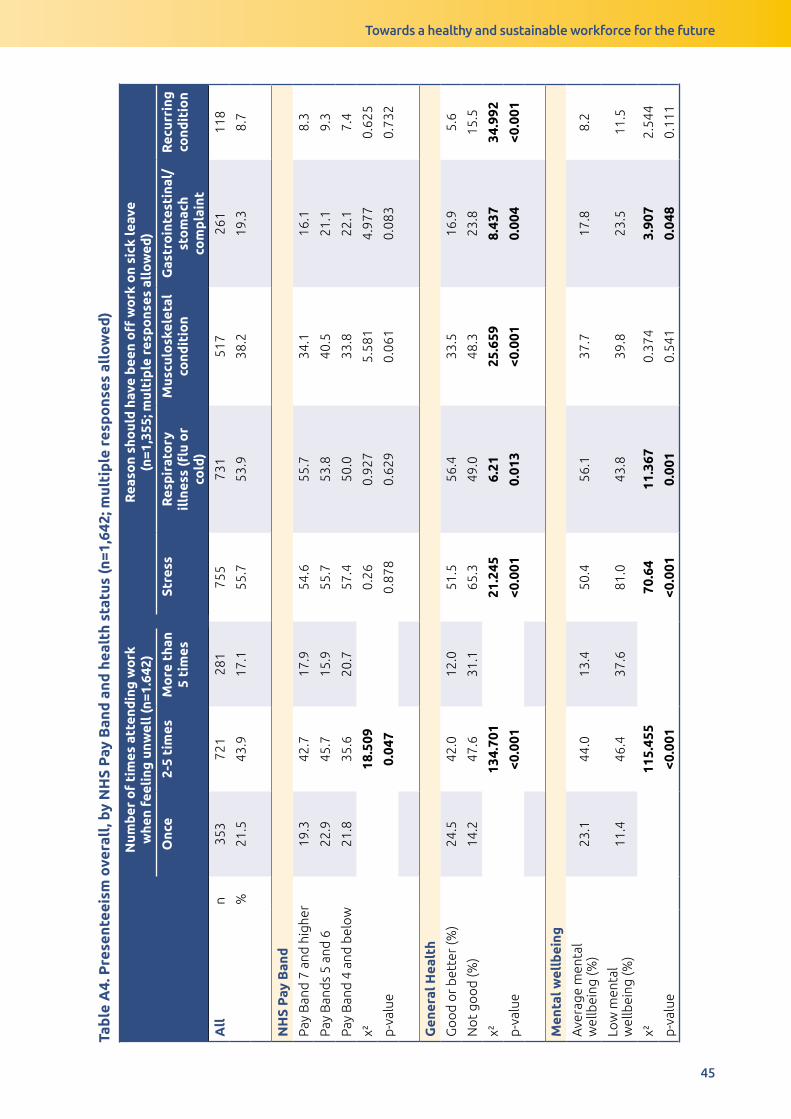
Towards a healthy and sustainable workforce for the future
45
Tab
le A
4. P
rese
ntee
ism
ove
rall
, by
NH
S P
ay B
and
and
hea
lth
stat
us (n
=1,6
42; m
ulti
ple
res
po
nses
all
ow
ed)
Num
ber
of
tim
es a
tten
din
g w
ork
w
hen
feel
ing
unw
ell (
n=1.
642)
Rea
son
sho
uld
hav
e b
een
off
wo
rk o
n si
ck le
ave
(n
=1,3
55; m
ulti
ple
res
po
nses
all
ow
ed)
Onc
e2-
5 ti
mes
Mo
re t
han
5 ti
mes
Stre
ssR
esp
irat
ory
il
lnes
s (fl
u o
r co
ld)
Mus
culo
skel
etal
co
ndit
ion
Gas
tro
inte
stin
al/
sto
mac
h co
mp
lain
t
Rec
urri
ng
cond
itio
n
All
n
353
721
281
755
731
517
261
118
%21
.543
.917
.155
.753
.938
.219
.38.
7
NH
S P
ay B
and
Pay
Ban
d 7
and
hig
her
19.3
42.7
17.9
54.6
55.7
34.1
16.1
8.3
Pay
Ban
ds
5 an
d 6
22.9
45.7
15.9
55.7
53.8
40.5
21.1
9.3
Pay
Ban
d 4
and
bel
ow
21.8
35.6
20.7
57.4
50.0
33.8
22.1
7.4
χ²18
.509
0.26
0.92
75.
581
4.97
70.
625
p-v
alue
0.04
70.
878
0.62
90.
061
0.08
30.
732
Gen
eral
Hea
lth
Go
od
or
bet
ter
(%)
24.5
42.0
12.0
51.5
56.4
33.5
16.9
5.6
No
t go
od
(%)
14.2
47.6
31.1
65.3
49.0
48.3
23.8
15.5
χ²13
4.70
121
.245
6.21
25.6
598.
437
34.9
92
p-v
alue
<0.0
01<0
.001
0.01
3<0
.001
0.00
4<0
.001
Men
tal w
ellb
eing
Ave
rage
men
tal
wel
lbei
ng (%
)23
.144
.013
.450
.456
.137
.717
.88.
2
Low
men
tal
wel
lbei
ng (%
)11
.446
.437
.681
.043
.839
.823
.511
.5
χ²11
5.45
570
.64
11.3
670.
374
3.90
72.
544
p-v
alue
<0.0
01<0
.001
0.00
10.
541
0.04
80.
111
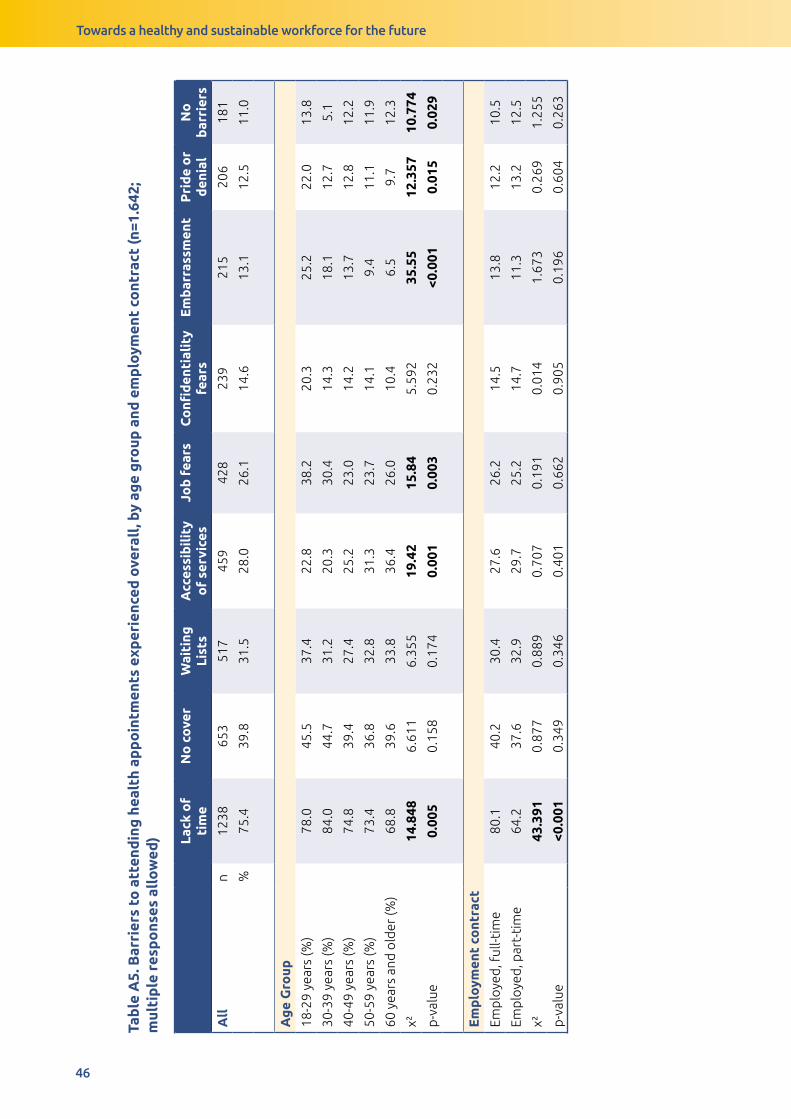
Towards a healthy and sustainable workforce for the future
46
Tab
le A
5. B
arri
ers
to a
tten
din
g h
ealt
h ap
po
intm
ents
exp
erie
nced
ove
rall
, by
age
gro
up a
nd e
mp
loym
ent
cont
ract
(n=1
.642
; m
ulti
ple
res
po
nses
all
ow
ed) La
ck o
f ti
me
No
co
ver
Wai
ting
Li
sts
Acc
essi
bil
ity
of
serv
ices
Job
fea
rsC
onfi
den
tial
ity
fear
sE
mb
arra
ssm
ent
Pri
de
or
den
ial
No
b
arri
ers
All
n
1238
653
517
459
428
239
215
206
181
%75
.439
.831
.528
.026
.114
.613
.112
.511
.0
Ag
e G
roup
18-2
9 ye
ars
(%)
78.0
45.5
37.4
22.8
38.2
20.3
25.2
22.0
13.8
30-3
9 ye
ars
(%)
84.0
44.7
31.2
20.3
30.4
14.3
18.1
12.7
5.1
40-4
9 ye
ars
(%)
74.8
39.4
27.4
25.2
23.0
14.2
13.7
12.8
12.2
50-5
9 ye
ars
(%)
73.4
36.8
32.8
31.3
23.7
14.1
9.4
11.1
11.9
60 y
ears
and
old
er (%
)68
.839
.633
.836
.426
.010
.46.
59.
712
.3
χ²14
.848
6.61
16.
355
19.4
215
.84
5.59
235
.55
12.3
5710
.774
p-v
alue
0.00
50.
158
0.17
40.
001
0.00
30.
232
<0.0
010.
015
0.02
9
Em
plo
ymen
t co
ntra
ct
Emp
loye
d, f
ull-t
ime
80.1
40.2
30.4
27.6
26.2
14.5
13.8
12.2
10.5
Emp
loye
d, p
art-
tim
e64
.237
.632
.929
.725
.214
.711
.313
.212
.5
χ²43
.391
0.87
70.
889
0.70
70.
191
0.01
41.
673
0.26
91.
255
p-v
alue
<0.0
010.
349
0.34
60.
401
0.66
20.
905
0.19
60.
604
0.26
3
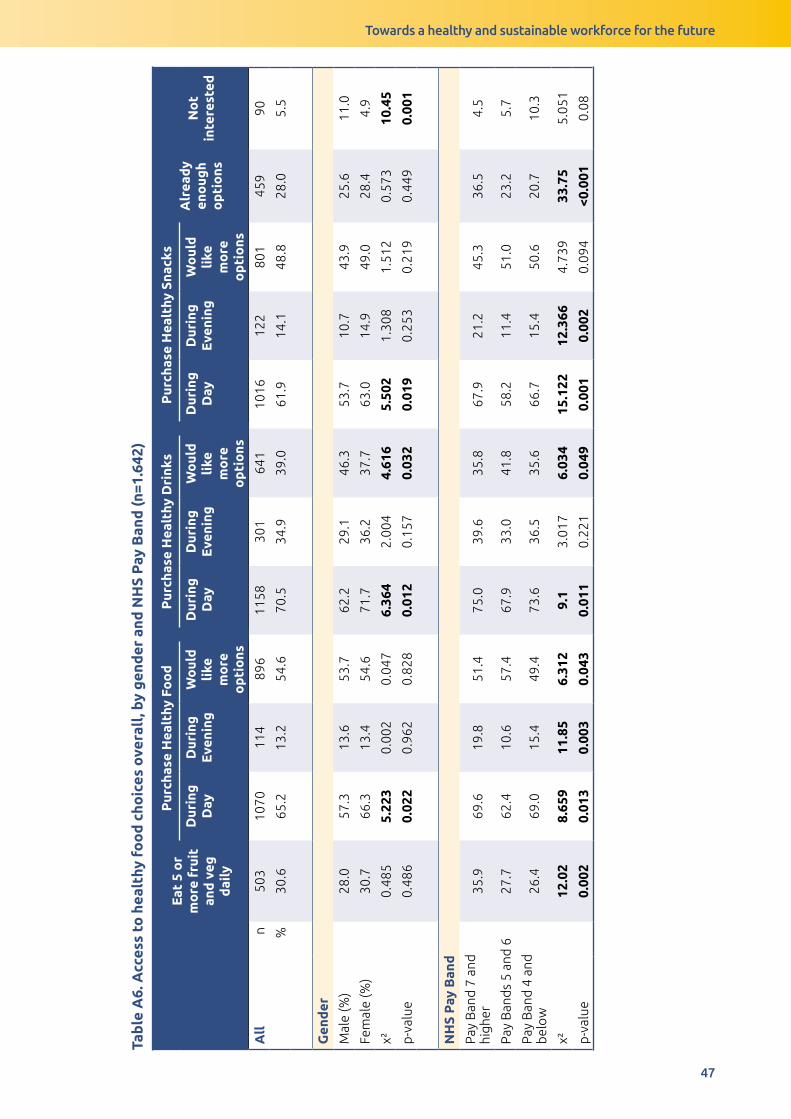
Towards a healthy and sustainable workforce for the future
47
Tab
le A
6. A
cces
s to
hea
lthy
fo
od
cho
ices
ove
rall
, by
gen
der
and
NH
S P
ay B
and
(n=1
.642
)
Eat
5 o
r m
ore
fru
it
and
veg
d
aily
Pur
chas
e H
ealt
hy F
oo
dP
urch
ase
Hea
lthy
Dri
nks
Pur
chas
e H
ealt
hy S
nack
sA
lrea
dy
eno
ugh
op
tio
ns
No
t in
tere
sted
Dur
ing
D
ayD
urin
g
Eve
ning
Wo
uld
li
ke
mo
re
op
tio
ns
Dur
ing
D
ayD
urin
g
Eve
ning
Wo
uld
li
ke
mo
re
op
tio
ns
Dur
ing
D
ayD
urin
g
Eve
ning
Wo
uld
li
ke
mo
re
op
tio
ns
All
n
503
1070
114
896
1158
301
641
1016
122
801
459
90
%30
.665
.213
.254
.670
.534
.939
.061
.914
.148
.828
.05.
5
Gen
der
Mal
e (%
)28
.057
.313
.653
.762
.229
.146
.353
.710
.743
.925
.611
.0
Fem
ale
(%)
30.7
66.3
13.4
54.6
71.7
36.2
37.7
63.0
14.9
49.0
28.4
4.9
χ²0.
485
5.22
30.
002
0.04
76.
364
2.00
44.
616
5.50
21.
308
1.51
20.
573
10.4
5
p-v
alue
0.48
60.
022
0.96
20.
828
0.01
20.
157
0.03
20.
019
0.25
30.
219
0.44
90.
001
NH
S P
ay B
and
Pay
Ban
d 7
and
hi
gher
35.9
69.6
19.8
51.4
75.0
39.6
35.8
67.9
21.2
45.3
36.5
4.5
Pay
Ban
ds
5 an
d 6
27.7
62.4
10.6
57.4
67.9
33.0
41.8
58.2
11.4
51.0
23.2
5.7
Pay
Ban
d 4
and
b
elo
w26
.469
.015
.449
.473
.636
.535
.666
.715
.450
.620
.710
.3
χ²12
.02
8.65
911
.85
6.31
29.
13.
017
6.03
415
.122
12.3
664.
739
33.7
55.
051
p-v
alue
0.00
20.
013
0.00
30.
043
0.01
10.
221
0.04
90.
001
0.00
20.
094
<0.0
010.
08
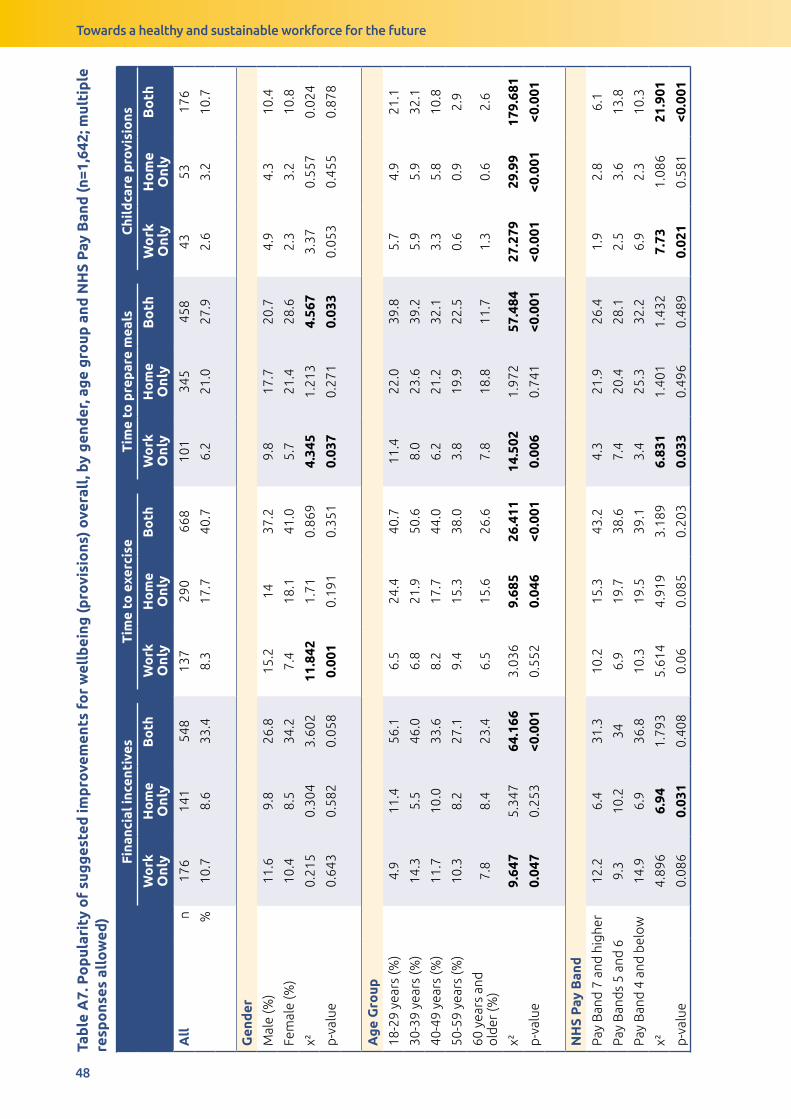
Towards a healthy and sustainable workforce for the future
48
Tab
le A
7. P
op
ular
ity
of
sug
ges
ted
imp
rove
men
ts f
or
wel
lbei
ng (p
rovi
sio
ns)
ove
rall
, by
gen
der
, ag
e g
roup
and
NH
S P
ay B
and
(n=1
,642
; mul
tip
le
resp
ons
es a
llo
wed
)
Fina
ncia
l inc
enti
ves
Tim
e to
exe
rcis
eT
ime
to p
rep
are
mea
lsC
hild
care
pro
visi
ons
Wo
rk
Onl
yH
om
e O
nly
Bo
thW
ork
O
nly
Ho
me
Onl
yB
oth
Wo
rk
Onl
yH
om
e O
nly
Bo
thW
ork
O
nly
Ho
me
Onl
yB
oth
All
n
176
141
548
137
290
668
101
345
458
4353
176
%10
.78.
633
.48.
317
.740
.76.
221
.027
.92.
63.
210
.7
Gen
der
Mal
e (%
)11
.69.
826
.815
.214
37.2
9.8
17.7
20.7
4.9
4.3
10.4
Fem
ale
(%)
10.4
8.5
34.2
7.4
18.1
41.0
5.7
21.4
28.6
2.3
3.2
10.8
χ²0.
215
0.30
43.
602
11.8
421.
710.
869
4.34
51.
213
4.56
73.
370.
557
0.02
4
p-v
alue
0.64
30.
582
0.05
80.
001
0.19
10.
351
0.03
70.
271
0.03
30.
053
0.45
50.
878
Ag
e G
roup
18-2
9 ye
ars
(%)
4.9
11.4
56.1
6.5
24.4
40.7
11.4
22.0
39.8
5.7
4.9
21.1
30-3
9 ye
ars
(%)
14.3
5.5
46.0
6.8
21.9
50.6
8.0
23.6
39.2
5.9
5.9
32.1
40-4
9 ye
ars
(%)
11.7
10.0
33.6
8.2
17.7
44.0
6.2
21.2
32.1
3.3
5.8
10.8
50-5
9 ye
ars
(%)
10.3
8.2
27.1
9.4
15.3
38.0
3.8
19.9
22.5
0.6
0.9
2.9
60 y
ears
and
o
lder
(%)
7.8
8.4
23.4
6.5
15.6
26.6
7.8
18.8
11.7
1.3
0.6
2.6
χ²9.
647
5.34
764
.166
3.03
69.
685
26.4
1114
.502
1.97
257
.484
27.2
7929
.99
179.
681
p-v
alue
0.04
70.
253
<0.0
010.
552
0.04
6<0
.001
0.00
60.
741
<0.0
01<0
.001
<0.0
01<0
.001
NH
S P
ay B
and
Pay
Ban
d 7
and
hig
her
12.2
6.4
31.3
10.2
15.3
43.2
4.3
21.9
26.4
1.9
2.8
6.1
Pay
Ban
ds
5 an
d 6
9.3
10.2
346.
919
.738
.67.
420
.428
.12.
53.
613
.8
Pay
Ban
d 4
and
bel
ow
14.9
6.9
36.8
10.3
19.5
39.1
3.4
25.3
32.2
6.9
2.3
10.3
χ²4.
896
6.94
1.79
35.
614
4.91
93.
189
6.83
11.
401
1.43
27.
731.
086
21.9
01
p-v
alue
0.08
60.
031
0.40
80.
060.
085
0.20
30.
033
0.49
60.
489
0.02
10.
581
<0.0
01
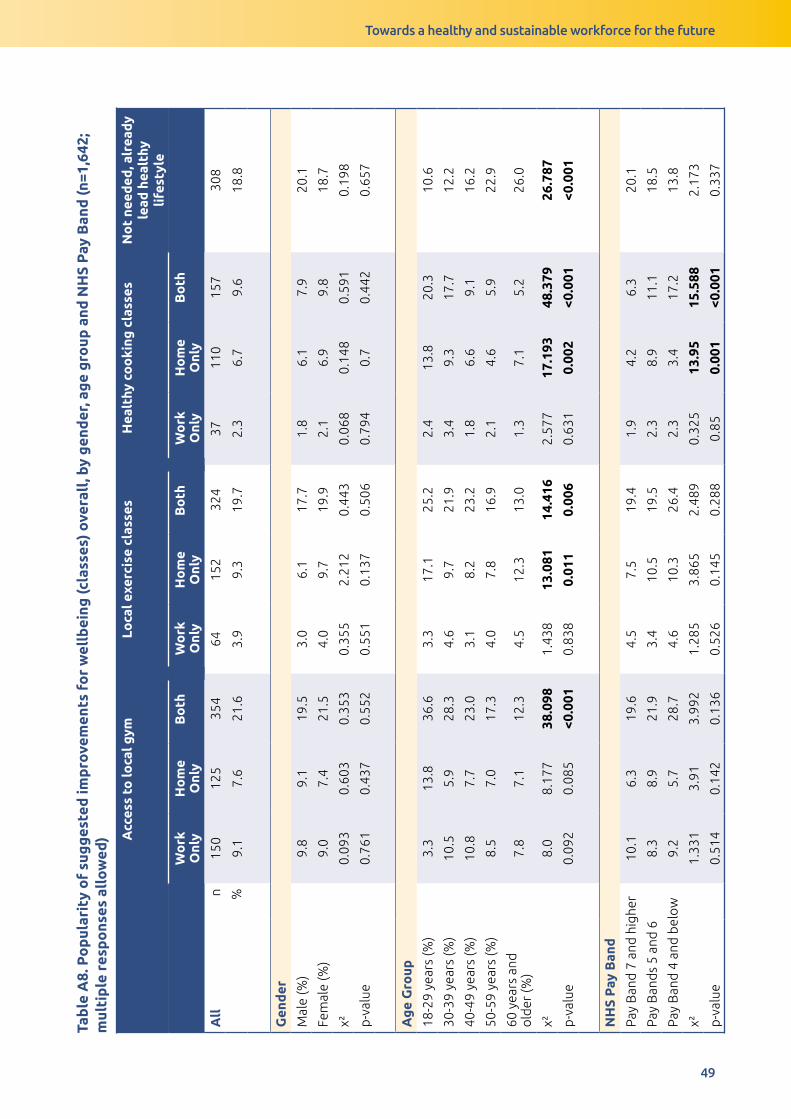
Towards a healthy and sustainable workforce for the future
49
Tab
le A
8. P
op
ular
ity
of
sug
ges
ted
imp
rove
men
ts f
or
wel
lbei
ng (c
lass
es)
ove
rall
, by
gen
der
, ag
e g
roup
and
NH
S P
ay B
and
(n=1
,642
; m
ulti
ple
res
po
nses
all
ow
ed) A
cces
s to
loca
l gym
Loca
l exe
rcis
e cl
asse
sH
ealt
hy c
oo
king
cla
sses
No
t ne
eded
, alr
eady
le
ad h
ealt
hy
life
styl
e
Wo
rk
Onl
yH
om
e O
nly
Bo
thW
ork
O
nly
Ho
me
Onl
yB
oth
Wo
rk
Onl
yH
om
e O
nly
Bo
th
All
n
150
125
354
6415
232
437
110
157
308
%9.
17.
621
.63.
99.
319
.72.
36.
79.
618
.8
Gen
der
Mal
e (%
)9.
89.
119
.53.
06.
117
.71.
86.
17.
920
.1
Fem
ale
(%)
9.0
7.4
21.5
4.0
9.7
19.9
2.1
6.9
9.8
18.7
χ²0.
093
0.60
30.
353
0.35
52.
212
0.44
30.
068
0.14
80.
591
0.19
8
p-v
alue
0.76
10.
437
0.55
20.
551
0.13
70.
506
0.79
40.
70.
442
0.65
7
Ag
e G
roup
18-2
9 ye
ars
(%)
3.3
13.8
36.6
3.3
17.1
25.2
2.4
13.8
20.3
10.6
30-3
9 ye
ars
(%)
10.5
5.9
28.3
4.6
9.7
21.9
3.4
9.3
17.7
12.2
40-4
9 ye
ars
(%)
10.8
7.7
23.0
3.1
8.2
23.2
1.8
6.6
9.1
16.2
50-5
9 ye
ars
(%)
8.5
7.0
17.3
4.0
7.8
16.9
2.1
4.6
5.9
22.9
60 y
ears
and
o
lder
(%)
7.8
7.1
12.3
4.5
12.3
13.0
1.3
7.1
5.2
26.0
χ²8.
08.
177
38.0
981.
438
13.0
8114
.416
2.57
717
.193
48.3
7926
.787
p-v
alue
0.09
20.
085
<0.0
010.
838
0.01
10.
006
0.63
10.
002
<0.0
01<0
.001
NH
S P
ay B
and
Pay
Ban
d 7
and
hig
her
10.1
6.3
19.6
4.5
7.5
19.4
1.9
4.2
6.3
20.1
Pay
Ban
ds
5 an
d 6
8.3
8.9
21.9
3.4
10.5
19.5
2.3
8.9
11.1
18.5
Pay
Ban
d 4
and
bel
ow
9.2
5.7
28.7
4.6
10.3
26.4
2.3
3.4
17.2
13.8
χ²1.
331
3.91
3.99
21.
285
3.86
52.
489
0.32
513
.95
15.5
882.
173
p-v
alue
0.51
40.
142
0.13
60.
526
0.14
50.
288
0.85
0.00
1<0
.001
0.33
7
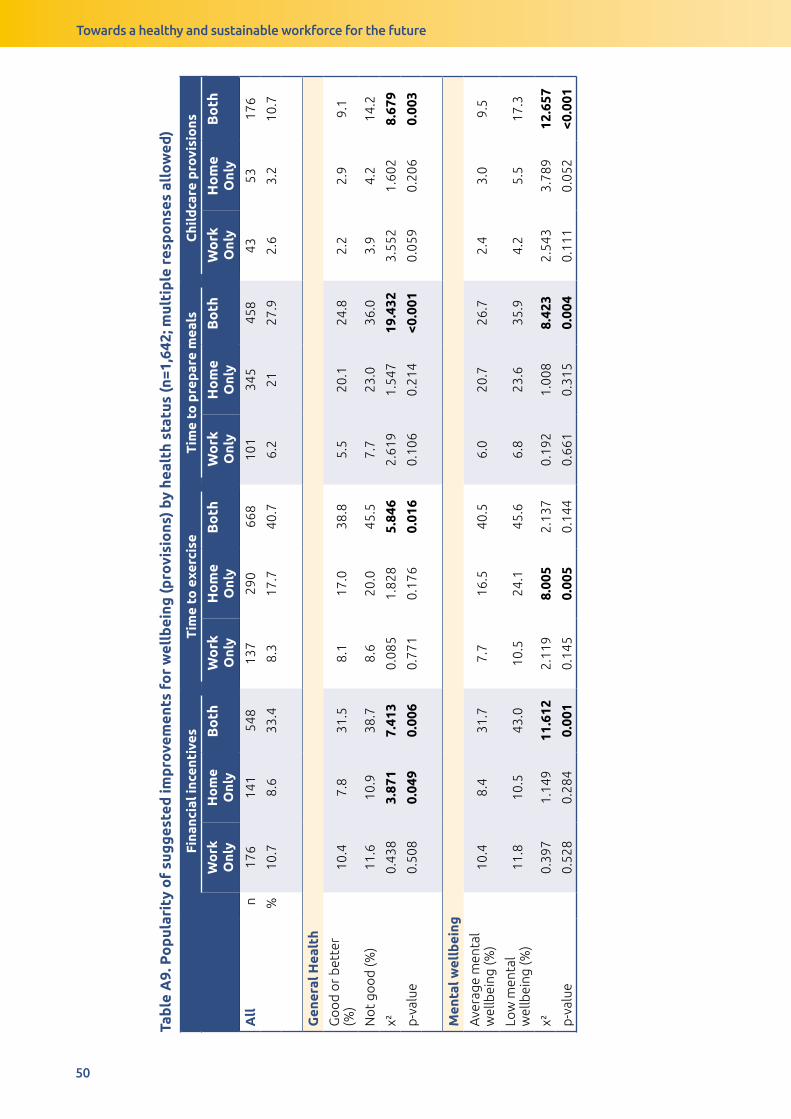
Towards a healthy and sustainable workforce for the future
50
Tab
le A
9. P
op
ular
ity
of
sug
ges
ted
imp
rove
men
ts f
or
wel
lbei
ng (p
rovi
sio
ns)
by h
ealt
h st
atus
(n=1
,642
; mul
tip
le r
esp
ons
es a
llo
wed
)
Fina
ncia
l inc
enti
ves
Tim
e to
exe
rcis
eT
ime
to p
rep
are
mea
lsC
hild
care
pro
visi
ons
Wo
rk
Onl
yH
om
e O
nly
Bo
thW
ork
O
nly
Ho
me
Onl
yB
oth
Wo
rk
Onl
yH
om
e O
nly
Bo
thW
ork
O
nly
Ho
me
Onl
yB
oth
All
n
176
141
548
137
290
668
101
345
458
4353
176
%10
.78.
633
.48.
317
.740
.76.
221
27.9
2.6
3.2
10.7
Gen
eral
Hea
lth
Go
od
or
bet
ter
(%)
10.4
7.8
31.5
8.1
17.0
38.8
5.5
20.1
24.8
2.2
2.9
9.1
No
t go
od
(%)
11.6
10.9
38.7
8.6
20.0
45.5
7.7
23.0
36.0
3.9
4.2
14.2
χ²0.
438
3.87
17.
413
0.08
51.
828
5.84
62.
619
1.54
719
.432
3.55
21.
602
8.67
9
p-v
alue
0.50
80.
049
0.00
60.
771
0.17
60.
016
0.10
60.
214
<0.0
010.
059
0.20
60.
003
Men
tal w
ellb
eing
Ave
rage
men
tal
wel
lbei
ng (%
)10
.48.
431
.77.
716
.540
.56.
020
.726
.72.
43.
09.
5
Low
men
tal
wel
lbei
ng (%
)11
.810
.543
.010
.524
.145
.66.
823
.635
.94.
25.
517
.3
χ²0.
397
1.14
911
.612
2.11
98.
005
2.13
70.
192
1.00
88.
423
2.54
33.
789
12.6
57
p-v
alue
0.52
80.
284
0.00
10.
145
0.00
50.
144
0.66
10.
315
0.00
40.
111
0.05
2<0
.001

Towards a healthy and sustainable workforce for the future
51
Tab
le A
10. P
op
ular
ity
of
sug
ges
ted
imp
rove
men
ts f
or
wel
lbei
ng (c
lass
es)
by h
ealt
h st
atus
Acc
ess
to lo
cal g
ymLo
cal e
xerc
ise
clas
ses
Hea
lthy
co
oki
ng c
lass
esN
ot
need
ed, a
lrea
dy
lead
hea
lthy
li
fest
yle
Wo
rk
Onl
yH
om
e O
nly
Bo
thW
ork
O
nly
Ho
me
Onl
yB
oth
Wo
rk
Onl
yH
om
e O
nly
Bo
th
All
n
150
125
354
6415
232
437
110
157
308
%9.
17.
621
.63.
99.
319
.72.
36.
79.
618
.8
Gen
eral
Hea
lth
Go
od
or
bet
ter
(%)
9.2
6.2
19.3
4.3
7.4
17.2
2.1
6.5
7.8
22.2
No
t go
od
(%)
8.6
11.4
28.1
2.8
13.9
26.2
2.3
7.2
14.6
9.3
χ²0.
128
12.1
9214
.413
1.89
215
.799
16.1
920.
048
0.23
716
.855
34.4
29
p-v
alue
0.72
1<0
.001
<0.0
010.
169
<0.0
01<0
.001
0.82
70.
626
<0.0
01<0
.001
Men
tal w
ellb
eing
Ave
rage
men
tal
wel
lbei
ng (%
)9.
37.
020
.13.
88.
819
.02.
26.
28.
920
.2
Low
men
tal
wel
lbei
ng (%
)8.
412
.727
.83.
413
.124
.11.
78.
413
.18.
9
χ²0.
186
8.95
7.29
50.
082
4.33
13.
225
0.23
51.
591
3.98
517
.191
p-v
alue
0.66
60.
003
0.00
70.
775
0.03
70.
073
0.62
80.
207
0.04
6<0
.001
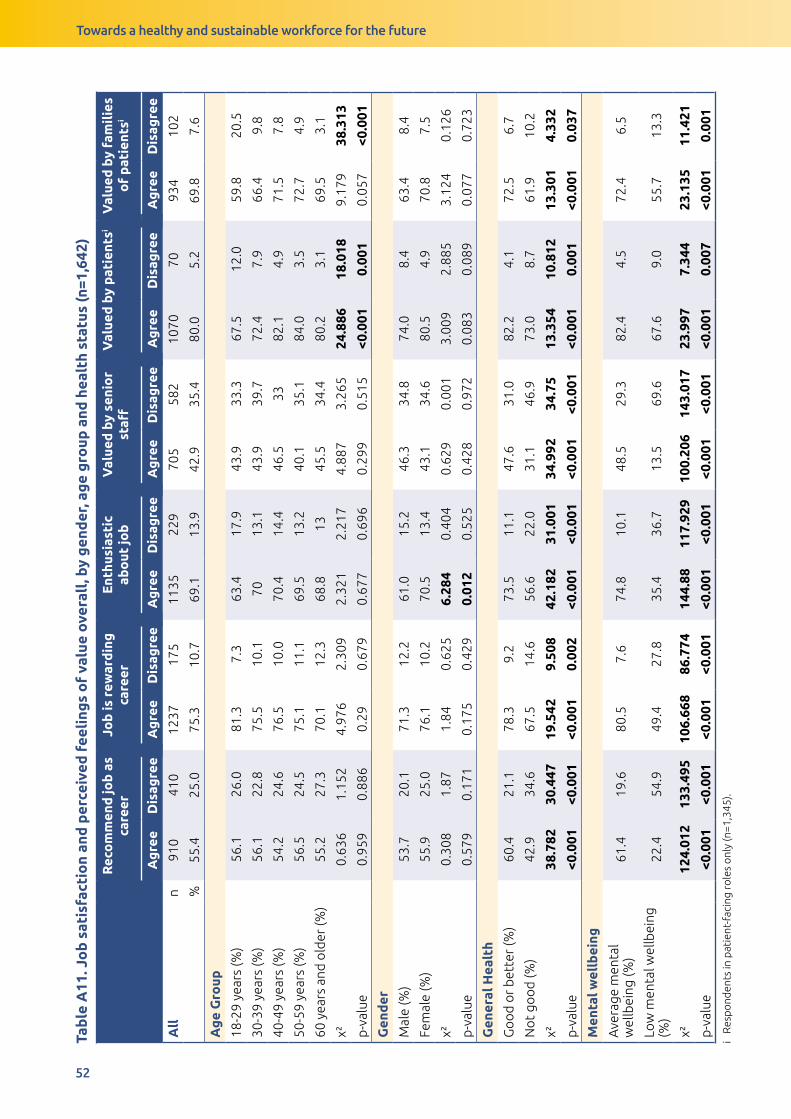
Towards a healthy and sustainable workforce for the future
52
Tab
le A
11. J
ob
sat
isfa
ctio
n an
d p
erce
ived
fee
ling
s o
f va
lue
ove
rall
, by
gen
der
, ag
e g
roup
and
hea
lth
stat
us (n
=1,6
42)
Rec
om
men
d jo
b a
s ca
reer
Job
is r
ewar
din
g
care
erE
nthu
sias
tic
abo
ut jo
bV
alue
d b
y se
nio
r st
affV
alue
d b
y p
atie
ntsi
Val
ued
by
fam
ilie
s o
f p
atie
ntsi
Ag
ree
Dis
agre
eA
gre
eD
isag
ree
Ag
ree
Dis
agre
eA
gre
eD
isag
ree
Ag
ree
Dis
agre
eA
gre
eD
isag
ree
All
n
910
410
1237
175
1135
229
705
582
1070
7093
410
2
%55
.425
.075
.310
.769
.113
.942
.935
.480
.05.
269
.87.
6
Ag
e G
roup
18-2
9 ye
ars
(%)
56.1
26.0
81.3
7.3
63.4
17.9
43.9
33.3
67.5
12.0
59.8
20.5
30-3
9 ye
ars
(%)
56.1
22.8
75.5
10.1
7013
.143
.939
.772
.47.
966
.49.
8
40-4
9 ye
ars
(%)
54.2
24.6
76.5
10.0
70.4
14.4
46.5
3382
.14.
971
.57.
8
50-5
9 ye
ars
(%)
56.5
24.5
75.1
11.1
69.5
13.2
40.1
35.1
84.0
3.5
72.7
4.9
60 y
ears
and
old
er (%
)55
.227
.370
.112
.368
.813
45.5
34.4
80.2
3.1
69.5
3.1
χ²0.
636
1.15
24.
976
2.30
92.
321
2.21
74.
887
3.26
524
.886
18.0
189.
179
38.3
13
p-v
alue
0.95
90.
886
0.29
0.67
90.
677
0.69
60.
299
0.51
5<0
.001
0.00
10.
057
<0.0
01
Gen
der
Mal
e (%
)53
.720
.171
.312
.261
.015
.246
.334
.874
.08.
463
.48.
4
Fem
ale
(%)
55.9
25.0
76.1
10.2
70.5
13.4
43.1
34.6
80.5
4.9
70.8
7.5
χ²0.
308
1.87
1.84
0.62
56.
284
0.40
40.
629
0.00
13.
009
2.88
53.
124
0.12
6
p-v
alue
0.57
90.
171
0.17
50.
429
0.01
20.
525
0.42
80.
972
0.08
30.
089
0.07
70.
723
Gen
eral
Hea
lth
Go
od
or
bet
ter
(%)
60.4
21.1
78.3
9.2
73.5
11.1
47.6
31.0
82.2
4.1
72.5
6.7
No
t go
od
(%)
42.9
34.6
67.5
14.6
56.6
22.0
31.1
46.9
73.0
8.7
61.9
10.2
χ²38
.782
30.4
4719
.542
9.50
842
.182
31.0
0134
.992
34.7
513
.354
10.8
1213
.301
4.33
2
p-v
alue
<0.0
01<0
.001
<0.0
010.
002
<0.0
01<0
.001
<0.0
01<0
.001
<0.0
010.
001
<0.0
010.
037
Men
tal w
ellb
eing
Ave
rage
men
tal
wel
lbei
ng (%
)61
.419
.680
.57.
674
.810
.148
.529
.382
.44.
572
.46.
5
Low
men
tal w
ellb
eing
(%
)22
.454
.949
.427
.835
.436
.713
.569
.667
.69.
055
.713
.3
χ²12
4.01
213
3.49
510
6.66
886
.774
144.
8811
7.92
910
0.20
614
3.01
723
.997
7.34
423
.135
11.4
21
p-v
alue
<0.0
01<0
.001
<0.0
01<0
.001
<0.0
01<0
.001
<0.0
01<0
.001
<0.0
010.
007
<0.0
010.
001
i R
esp
ond
ents
in p
atie
nt-f
acin
g ro
les
onl
y (n
=1,3
45).
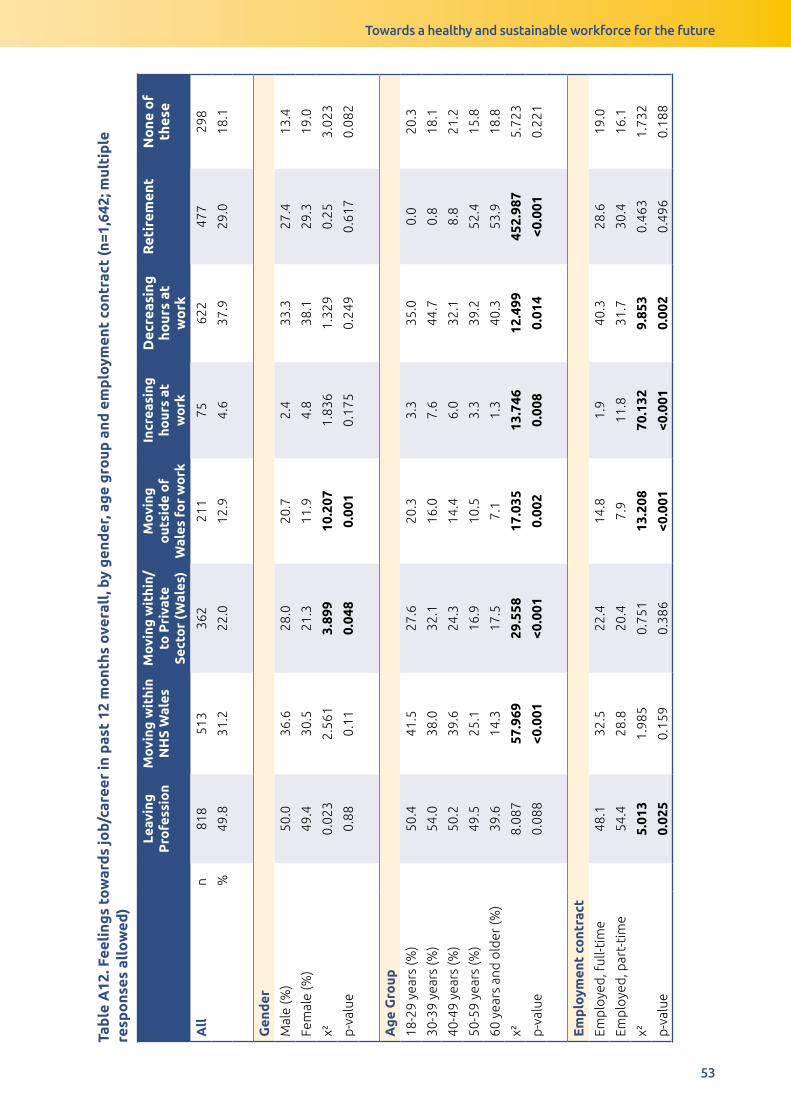
Towards a healthy and sustainable workforce for the future
53
Tab
le A
11. J
ob
sat
isfa
ctio
n an
d p
erce
ived
fee
ling
s o
f va
lue
ove
rall
, by
gen
der
, ag
e g
roup
and
hea
lth
stat
us (n
=1,6
42)
Rec
om
men
d jo
b a
s ca
reer
Job
is r
ewar
din
g
care
erE
nthu
sias
tic
abo
ut jo
bV
alue
d b
y se
nio
r st
affV
alue
d b
y p
atie
ntsi
Val
ued
by
fam
ilie
s o
f p
atie
ntsi
Ag
ree
Dis
agre
eA
gre
eD
isag
ree
Ag
ree
Dis
agre
eA
gre
eD
isag
ree
Ag
ree
Dis
agre
eA
gre
eD
isag
ree
All
n
910
410
1237
175
1135
229
705
582
1070
7093
410
2
%55
.425
.075
.310
.769
.113
.942
.935
.480
.05.
269
.87.
6
Ag
e G
roup
18-2
9 ye
ars
(%)
56.1
26.0
81.3
7.3
63.4
17.9
43.9
33.3
67.5
12.0
59.8
20.5
30-3
9 ye
ars
(%)
56.1
22.8
75.5
10.1
7013
.143
.939
.772
.47.
966
.49.
8
40-4
9 ye
ars
(%)
54.2
24.6
76.5
10.0
70.4
14.4
46.5
3382
.14.
971
.57.
8
50-5
9 ye
ars
(%)
56.5
24.5
75.1
11.1
69.5
13.2
40.1
35.1
84.0
3.5
72.7
4.9
60 y
ears
and
old
er (%
)55
.227
.370
.112
.368
.813
45.5
34.4
80.2
3.1
69.5
3.1
χ²0.
636
1.15
24.
976
2.30
92.
321
2.21
74.
887
3.26
524
.886
18.0
189.
179
38.3
13
p-v
alue
0.95
90.
886
0.29
0.67
90.
677
0.69
60.
299
0.51
5<0
.001
0.00
10.
057
<0.0
01
Gen
der
Mal
e (%
)53
.720
.171
.312
.261
.015
.246
.334
.874
.08.
463
.48.
4
Fem
ale
(%)
55.9
25.0
76.1
10.2
70.5
13.4
43.1
34.6
80.5
4.9
70.8
7.5
χ²0.
308
1.87
1.84
0.62
56.
284
0.40
40.
629
0.00
13.
009
2.88
53.
124
0.12
6
p-v
alue
0.57
90.
171
0.17
50.
429
0.01
20.
525
0.42
80.
972
0.08
30.
089
0.07
70.
723
Gen
eral
Hea
lth
Go
od
or
bet
ter
(%)
60.4
21.1
78.3
9.2
73.5
11.1
47.6
31.0
82.2
4.1
72.5
6.7
No
t go
od
(%)
42.9
34.6
67.5
14.6
56.6
22.0
31.1
46.9
73.0
8.7
61.9
10.2
χ²38
.782
30.4
4719
.542
9.50
842
.182
31.0
0134
.992
34.7
513
.354
10.8
1213
.301
4.33
2
p-v
alue
<0.0
01<0
.001
<0.0
010.
002
<0.0
01<0
.001
<0.0
01<0
.001
<0.0
010.
001
<0.0
010.
037
Men
tal w
ellb
eing
Ave
rage
men
tal
wel
lbei
ng (%
)61
.419
.680
.57.
674
.810
.148
.529
.382
.44.
572
.46.
5
Low
men
tal w
ellb
eing
(%
)22
.454
.949
.427
.835
.436
.713
.569
.667
.69.
055
.713
.3
χ²12
4.01
213
3.49
510
6.66
886
.774
144.
8811
7.92
910
0.20
614
3.01
723
.997
7.34
423
.135
11.4
21
p-v
alue
<0.0
01<0
.001
<0.0
01<0
.001
<0.0
01<0
.001
<0.0
01<0
.001
<0.0
010.
007
<0.0
010.
001
i R
esp
ond
ents
in p
atie
nt-f
acin
g ro
les
onl
y (n
=1,3
45).
Tab
le A
12. F
eeli
ngs
tow
ard
s jo
b/ca
reer
in p
ast
12 m
ont
hs o
vera
ll, b
y g
end
er, a
ge
gro
up a
nd e
mp
loym
ent
cont
ract
(n=1
,642
; mul
tip
le
resp
ons
es a
llo
wed
)
Leav
ing
P
rofe
ssio
nM
ovi
ng w
ithi
n N
HS
Wal
esM
ovi
ng w
ithi
n/to
Pri
vate
Se
cto
r (W
ales
)
Mo
ving
o
utsi
de
of
Wal
es f
or
wo
rk
Incr
easi
ng
hour
s at
w
ork
Dec
reas
ing
ho
urs
at
wo
rk
Ret
irem
ent
No
ne o
f th
ese
All
n
818
513
362
211
7562
247
729
8
%49
.831
.222
.012
.94.
637
.929
.018
.1
Gen
der
Mal
e (%
)50
.036
.628
.020
.72.
433
.327
.413
.4
Fem
ale
(%)
49.4
30.5
21.3
11.9
4.8
38.1
29.3
19.0
χ²0.
023
2.56
13.
899
10.2
071.
836
1.32
90.
253.
023
p-v
alue
0.88
0.11
0.04
80.
001
0.17
50.
249
0.61
70.
082
Ag
e G
roup
18-2
9 ye
ars
(%)
50.4
41.5
27.6
20.3
3.3
35.0
0.0
20.3
30-3
9 ye
ars
(%)
54.0
38.0
32.1
16.0
7.6
44.7
0.8
18.1
40-4
9 ye
ars
(%)
50.2
39.6
24.3
14.4
6.0
32.1
8.8
21.2
50-5
9 ye
ars
(%)
49.5
25.1
16.9
10.5
3.3
39.2
52.4
15.8
60 y
ears
and
old
er (%
)39
.614
.317
.57.
11.
340
.353
.918
.8
χ²8.
087
57.9
6929
.558
17.0
3513
.746
12.4
9945
2.98
75.
723
p-v
alue
0.08
8<0
.001
<0.0
010.
002
0.00
80.
014
<0.0
010.
221
Em
plo
ymen
t co
ntra
ct
Emp
loye
d, f
ull-t
ime
48.1
32.5
22.4
14.8
1.9
40.3
28.6
19.0
Emp
loye
d, p
art-
tim
e54
.428
.820
.47.
911
.831
.730
.416
.1
χ²5.
013
1.98
50.
751
13.2
0870
.132
9.85
30.
463
1.73
2
p-v
alue
0.02
50.
159
0.38
6<0
.001
<0.0
010.
002
0.49
60.
188

Towards a healthy and sustainable workforce for the future
54
Tab
le A
13. A
ctio
n ta
ken
to m
eet
dai
ly li
ving
exp
ense
s in
the
pas
t 12
mo
nths
ove
rall
, by
NH
S P
ay B
and
and
hea
lth
stat
us (n
=1,6
42; m
ulti
ple
re
spo
nses
all
ow
ed)
Wo
rked
ove
rtim
e in
m
ain
job
Bo
rro
wed
mo
ney
fro
m
fam
ily
or
frie
nds
Wo
rked
an
extr
a jo
bTa
ken
out
a
pay
day
loan
No
ne o
f th
ese
All
n
504
418
194
3281
0
%30
.725
.511
.81.
949
.3
Gen
der
Mal
e (%
)35
.426
.819
.53.
042
.1
Fem
ale
(%)
30.3
25.3
10.9
1.9
50.6
χ²1.
741
0.17
910
.53
1.06
84.
237
p-v
alue
0.18
70.
672
0.00
10.
301
0.04
NH
S P
ay B
and
Pay
Ban
d 7
and
hig
her
22.0
19.4
7.3
0.9
61.5
Pay
Ban
ds
5 an
d 6
35.3
28.7
13.8
1.9
44
Pay
Ban
d 4
and
bel
ow
41.4
34.5
18.4
9.2
32.2
χ²34
.219
19.7
6718
.498
27.5
954
.837
p-v
alue
<0.0
01<0
.001
<0.0
01<0
.001
<0.0
01
Gen
eral
Hea
lth
Go
od
or
bet
ter
(%)
28.0
22.9
10.9
1.0
53.9
No
t go
od
(%)
38.3
32.7
13.7
4.6
38.3
χ²15
.638
16.0
882.
428
20.9
5530
.865
p-v
alue
<0.0
01<0
.001
0.11
9<0
.001
<0.0
01
Men
tal w
ellb
eing
Ave
rage
men
tal w
ellb
eing
(%)
28.5
23.2
10.7
1.3
52.1
Low
men
tal w
ellb
eing
(%)
41.4
39.7
17.7
5.9
35.0
χ²15
.554
28.4
979.
413
22.2
5323
.588
p-v
alue
<0.0
01<0
.001
0.00
2<0
.001
<0.0
01
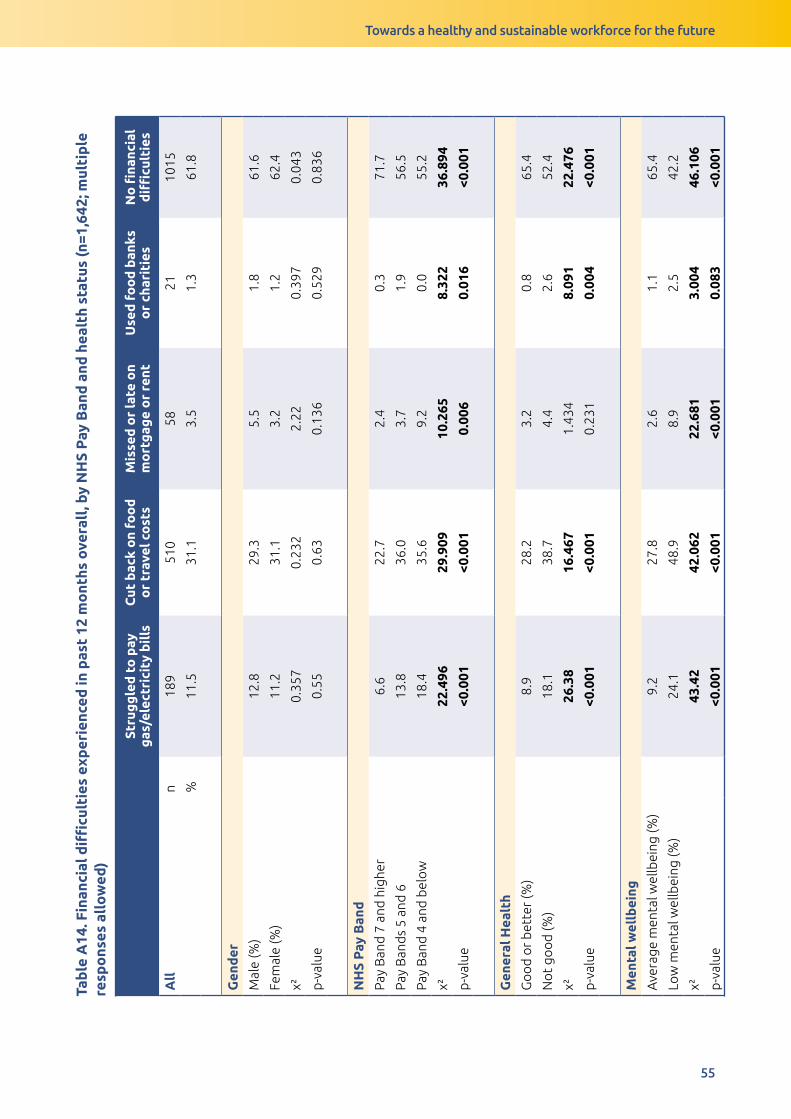
Towards a healthy and sustainable workforce for the future
55
Tab
le A
14. F
inan
cial
diffi
cult
ies
exp
erie
nced
in p
ast
12 m
ont
hs o
vera
ll, b
y N
HS
Pay
Ban
d a
nd h
ealt
h st
atus
(n=1
,642
; mul
tip
le
resp
ons
es a
llo
wed
)
Stru
gg
led
to
pay
g
as/e
lect
rici
ty b
ills
Cut
bac
k o
n fo
od
o
r tr
avel
co
sts
Mis
sed
or
late
on
mo
rtg
age
or
rent
Use
d f
oo
d b
anks
o
r ch
arit
ies
No
fina
ncia
l d
ifficu
ltie
s
All
n
189
510
5821
1015
%11
.531
.13.
51.
361
.8
Gen
der
Mal
e (%
)12
.829
.35.
51.
861
.6
Fem
ale
(%)
11.2
31.1
3.2
1.2
62.4
χ²0.
357
0.23
22.
220.
397
0.04
3
p-v
alue
0.55
0.63
0.13
60.
529
0.83
6
NH
S P
ay B
and
Pay
Ban
d 7
and
hig
her
6.6
22.7
2.4
0.3
71.7
Pay
Ban
ds
5 an
d 6
13.8
36.0
3.7
1.9
56.5
Pay
Ban
d 4
and
bel
ow
18.4
35.6
9.2
0.0
55.2
χ²22
.496
29.9
0910
.265
8.32
236
.894
p-v
alue
<0.0
01<0
.001
0.00
60.
016
<0.0
01
Gen
eral
Hea
lth
Go
od
or
bet
ter
(%)
8.9
28.2
3.2
0.8
65.4
No
t go
od
(%)
18.1
38.7
4.4
2.6
52.4
χ²26
.38
16.4
671.
434
8.09
122
.476
p-v
alue
<0.0
01<0
.001
0.23
10.
004
<0.0
01
Men
tal w
ellb
eing
Ave
rage
men
tal w
ellb
eing
(%)
9.2
27.8
2.6
1.1
65.4
Low
men
tal w
ellb
eing
(%)
24.1
48.9
8.9
2.5
42.2
χ²43
.42
42.0
6222
.681
3.00
446
.106
p-v
alue
<0.0
01<0
.001
<0.0
010.
083
<0.0
01
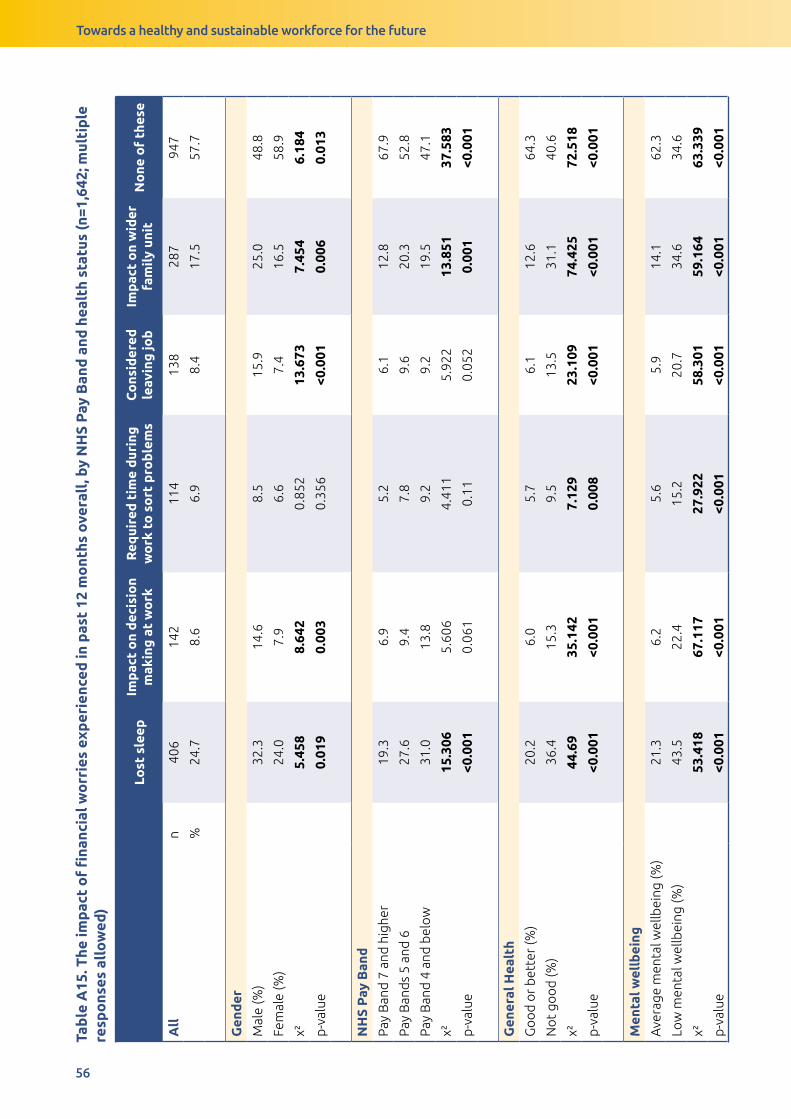
Towards a healthy and sustainable workforce for the future
56
Tab
le A
15. T
he im
pac
t o
f fi
nanc
ial w
orr
ies
exp
erie
nced
in p
ast
12 m
ont
hs o
vera
ll, b
y N
HS
Pay
Ban
d a
nd h
ealt
h st
atus
(n=1
,642
; mul
tip
le
resp
ons
es a
llo
wed
)
Lost
sle
epIm
pac
t o
n d
ecis
ion
mak
ing
at
wo
rkR
equi
red
tim
e d
urin
g
wo
rk t
o s
ort
pro
ble
ms
Co
nsid
ered
le
avin
g jo
bIm
pac
t o
n w
ider
fa
mil
y un
itN
one
of
thes
e
All
n
406
142
114
138
287
947
%24
.78.
66.
98.
417
.557
.7
Gen
der
Mal
e (%
)32
.314
.68.
515
.925
.048
.8
Fem
ale
(%)
24.0
7.9
6.6
7.4
16.5
58.9
χ²5.
458
8.64
20.
852
13.6
737.
454
6.18
4
p-v
alue
0.01
90.
003
0.35
6<0
.001
0.00
60.
013
NH
S P
ay B
and
Pay
Ban
d 7
and
hig
her
19.3
6.9
5.2
6.1
12.8
67.9
Pay
Ban
ds
5 an
d 6
27.6
9.4
7.8
9.6
20.3
52.8
Pay
Ban
d 4
and
bel
ow
31.0
13.8
9.2
9.2
19.5
47.1
χ²15
.306
5.60
64.
411
5.92
213
.851
37.5
83
p-v
alue
<0.0
010.
061
0.11
0.05
20.
001
<0.0
01
Gen
eral
Hea
lth
Go
od
or
bet
ter
(%)
20.2
6.0
5.7
6.1
12.6
64.3
No
t go
od
(%)
36.4
15.3
9.5
13.5
31.1
40.6
χ²44
.69
35.1
427.
129
23.1
0974
.425
72.5
18
p-v
alue
<0.0
01<0
.001
0.00
8<0
.001
<0.0
01<0
.001
Men
tal w
ellb
eing
Ave
rage
men
tal w
ellb
eing
(%)
21.3
6.2
5.6
5.9
14.1
62.3
Low
men
tal w
ellb
eing
(%)
43.5
22.4
15.2
20.7
34.6
34.6
χ²53
.418
67.1
1727
.922
58.3
0159
.164
63.3
39
p-v
alue
<0.0
01<0
.001
<0.0
01<0
.001
<0.0
01<0
.001
Our Priorities2018-2030
Influencing
the wid
er d
eterminants
of health
Imp
roving
mental w
ell-being
and
resilience
Pro
mo
ting
healthy b
ehaviours
Supp
orting
the develo
pm
ent of a
sustainable health and
care system
focused
on
preventio
n and
early interventio
n
Securing ahealthy future
for the next
generation
Build
ingand
mo
bilising
kno
wled
ge and
skills to
imp
rove
health and w
ell-b
eing across
Wales
Pro
tectingthe p
ublic fro
m
infection and
enviro
nmental
threats tohealth
Working
to Achieve
a Healthier
Future for W
ales
Ou
r Valu
es:
Research and Evaluation DivisionKnowledge Directorate
Public Health Wales Number 2 Capital Quarter
Tyndall Street Cardiff
CF10 4BZ
Tel: +44 (0)29 2022 7744
Email: [email protected]
@PublichealthW @PHREWales
/PublicHealthWales
phw.nhs.wales