Embed Size (px)
Citation preview

1
The CreditRiskMonitor PAYCE® score
EXECUTIVE SUMMARY
As part of CreditRiskMonitor’s effort to improve the risk assessment capabilities offered to the
company’s subscribers, the PAYCE® score has been introduced. The company’s FRISK® score estimates
bankruptcy risk for public companies and private businesses for which financial statements are
available. The PAYCE® score applies to private companies for which financials are not available. The
primary data source for the PAYCE® score is trade payment information along with federal tax liens. Like
the FRISK® score this model predicts the risk of bankruptcy during the next twelve months.
A previous study1 found that the use of payment information to predict bankruptcy in public companies
can be misleading as large public companies can “cloak” their financial distress from their payment
behavior. However, the study found that private companies in financial distress do exhibit more
delinquent and erratic payments. Businesses often extend the repayment of their trade accounts
payable to help manage their working capital, in particular during periods of financial stress.
The PAYCE® score makes use of a deep neural network to learn the complex payment patterns
representative of financial distress. One of the unique features of trade payment, unlike other types of
debt is that it is not infrequent for customers to pay late. This can be part of a company’s strategy to
manage working capital and it may not be indicative of financial distress. The deep neural network
technology can learn that payment patterns which are frequently more than 90 days past due, are likely
indicative of financial distress, this is difficult to implement with simpler models.
DISCUSSION OF DEEP NEURAL NETWORKS
The field of deep artificial neural networks has been around for many years. In the 1980s Hinton2 and
other researchers developed techniques for “deep” neural networks. The challenge for these networks
was that they were very difficult to train. Once a neural network was trained it could run relatively
quickly, but problems were identified in the training algorithms, and the computer hardware available at
the time was simply not fast enough to make training practical.
For many years the techniques used to train deep neural networks were limited to run on large,
expensive hardware. However, in the late 2000’s several breakthroughs took place. One was the
development of new training methodologies, which increased efficiency and accuracy. The other was
the realization that using NVIDIA’s highly parallel GPU’s (higher power graphic boards) would increase
training speed by orders of magnitude. Since then, general purpose GPUs have come on the market
making deep neural networks accessible to a broad range of businesses3.
1 https://www.credittoday.net/members/login.cfm?hpage=How-to-be-less-surprised-by-a-large-customers-bankruptcy-or-Demystifying-the-cloaking-effect.cfm 2 https://www.technologyreview.com/s/513696/deep-learning/ 3 http://fortune.com/ai-artificial-intelligence-deep-machine-learning/

2
The reason deep neural networks are so effective is that in many ways they emulate biological systems.
By connecting layers of large numbers of artificial neurons together, these systems can learn a broad
range of patterns and behaviors.
The large number of neurons in each layer allows the system to learn a broad range of functional
relationships between inputs and outputs. The hidden layers introduces a higher level of abstraction
converting the data into the desired output, Figure 1. This combination lets deep neural networks
handle a broad range of inputs and learn complex relationships2.
Figure 1. The above diagram shows a “deep” neural network, each circle represents and artificial neuron whose job is to learn specific data patterns based on the input coming in from the data from the left and produce an output and pass it to the next layer on the right.. The layer on the very left, the input layer processes all the input variables going into the model and feeds the processed output to the first hidden layer. The job of the hidden layer is to take data and further combine (abstract) the information and pass it on to the next layer for further processing. Deep neural networks have many hidden layers, enabling the system to learn complex relationships better than other approaches. The right most layer of neurons has the job of producing the desired type of output. In the case of the PAYCE™ score there is only one output neuron producing a value between zero and one representing an estimate of the probability of bankruptcy for the business being scored.

3
ADVANTAGES OF CONTRIBUTING TRADE TO CREDITRISKMONITOR
The PAYCE® score is available to all subscribers. A fundamental driver of the PAYCE® score is the trade
data obtained through CreditRiskMonitor’s Trade Contributor Program. This is an optional service
provided to subscribers, included in their subscriptions. As of 1/1/2018, CreditRiskMonitor’s network of
trade contributors provided more than $140 billion in trade data on both public and private companies
every month, giving each subscriber visibility into their biggest dollar risks.
Subscribers derive other advantages from the Trade Contributor Program, which compels their
commitment to the program. They are able to:
Get a snapshot of dollar risk at a glance, segmented by high, medium and low risk
Observe how accounts are paying against other vendors
Identify “hidden slow payers” who pay on time but are late with others, signaling potential
trouble
Receive risk exposure alerts
Generate informative reports (e.g., top customers by total owed, past due, highest risk)
Consolidate data across multiple business divisions or trade A/R files for a unified view of risk
Subscribers who submit their trade balances to CreditRiskMonitor can see their data in an aggregated
format, cleaned and normalized against those of their peers. The added value derived from this service
(noted above) has rapidly increased the number of trade providers in CreditRiskMonitor’s program.
Unlike many other payment-based models, a PAYCE® score is only calculated when there is a both a
significant number of trade contributors and trade lines on a company. CreditRiskMonitor is currently
only able to provide a PAYCE® score on about 80,000 private companies due to these limitations, but
the results are more accurate than scores designed to run with fewer payment experiences. As the
amount of contributed trade increases further, the number of scored businesses will also increase.
DATA USED TO DEVELOP THE PAYCE® SCORE
The data used to build the PAYCE® model covers the period between January 2012 and December 2016.
A static pool approach is used to build the model. In this method, all relevant data is selected at
different starting points over the historical period and a twelve-month observation window is created
for each starting point. For a static pool, all businesses filing for bankruptcy during the subsequent 12-
month observation window are flagged in that pool. Five static pools were created over this period,
with a total of 60,000 unique businesses and a total of 1,150 bankruptcies.
PAYCE® SCORE DESCRIPTION
When no financial statements are available for a private company, looking at the way the company pays
its accounts payables and reviewing public filing information are widely accepted, effective ways to
evaluate the company’s risk. The PAYCE® score works on the relationship between a business’s recent

4
payment behavior and the future risk of bankruptcy. Development of the model has also found that the
existence of certain types of public filings is indicative of a heightened level of bankruptcy risk.
Many financial risk models use default as the event that defines financial distress. Using bond default
makes sense for bond investors, because it is an event of consequence to them, although the definition
of “default” isn’t always consistent. Bankruptcy is an alternative event defining extreme financial stress.
All bankruptcy events are a clearly defined matter of public record. Bankruptcy (whether Chapter 7 or
11) is a severe event, much more indicative that the company has been in financial distress over a
period prior to the filing. Most private businesses do not have public debt, so the event of bond default
is not meaningful for this very large group of businesses.
Often, risk models that use payment information predict risk of severe delinquency. There are many
reasons why a company may pay late, not all having to do with financial distress. Larger businesses with
significant market power may pay late because they can. Since bankruptcy is one of the most distant
events in the spiral of financial distress, a high risk of bankruptcy can imply a high risk of severe
delinquency and financial distress.
The historical payment, public filing and bankruptcy data were used to optimize the neural network
parameters on an out-of-sample basis. The data set was split into two groups, the larger one (in-sample)
was used to train the model, and the smaller one (out-of-sample) was used to evaluate the model’s
performance.
ANALYSIS OF PERFORMANCE
Many metrics have been developed in the past to evaluate credit model performance. The technique
used here, to be consistent with the FRISK® score, and to evaluate the final model performance, is the
“Receiver Operating Characteristics” (ROC) method which has a long history in statistical model
development4. The method compares the true positive rate “TPR” (i.e., the fraction of companies
positively identified as likely to go bankrupt, for a given risk threshold, that do go bankrupt) with the
false positive rate “FPR” (i.e., the fraction of companies positively identified as likely to go bankrupt, for
the same risk threshold, that do not file for bankruptcy). Every risk threshold has a set of two values
(FPR, TPR) associated with it, and by changing the threshold values an ROC graph can be generated as
shown in Figure 2.
The graph shows two curves, one (black) is the deep neural network model discussed here, and the
other curve (blue) is a linear model using the same data and same variables. The output of the model is
a probability varying between zero and one. To construct the ROC curve a series of thresholds are
assumed, these are values that vary between zero and one, also. If the output of the model concerning a
company is equal or greater than the assumed threshold, the company is tagged as being high risk. If the
output of the model is less than the assumed threshold the company is tagged as low risk. As the
threshold values change, an ROC curve is generated, and this curve is characteristic of the model.
4 R.J Irwin and T.C. Irwin, “Appraising Credit Ratings: Does the CAP Fit Better than the ROC?”, IMF Working Paper WP/12/122, May 2012
5
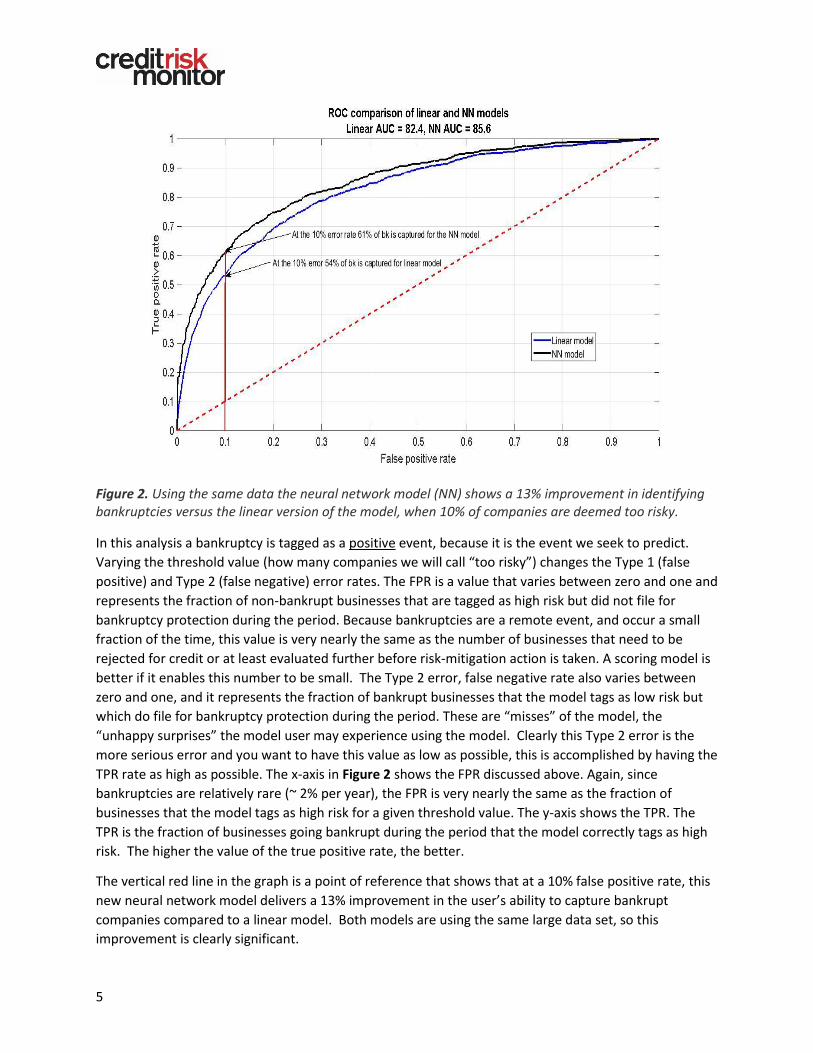
Figure 2. Using the same data the neural network model (NN) shows a 13% improvement in identifying bankruptcies versus the linear version of the model, when 10% of companies are deemed too risky.
In this analysis a bankruptcy is tagged as a positive event, because it is the event we seek to predict.
Varying the threshold value (how many companies we will call “too risky”) changes the Type 1 (false
positive) and Type 2 (false negative) error rates. The FPR is a value that varies between zero and one and
represents the fraction of non-bankrupt businesses that are tagged as high risk but did not file for
bankruptcy protection during the period. Because bankruptcies are a remote event, and occur a small
fraction of the time, this value is very nearly the same as the number of businesses that need to be
rejected for credit or at least evaluated further before risk-mitigation action is taken. A scoring model is
better if it enables this number to be small. The Type 2 error, false negative rate also varies between
zero and one, and it represents the fraction of bankrupt businesses that the model tags as low risk but
which do file for bankruptcy protection during the period. These are “misses” of the model, the
“unhappy surprises” the model user may experience using the model. Clearly this Type 2 error is the
more serious error and you want to have this value as low as possible, this is accomplished by having the
TPR rate as high as possible. The x-axis in Figure 2 shows the FPR discussed above. Again, since
bankruptcies are relatively rare (~ 2% per year), the FPR is very nearly the same as the fraction of
businesses that the model tags as high risk for a given threshold value. The y-axis shows the TPR. The
TPR is the fraction of businesses going bankrupt during the period that the model correctly tags as high
risk. The higher the value of the true positive rate, the better.
The vertical red line in the graph is a point of reference that shows that at a 10% false positive rate, this
new neural network model delivers a 13% improvement in the user’s ability to capture bankrupt
companies compared to a linear model. Both models are using the same large data set, so this
improvement is clearly significant.

6
Like the FRISK® score the output of the PAYCE™ score is mapped to a range from “1” (worst) to “10” (best), for ease of use. The table below shows how each score bucket relates to the probability of bankruptcy during the next 12 months.
Table 1 shows the range of bankruptcy probability represented by each score category, low and high. In
addition, the right two columns show the data from Figure 2 for the neural network model in tabular
form. Each row represents cumulative value of the FPR and TPR values for that score category and
below. Businesses with PAYCE® score of “1” have an FPR of about 2%, so this bucket represents about
2% of the population, but it captures 35% of bankruptcies. The PAYCE® score “5” category has a
cumulative FPR of 25%, this means that about 25% of businesses had a PAYCE™ score of “5” or below,
and this group represented 70% of all bankruptcies.
PAYCE®
score Low pB* (%) High pB(%)
Cumulative
FPR%
Cumulative
TPR%
10 0.00 0.38 100 100
9 0.38 0.55 80 99
8 0.55 0.80 65 96
7 0.80 1.22 50 91
6 1.22 1.69 34 83
5 1.69 2.59 25 70
4 2.59 3.73 15 65
3 3.73 6.34 10 60
2 6.34 10.02 5 47
1 10.02 50.00 2 35
Table 1. PAYCE® scores have useful bankruptcy ranges, and the score’s accuracy concentrates 4 of 5 bankruptcies in the red zone.
Those readers familiar with the FRISK® score’s performance will observe that the accuracy of the
PAYCE® score is not as good as the FRISK®. However, keep in mind that the PAYCE® score does not
require the rich data available on public companies. Therefore it is a good score to use to evaluate
a great number of private companies for whom financial statements are not available.

7
APPROACH TO BANKRUPTCY
When evaluating a bankruptcy score, it is also instructive to examine whether the score generally shows
more risk as the date of bankruptcy approaches. Evidence that a company’s payment behavior, as
evaluated by the PAYCE® score, degrades as the company approaches the bankruptcy filing date is
shown in Figure 3. The x-axis shows the number of months prior to filing for bankruptcy and the y-axis
shows the average PAYCE® score across all bankrupt businesses for a given month. The average value of
the score takes a more negative trend on or about 11 months prior to filing.
Figure 3. The average PAYCE® score drops as bankruptcy approaches.
Average PAYCE score
95% confidence range

8
CONCLUSION
The CreditRiskMonitor PAYCE® score provides a significant increase in our risk coverage for commercial
credit. Currently, the PAYCE® score covers about 80,000 large private businesses worldwide. This
number is limited by the score’s requirement for a sufficient number of trade contributors and trade
lines in order to compute a score, and as more subscribers contribute trade, the number of covered
businesses will increase. The PAYCE® score is updated daily as new trial balances are received, typically
for the previous month. Unlike many other payment based scores, this score focuses on the risk of
bankruptcy, a clear and definite indication of financial distress.


![Cream Rock Score - [Full Band Score]](https://img.pdfslide.us/doc/110x75/55cf99c1550346d0339f0059/cream-rock-score-full-band-score-56290de202403.jpg)