Embed Size (px)
Citation preview
The Countries of EuropeFacts and key figures
2nd edition
2015

The Countries of EuropeFacts and key figures2nd edition 2015
The Countries of Europe
Introduction 4
Comparing the Countries of Europe 7
Union of diversity 8The Languages of Europe 10
The official languages of the EU 12Majority language communities 16The working languages of the EU 17Old cultural languages 18
Political systems 20Area and geography 21
Mountains 22Oceans, seas and lakes 22Rivers 23Natural resources 24Dependent territories 25Country abbreviations 27
Memberships 29Economy 32
Economic power per resident 34Unemployment 36Population structure 37
European Overview 39
Overview of facts and figures 40Austria 42Belgium 48Bulgaria 54
Content
Croatia 60Cyprus 66Czech Republik 72Denmark 78Estonia 84Finland 90France 96Germany 102Greece 108Hungary 114Ireland 120Italy 126Latvia 132Lithuania 138Luxembourg 144Malta 150The Netherlands 156Poland 162Portugal 168Romania 174Slovakia 180Slovenia 186Spain 192Sweden 198United Kingdom 204EU-28 210
EU Institutions 216European Commission 218Appendix 222
Links 222The “Social Security Compass for Europe” 226“Social policy” media package 232Order information 236Imprint 237Helpline 238
4
IntroductionThe European Union‘s single market is also the basis for today‘s practically unrestricted freedom of movement, which also extends to work and social benefits. For this reason, being familiar with the different labour markets, social security schemes and legal systems will become increasingly important for people living in a free Europe.
The “Social Security Compass for Europe” database, released and regularly updated on DVD and online by the German Federal Ministry of Labour and Social Affairs (BMAS), provides a detailed comparison of social systems across the countries of the European Union. The database contains extensive information on various areas of social security, including work, occupational safety, illness, healthcare, family benefits, disability and social hardship, just to name a few.
A comparison of the social security systems in the EU member states is only meaningful if the facts and data on this important European issue are examined in the context of the general cultural, geographic, political and economic key figures. It is also possible to see how societal developments and changes are reflected in the social security systems in the individual member states.
This publication provides basic information about each of the 28 EU member countries. This includes the country’s official name, political system, population, language(s) and administrative structure, as well as key political and economic key figures, like the gross domestic product, average income, unemployment rate and population structure.
This is certainly a limited selection of the many different data and facts that can help us learn more about a country. However, they provide a context in which we can better understand the information about the various social systems and their actual impact on the people who live in the EU. This publication is also specifically designed for use in further training and education as a supplement to the “Social Security Database for Europe”.
Introduction
Introduction 5
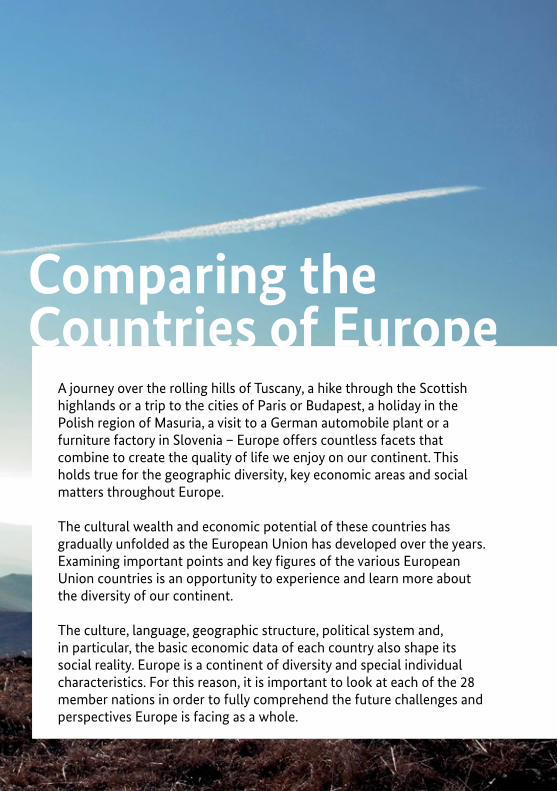
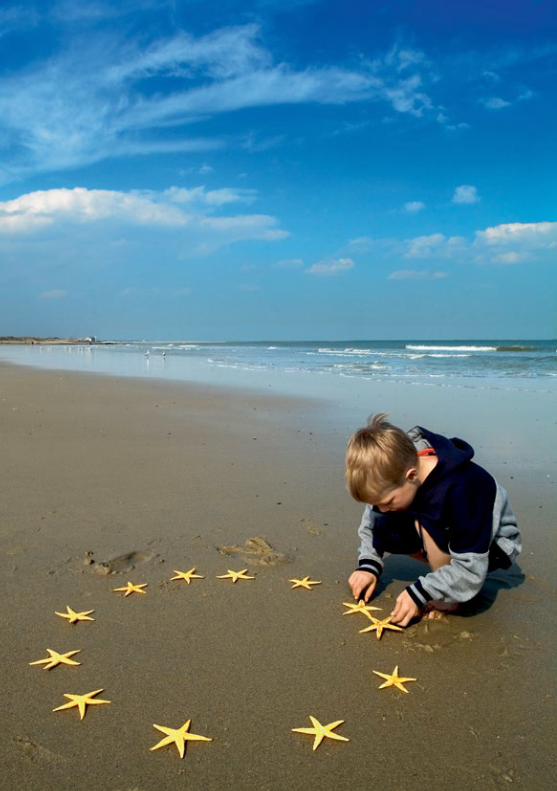
A journey over the rolling hills of Tuscany, a hike through the Scottish highlands or a trip to the cities of Paris or Budapest, a holiday in the Polish region of Masuria, a visit to a German automobile plant or a furniture factory in Slovenia – Europe offers countless facets that combine to create the quality of life we enjoy on our continent. This holds true for the geographic diversity, key economic areas and social matters throughout Europe.
The cultural wealth and economic potential of these countries has gradually unfolded as the European Union has developed over the years. Examining important points and key figures of the various European Union countries is an opportunity to experience and learn more about the diversity of our continent.
The culture, language, geographic structure, political system and, in particular, the basic economic data of each country also shape its social reality. Europe is a continent of diversity and special individual characteristics. For this reason, it is important to look at each of the 28 member nations in order to fully comprehend the future challenges and perspectives Europe is facing as a whole.
Comparing the Countries of Europe
Comparing the Countries of Europe8
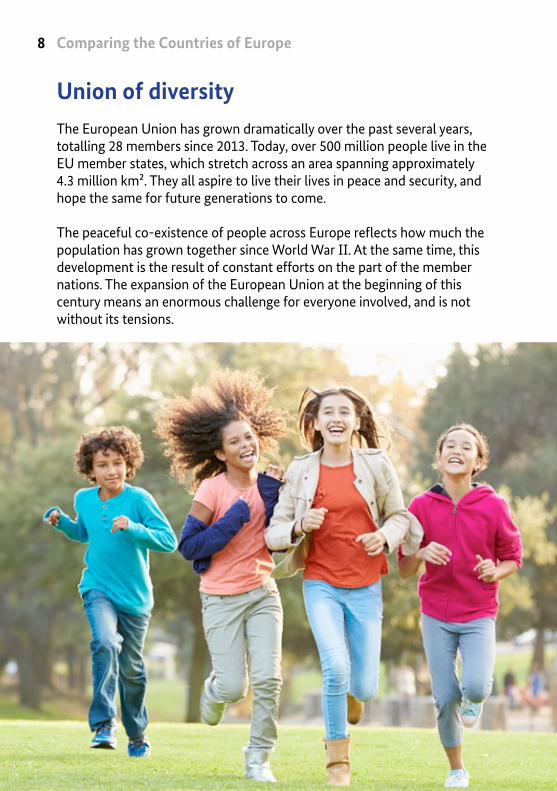
Union of diversity The European Union has grown dramatically over the past several years, totalling 28 members since 2013. Today, over 500 million people live in the EU member states, which stretch across an area spanning approximately 4.3 million km². They all aspire to live their lives in peace and security, and hope the same for future generations to come.
The peaceful co-existence of people across Europe reflects how much the population has grown together since World War II. At the same time, this development is the result of constant efforts on the part of the member nations. The expansion of the European Union at the beginning of this century means an enormous challenge for everyone involved, and is not without its tensions.
Union of diversity 9
The great wealth of the European Union lies in its diverse cultures and traditions. These do make it necessary, however, to find and establish shared standards and regulations for the people in the member states to live together. The day-to-day work of European policy involves unifying such differing political systems; geographic, historic and economic conditions, as well as strong traditions and ways of thinking across the continent.
The differences in traditions, political systems, economic possibilities and conditions, as well as business and financial policy, seem to emerge more clearly in social policy than in any other sector. The social security systems in the individual countries of the European Union are shaped by established structures on the one hand, and economic and political developments on the other. This is why the EU aims to coordinate and harmonise the many different social protection and social security systems for the people of Europe.
Europe is a continent of diversity – and this is especially true of the social security systems in the EU member nations. As these countries grow closer together, they do not lose their unique features and traditions, or their histories and strengths. Instead, their development is harmonised. This can make daily life simpler and more transparent across the member states. This harmonisation process is the ultimate goal for social Europe.
In order to appreciate and preserve the wealth and diversity on our continent, we first need to recognise this. Getting to know our neighbours and communicating with them is an essential foundation for our steady convergence. It has also provided the basis for the peaceful co-existence of people throughout Europe for around 70 years. The social security systems in the EU are very significant in this respect. They indicate where Europe stands today, but also reveal the continent’s historic development and the challenges it will face in future.
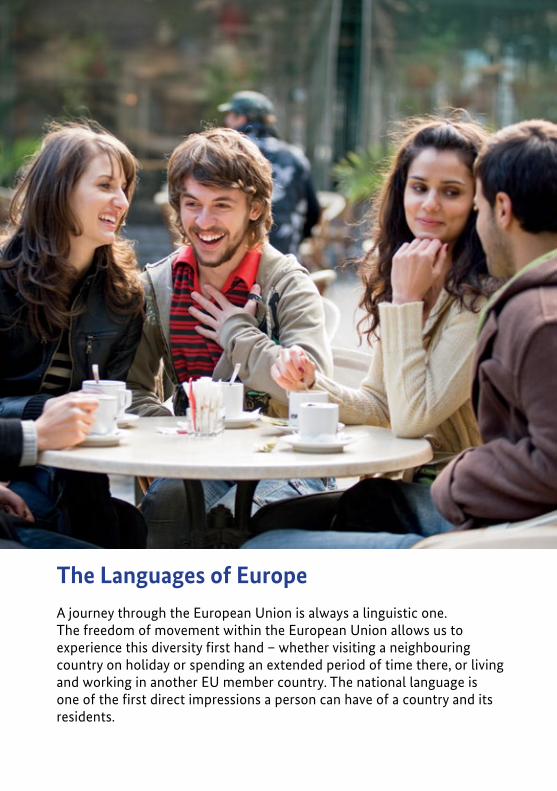
The Languages of EuropeA journey through the European Union is always a linguistic one. The freedom of movement within the European Union allows us to experience this diversity first hand – whether visiting a neighbouring country on holiday or spending an extended period of time there, or living and working in another EU member country. The national language is one of the first direct impressions a person can have of a country and its residents.
The Languages of Europe 11
Most people in the European Union are native German speakers. Over 89 million people within the European Union speak German: 80.8 million in Germany, and 8.5 million in Austria. Belgium also has a sizable German-speaking community of 76,300 people. There are also German-speaking populations in Luxembourg and South Tyrol, as well as smaller groups of native speakers in Romania and Hungary.
French follows German as the second most commonly spoken language, with around 70 million native speakers. In addition to the 65.8 million people in France, there are about four million native French speakers in the Walloon Region of Belgium, as well as the French-speaking population in Luxembourg.
English is a close third place, with 64.3 million native speakers in the United Kingdom and 4.6 million in the Republic of Ireland – the majority of Gaelic speakers also count English as their mother tongue. English is also the second official language in Malta. Around 69 million native English speakers live in Europe.
Italian is the fourth most spoken language in Europe, with about 61 million speakers. This is followed by Spanish, with 46.5 million people, and Polish with 38 million native speakers. Dutch, with around 23 million speakers – 16.8 million in the Netherlands and around 6 million in the Belgian region of Flanders – and Romanian (19.9 million) are next on the list.
There are five different languages that are each spoken by about 10 million people in Europe: Greek, with 10.9 million native speakers in Greece as well as the Greek-speaking population of Cyprus (700,000), Portuguese (10.4 million), Czech (10.5 million), Hungarian (9.9 million) and Swedish, with around 10 million speakers – 9.6 million in Sweden and the community of 290,000 Swedish speakers in Finland.
Comparing the Countries of Europe1212
The official languages of the EU
The European Union has a total of 24 official languages. In addition to the languages most widely spoken in Europe – German, French, English, Italian, Spanish and Polish – the less common ones shape the richness and diversity of the continent’s culture.
These include the national languages of Bulgarian, spoken by 7.2 million people, Danish, with 5.6 million speakers, Finnish (5.5 million), Slovakian (5.4 million), Croatian (4.2 million) Lithuanian (2.9 million), Latvian (2.1 million), Slovenian (2.0 million) and Estonian (1.3 million speakers). Fewer than one million people in the EU are native speakers of Irish, Maltese and Luxembourgish. The Turkish speaking population in Cyprus is a special exception.
The Languages of Europe 13
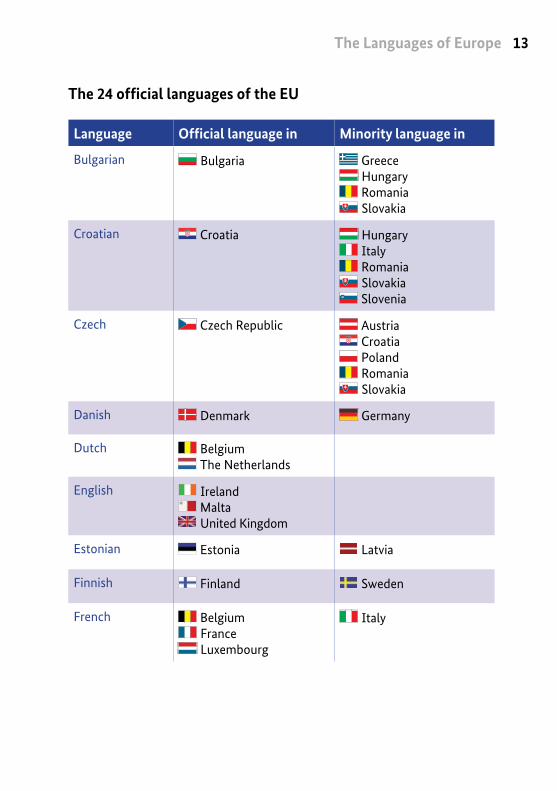
The 24 official languages of the EU
Language Official language in Minority language in
Bulgarian Bulgaria GreeceHungaryRomaniaSlovakia
Croatian Croatia HungaryItalyRomaniaSlovakiaSlovenia
Czech Czech Republic AustriaCroatiaPolandRomaniaSlovakia
Danish Denmark Germany
Dutch BelgiumThe Netherlands
English IrelandMaltaUnited Kingdom
Estonian Estonia Latvia
Finnish Finland Sweden
French BelgiumFranceLuxembourg
Italy
Comparing the Countries of Europe14
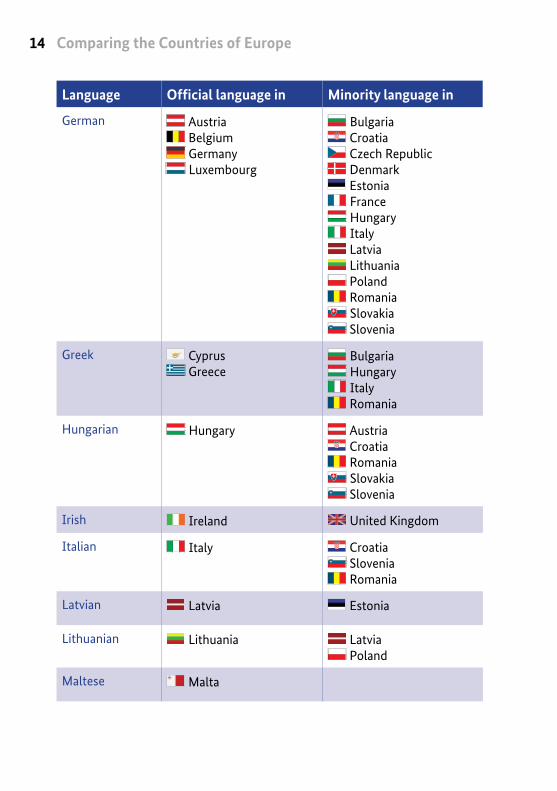
Language Official language in Minority language in
German AustriaBelgiumGermanyLuxembourg
BulgariaCroatiaCzech RepublicDenmarkEstoniaFranceHungaryItalyLatviaLithuaniaPolandRomaniaSlovakiaSlovenia
Greek CyprusGreece
BulgariaHungaryItalyRomania
Hungarian Hungary AustriaCroatiaRomaniaSlovakiaSlovenia
Irish Ireland United Kingdom
Italian Italy CroatiaSloveniaRomania
Latvian Latvia Estonia
Lithuanian Lithuania LatviaPoland
Maltese Malta
The Languages of Europe 15
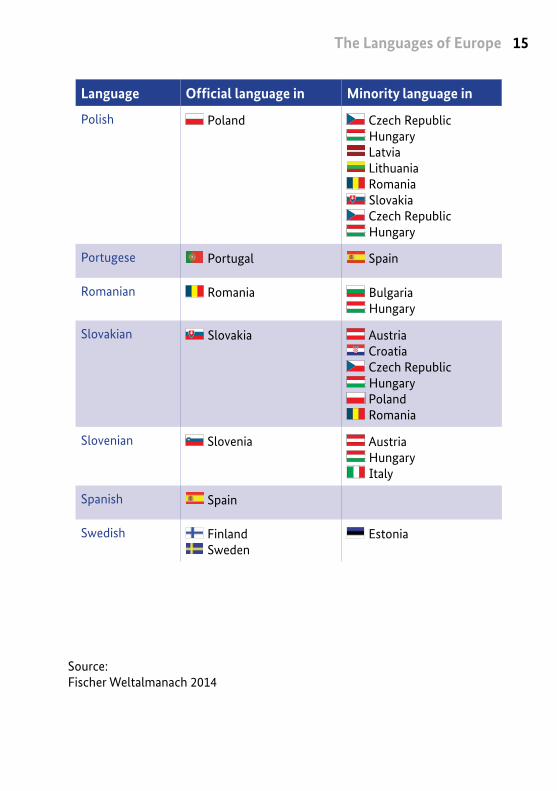
Source:Fischer Weltalmanach 2014
Language Official language in Minority language in
Polish Poland Czech RepublicHungaryLatviaLithuaniaRomaniaSlovakiaCzech RepublicHungary
Portugese Portugal Spain
Romanian Romania BulgariaHungary
Slovakian Slovakia AustriaCroatiaCzech RepublicHungaryPolandRomania
Slovenian Slovenia AustriaHungaryItaly
Spanish Spain
Swedish FinlandSweden
Estonia
Comparing the Countries of Europe16
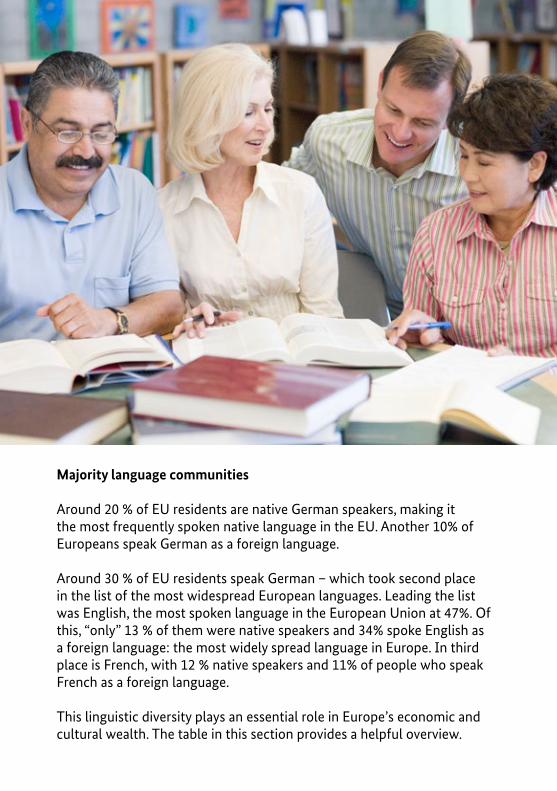
Majority language communities
Around 20 % of EU residents are native German speakers, making it the most frequently spoken native language in the EU. Another 10% of Europeans speak German as a foreign language.
Around 30 % of EU residents speak German – which took second place in the list of the most widespread European languages. Leading the list was English, the most spoken language in the European Union at 47%. Of this, “only” 13 % of them were native speakers and 34% spoke English as a foreign language: the most widely spread language in Europe. In third place is French, with 12 % native speakers and 11% of people who speak French as a foreign language.
This linguistic diversity plays an essential role in Europe’s economic and cultural wealth. The table in this section provides a helpful overview.
The Languages of Europe 17
The working languages of the EU
So-called working languages are used to ensure that people can work as effectively as possible in the European Union’s institutions. Representatives from 28 nations work with 24 official languages here. The EU institutions can decide which regulations are used to govern language use.
In the most important EU entities, this means: All documents submitted need to be translated into the working language of English, French and German. The so-called three language regime is in place here. When it comes to internal meetings, English has become the common language of choice.
In contrast, the following applies in the Council of the European Union: Minister-level negotiations and discussions are always translated into all official languages. The permanent representatives’ committee also allows for a three-language regime of English, French and German.
Finally, the European Parliament has interpreters to translate in and out of all of the European Union’s official languages in the plenum and committees. Official parliamentary communication with the member states takes place in the corresponding official language of the state.
Decisions of the European Court of Justice must be translated into all official languages. The European institutions reflect a level of diversity that is not always easy to manage with 24 official languages.
Comparing the Countries of Europe18
Old cultural languages
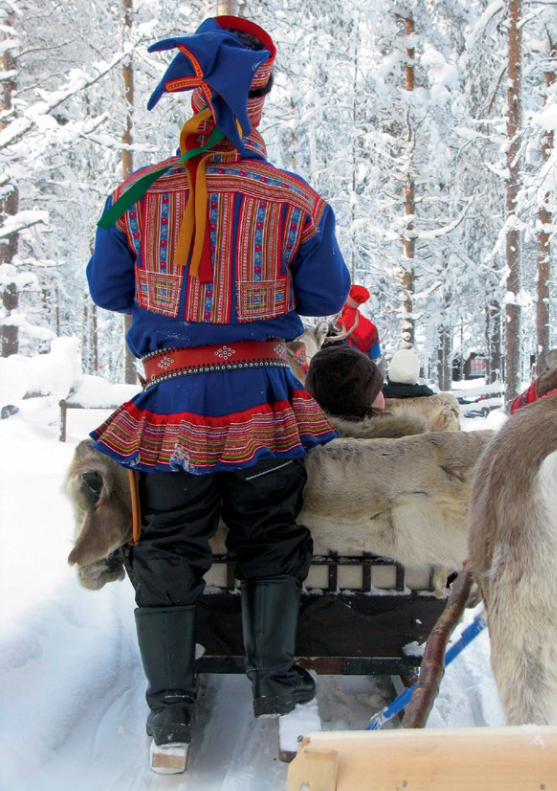
Europe’s linguistic atlas also has a variety of other facets. Historic languages are spoken in a number of small areas that are conscious of their traditions. Many of these languages have been and continue to be endangered by the dominance of the national or official languages: Basque, Breton, Frisian, Irish, Sami, Scottish Gaelic, Sorbian and Welsh are just a few examples of the diversity in the area of old cultural languages.
People who travel through Europe today can see the resurgence of these languages – thanks in part to the European Union’s regional support programmes. City and street signs in these regions are printed in both languages to make people aware of their existence. Several radio and television programmes – like BBC Alba in Scotland, RTE in Ireland, Sámi Radio in Finland and TV Breizh in France – show this linguistic diversity. Websites, newspapers and books also carry on the tradition of these old languages, and many are even taught in schools across Europe today.
The Languages of Europe 19
Comparing the Countries of Europe20
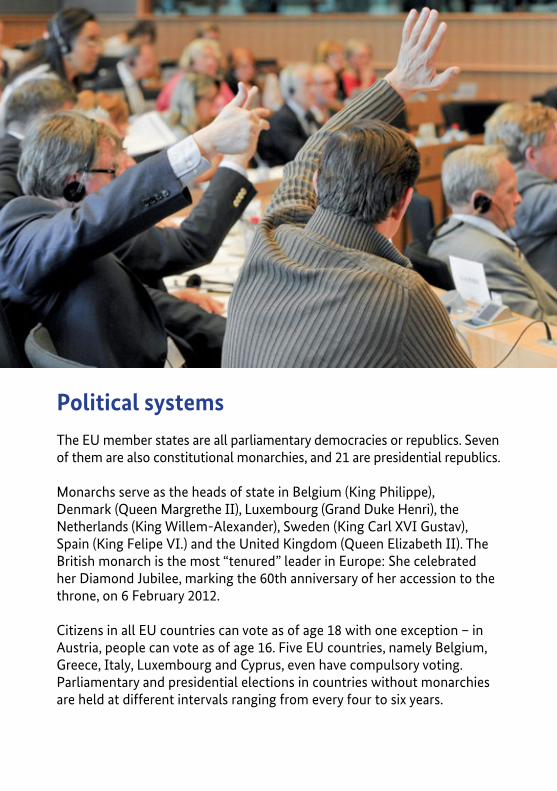
Political systemsThe EU member states are all parliamentary democracies or republics. Seven of them are also constitutional monarchies, and 21 are presidential republics.
Monarchs serve as the heads of state in Belgium (King Philippe), Denmark (Queen Margrethe II), Luxembourg (Grand Duke Henri), the Netherlands (King Willem-Alexander), Sweden (King Carl XVI Gustav), Spain (King Felipe VI.) and the United Kingdom (Queen Elizabeth II). The British monarch is the most “tenured” leader in Europe: She celebrated her Diamond Jubilee, marking the 60th anniversary of her accession to the throne, on 6 February 2012.
Citizens in all EU countries can vote as of age 18 with one exception – in Austria, people can vote as of age 16. Five EU countries, namely Belgium, Greece, Italy, Luxembourg and Cyprus, even have compulsory voting. Parliamentary and presidential elections in countries without monarchies are held at different intervals ranging from every four to six years.
Area and geography 21
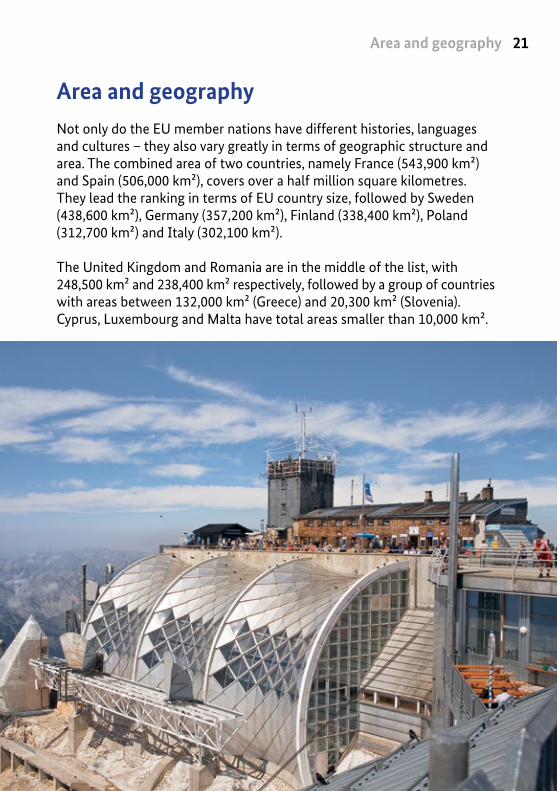
Area and geographyNot only do the EU member nations have different histories, languages and cultures – they also vary greatly in terms of geographic structure and area. The combined area of two countries, namely France (543,900 km²) and Spain (506,000 km²), covers over a half million square kilometres. They lead the ranking in terms of EU country size, followed by Sweden (438,600 km²), Germany (357,200 km²), Finland (338,400 km²), Poland (312,700 km²) and Italy (302,100 km²).
The United Kingdom and Romania are in the middle of the list, with 248,500 km² and 238,400 km² respectively, followed by a group of countries with areas between 132,000 km² (Greece) and 20,300 km² (Slovenia). Cyprus, Luxembourg and Malta have total areas smaller than 10,000 km².
Comparing the Countries of Europe22
Mountains
The geographic structure of these countries is far more expressive than the raw data: Mountains, coastlines, islands, rivers and lakes have a major impact on the geopolitical and economic development of the EU.
The highest peak in the Alps as well as Europe is Mont Blanc, at 4,810 m, located between France and Italy. It divides and links the countries to the north and south of the Alps. In 1965, an 11.6 km-long tunnel was opened between Chamonix on the French side and Courmayeur in the Aosta Valley. It has since become an important transportation connection between the two countries.
Bulgaria’s highest peak, Musala, at 2,925 m, is seven metres higher than Greece’s tallest mountain, Mytikas, located in the Olympus Mountains (2,918 m), and nearly as tall as the Zugspitze (2,962 m). The four largest mountain ranges in France, the largest EU country in terms of area, are the Alps, Pyrenees, Massif Central and Vosges.
Oceans, seas and lakes
The Atlantic Ocean and Mediterranean Sea, North and Baltic Seas, Irish Sea, Aegean and Ionian Seas, as well as the Black Sea form the natural border of water surrounding the European continent. Denmark, for example, consists of around 400 named islands. Finland is home to approximately 180,000 islands, and Sweden even has 221,800 islands. Finland is also home to a stunning 187,888 inland lakes. With 9,300 inland lakes, Poland has among the highest numbers of lakes in the world.
Germany’s ten largest islands are – in order of size – Rügen, Usedom, Feh-marn, Sylt, Föhr, Pellworm, Poel, Borkum, Norderney and Amrum. Rügen tops the list with 976 km², and Amrum is smallest with an area of just 20,5 km². One-quarter of the country of the Netherlands is located below sea level. Around 3,000 km of dikes protect the country from the sea.
Area and geography 23
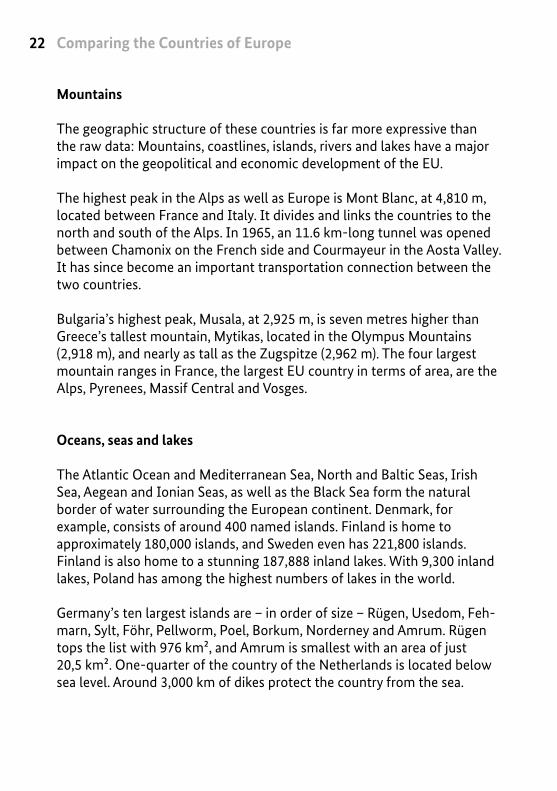
Rivers
Rivers have always been essential to the economic development of countries. In ancient times, they served as natural transport routes in Europe. These bustling waterways simultaneously brought the different peoples and cultures of the European countries together. The longest rivers in the EU are the Danube, which measures 2,860 km from its mouth to its source, the Rhine at 1,233 km, the Elbe (1,094 km), the Vistula (1,047 km), the Loire (1,012 km) and the Tagus (1,007 km).
The Oder, Meuse, Rhône, Ebro and Po rivers, each between 1,000 and 650 km in length, are also very significant for trade. They serve as important connecting routes throughout Europe.
Comparing the Countries of Europe24
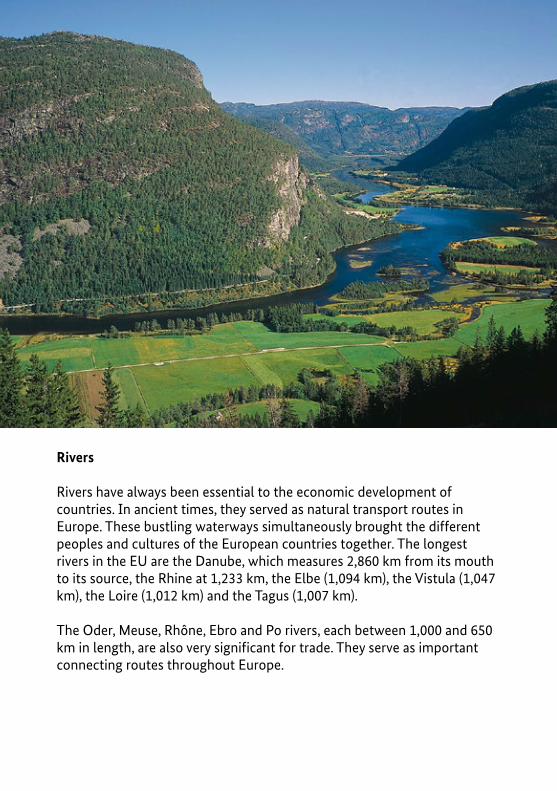
Natural resources
Europe’s diversity is also reflected in the diversity of its natural resources. Iron, copper, cobalt, tin and silver, for example, are all found in the Ore Mountains between Germany and the Czech Republic. They shape the landscape and people of this region even today. Another example: 58 % of the country of Slovenia is covered by forests today, making it one of Europe’s most forested nations. The forest is a major economic factor in Slovenia as the wood industry is a major employer.
Area and geography 25
The discovery of oil deposits off the coast of Scotland has changed the country and its people. The Mediterranean region is also home to a great deal of natural resources: The word “Copper” is derived from the Latin æes cyprium, which means “ore from Cyprus”. Copper has been mined on Cyprus since ancient times. Today, marble from the mountains on Cyprus is an important export.
These facts and figures illustrate how geography, geology and natural resources impact the living conditions of people in the various countries and regions of the European Union. A brief glance at the few random examples presented here clearly shows that all of these factors shape the development of each EU country – and, in turn, their social structures.
Dependent territories
The former colonial powers, namely France, Great Britain, the Nether lands, Spain and Portugal, have the most territories outside of the European continent. The United Kingdom has a total of 14 British Overseas Territories, including Bermuda, the British Virgin Islands, Falkland Islands, Cayman Islands and Saint Helena.
French territory extends to the islands of Guadeloupe and Martinique in the Caribbean, French Guiana in South America, Réunion in the Indian Ocean, and Saint-Pierre and Miquelon in the Atlantic, to name a few. The Caribbean islands of Aruba, Curaçao and Sint Maarten belong to the Netherlands. Azores and Madeira, located off the coast of West Africa, are part of Portugal, and Spain governs the Balearic and Canary Islands.
Comparing the Countries of Europe26
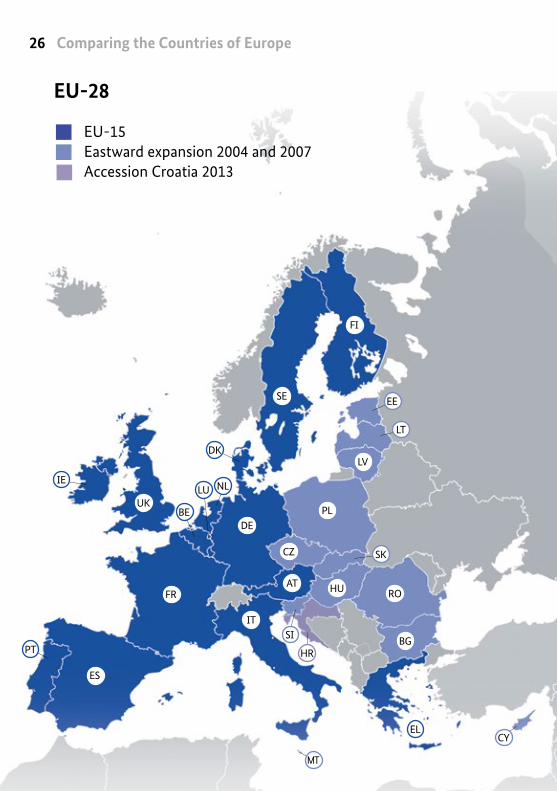
EU-28
EU-15Eastward expansion 2004 and 2007Accession Croatia 2013
DE
FR
ES
UK
SE
FI
PL
IT
AT
EL
ROHU
BG
CZ
LV
EE
LT
SK
SI
HR
MT
CY
PT
IE
DK
BE
LU NL
Area and geography 27
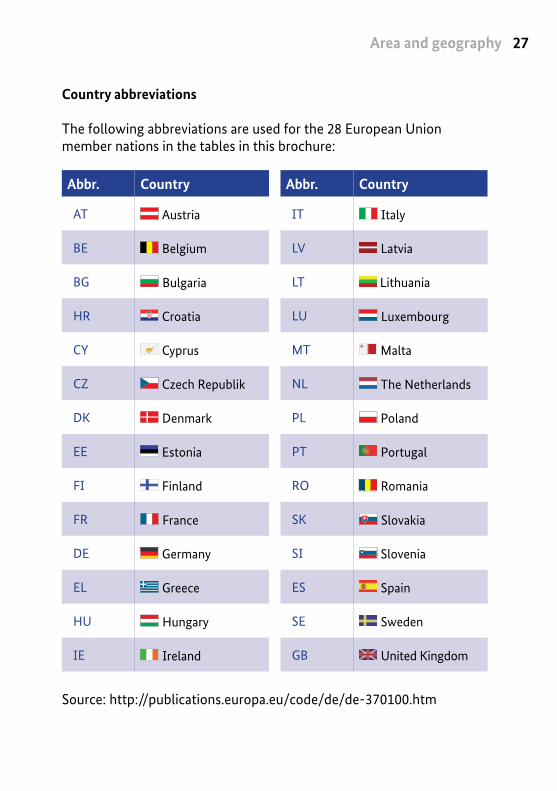
Country abbreviations
The following abbreviations are used for the 28 European Union member nations in the tables in this brochure:
Abbr. Country
AT Austria
BE Belgium
BG Bulgaria
HR Croatia
CY Cyprus
CZ Czech Republik
DK Denmark
EE Estonia
FI Finland
FR France
DE Germany
EL Greece
HU Hungary
IE Ireland
Abbr. Country
IT Italy
LV Latvia
LT Lithuania
LU Luxembourg
MT Malta
NL The Netherlands
PL Poland
PT Portugal
RO Romania
SK Slovakia
SI Slovenia
ES Spain
SE Sweden
GB United Kingdom
Source: http://publications.europa.eu/code/de/de-370100.htm
Comparing the Countries of Europe28
Memberships 29
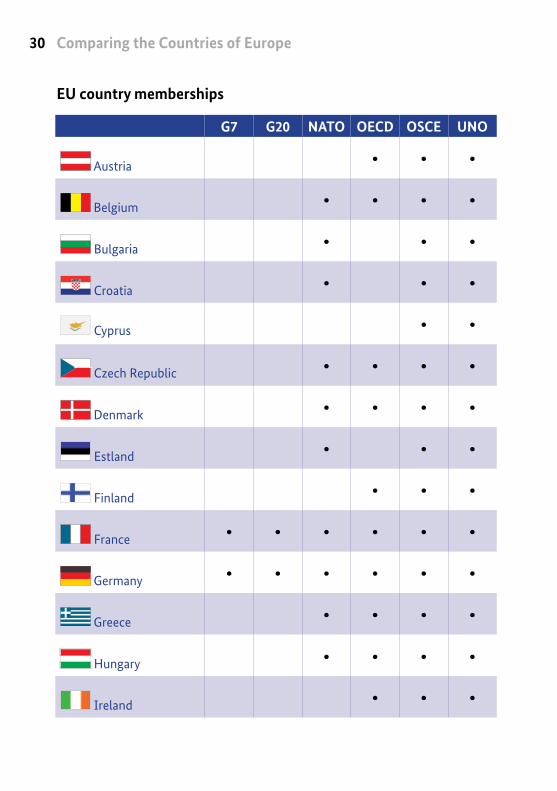
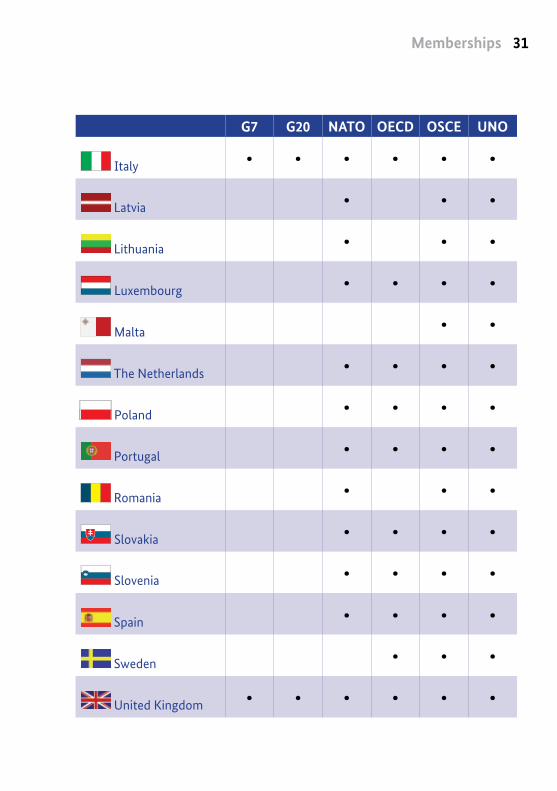
MembershipsThe EU countries are members of major international organisations. These memberships also reflect the history and individual development of each nation. Germany, France, Italy and the United Kingdom belong to the Group of Seven and 20 largest economies in the world (G7 and G20).
All EU countries are members of the UNO and the OSCE, the Organization for Security and Co-operation in Europe. Of the 28 EU countries mentioned here, 22 of these are members of NATO. Finland, Ireland, Malta, Austria, Sweden and Cyprus are not NATO members. The OECD, the Organisation for Economic Co-operation and Development, counts all EU countries among its members with the exception of Bulgaria, Estonia, Latvia, Lithuania, Malta, Romania, Croatia and Cyprus.
Comparing the Countries of Europe30
EU country memberships
G7 G20 NATO OECD OSCE UNO
Austria • • •
Belgium • • • •
Bulgaria • • •
Croatia • • •
Cyprus • •
Czech Republic • • • •
Denmark • • • •
Estland • • •
Finland • • •
France • • • • • •
Germany • • • • • •
Greece • • • •
Hungary • • • •
Ireland • • •
Memberships 31
G7 G20 NATO OECD OSCE UNO
Italy • • • • • •
Latvia • • •
Lithuania • • •
Luxembourg • • • •
Malta • •
The Netherlands • • • •
Poland • • • •
Portugal • • • •
Romania • • •
Slovakia • • • •
Slovenia • • • •
Spain • • • •
Sweden • • •
United Kingdom • • • • • •
Comparing the Countries of Europe32
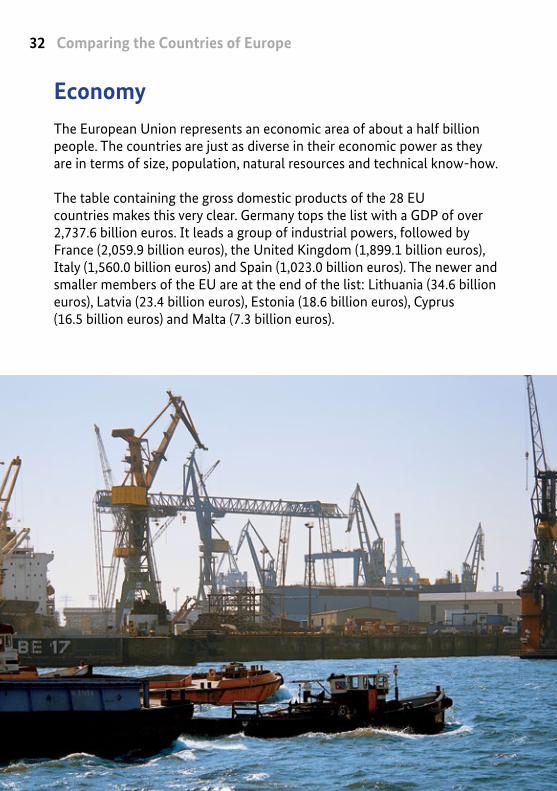
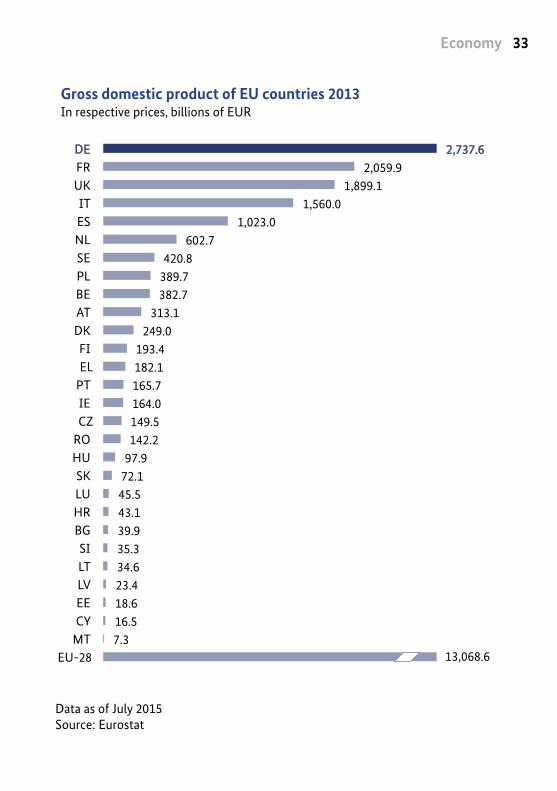
EconomyThe European Union represents an economic area of about a half billion people. The countries are just as diverse in their economic power as they are in terms of size, population, natural resources and technical know-how.
The table containing the gross domestic products of the 28 EU countries makes this very clear. Germany tops the list with a GDP of over 2,737.6 billion euros. It leads a group of industrial powers, followed by France (2,059.9 billion euros), the United Kingdom (1,899.1 billion euros), Italy (1,560.0 billion euros) and Spain (1,023.0 billion euros). The newer and smaller members of the EU are at the end of the list: Lithuania (34.6 billion euros), Latvia (23.4 billion euros), Estonia (18.6 billion euros), Cyprus (16.5 billion euros) and Malta (7.3 billion euros).
Economy 33
Gross domestic product of EU countries 2013In respective prices, billions of EUR
Data as of July 2015 Source: Eurostat
2,737.6 2,059.9
1,899.1 1,560.0
1,023.0 602.7
420.8 389.7 382.7
313.1 249.0
193.4 182.1 165.7 164.0 149.5 142.2
97.9 72.1 45.5 43.1 39.9 35.3 34.6 23.4 18.6 16.5 7.3
13,068.6
FR UK IT ES NL SE PL BE AT DK FI EL
PT IE CZ
RO HU SK LU HR BG SI LT LV EE CY
MT EU-28
DE
Comparing the Countries of Europe34
Economic power per resident
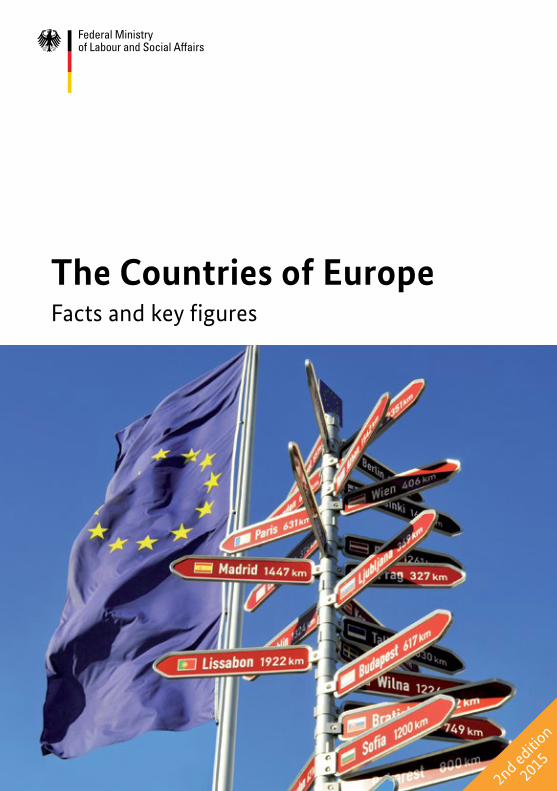
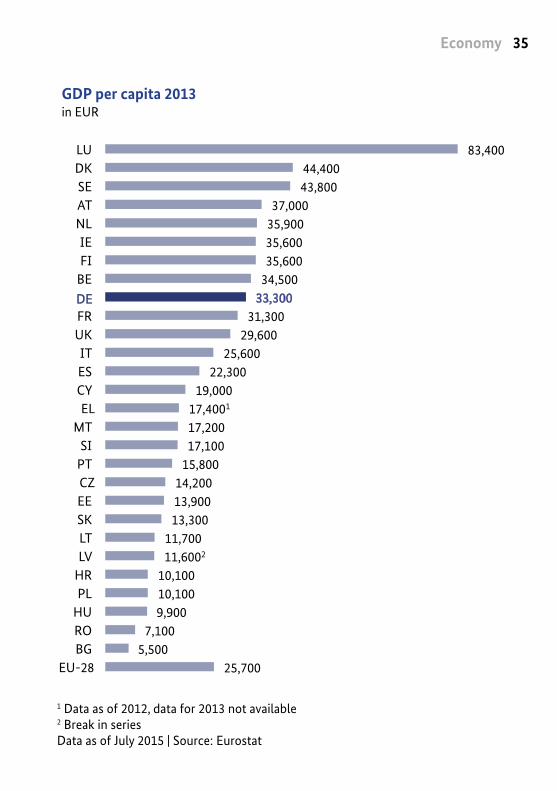
The order changes when the GDP is calculated in terms of economic performance per individual: Luxembourg is at the top (€83,400), followed by Denmark (€44,400), Sweden (€43,800), Austria (€37,000) and the Netherlands (€35,900).
This is an indication of the Scandinavian countries’ performance in terms of social security systems – Finland is in seventh place with €35,600. At the same time, it also shows the potential of the smaller European Union member nations.
In this analysis, Germany is ranked ninth in the table with a per capita GDP of €33,600 per year. The countries that joined the European Union in 2004, 2007 and 2013 are at the end of this list: Latvia (€11,600), Croatia and Poland (€10,100), Hungary (€9,900), Romania (€7,100) and Bulgaria (€5,500).
Economy 35
GDP per capita 2013in EUR
1 Data as of 2012, data for 2013 not available2 Break in seriesData as of July 2015 | Source: Eurostat
83,400 44,400 43,800
37,000 35,900 35,600 35,600
34,500 33,300
31,300 29,600
25,600 22,300
19,000 17,4001 17,200 17,100
15,800 14,200 13,900 13,300
11,700 11,6002
10,100 10,100 9,900
7,100 5,500
25,700
LU DK SE AT NL IE FI
BE
FR UK IT ES CY EL
MT SI
PT CZ EE SK LT LV
HR PL
HU RO BG
EU-28
DE
Comparing the Countries of Europe36
Unemployment
There are also major differences in unemployment rates throughout the 28 European Union countries. In March 2015 the nation with the lowest unemployment rate is Germany, at 4.8 %. The United Kingdom was ranked second with an unemployment rate of 5.4 %.
The highest unemployment rates are found in Portugal (13.2 %), Cyprus (16.3 %), Croatia (16.7 %), Spain (22.9 %) and Greece with 25.6 %. In March 2015, the average unemployment rate for all EU countries was 9.7 % - significantly higher than the United States, which has a jobless rate of 5.5 %.

Economy 37
Population structure
There are also clear differences in the age structures of the EU member nations, albeit far less dramatic ones. By looking at the population structure, it is noticeable that several countries have an especially “young” population, such as Ireland.
In contrast, other countries, like Germany and Italy, have an especially high percentage of people over age 65. In 2013, this age segment totalled around 21 % of the total population in Germany, and even 22 % of the total population in Italy.Ireland has the largest number of people ages 0 to 14. This population group makes up 22 % of the island republic.
Die Länder Europas im Vergleich 39Die Länder Europas im Vergleich 39
The great diversity of the 28 European Union countries revealed in their key figures is what makes them so interesting to compare. A wide range of factors, key figures and developments shape the Europe of today, and allow a glimpse into the future potential of each member nation.
All of these elements lead to the fact that there are still major differences between EU countries - especially when it comes to their social security systems. At the same time, comparing the countries shows that the gaps between them have started to shrink over the past few years, and continue to do so today. This has a significant impact on social security in Europe which provides an important foundation for the Europe of tomorrow - promoting the prosperity and peaceful co-existence of the people on our continent.
European Overview
European Overview40
Overview of facts and figuresThe following pages present extensive information about all 28 European Union countries as well as the EU-28 as a whole. A six-page section is dedicated to each individual country.
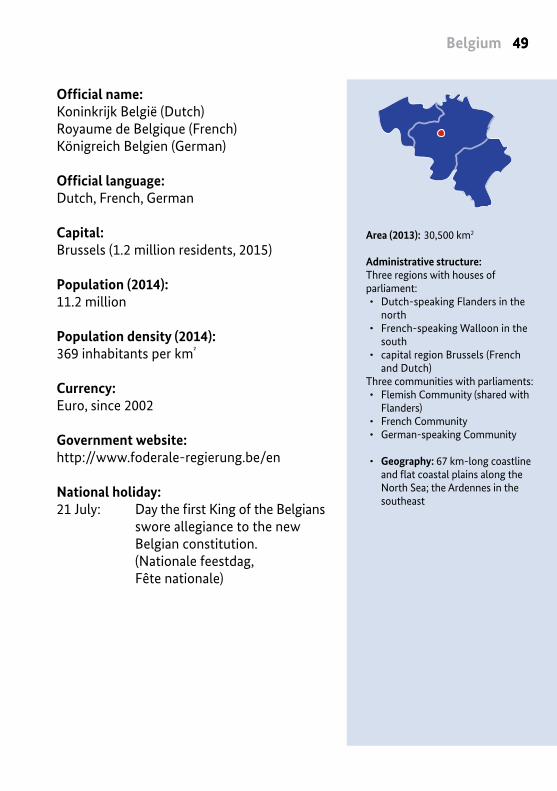
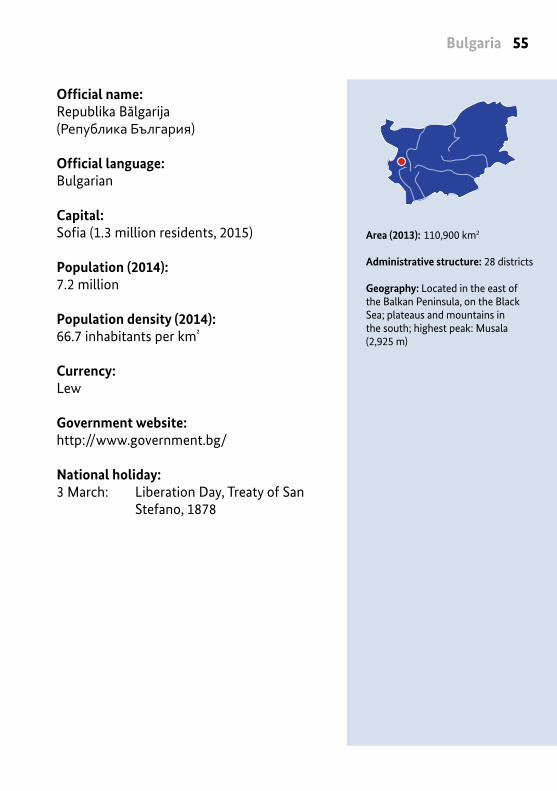
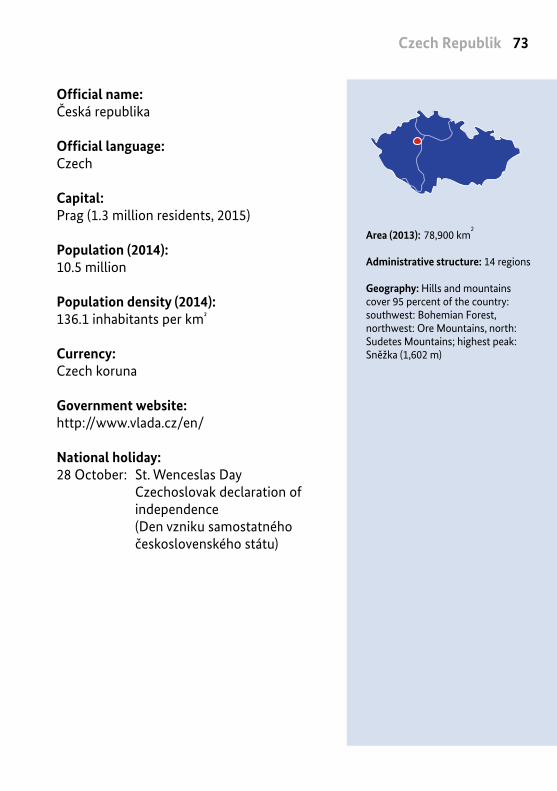
The first two-page spread features a photo of the capital city or seat of government and short portrait of the corresponding member state. The national flag and a small map of the country with the most important rivers and capital city marked are also included as helpful details. Information about the official language, government, population, currency, national holiday, geographic information, etc., is listed also.
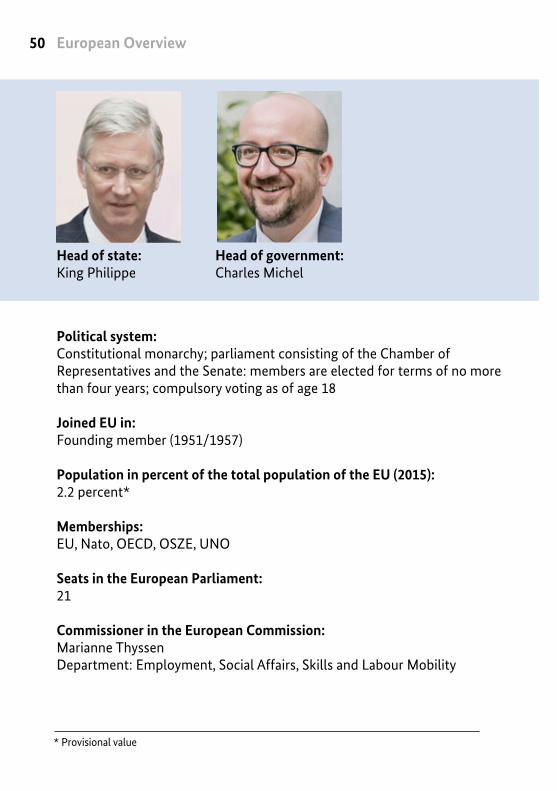
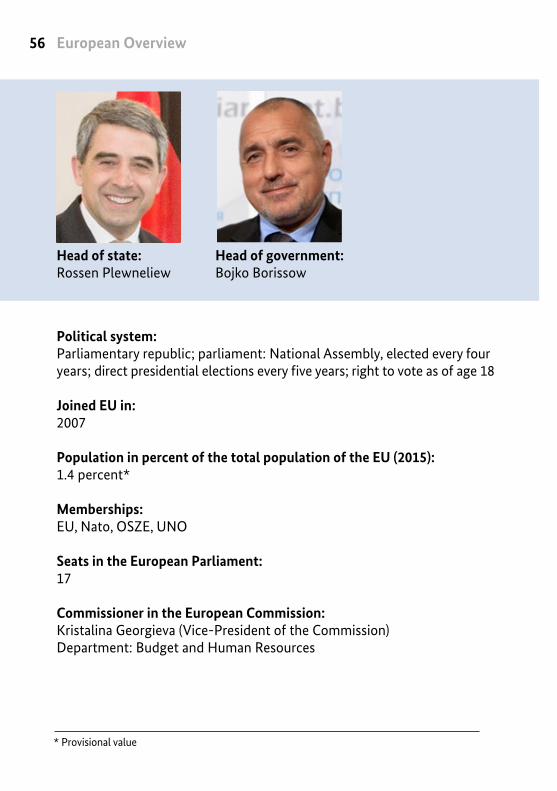
The second two-page spread provides further facts and figures; e.g. regarding the EU Commissioner delegated by the country and the number of seats in the European Parliament. The Heads of State and Government of the respective nation are pictured above. Further information like the gross annual income, minimum wages and demographic structures complete the scope of information. The details about youth unemployment (2014) refer to the population group of the 15 to 24 year olds. The adults with higher education are people aged 25 to 64 years who, at least, obtained A-levels.
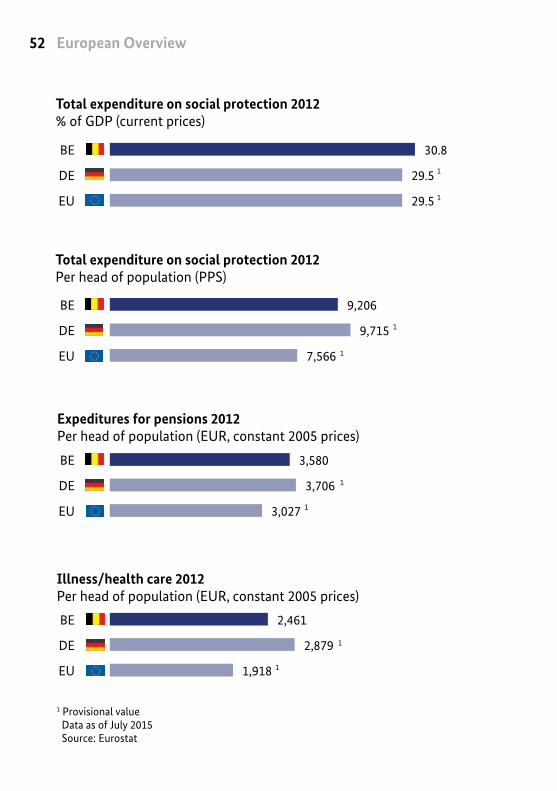
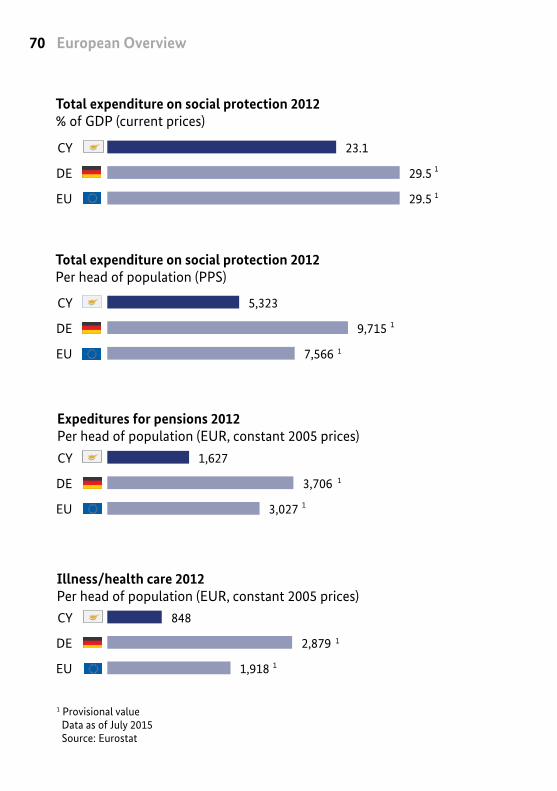
The third two-page features data on the main topic of social security systems. The key figures for each EU member country are presented in relation to those of Germany and the EU 28 overall. The graphic presentation of data makes comparing the figures both quick and easy. Total social security expenditures for 2011 are compared to respective prices as a percentage of the gross domestic product (GDP) in 2012, as well as in per capita purchasing power standards (PPS). PPS are considered an artificial currency which takes price differences between countries into account and improves the comparability of data.
40
Overview of facts and figures 41
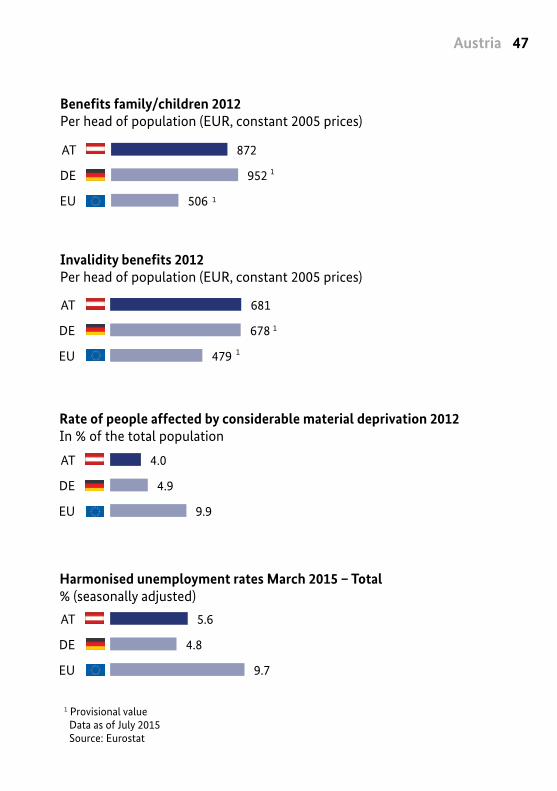
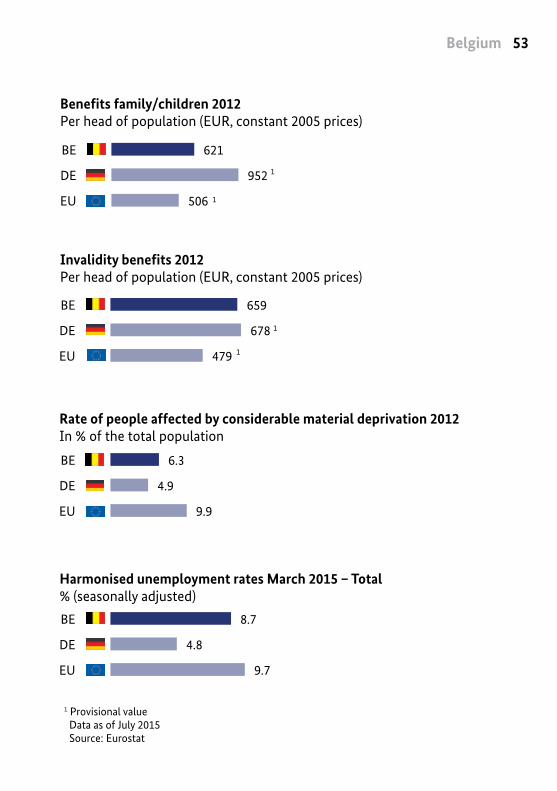
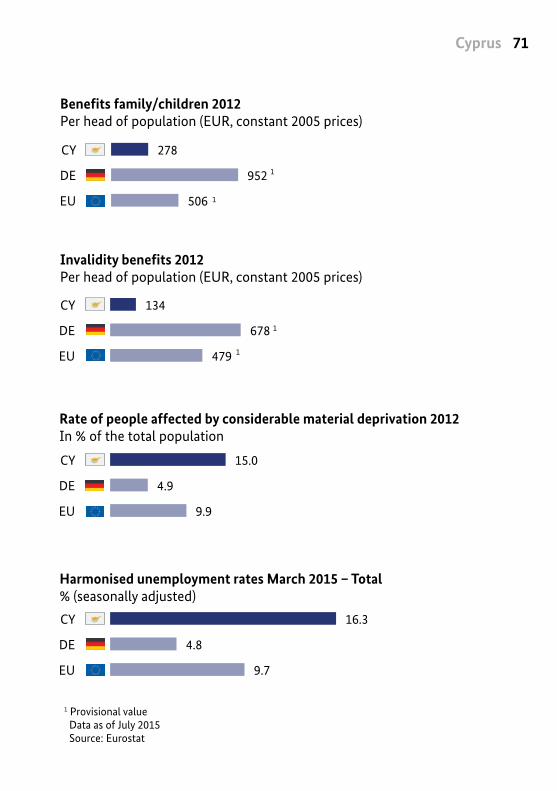
Each country‘s expenditures for pensions, illness and health care, family and children, as well as the disabled, are compared to Germany‘s expenditures as well as those of the entire EU-28 in 2012. Another diagram shows the percentage of people impacted by severe poverty in 2012. Finally, the harmonised unemployment rate from March 2015 is shown in relation to Germany and the 28 EU member nations. In order to provide the most meaningful comparison, this publication only uses figures from the year in which consolidated data were available for each EU country.
Since the facts and figures in this publication are regularly updated as part of the extensive Social Security Compass for Europe database, this overview is based on the latest available information. As such, this publication is a current, accurate and reliable source for key data on European social systems.
41

AUSTRIAThe Republic of Austria is one of the most mountainous countries in the European Union. The Alpine republic and its many ski resorts attract tourists from around the world. Thanks to its central, landlocked location in Europe, Austria has many neighbours: The country borders Germany, the Czech Republic, Slovenia, Italy, Slovakia, Hungary, Switzerland and Liechtenstein.
The Austrian Alps traditionally generate a great deal of hydroelectric power. This environmentally friendly energy source covers a large share of Austria‘s energy requirements.
Austria has a long cultural tradition. The capital city of Vienna was a centre for music in the 18th and 19th centuries, and has an important theatre community today. UNESCO added the historic centres of Mozart‘s birthplace Salzburg and the city of Graz to its list of World Heritage Sites.
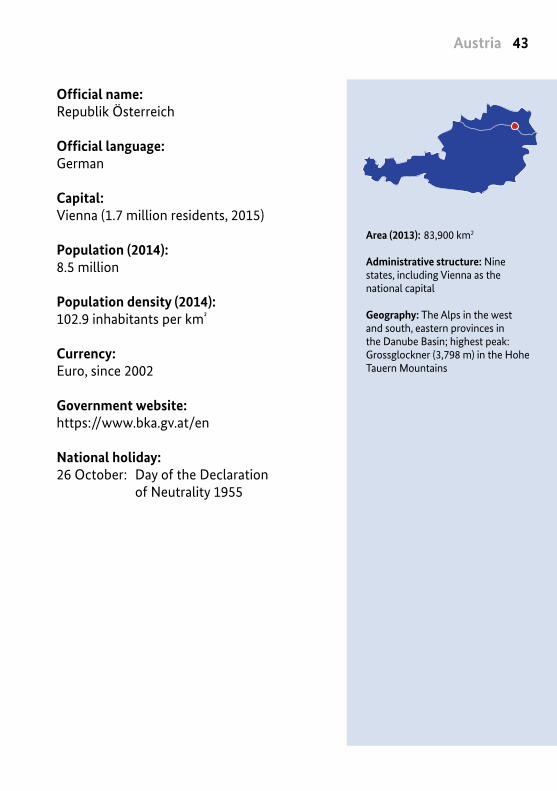
43Austria
Area (2013): 83,900 km2
Administrative structure: Nine states, including Vienna as the national capital
Geography: The Alps in the west and south, eastern provinces in the Danube Basin; highest peak: Grossglockner (3,798 m) in the Hohe Tauern Mountains
Official name:Republik Österreich
Official language: German
Capital: Vienna (1.7 million residents, 2015)
Population (2014): 8.5 million
Population density (2014): 102.9 inhabitants per km²
Currency: Euro, since 2002
Government website: https://www.bka.gv.at/en
National holiday: 26 October: Day of the Declaration of Neutrality 1955
European Overview44
* Provisional value
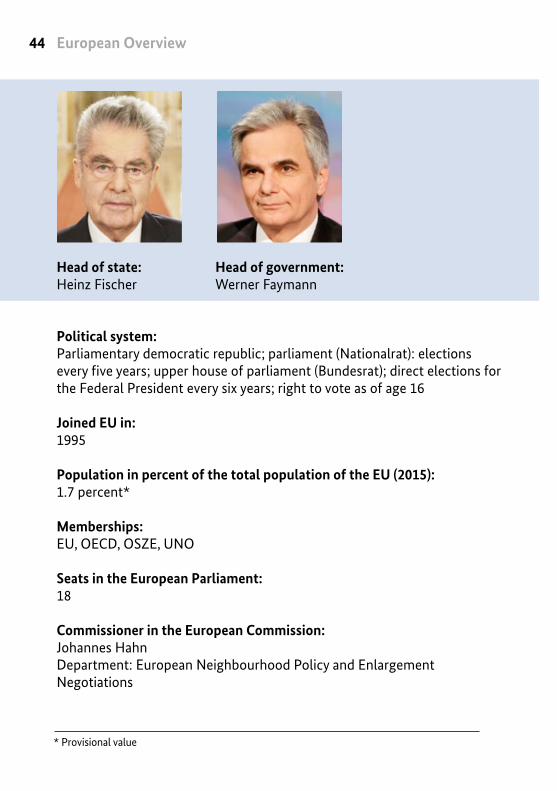
Head of government: Werner Faymann
Head of state: Heinz Fischer
Political system: Parliamentary democratic republic; parliament (Nationalrat): elections every five years; upper house of parliament (Bundesrat); direct elections for the Federal President every six years; right to vote as of age 16
Joined EU in: 1995
Population in percent of the total population of the EU (2015):1.7 percent*
Memberships: EU, OECD, OSZE, UNO
Seats in the European Parliament: 18
Commissioner in the European Commission:Johannes HahnDepartment: European Neighbourhood Policy and Enlargement Negotiations
45Austria
** Break in series
Age distribution
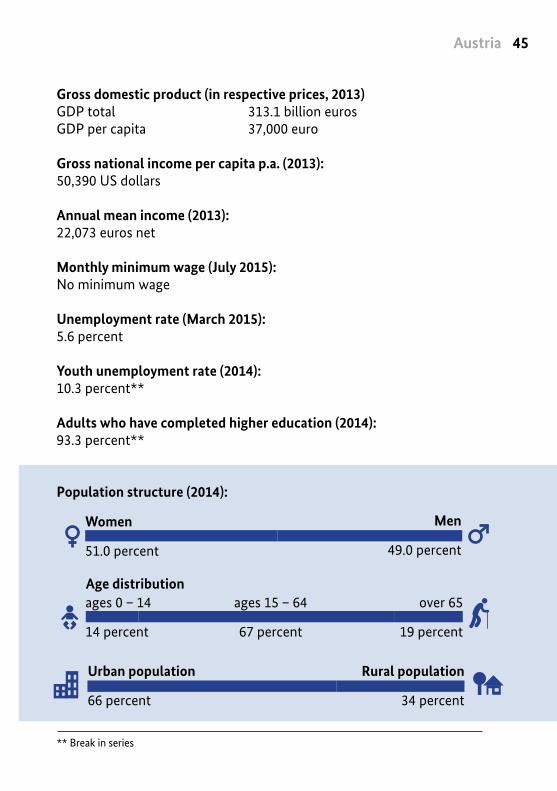
Population structure (2014):
Gross domestic product (in respective prices, 2013)GDP total 313.1 billion eurosGDP per capita 37,000 euro
Gross national income per capita p.a. (2013):50,390 US dollars
Annual mean income (2013):22,073 euros net
Monthly minimum wage (July 2015): No minimum wage
Unemployment rate (March 2015): 5.6 percent
Youth unemployment rate (2014): 10.3 percent**
Adults who have completed higher education (2014):93.3 percent**
Rural population
34 percent
Urban population 66 percent
ages 0 – 14
14 percent
ages 15 – 64
67 percent
over 65
19 percent
Men
49.0 percent
Women
51.0 percent
European Overview46
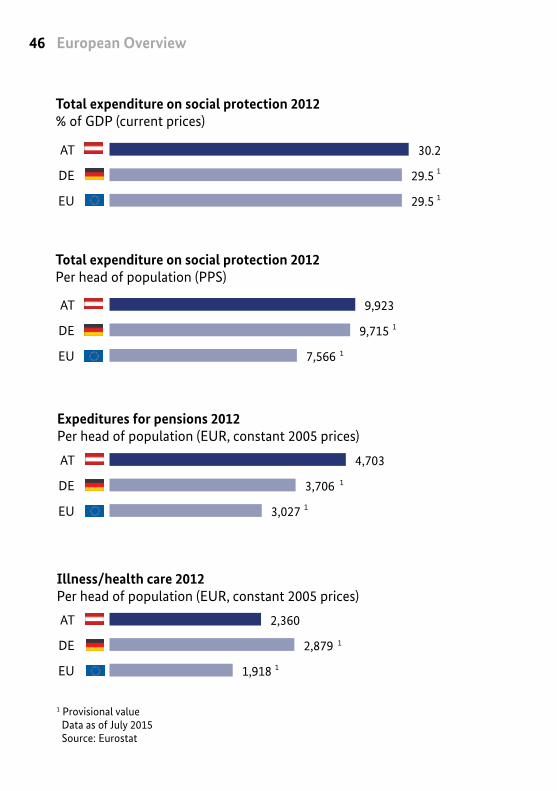
1 Provisional value Data as of July 2015 Source: Eurostat
30.2
29.5
29.5
AT
DE
EU 1
2,360
2,879
1,918
AT
DE
EU
1
1
9,923
9,715
7,566
AT
DE
EU
1
1
4,703
3,706
3,027
AT
DE
EU
1
1
DE
EU
AT
1
Total expenditure on social protection 2012% of GDP (current prices)
Illness/health care 2012Per head of population (EUR, constant 2005 prices)
Expeditures for pensions 2012Per head of population (EUR, constant 2005 prices)
Total expenditure on social protection 2012Per head of population (PPS)
47Austria
1 Provisional value Data as of July 2015 Source: Eurostat
872
952
506
AT
DE
EU
1
1
681
678
479
AT
DE
EU
1
1
4.0
4.9
9.9
AT
DE
EU
5.6
4.8
9.7
AT
DE
EU
Harmonised unemployment rates March 2015 – Total% (seasonally adjusted)
Invalidity benefits 2012Per head of population (EUR, constant 2005 prices)
Benefits family/children 2012Per head of population (EUR, constant 2005 prices)
Rate of people affected by considerable material deprivation 2012In % of the total population

The Kingdom of Belgium is located in the heart of the European Union. The country has a wide variety of landscapes – with flat, gently rolling arable land in the north, and the forested Ardennes in the south. Just as diverse as the landscapes are Belgium‘s political regions – consisting of Flanders, Wallonia and the Brussels-Capital region. Belgium is also divided into Flemish, French and German-speaking communities, and has three official languages as a result: Dutch, French and German.
The capital city of Brussels, an important hub for European and global politics, is located in the heart of the country. Brussels is home to the headquarters of the European Union, the EU Commission and NATO. The European Parliament and the Council of the European Union also have representative offices in the Belgian capital.
Spanning around 70 km, the Belgian coast is home to several important harbours. After Rotterdam, Antwerp harbour is Europe‘s second largest port, followed by Hamburg. Zeebrugge is the world‘s largest port for the automotive industry.
BELGIUM
49Belgium
Area (2013): 30,500 km2
Administrative structure: Three regions with houses of parliament:• Dutch-speaking Flanders in the
north• French-speaking Walloon in the
south• capital region Brussels (French
and Dutch)Three communities with parliaments:• Flemish Community (shared with
Flanders)• French Community• German-speaking Community
• Geography: 67 km-long coastline and flat coastal plains along the North Sea; the Ardennes in the southeast
Official name:Koninkrijk België (Dutch)Royaume de Belgique (French)Königreich Belgien (German)
Official language: Dutch, French, German
Capital: Brussels (1.2 million residents, 2015)
Population (2014): 11.2 million
Population density (2014): 369 inhabitants per km²
Currency: Euro, since 2002
Government website: http://www.foderale-regierung.be/en
National holiday: 21 July: Day the first King of the Belgians swore allegiance to the new Belgian constitution. (Nationale feestdag, Fête nationale)
49
European Overview50
* Provisional value
Political system: Constitutional monarchy; parliament consisting of the Chamber of Representatives and the Senate: members are elected for terms of no more than four years; compulsory voting as of age 18
Joined EU in: Founding member (1951/1957)
Population in percent of the total population of the EU (2015):2.2 percent*
Memberships: EU, Nato, OECD, OSZE, UNO
Seats in the European Parliament: 21
Commissioner in the European Commission:Marianne ThyssenDepartment: Employment, Social Affairs, Skills and Labour Mobility
Head of government: Charles Michel
Head of state: King Philippe

51Belgium
** Break in series
Urban population 98 percent
Rural population
2 percent
ages 0 – 14
17 percent
ages 15 – 64
65 percent
over 65
18 percent
Age distribution
Women
50.9 percent
Men
49.1 percent
Population structure (2014):
Gross domestic product (in respective prices, 2013)GDP total 382.7 billion eurosGDP per capita 34,500 euro
Gross national income per capita p.a. (2013):46,340 US dollars
Annual mean income (2013):21,483 euros net
Monthly minimum wage (July 2015): 1,502 euro
Unemployment rate (March 2015): 8.7 percent
Youth unemployment rate (2014): 23.2 percent**
Adults who have completed higher education (2014):75.9 percent**
European Overview52
1 Provisional value Data as of July 2015 Source: Eurostat
30.8
29.5
29.5
BE
DE
EU 1
2,461
2,879
1,918
BE
DE
EU
1
1
9,206
9,715
7,566
BE
DE
EU
1
1
3,580
3,706
3,027
BE
DE
EU
1
1
DE
EU
BE
DE
EU
BE
DE
EU
BE
DE
EU
1
Total expenditure on social protection 2012% of GDP (current prices)
Illness/health care 2012Per head of population (EUR, constant 2005 prices)
Expeditures for pensions 2012Per head of population (EUR, constant 2005 prices)
Total expenditure on social protection 2012Per head of population (PPS)
53Belgium
1 Provisional value Data as of July 2015 Source: Eurostat
621
952
506
BE
DE
EU
1
1
659
678
479
BE
DE
EU
1
1
6.3
4.9
9.9
BE
DE
EU
8.7
4.8
9.7
BE
DE
EU
30.8
29.5
29.5
BE
DE
EU 1
2,461
2,879
1,918
BE
DE
EU
1
1
9,206
9,715
7,566
BE
DE
EU
1
1
3,580
3,706
3,027
BE
DE
EU
1
1
DE
EU
BE
DE
EU
BE
DE
EU
BE
DE
EU
1
Harmonised unemployment rates March 2015 – Total% (seasonally adjusted)
Invalidity benefits 2012Per head of population (EUR, constant 2005 prices)
Benefits family/children 2012Per head of population (EUR, constant 2005 prices)
Rate of people affected by considerable material deprivation 2012In % of the total population
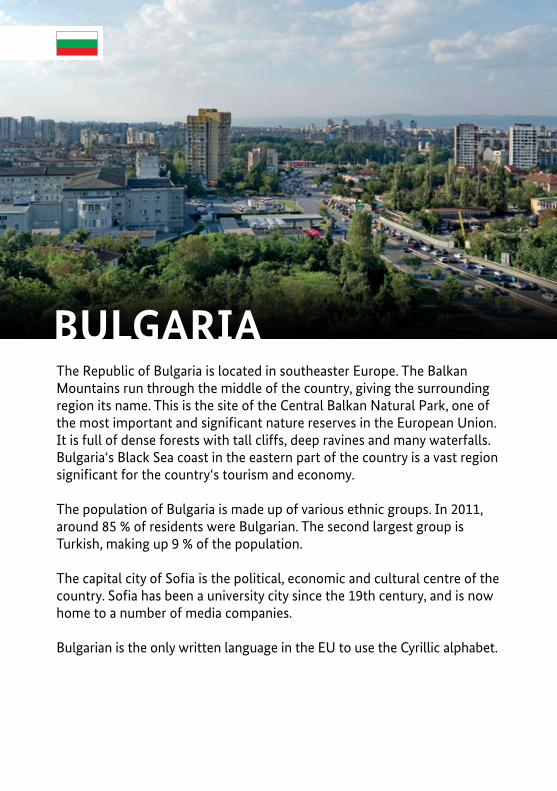
The Republic of Bulgaria is located in southeaster Europe. The Balkan Mountains run through the middle of the country, giving the surrounding region its name. This is the site of the Central Balkan Natural Park, one of the most important and significant nature reserves in the European Union. It is full of dense forests with tall cliffs, deep ravines and many waterfalls. Bulgaria‘s Black Sea coast in the eastern part of the country is a vast region significant for the country‘s tourism and economy.
The population of Bulgaria is made up of various ethnic groups. In 2011, around 85 % of residents were Bulgarian. The second largest group is Turkish, making up 9 % of the population.
The capital city of Sofia is the political, economic and cultural centre of the country. Sofia has been a university city since the 19th century, and is now home to a number of media companies.
Bulgarian is the only written language in the EU to use the Cyrillic alphabet.
BULGARIA
55Bulgaria
Area (2013): 110,900 km2
Administrative structure: 28 districts
Geography: Located in the east of the Balkan Peninsula, on the Black Sea; plateaus and mountains in the south; highest peak: Musala (2,925 m)
Official name:Republika Bălgarija (Република България)
Official language: Bulgarian
Capital: Sofia (1.3 million residents, 2015)
Population (2014): 7.2 million
Population density (2014): 66.7 inhabitants per km²
Currency: Lew
Government website: http://www.government.bg/
National holiday: 3 March: Liberation Day, Treaty of San Stefano, 1878
55
European Overview56
* Provisional value
Political system: Parliamentary republic; parliament: National Assembly, elected every four years; direct presidential elections every five years; right to vote as of age 18
Joined EU in: 2007
Population in percent of the total population of the EU (2015):1.4 percent*
Memberships: EU, Nato, OSZE, UNO
Seats in the European Parliament: 17
Commissioner in the European Commission:Kristalina Georgieva (Vice-President of the Commission)Department: Budget and Human Resources
Head of government: Bojko Borissow
Head of state: Rossen Plewneliew
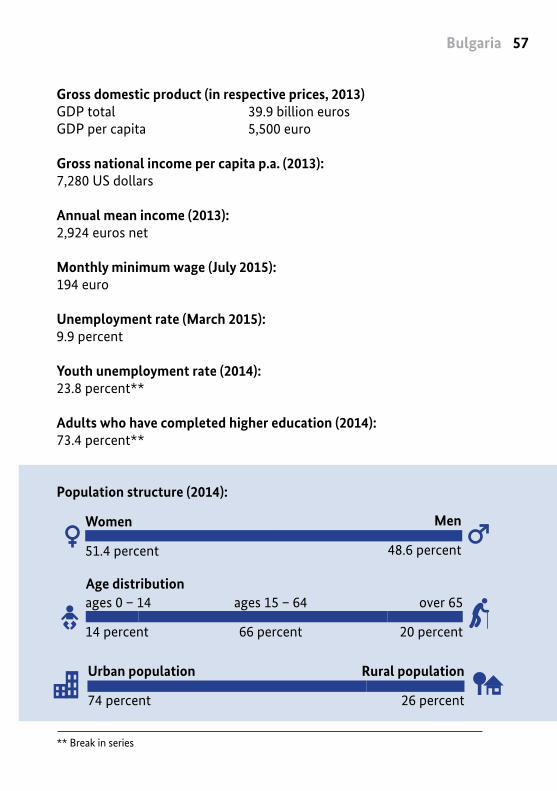
57Bulgaria
** Break in series
Rural population
26 percent
Urban population 74 percent
over 65
20 percent
ages 15 – 64
66 percent
ages 0 – 14
14 percent
Men
48.6 percent
Women
51.4 percent
Gross domestic product (in respective prices, 2013)GDP total 39.9 billion eurosGDP per capita 5,500 euro
Gross national income per capita p.a. (2013):7,280 US dollars
Annual mean income (2013):2,924 euros net
Monthly minimum wage (July 2015): 194 euro
Unemployment rate (March 2015): 9.9 percent
Youth unemployment rate (2014): 23.8 percent**
Adults who have completed higher education (2014):73.4 percent**
Population structure (2014):
Age distribution
European Overview58
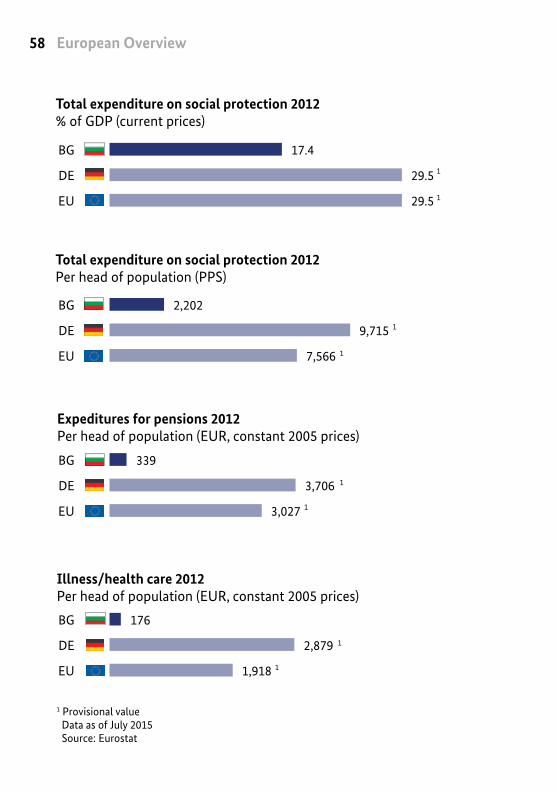
1 Provisional value Data as of July 2015 Source: Eurostat
17.4
29.5
29.5
BG
DE
EU 1
176
2,879
1,918
BG
DE
EU
1
1
2,202
9,715
7,566
BG
DE
EU
1
1
339
3,706
3,027
BG
DE
EU
1
1
BG
DE
EU
BG
DE
EU
BG
DE
EU
BG
DE
EU
1
Total expenditure on social protection 2012% of GDP (current prices)
Illness/health care 2012Per head of population (EUR, constant 2005 prices)
Expeditures for pensions 2012Per head of population (EUR, constant 2005 prices)
Total expenditure on social protection 2012Per head of population (PPS)
59Bulgaria
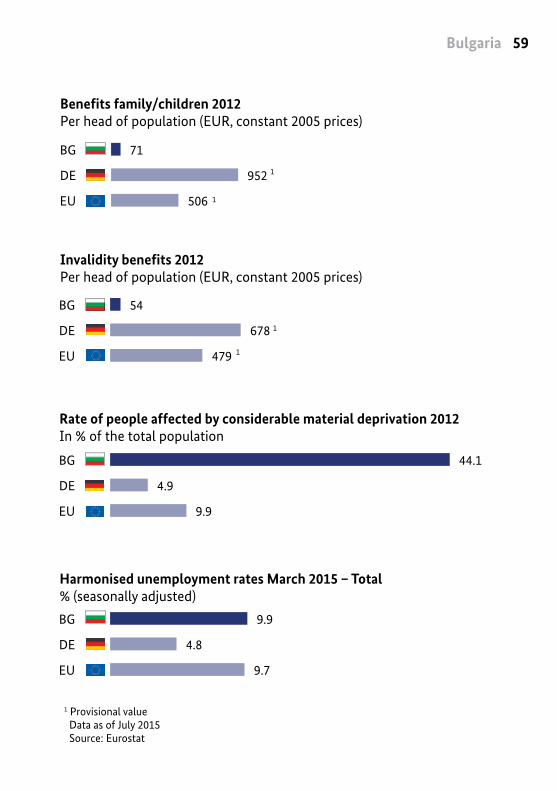
1 Provisional value Data as of July 2015 Source: Eurostat
71
952
506
BG
DE
EU
1
1
54
678
479
BG
DE
EU
1
1
44.1
4.9
9.9
BG
DE
EU
9.9
4.8
9.7
BG
DE
EU
Harmonised unemployment rates March 2015 – Total% (seasonally adjusted)
Invalidity benefits 2012Per head of population (EUR, constant 2005 prices)
Benefits family/children 2012Per head of population (EUR, constant 2005 prices)
Rate of people affected by considerable material deprivation 2012In % of the total population
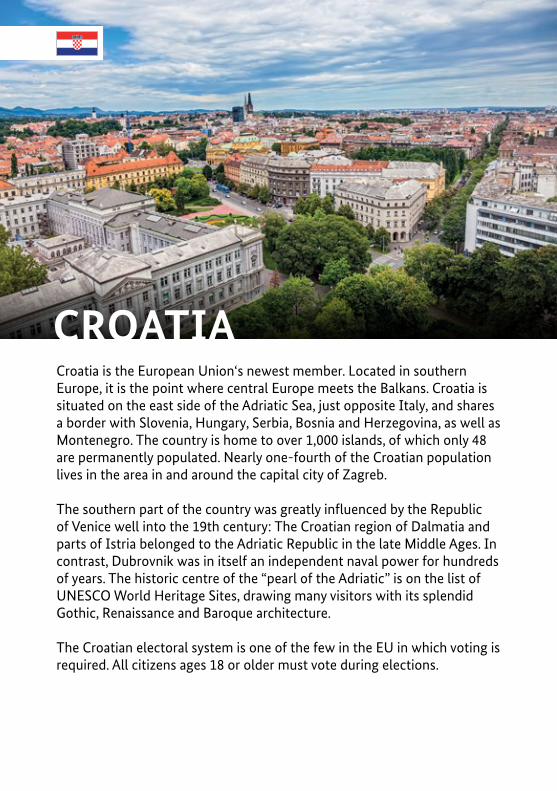
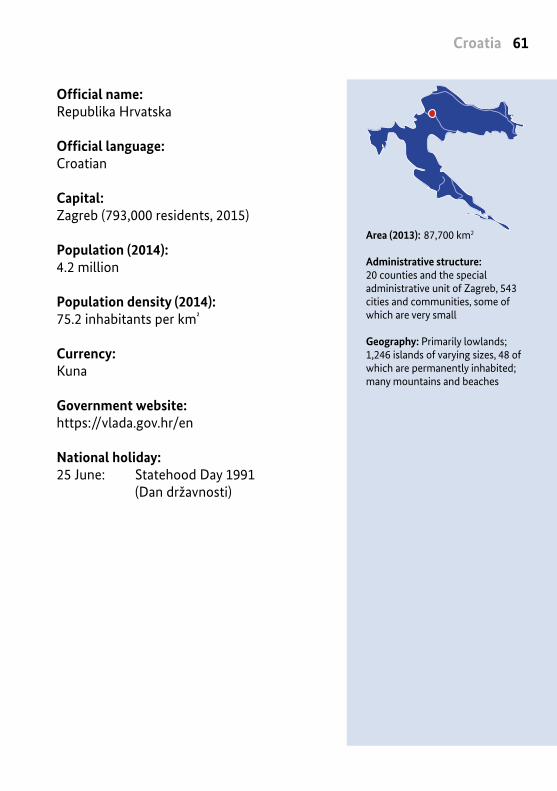
CROATIACroatia is the European Union‘s newest member. Located in southern Europe, it is the point where central Europe meets the Balkans. Croatia is situated on the east side of the Adriatic Sea, just opposite Italy, and shares a border with Slovenia, Hungary, Serbia, Bosnia and Herzegovina, as well as Montenegro. The country is home to over 1,000 islands, of which only 48 are permanently populated. Nearly one-fourth of the Croatian population lives in the area in and around the capital city of Zagreb.
The southern part of the country was greatly influenced by the Republic of Venice well into the 19th century: The Croatian region of Dalmatia and parts of Istria belonged to the Adriatic Republic in the late Middle Ages. In contrast, Dubrovnik was in itself an independent naval power for hundreds of years. The historic centre of the “pearl of the Adriatic” is on the list of UNESCO World Heritage Sites, drawing many visitors with its splendid Gothic, Renaissance and Baroque architecture.
The Croatian electoral system is one of the few in the EU in which voting is required. All citizens ages 18 or older must vote during elections.
61Croatia
Area (2013): 87,700 km2
Administrative structure: 20 counties and the special administrative unit of Zagreb, 543 cities and communities, some of which are very small
Geography: Primarily lowlands; 1,246 islands of varying sizes, 48 of which are permanently inhabited; many mountains and beaches
Official name:Republika Hrvatska
Official language: Croatian
Capital: Zagreb (793,000 residents, 2015)
Population (2014): 4.2 million
Population density (2014): 75.2 inhabitants per km²
Currency: Kuna
Government website: https://vlada.gov.hr/en
National holiday: 25 June: Statehood Day 1991 (Dan državnosti)
European Overview62
* Provisional value
Head of state: Kolinda Grabar-Kitarović
Political system: Parliamentary democracy; one chamber; elected every four years; presidential elections every five years; compulsory voting as of age 18
Joined EU in: 2013
Population in percent of the total population of the EU (2015):0.8 percent*
Memberships: EU, Nato, OSZE, UNO
Seats in the European Parliament: 11
Commissioner in the European Commission:Neven MimicaDepartment: International Cooperation and Development
Head of government: Zoran Milanović

63Croatia
** Break in series
Age distribution
Population structure (2014):
Rural population
41 percent
Urban population 59 percent
ages 0 – 14
15 percent
ages 15 – 64
66 percent
over 65
19 percent
Men
48.2 percent
Women
51.8 percent
Gross domestic product (in respective prices, 2013)GDP total 43.1 billion eurosGDP per capita 10,100 euro
Gross national income per capita p.a. (2013):13,470 US dollars
Annual mean income (2013):5,078 euros net
Monthly minimum wage (July 2015): 399 euro
Unemployment rate (March 2015): 16.7 percent
Youth unemployment rate (2014): 45.5 percent**
Adults who have completed higher education (2014):91.2 percent**
European Overview64
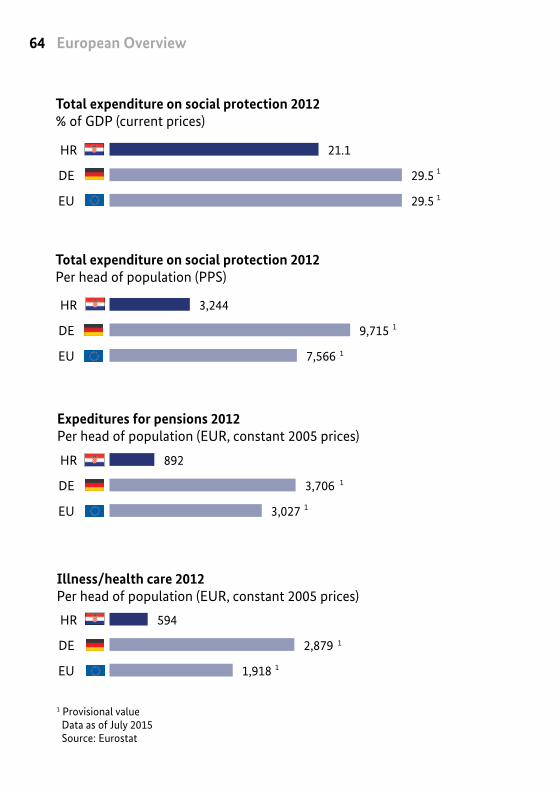
1 Provisional value Data as of July 2015 Source: Eurostat
21.1
29.5
29.5
HR
DE
EU 1
594
2,879
1,918
HR
DE
EU
1
1
3,244
9,715
7,566
HR
DE
EU
1
1
892
3,706
3,027
HR
DE
EU
1
1
EU
DE
EU
DE
EU
DE
EU
1
Total expenditure on social protection 2012% of GDP (current prices)
Illness/health care 2012Per head of population (EUR, constant 2005 prices)
Expeditures for pensions 2012Per head of population (EUR, constant 2005 prices)
Total expenditure on social protection 2012Per head of population (PPS)
65Croatia
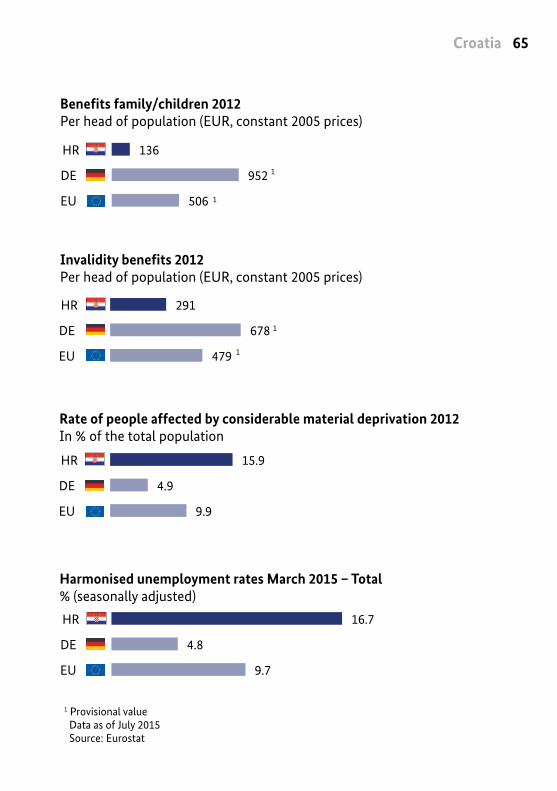
1 Provisional value Data as of July 2015 Source: Eurostat
136
952
506
HR
DE
EU
1
1
291
678
479
HR
DE
EU
1
1
15.9
4.9
9.9
HR
DE
EU
16.7
4.8
9.7
HR
DE
EU
Harmonised unemployment rates March 2015 – Total% (seasonally adjusted)
Invalidity benefits 2012Per head of population (EUR, constant 2005 prices)
Benefits family/children 2012Per head of population (EUR, constant 2005 prices)
Rate of people affected by considerable material deprivation 2012In % of the total population
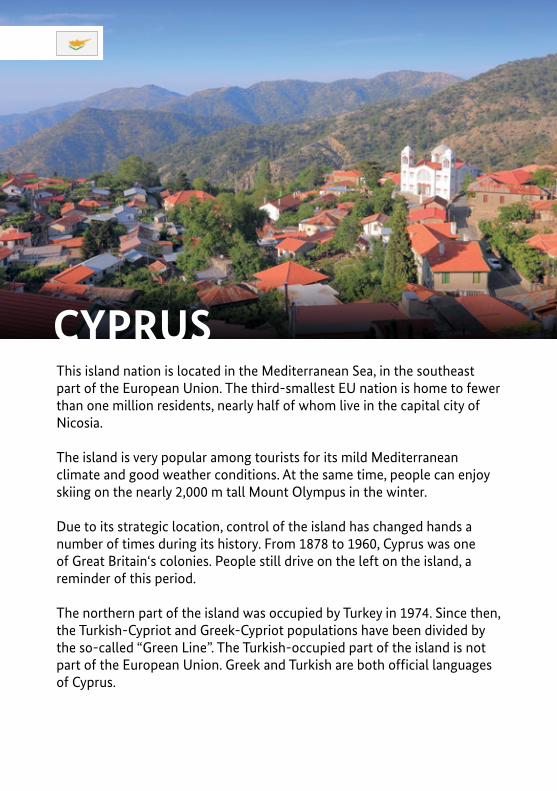
CYPRUSThis island nation is located in the Mediterranean Sea, in the southeast part of the European Union. The third-smallest EU nation is home to fewer than one million residents, nearly half of whom live in the capital city of Nicosia.
The island is very popular among tourists for its mild Mediterranean climate and good weather conditions. At the same time, people can enjoy skiing on the nearly 2,000 m tall Mount Olympus in the winter.
Due to its strategic location, control of the island has changed hands a number of times during its history. From 1878 to 1960, Cyprus was one of Great Britain‘s colonies. People still drive on the left on the island, a reminder of this period.
The northern part of the island was occupied by Turkey in 1974. Since then, the Turkish-Cypriot and Greek-Cypriot populations have been divided by the so-called “Green Line”. The Turkish-occupied part of the island is not part of the European Union. Greek and Turkish are both official languages of Cyprus.
67Cyprus
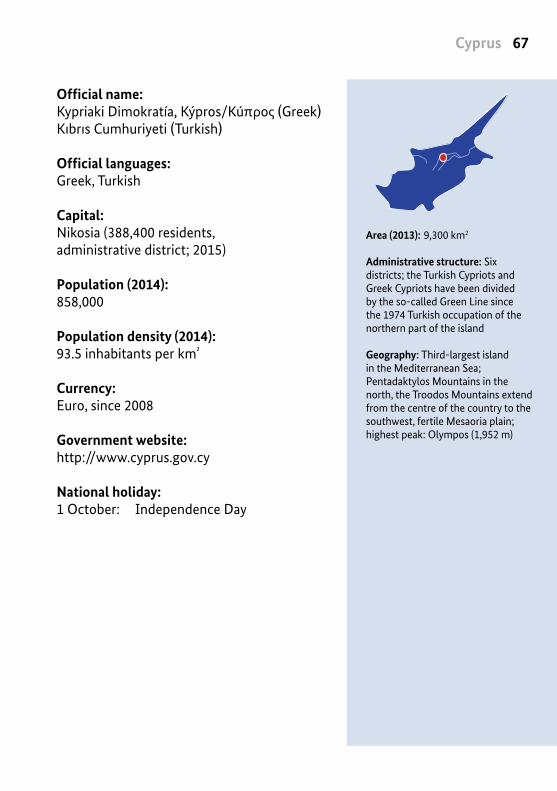
Area (2013): 9,300 km2
Administrative structure: Six districts; the Turkish Cypriots and Greek Cypriots have been divided by the so-called Green Line since the 1974 Turkish occupation of the northern part of the island
Geography: Third-largest island in the Mediterranean Sea; Pentadaktylos Mountains in the north, the Troodos Mountains extend from the centre of the country to the southwest, fertile Mesaoria plain; highest peak: Olympos (1,952 m)
Official name:Kypriaki Dimokratía, Kýpros/Kúπρoς (Greek)Kıbrıs Cumhuriyeti (Turkish)
Official languages: Greek, Turkish
Capital: Nikosia (388,400 residents, administrative district; 2015)
Population (2014): 858,000
Population density (2014): 93.5 inhabitants per km²
Currency: Euro, since 2008
Government website: http://www.cyprus.gov.cy
National holiday: 1 October: Independence Day
European Overview68
* Provisional value
Head of State and Head of government: Nikos Anastasiades
Political system: Parliamentary presidential republic; parliamentary elections every five years; direct presidential elections every five years; compulsory voting as of age 18
Joined EU in: 2004
Population in percent of the total population of the EU (2015):0.2 percent*
Memberships: EU, OSZE, UNO
Seats in the European Parliament: 6
Commissioner in the European Commission:Christos StylianidesDepartment: Humanitarian Aid and Crisis Management
69Cyprus
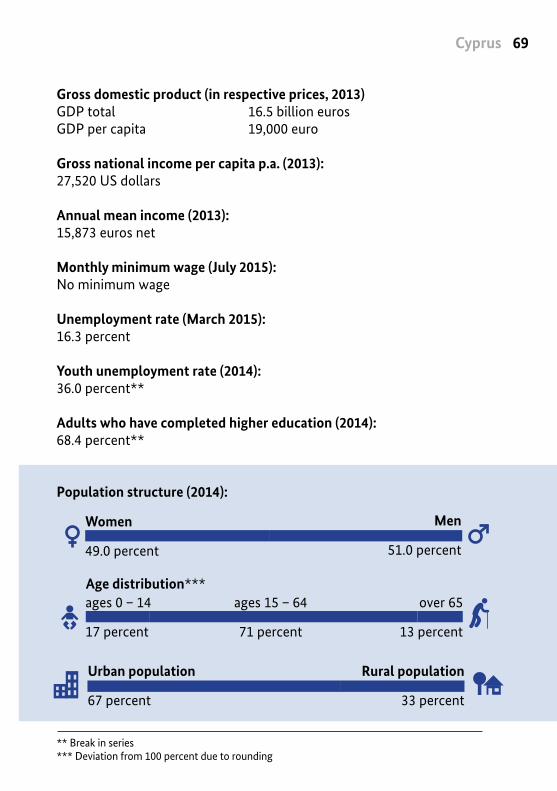
Population structure (2014):
Age distribution***
Rural population
33 percent
Urban population 67 percent
ages 0 – 14
17 percent
ages 15 – 64
71 percent
over 65
13 percent
Men
51.0 percent
Women
49.0 percent
Gross domestic product (in respective prices, 2013)GDP total 16.5 billion eurosGDP per capita 19,000 euro
Gross national income per capita p.a. (2013):27,520 US dollars
Annual mean income (2013):15,873 euros net
Monthly minimum wage (July 2015): No minimum wage
Unemployment rate (March 2015): 16.3 percent
Youth unemployment rate (2014): 36.0 percent**
Adults who have completed higher education (2014):68.4 percent**
** Break in series*** Deviation from 100 percent due to rounding
European Overview70
1 Provisional value Data as of July 2015 Source: Eurostat
23.1
29.5
29.5
CY
DE
EU 1
848
2,879
1,918
CY
DE
EU
1
1
5,323
9,715
7,566
CY
DE
EU
1
1
1,627
3,706
3,027
CY
DE
EU
1
1
DE
EU
CY
DE
EU
CY
DE
EU
CY
DE
EU
1
Total expenditure on social protection 2012% of GDP (current prices)
Illness/health care 2012Per head of population (EUR, constant 2005 prices)
Expeditures for pensions 2012Per head of population (EUR, constant 2005 prices)
Total expenditure on social protection 2012Per head of population (PPS)
71Cyprus
1 Provisional value Data as of July 2015 Source: Eurostat
278
952
506
CY
DE
EU
1
1
134
678
479
CY
DE
EU
1
1
15.0
4.9
9.9
CY
DE
EU
16.3
4.8
9.7
CY
DE
EU
Harmonised unemployment rates March 2015 – Total% (seasonally adjusted)
Invalidity benefits 2012Per head of population (EUR, constant 2005 prices)
Benefits family/children 2012Per head of population (EUR, constant 2005 prices)
Rate of people affected by considerable material deprivation 2012In % of the total population
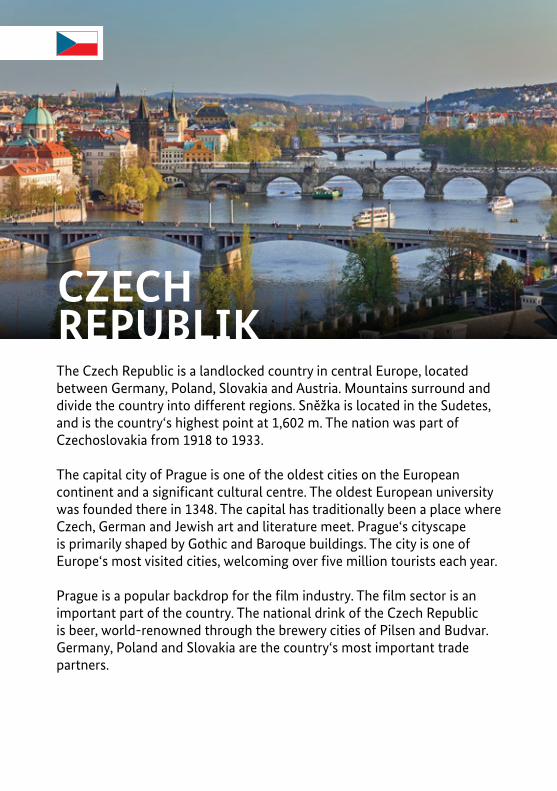
CZECH REPUBLIKThe Czech Republic is a landlocked country in central Europe, located between Germany, Poland, Slovakia and Austria. Mountains surround and divide the country into different regions. Sněžka is located in the Sudetes, and is the country‘s highest point at 1,602 m. The nation was part of Czechoslovakia from 1918 to 1933.
The capital city of Prague is one of the oldest cities on the European continent and a significant cultural centre. The oldest European university was founded there in 1348. The capital has traditionally been a place where Czech, German and Jewish art and literature meet. Prague‘s cityscape is primarily shaped by Gothic and Baroque buildings. The city is one of Europe‘s most visited cities, welcoming over five million tourists each year.
Prague is a popular backdrop for the film industry. The film sector is an important part of the country. The national drink of the Czech Republic is beer, world-renowned through the brewery cities of Pilsen and Budvar. Germany, Poland and Slovakia are the country‘s most important trade partners.
73Czech Republik
Area (2013): 78,900 km2
Administrative structure: 14 regions
Geography: Hills and mountains cover 95 percent of the country: southwest: Bohemian Forest, northwest: Ore Mountains, north: Sudetes Mountains; highest peak: Sněžka (1,602 m)
Official name:Česká republika
Official language: Czech
Capital: Prag (1.3 million residents, 2015)
Population (2014): 10.5 million
Population density (2014): 136.1 inhabitants per km²
Currency: Czech koruna
Government website: http://www.vlada.cz/en/
National holiday: 28 October: St. Wenceslas Day Czechoslovak declaration of independence (Den vzniku samostatného československého státu)
European Overview74
* Provisional value
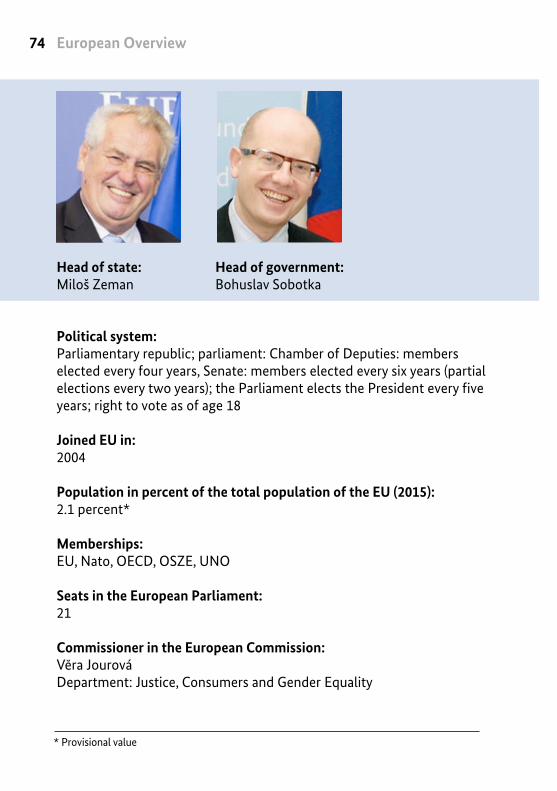
Head of government: Bohuslav Sobotka
Head of state: Miloš Zeman
Political system: Parliamentary republic; parliament: Chamber of Deputies: members elected every four years, Senate: members elected every six years (partial elections every two years); the Parliament elects the President every five years; right to vote as of age 18
Joined EU in: 2004
Population in percent of the total population of the EU (2015):2.1 percent*
Memberships: EU, Nato, OECD, OSZE, UNO
Seats in the European Parliament: 21
Commissioner in the European Commission:Vĕra JourováDepartment: Justice, Consumers and Gender Equality

75Czech Republik
Population structure (2014):
** Break in series*** Deviation from 100 percent due to rounding
Age distribution***
Rural population
27 percent
Urban population 73 percent
ages 0 – 14
15 percent
ages 15 – 64
68 percent
over 65
18 percent
Men
49.1 percent
Women
50.9 percent
Gross domestic product (in respective prices, 2013)GDP total 149.5 billion eurosGDP per capita 14,200 euro
Gross national income per capita p.a. (2013):18,970 US dollars
Annual mean income (2013):7,694 euros net
Monthly minimum wage (July 2015): 338 euro
Unemployment rate (March 2015): 5.9 percent
Youth unemployment rate (2014): 15.9 percent**
Adults who have completed higher education (2014):72.7 percent**

European Overview76
1 Provisional value Data as of July 2015 Source: Eurostat
20.8
29.5
29.5
CZ
DE
EU 1
690
2,879
1,918
CZ
DE
EU
1
1
4,460
9,715
7,566
CZ
DE
EU
1
1
1,066
3,706
3,027
CZ
DE
EU
1
1
DE
EU
CZ
DE
EU
CZ
DE
EU
CZ
DE
EU
1
Total expenditure on social protection 2012% of GDP (current prices)
Illness/health care 2012Per head of population (EUR, constant 2005 prices)
Expeditures for pensions 2012Per head of population (EUR, constant 2005 prices)
Total expenditure on social protection 2012Per head of population (PPS)
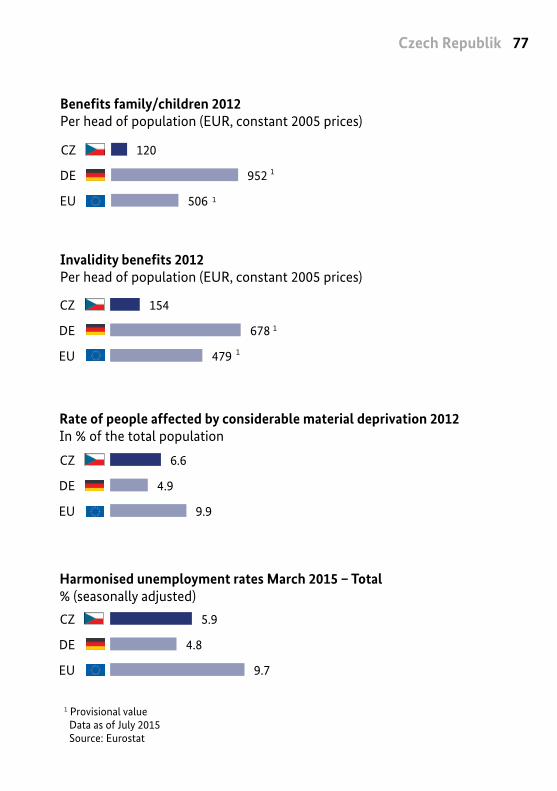
77Czech Republik
1 Provisional value Data as of July 2015 Source: Eurostat
120
952
506
CZ
DE
EU
1
1
154
678
479
CZ
DE
EU
1
1
6.6
4.9
9.9
CZ
DE
EU
5.9
4.8
9.7
CZ
DE
EU
Harmonised unemployment rates March 2015 – Total% (seasonally adjusted)
Invalidity benefits 2012Per head of population (EUR, constant 2005 prices)
Benefits family/children 2012Per head of population (EUR, constant 2005 prices)
Rate of people affected by considerable material deprivation 2012In % of the total population
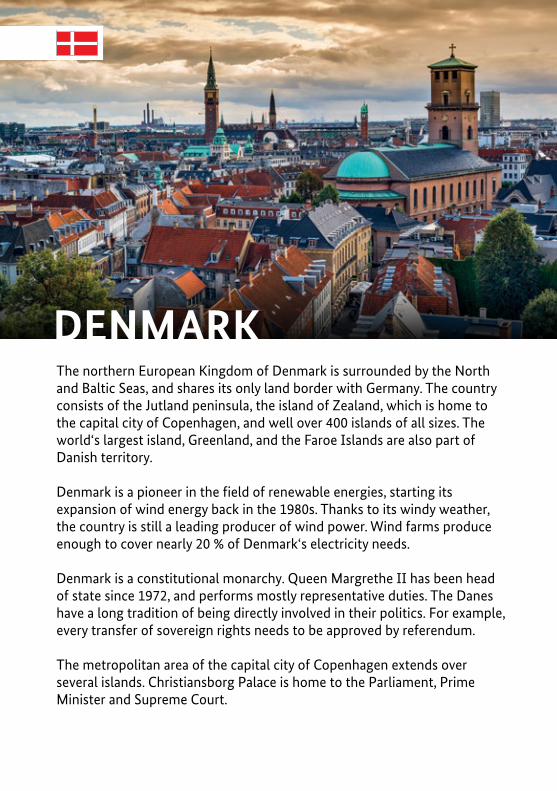
DENMARKThe northern European Kingdom of Denmark is surrounded by the North and Baltic Seas, and shares its only land border with Germany. The country consists of the Jutland peninsula, the island of Zealand, which is home to the capital city of Copenhagen, and well over 400 islands of all sizes. The world‘s largest island, Greenland, and the Faroe Islands are also part of Danish territory.
Denmark is a pioneer in the field of renewable energies, starting its expansion of wind energy back in the 1980s. Thanks to its windy weather, the country is still a leading producer of wind power. Wind farms produce enough to cover nearly 20 % of Denmark‘s electricity needs.
Denmark is a constitutional monarchy. Queen Margrethe II has been head of state since 1972, and performs mostly representative duties. The Danes have a long tradition of being directly involved in their politics. For example, every transfer of sovereign rights needs to be approved by referendum.
The metropolitan area of the capital city of Copenhagen extends over several islands. Christiansborg Palace is home to the Parliament, Prime Minister and Supreme Court.
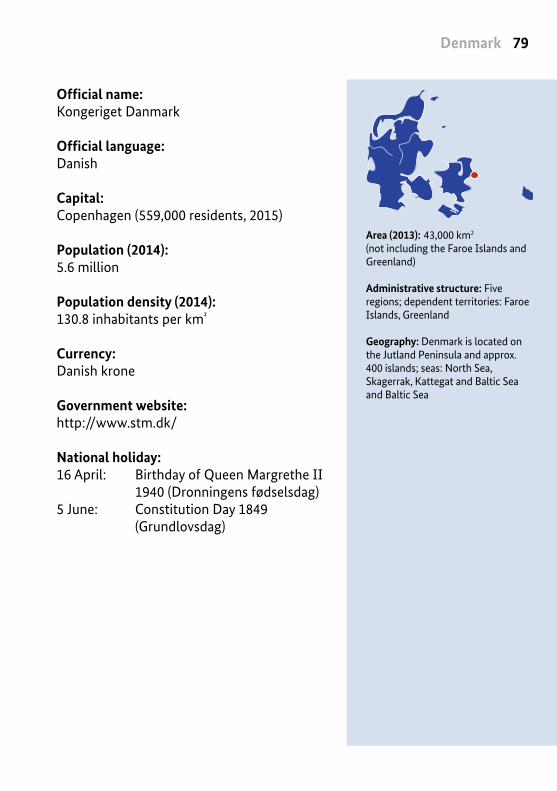
79Denmark
Area (2013): 43,000 km2 (not including the Faroe Islands and Greenland)
Administrative structure: Five regions; dependent territories: Faroe Islands, Greenland
Geography: Denmark is located on the Jutland Peninsula and approx. 400 islands; seas: North Sea, Skagerrak, Kattegat and Baltic Sea and Baltic Sea
Official name:Kongeriget Danmark
Official language: Danish
Capital: Copenhagen (559,000 residents, 2015)
Population (2014): 5.6 million
Population density (2014): 130.8 inhabitants per km²
Currency: Danish krone
Government website: http://www.stm.dk/
National holiday: 16 April: Birthday of Queen Margrethe II 1940 (Dronningens fødselsdag)5 June: Constitution Day 1849 (Grundlovsdag)
European Overview80
* Provisional value
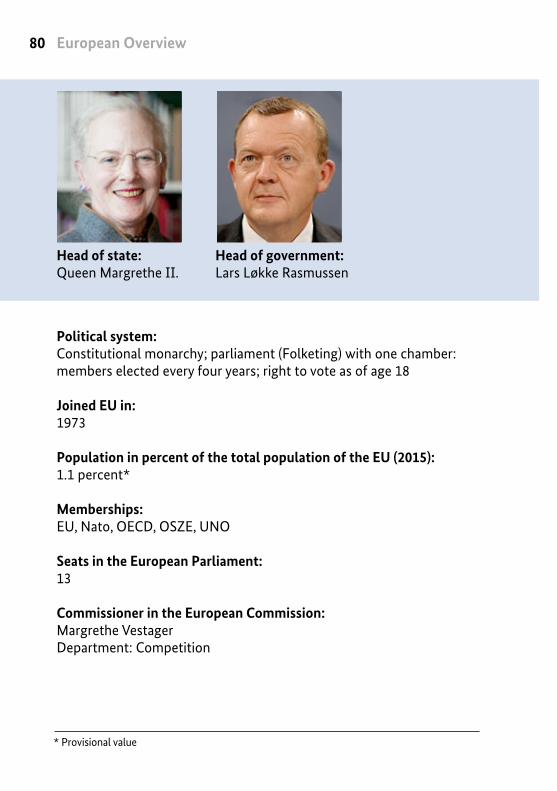
Head of government: Lars Løkke Rasmussen
Head of state: Queen Margrethe II.
Political system: Constitutional monarchy; parliament (Folketing) with one chamber: members elected every four years; right to vote as of age 18
Joined EU in: 1973
Population in percent of the total population of the EU (2015):1.1 percent*
Memberships: EU, Nato, OECD, OSZE, UNO
Seats in the European Parliament: 13
Commissioner in the European Commission:Margrethe VestagerDepartment: Competition

81Denmark
** Break in series*** Deviation from 100 percent due to rounding
Urban population 88 percent
Rural population
12 percent
ages 0 – 14
17 percent
ages 15 – 64
64 percent
over 65
18 percent
Age distribution***
Women
50.4 percent
Men
49.6 percent
Population structure (2014):
Gross domestic product (in respective prices, 2013)GDP total 249.0 billion eurosGDP per capita 44,400 euro
Gross national income per capita p.a. (2013):61,740 US dollars
Annual mean income (2013):26,897 euros net
Monthly minimum wage (July 2015): No minimum wage
Unemployment rate (March 2015): 6.3 percent
Youth unemployment rate (2014): 12.6 percent**
Adults who have completed higher education (2014):72.5 percent**
European Overview82
1 Provisional value Data as of July 2015 Source: Eurostat
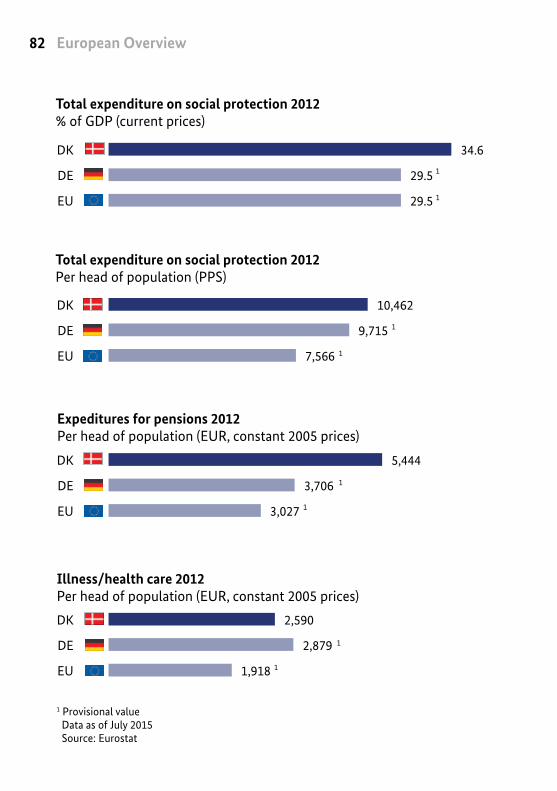
34.6
29.5
29.5
DK
DE
EU 1
2,590
2,879
1,918
DK
DE
EU
1
1
10,462
9,715
7,566
DK
DE
EU
1
1
5,444
3,706
3,027
DK
DE
EU
1
1
DK
DE
EU
DK
DE
EU
DK
DE
EU
DK
DE
EU
1
Total expenditure on social protection 2012% of GDP (current prices)
Illness/health care 2012Per head of population (EUR, constant 2005 prices)
Expeditures for pensions 2012Per head of population (EUR, constant 2005 prices)
Total expenditure on social protection 2012Per head of population (PPS)
83Denmark
1 Provisional value Data as of July 2015 Source: Eurostat
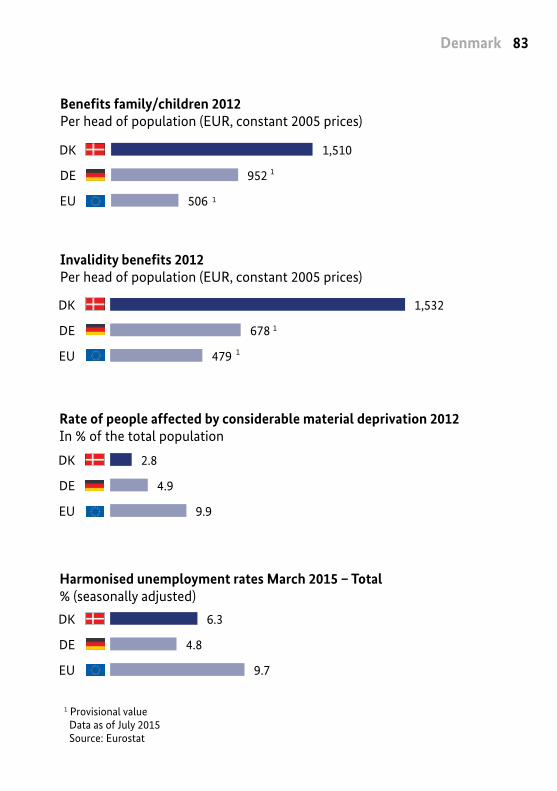
1,510
952
506
DK
DE
EU
1
1
1,532
678
479
DK
DE
EU
1
1
2.8
4.9
9.9
DK
DE
EU
6.3
4.8
9.7
DK
DE
EU
Harmonised unemployment rates March 2015 – Total% (seasonally adjusted)
Invalidity benefits 2012Per head of population (EUR, constant 2005 prices)
Benefits family/children 2012Per head of population (EUR, constant 2005 prices)
Rate of people affected by considerable material deprivation 2012In % of the total population
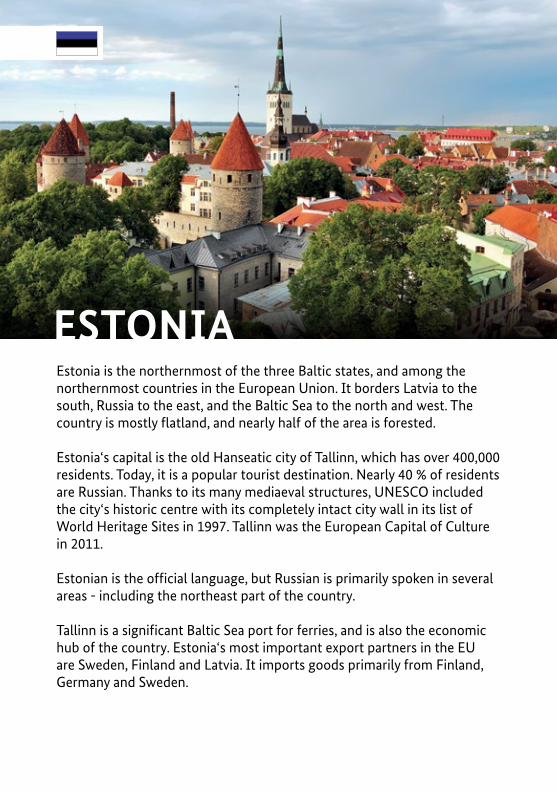
ESTONIAEstonia is the northernmost of the three Baltic states, and among the northernmost countries in the European Union. It borders Latvia to the south, Russia to the east, and the Baltic Sea to the north and west. The country is mostly flatland, and nearly half of the area is forested.
Estonia‘s capital is the old Hanseatic city of Tallinn, which has over 400,000 residents. Today, it is a popular tourist destination. Nearly 40 % of residents are Russian. Thanks to its many mediaeval structures, UNESCO included the city‘s historic centre with its completely intact city wall in its list of World Heritage Sites in 1997. Tallinn was the European Capital of Culture in 2011.
Estonian is the official language, but Russian is primarily spoken in several areas - including the northeast part of the country.
Tallinn is a significant Baltic Sea port for ferries, and is also the economic hub of the country. Estonia‘s most important export partners in the EU are Sweden, Finland and Latvia. It imports goods primarily from Finland, Germany and Sweden.
85Estonia
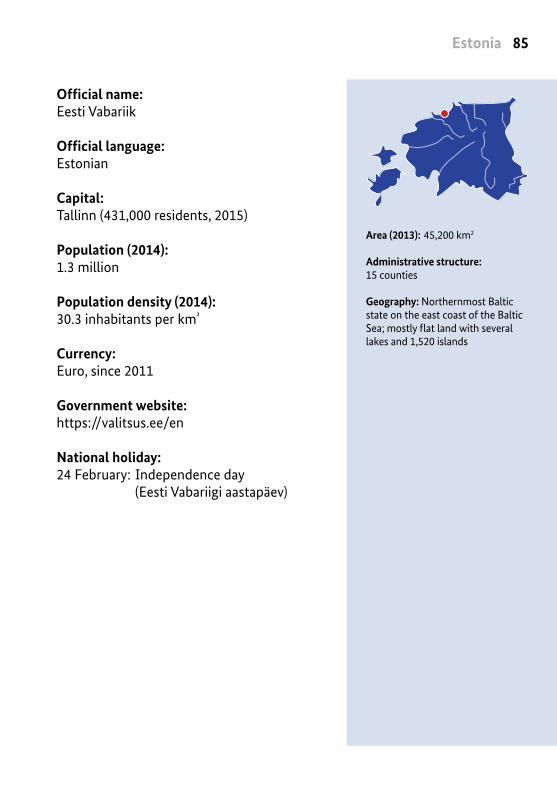
Area (2013): 45,200 km2
Administrative structure: 15 counties
Geography: Northernmost Baltic state on the east coast of the Baltic Sea; mostly flat land with several lakes and 1,520 islands
Official name:Eesti Vabariik
Official language: Estonian
Capital: Tallinn (431,000 residents, 2015)
Population (2014): 1.3 million
Population density (2014): 30.3 inhabitants per km²
Currency: Euro, since 2011
Government website: https://valitsus.ee/en
National holiday: 24 February: Independence day (Eesti Vabariigi aastapäev)
European Overview86
* Provisional value
Political system: Republic; parliament: legislative branch (Riigikogu), members are elected every four years; parliament elects the president every five years; right to vote as of age 18
Joined EU in: 2004
Population in percent of the total population of the EU (2015):0.3 percent*
Memberships: EU, Nato, OSZE, OECD, UNO
Seats in the European Parliament: 6
Commissioner in the European Commission:Andrus Ansip (Vice-President of the Commission)Department: Digital Single Market
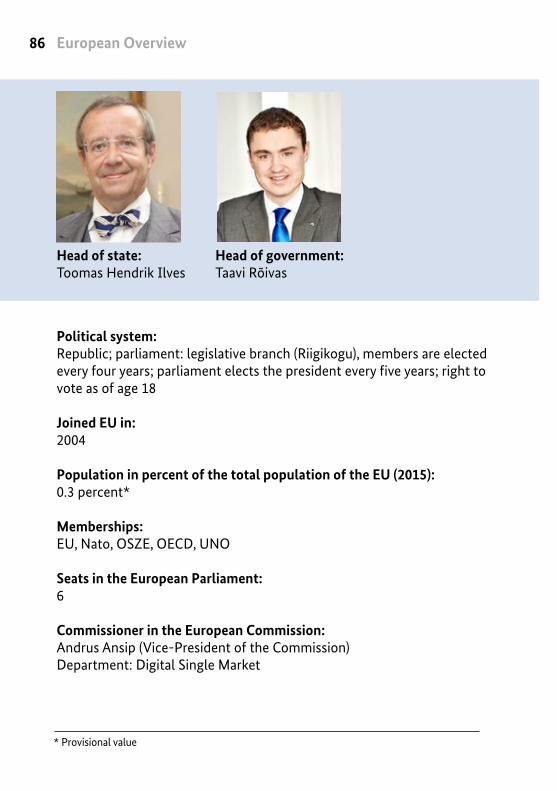
Head of state: Toomas Hendrik Ilves
Head of government: Taavi Rõivas

87Estonia
** Break in series*** Deviation from 100 percent due to rounding
Urban population 68 percent
Rural population
32 percent
ages 0 – 14
16 percent
ages 15 – 64
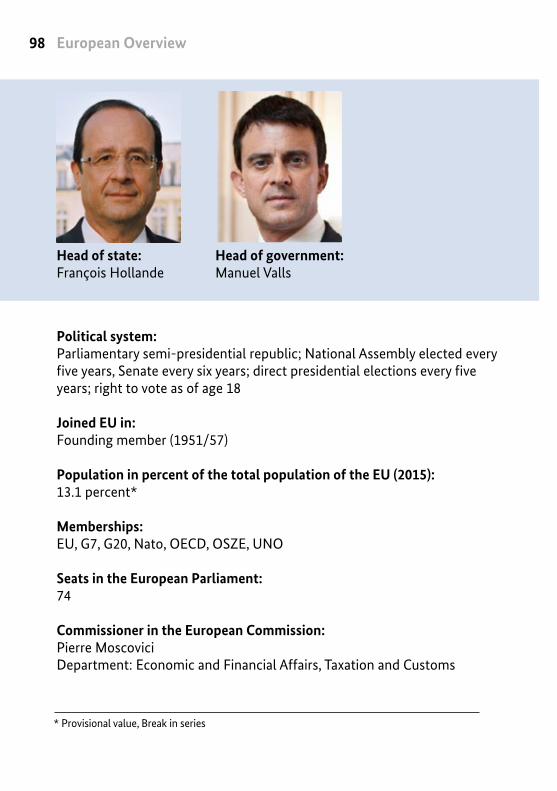
66 percent
over 65
19 percent
Age distribution***
Women
53.2 percent
Men
46.8 percent
Population structure (2014):
Gross domestic product (in respective prices, 2013)GDP total 18.6 billion eurosGDP per capita 13,900 euro
Gross national income per capita p.a. (2013):17,970 US dollars
Annual mean income (2013):6,579 euros net
Monthly minimum wage (July 2015): 390 euro
Unemployment rate (March 2015): 6.2 percent
Youth unemployment rate (2014): 15.0 percent**
Adults who have completed higher education (2014):73.6 percent**
European Overview88
1 Provisional value Data as of July 2015 Source: Eurostat
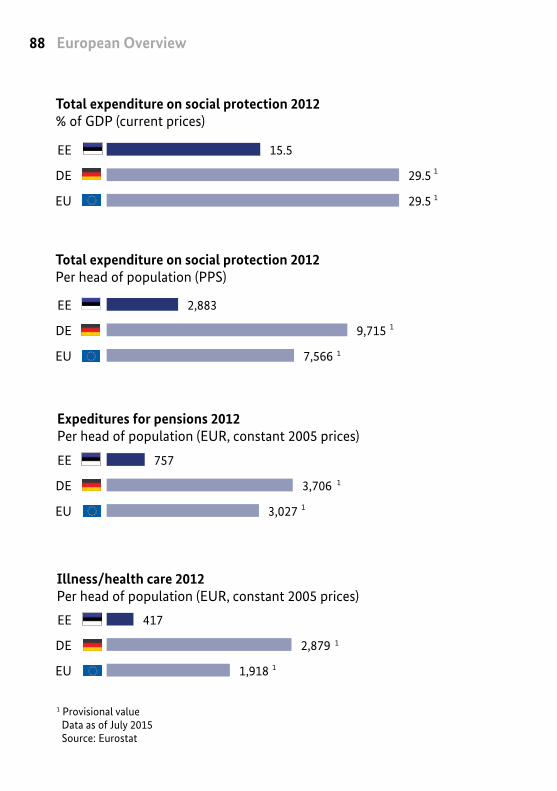
15.5
29.5
29.5
EE
DE
EU 1
417
2,879
1,918
EE
DE
EU
1
1
2,883
9,715
7,566
EE
DE
EU
1
1
757
3,706
3,027
EE
DE
EU
1
1
DE
EU
DE
EU
DE
EU
EE
DE
EU
1
Total expenditure on social protection 2012% of GDP (current prices)
Illness/health care 2012Per head of population (EUR, constant 2005 prices)
Expeditures for pensions 2012Per head of population (EUR, constant 2005 prices)
Total expenditure on social protection 2012Per head of population (PPS)

89Estonia
1 Provisional value Data as of July 2015 Source: Eurostat
170
952
506
EE
DE
EU
1
1
174
678
479
EE
DE
EU
1
1
9.4
4.9
9.9
EE
DE
EU
6.2
4.8
9.7
EE
DE
EU
Harmonised unemployment rates March 2015 – Total% (seasonally adjusted)
Invalidity benefits 2012Per head of population (EUR, constant 2005 prices)
Benefits family/children 2012Per head of population (EUR, constant 2005 prices)
Rate of people affected by considerable material deprivation 2012In % of the total population
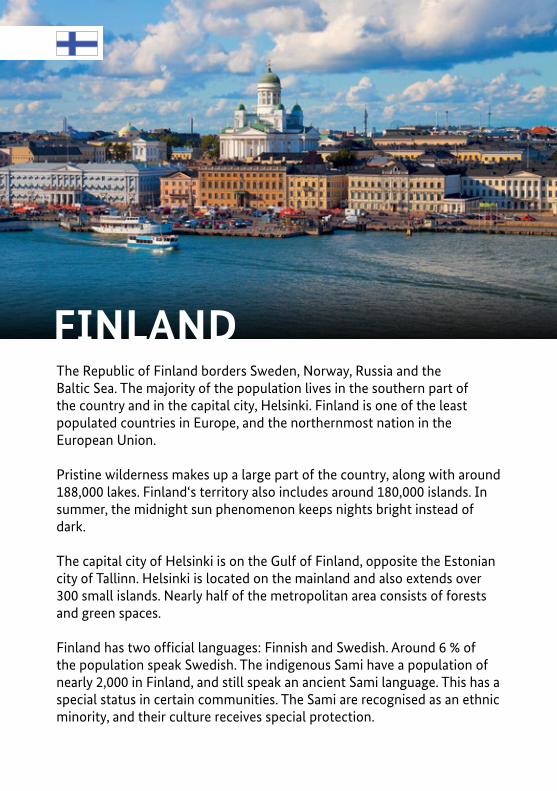
The Republic of Finland borders Sweden, Norway, Russia and the Baltic Sea. The majority of the population lives in the southern part of the country and in the capital city, Helsinki. Finland is one of the least populated countries in Europe, and the northernmost nation in the European Union.
Pristine wilderness makes up a large part of the country, along with around 188,000 lakes. Finland‘s territory also includes around 180,000 islands. In summer, the midnight sun phenomenon keeps nights bright instead of dark.
The capital city of Helsinki is on the Gulf of Finland, opposite the Estonian city of Tallinn. Helsinki is located on the mainland and also extends over 300 small islands. Nearly half of the metropolitan area consists of forests and green spaces.
Finland has two official languages: Finnish and Swedish. Around 6 % of the population speak Swedish. The indigenous Sami have a population of nearly 2,000 in Finland, and still speak an ancient Sami language. This has a special status in certain communities. The Sami are recognised as an ethnic minority, and their culture receives special protection.
FINLAND
91Finland
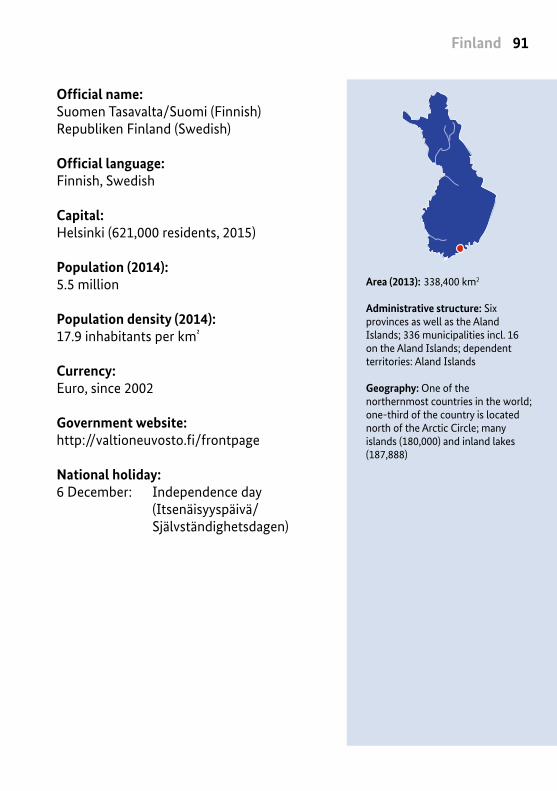
Area (2013): 338,400 km2
Administrative structure: Six provinces as well as the Aland Islands; 336 municipalities incl. 16 on the Aland Islands; dependent territories: Aland Islands
Geography: One of the northernmost countries in the world; one-third of the country is located north of the Arctic Circle; many islands (180,000) and inland lakes (187,888)
Official name:Suomen Tasavalta/Suomi (Finnish)Republiken Finland (Swedish)
Official language: Finnish, Swedish
Capital: Helsinki (621,000 residents, 2015)
Population (2014): 5.5 million
Population density (2014): 17.9 inhabitants per km²
Currency: Euro, since 2002
Government website: http://valtioneuvosto.fi/frontpage
National holiday: 6 December: Independence day (Itsenäisyyspäivä/ Självständighetsdagen)
European Overview92
* Provisional value
Head of government: Juha Sipilä
Head of state: Sauli Niinistö
Political system: Parliamentary republic; parliamentary elections every four years; direct presidential elections every six years; right to vote as of age 18
Joined EU in: 1995
Population in percent of the total population of the EU (2015):1.1 percent*
Memberships: EU, OECD, OSZE, UNO
Seats in the European Parliament: 13
Commissioner in the European Commission:Jyrki Katainen (Vice-President of the Commission)Department: Jobs, Growth, Investment and Competitiveness

93Finland
** Break in series
Age distribution
Rural population
16 percent
Urban population 84 percent
ages 0 – 14
16 percent
ages 15 – 64
64 percent
over 65
20 percent
Men
49.2 percent
Women
50.8 percent
Population structure (2014):
Gross domestic product (in respective prices, 2013)GDP total 193.4 billion eurosGDP per capita 35,600 euro
Gross national income per capita p.a. (2013):48,910 US dollars
Annual mean income (2013):23,272 euros net
Monthly minimum wage (July 2015): No minimum wage
Unemployment rate (March 2015): 9.3 percent
Youth unemployment rate (2014): 20.5 percent**
Adults who have completed higher education (2014):90.5 percent**

European Overview94
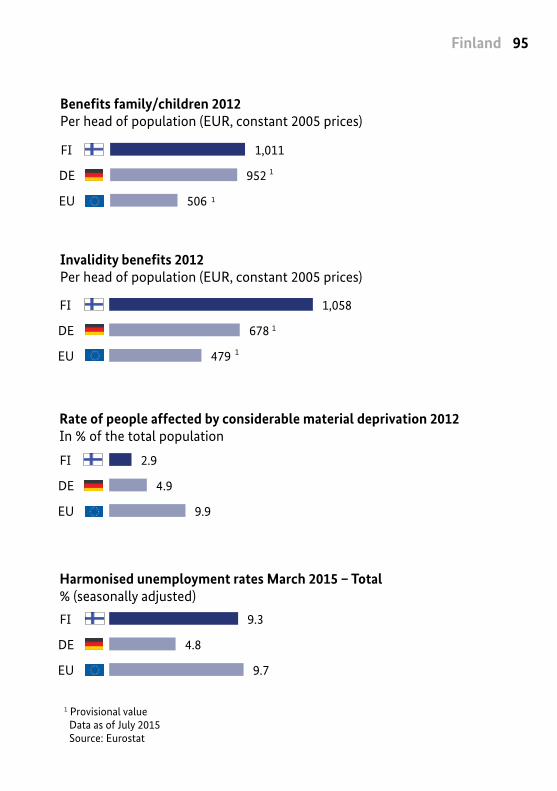
1 Provisional value Data as of July 2015 Source: Eurostat
1,011
952
506
FI
DE
EU
1
1
1,058
678
479
FI
DE
EU
1
1
2.9
4.9
9.9
FI
DE
EU
9.3
4.8
9.7
FI
DE
EU
31.2
29.5
29.5
FI
DE
EU 1
2,313
2,879
1,918
FI
DE
EU
1
1
9,036
9,715
7,566
FI
DE
EU
1
1
3,917
3,706
3,027
FI
DE
EU
1
1
DE
EU
DE
EU
DE
EU
DE
EU
1
Total expenditure on social protection 2012% of GDP (current prices)
Illness/health care 2012Per head of population (EUR, constant 2005 prices)
Expeditures for pensions 2012Per head of population (EUR, constant 2005 prices)
Total expenditure on social protection 2012Per head of population (PPS)
95Finland
1 Provisional value Data as of July 2015 Source: Eurostat
1,011
952
506
FI
DE
EU
1
1
1,058
678
479
FI
DE
EU
1
1
2.9
4.9
9.9
FI
DE
EU
9.3
4.8
9.7
FI
DE
EU
Harmonised unemployment rates March 2015 – Total% (seasonally adjusted)
Invalidity benefits 2012Per head of population (EUR, constant 2005 prices)
Benefits family/children 2012Per head of population (EUR, constant 2005 prices)
Rate of people affected by considerable material deprivation 2012In % of the total population
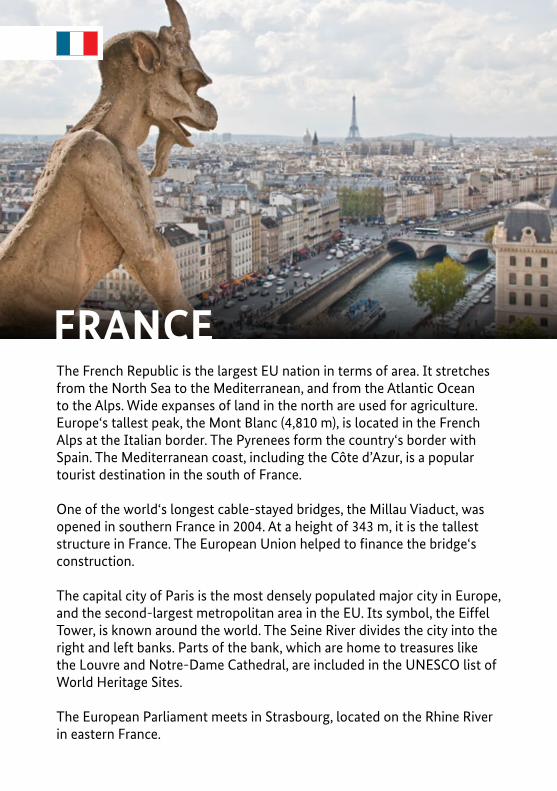
FRANCEThe French Republic is the largest EU nation in terms of area. It stretches from the North Sea to the Mediterranean, and from the Atlantic Ocean to the Alps. Wide expanses of land in the north are used for agriculture. Europe‘s tallest peak, the Mont Blanc (4,810 m), is located in the French Alps at the Italian border. The Pyrenees form the country‘s border with Spain. The Mediterranean coast, including the Côte d’Azur, is a popular tourist destination in the south of France.
One of the world‘s longest cable-stayed bridges, the Millau Viaduct, was opened in southern France in 2004. At a height of 343 m, it is the tallest structure in France. The European Union helped to finance the bridge‘s construction.
The capital city of Paris is the most densely populated major city in Europe, and the second-largest metropolitan area in the EU. Its symbol, the Eiffel Tower, is known around the world. The Seine River divides the city into the right and left banks. Parts of the bank, which are home to treasures like the Louvre and Notre-Dame Cathedral, are included in the UNESCO list of World Heritage Sites.
The European Parliament meets in Strasbourg, located on the Rhine River in eastern France.

97France
Official name:République française/France
Official language: French
Capital: Paris (2.5 million residents, 2012)
Population (2014): 65.8 million*
Population density (2014): 103.8 inhabitants per km²
Currency: Euro, since 2002
Government website: http://www.gouvernement.fr/en
National holiday: 14 July: Bastille Day 1789 (Fête nationale)
Area (2013): 543,900 km2 (not including overseas regions)
Administrative structure: 22 regions, 96 departments (not including overseas regions); dependent territories: Caribbean: Guadeloupe, Martinique, St. Barthélemy, St. Martin; Indian Ocean: Réunion, Mayotte; South America: French Guiana; Pacific: French Polynesia, New Caledonia, Wallis and Futuna; Atlantic: Saint-Pierre and Miquelon; French Southern and Antarctic Lands
Geography: Seas: North and Mediterranean Seas; main mountain ranges: Pyrenees, Massif Central, Alps, Vosges; highest peak: Mont Blanc (4,810 m)
* Break in series
European Overview98
* Provisional value, Break in series
François HollandePrésident de la République française
photo RAYMoND DEpARDoNiMpRiMé EN fRANcE pAR lA DilA © DilA - lA DocUMENtAtioN fRANçAiSE - 2012
503120432 affiche Validé JO 1/6/2012
Head of government: Manuel Valls
Head of state: François Hollande
Political system: Parliamentary semi-presidential republic; National Assembly elected every five years, Senate every six years; direct presidential elections every five years; right to vote as of age 18
Joined EU in: Founding member (1951/57)
Population in percent of the total population of the EU (2015):13.1 percent*
Memberships: EU, G7, G20, Nato, OECD, OSZE, UNO
Seats in the European Parliament: 74
Commissioner in the European Commission:Pierre MoscoviciDepartment: Economic and Financial Affairs, Taxation and Customs

99France
** Break in series*** Deviation from 100 percent due to rounding
Population structure (2014):
Rural population
21 percent
Urban population 79 percent
Age distribution***ages 15 – 64
63 percent
over 65
19 percent
ages 0 – 14
19 percent
Men
48.7 percent
Women
51.3 percent
Gross domestic product (in respective prices, 2013)GDP total 2,059.9 billion eurosGDP per capita 31,300 euro
Gross national income per capita p.a. (2013):43,550 US dollars
Annual mean income (2013):20,954 euros net
Monthly minimum wage (July 2015): 1,458 euro
Unemployment rate (March 2015): 10.3 percent
Youth unemployment rate (2014): 24.2 percent**
Adults who have completed higher education (2014):86.9 percent**
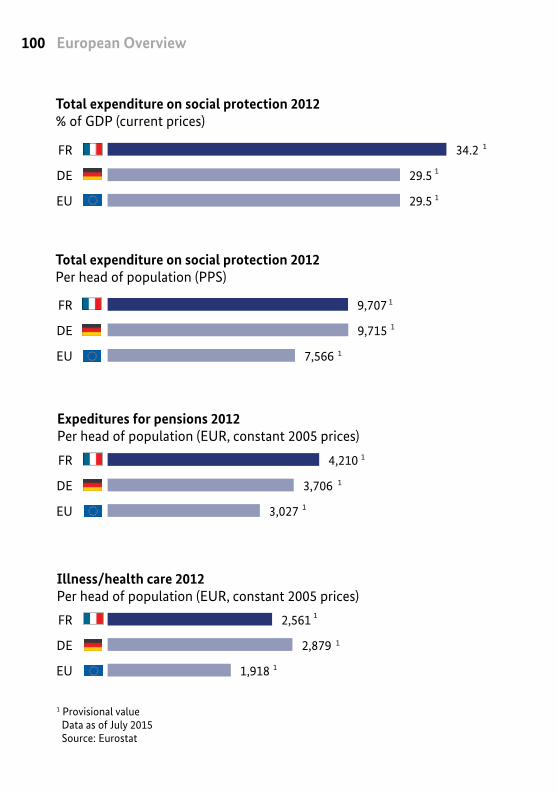
European Overview100
1 Provisional value Data as of July 2015 Source: Eurostat
34.2
29.5
29.5
FR
DE
EU 1
1
2,561
2,879
1,918
FR
DE
EU
1
1
1
9,707
9,715
7,566
FR
DE
EU
1
1
1
4,210
3,706
3,027
FR
DE
EU
1
1
1
DE
EU
DE
EU
DE
EU
FR
DE
EU
1
Total expenditure on social protection 2012% of GDP (current prices)
Illness/health care 2012Per head of population (EUR, constant 2005 prices)
Expeditures for pensions 2012Per head of population (EUR, constant 2005 prices)
Total expenditure on social protection 2012Per head of population (PPS)
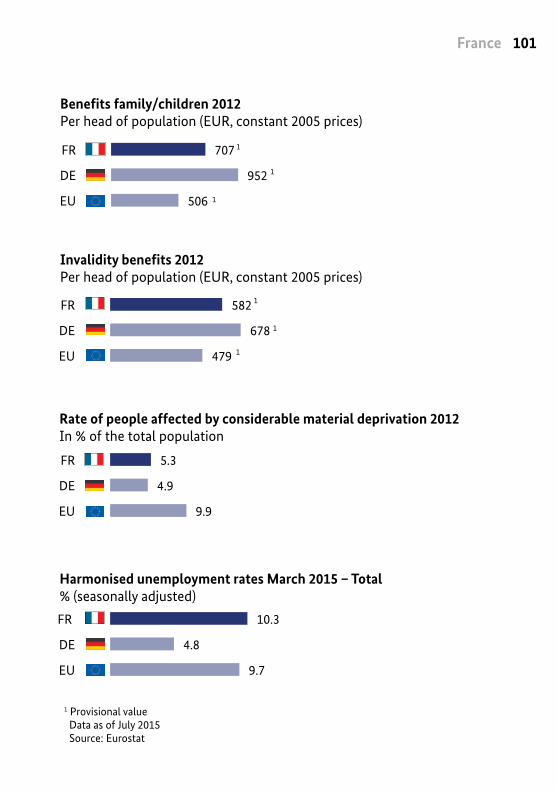
101France
1 Provisional value Data as of July 2015 Source: Eurostat
707
952
506
FR
DE
EU
1
1
1
582
678
479
FR
DE
EU
1
1
1
5.3
4.9
9.9
FR
DE
EU
10.3
4.8
9.7
FR
DE
EU
Harmonised unemployment rates March 2015 – Total% (seasonally adjusted)
Invalidity benefits 2012Per head of population (EUR, constant 2005 prices)
Benefits family/children 2012Per head of population (EUR, constant 2005 prices)
Rate of people affected by considerable material deprivation 2012In % of the total population
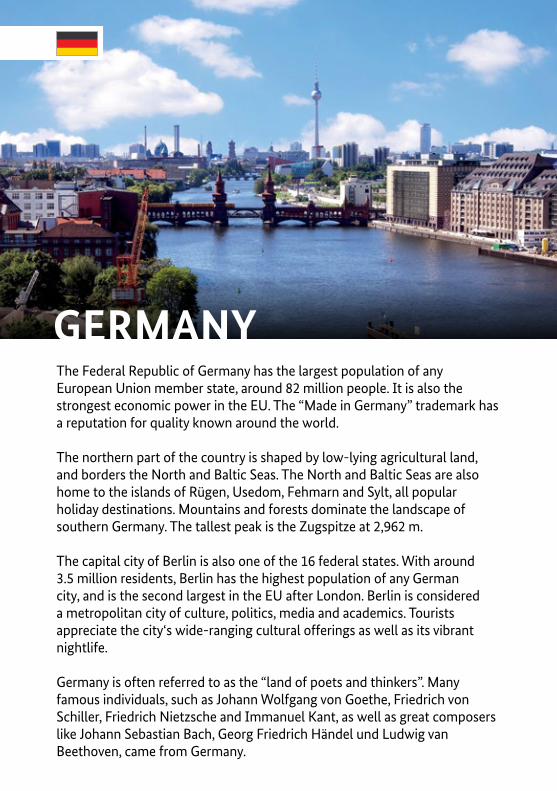
GERMANYThe Federal Republic of Germany has the largest population of any European Union member state, around 82 million people. It is also the strongest economic power in the EU. The “Made in Germany” trademark has a reputation for quality known around the world.
The northern part of the country is shaped by low-lying agricultural land, and borders the North and Baltic Seas. The North and Baltic Seas are also home to the islands of Rügen, Usedom, Fehmarn and Sylt, all popular holiday destinations. Mountains and forests dominate the landscape of southern Germany. The tallest peak is the Zugspitze at 2,962 m.
The capital city of Berlin is also one of the 16 federal states. With around 3.5 million residents, Berlin has the highest population of any German city, and is the second largest in the EU after London. Berlin is considered a metropolitan city of culture, politics, media and academics. Tourists appreciate the city‘s wide-ranging cultural offerings as well as its vibrant nightlife.
Germany is often referred to as the “land of poets and thinkers”. Many famous individuals, such as Johann Wolfgang von Goethe, Friedrich von Schiller, Friedrich Nietzsche and Immanuel Kant, as well as great composers like Johann Sebastian Bach, Georg Friedrich Händel und Ludwig van Beethoven, came from Germany.
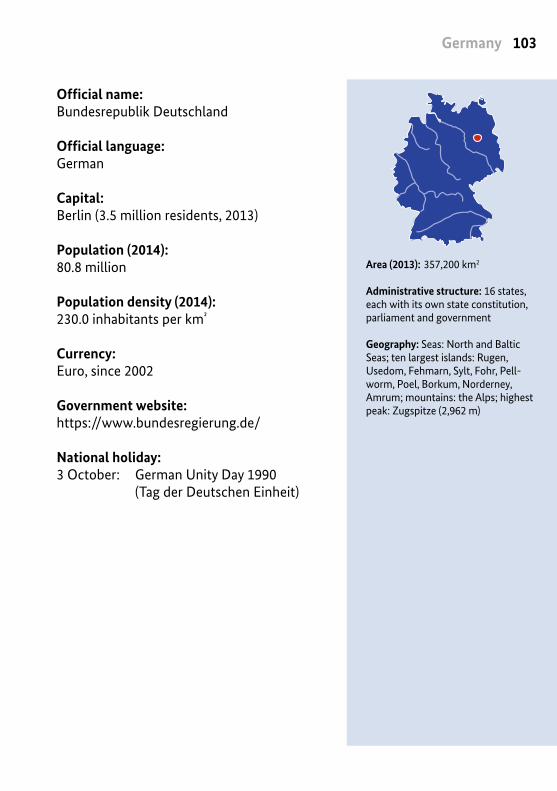
103Germany
Official name:Bundesrepublik Deutschland
Official language: German
Capital: Berlin (3.5 million residents, 2013)
Population (2014): 80.8 million
Population density (2014): 230.0 inhabitants per km²
Currency: Euro, since 2002
Government website: https://www.bundesregierung.de/
National holiday: 3 October: German Unity Day 1990 (Tag der Deutschen Einheit)
Area (2013): 357,200 km2
Administrative structure: 16 states, each with its own state constitution, parliament and government
Geography: Seas: North and Baltic Seas; ten largest islands: Rugen, Usedom, Fehmarn, Sylt, Fohr, Pell-worm, Poel, Borkum, Norderney, Amrum; mountains: the Alps; highest peak: Zugspitze (2,962 m)

European Overview104
* Provisional value
Political system: Democratic parliamentary republic; parliament (Bundestag): elections every four years; Bundesrat (federal council of states); Federal President elected by the Federal Convention every five years; right to vote as of age 18
Joined EU in: Founding member (1951/57)
Population in percent of the total population of the EU (2015):16.0 percent*
Memberships: EU, G7, G20, Nato, OECD, OSZE, UNO
Seats in the European Parliament: 96
Commissioner in the European Commission:Günther H. OettingerDepartment: Digital Economy and Society
Head of government: Angela Merkel
Head of state: Joachim Gauck

105Germany
** Break in series
Age distribution
Population structure (2014):
ages 15 – 64
66 percent
Rural population
25 percent
Urban population 75 percent
ages 0 – 14
13 percent
over 65
21 percent
Men
49.1 percent
Women
50.9 percent
Gross domestic product (in respective prices, 2013)GDP total 2,737.6 billion eurosGDP per capita 33,300 euro
Gross national income per capita p.a. (2013):47,250 US dollars
Annual mean income (2013):19,582 euros net
Monthly minimum wage (July 2015): 1,473 euro
Unemployment rate (March 2015): 4.8 percent
Youth unemployment rate (2014): 7.7 percent**
Adults who have completed higher education (2014):72.4 percent**
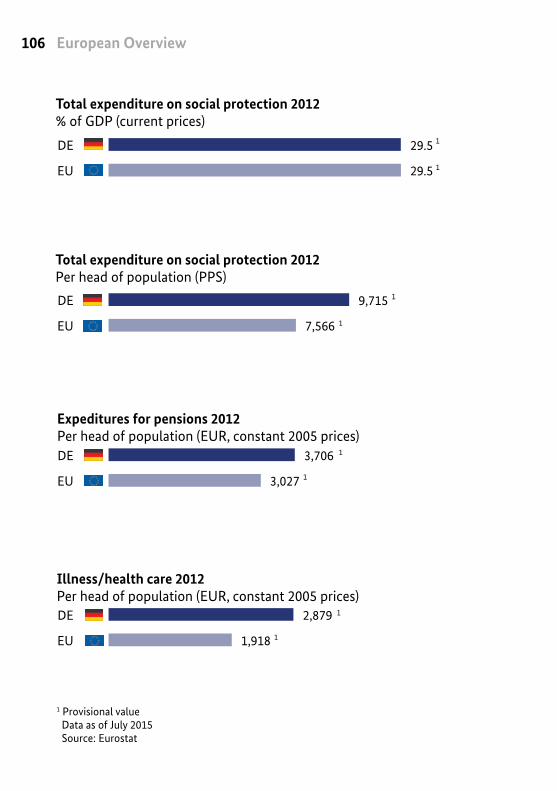
European Overview106
1 Provisional value Data as of July 2015 Source: Eurostat
29.5
29.5
DE
EU 1
2,879
1,918
DE
EU
1
1
9,715
7,566
DE
EU
1
1
3,706
3,027
DE
EU
1
1
DE
EU
DE
EU
DE
EU
DE
EU
1
Total expenditure on social protection 2012% of GDP (current prices)
Illness/health care 2012Per head of population (EUR, constant 2005 prices)
Expeditures for pensions 2012Per head of population (EUR, constant 2005 prices)
Total expenditure on social protection 2012Per head of population (PPS)
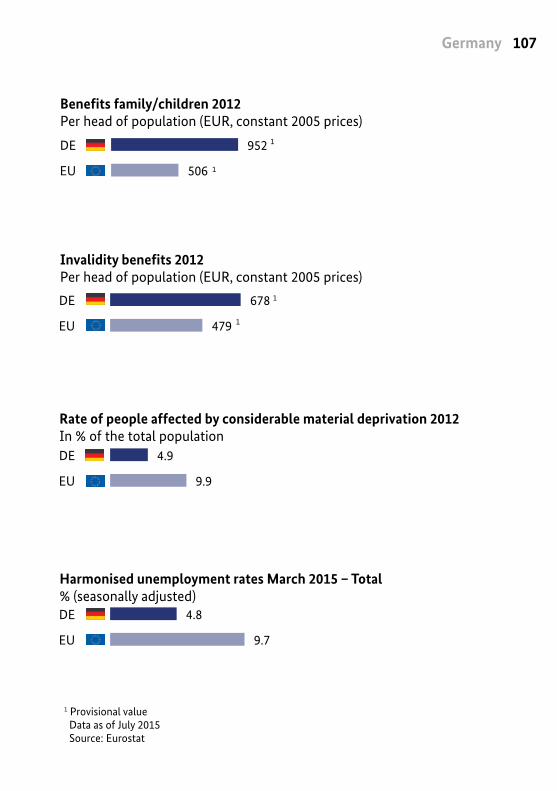
107Germany
1 Provisional value Data as of July 2015 Source: Eurostat
952
506
DE
EU
1
1
678
479
DE
EU
1
1
4.9
9.9
DE
EU
4.8
9.7
DE
EU
Harmonised unemployment rates March 2015 – Total% (seasonally adjusted)
Invalidity benefits 2012Per head of population (EUR, constant 2005 prices)
Benefits family/children 2012Per head of population (EUR, constant 2005 prices)
Rate of people affected by considerable material deprivation 2012In % of the total population
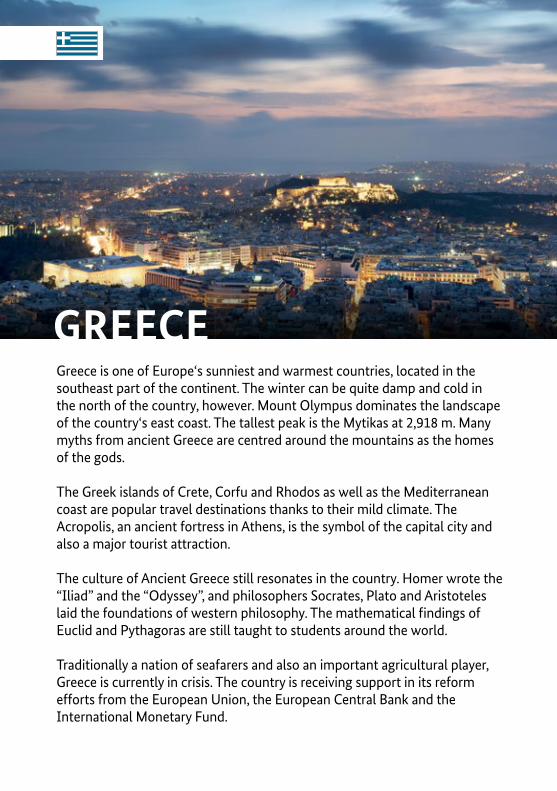
GREECEGreece is one of Europe‘s sunniest and warmest countries, located in the southeast part of the continent. The winter can be quite damp and cold in the north of the country, however. Mount Olympus dominates the landscape of the country‘s east coast. The tallest peak is the Mytikas at 2,918 m. Many myths from ancient Greece are centred around the mountains as the homes of the gods.
The Greek islands of Crete, Corfu and Rhodos as well as the Mediterranean coast are popular travel destinations thanks to their mild climate. The Acropolis, an ancient fortress in Athens, is the symbol of the capital city and also a major tourist attraction.
The culture of Ancient Greece still resonates in the country. Homer wrote the “Iliad” and the “Odyssey”, and philosophers Socrates, Plato and Aristoteles laid the foundations of western philosophy. The mathematical findings of Euclid and Pythagoras are still taught to students around the world.
Traditionally a nation of seafarers and also an important agricultural player, Greece is currently in crisis. The country is receiving support in its reform efforts from the European Union, the European Central Bank and the International Monetary Fund.
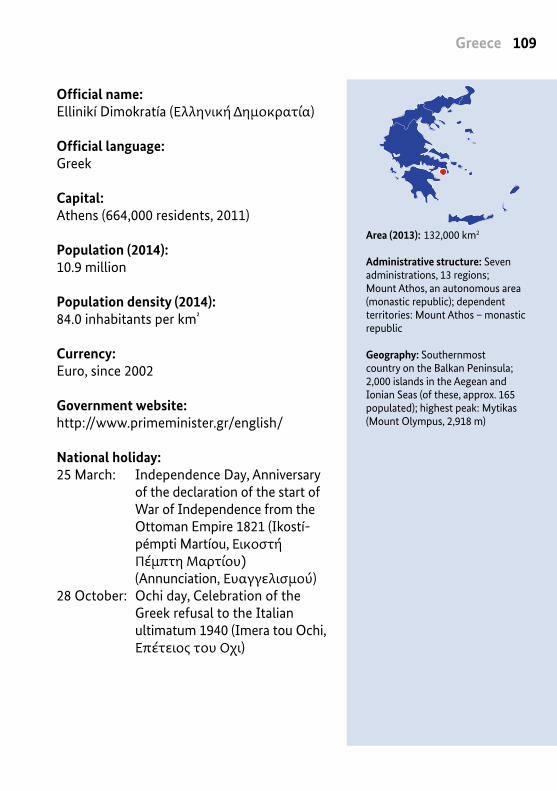
109Greece
Area (2013): 132,000 km2
Administrative structure: Seven administrations, 13 regions; Mount Athos, an autonomous area (monastic republic); dependent territories: Mount Athos – monastic republic
Geography: Southernmost country on the Balkan Peninsula; 2,000 islands in the Aegean and Ionian Seas (of these, approx. 165 popu lated); highest peak: Mytikas (Mount Olympus, 2,918 m)
Official name:Ellinikí Dimokratía (Ελληνική Δημοκρατία)
Official language: Greek
Capital: Athens (664,000 residents, 2011)
Population (2014): 10.9 million
Population density (2014): 84.0 inhabitants per km²
Currency: Euro, since 2002
Government website: http://www.primeminister.gr/english/
National holiday: 25 March: Independence Day, Anniversary of the declaration of the start of War of Independence from the Ottoman Empire 1821 (Ikostí- pémpti Martíou, Εικοστή Πέμπτη Μαρτίου) (Annunciation, Ευαγγελισμού)28 October: Ochi day, Celebration of the Greek refusal to the Italian ultimatum 1940 (Imera tou Ochi, Επέτειος του Όχι)

European Overview110
* Provisional value
Head of government: Alexis Tsipras
Head of state: Prokopis Pavlopoulos
Political system: Parliamentary republic; one chamber, members elected for four-year terms; parliament elects president every five years; compulsory voting as of age 18
Joined EU in: 1981
Population in percent of the total population of the EU (2015):2.1 percent*
Memberships: EU, Nato, OECD, OSZE, UNO
Seats in the European Parliament: 21
Commissioner in the European Commission:Dimitris AvramopoulosDepartment: Migration, Home Affairs and Citizenship
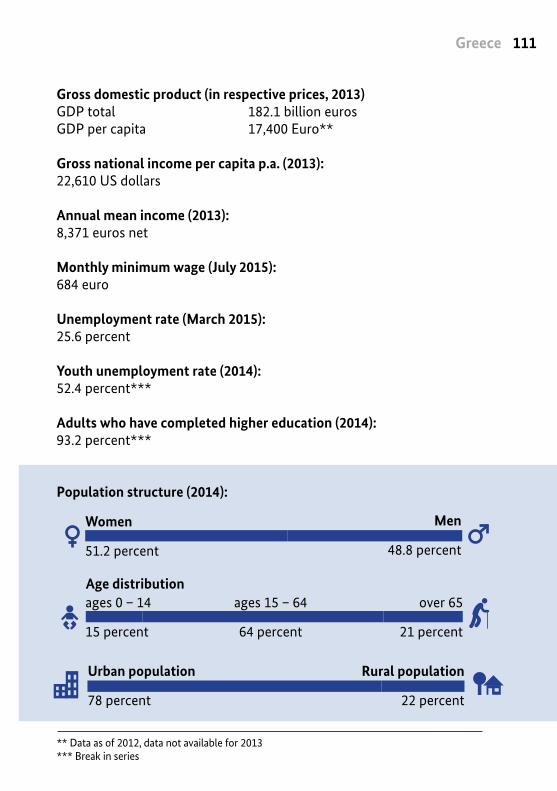
111Greece
Population structure (2014):
Rural population
22 percent
Urban population 78 percent
ages 0 – 14
15 percent
Age distributionages 15 – 64
64 percent
over 65
21 percent
Men
48.8 percent
Women
51.2 percent
Gross domestic product (in respective prices, 2013)GDP total 182.1 billion eurosGDP per capita 17,400 Euro**
Gross national income per capita p.a. (2013):22,610 US dollars
Annual mean income (2013):8,371 euros net
Monthly minimum wage (July 2015): 684 euro
Unemployment rate (March 2015): 25.6 percent
Youth unemployment rate (2014): 52.4 percent***
Adults who have completed higher education (2014):93.2 percent***
** Data as of 2012, data not available for 2013*** Break in series
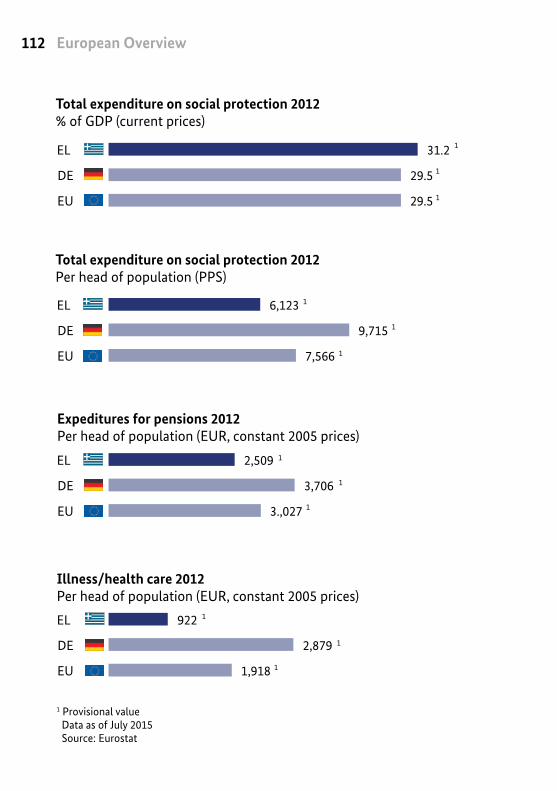
European Overview112
1 Provisional value Data as of July 2015 Source: Eurostat
31.2
29.5
29.5
EL
DE
EU 1
1
922
2,879
1,918
EL
DE
EU
1
1
1
6,123
9,715
7,566
EL
DE
EU
1
1
1
2,509
3,706
3.,027
EL
DE
EU
1
1
1
EL
DE
EU
EL
DE
EU
EL
DE
EU
EL
DE
EU
1
Total expenditure on social protection 2012% of GDP (current prices)
Illness/health care 2012Per head of population (EUR, constant 2005 prices)
Expeditures for pensions 2012Per head of population (EUR, constant 2005 prices)
Total expenditure on social protection 2012Per head of population (PPS)
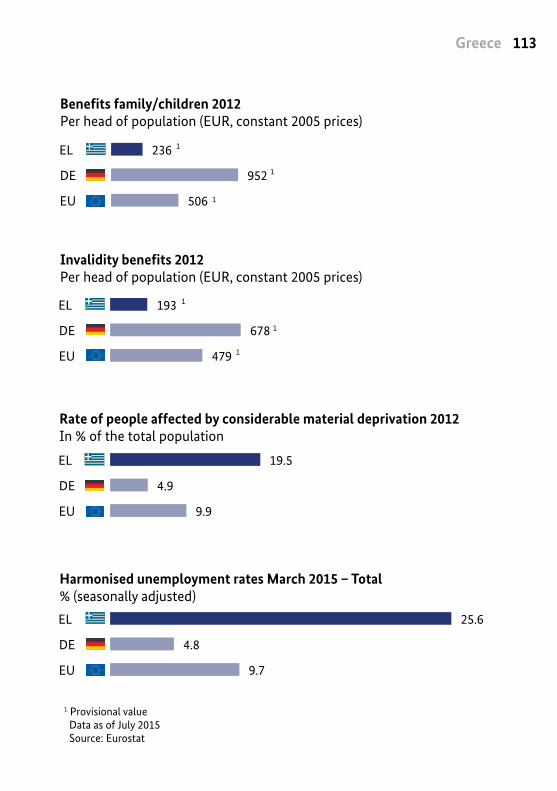
113Greece
1 Provisional value Data as of July 2015 Source: Eurostat
236
952
506
EL
DE
EU
1
1
1
193
678
479
EL
DE
EU
1
1
1
19.5
4.9
9.9
EL
DE
EU
25.6
4.8
9.7
EL
DE
EU
Harmonised unemployment rates March 2015 – Total% (seasonally adjusted)
Invalidity benefits 2012Per head of population (EUR, constant 2005 prices)
Benefits family/children 2012Per head of population (EUR, constant 2005 prices)
Rate of people affected by considerable material deprivation 2012In % of the total population
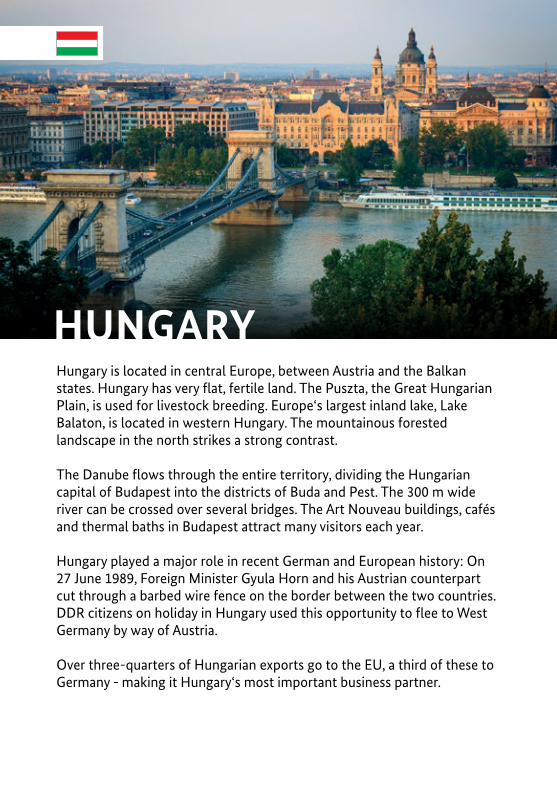
HUNGARYHungary is located in central Europe, between Austria and the Balkan states. Hungary has very flat, fertile land. The Puszta, the Great Hungarian Plain, is used for livestock breeding. Europe‘s largest inland lake, Lake Balaton, is located in western Hungary. The mountainous forested landscape in the north strikes a strong contrast.
The Danube flows through the entire territory, dividing the Hungarian capital of Budapest into the districts of Buda and Pest. The 300 m wide river can be crossed over several bridges. The Art Nouveau buildings, cafés and thermal baths in Budapest attract many visitors each year.
Hungary played a major role in recent German and European history: On 27 June 1989, Foreign Minister Gyula Horn and his Austrian counterpart cut through a barbed wire fence on the border between the two countries. DDR citizens on holiday in Hungary used this opportunity to flee to West Germany by way of Austria.
Over three-quarters of Hungarian exports go to the EU, a third of these to Germany - making it Hungary‘s most important business partner.
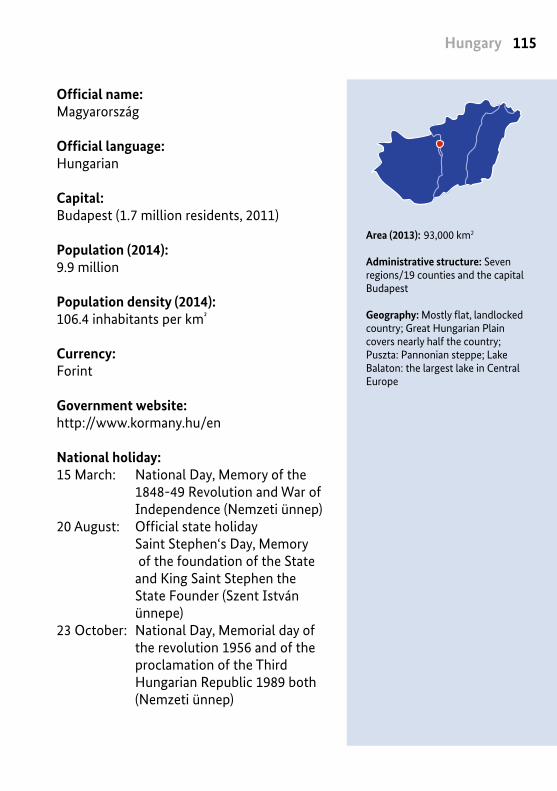
115Hungary
Area (2013): 93,000 km2
Administrative structure: Seven regions/19 counties and the capital Budapest
Geography: Mostly flat, landlocked country; Great Hungarian Plain covers nearly half the country; Puszta: Pannonian steppe; Lake Balaton: the largest lake in Central Europe
Official name:Magyarország
Official language: Hungarian
Capital: Budapest (1.7 million residents, 2011)
Population (2014): 9.9 million
Population density (2014): 106.4 inhabitants per km²
Currency: Forint
Government website: http://www.kormany.hu/en
National holiday: 15 March: National Day, Memory of the 1848-49 Revolution and War of Independence (Nemzeti ünnep)20 August: Official state holiday Saint Stephen‘s Day, Memory of the foundation of the State and King Saint Stephen the State Founder (Szent István ünnepe)23 October: National Day, Memorial day of the revolution 1956 and of the proclamation of the Third Hungarian Republic 1989 both (Nemzeti ünnep)
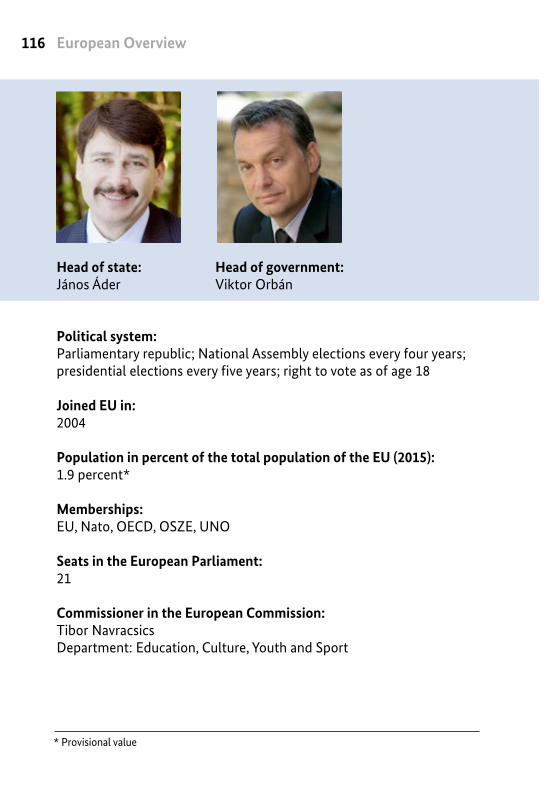
European Overview116
* Provisional value
Head of government: Viktor Orbán
Head of state: János Áder
Political system: Parliamentary republic; National Assembly elections every four years; presidential elections every five years; right to vote as of age 18
Joined EU in: 2004
Population in percent of the total population of the EU (2015):1.9 percent*
Memberships: EU, Nato, OECD, OSZE, UNO
Seats in the European Parliament: 21
Commissioner in the European Commission:Tibor NavracsicsDepartment: Education, Culture, Youth and Sport
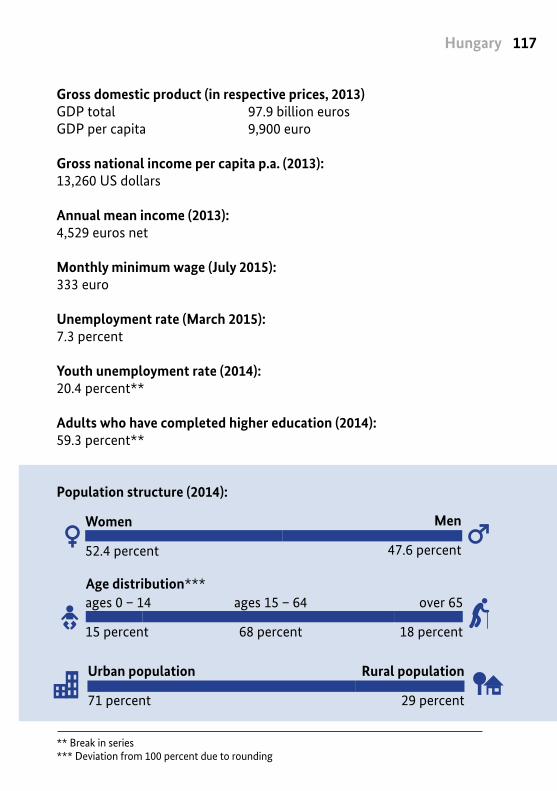
117Hungary
Population structure (2014):
** Break in series*** Deviation from 100 percent due to rounding
Age distribution***
Rural population
29 percent
Urban population 71 percent
ages 0 – 14
15 percent
ages 15 – 64
68 percent
over 65
18 percent
Men
47.6 percent
Women
52.4 percent
Gross domestic product (in respective prices, 2013)GDP total 97.9 billion eurosGDP per capita 9,900 euro
Gross national income per capita p.a. (2013):13,260 US dollars
Annual mean income (2013):4,529 euros net
Monthly minimum wage (July 2015): 333 euro
Unemployment rate (March 2015): 7.3 percent
Youth unemployment rate (2014): 20.4 percent**
Adults who have completed higher education (2014):59.3 percent**

European Overview118
1 Provisional value Data as of July 2015 Source: Eurostat
218
952
506
HU
DE
EU
1
1
133
678
479
HU
DE
EU
1
1
25.7
4.9
9.9
HU
DE
EU
7.3
4.8
9.7
HU
DE
EU
21.8
29.5
29.5
HU
DE
EU 1
418
2,879
1,918
HU
DE
EU
1
1
3,880
9,715
7,566
HU
DE
EU
1
1
784
3,706
3,027
HU
DE
EU
1
1
EU
HU
DE
EU
HU
DE
EU
HU
DE
EU
1
Total expenditure on social protection 2012% of GDP (current prices)
Illness/health care 2012Per head of population (EUR, constant 2005 prices)
Expeditures for pensions 2012Per head of population (EUR, constant 2005 prices)
Total expenditure on social protection 2012Per head of population (PPS)
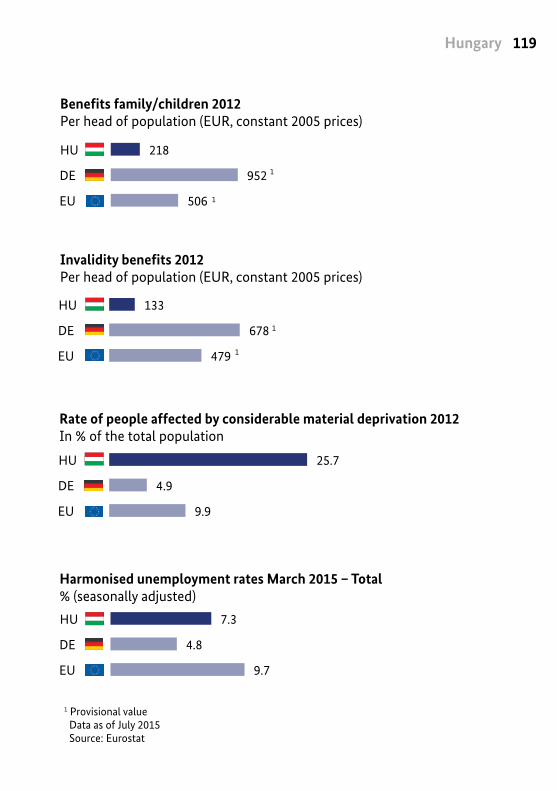
119Hungary
1 Provisional value Data as of July 2015 Source: Eurostat
218
952
506
HU
DE
EU
1
1
133
678
479
HU
DE
EU
1
1
25.7
4.9
9.9
HU
DE
EU
7.3
4.8
9.7
HU
DE
EU
Harmonised unemployment rates March 2015 – Total% (seasonally adjusted)
Invalidity benefits 2012Per head of population (EUR, constant 2005 prices)
Benefits family/children 2012Per head of population (EUR, constant 2005 prices)
Rate of people affected by considerable material deprivation 2012In % of the total population
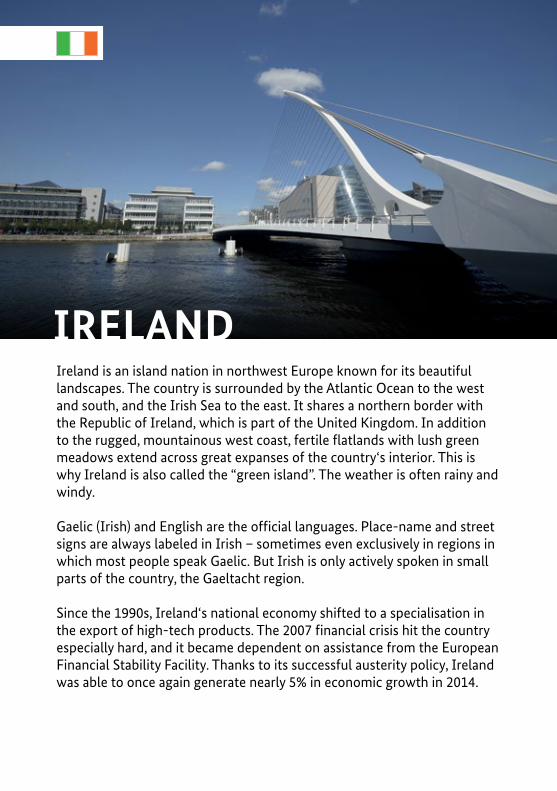
IRELANDIreland is an island nation in northwest Europe known for its beautiful landscapes. The country is surrounded by the Atlantic Ocean to the west and south, and the Irish Sea to the east. It shares a northern border with the Republic of Ireland, which is part of the United Kingdom. In addition to the rugged, mountainous west coast, fertile flatlands with lush green meadows extend across great expanses of the country‘s interior. This is why Ireland is also called the “green island”. The weather is often rainy and windy.
Gaelic (Irish) and English are the official languages. Place-name and street signs are always labeled in Irish – sometimes even exclusively in regions in which most people speak Gaelic. But Irish is only actively spoken in small parts of the country, the Gaeltacht region.
Since the 1990s, Ireland‘s national economy shifted to a specialisation in the export of high-tech products. The 2007 financial crisis hit the country especially hard, and it became dependent on assistance from the European Financial Stability Facility. Thanks to its successful austerity policy, Ireland was able to once again generate nearly 5% in economic growth in 2014.
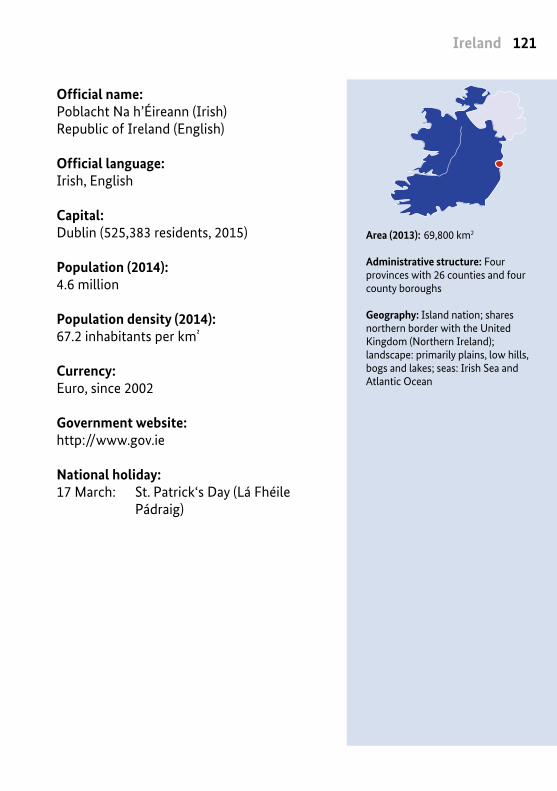
121Ireland
Official name:Poblacht Na h’Éireann (Irish)Republic of Ireland (English)
Official language: Irish, English
Capital: Dublin (525,383 residents, 2015)
Population (2014): 4.6 million
Population density (2014): 67.2 inhabitants per km²
Currency: Euro, since 2002
Government website: http://www.gov.ie
National holiday: 17 March: St. Patrick‘s Day (Lá Fhéile Pádraig)
Area (2013): 69,800 km2
Administrative structure: Four provinces with 26 counties and four county boroughs
Geography: Island nation; shares northern border with the United Kingdom (Northern Ireland); landscape: primarily plains, low hills, bogs and lakes; seas: Irish Sea and Atlantic Ocean
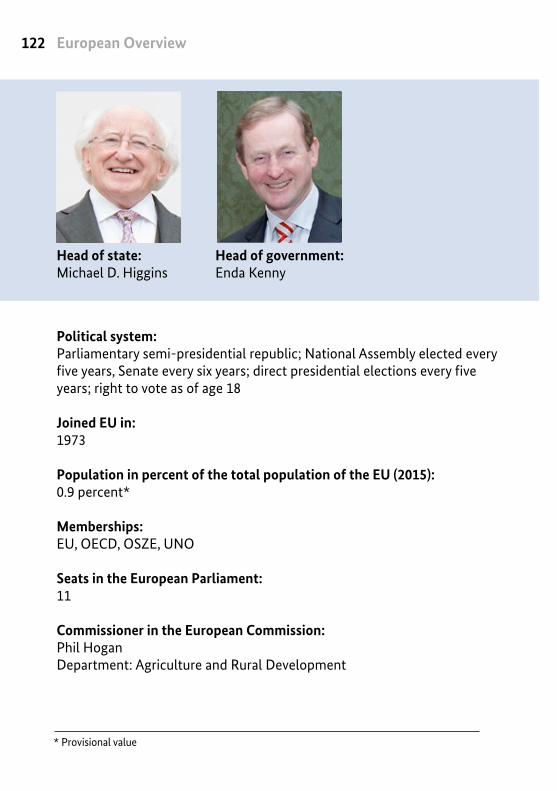
European Overview122
* Provisional value
Head of government: Enda Kenny
Head of state: Michael D. Higgins
Political system: Parliamentary semi-presidential republic; National Assembly elected every five years, Senate every six years; direct presidential elections every five years; right to vote as of age 18
Joined EU in: 1973
Population in percent of the total population of the EU (2015):0.9 percent*
Memberships: EU, OECD, OSZE, UNO
Seats in the European Parliament: 11
Commissioner in the European Commission:Phil HoganDepartment: Agriculture and Rural Development
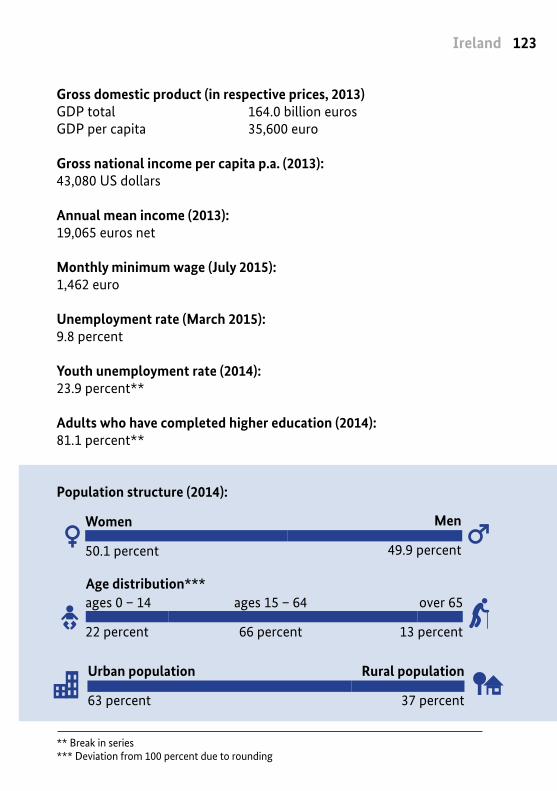
123Ireland
** Break in series*** Deviation from 100 percent due to rounding
Population structure (2014):
ages 0 – 14
22 percent
Rural population
37 percent
Urban population 63 percent
Age distribution***ages 15 – 64
66 percent
over 65
13 percent
Men
49.9 percent
Women
50.1 percent
Gross domestic product (in respective prices, 2013)GDP total 164.0 billion eurosGDP per capita 35,600 euro
Gross national income per capita p.a. (2013):43,080 US dollars
Annual mean income (2013):19,065 euros net
Monthly minimum wage (July 2015): 1,462 euro
Unemployment rate (March 2015): 9.8 percent
Youth unemployment rate (2014): 23.9 percent**
Adults who have completed higher education (2014):81.1 percent**
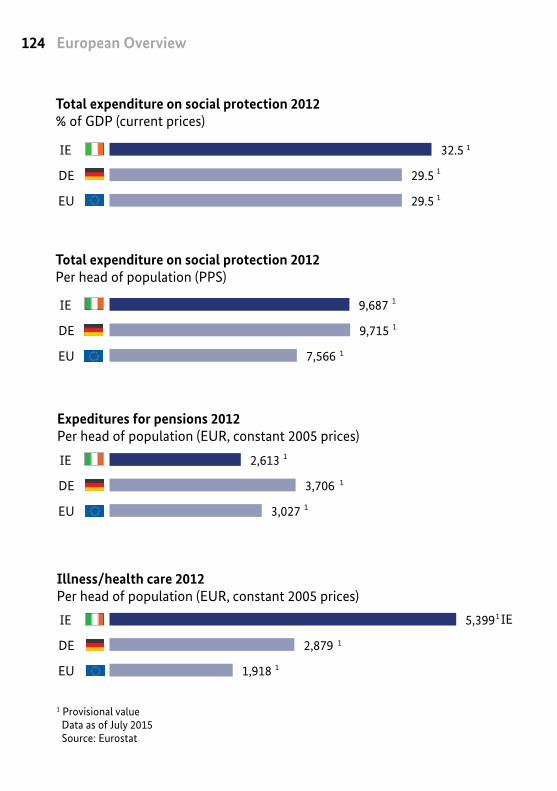
European Overview124
1 Provisional value Data as of July 2015 Source: Eurostat
32.5
29.5
29.5
IE
DE
EU 1
1
5,399
2,879
1,918
IE
DE
EU
1
1
1
9,687
9,715
7,566
IE
DE
EU
1
1
1
2,613
3,706
3,027
IE
DE
EU
1
1
1
DE
EU
IE
DE
EU
IE
DE
EU
IE
DE
EU
1
Total expenditure on social protection 2012% of GDP (current prices)
Illness/health care 2012Per head of population (EUR, constant 2005 prices)
Expeditures for pensions 2012Per head of population (EUR, constant 2005 prices)
Total expenditure on social protection 2012Per head of population (PPS)
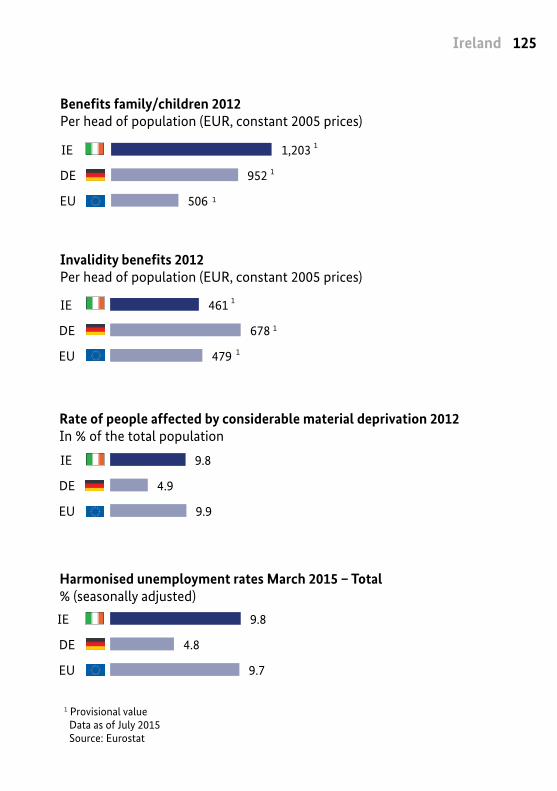
125Ireland
1 Provisional value Data as of July 2015 Source: Eurostat
1,203
952
506
IE
DE
EU
1
1
1
461
678
479
IE
DE
EU
1
1
1
9.8
4.9
9.9
IE
DE
EU
9.8
4.8
9.7
IE
DE
EU
Harmonised unemployment rates March 2015 – Total% (seasonally adjusted)
Invalidity benefits 2012Per head of population (EUR, constant 2005 prices)
Benefits family/children 2012Per head of population (EUR, constant 2005 prices)
Rate of people affected by considerable material deprivation 2012In % of the total population
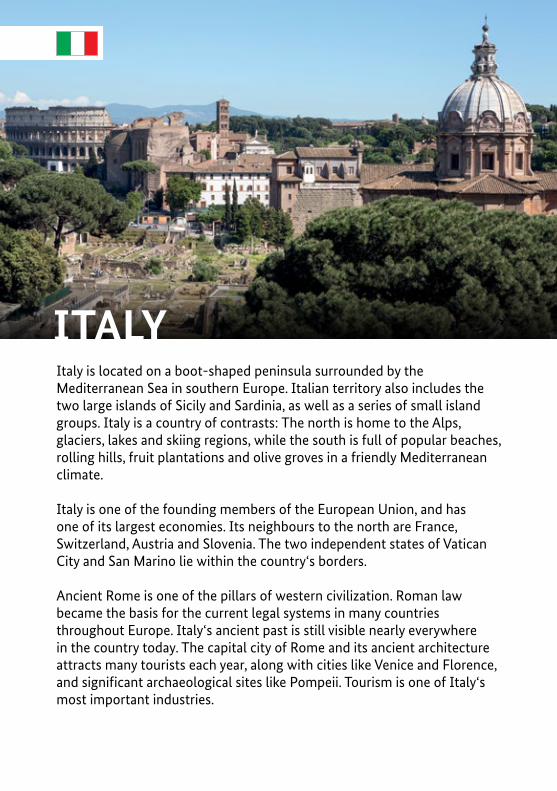
ITALYItaly is located on a boot-shaped peninsula surrounded by the Mediterranean Sea in southern Europe. Italian territory also includes the two large islands of Sicily and Sardinia, as well as a series of small island groups. Italy is a country of contrasts: The north is home to the Alps, glaciers, lakes and skiing regions, while the south is full of popular beaches, rolling hills, fruit plantations and olive groves in a friendly Mediterranean climate.
Italy is one of the founding members of the European Union, and has one of its largest economies. Its neighbours to the north are France, Switzerland, Austria and Slovenia. The two independent states of Vatican City and San Marino lie within the country‘s borders.
Ancient Rome is one of the pillars of western civilization. Roman law became the basis for the current legal systems in many countries throughout Europe. Italy‘s ancient past is still visible nearly everywhere in the country today. The capital city of Rome and its ancient architecture attracts many tourists each year, along with cities like Venice and Florence, and significant archaeological sites like Pompeii. Tourism is one of Italy‘s most important industries.
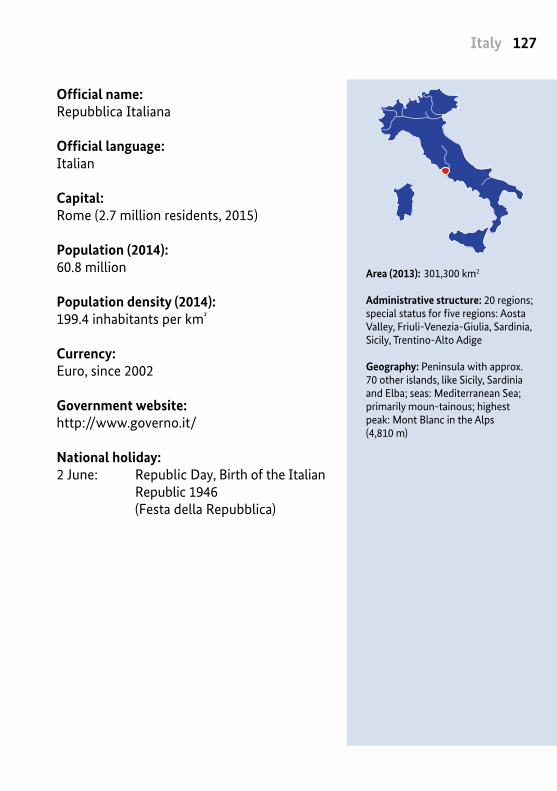
127Italy
Official name:Repubblica Italiana
Official language: Italian
Capital: Rome (2.7 million residents, 2015)
Population (2014): 60.8 million
Population density (2014): 199.4 inhabitants per km²
Currency: Euro, since 2002
Government website: http://www.governo.it/
National holiday: 2 June: Republic Day, Birth of the Italian Republic 1946 (Festa della Repubblica)
Area (2013): 301,300 km2
Administrative structure: 20 regions; special status for five regions: Aosta Valley, Friuli-Venezia-Giulia, Sardinia, Sicily, Trentino-Alto Adige
Geography: Peninsula with approx. 70 other islands, like Sicily, Sardinia and Elba; seas: Mediterranean Sea; primarily moun-tainous; highest peak: Mont Blanc in the Alps (4,810 m)
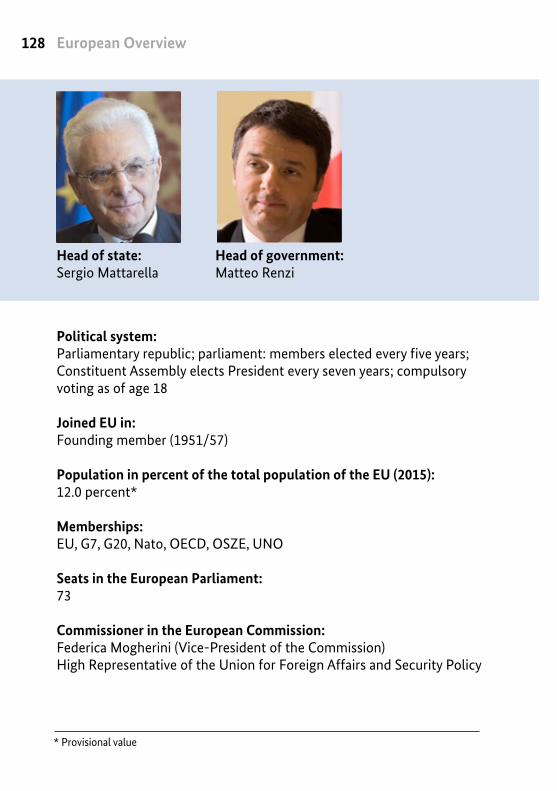
European Overview128
* Provisional value
Head of government: Matteo Renzi
Head of state: Sergio Mattarella
Political system: Parliamentary republic; parliament: members elected every five years; Constituent Assembly elects President every seven years; compulsory voting as of age 18
Joined EU in: Founding member (1951/57)
Population in percent of the total population of the EU (2015):12.0 percent*
Memberships: EU, G7, G20, Nato, OECD, OSZE, UNO
Seats in the European Parliament: 73
Commissioner in the European Commission:Federica Mogherini (Vice-President of the Commission)High Representative of the Union for Foreign Affairs and Security Policy

129Italy
** Break in series
Population structure (2014):
Rural population
31 percent
Urban population 69 percent
ages 0 – 14
14 percent
Age distributionages 15 – 64
64 percent
over 65
22 percent
Men
48.6 percent
Women
51.4 percent
Gross domestic product (in respective prices, 2013)GDP total 1,560.0 billion eurosGDP per capita 25,600 euro
Gross national income per capita p.a. (2013):35,430 US dollars
Annual mean income (2013):15,733 euros net
Monthly minimum wage (July 2015): No minimum wage
Unemployment rate (March 2015): 12.6 percent
Youth unemployment rate (2014): 42.7 percent**
Adults who have completed higher education (2014):78.8 percent**
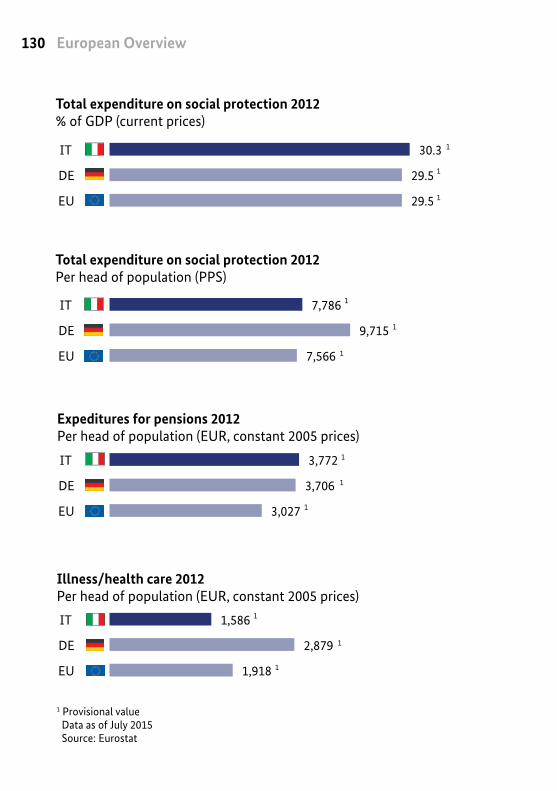
European Overview130
1 Provisional value Data as of July 2015 Source: Eurostat
30.3
29.5
29.5
IT
DE
EU 1
1
1,586
2,879
1,918
IT
DE
EU
1
1
1
7,786
9,715
7,566
IT
DE
EU
1
1
1
3,772
3,706
3,027
IT
DE
EU
1
1
1
DE
EU
IT
DE
EU
IT
DE
EU
IT
DE
EU
1
Total expenditure on social protection 2012% of GDP (current prices)
Illness/health care 2012Per head of population (EUR, constant 2005 prices)
Expeditures for pensions 2012Per head of population (EUR, constant 2005 prices)
Total expenditure on social protection 2012Per head of population (PPS)
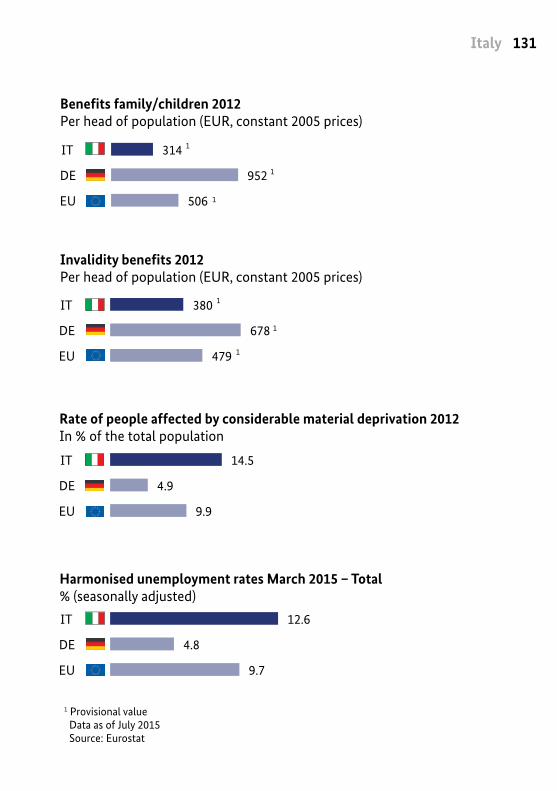
131Italy
1 Provisional value Data as of July 2015 Source: Eurostat
314
952
506
IT
DE
EU
1
1
1
380
678
479
IT
DE
EU
1
1
1
14.5
4.9
9.9
IT
DE
EU
12.6
4.8
9.7
IT
DE
EU
Harmonised unemployment rates March 2015 – Total% (seasonally adjusted)
Invalidity benefits 2012Per head of population (EUR, constant 2005 prices)
Benefits family/children 2012Per head of population (EUR, constant 2005 prices)
Rate of people affected by considerable material deprivation 2012In % of the total population
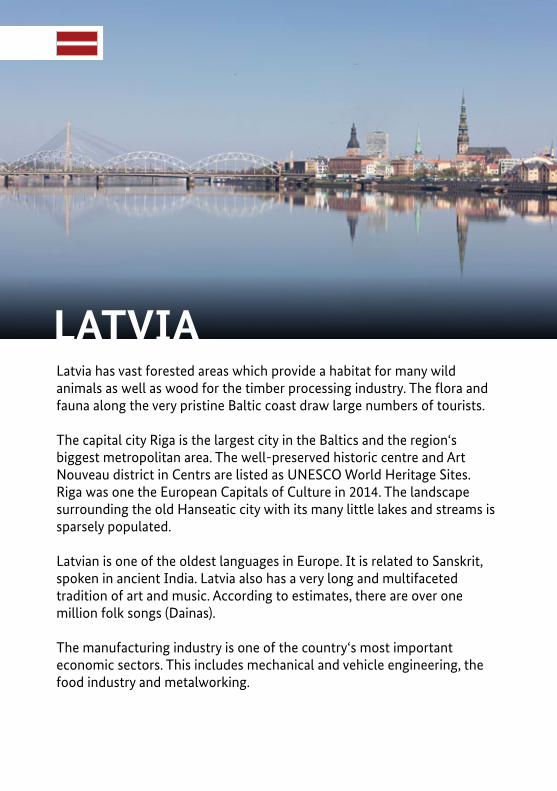
LATVIALatvia has vast forested areas which provide a habitat for many wild animals as well as wood for the timber processing industry. The flora and fauna along the very pristine Baltic coast draw large numbers of tourists.
The capital city Riga is the largest city in the Baltics and the region‘s biggest metropolitan area. The well-preserved historic centre and Art Nouveau district in Centrs are listed as UNESCO World Heritage Sites. Riga was one the European Capitals of Culture in 2014. The landscape surrounding the old Hanseatic city with its many little lakes and streams is sparsely populated.
Latvian is one of the oldest languages in Europe. It is related to Sanskrit, spoken in ancient India. Latvia also has a very long and multifaceted tradition of art and music. According to estimates, there are over one million folk songs (Dainas).
The manufacturing industry is one of the country‘s most important economic sectors. This includes mechanical and vehicle engineering, the food industry and metalworking.
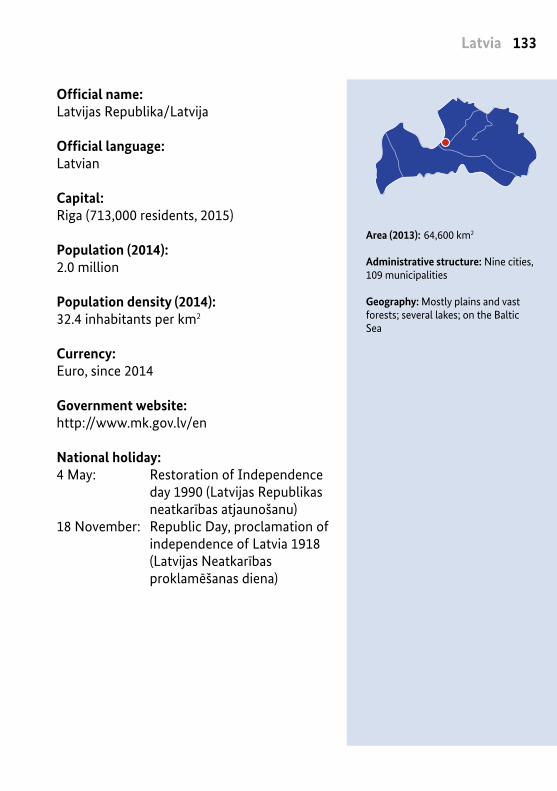
133Latvia
Official name:Latvijas Republika/Latvija
Official language: Latvian
Capital: Riga (713,000 residents, 2015)
Population (2014): 2.0 million
Population density (2014): 32.4 inhabitants per km2
Currency: Euro, since 2014
Government website: http://www.mk.gov.lv/en
National holiday: 4 May: Restoration of Independence day 1990 (Latvijas Republikas neatkarības atjaunošanu)18 November: Republic Day, proclamation of independence of Latvia 1918 (Latvijas Neatkarības proklamēšanas diena)
Area (2013): 64,600 km2
Administrative structure: Nine cities, 109 municipalities
Geography: Mostly plains and vast forests; several lakes; on the Baltic Sea
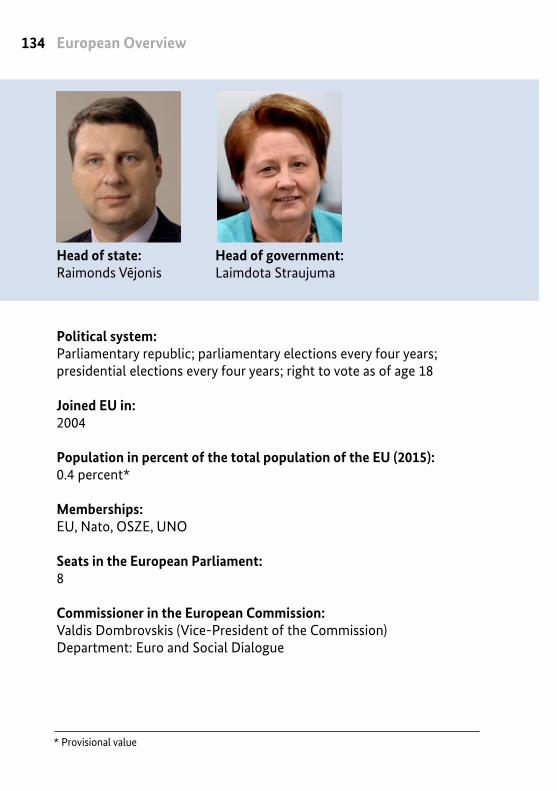
European Overview134
* Provisional value
Head of state: Raimonds Vējonis
Political system: Parliamentary republic; parliamentary elections every four years; presidential elections every four years; right to vote as of age 18
Joined EU in: 2004
Population in percent of the total population of the EU (2015):0.4 percent*
Memberships: EU, Nato, OSZE, UNO
Seats in the European Parliament: 8
Commissioner in the European Commission:Valdis Dombrovskis (Vice-President of the Commission)Department: Euro and Social Dialogue
Head of government: Laimdota Straujuma

135Latvia
** Break in series
Population structure (2014):
Rural population
33 percent
Urban population 67 percent
ages 0 – 14
15 percent
Age distributionages 15 – 64
66 percent
over 65
19 percent
Men
45.8 percent
Women
54.2 percent
Gross domestic product (in respective prices, 2013)GDP total 23.4 billion eurosGDP per capita 11,600 euro
Gross national income per capita p.a. (2013):15,280 US dollars
Annual mean income (2013):4,666 euros net
Monthly minimum wage (July 2015): 360 euro
Unemployment rate (March 2015): 9.9 percent
Youth unemployment rate (2014): 19.6 percent**
Adults who have completed higher education (2014):56.6 percent**
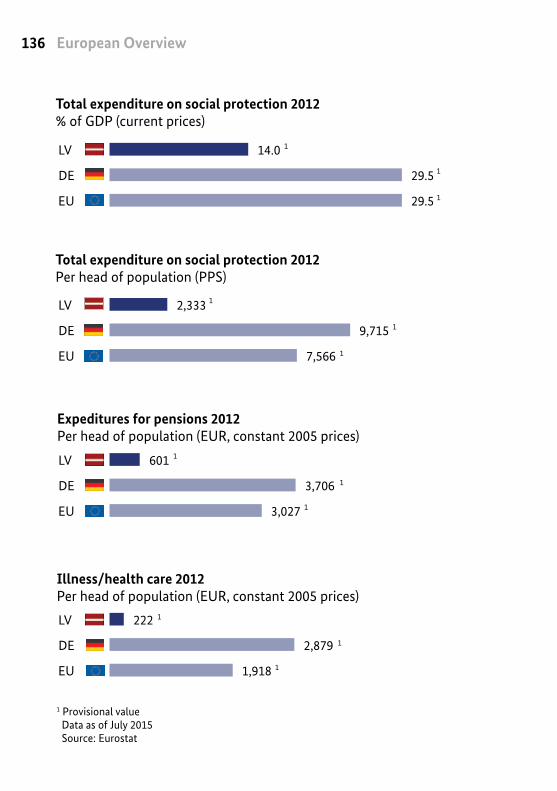
European Overview136
1 Provisional value Data as of July 2015 Source: Eurostat
14.0
29.5
29.5
LV
DE
EU 1
1
222
2,879
1,918
LV
DE
EU
1
1
1
2,333
9,715
7,566
LV
DE
EU
1
1
1
601
3,706
3,027
LV
DE
EU
1
1
1
LV
DE
EU
LV
DE
EU
LV
DE
EU
LV
DE
EU
1
Total expenditure on social protection 2012% of GDP (current prices)
Illness/health care 2012Per head of population (EUR, constant 2005 prices)
Expeditures for pensions 2012Per head of population (EUR, constant 2005 prices)
Total expenditure on social protection 2012Per head of population (PPS)
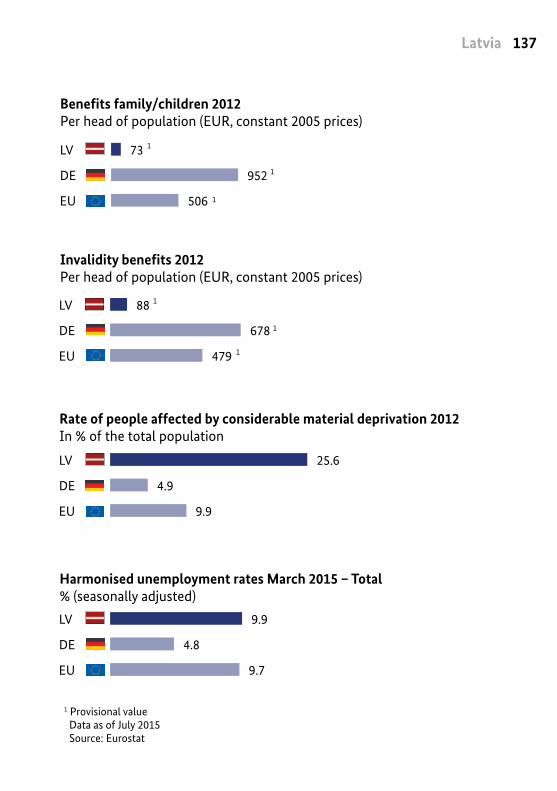
137Latvia
1 Provisional value Data as of July 2015 Source: Eurostat
73
952
506
LV
DE
EU
1
1
1
88
678
479
LV
DE
EU
1
1
1
25.6
4.9
9.9
LV
DE
EU
9.9
4.8
9.7
LV
DE
EU
Harmonised unemployment rates March 2015 – Total% (seasonally adjusted)
Invalidity benefits 2012Per head of population (EUR, constant 2005 prices)
Benefits family/children 2012Per head of population (EUR, constant 2005 prices)
Rate of people affected by considerable material deprivation 2012In % of the total population
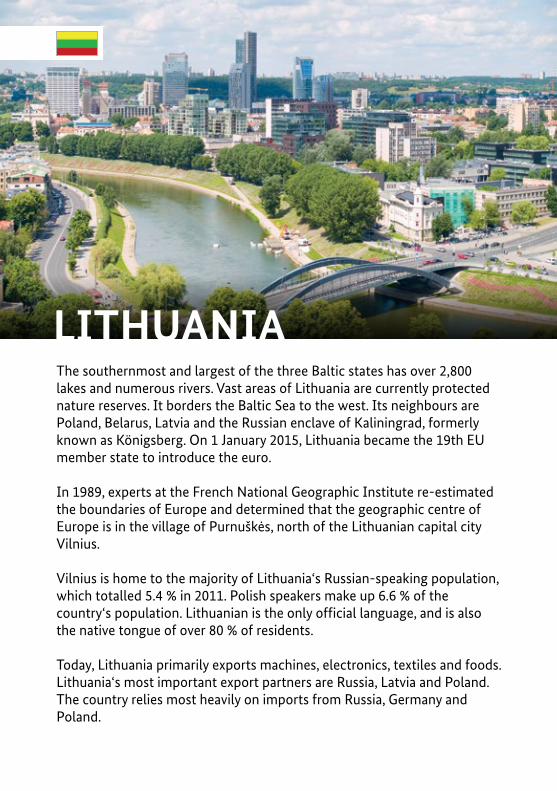
LITHUANIAThe southernmost and largest of the three Baltic states has over 2,800 lakes and numerous rivers. Vast areas of Lithuania are currently protected nature reserves. It borders the Baltic Sea to the west. Its neighbours are Poland, Belarus, Latvia and the Russian enclave of Kaliningrad, formerly known as Königsberg. On 1 January 2015, Lithuania became the 19th EU member state to introduce the euro.
In 1989, experts at the French National Geographic Institute re-estimated the boundaries of Europe and determined that the geographic centre of Europe is in the village of Purnuškės, north of the Lithuanian capital city Vilnius.
Vilnius is home to the majority of Lithuania‘s Russian-speaking population, which totalled 5.4 % in 2011. Polish speakers make up 6.6 % of the country‘s population. Lithuanian is the only official language, and is also the native tongue of over 80 % of residents.
Today, Lithuania primarily exports machines, electronics, textiles and foods. Lithuania‘s most important export partners are Russia, Latvia and Poland. The country relies most heavily on imports from Russia, Germany and Poland.
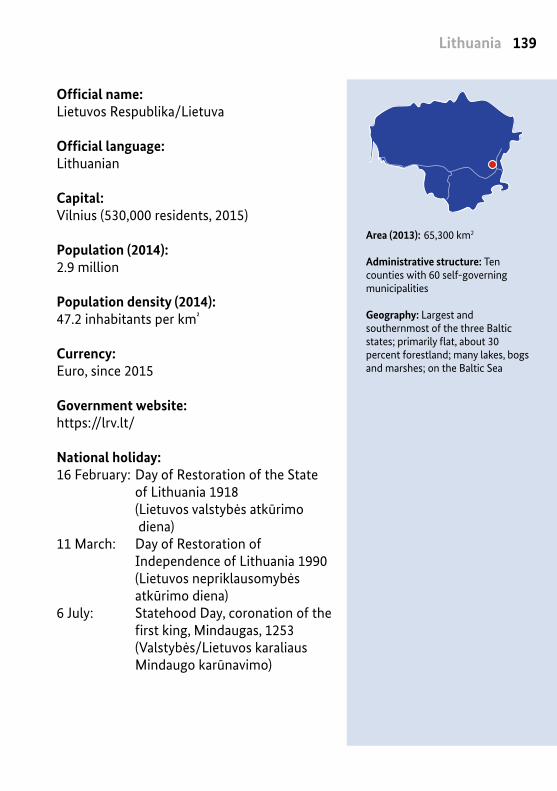
139Lithuania
Official name:Lietuvos Respublika/Lietuva
Official language: Lithuanian
Capital: Vilnius (530,000 residents, 2015)
Population (2014): 2.9 million
Population density (2014): 47.2 inhabitants per km²
Currency: Euro, since 2015
Government website: https://lrv.lt/
National holiday: 16 February: Day of Restoration of the State of Lithuania 1918 (Lietuvos valstybės atkūrimo diena) 11 March: Day of Restoration of Independence of Lithuania 1990 (Lietuvos nepriklausomybės atkūrimo diena) 6 July: Statehood Day, coronation of the first king, Mindaugas, 1253 (Valstybės/Lietuvos karaliaus Mindaugo karūnavimo)
Area (2013): 65,300 km2
Administrative structure: Ten counties with 60 self-governing municipalities
Geography: Largest and southernmost of the three Baltic states; primarily flat, about 30 percent forestland; many lakes, bogs and marshes; on the Baltic Sea
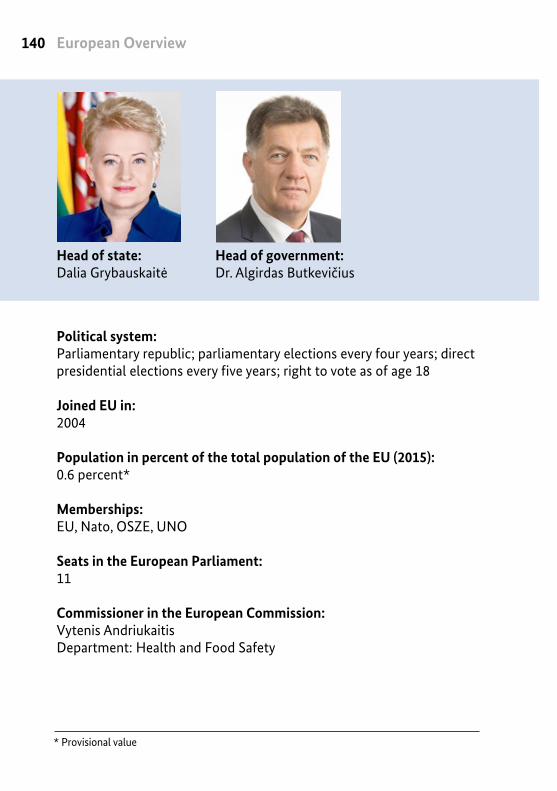
European Overview140
* Provisional value
Head of state: Dalia Grybauskaitė
Political system: Parliamentary republic; parliamentary elections every four years; direct presidential elections every five years; right to vote as of age 18
Joined EU in: 2004
Population in percent of the total population of the EU (2015):0.6 percent*
Memberships: EU, Nato, OSZE, UNO
Seats in the European Parliament: 11
Commissioner in the European Commission:Vytenis AndriukaitisDepartment: Health and Food Safety
Head of government: Dr. Algirdas Butkevičius

141Lithuania
** Break in series
Gross domestic product (in respective prices, 2013)GDP total 34.6 billion eurosGDP per capita 11,700 euro
Gross national income per capita p.a. (2013):15,100 US dollars
Annual mean income (2013):4,698 euros net
Monthly minimum wage (July 2015): 325 euro
Unemployment rate (March 2015): 9.0 percent
Youth unemployment rate (2014): 19.3 percent**
Adults who have completed higher education (2014):77.4 percent**
Age distribution
Population structure (2014):
Rural population
33 percent
Urban population 67 percent
ages 0 – 14
14 percent
ages 15 – 64
67 percent
over 65
19 percent
Men
46.0 percent
Women
54.0 percent
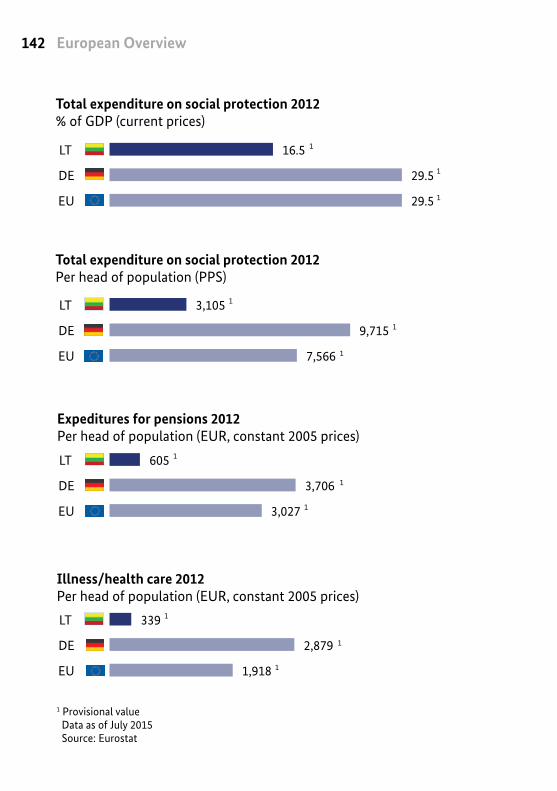
European Overview142
1 Provisional value Data as of July 2015 Source: Eurostat
16.5
29.5
29.5
LT
DE
EU 1
1
339
2,879
1,918
LT
DE
EU
1
1
1
3,105
9,715
7,566
LT
DE
EU
1
1
1
605
3,706
3,027
LT
DE
EU
1
1
1
DE
EU
LT
DE
EU
LT
DE
EU
LT
DE
EU
1
Total expenditure on social protection 2012% of GDP (current prices)
Illness/health care 2012Per head of population (EUR, constant 2005 prices)
Expeditures for pensions 2012Per head of population (EUR, constant 2005 prices)
Total expenditure on social protection 2012Per head of population (PPS)
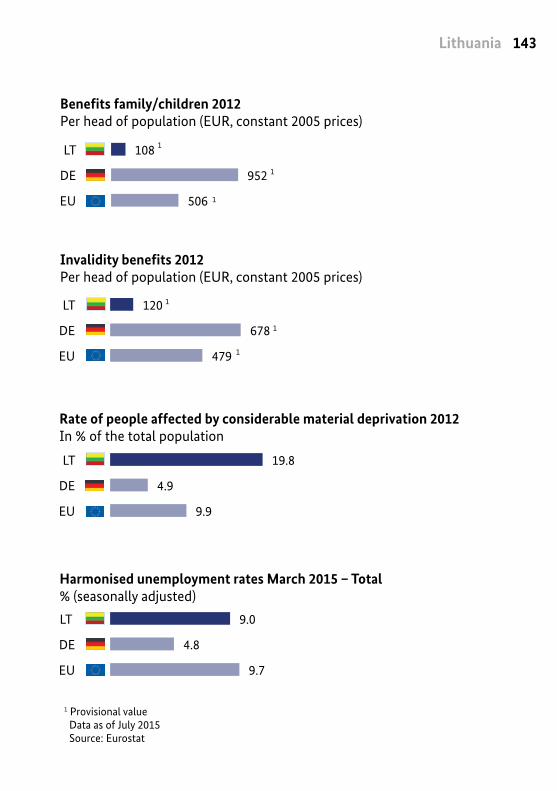
143Lithuania
1 Provisional value Data as of July 2015 Source: Eurostat
108
952
506
LT
DE
EU
1
1
1
120
678
479
LT
DE
EU
1
1
1
19.8
4.9
9.9
LT
DE
EU
9.0
4.8
9.7
LT
DE
EU
Harmonised unemployment rates March 2015 – Total% (seasonally adjusted)
Invalidity benefits 2012Per head of population (EUR, constant 2005 prices)
Benefits family/children 2012Per head of population (EUR, constant 2005 prices)
Rate of people affected by considerable material deprivation 2012In % of the total population
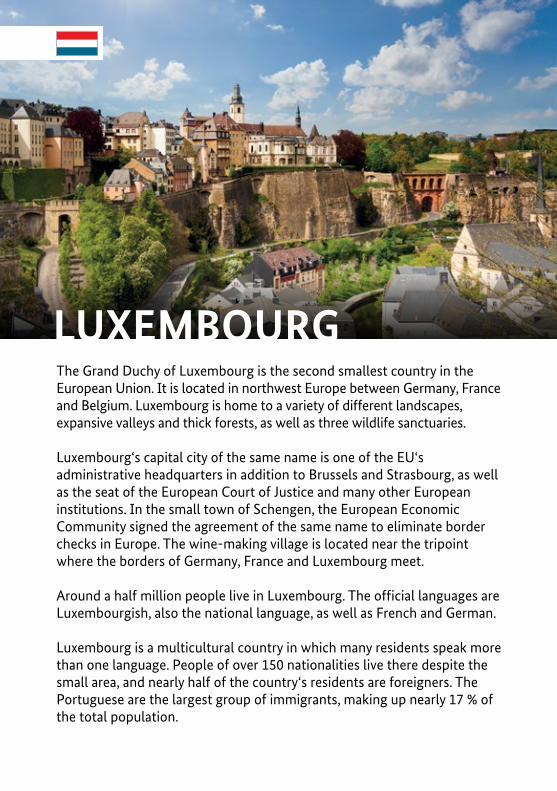
LUXEMBOURGThe Grand Duchy of Luxembourg is the second smallest country in the Euro pean Union. It is located in northwest Europe between Germany, France and Belgium. Luxembourg is home to a variety of different landscapes, expansive valleys and thick forests, as well as three wildlife sanctuaries.
Luxembourg‘s capital city of the same name is one of the EU‘s administrative headquarters in addition to Brussels and Strasbourg, as well as the seat of the European Court of Justice and many other European institutions. In the small town of Schengen, the European Economic Community signed the agreement of the same name to eliminate border checks in Europe. The wine-making village is located near the tripoint where the borders of Germany, France and Luxembourg meet.
Around a half million people live in Luxembourg. The official languages are Luxembourgish, also the national language, as well as French and German.
Luxembourg is a multicultural country in which many residents speak more than one language. People of over 150 nationalities live there despite the small area, and nearly half of the country‘s residents are foreigners. The Portuguese are the largest group of immigrants, making up nearly 17 % of the total population.
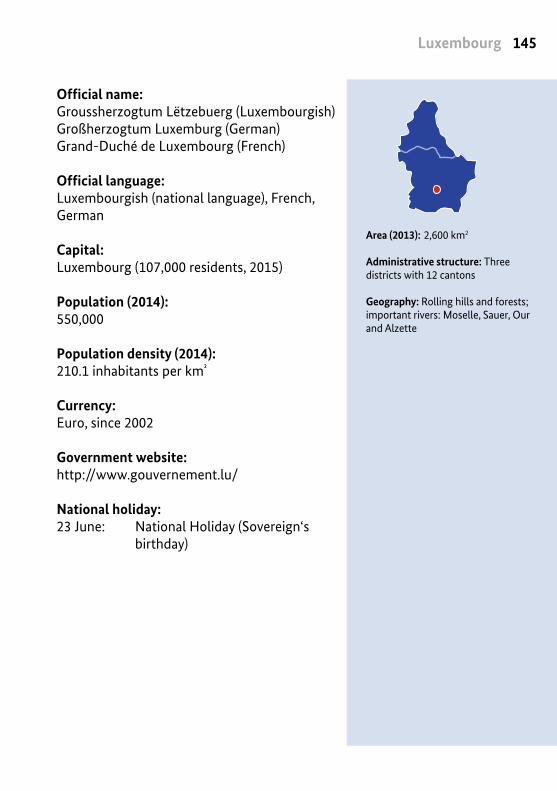
145Luxembourg
Official name:Groussherzogtum Lëtzebuerg (Luxembourgish)Großherzogtum Luxemburg (German)Grand-Duché de Luxembourg (French)
Official language: Luxembourgish (national language), French, German
Capital: Luxembourg (107,000 residents, 2015)
Population (2014): 550,000
Population density (2014): 210.1 inhabitants per km²
Currency: Euro, since 2002
Government website: http://www.gouvernement.lu/
National holiday: 23 June: National Holiday (Sovereign‘s birthday)
Area (2013): 2,600 km2
Administrative structure: Three districts with 12 cantons
Geography: Rolling hills and forests; important rivers: Moselle, Sauer, Our and Alzette
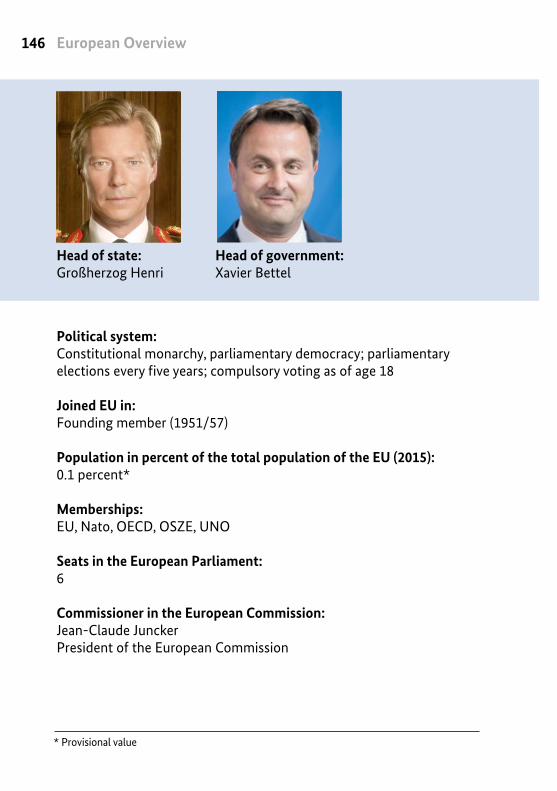
European Overview146
* Provisional value
Head of government: Xavier Bettel
Head of state: Großherzog Henri
Political system: Constitutional monarchy, parliamentary democracy; parliamentary elections every five years; compulsory voting as of age 18
Joined EU in: Founding member (1951/57)
Population in percent of the total population of the EU (2015):0.1 percent*
Memberships: EU, Nato, OECD, OSZE, UNO
Seats in the European Parliament: 6
Commissioner in the European Commission:Jean-Claude JunckerPresident of the European Commission

147Luxembourg
** Break in series
Age distribution
Population structure (2014):
Urban population 90 percent
Rural population
10 percent
over 65
14 percent
ages 15 – 64
69 percent
ages 0 – 14
17 percent
Men
50.1 percent
Women
49.9 percent
Gross domestic product (in respective prices, 2013)GDP total 45.5 billion eurosGDP per capita 83,400 euro
Gross national income per capita p.a. (2013):69,880 US dollars
Annual mean income (2013):33,301 euros net
Monthly minimum wage (July 2015): 1,923 euro
Unemployment rate (March 2015): 5.8 percent
Youth unemployment rate (2014): 22.6 percent**
Adults who have completed higher education (2014):82.9 percent**
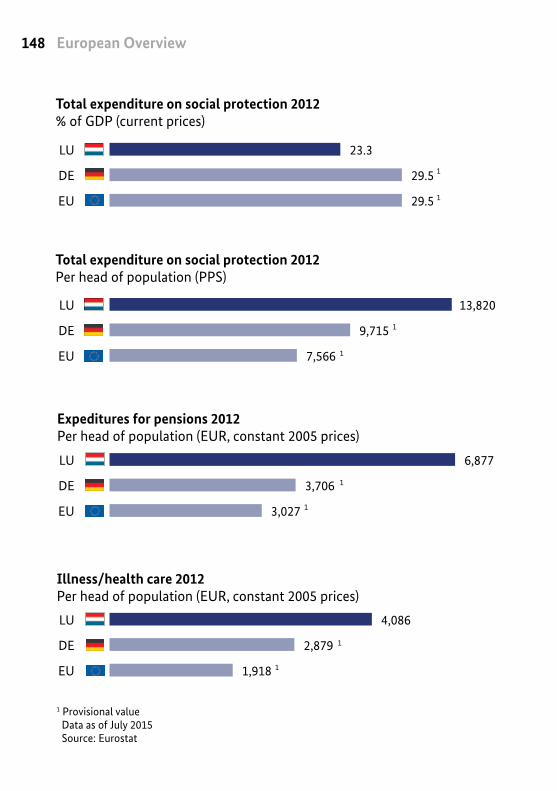
European Overview148
1 Provisional value Data as of July 2015 Source: Eurostat
23.3
29.5
29.5
LU
DE
EU 1
4,086
2,879
1,918
LU
DE
EU
1
1
13,820
9,715
7,566
LU
DE
EU
1
1
6,877
3,706
3,027
LU
DE
EU
1
1
EU
LU
DE
EU
LU
DE
EU
DE
EU
1
Total expenditure on social protection 2012% of GDP (current prices)
Illness/health care 2012Per head of population (EUR, constant 2005 prices)
Expeditures for pensions 2012Per head of population (EUR, constant 2005 prices)
Total expenditure on social protection 2012Per head of population (PPS)
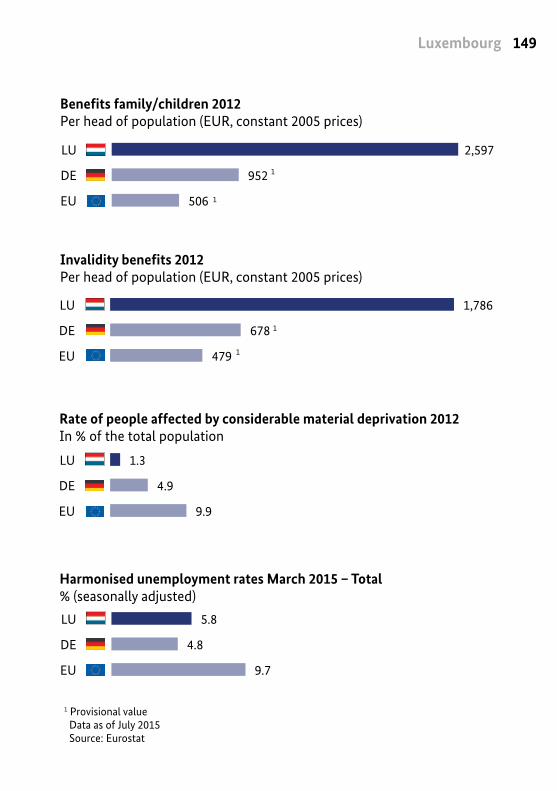
149Luxembourg
1 Provisional value Data as of July 2015 Source: Eurostat
2,597
952
506
LU
DE
EU
1
1
1,786
678
479
LU
DE
EU
1
1
1.3
4.9
9.9
LU
DE
EU
5.8
4.8
9.7
LU
DE
EU
Harmonised unemployment rates March 2015 – Total% (seasonally adjusted)
Invalidity benefits 2012Per head of population (EUR, constant 2005 prices)
Benefits family/children 2012Per head of population (EUR, constant 2005 prices)
Rate of people affected by considerable material deprivation 2012In % of the total population
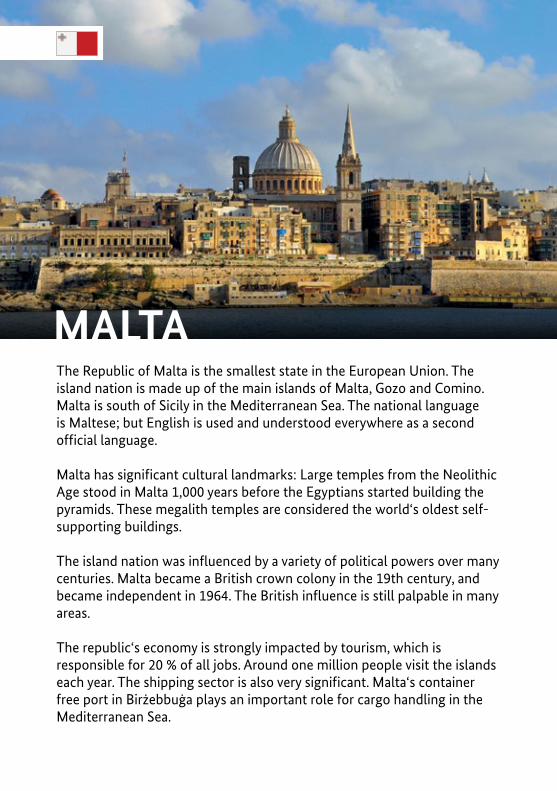
MALTAThe Republic of Malta is the smallest state in the European Union. The island nation is made up of the main islands of Malta, Gozo and Comino. Malta is south of Sicily in the Mediterranean Sea. The national language is Maltese; but English is used and understood everywhere as a second official language.
Malta has significant cultural landmarks: Large temples from the Neolithic Age stood in Malta 1,000 years before the Egyptians started building the pyramids. These megalith temples are considered the world‘s oldest self-supporting buildings.
The island nation was influenced by a variety of political powers over many centuries. Malta became a British crown colony in the 19th century, and became independent in 1964. The British influence is still palpable in many areas.
The republic‘s economy is strongly impacted by tourism, which is responsible for 20 % of all jobs. Around one million people visit the islands each year. The shipping sector is also very significant. Malta‘s container free port in Birżebbuġa plays an important role for cargo handling in the Mediterranean Sea.
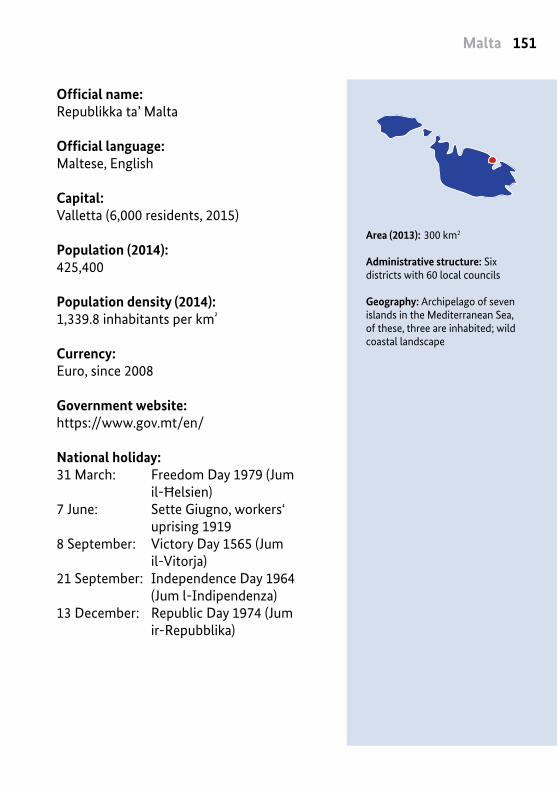
151Malta
Official name:Republikka ta’ Malta
Official language: Maltese, English
Capital: Valletta (6,000 residents, 2015)
Population (2014): 425,400
Population density (2014): 1,339.8 inhabitants per km²
Currency: Euro, since 2008
Government website: https://www.gov.mt/en/
National holiday: 31 March: Freedom Day 1979 (Jum il-Ħelsien)7 June: Sette Giugno, workers‘ uprising 1919 8 September: Victory Day 1565 (Jum il-Vitorja)21 September: Independence Day 1964 (Jum l-Indipendenza)13 December: Republic Day 1974 (Jum ir-Repubblika)
Area (2013): 300 km2
Administrative structure: Six districts with 60 local councils
Geography: Archipelago of seven islands in the Mediterranean Sea, of these, three are inhabited; wild coastal landscape
European Overview152
* Provisional value
Head of government: Joseph Muscat
Head of state: Marie-Louise Coleiro Preca
Political system: Constitutional monarchy, parliamentary democracy; parliamentary elections every five years; compulsory voting as of age 18
Joined EU in: 2004
Population in percent of the total population of the EU (2015):0.1 percent*
Memberships: EU, OSZE, UNO
Seats in the European Parliament: 6
Commissioner in the European Commission:Karmenu VellaDepartment: Environment, Maritime Affairs and Fisheries
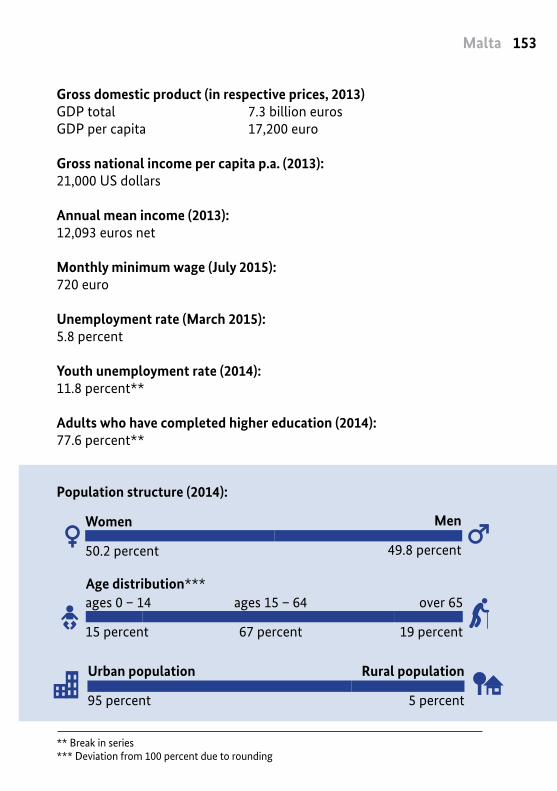
153Malta
Population structure (2014):
** Break in series*** Deviation from 100 percent due to rounding
Age distribution***
Urban population 95 percent
Rural population
5 percent
over 65
19 percent
ages 15 – 64
67 percent
ages 0 – 14
15 percent
Men
49.8 percent
Women
50.2 percent
Gross domestic product (in respective prices, 2013)GDP total 7.3 billion eurosGDP per capita 17,200 euro
Gross national income per capita p.a. (2013):21,000 US dollars
Annual mean income (2013):12,093 euros net
Monthly minimum wage (July 2015): 720 euro
Unemployment rate (March 2015): 5.8 percent
Youth unemployment rate (2014): 11.8 percent**
Adults who have completed higher education (2014):77.6 percent**
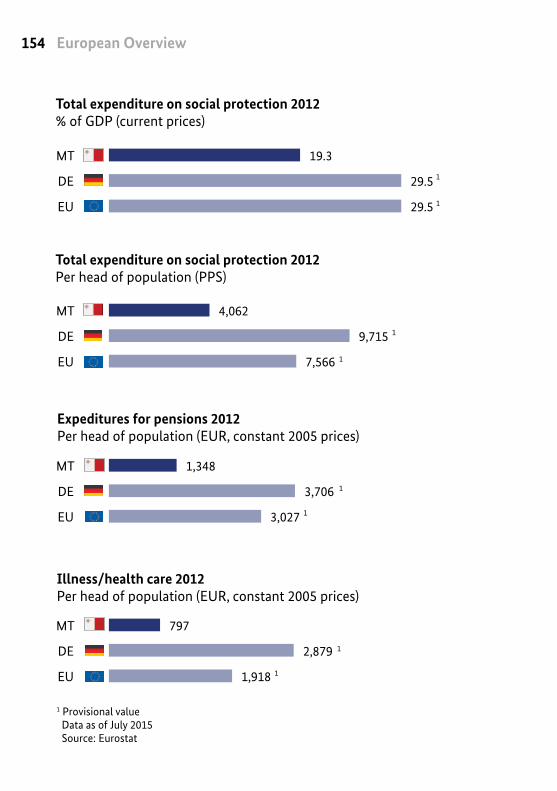
European Overview154
1 Provisional value Data as of July 2015 Source: Eurostat
168
952
506
MT
DE
EU
1
1
105
678
479
MT
DE
EU
1
1
9.2
4.9
9.9
MT
DE
EU
5.8
4.8
9.7
MT
DE
EU
19.3
29.5
29.5
MT
DE
EU 1
797
2,879
1,918
MT
DE
EU
1
1
4,062
9,715
7,566
MT
DE
EU
1
1
1,348
3,706
3,027
MT
DE
EU
1
1
MT
EU
MT
DE
EU
MT
DE
EU
MT
DE
EU
1
Total expenditure on social protection 2012% of GDP (current prices)
Illness/health care 2012Per head of population (EUR, constant 2005 prices)
Expeditures for pensions 2012Per head of population (EUR, constant 2005 prices)
Total expenditure on social protection 2012Per head of population (PPS)
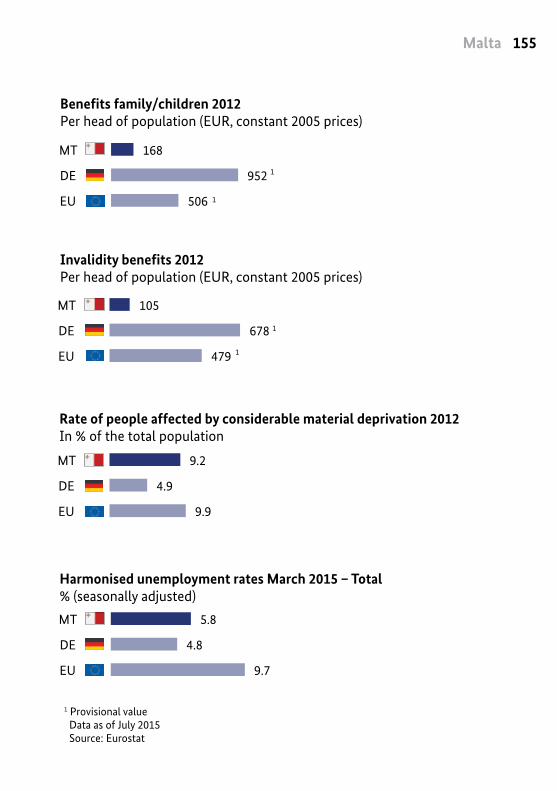
155Malta
1 Provisional value Data as of July 2015 Source: Eurostat
168
952
506
MT
DE
EU
1
1
105
678
479
MT
DE
EU
1
1
9.2
4.9
9.9
MT
DE
EU
5.8
4.8
9.7
MT
DE
EU
Harmonised unemployment rates March 2015 – Total% (seasonally adjusted)
Invalidity benefits 2012Per head of population (EUR, constant 2005 prices)
Benefits family/children 2012Per head of population (EUR, constant 2005 prices)
Rate of people affected by considerable material deprivation 2012In % of the total population
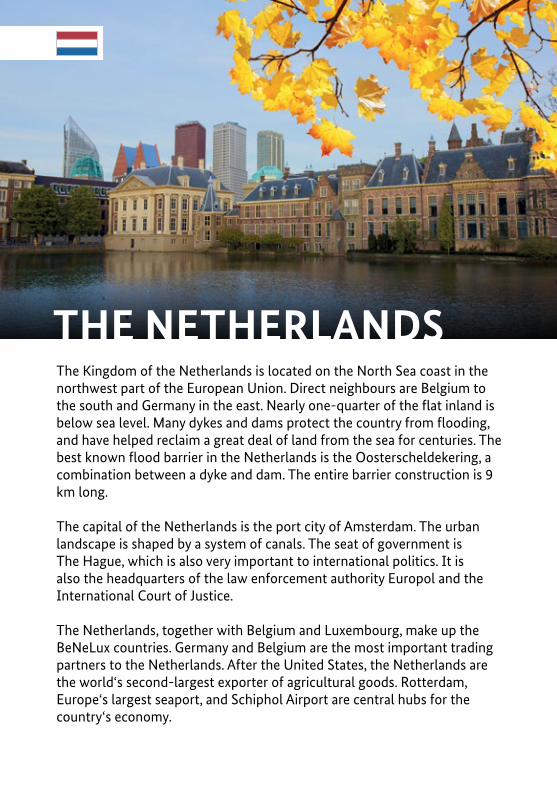
THE NETHERLANDSThe Kingdom of the Netherlands is located on the North Sea coast in the northwest part of the European Union. Direct neighbours are Belgium to the south and Germany in the east. Nearly one-quarter of the flat inland is below sea level. Many dykes and dams protect the country from flooding, and have helped reclaim a great deal of land from the sea for centuries. The best known flood barrier in the Netherlands is the Oosterscheldekering, a combination between a dyke and dam. The entire barrier construction is 9 km long.
The capital of the Netherlands is the port city of Amsterdam. The urban landscape is shaped by a system of canals. The seat of government is The Hague, which is also very important to international politics. It is also the headquarters of the law enforcement authority Europol and the International Court of Justice.
The Netherlands, together with Belgium and Luxembourg, make up the BeNeLux countries. Germany and Belgium are the most important trading partners to the Netherlands. After the United States, the Netherlands are the world‘s second-largest exporter of agricultural goods. Rotterdam, Europe‘s largest seaport, and Schiphol Airport are central hubs for the country‘s economy.
157The Netherlands
Area (2013): 41,500 km2
Administrative structure: Twelve provinces; dependent territories: BES islands Bonaire, Sint Eustatius and Saba in the Caribbean. The Netherlands belong to the Kingdom of the Netherlands, which consists of the European area with the BES islands and the islands of Aruba, Curaçao and Sint Maarten (also in the Caribbean).
Geography: Lowlands shaped by the coast, one-quarter of the country is below sea level; dikes cover an area of 3,000 km, parts of the country (polders) were re claimed from the sea; Rhine-Meuse-Scheldt Delta
Official name:Koninkrijk der Nederlanden
Official language: Dutch
Capital: Amsterdam (811,000 residents, 2015)
Seat of Government:The Hague
Population (2014): 16.8 million
Population density (2014): 498.4 inhabitants per km²
Currency: Euro, since 2002
Government website: https://www.government.nl/
National holiday: 27 April: King‘s Day (Koningsdag)
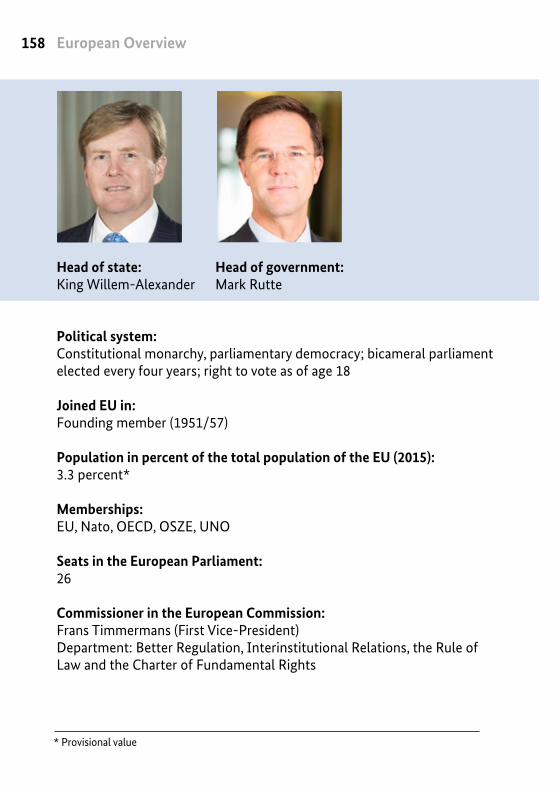
European Overview158
* Provisional value
Head of government: Mark Rutte
Head of state: King Willem-Alexander
Political system: Constitutional monarchy, parliamentary democracy; bicameral parliament elected every four years; right to vote as of age 18
Joined EU in: Founding member (1951/57)
Population in percent of the total population of the EU (2015):3.3 percent*
Memberships: EU, Nato, OECD, OSZE, UNO
Seats in the European Parliament: 26
Commissioner in the European Commission:Frans Timmermans (First Vice-President) Department: Better Regulation, Interinstitutional Relations, the Rule of Law and the Charter of Fundamental Rights

159The Netherlands
Population structure (2014):
** Break in series*** Deviation from 100 percent due to rounding
Age distribution***
Rural population
10 percent
Urban population 90 percent
ages 0 – 14
17 percent
ages 15 – 64
66 percent
over 65
18 percent
Men
49.6 percent
Women
50.4 percent
Gross domestic product (in respective prices, 2013)GDP total 602.7 billion eurosGDP per capita 35,900 euro
Gross national income per capita p.a. (2013):51,060 US dollars
Annual mean income (2013):20,839 euros net
Monthly minimum wage (July 2015): 1,508 euro
Unemployment rate (March 2015): 7.0 percent
Youth unemployment rate (2014): 12.7 percent**
Adults who have completed higher education (2014):89.5 percent**
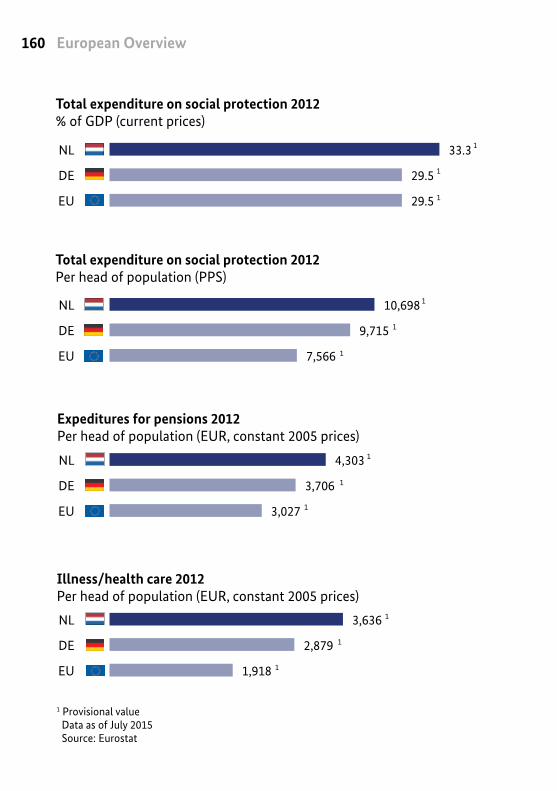
European Overview160
1 Provisional value Data as of July 2015 Source: Eurostat
33.3
29.5
29.5
NL
DE
EU 1
1
3,636
2,879
1,918
NL
DE
EU
1
1
1
10,698
9,715
7,566
NL
DE
EU
1
1
1
4,303
3,706
3,027
NL
DE
EU
1
1
1
NL
DE
EU
NL
DE
EU
NL
DE
EU
NL
DE
EU
1
Total expenditure on social protection 2012% of GDP (current prices)
Illness/health care 2012Per head of population (EUR, constant 2005 prices)
Expeditures for pensions 2012Per head of population (EUR, constant 2005 prices)
Total expenditure on social protection 2012Per head of population (PPS)
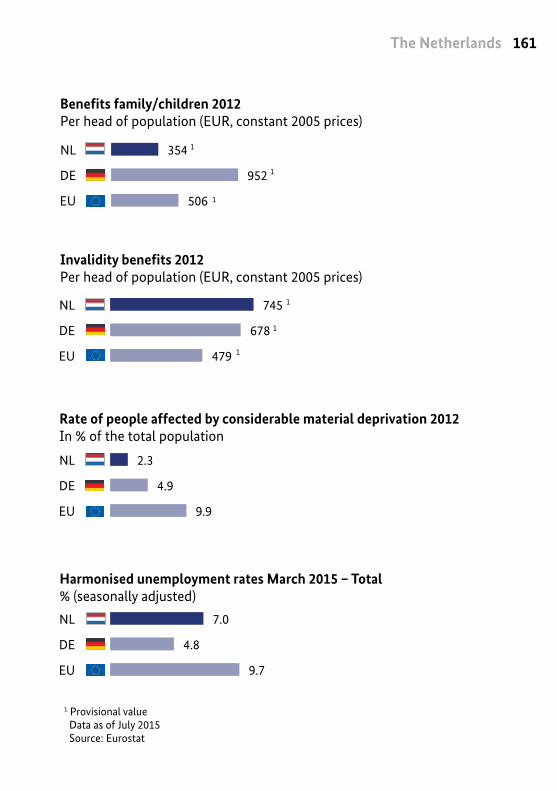
161The Netherlands
1 Provisional value Data as of July 2015 Source: Eurostat
354
952
506
NL
DE
EU
1
1
1
745
678
479
NL
DE
EU
1
1
1
2.3
4.9
9.9
NL
DE
EU
7.0
4.8
9.7
NL
DE
EU
Harmonised unemployment rates March 2015 – Total% (seasonally adjusted)
Invalidity benefits 2012Per head of population (EUR, constant 2005 prices)
Benefits family/children 2012Per head of population (EUR, constant 2005 prices)
Rate of people affected by considerable material deprivation 2012In % of the total population
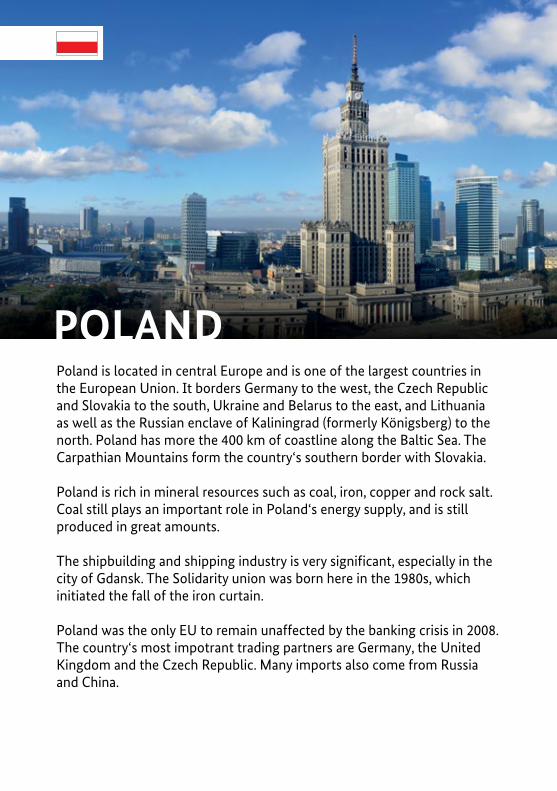
POLANDPoland is located in central Europe and is one of the largest countries in the European Union. It borders Germany to the west, the Czech Republic and Slovakia to the south, Ukraine and Belarus to the east, and Lithuania as well as the Russian enclave of Kaliningrad (formerly Königsberg) to the north. Poland has more the 400 km of coastline along the Baltic Sea. The Carpathian Mountains form the country‘s southern border with Slovakia.
Poland is rich in mineral resources such as coal, iron, copper and rock salt. Coal still plays an important role in Poland‘s energy supply, and is still produced in great amounts.
The shipbuilding and shipping industry is very significant, especially in the city of Gdansk. The Solidarity union was born here in the 1980s, which initiated the fall of the iron curtain.
Poland was the only EU to remain unaffected by the banking crisis in 2008. The country‘s most impotrant trading partners are Germany, the United Kingdom and the Czech Republic. Many imports also come from Russia and China.
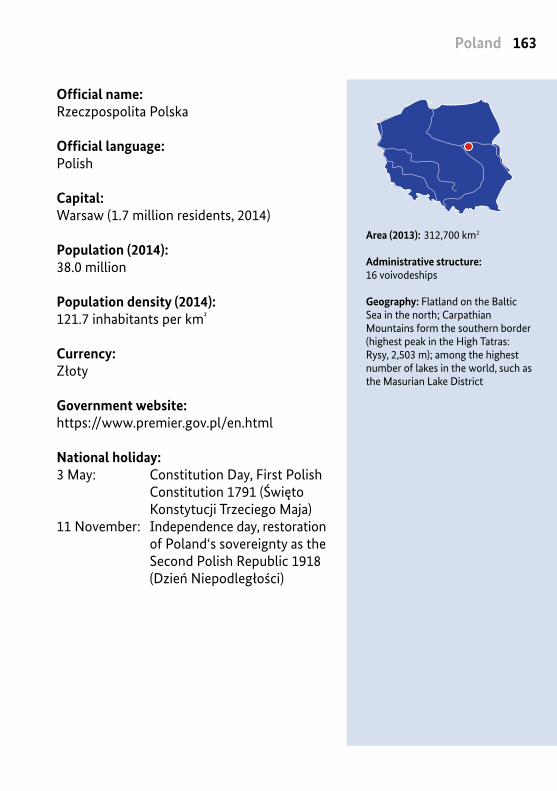
163Poland
Area (2013): 312,700 km2
Administrative structure: 16 voivodeships
Geography: Flatland on the Baltic Sea in the north; Carpathian Mountains form the southern border (highest peak in the High Tatras: Rysy, 2,503 m); among the highest number of lakes in the world, such as the Masurian Lake District
Official name:Rzeczpospolita Polska
Official language: Polish
Capital: Warsaw (1.7 million residents, 2014)
Population (2014): 38.0 million
Population density (2014): 121.7 inhabitants per km²
Currency: Złoty
Government website: https://www.premier.gov.pl/en.html
National holiday: 3 May: Constitution Day, First Polish Constitution 1791 (Święto Konstytucji Trzeciego Maja) 11 November: Independence day, restoration of Poland‘s sovereignty as the Second Polish Republic 1918 (Dzień Niepodległości)
European Overview164
* Provisional value
Head of government: Beata Szydlo
Head of state: Andrzej Duda
Political system: Parliamentary republic; parliamentary elections every four years; direct presidential elections every five years; right to vote as of age 18
Joined EU in: 2004
Population in percent of the total population of the EU (2015):7.5 percent*
Memberships: EU, Nato, OECD, OSZE, UNO
Seats in the European Parliament: 51
Commissioner in the European Commission:Elżbieta BieńkowskaDepartment: Internal Market, Industry, Entrepreneurship and SMEs

165Poland
** Break in series
Age distribution
Population structure (2014):
Gross domestic product (in respective prices, 2013)GDP total 389.7 billion eurosGDP per capita 10,100 euro
Gross national income per capita p.a. (2013):13.440 US dollars
Annual mean income (2013):5.164 euros net
Monthly minimum wage (July 2015): 418 euro
Unemployment rate (March 2015): 7.9 percent
Youth unemployment rate (2014): 23.9 percent**
Adults who have completed higher education (2014):82.0 percent**
Rural population
39 percent
Urban population 61 percent
ages 0 – 14
15 percent
ages 15 – 64
70 percent
over 65
15 percent
Men
48.4 percent
Women
51.6 percent
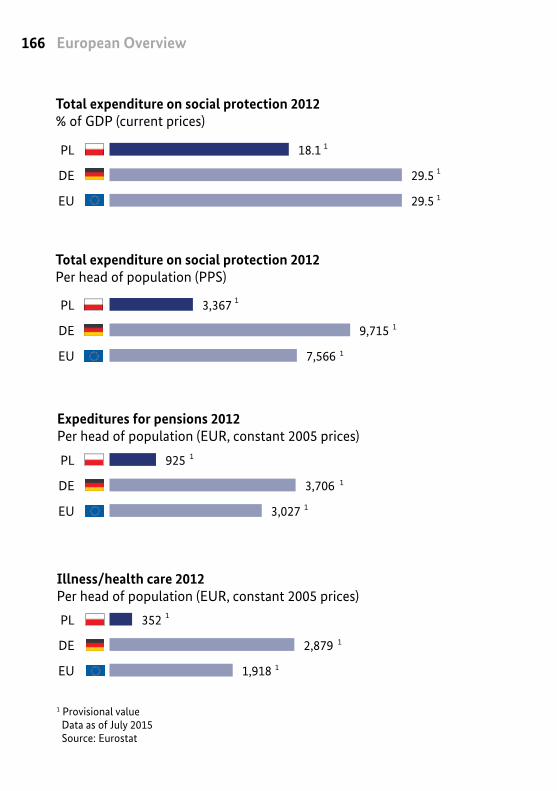
European Overview166
1 Provisional value Data as of July 2015 Source: Eurostat
18.1
29.5
29.5
PL
DE
EU 1
1
352
2,879
1,918
PL
DE
EU
1
1
1
3,367
9,715
7,566
PL
DE
EU
1
1
1
925
3,706
3,027
PL
DE
EU
1
1
1
DE
EU
DE
EU
DE
EU
PL
DE
EU
1
Total expenditure on social protection 2012% of GDP (current prices)
Illness/health care 2012Per head of population (EUR, constant 2005 prices)
Expeditures for pensions 2012Per head of population (EUR, constant 2005 prices)
Total expenditure on social protection 2012Per head of population (PPS)
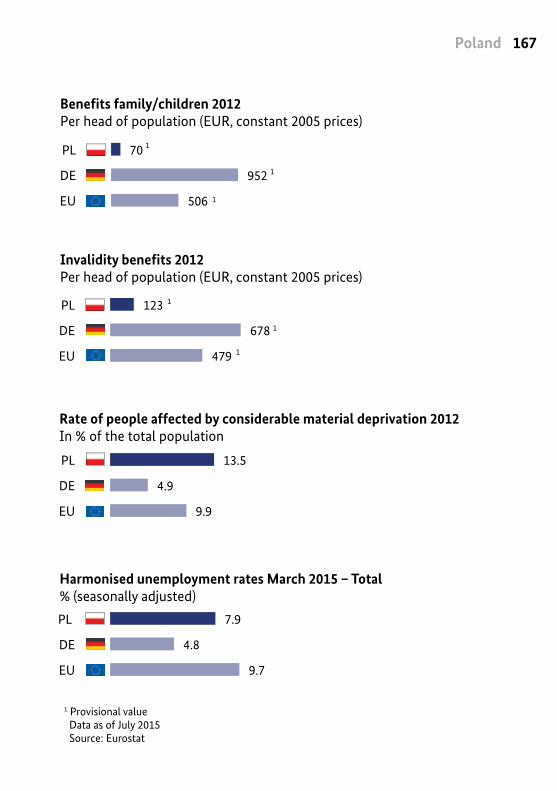
167Poland
1 Provisional value Data as of July 2015 Source: Eurostat
70
952
506
PL
DE
EU
1
1
1
123
678
479
PL
DE
EU
1
1
1
13.5
4.9
9.9
PL
DE
EU
7.9
4.8
9.7
PL
DE
EU
Harmonised unemployment rates March 2015 – Total% (seasonally adjusted)
Invalidity benefits 2012Per head of population (EUR, constant 2005 prices)
Benefits family/children 2012Per head of population (EUR, constant 2005 prices)
Rate of people affected by considerable material deprivation 2012In % of the total population
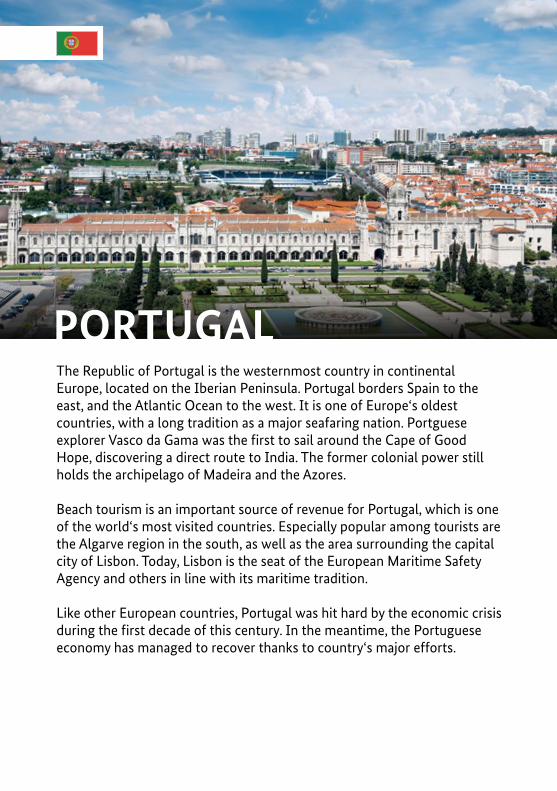
PORTUGALThe Republic of Portugal is the westernmost country in continental Europe, located on the Iberian Peninsula. Portugal borders Spain to the east, and the Atlantic Ocean to the west. It is one of Europe‘s oldest countries, with a long tradition as a major seafaring nation. Portguese explorer Vasco da Gama was the first to sail around the Cape of Good Hope, discovering a direct route to India. The former colonial power still holds the archipelago of Madeira and the Azores.
Beach tourism is an important source of revenue for Portugal, which is one of the world‘s most visited countries. Especially popular among tourists are the Algarve region in the south, as well as the area surrounding the capital city of Lisbon. Today, Lisbon is the seat of the European Maritime Safety Agency and others in line with its maritime tradition.
Like other European countries, Portugal was hit hard by the economic crisis during the first decade of this century. In the meantime, the Portuguese economy has managed to recover thanks to country‘s major efforts.

169Portugal
Area (2013): 92,200 km2
Administrative structure: 18 districts and two autonomous regions (Azores and Madeira); dependent territories: Azores and Madeira
Geography: Located on the Iberian Peninsula on the Atlantic Ocean; longest river: Tagus, divides the country into a green, mountainous north and a rather flat, dry south; southernmost region: Algarve
Official name:República Portuguesa
Official language: Portuguese
Capital: Lisbon (548,000 residents, 2015)
Population (2014): 10.4 million
Population density (2014): 113.4 inhabitants per km²
Currency: Euro, since 2002
Government website: http://www.portugal.gov.pt/en.aspx
National holiday: 10 June: Day of Portugal Day, and the Portuguese Communities, death of national literary icon Luís de Camões 1580 (Dia de Portugal de Camões e das Comunidades Portuguesas)
169
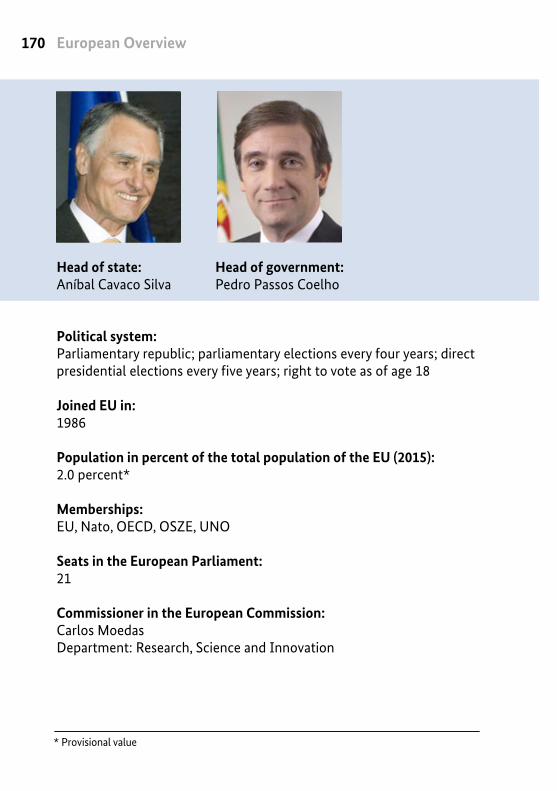
European Overview170
* Provisional value
Head of government: Pedro Passos Coelho
Head of state: Aníbal Cavaco Silva
Political system: Parliamentary republic; parliamentary elections every four years; direct presidential elections every five years; right to vote as of age 18
Joined EU in: 1986
Population in percent of the total population of the EU (2015):2.0 percent*
Memberships: EU, Nato, OECD, OSZE, UNO
Seats in the European Parliament: 21
Commissioner in the European Commission:Carlos MoedasDepartment: Research, Science and Innovation

171Portugal
Population structure (2014):
Age distribution***
Gross domestic product (in respective prices, 2013)GDP total 165.7 billion eurosGDP per capita 15,800 euro
Gross national income per capita p.a. (2013):21,310 US dollars
Annual mean income (2013):8,177 euros net
Monthly minimum wage (July 2015): 589 euro
Unemployment rate (March 2015): 13.2 percent
Youth unemployment rate (2014): 34.8 percent**
Adults who have completed higher education (2014):83.1 percent**
** Break in series*** Deviation from 100 percent due to rounding
Rural population
37 percent
Urban population 63 percent
ages 0 – 14
14 percent
ages 15 – 64
65 percent
over 65
20 percent
Men
47.4 percent
Women
52.6 percent
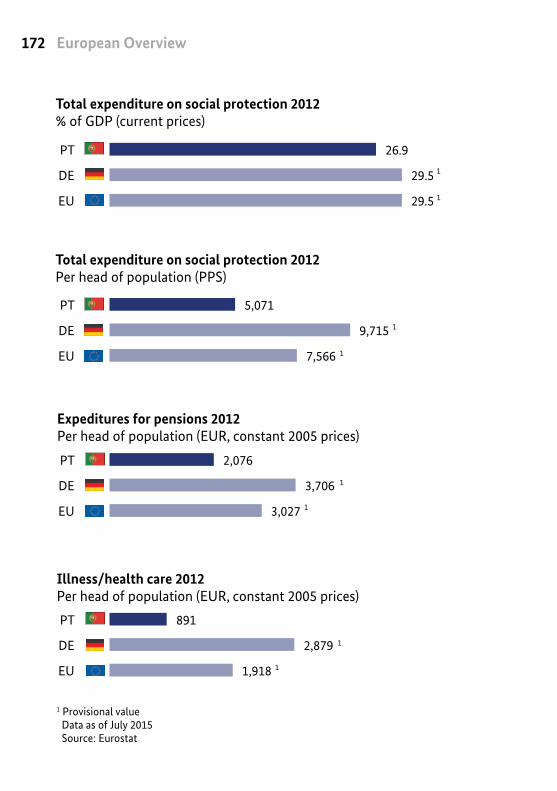
European Overview172
1 Provisional value Data as of July 2015 Source: Eurostat
26.9
29.5
29.5
PT
DE
EU 1
891
2,879
1,918
PT
DE
EU
1
1
5,071
9,715
7,566
PT
DE
EU
1
1
2,076
3,706
3,027
PT
DE
EU
1
1
EU
PT
DE
EU
PT
DE
EU
PT
DE
EU
1
Total expenditure on social protection 2012% of GDP (current prices)
Illness/health care 2012Per head of population (EUR, constant 2005 prices)
Expeditures for pensions 2012Per head of population (EUR, constant 2005 prices)
Total expenditure on social protection 2012Per head of population (PPS)
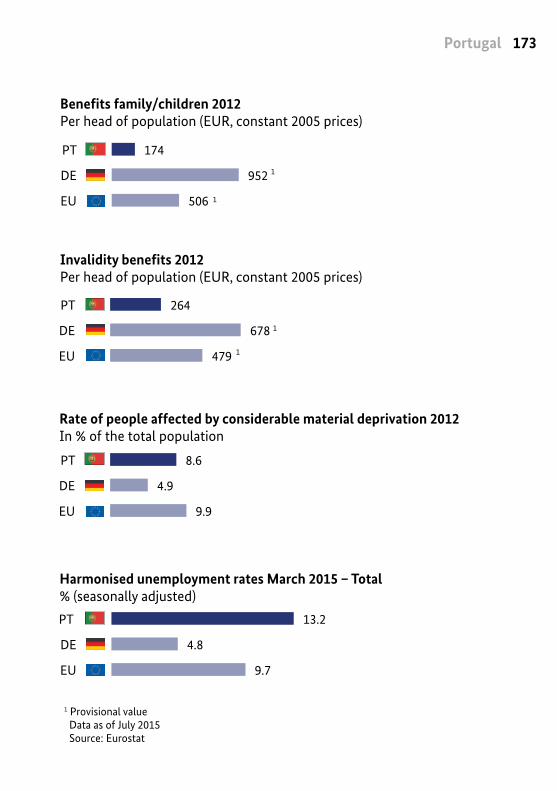
173Portugal
1 Provisional value Data as of July 2015 Source: Eurostat
174
952
506
PT
DE
EU
1
1
264
678
479
PT
DE
EU
1
1
8.6
4.9
9.9
PT
DE
EU
13.2
4.8
9.7
PT
DE
EU
Harmonised unemployment rates March 2015 – Total% (seasonally adjusted)
Invalidity benefits 2012Per head of population (EUR, constant 2005 prices)
Benefits family/children 2012Per head of population (EUR, constant 2005 prices)
Rate of people affected by considerable material deprivation 2012In % of the total population
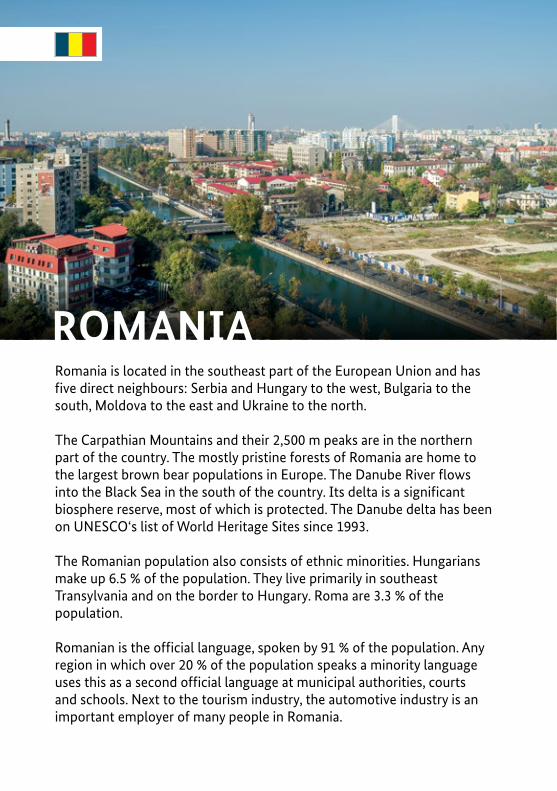
ROMANIARomania is located in the southeast part of the European Union and has five direct neighbours: Serbia and Hungary to the west, Bulgaria to the south, Moldova to the east and Ukraine to the north.
The Carpathian Mountains and their 2,500 m peaks are in the northern part of the country. The mostly pristine forests of Romania are home to the largest brown bear populations in Europe. The Danube River flows into the Black Sea in the south of the country. Its delta is a significant biosphere reserve, most of which is protected. The Danube delta has been on UNESCO‘s list of World Heritage Sites since 1993.
The Romanian population also consists of ethnic minorities. Hungarians make up 6.5 % of the population. They live primarily in southeast Transylvania and on the border to Hungary. Roma are 3.3 % of the population.
Romanian is the official language, spoken by 91 % of the population. Any region in which over 20 % of the population speaks a minority language uses this as a second official language at municipal authorities, courts and schools. Next to the tourism industry, the automotive industry is an important employer of many people in Romania.
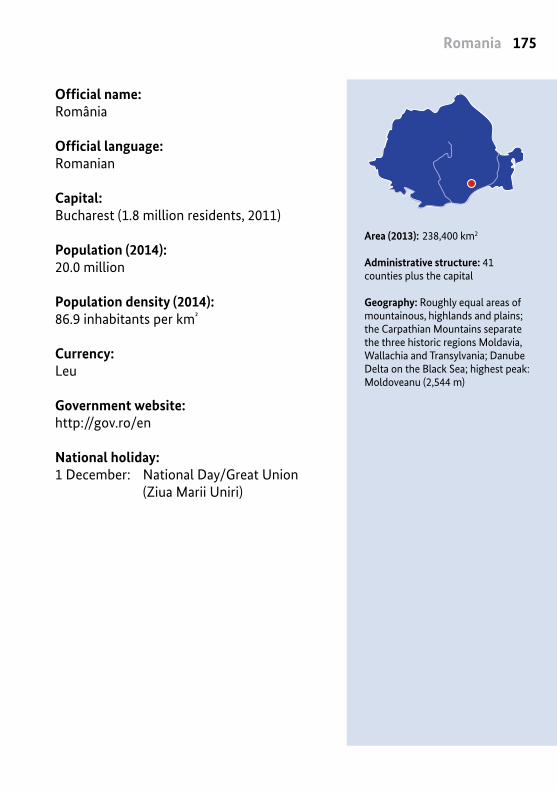
175Romania
Area (2013): 238,400 km2
Administrative structure: 41 counties plus the capital
Geography: Roughly equal areas of mountainous, highlands and plains; the Carpathian Mountains separate the three historic regions Moldavia, Wallachia and Transylvania; Danube Delta on the Black Sea; highest peak: Moldoveanu (2,544 m)
Official name:România
Official language: Romanian
Capital: Bucharest (1.8 million residents, 2011)
Population (2014): 20.0 million
Population density (2014): 86.9 inhabitants per km²
Currency: Leu
Government website: http://gov.ro/en
National holiday: 1 December: National Day/Great Union (Ziua Marii Uniri)
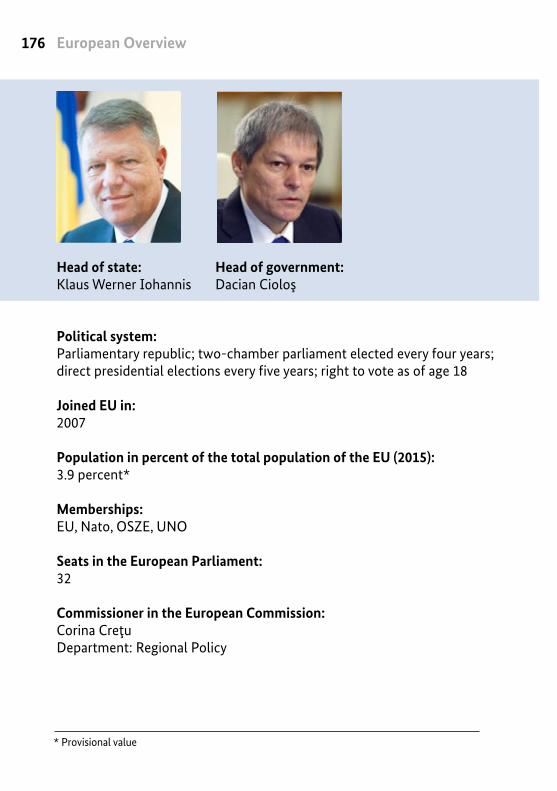
European Overview176
* Provisional value
Head of government: Dacian Cioloş
Head of state: Klaus Werner Iohannis
Political system: Parliamentary republic; two-chamber parliament elected every four years; direct presidential elections every five years; right to vote as of age 18
Joined EU in: 2007
Population in percent of the total population of the EU (2015):3.9 percent*
Memberships: EU, Nato, OSZE, UNO
Seats in the European Parliament: 32
Commissioner in the European Commission:Corina CreţuDepartment: Regional Policy

177Romania
** Break in series
Age distribution
Population structure (2014):
Rural population
46 percent
Urban population 54 percent
ages 0 – 14
16 percent
ages 15 – 64
67 percent
over 65
17 percent
Men
48.5 percent
Women
51.5 percent
Gross domestic product (in respective prices, 2013)GDP total 142.2 billion eurosGDP per capita 7,100 euro
Gross national income per capita p.a. (2013):9,050 US dollars
Annual mean income (2013):2,066 euros net
Monthly minimum wage (July 2015): 235 euro
Unemployment rate (March 2015): 6.8 percent
Youth unemployment rate (2014): 24.0 percent**
Adults who have completed higher education (2014):42.2 percent**
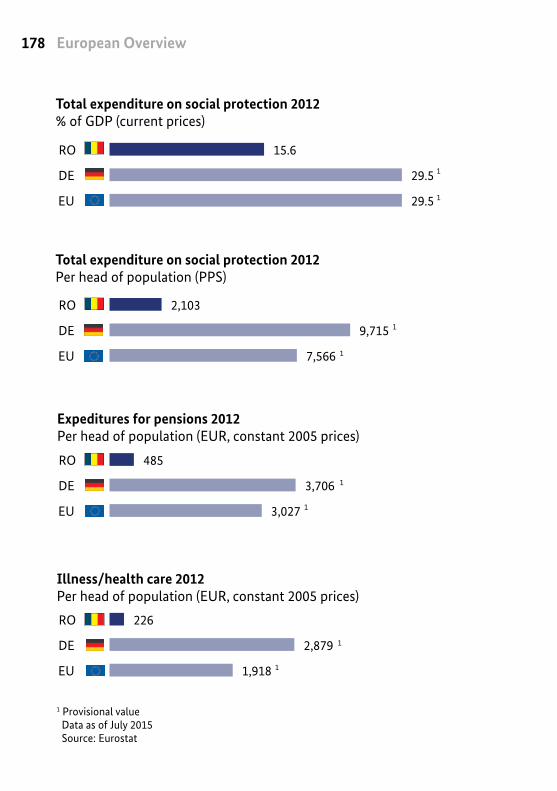
European Overview178
1 Provisional value Data as of July 2015 Source: Eurostat
15.6
29.5
29.5
RO
DE
EU 1
226
2,879
1,918
RO
DE
EU
1
1
2,103
9,715
7,566
RO
DE
EU
1
1
485
3,706
3,027
RO
DE
EU
1
1
EU
RO
DE
EU
RO
DE
EU
DE
EU
1
Total expenditure on social protection 2012% of GDP (current prices)
Illness/health care 2012Per head of population (EUR, constant 2005 prices)
Expeditures for pensions 2012Per head of population (EUR, constant 2005 prices)
Total expenditure on social protection 2012Per head of population (PPS)
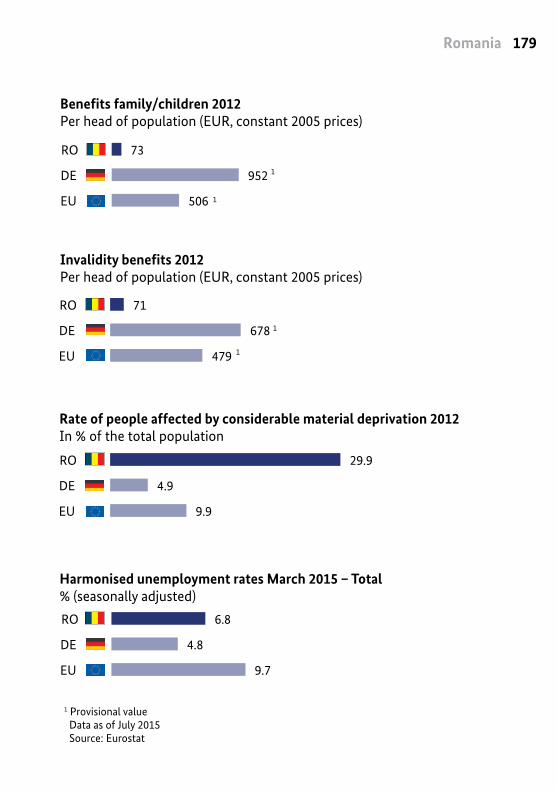
179Romania
1 Provisional value Data as of July 2015 Source: Eurostat
73
952
506
RO
DE
EU
1
1
71
678
479
RO
DE
EU
1
1
29.9
4.9
9.9
RO
DE
EU
6.8
4.8
9.7
RO
DE
EU
Harmonised unemployment rates March 2015 – Total% (seasonally adjusted)
Invalidity benefits 2012Per head of population (EUR, constant 2005 prices)
Benefits family/children 2012Per head of population (EUR, constant 2005 prices)
Rate of people affected by considerable material deprivation 2012In % of the total population
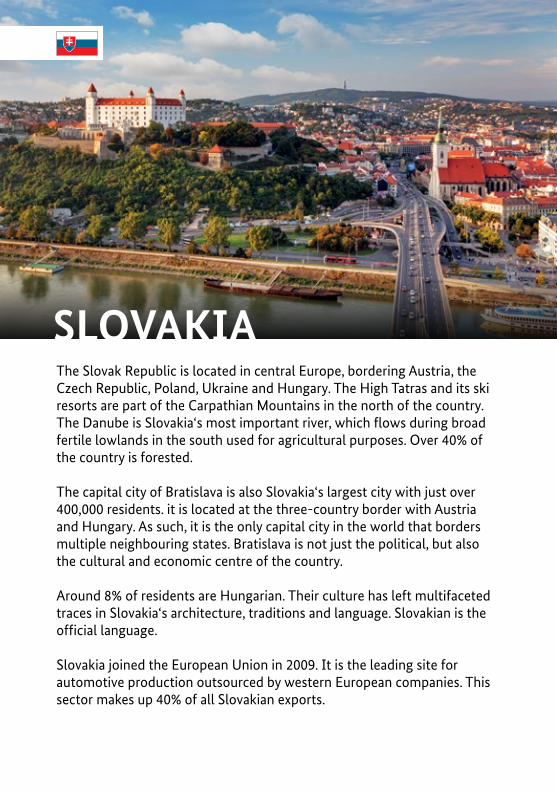
SLOVAKIAThe Slovak Republic is located in central Europe, bordering Austria, the Czech Republic, Poland, Ukraine and Hungary. The High Tatras and its ski resorts are part of the Carpathian Mountains in the north of the country. The Danube is Slovakia‘s most important river, which flows during broad fertile lowlands in the south used for agricultural purposes. Over 40% of the country is forested.
The capital city of Bratislava is also Slovakia‘s largest city with just over 400,000 residents. it is located at the three-country border with Austria and Hungary. As such, it is the only capital city in the world that borders multiple neighbouring states. Bratislava is not just the political, but also the cultural and economic centre of the country.
Around 8% of residents are Hungarian. Their culture has left multifaceted traces in Slovakia‘s architecture, traditions and language. Slovakian is the official language.
Slovakia joined the European Union in 2009. It is the leading site for automotive production outsourced by western European companies. This sector makes up 40% of all Slovakian exports.
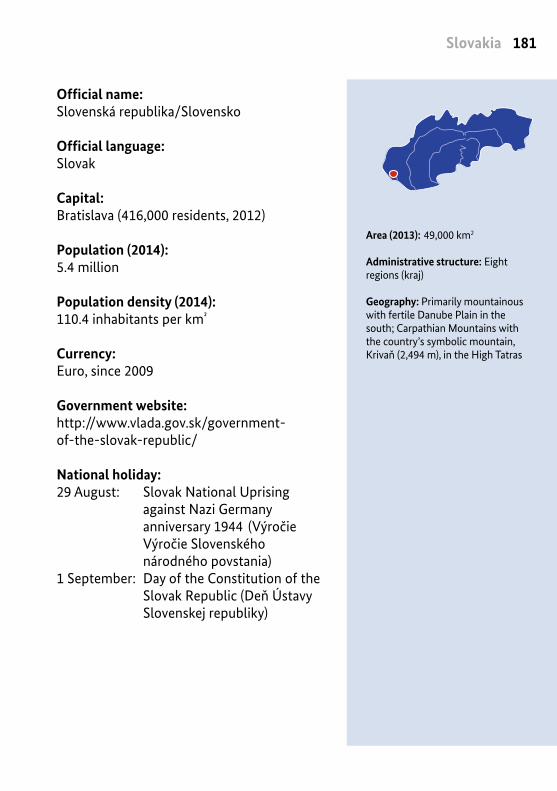
181Slovakia
Area (2013): 49,000 km2
Administrative structure: Eight regions (kraj)
Geography: Primarily mountainous with fertile Danube Plain in the south; Carpathian Mountains with the country’s symbolic mountain, Krivaň (2,494 m), in the High Tatras
Official name:Slovenská republika/Slovensko
Official language: Slovak
Capital: Bratislava (416,000 residents, 2012)
Population (2014): 5.4 million
Population density (2014): 110.4 inhabitants per km²
Currency: Euro, since 2009
Government website: http://www.vlada.gov.sk/government- of-the-slovak-republic/
National holiday: 29 August: Slovak National Uprising against Nazi Germany anniversary 1944 (Výročie Výročie Slovenského národného povstania)1 September: Day of the Constitution of the Slovak Republic (Deň Ústavy Slovenskej republiky)
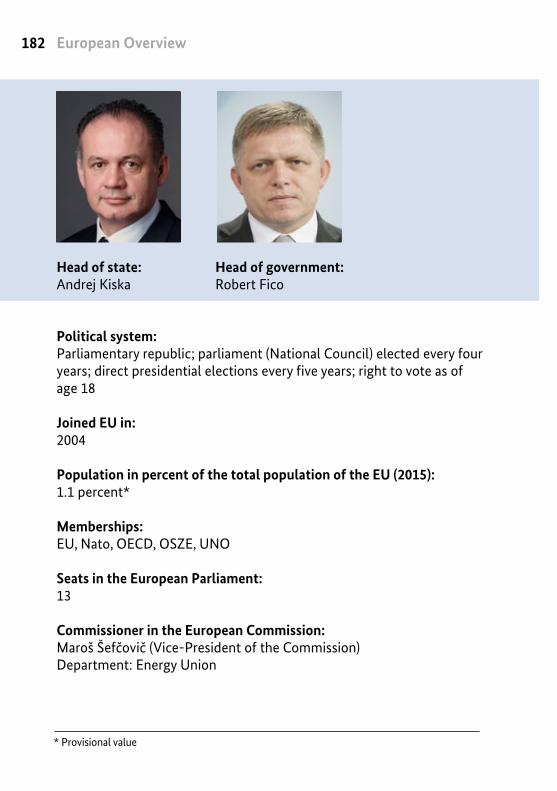
European Overview182
* Provisional value
Head of government: Robert Fico
Head of state: Andrej Kiska
Political system: Parliamentary republic; parliament (National Council) elected every four years; direct presidential elections every five years; right to vote as of age 18
Joined EU in: 2004
Population in percent of the total population of the EU (2015):1.1 percent*
Memberships: EU, Nato, OECD, OSZE, UNO
Seats in the European Parliament: 13
Commissioner in the European Commission:Maroš Šefčovič (Vice-President of the Commission) Department: Energy Union

183Slovakia
Population structure (2014):
** Break in series*** Deviation from 100 percent due to rounding
Age distribution***
Rural population
46 percent
Urban population 54 percent
ages 0 – 14
15 percent
ages 15 – 64
71 percent
over 65
13 percent
Men
48.5 percent
Women
51.5 percent
Gross domestic product (in respective prices, 2013)GDP total 72.1 billion eurosGDP per capita 13,300 euro
Gross national income per capita p.a. (2013):17,810 US dollars
Annual mean income (2013):6,737 euros net
Monthly minimum wage (July 2015): 380 euro
Unemployment rate (March 2015): 12.0 percent
Youth unemployment rate (2014): 29.7 percent**
Adults who have completed higher education (2014):83.9 percent**
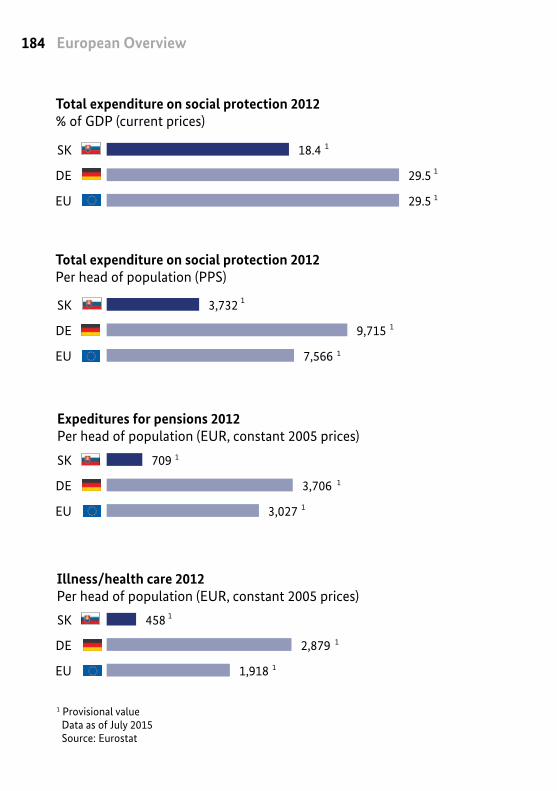
European Overview184
1 Provisional value Data as of July 2015 Source: Eurostat
18.4
29.5
29.5
SK
DE
EU 1
1
458
2,879
1,918
SK
DE
EU
1
1
1
3,732
9,715
7,566
SK
DE
EU
1
1
1
709
3,706
3,027
SK
DE
EU
1
1
1
DE
EU
DE
EU
DE
EU
SK
DE
EU
1
Total expenditure on social protection 2012% of GDP (current prices)
Illness/health care 2012Per head of population (EUR, constant 2005 prices)
Expeditures for pensions 2012Per head of population (EUR, constant 2005 prices)
Total expenditure on social protection 2012Per head of population (PPS)
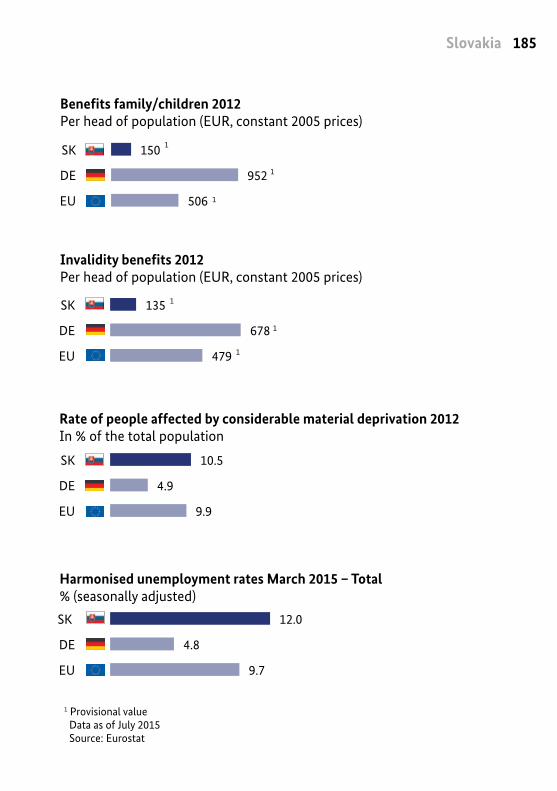
185Slovakia
1 Provisional value Data as of July 2015 Source: Eurostat
150
952
506
SK
DE
EU
1
1
1
135
678
479
SK
DE
EU
1
1
1
10.5
4.9
9.9
SK
DE
EU
12.0
4.8
9.7
SK
DE
EU
Harmonised unemployment rates March 2015 – Total% (seasonally adjusted)
Invalidity benefits 2012Per head of population (EUR, constant 2005 prices)
Benefits family/children 2012Per head of population (EUR, constant 2005 prices)
Rate of people affected by considerable material deprivation 2012In % of the total population
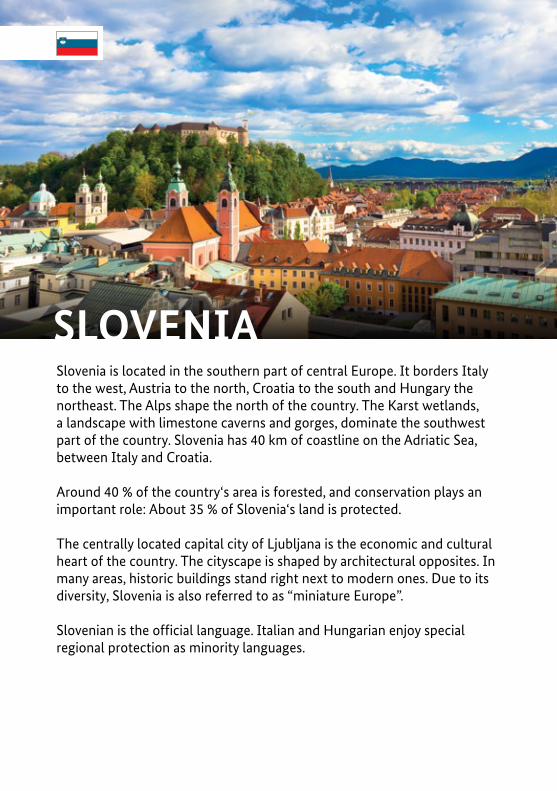
SLOVENIASlovenia is located in the southern part of central Europe. It borders Italy to the west, Austria to the north, Croatia to the south and Hungary the northeast. The Alps shape the north of the country. The Karst wetlands, a landscape with limestone caverns and gorges, dominate the southwest part of the country. Slovenia has 40 km of coastline on the Adriatic Sea, between Italy and Croatia.
Around 40 % of the country‘s area is forested, and conservation plays an important role: About 35 % of Slovenia‘s land is protected.
The centrally located capital city of Ljubljana is the economic and cultural heart of the country. The cityscape is shaped by architectural opposites. In many areas, historic buildings stand right next to modern ones. Due to its diversity, Slovenia is also referred to as “miniature Europe”.
Slovenian is the official language. Italian and Hungarian enjoy special regional protection as minority languages.
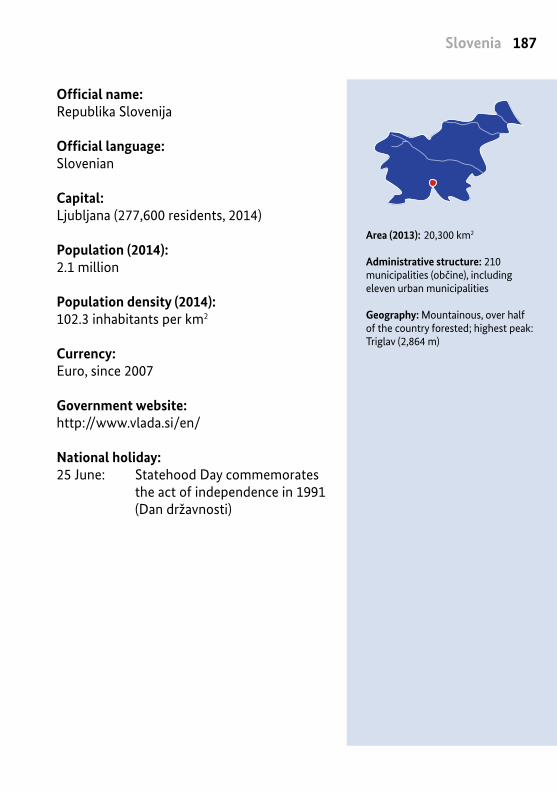
187Slovenia
Area (2013): 20,300 km2
Administrative structure: 210 municipalities (občine), including eleven urban municipalities
Geography: Mountainous, over half of the country forested; highest peak: Triglav (2,864 m)
Official name:Republika Slovenija
Official language: Slovenian
Capital: Ljubljana (277,600 residents, 2014)
Population (2014): 2.1 million
Population density (2014): 102.3 inhabitants per km2
Currency: Euro, since 2007
Government website: http://www.vlada.si/en/
National holiday: 25 June: Statehood Day commemorates the act of independence in 1991 (Dan državnosti)
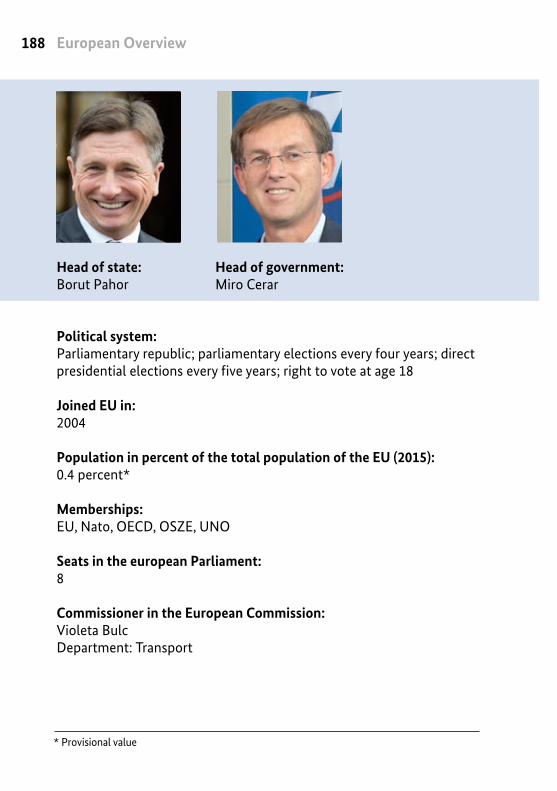
European Overview188
* Provisional value
Head of government: Miro Cerar
Head of state: Borut Pahor
Political system: Parliamentary republic; parliamentary elections every four years; direct presidential elections every five years; right to vote at age 18
Joined EU in: 2004
Population in percent of the total population of the EU (2015):0.4 percent*
Memberships: EU, Nato, OECD, OSZE, UNO
Seats in the european Parliament: 8
Commissioner in the European Commission:Violeta BulcDepartment: Transport

189Slovenia
Population structure (2014):
** Break in series*** Deviation from 100 percent due to rounding
Age distribution***
Rural population
50 percent
Urban population 50 percent
ages 0 – 14
15 percent
ages 15 – 64
68 percent
over 65
18 percent
Men
49.6 percent
Women
50.4 percent
Gross domestic product (in respective prices, 2013)GDP total 35.3 billion eurosGDP per capita 17,100 euro
Gross national income per capita p.a. (2013):23,220 US dollars
Annual mean income (2013):11,852 euros net
Monthly minimum wage (July 2015): 791 euro
Unemployment rate (March 2015): 9.3 percent
Youth unemployment rate (2014): 20.2 percent**
Adults who have completed higher education (2014):76.0 percent**
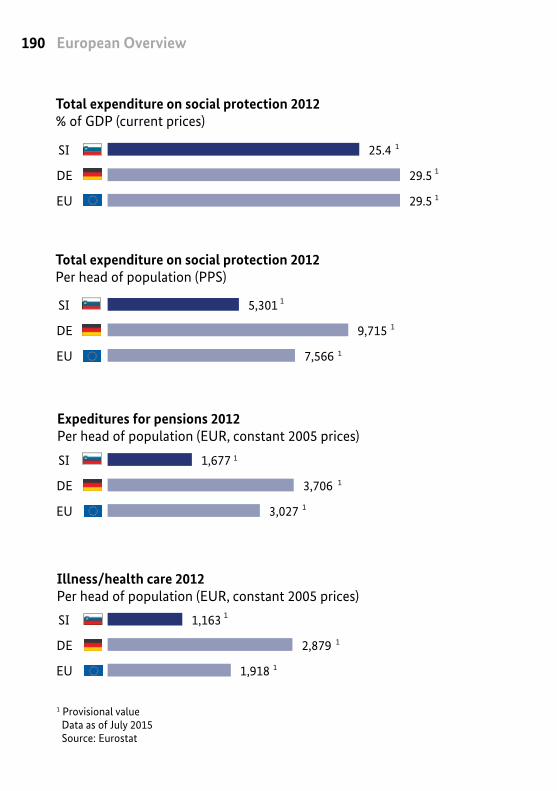
European Overview190
1 Provisional value Data as of July 2015 Source: Eurostat
25.4
29.5
29.5
SI
DE
EU 1
1
1,163
2,879
1,918
SI
DE
EU
1
1
1
5,301
9,715
7,566
SI
DE
EU
1
1
1
1,677
3,706
3,027
SI
DE
EU
1
1
1
DE
EU
DE
EU
DE
EU
DE
EU
1
Total expenditure on social protection 2012% of GDP (current prices)
Illness/health care 2012Per head of population (EUR, constant 2005 prices)
Expeditures for pensions 2012Per head of population (EUR, constant 2005 prices)
Total expenditure on social protection 2012Per head of population (PPS)
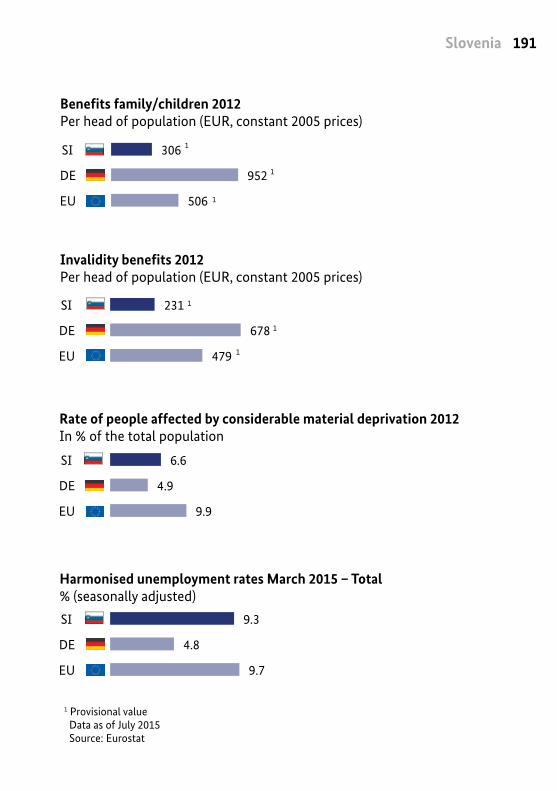
191Slovenia
1 Provisional value Data as of July 2015 Source: Eurostat
306
952
506
SI
DE
EU
1
1
1
231
678
479
SI
DE
EU
1
1
1
6.6
4.9
9.9
SI
DE
EU
9.3
4.8
9.7
SI
DE
EU
Harmonised unemployment rates March 2015 – Total% (seasonally adjusted)
Invalidity benefits 2012Per head of population (EUR, constant 2005 prices)
Benefits family/children 2012Per head of population (EUR, constant 2005 prices)
Rate of people affected by considerable material deprivation 2012In % of the total population
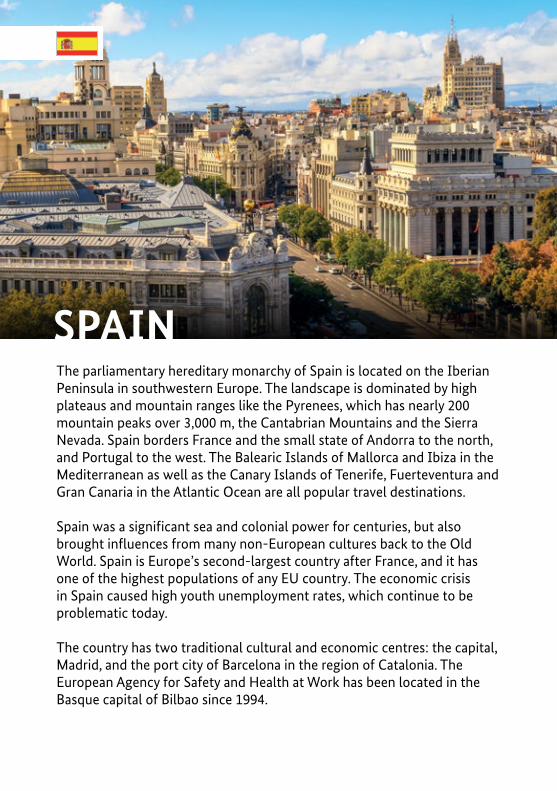
SPAINThe parliamentary hereditary monarchy of Spain is located on the Iberian Peninsula in southwestern Europe. The landscape is dominated by high plateaus and mountain ranges like the Pyrenees, which has nearly 200 mountain peaks over 3,000 m, the Cantabrian Mountains and the Sierra Nevada. Spain borders France and the small state of Andorra to the north, and Portugal to the west. The Balearic Islands of Mallorca and Ibiza in the Mediterranean as well as the Canary Islands of Tenerife, Fuerteventura and Gran Canaria in the Atlantic Ocean are all popular travel destinations.
Spain was a significant sea and colonial power for centuries, but also brought influences from many non-European cultures back to the Old World. Spain is Europe’s second-largest country after France, and it has one of the highest populations of any EU country. The economic crisis in Spain caused high youth unemployment rates, which continue to be problematic today.
The country has two traditional cultural and economic centres: the capital, Madrid, and the port city of Barcelona in the region of Catalonia. The European Agency for Safety and Health at Work has been located in the Basque capital of Bilbao since 1994.
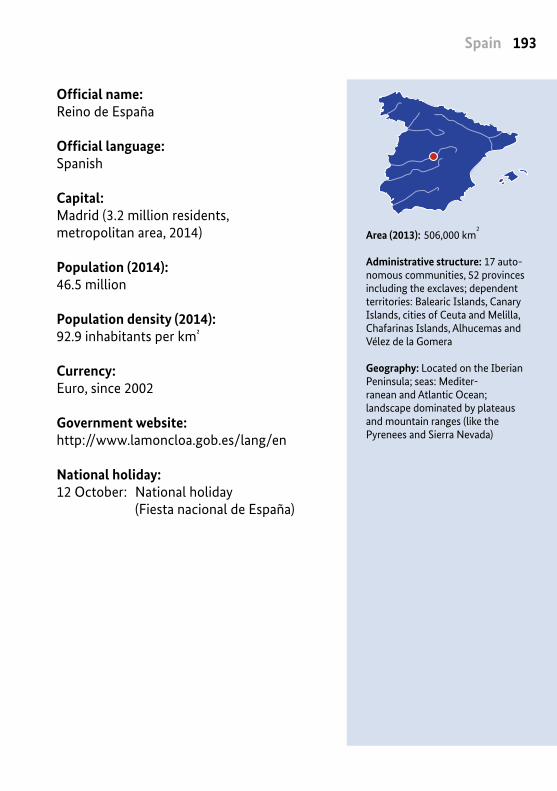
193Spain
Area (2013): 506,000 km2
Administrative structure: 17 auto-nomous communities, 52 provinces including the exclaves; dependent territories: Balearic Islands, Canary Islands, cities of Ceuta and Melilla, Chafarinas Islands, Alhucemas and Vélez de la Gomera
Geography: Located on the Iberian Peninsula; seas: Mediter- ranean and Atlantic Ocean; landscape dominated by plateaus and mountain ranges (like the Pyrenees and Sierra Nevada)
Official name:Reino de España
Official language: Spanish
Capital: Madrid (3.2 million residents, metropolitan area, 2014)
Population (2014): 46.5 million
Population density (2014): 92.9 inhabitants per km²
Currency: Euro, since 2002
Government website: http://www.lamoncloa.gob.es/lang/en
National holiday: 12 October: National holiday (Fiesta nacional de España)
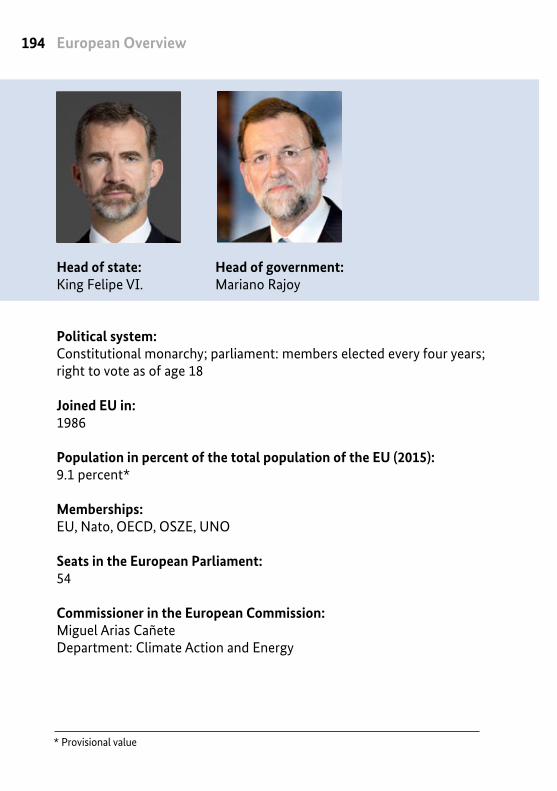
European Overview194
* Provisional value
Head of government: Mariano Rajoy
Head of state: King Felipe VI.
Political system: Constitutional monarchy; parliament: members elected every four years; right to vote as of age 18
Joined EU in: 1986
Population in percent of the total population of the EU (2015):9.1 percent*
Memberships: EU, Nato, OECD, OSZE, UNO
Seats in the European Parliament: 54
Commissioner in the European Commission:Miguel Arias CañeteDepartment: Climate Action and Energy

195Spain
** Break in series
Age distribution
Population structure (2014):
Rural population
21 percent
Urban population 79 percent
ages 0 – 14
15 percent
ages 15 – 64
67 percent
over 65
18 percent
Men
49.1 percent
Women
50.9 percent
Gross domestic product (in respective prices, 2013)GDP total 1,023.0 billion eurosGDP per capita 22,300 euro
Gross national income per capita p.a. (2013):29,940 US dollars
Annual mean income (2013):13,524 euros net
Monthly minimum wage (July 2015): 757 euro
Unemployment rate (March 2015): 22.9 percent
Youth unemployment rate (2014): 53.2 percent**
Adults who have completed higher education (2014):79.6 percent**
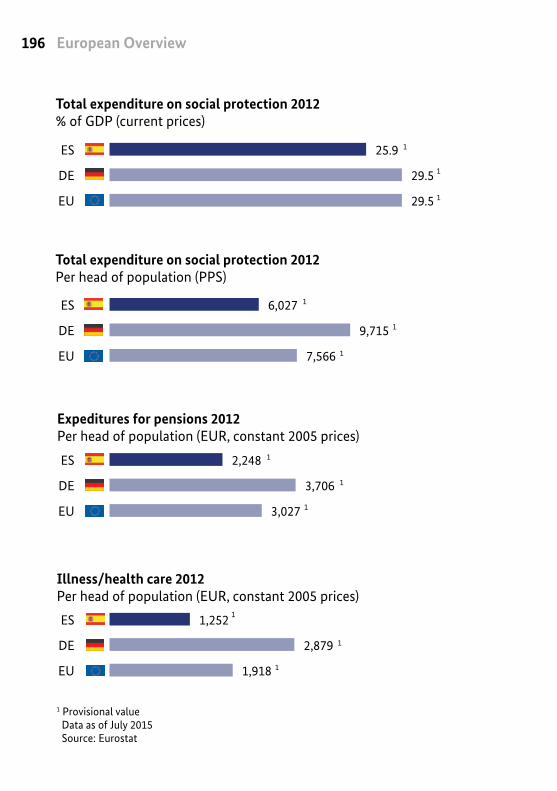
European Overview196
1 Provisional value Data as of July 2015 Source: Eurostat
25.9
29.5
29.5
ES
DE
EU 1
1
1,252
2,879
1,918
ES
DE
EU
1
1
1
6,027
9,715
7,566
ES
DE
EU
1
1
1
2,248
3,706
3,027
ES
DE
EU
1
1
1
DE
EU
DE
EU
DE
EU
ES
DE
EU
1
Total expenditure on social protection 2012% of GDP (current prices)
Illness/health care 2012Per head of population (EUR, constant 2005 prices)
Expeditures for pensions 2012Per head of population (EUR, constant 2005 prices)
Total expenditure on social protection 2012Per head of population (PPS)
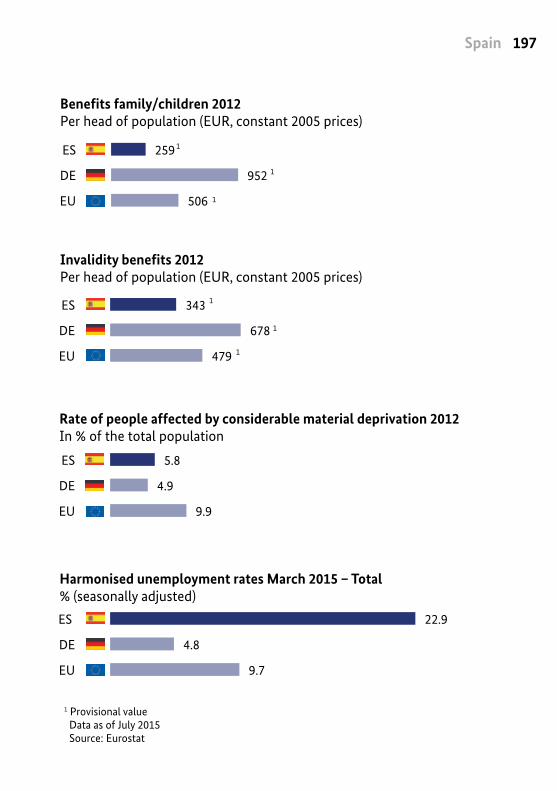
197Spain
1 Provisional value Data as of July 2015 Source: Eurostat
259
952
506
ES
DE
EU
1
1
1
343
678
479
ES
DE
EU
1
1
1
5.8
4.9
9.9
ES
DE
EU
22.9
4.8
9.7
ES
DE
EU
Harmonised unemployment rates March 2015 – Total% (seasonally adjusted)
Invalidity benefits 2012Per head of population (EUR, constant 2005 prices)
Benefits family/children 2012Per head of population (EUR, constant 2005 prices)
Rate of people affected by considerable material deprivation 2012In % of the total population
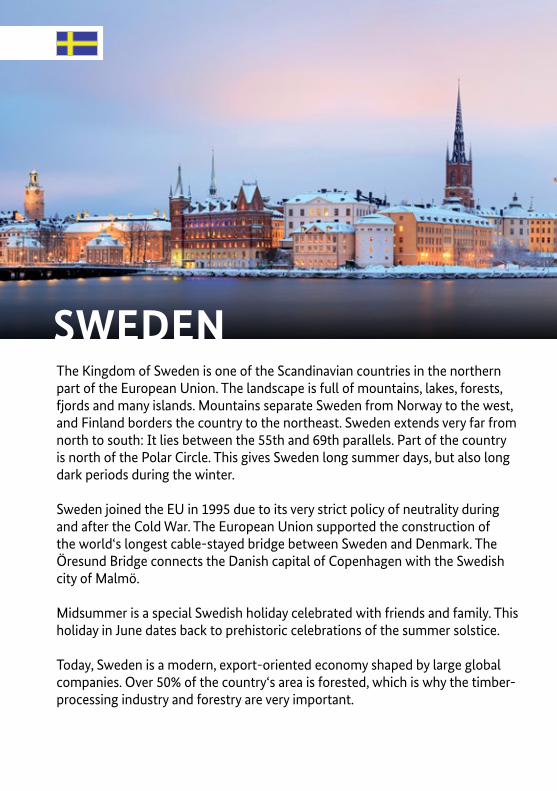
SWEDENThe Kingdom of Sweden is one of the Scandinavian countries in the northern part of the European Union. The landscape is full of mountains, lakes, forests, fjords and many islands. Mountains separate Sweden from Norway to the west, and Finland borders the country to the northeast. Sweden extends very far from north to south: It lies between the 55th and 69th parallels. Part of the country is north of the Polar Circle. This gives Sweden long summer days, but also long dark periods during the winter.
Sweden joined the EU in 1995 due to its very strict policy of neutrality during and after the Cold War. The European Union supported the construction of the world‘s longest cable-stayed bridge between Sweden and Denmark. The Öresund Bridge connects the Danish capital of Copenhagen with the Swedish city of Malmö.
Midsummer is a special Swedish holiday celebrated with friends and family. This holiday in June dates back to prehistoric celebrations of the summer solstice.
Today, Sweden is a modern, export-oriented economy shaped by large global companies. Over 50% of the country‘s area is forested, which is why the timber-processing industry and forestry are very important.

199Sweden
Official name:Konungariket Sverige
Official language: Swedish
Capital: Stockholm (912,000 residents, 2014)
Population (2014): 9.6 million
Population density (2014): 23.6 inhabitants per km²
Currency: Swedish krona
Government website: http://www.government.se/
National holiday: 6 June: National Day of Sweden (Svenska flaggans dag)
Area (2013): 438,600 km2
Administrative structure: 21 provinces (län)
Geography: Borders the Baltic Sea; around 221,800 islands; Scandes Mountain range along the border to Norway; highest peak: Kebnekaise (2,104 m)
European Overview200
* Provisional value
Head of government: Stefan Löfven
Head of state: King Carl XVI. Gustaf
Political system: Constitutional monarchy, parliamentary democracy; parliamentary elections every four years; right to vote as of age 18
Joined EU in: 1995
Population in percent of the total population of the EU (2015):1.9 percent*
Memberships: EU, OECD, OSZE, UNO
Seats in the European Parliament: 20
Commissioner in the European Commission:Cecilia MalmströmDepartment: Trade

201Sweden
** Break in series
Age distribution
Population structure (2014):
Rural population
14 percent
Urban population 86 percent
ages 0 – 14
17 percent
ages 15 – 64
63 percent
over 65
20 percent
Men
49.9 percent
Women
50.1 percent
Gross domestic product (in respective prices, 2013)GDP total 420.8 billion eurosGDP per capita 43,800 euro
Gross national income per capita p.a. (2013):61,750 US dollars
Annual mean income (2013):26,414 euros net
Monthly minimum wage (July 2015): No minimum wage
Unemployment rate (March 2015): 7.6 percent
Youth unemployment rate (2014): 22.9 percent**
Adults who have completed higher education (2014):43.3 percent**
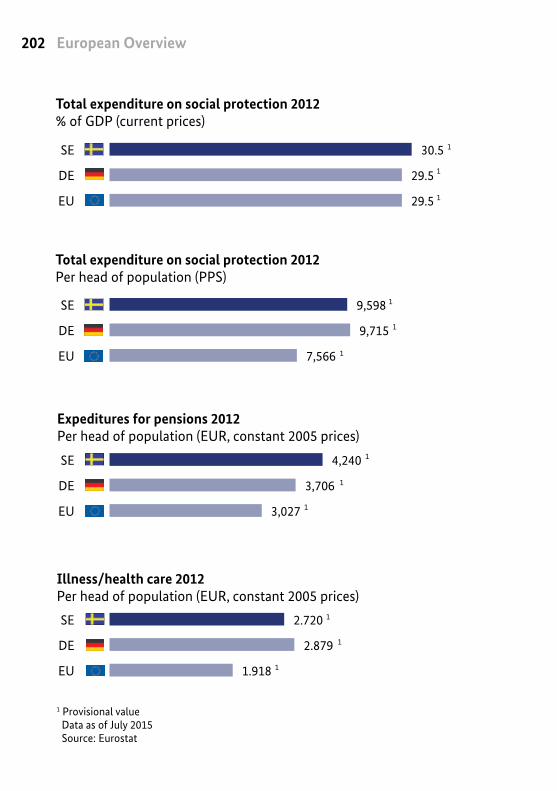
European Overview202
1 Provisional value Data as of July 2015 Source: Eurostat
30.5
29.5
29.5
SE
DE
EU 1
1
2.720
2.879
1.918
SE
DE
EU
1
1
1
9,598
9,715
7,566
SE
DE
EU
1
1
1
4,240
3,706
3,027
SE
DE
EU
1
1
1
DE
EU
DE
EU
DE
EU
SE
DE
EU
1
Total expenditure on social protection 2012% of GDP (current prices)
Illness/health care 2012Per head of population (EUR, constant 2005 prices)
Expeditures for pensions 2012Per head of population (EUR, constant 2005 prices)
Total expenditure on social protection 2012Per head of population (PPS)
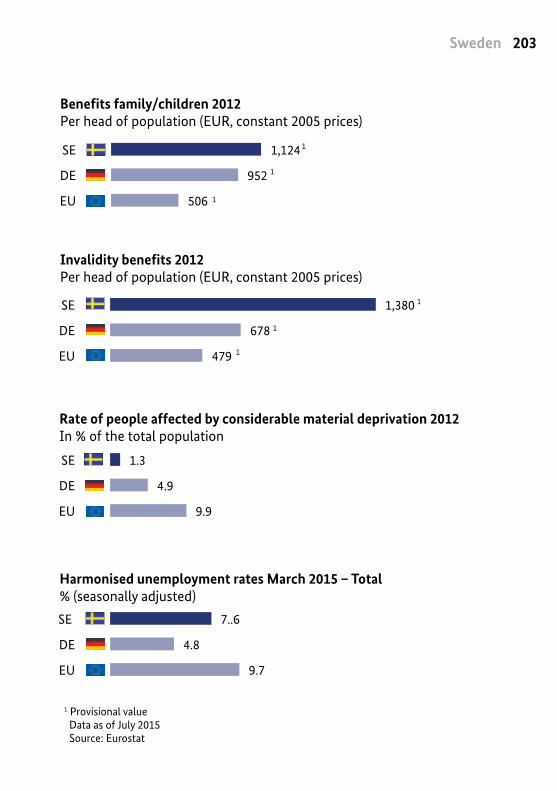
203Sweden
1 Provisional value Data as of July 2015 Source: Eurostat
1,124
952
506
SE
DE
EU
1
1
1
1,380
678
479
SE
DE
EU
1
1
1
1.3
4.9
9.9
SE
DE
EU
7..6
4.8
9.7
SE
DE
EU
Harmonised unemployment rates March 2015 – Total% (seasonally adjusted)
Invalidity benefits 2012Per head of population (EUR, constant 2005 prices)
Benefits family/children 2012Per head of population (EUR, constant 2005 prices)
Rate of people affected by considerable material deprivation 2012In % of the total population
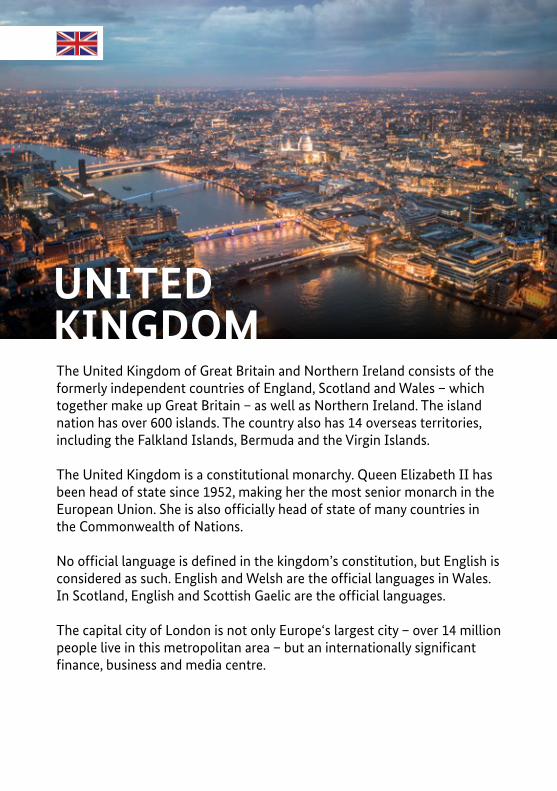
The United Kingdom of Great Britain and Northern Ireland consists of the formerly independent countries of England, Scotland and Wales – which together make up Great Britain – as well as Northern Ireland. The island nation has over 600 islands. The country also has 14 overseas territories, including the Falkland Islands, Bermuda and the Virgin Islands.
The United Kingdom is a constitutional monarchy. Queen Elizabeth II has been head of state since 1952, making her the most senior monarch in the European Union. She is also officially head of state of many countries in the Commonwealth of Nations.
No official language is defined in the kingdom’s constitution, but English is considered as such. English and Welsh are the official languages in Wales. In Scotland, English and Scottish Gaelic are the official languages.
The capital city of London is not only Europe‘s largest city – over 14 million people live in this metropolitan area – but an internationally significant finance, business and media centre.
UNITED KINGDOM
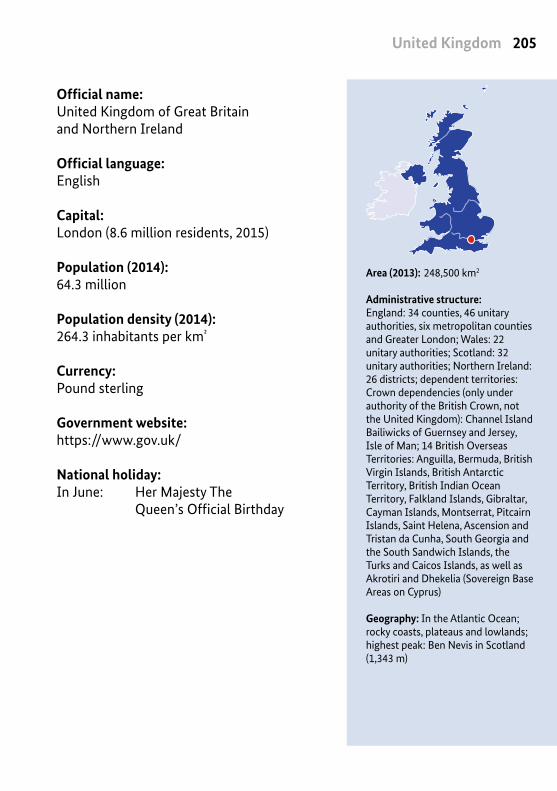
205United Kingdom
Area (2013): 248,500 km2
Administrative structure: England: 34 counties, 46 unitary authorities, six metropolitan counties and Greater London; Wales: 22 unitary authorities; Scotland: 32 unitary authorities; Northern Ireland: 26 districts; dependent territories: Crown dependencies (only under authority of the British Crown, not the United Kingdom): Channel Island Bailiwicks of Guernsey and Jersey, Isle of Man; 14 British Overseas Territories: Anguilla, Bermuda, British Virgin Islands, British Antarctic Territory, British Indian Ocean Territory, Falkland Islands, Gibraltar, Cayman Islands, Montserrat, Pitcairn Islands, Saint Helena, Ascension and Tristan da Cunha, South Georgia and the South Sandwich Islands, the Turks and Caicos Islands, as well as Akrotiri and Dhekelia (Sovereign Base Areas on Cyprus)
Geography: In the Atlantic Ocean; rocky coasts, plateaus and lowlands; highest peak: Ben Nevis in Scotland (1,343 m)
Official name:United Kingdom of Great Britain and Northern Ireland
Official language: English
Capital: London (8.6 million residents, 2015)
Population (2014): 64.3 million
Population density (2014): 264.3 inhabitants per km²
Currency: Pound sterling
Government website: https://www.gov.uk/
National holiday: In June: Her Majesty The Queen’s Official Birthday

European Overview206
* Provisional value
Head of government: David Cameron
Head of state: Queen Elizabeth II.
Political system: Constitutional monarchy, parliamentary democracy; House of Commons members elected every five years beginning in 2015; right to vote as of age 18
Joined EU in: 1973
Population in percent of the total population of the EU (2015):12.7 percent*
Memberships: EU, G7, G20, Nato, OECD, OSZE, UNO
Seats in the European Parliament: 73
Commissioner in the European Commission:Jonathan HillDepartment: Financial Stability, Financial Services and Capital Markets Union

207United Kingdom
** Break in series
Age distribution
Population structure (2014):
Rural population
18 percent
Urban population 82 percent
ages 0 – 14
18 percent
ages 15 – 64
65 percent
over 65
17 percent
Men
49.3 percent
Women
50.7 percent
Gross domestic product (in respective prices, 2013)GDP total 1,899.1 billion eurosGDP per capita 29,600 Euro Gross national income per capita p.a. (2013):41,590 US dollars
Annual mean income (2013):18,694 euros net
Monthly minimum wage (July 2015): 1,510 euro
Unemployment rate (March 2015): 5.4 percent
Youth unemployment rate (2014): 16.9 percent**
Adults who have completed higher education (2014):72.8 percent**
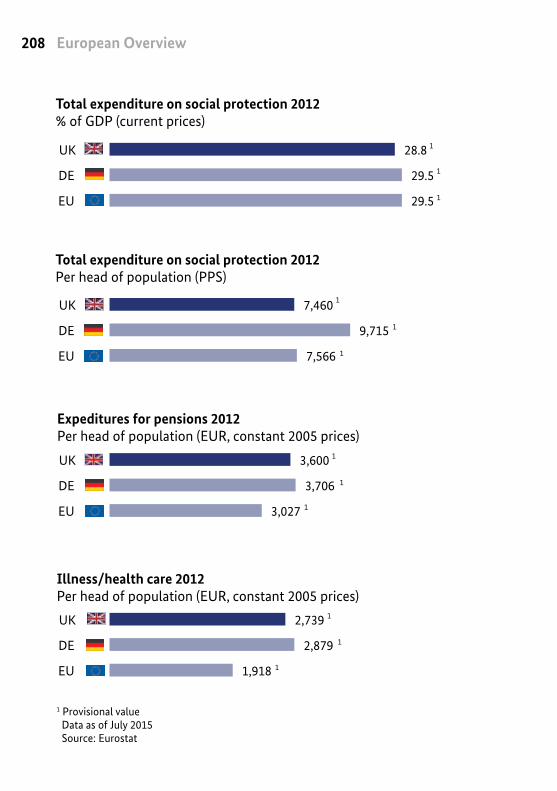
European Overview208
1 Provisional value Data as of July 2015 Source: Eurostat
28.8
29.5
29.5
UK
DE
EU 1
1
2,739
2,879
1,918
UK
DE
EU
1
1
1
7,460
9,715
7,566
UK
DE
EU
1
1
1
3,600
3,706
3,027
UK
DE
EU
1
1
1
UK
DE
EU
UK
DE
EU
UK
DE
EU
UK
DE
EU
1
Total expenditure on social protection 2012% of GDP (current prices)
Illness/health care 2012Per head of population (EUR, constant 2005 prices)
Expeditures for pensions 2012Per head of population (EUR, constant 2005 prices)
Total expenditure on social protection 2012Per head of population (PPS)
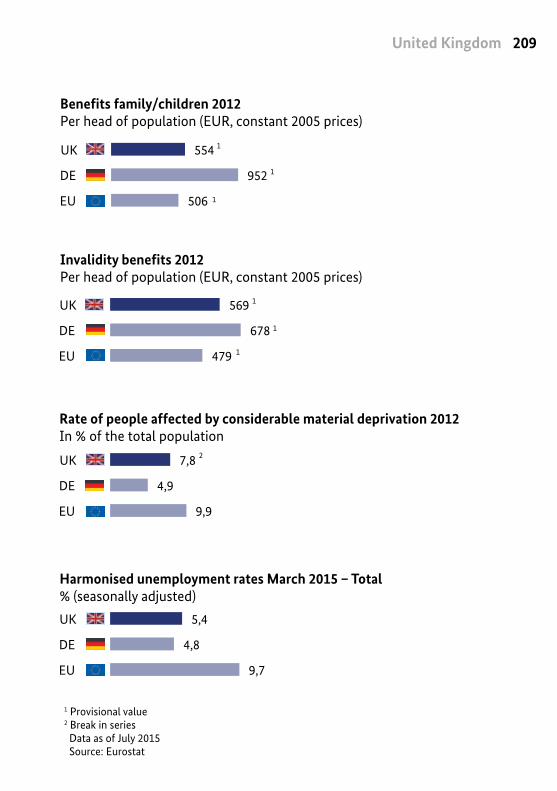
209United Kingdom
554
952
506
UK
DE
EU
1
1
1
569
678
479
UK
DE
EU
1
1
1
7,8
4,9
9,9
UK
DE
EU
2
5,4
4,8
9,7
UK
DE
EU
1 Provisional value2 Break in series Data as of July 2015 Source: Eurostat
Harmonised unemployment rates March 2015 – Total% (seasonally adjusted)
Invalidity benefits 2012Per head of population (EUR, constant 2005 prices)
Benefits family/children 2012Per head of population (EUR, constant 2005 prices)
Rate of people affected by considerable material deprivation 2012In % of the total population
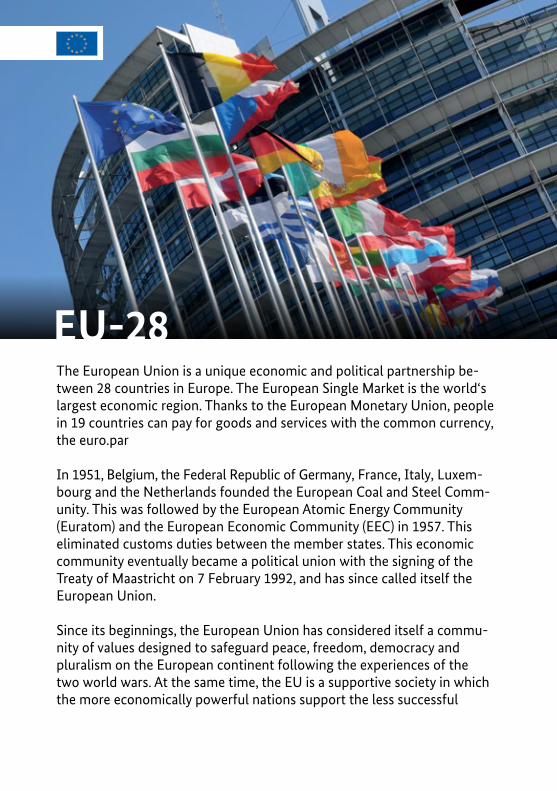
EU-28The European Union is a unique economic and political partnership be-tween 28 countries in Europe. The European Single Market is the world‘s largest economic region. Thanks to the European Monetary Union, people in 19 countries can pay for goods and services with the common currency, the euro.par
In 1951, Belgium, the Federal Republic of Germany, France, Italy, Luxem -bourg and the Netherlands founded the European Coal and Steel Comm-unity. This was followed by the European Atomic Energy Community (Euratom) and the European Economic Community (EEC) in 1957. This eliminated customs duties between the member states. This economic community eventually became a political union with the signing of the Treaty of Maastricht on 7 February 1992, and has since called itself the European Union.
Since its beginnings, the European Union has considered itself a commu-nity of values designed to safeguard peace, freedom, democracy and pluralism on the European continent following the experiences of the two world wars. At the same time, the EU is a supportive society in which the more economically powerful nations support the less successful
211EU-28
ones. After several expansions, today‘s European Union is made up of 28 member nations who share the same laws, social and educational standards, a common foreign and security policy, as well as a single monetary policy.
Each citizen of the European Union has the right to travel to another EU country without being checked at the border, and can also establish residence and work there. The member states may only limit access to certain public services.
Since its establishment, the EU has created a number of central institutions that organise political cooperation within the Union. The European Council, a committee of heads of states and governments, defines the EU‘s general political priorities. This overarching institution is not directly involved in actual EU legislation. Instead, its job is to find compromises between the member states. The presidency rotates every six months.
EU residents vote for the European Parliament every five years. The Parlia-ment is responsible for adopting the laws and directives of the European Union. The current president of the European Parliament is Martin Schulz from Germany, who was appointed in 2012.
The European Commission is the executive of the union. Its 28 members, referred to as “Commissioners”, are nominated by the member states and need to have a hearing with the European Parliament. The president of the EU Commission is Luxembourg-native Jean-Claude Juncker.
The European Court of Justice, based in Luxembourg, is responsible for European case law. The European Central Bank in Frankfurt am Main and the national central banks combine to form the Eurosystem, the central banking system of the Euro currency region.
These central institutions help coordinate and harmonise a number of different policy areas, including economic, financial, international, agricultural, energy, environmental and educational policy, as well as labour and social policy.
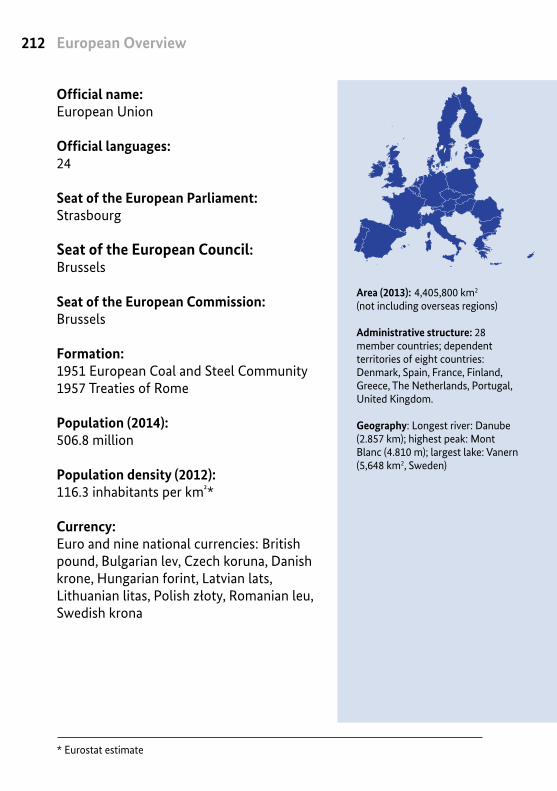
European Overview212
* Eurostat estimate
Official name:European Union
Official languages: 24
Seat of the European Parliament: Strasbourg
Seat of the European Council: Brussels
Seat of the European Commission: Brussels
Formation: 1951 European Coal and Steel Community1957 Treaties of Rome
Population (2014): 506.8 million
Population density (2012): 116.3 inhabitants per km²*
Currency: Euro and nine national currencies: British pound, Bulgarian lev, Czech koruna, Danish krone, Hungarian forint, Latvian lats, Lithuanian litas, Polish złoty, Romanian leu, Swedish krona
Area (2013): 4,405,800 km2
(not including overseas regions)
Administrative structure: 28 member countries; dependent territories of eight countries: Denmark, Spain, France, Finland, Greece, The Netherlands, Portugal, United Kingdom.
Geography: Longest river: Danube (2.857 km); highest peak: Mont Blanc (4.810 m); largest lake: Vanern (5,648 km2, Sweden)
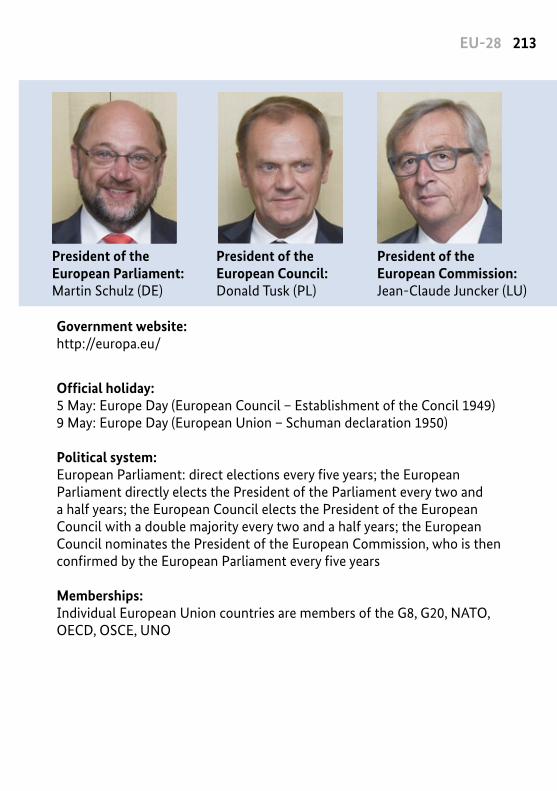
213EU-28
President of the European Parliament: Martin Schulz (DE)
President of the European Council: Donald Tusk (PL)
President of the European Commission: Jean-Claude Juncker (LU)
Government website: http://europa.eu/
Official holiday: 5 May: Europe Day (European Council – Establishment of the Concil 1949)9 May: Europe Day (European Union – Schuman declaration 1950)
Political system: European Parliament: direct elections every five years; the European Parliament directly elects the President of the Parliament every two and a half years; the European Council elects the President of the European Council with a double majority every two and a half years; the European Council nominates the President of the European Commission, who is then confirmed by the European Parliament every five years
Memberships: Individual European Union countries are members of the G8, G20, NATO, OECD, OSCE, UNO
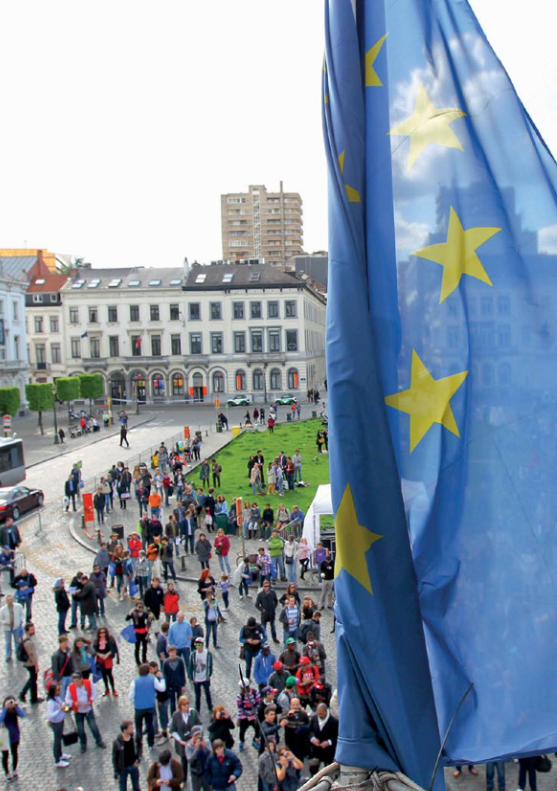
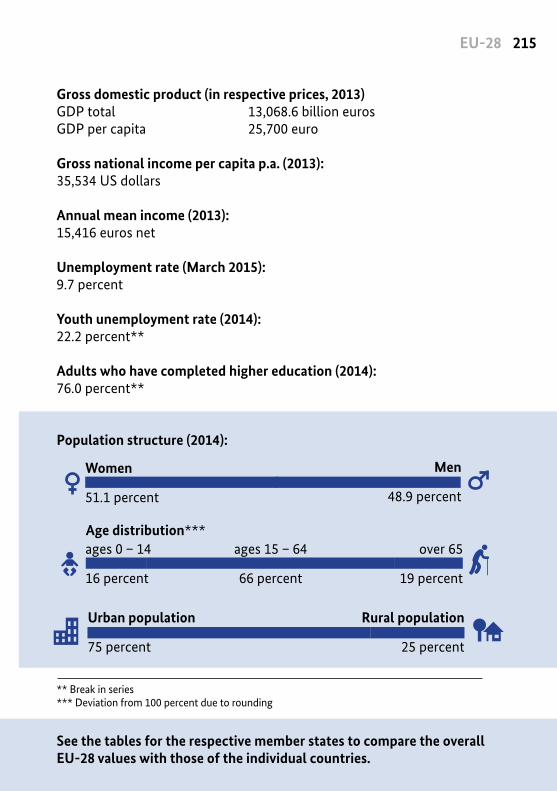
215EU-28
Population structure (2014):
Gross domestic product (in respective prices, 2013)GDP total 13,068.6 billion eurosGDP per capita 25,700 euro
Gross national income per capita p.a. (2013):35,534 US dollars
Annual mean income (2013):15,416 euros net
Unemployment rate (March 2015): 9.7 percent
Youth unemployment rate (2014): 22.2 percent**
Adults who have completed higher education (2014):76.0 percent**
** Break in series*** Deviation from 100 percent due to rounding
Age distribution***
Rural population
25 percent
Urban population 75 percent
ages 0 – 14
16 percent
ages 15 – 64
66 percent
over 65
19 percent
Men
48.9 percent
Women
51.1 percent
See the tables for the respective member states to compare the overall EU-28 values with those of the individual countries.
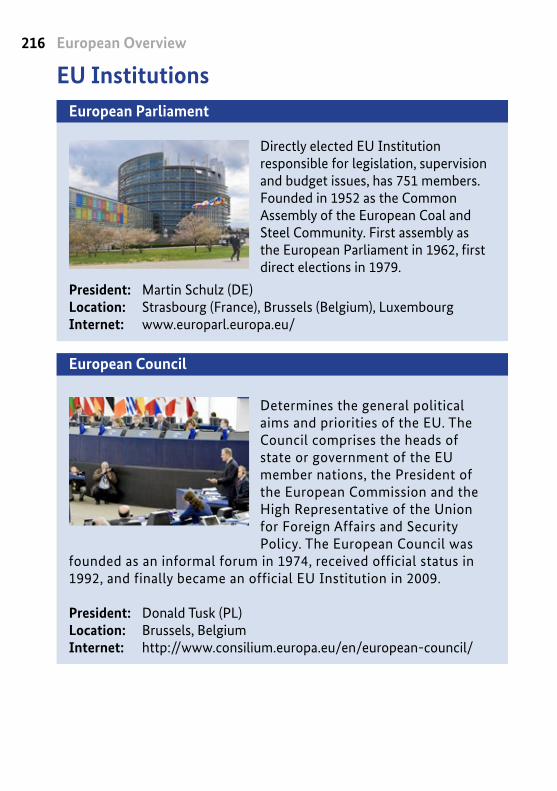
European Overview216
EU InstitutionsEuropean Parliament
Directly elected EU Institution responsible for legislation, supervision and budget issues, has 751 members. Founded in 1952 as the Common Assembly of the European Coal and Steel Community. First assembly as the European Parliament in 1962, first direct elections in 1979.
President: Martin Schulz (DE)Location: Strasbourg (France), Brussels (Belgium), LuxembourgInternet: www.europarl.europa.eu/
European Council
Determines the general political aims and priorities of the EU. The Council comprises the heads of state or government of the EU member nations, the President of the European Commission and the High Representative of the Union for Foreign Affairs and Security Policy. The European Council was
founded as an informal forum in 1974, received official status in 1992, and finally became an official EU Institution in 2009.
President: Donald Tusk (PL)Location: Brussels, BelgiumInternet: http://www.consilium.europa.eu/en/european-council/
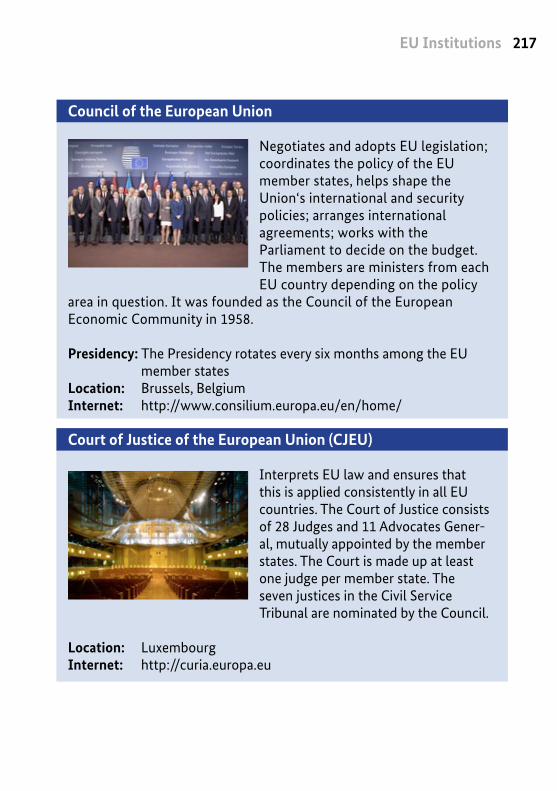
EU Institutions 217
Council of the European Union
Negotiates and adopts EU legislation; coordinates the policy of the EU member states, helps shape the Union‘s international and security policies; arranges international agreements; works with the Parliament to decide on the budget. The members are ministers from each EU country depending on the policy
area in question. It was founded as the Council of the European Economic Community in 1958.
Presidency: The Presidency rotates every six months among the EU member statesLocation: Brussels, BelgiumInternet: http://www.consilium.europa.eu/en/home/
Court of Justice of the European Union (CJEU)
Interprets EU law and ensures that this is applied consistently in all EU countries. The Court of Justice consists of 28 Judges and 11 Advocates Gener-al, mutually appointed by the member states. The Court is made up at least one judge per member state. The seven justices in the Civil Service Tribunal are nominated by the Council.
Location: LuxembourgInternet: http://curia.europa.eu
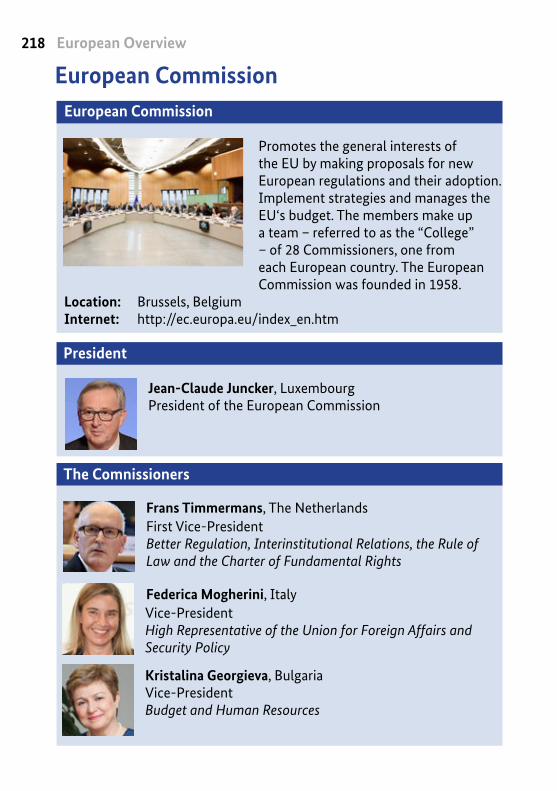
European Overview218
European CommissionEuropean Commission
Promotes the general interests of the EU by making proposals for new European regulations and their adoption. Implement strategies and manages the EU‘s budget. The members make up a team – referred to as the “College” – of 28 Commissioners, one from each European country. The European Commission was founded in 1958.
Location: Brussels, BelgiumInternet: http://ec.europa.eu/index_en.htm
President
Jean-Claude Juncker, LuxembourgPresident of the European Commission
The Comnissioners
Frans Timmermans, The NetherlandsFirst Vice-PresidentBetter Regulation, Interinstitutional Relations, the Rule of Law and the Charter of Fundamental Rights
Federica Mogherini, ItalyVice-PresidentHigh Representative of the Union for Foreign Affairs and Security Policy
Kristalina Georgieva, BulgariaVice-PresidentBudget and Human Resources
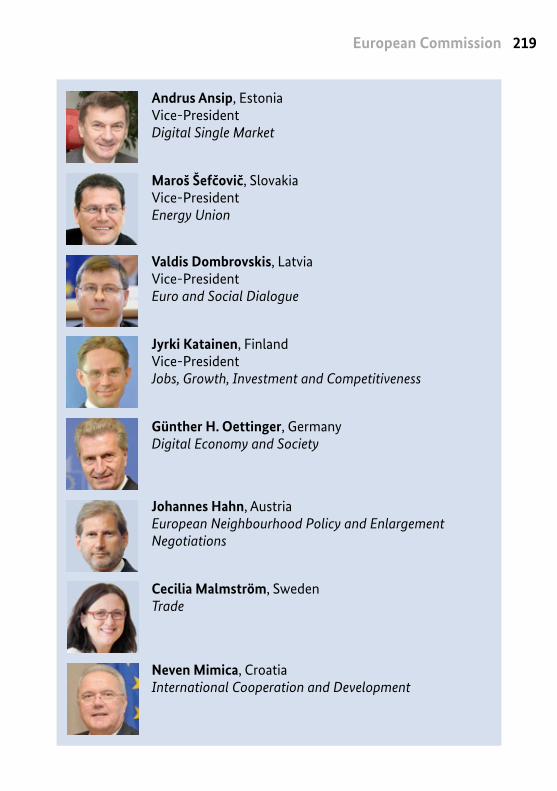
European Commission 219
Andrus Ansip, EstoniaVice-PresidentDigital Single Market
Maroš Šefčovič, SlovakiaVice-PresidentEnergy Union
Valdis Dombrovskis, LatviaVice-PresidentEuro and Social Dialogue
Jyrki Katainen, FinlandVice-PresidentJobs, Growth, Investment and Competitiveness
Günther H. Oettinger, GermanyDigital Economy and Society
Johannes Hahn, AustriaEuropean Neighbourhood Policy and Enlargement Negotiations
Cecilia Malmström, SwedenTrade
Neven Mimica, CroatiaInternational Cooperation and Development
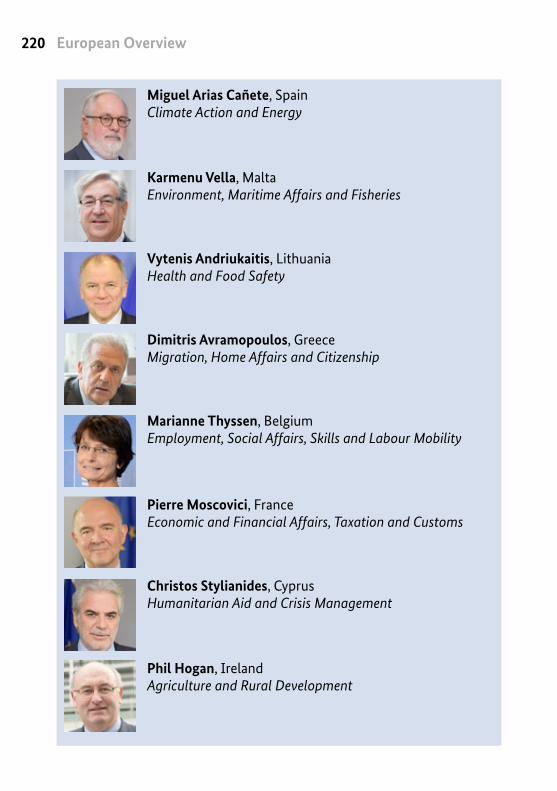
European Overview220
Miguel Arias Cañete, SpainClimate Action and Energy
Karmenu Vella, MaltaEnvironment, Maritime Affairs and Fisheries
Vytenis Andriukaitis, LithuaniaHealth and Food Safety
Dimitris Avramopoulos, GreeceMigration, Home Affairs and Citizenship
Marianne Thyssen, BelgiumEmployment, Social Affairs, Skills and Labour Mobility
Pierre Moscovici, FranceEconomic and Financial Affairs, Taxation and Customs
Christos Stylianides, CyprusHumanitarian Aid and Crisis Management
Phil Hogan, IrelandAgriculture and Rural Development
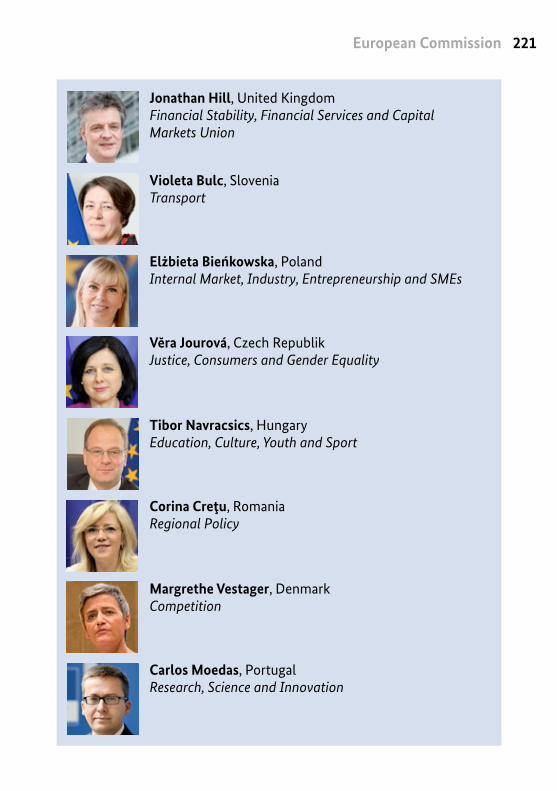
European Commission 221
Jonathan Hill, United KingdomFinancial Stability, Financial Services and Capital Markets Union
Violeta Bulc, SloveniaTransport
Elżbieta Bieńkowska, PolandInternal Market, Industry, Entrepreneur ship and SMEs
Vĕra Jourová, Czech RepublikJustice, Consumers and Gender Equality
Tibor Navracsics, HungaryEducation, Culture, Youth and Sport
Corina Creţu, RomaniaRegional Policy
Margrethe Vestager, DenmarkCompetition
Carlos Moedas, PortugalResearch, Science and Innovation
Appendix222
LinksAcademic Network of European Disability Expertswww.disability-europe.net/en
EU-Bookshopwww.bookshop.europa.eu
EUR-Lex – Acces to European Union Lawhttp://eur-lex.europa.eu/homepage.html?locale=en
EURES – European Job Networkwww.ec.europa.eu/eures
Europe 2020 in all EU-Countrieswww.ec.europa.eu/europe2020/index_en.htm
Europe – Summary of EU-Law, Labour Law and Work Organisationwww.europa.eu/legislation_summaries/employment_and_social_policy/employment_rights_and_work_organisation/index_en.htm
Europe Direct – Central EU Information Servicehttp://europa.eu/europedirect/index_en.htm
European Agency for Safety and Health at Workhttps://osha.europa.eu/en
European Commissionwww.ec.europa.eu
European Commission – Employment, Social Affairs and Inclusionwww.ec.europa.eu/social
Links 223
European Commission – European Social Fundwww.ec.europa.eu/esf/home.jsp?langId=en
European Coordination of Social Security Systemswww.ec.europa.eu/social/main.jsp?catId=849&langId=de
European Councilwww.consilium.europa.eu/en/council-eu/configurations/epsco/
European Health Insurance Cardhttp://ec.europa.eu/social/main.jsp?catId=559&langId=en
European Ombudsmanhttp://www.ombudsman.europa.eu/en/
European Parliament http://www.europarl.europa.eu/
European Social Fund for Germanywww.esf.de
European Unionwww.europa.eu
European Union – Agency for Fundamental Rightshttp://fra.europa.eu/en
European Union – Healthcare in the EUhttp://europa.eu/eu-life/healthcare/index_en.htm
European Union – Statistics and Opinion Pollshttp://europa.eu/publications/statistics/index_en.htm
Appendix224
Eurostat – Your Key to European Statisticshttp://ec.europa.eu/eurostat/en
The Federal Agency for Civic Educationwww.eubuero.de
The Federal Agency for Civic Educationhttp://www.bpb.de/die-bpb/138852/federal-agency-for-civic-education
Federal Foreign Officewww.auswaertiges-amt.de/EN
Federal Ministry for Family Affairs, Senior Citizens, Women and Youthwww.bmfsfj.de
Federal Ministry of Labour and Social Affairswww.bmas.de/EN
Historical Archives - European University Institutewww.eui.eu/Research/HistoricalArchivesOfEU
Information about Participation of Workers and Employees in the EUhttp://worker-participation.eu/
Information of the European Union for Childrenhttp://europa.eu/kids-corner/countries/flash/index_en.htm
MISSOC – Mutual Information System on Social Protectionwww.missoc.org
Permanent Representation of the Federal Republic of Germany to the European Union Brusselshttp://www.bruessel-eu.diplo.de/Vertretung/bruessel__eu/en/Startseite.html
Links 225
Representative of the Federal Republic of Germany for the Interests of the Disabledhttp://www.behindertenbeauftragte.de/EN/Englisch.html?nn=2950120
Social Security Compass Europewww.sozialkompass.eu
Your Europe – Help and advice for EU nationals and their familywww.ec.europa.eu/youreurope
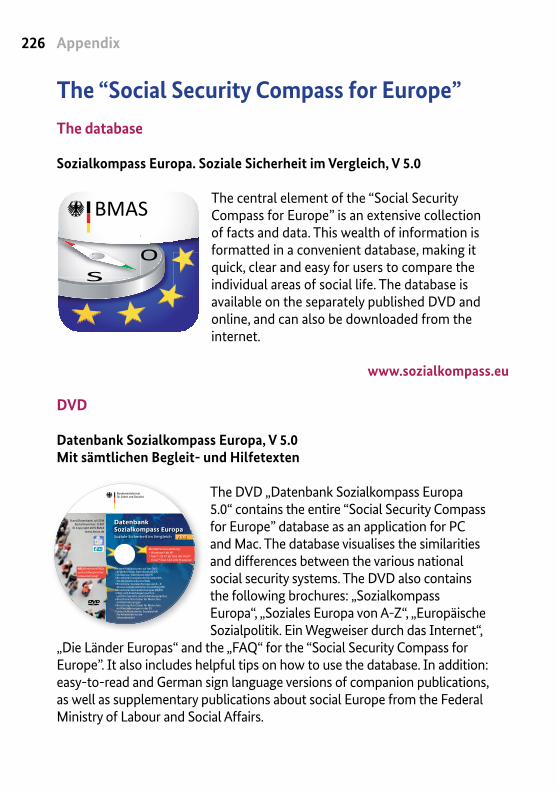
Appendix226
The “Social Security Compass for Europe”The database
Sozialkompass Europa. Soziale Sicherheit im Vergleich, V 5.0
The central element of the “Social Security Compass for Europe” is an extensive collection of facts and data. This wealth of information is formatted in a convenient database, making it quick, clear and easy for users to compare the individual areas of social life. The database is available on the separately published DVD and online, and can also be downloaded from the internet.
www.sozialkompass.eu
DVD
Datenbank Sozialkompass Europa, V 5.0Mit sämtlichen Begleit- und Hilfetexten
The DVD „Datenbank Sozialkompass Europa 5.0“ contains the entire “Social Security Compass for Europe” database as an application for PC and Mac. The database visualises the similarities and differences between the various national social security systems. The DVD also contains the following brochures: „Sozialkompass Europa“, „Soziales Europa von A-Z“, „Europäische Sozialpolitik. Ein Wegweiser durch das Internet“,
„Die Länder Europas“ and the „FAQ“ for the “Social Security Compass for Europe”. It also includes helpful tips on how to use the database. In addition: easy-to-read and German sign language versions of companion publications, as well as supplementary publications about social Europe from the Federal Ministry of Labour and Social Affairs.
Weitere Publikationen auf der DVD:Begleitheft zur Datenbank DE/ENGlossar zur Datenbank DE/ENBroschüre: Europäische Sozialpolitik. Ein Wegweiser durchs Web Broschüre: Soziales Europa von A – Z.Glossar sozialpolitischer Grundbegriffe Broschüre: Die Länder Europas DE/ENFAQs und Anleitungen (auch in Leichter Sprache und Gebärdensprache)Broschüre: Rat-Geber für Menschen mit BehinderungenBroschüre: Rat-Geber für Menschen mit Behinderungen in der EUUnterrichtsmaterial: SozialpolitikEin Arbeitsheft für die Sekundarstufe I
Mindestvoraussetzung:Windows® ab XPMac® OS X® ab 10.6 mit Intel® CoreTM Duo 1.83 GHz Prozessor
DatenbankSozialkompass EuropaSoziale Sicherheit im Vergleich V 5.0
Stand Datenbank: Juli 2014Bestellnummer: D 801
© Copyright 2015 BMASwww.bmas.de
NEU! Jetzt mit FAQs und umfangreicher Linksammlung!
BMAS
OS
The “Social Security Compass for Europe” 227
Order number D801Print versions
Sozialkompass Europa. Soziale Sicherheit im VergleichBegleittexte zur Datenbank, 6. Auflage 2015
This brochure gives interested readers insights into the development of the European Union‘s social security systems. It also compares various areas of the social security systems in the 28 EU member states. The publication is based on the interactive “Social Security Compass for Europe” database, which is updated each year along with the brochure. It covers a total of 15 topics: family, maternity leave, illness, care, disability, continued pay, unemployment, work-related accident, invalidity, ageing, surviving dependents, termination, co-determination, labour disputes and social hardship.
Order number A801
Die Länder Europas. Zahlen und Fakten zur sozialen Sicherung, 2. Aufl. 2015
The publication uses descriptive graphics to present information about European social security systems. The figures for the individual EU countries are provided in direct comparison with Germany and the EU as a whole. A detailed profile also introduces each country. In addition to general information about the political system and expenditures for various areas of social policy (social protection, pensions, healthcare, family and children, invalids), the publication offers an overview of the unemployment rate, GDP, population structure and rate of those affected by considerable material deprivation.
Order number A871
Die Länder EuropasZahlen und Fakten zur sozialen Sicherung
2. Auflag
e
2015
Sozialkompass EuropaSoziale Sicherheit im VergleichBegleittexte zur Datenbank
6. Au� a
ge
2015
Appendix228
Europäische Sozialpolitik. Ein Wegweiser durch das Internet
This publication is a collection of important and interesting URLs from the entire EU sorted by member state. The links for each individual country are structured in line with the topics in the “Social Security Compass for Europe” issued by the Federal Ministry of Labour and Social Affairs. Additional links cover the areas of general EU information, immigration, Europe-wide education, laws, travel and tourism, and social security. It is also possible to access the links at www.sozialkompass.eu and sort them by topic or country.
Order number A799
Soziales Europa von A-Z. Glossar sozialpolitischer Grundbegriffe
The glossary for the “Social Security Compass for Europe” provides explanations and definitions of important basic sociopolitical terms, including several references and sources. This document makes it easier to work with the interactive “Social Security Compass for Europe” database. It supports the database‘s use in schools and educational institutions, and is also designed for all citizens interested in social policy and European politics. The PDF is identical to the online version available at www.sozialkompass.eu.
Order number A798
über 1.200 Web-Adressennach Mitgliedstaaten und Themen geordnet
Europäische SozialpolitikEin Wegweiser durch das Internet
Soziales Europa von A–ZGlossar sozialpolitischer Grundbegriffe
rund 400 Begriffe verständlich erklärt
The “Social Security Compass for Europe” 229
Easy-to-read publications
Hilfetexte in Leichter Sprache
Easy-to-read information is also available for the “Social Security Compass for Europe”: help texts explaining how to use the database, and simplified versions of the latest developments in Europe. All texts are available in PDF format online at:
http://www.sozialkompass.eu/sprache.html
Rat-Geber für Menschen mit Behinderungen in der Europäischen Union in Leichter Sprache
This is an easy-to-read overview of the state assistance available to people with disabilities in the European Union. Topics range from education, labour and inclusion, to resources for people with disabilities. It also covers the rights of people with disabilities and the EU‘s goals.
Order number A812L
Rat-Geber für Menschen mit Behinderungen in Leichter Sprache
The publication contains information on the topic of disability in Germany. It explains essential details in easy-to-read format, and people with disabilities tips for everyday life - including sections on childhood, learning and health. The appendix provides an overview of other interesting and useful easy-to-read publications.
Order number A749
in Leichter Sprache
Rat-Geber für Menschen mit Behinderungen in der Europäischen Union
Rat-Geberfür Menschen mit Behinderungen
in Leichter Sprache
Appendix230
English-language publications
The English versions are complete translations of the German brochures and have the same content.
Social Security Compass. Social security in comparison5th edition
Order number A802
The Countries of Europe. Facts and key figures
Order number A871E
Social Europe from A to Z. A glossary of basic sociopolitical terms
Order number A798E
Social Security CompassSocial security in comparisonAccompanying information to the database
5th Editio
n
2014
The Countries of EuropeFacts and key figures
Social Europe from A to ZA glossary of basic sociopolitical terms
Around 400 terms in easy-to-understand language
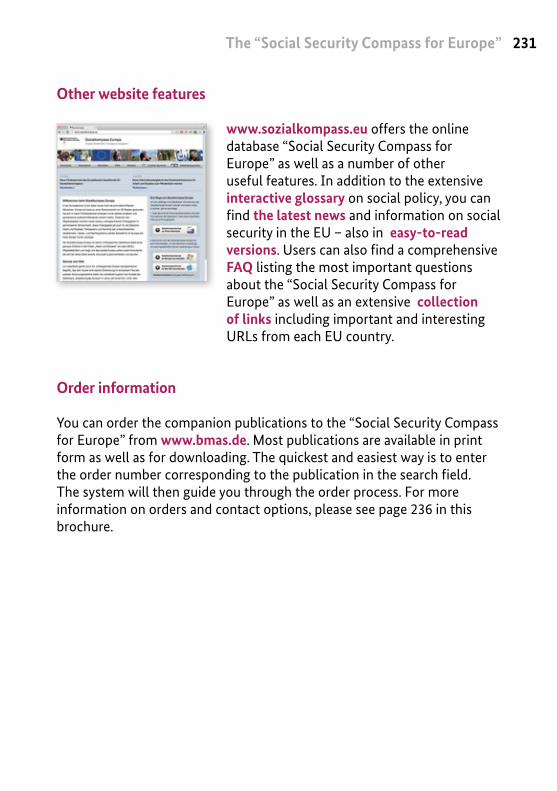
The “Social Security Compass for Europe” 231
Other website features
www.sozialkompass.eu offers the online database “Social Security Compass for Europe” as well as a number of other useful features. In addition to the extensive interactive glossary on social policy, you can find the latest news and information on social security in the EU – also in easy-to-read versions. Users can also find a comprehensive FAQ listing the most important questions about the “Social Security Compass for Europe” as well as an extensive collection of links including important and interesting URLs from each EU country.
Order information
You can order the companion publications to the “Social Security Compass for Europe” from www.bmas.de. Most publications are available in print form as well as for downloading. The quickest and easiest way is to enter the order number corresponding to the publication in the search field. The system will then guide you through the order process. For more information on orders and contact options, please see page 236 in this brochure.
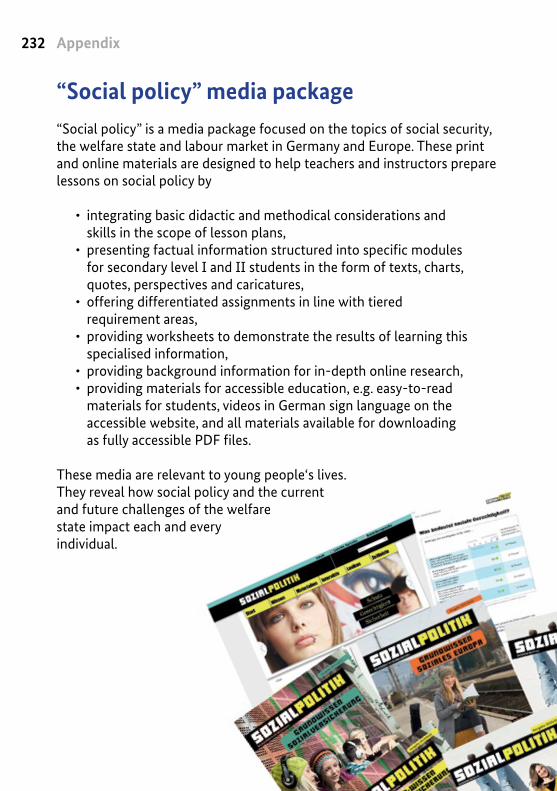
Appendix232
“Social policy” media package “Social policy” is a media package focused on the topics of social security, the welfare state and labour market in Germany and Europe. These print and online materials are designed to help teachers and instructors prepare lessons on social policy by
• integrating basic didactic and methodical considerations and skills in the scope of lesson plans,
• presenting factual information structured into specific modules for secondary level I and II students in the form of texts, charts, quotes, perspectives and caricatures,
• offering differentiated assignments in line with tiered requirement areas,
• providing worksheets to demonstrate the results of learning this specialised information,
• providing background information for in-depth online research,• providing materials for accessible education, e.g. easy-to-read
materials for students, videos in German sign language on the accessible website, and all materials available for downloading as fully accessible PDF files.
These media are relevant to young people‘s lives.They reveal how social policy and the current and future challenges of the welfare state impact each and every individual.
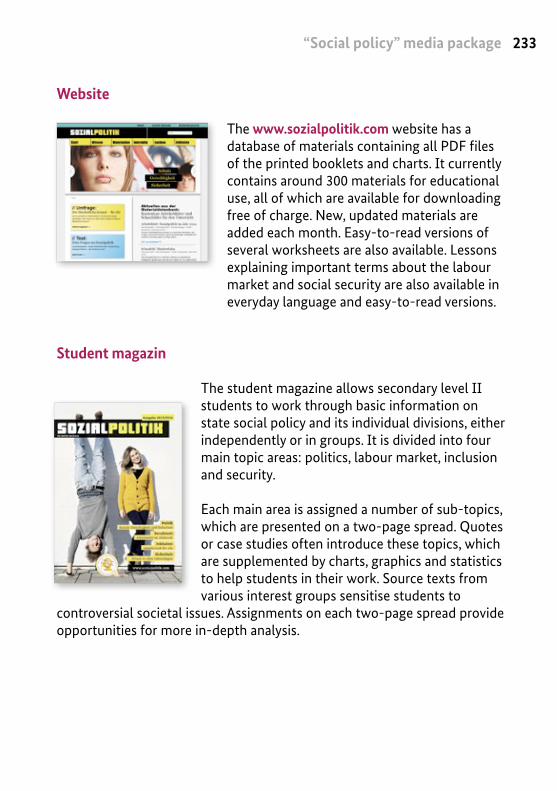
“Social policy” media package 233
Website
The www.sozialpolitik.com website has a database of materials containing all PDF files of the printed booklets and charts. It currently contains around 300 materials for educational use, all of which are available for downloading free of charge. New, updated materials are added each month. Easy-to-read versions of several worksheets are also available. Lessons explaining important terms about the labour market and social security are also available in everyday language and easy-to-read versions.
Student magazin
The student magazine allows secondary level II students to work through basic information on state social policy and its individual divisions, either independently or in groups. It is divided into four main topic areas: politics, labour market, inclusion and security.
Each main area is assigned a number of sub-topics, which are presented on a two-page spread. Quotes or case studies often introduce these topics, which are supplemented by charts, graphics and statistics to help students in their work. Source texts from various interest groups sensitise students to
controversial societal issues. Assignments on each two-page spread provide opportunities for more in-depth analysis.
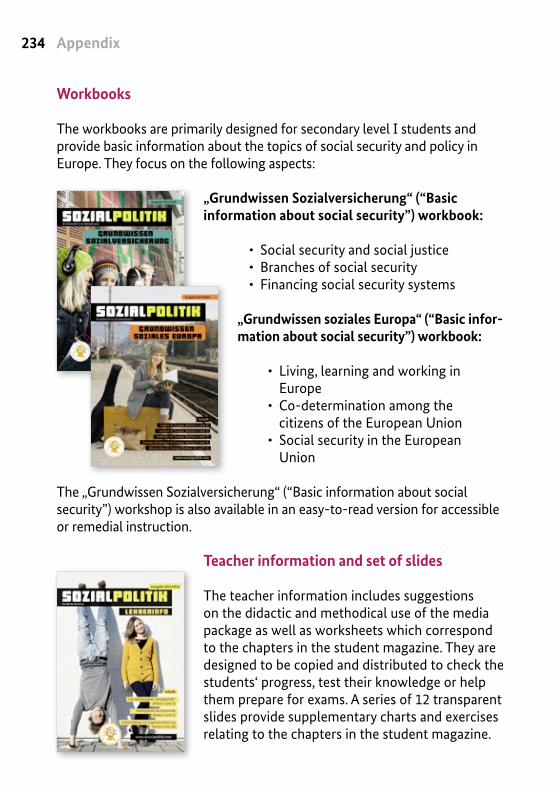
Appendix234
Workbooks
The workbooks are primarily designed for secondary level I students and provide basic information about the topics of social security and policy in Europe. They focus on the following aspects:
„Grundwissen Sozialversicherung“ (“Basic information about social security”) workbook:
• Social security and social justice• Branches of social security• Financing social security systems
„Grundwissen soziales Europa“ (“Basic infor-mation about social security”) workbook:
• Living, learning and working in Europe
• Co-determination among the citizens of the European Union
• Social security in the European Union
The „Grundwissen Sozialversicherung“ (“Basic information about social security”) workshop is also available in an easy-to-read version for accessible or remedial instruction.
Teacher information and set of slides
The teacher information includes suggestions on the didactic and methodical use of the media package as well as worksheets which correspond to the chapters in the student magazine. They are designed to be copied and distributed to check the students‘ progress, test their knowledge or help them prepare for exams. A series of 12 transparent slides provide supplementary charts and exercises relating to the chapters in the student magazine.
“Social policy” media package 235
“Social policy” for inclusive education
The “Social policy” materials can be used in inclusive education. The aim is to give all students equal access to the most important information about social policy irrespective of their language skills or physical and cognitive capacities. The following materials are available:
Easy-to-read workbook and worksheets: The “Basic information about social security” workbook was edited and designed to make it easy to understand for students with learning or language difficulties. An additional easy-to-read worksheet is also released online each quarter.
Easy-to-read glossary and guidelines, sign language videos: The online glossary explains important terms about the labour market and social security in easy-to-read language. Guidelines in easy-to-read and German sign language versions are also available for the “Social policy” media package.
Accessibility in accordance with BITV 2.0 (Federal Ordinance on Barrier-free Information Technology): Voice outputs of the www.sozialpolitik.com website and PDF files of the print materials are also available for use on the computer. Alternative texts are offered for graphics and photos, and type sizes can be adjusted as necessary. Clear contrasts make the content easier to read.
Order information:
Schools can order class sets of these materials free of charge:
Bestellservice Jugend und Bildung, 65341 EltvilleFax: 0 61 23 9 23 82 44E-Mail: [email protected] Internet: www.sozialpolitik.com or www.jubi-shop.de
Appendix236
Order informationOrder No.: A 871 „Die Länder Europas. Zahlen und Fakten zur sozialen Sicherung“ 2. Auflage 2015 A 871e “The countries of Europe. Facts and key figures” 2nd edition 2015
Tel: +49 (0) 30 18 272 272 1Fax: +49 (0) 30 18 10 272 272 1Postal address: Publikationsversand der Bundesregierung Postfach 48 10 09 18132 Rostock
E-Mail: [email protected]: www.bmas.de
If you cite this publication, please accurately state the publisher, title and publication date. Please additionally send a complimentary copy to the publishers.
Imprint 237
ImprintPublisher: Federal Ministry of Labour and Social Affairs Referat Information, Publikation, Redaktion 53107 Bonn
2nd edition, November 2015
Concept, Editing, Design: heimbüchel pr, Köln www.heimbuechel.de
Text: Dr. Bernd Heimbüchel, Michèle Gries, Tasso Griep
Editorial assistance: Kirsten Scholz
Editor: Ute Heimbüchel, Ellen Wurster
Layout: Ellen Sturm, Kirsten Scholz
Printed by Bundesministerium für Arbeit und Soziales, Hausdruckerei
Picture credits: 123rf, www.123rf.com (alevol, antonchalakov, anyaivanova, arekmalang dbajurin, deanpictures, evgeshag, gkoutouridis, hauhu, jenifoto, jovannig, katso, krasnevsky, matthi, mikewaters, mizio1970, neirfy, nui7711, packshot, radub85, sborisov, scanrail, sepavo, serrnovik, tomas1111, totalpics, ttretjak, tupungato, udra, vichie81, victorgrow, vili45, zechal, zerfart); casareal.es; creative collection (cc), www.ccvision.de; Digitales Bildarchiv des Presse- und Informationsamtes der Bundesregierung, www.bundesbildstelle.de (Steffen Kugler); Europäische Kommission, www.ec.europa.eu; Europäische Union, audiovisual.europarl.europa.eu, www.ec.europa.eu/avservices; Flickr (Platforma Obywatelska RP); Fotolia, www.fotolia.de (CB94, Robert Kneschke, Yvan, Zoe); Fotoservice des Bundeskanzleramtes Österreich; gouvernement.fr (Manuel Valls); keh.hu; kungahuset.se (Anna-Lena Ahlström); lrp.lt (MP A. Butkevicius); luxemburg.lu; MEV, www.mev.de (Claude Bousquet); norden.org (Johannes Jansson); koninkljhuis.nl; Peter Lechner/HBF; PiS, pis.org.pl; portugal.gov.pt; president.ie (Taoisearch Photo); prezident.sk; predsjednica.hr (Grabar Sluzbena fotografija); quirinale.it; rijksoverheid.nl (Portretfoto Rutte); rov.ro; Wikimedia (Partit Laburista)
Appendix238
Helpline
Monday – Thursday from 8 am to 8 pmYou ask – We answer
Pensions: +49 (0) 30 221 911 001
Accident insurance/Volunteer work: +49 (0) 30 221 911 002
Labour market policy and promotion: +49 (0) 30 221 911 003
Labour law: +49 (0) 30 221 911 004
Part-time employment, partial retirement, mini jobs: +49 (0) 30 221 911 005
Information for people with disabilities: +49 (0) 30 221 911 006
European Social Fund/Social Europe: +49 (0) 30 221 991 007
Employee equity participation: +49 (0) 30 221 911 008
Information regarding the Education Package: +49 (0) 30 221 911 009
Information regarding the Minimum Wage: +49 (0) 30 60 28 00 28
Helpline 239
Service for the deaf/hard of hearing: E-Mail: [email protected] [email protected] Fax: +49 (0) 221 911 017
Sign language telephone: [email protected]
Revision date
The text sections of this publication are current as of November 2015. Theinformation contained in the tables is mostly based on the latest availablereference data contained in EUROSTAT July 2015.
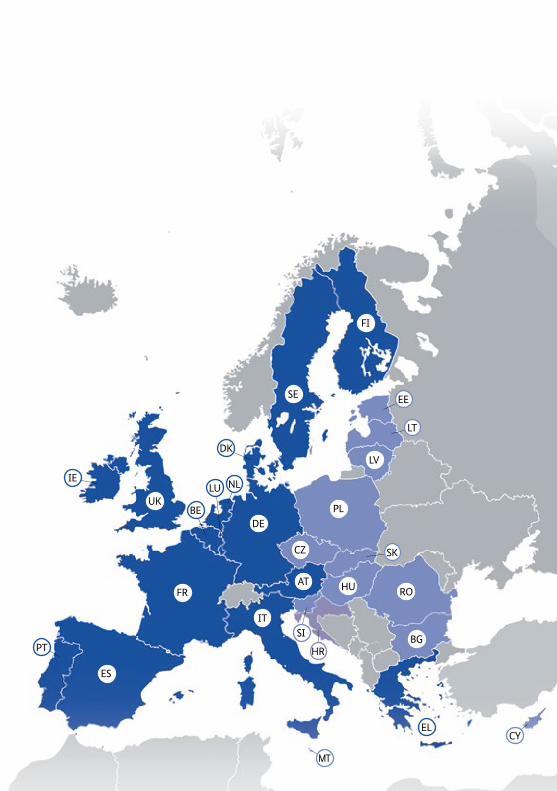
DE
FR
ES
UK
SE
FI
PL
IT
AT
EL
ROHU
BG
CZ
LV
EE
LT
SK
SI
HR
MT
CY
PT
IE
DK
BE
LU NL
This publication is made available as part of the public relations work of the German Federal Ministry of Labour and Social Affairs. It may not be used for electoral campaigning by any political party, canvasser or electoral assistant during any European, Bundes-tag, Landtag or local election. In particular, it may not be distributed at any electoral campaign event or political party information stand; no party-political information or advertising may be inserted in, printed on or otherwise attached to it; and it may not be passed on to any third party for purposes of electoral campaigning. Regardless of when, how and in what quantities it is supplied and of whether an election is imminent at the time, this publication may not be used in any way such that the German Federal Government could be construed as favouring any particular political grouping.

![Sports in Portuguese-language african countries: a field ... · Sports in Portuguese-language african countries: a field to discover Andrea Marzano[1] and Augusto Nascimento[2] Abstract](https://img.pdfslide.us/doc/110x75/5f0347087e708231d4086b1e/sports-in-portuguese-language-african-countries-a-field-sports-in-portuguese-language.jpg)