Embed Size (px)
Citation preview

Gerry Angevine and Kenneth P. Green
July 2016
The Costs of Pipeline Obstructionism

www.fraserinstitute.org

iii COSTS OF PIPELINE OBSTRUCTIONISM
www.fraserinstitute.org
Contents
Executive Summary / 1
Introduction / 3
Continued Discounting of Western Canadian Crude Oil in US Market Underscores Need for Market Alternatives / 4
Economic Consequences of Bottlenecks for Producers and Governments / 10
Canadian Crude Oil Production Outlook: Implications for Pipeline Infrastructures / 16
Alberta’s Climate Change Plan: Implications for Oil Sands Investment, Production, and Additions to Takeaway Capacity / 18
Obstacles Faced by Major Pipeline Projects / 22
Changes to the Pipeline Project Review Process / 28
Recommendations for Expediting Pipeline Projects of Strategic and National Interest / 30
Conclusion / 32
Appendix / 35
References / 37
About the Authors / 42
Acknowledgements / 43
About the Fraser Institute / 43
Publication Information / 44
Supporting the Fraser Institute / 45
Purpose, Funding, and Independence / 45
Editorial Advisory Board / 46

www.fraserinstitute.org

1 COSTS OF PIPELINE OBSTRUCTIONISM
www.fraserinstitute.org
Executive Summary
This paper reviews how Western Canadian oil producers are being con-strained by the inability to access new markets via ocean ports and how this constraint, along with the drop in oil prices, the Alberta ceiling on greenhouse gas (GHG) emissions in oil sands operations, and regulatory obstacles are affecting pipeline infrastructure requirements and decisions.
Western Canadian conventional and non-conventional (i.e., oil sands) heavy crude oils continue to suffer from price discounts relative to world region crude oil prices such as North Sea Brent (adjusted for quality differentials and transportation cost), and are at risk of being displaced by increasing US oil production. Access to port facilities on the west and/or east coast would allow Canadian producers to access world crude oil prices.
If Canada were able to export 1 million barrels of oil per day to markets accessible from ocean ports—with the lion’s share of heavy oil and bitumen exports continuing to flow to US oil markets—substantial incremental rev-enues could result. At a US$40/bbl price this could be as high as $2 billion per year (in Canadian dollars) compared with selling into the flooded US market. At an average price of US$60/bbl, it could reach CA$4.2 billion; and at US $80/bbl, CA$6.4 billion. If higher netbacks from markets accessed from tidewater connections were realized by all Western Canada heavy oil production, at the US$40, US$60, and US$80/bbl price levels the annual benefits could reach CA$8.9 billion, CA$18.5 billion, and $CA28.2 billion, respectively.
Both the oil price and the volume of production drive the Alberta and Saskatchewan crude oil royalty formulas. The importance of the price factor is underscored by the impacts of much lower prices on royalty revenues. In the Alberta October 2015 budget, royalty revenues were projected to plunge to $1.5 billion in 2015–16 from $5.0 billion. Royalties from conventional oil production were estimated at $0.5 billion compared with $2.2 billion in 2014–15 (Alberta, 2015a). Saskatchewan’s February 2016 Budget Update projected oil royalty revenue of $347.9 million in fiscal 2015–16—38.5 per-cent less than previously (Saskatchewan Ministry of Finance, 2016a).
Understanding the sensitivity of royalty revenues to price changes allows governments to predict how revenues will be affected by improved prices as, for example, access to new markets is achieved. Oil royalty revenues in Alberta and Saskatchewan would increase by about CA$1.2 billion a year if the WTI oil price were to increase by US$7/bbl. A US$5/bbl increase in the price of WTI crude oil would increase Saskatchewan’s annual royalty revenue on heavy oil production by approximately $29.5 million, and total

2 COSTS OF PIPELINE OBSTRUCTIONISM
www.fraserinstitute.org
oil production royalties by about $94.5 million (assuming an exchange rate of 71.5 cents per Canadian dollar).
The capacity to transport crude oil to coastal refineries is insufficient to solve the pricing dilemma that western Canadian oil producers face due to heavy dependence on the US mid-continent region. Oil pipeline projects with a combined capacity of about 4 MMbpd (million barrels per day) have been proposed or conditionally approved. But investors may be less inclined to move ahead with oil sands and related infrastructure projects than before the downturn in prices.
With no reduction in GHG emission rates, the 100 Mt limit on GHG emis-sions from oil sands operations will be reached in 2025, at which point total oil sands production is projected to increase by 1.5 MMbpd. If, as the NEB has suggested, Western Canadian conventional oil production will then have peaked, the required increase in pipeline takeaway capacity will be about 1.9 MMbpd (assuming a system capacity utilization rate of 80 percent). Clearly, without significant reductions in oil sands GHG emissions rates, much of the proposed increase in pipeline capacity from Western Canada (Appendix A) will not be needed.
The Energy East Pipeline, the Trans Mountain Pipeline Expansion, and the Northern Gateway Pipeline project would enable about 2MMbpd of Western Canadian crude to access coastal US and overseas markets. But all three proj-ects face serious challenges, mostly environmental, from First Nations, and from various communities. Further, the federal government has imposed new consultation obligations and upstream GHG emission assessment requirements on the Energy East and Trans Mountain projects that will prolong the review process.
Every effort should be made to expedite pipeline project review and assess-ment processes before windows of opportunity for access to new markets are largely pre-empted by competitors. If the legislated regulatory review process with regard to a particular project is unduly delayed, the federal government may need to help resolve impasses or, in the case of projects that are truly in the national interest, introduce special legislation to allow a project to proceed.

3 COSTS OF PIPELINE OBSTRUCTIONISM
www.fraserinstitute.org
Introduction
In 2013, we reviewed the challenges that Western Canada’s crude oil pro-ducers face by not having pipeline transportation access to potential mar-kets in Eastern Canada, parts of the United States, and overseas (Angevine, 2013). That review indicated that producers were suffering from substantial discounts vis-à-vis prices in the US because of increasing supplies in the mid-continent region, where limited pipeline capacity was constraining crude oil shipments to refiners in the US Gulf Coast. Further, the inability to access markets in Eastern Canada and overseas and to expand exports to refineries in some US market regions, especially the Gulf Coast, threatened to seriously constrain the growth of crude oil exports. Also constrained was much of the anticipated growth in production from Western Canada’s oilfields, especially the oil sands.
Events since that paper was written compel an updated review of Canada’s crude oil transportation bottleneck dilemma. This study examines whether and to what extent producers and governments continue to suffer from widespread price discounting on account of the bottlenecks noted in the earlier paper. We review changes in the outlook for investment in oil sands bitumen recovery operations, where Western Canada’s potential for oil pro-duction growth lies, and the implications that this may have for infrastruc-ture requirements. In addition, we examine the extent to which the Alberta Government’s recent decision to limit GHG emissions from oil sands bitu-men production to 100 megatons per year could limit production growth and affect infrastructure requirements. Finally, we review progress that has been made towards putting proposed new pipeline transportation infra-structure in place, and the various obstacles that are being encountered. We conclude by putting forward several suggestions for governments to consider when they review important pipeline project proposals.

4 COSTS OF PIPELINE OBSTRUCTIONISM
www.fraserinstitute.org
Continued Discounting of Western Canadian Crude Oil in US Market Underscores Need for Market Alternatives
Failure to build pipeline capacity to transport crude oil from western Canada to port facilities on the east and west coasts (which would facilitate export to overseas refineries) means that Canada’s exports continue to be limited for the most part to US inland refineries. Substantial increases in US oil production in recent years (figure 1) as the result of technological improve-ments in horizontal drilling and multi-stage fracturing techniques, as well as increased crude oil supplies from Western Canada, have put downward pressure on crude oil prices in the mid-continent region.
With completion of its “MarketLink” crude oil pipeline facility (the south-ernmost leg of the proposed Keystone XL Pipeline) in 2014, TransCanada Corporation now has the capacity to move crude oil from Cushing, Oklahoma to the Houston, Texas vicinity. However, the rejection of the company’s Keystone XL Pipeline proposal by President Obama in November 2015 means that the ability to ship 825,000 barrels of crude oil per day from Western Canada and North Dakota to the US Gulf of Mexico via Keystone XL and Cushing has been thwarted, at least for the time being (President Obama, 2015).1
1. There is no indication that the recent downturn in prices has altered price expectations sufficiently to weaken would-be shippers’ support for the proposed Keystone XL Pipeline.
Figure 1: US field production of crude oil
1.5
2.0
2.5
3.0
3.5
4.0
20152010200520021995199019851980197519701965
Billi
ons o
f bar
rels
Source: US Energy Information Administration, 2016a.

5 COSTS OF PIPELINE OBSTRUCTIONISM
www.fraserinstitute.org
For its part, Enbridge has been expanding its US Mainline pipeline capacity from North Dakota to Cushing via the upgrading and addition of pumping stations in Wisconsin and Illinois. Combined with the company’s Seaway Pipeline expansion, this will provide an alternative path to the Gulf for Western Canadian crude oil.2
Heavy crude oil and bitumen (non-upgraded) account for almost half of estimated 2015 Western Canadian crude oil production, while conventional heavy crude and upgraded and non-upgraded bitumen (including bitumen blends) represent approximately 81 percent of total Canadian US-bound oil exports (NEB, 2016a).
Canadian light and heavy crude oil producers are both subject to substantial penalties in US markets, but the heavy crude oil and bitumen blend labelled as “Western Canada Select” (WCS) that is mixed and priced at Hardisty, Alberta suffers more than light, sweet crudes. This is because the price of WCS is affected not only by relatively long distances to refinery destinations and the higher transportation costs that the shippers must absorb for that reason, but also by quality differences.
WCS is heavier than West Texas Intermediate (WTI) crude (an API of 20.5 degrees versus 34.3 degrees) and contains 3.5 percent sulphur by weight versus WTI’s 0.9 percent (BNN News, 2013). Being heavier, WCS is more costly to transport by pipeline (as it takes longer to move it a given distance). Further, the heavier the crude oil (i.e., the lower the API gravity rating), the lower its value to a refiner as it will either require more processing or yield a higher percentage of lower-valued by-products such as heavy fuel oil. Complex crudes containing more sulphur also generally cost more to refine than low-sulphur crudes. For these reasons, oil refiners are willing to pay more for light, low-sulphur crude oil.
If it were not for the quality differences and the effect that this has on refinery demand for competing crudes, the difference between the price of WCS at Hardisty AB and WTI crude oil at Cushing OK would boil down to the transportation cost. According to the National Energy Board, “the tolls to ship oil from Edmonton/Hardisty to Cushing are about US$5 to $6.55 per barrel, depending on the type of oil and which pipeline systems are used.” It costs approximately another US$3 per barrel to reach the Gulf Cost from Cushing (NEB, 2014).
The insufficient pipeline capacity available to transport Canadian crudes to US destinations has resulted in increased shipment by railway in recent years.3 Of course, the producers that have resorted to shipping by rail have
2. As indicated later in this report, Enbridge is also taking steps to increase the takeaway capacity of the Canadian Mainline (table 2).3. At 96,065 barrels per day in January 2016, Canadian crude oil exports by rail were ten times greater than in January 2012 (NEB, 2016b).

6 COSTS OF PIPELINE OBSTRUCTIONISM
www.fraserinstitute.org
had to absorb the higher transportation cost.4 The more that producers have to depend on rail because of insufficient pipeline capacity, the greater will be the average WCS transportation cost and the spread between the WCS and WTI prices. Deducting the transportation cost from Hardisty to Cushing from the price of WTI crude at a given point in time provides an indication of the approximate value of WCS to US refiners in the Cushing area.
Figure 2 illustrates that the widely referenced West Texas Intermediate light, sweet crude oil price marker established at Cushing, Oklahoma has mostly continued to trade at a discount relative to the marker established for similar (though slightly heavier) Brent North Sea crude since 2012.5 Consequently, WCS has generally continued to be substantially below the prices of both WTI and Brent. As indicated, WCS has also been trading below the average price of crude oil in Japan.
4. According to one source, the cost of transporting crude oil from Hardisty, Alberta to the Gulf Coast by rail is as much as US$10/bbl greater than shipping by pipeline (Hussain, 2015). In 2014, the National Energy Board indicated that “rail costs are roughly double or triple the pipeline tolls” (NEB, 2014).5. The differential between the WTI price and other world region oil prices at any point in time reflects the crude oil supply and demand situation in each region, crude oil quality differences, and transpor-tation costs. When comparing particular prices, one must recognize that the differences between them are affected by these factors. In recent years, the ban on US crude oil exports along with the increase in US oil production has served to suppress the WTI price relative to Brent. With the US export ban lifted, the difference between the WTI marker price and other world region markers can be expected to narrow barring other developments.
0
20
40
60
80
100
120
140
Oct-15
Jul-1
5Apr-1
5
Jan-15
Oct-14
Jul-1
4Apr-1
4
Jan-14
Oct-13
Jul-1
3Apr-1
3
Jan-13
Oct-12
Jul-1
2Apr-1
2
Jan-12
Oct-11
Jul-1
1Apr-1
1
Jan-11
WCS
Brent
US$/
bbl
Japanese priceWTI
Figure 2: WCS vs. crude oil reference prices
Sources: Alberta, 2016d; US Energy Information Administration, 2016b; Petroleum Association of Japan, 2015.

7 COSTS OF PIPELINE OBSTRUCTIONISM
www.fraserinstitute.org
Figure 3 illustrates the percentage discount at which the WCS heavy crude oil blend traded relative to the prices of WTI and Brent in recent years. Although oil prices have tumbled dramatically since early 2015 (figure 2), in percentage terms the discount of WCS relative to WTI mainly fluctuated in the 25 to 30 percent range during the 2014 to 2015 period, a bit higher on average than from 2011 through 2013. Generally, the discount relative to Brent has been slightly greater because the price of WTI has been suppressed relative to Brent, in part because of excess supplies in the US mid-continent as a consequence of growing US production but also because of the US ban on crude oil exports, which was only lifted recently.
The percent discount to which Canadian light crude oil has been subject ver-sus WTI has been significantly less than in the WCS case (figure 4). This is mainly because the discount that Canadian producers have to bear because of quality differences vs. WTI crude is less with light crudes than with WCS.
To the extent that Canadian heavy crude oil and bitumen blends are avail-able to the US Gulf Coast oil-refining hub, they face tough competition from Mexican Maya crude, a relatively sour heavy crude oil with gravity and sul-phur content similar to that of WCS.6
6. Maya crude has an API gravity rating of 21.8 degrees. This indicates that it is slightly lighter than WCS’s 20.5 degrees API. With sulphur content of 3.33 percent by weight, Maya crude is marginally sweeter than WCS that has a sulphur content of 3.51 percent (BNN News, 2013; Wikipedia).
Figure 3: WCS % discounts vs. Brent and WTI
Sources: Alberta, 2016d; US Energy Information Administration, 2016b; author calculations.
0
10
20
30
40
50
Oct-15
Jul-1
5Apr-1
5
Jan-15
Oct-14
Jul-1
4Apr-1
4
Jan-14
Oct-13
Jul-1
3Apr-1
3
Jan-13
Oct-12
Jul-1
2Apr-1
2
Jan-12
Oct-11
Jul-1
1Apr-1
1
Jan-11
vs. WTI
vs. Brent
Perce
nt

8 COSTS OF PIPELINE OBSTRUCTIONISM
www.fraserinstitute.org
WCS and Maya oil crude prices are compared in figure 5 and the WCS-Maya price differential is shown in figure 6. For some time, Maya crude had been trading at a significant premium relative to WCS, likely because of the WCS transportation cost since the quality differences are small. The narrowing of the price differential during the past year suggests that marketing arm of state-owned PEMEX is intent on maintaining the Maya crude market share in the US Gulf and is prepared to discount the price of Maya to the extent necessary.
These comparisons illustrate the dilemma that Canada’s crude oil export-ers face due to being tied to the US market, where the capacity to produce oil from tight formations has resulted in increased supply and fierce com-petition during the past few years. Further, they underscore the need for Canadian crude oil to gain access to ocean ports in order to benefit from the higher prices that are available overseas (as with the Brent price marker).
Figure 4: Canadian Light % discount from WTI
Sources: Natural Resources Canada, 2016c; US Energy Information Administration, 2016b; author calculations.
0
5
10
15
20
Oct-15
Jul-1
5Apr-1
5
Jan-15
Oct-14
Jul-1
4Apr-1
4
Jan-14
Oct-13
Jul-1
3Apr-1
3
Jan-13
Perce
nt

9 COSTS OF PIPELINE OBSTRUCTIONISM
www.fraserinstitute.org
Figure 5: WCS price vs. Mexican Maya Crude
Source: Alberta, 2016d.
Figure 6: Maya-WCS price differential
Source: Alberta 2016d; author calculations.
0
20
40
60
80
100
120
Oct-15
Jul-1
5Apr-1
5
Jan-15
Oct-14
Jul-1
4Apr-1
4
Jan-14
Oct-13
Jul-1
3Apr-1
3
Jan-13
Oct-12
Jul-1
2Apr-1
2
Jan-12
Oct-11
Jul-1
1Apr-1
1
Jan-11
WCS
Maya
US$/
bbl
0
10
20
30
40
50
60
Oct-15
Jul-1
5Apr-1
5
Jan-15
Oct-14
Jul-1
4Apr-1
4
Jan-14
Oct-13
Jul-1
3Apr-1
3
Jan-13
Oct-12
Jul-1
2Apr-1
2
Jan-12
Oct-11
Jul-1
1Apr-1
1
Jan-11
Maya - WCS
US$/
bbl
10 COSTS OF PIPELINE OBSTRUCTIONISM
www.fraserinstitute.org
Economic Consequences of Bottlenecks for Producers and Governments
Price Discounting
Because Canadian conventional and non-conventional (i.e., from the oil sands) heavy crude oils continue to suffer from price discounts relative to world region crude oil prices such as North Sea Brent (adjusted for quality differentials and transportation cost), and is at risk of being displaced to some extent by the increase in US oil production, we assume that it is in the national interest to develop access to overseas markets at an early date. Access to port facilities on the west and/or east coast will allow Canadian producers to access world crude oil prices such as the price of North Sea Brent crude (adjusted for transportation cost). If such access continues to be unavailable, the value of the lost revenue will mount.
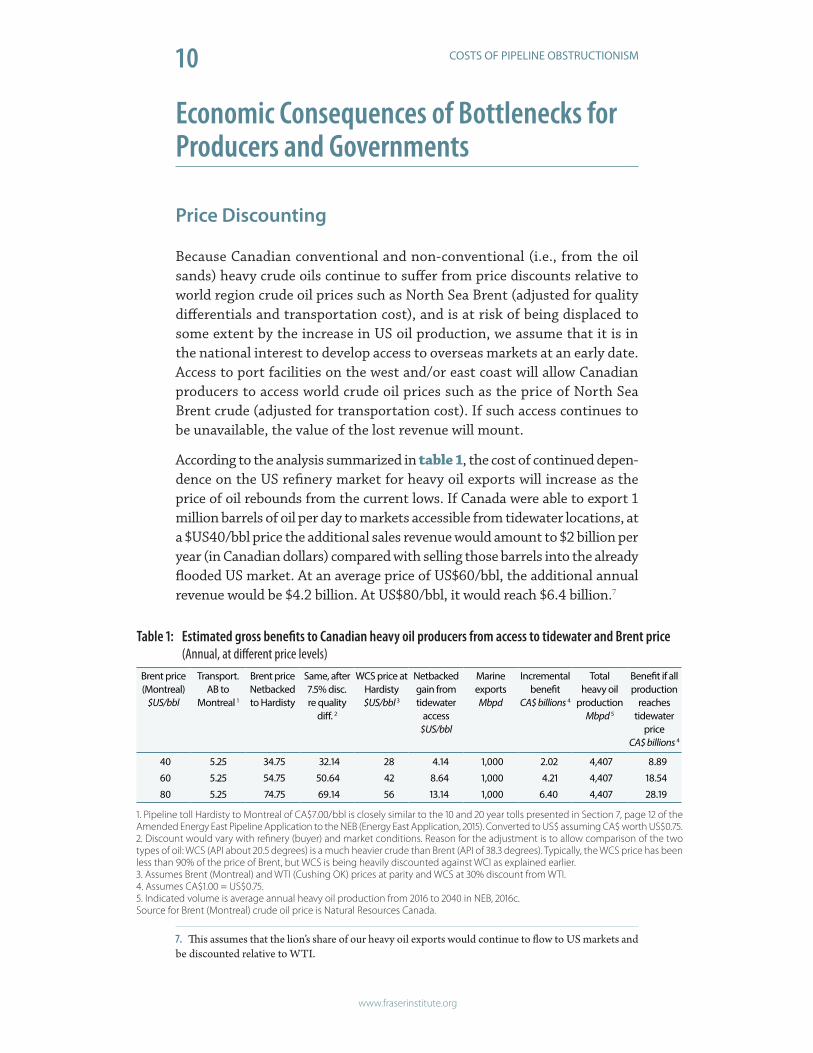
According to the analysis summarized in table 1, the cost of continued depen-dence on the US refinery market for heavy oil exports will increase as the price of oil rebounds from the current lows. If Canada were able to export 1 million barrels of oil per day to markets accessible from tidewater locations, at a $US40/bbl price the additional sales revenue would amount to $2 billion per year (in Canadian dollars) compared with selling those barrels into the already flooded US market. At an average price of US$60/bbl, the additional annual revenue would be $4.2 billion. At US$80/bbl, it would reach $6.4 billion.7
7. This assumes that the lion’s share of our heavy oil exports would continue to flow to US markets and be discounted relative to WTI.
Brent price (Montreal)
$US/bbl
Transport.AB to
Montreal 1
Brent priceNetbackedto Hardisty
Same, after7.5% disc.re quality
diff. 2
WCS price atHardisty$US/bbl 3
Netbackedgain fromtidewater
access$US/bbl
MarineexportsMbpd
Incrementalbenefit
CA$ billions 4
Totalheavy oil
productionMbpd 5
Benefit if allproduction
reachestidewater
priceCA$ billions 4
40 5.25 34.75 32.14 28 4.14 1,000 2.02 4,407 8.89
60 5.25 54.75 50.64 42 8.64 1,000 4.21 4,407 18.54
80 5.25 74.75 69.14 56 13.14 1,000 6.40 4,407 28.19
Table 1: Estimated gross benefits to Canadian heavy oil producers from access to tidewater and Brent price (Annual, at different price levels)
1. Pipeline toll Hardisty to Montreal of CA$7.00/bbl is closely similar to the 10 and 20 year tolls presented in Section 7, page 12 of the Amended Energy East Pipeline Application to the NEB (Energy East Application, 2015). Converted to US$ assuming CA$ worth US$0.75.2. Discount would vary with refinery (buyer) and market conditions. Reason for the adjustment is to allow comparison of the two types of oil: WCS (API about 20.5 degrees) is a much heavier crude than Brent (API of 38.3 degrees). Typically, the WCS price has been less than 90% of the price of Brent, but WCS is being heavily discounted against WCI as explained earlier.3. Assumes Brent (Montreal) and WTI (Cushing OK) prices at parity and WCS at 30% discount from WTI.4. Assumes CA$1.00 = US$0.75.5. Indicated volume is average annual heavy oil production from 2016 to 2040 in NEB, 2016c.Source for Brent (Montreal) crude oil price is Natural Resources Canada.

11 COSTS OF PIPELINE OBSTRUCTIONISM
www.fraserinstitute.org
If, as in the market study undertaken recently by IHS Inc. in support of TransCanada’s Energy East Pipeline proposal (IHS, 2015), one assumes that the higher netbacks from markets accessed from tidewater connections would be realized by all Western Canada heavy oil production, the benefits would of course be much greater. In that case, as indicated in table 1, at the US$40, US$60, and US$80/bbl price levels the estimated annual benefits could be as large as 8.9 billion, 18.5 billion and 28.2 billion Canadian dollars, respectively.8
Royalties
The Alberta and Saskatchewan crude oil and bitumen royalty formulas take into account both the price of crude oil and the volume of oil that is pro-duced. Royalty revenues in both provinces have fallen substantially because of the fall in crude oil prices.
Alberta
The importance of crude oil prices in the determination of royalty reve-nues from Alberta crude oil production is illustrated by the large downward adjustment in the October 2015 provincial budget. Royalty revenues from bitumen production were projected to plunge to $1.5 billion in 2015–16 from $5.0 billion the preceding year despite an estimated 6 percent increase in production (Alberta, 2015a). The reason was the much lower oil price assumption compared with the previous fiscal year.9
Royalties from conventional oil production in 2015–16 were estimated at $0.5 billion compared with 2.2 billion in 2014–15. Most of the 74 percent reduction in royalties on conventional oil production is due to lower oil prices as production was projected to decline by only 4.4 percent.
Under the current Alberta royalty framework, the royalty rate on conven-tional oil production is determined by the producer’s monthly production and by the price of oil in that month.10 The rate varies with the price of oil
8. The indicated “netback gain” of US$4.14/bbl in the first (US$40/bbl Brent (Montreal)) case is less than the US$5.25 toll on the proposed East West Pipeline. But the cost to ship WCS crude from Hardisty to Cushing would be greater. In the other examples, the “netback gain” exceeds the toll on the East West Pipeline.9. In the October 2015 budget, the price of the WCS crude blend at Hardisty was assumed to average only $46.50/bbl (Canadian) in 2015–16 compared with $70.78/bbl in 2014–15.10. Because the royalty system results in fluctuating royalty revenues in accordance with changes in the price of oil, the provincial government (and taxpayers) are placed at risk from lower oil prices that otherwise would be limited to the producers.

12 COSTS OF PIPELINE OBSTRUCTIONISM
www.fraserinstitute.org
up to a ceiling of 40 percent at given rates of production.11 For example, at an average monthly production rate of 50 bbl/day, and a price of CA$40/bbl, the applicable royalty rate in the month is about 15.8 percent. At the same production rate, if the average oil price were to increase to CA$50/bbl, the royalty rate applicable to the month’s production would increase to 22 per-cent (Alberta Energy, 2016a). Given the importance of price in the royalty calculation formula, Alberta government royalty revenues should benefit directly from increases in oil netbacks realized from gaining access to alter-native markets for western Canadian conventional heavy oil exports.12
Alberta royalties on oil sands bitumen recovery operations are applied to gross or net revenue (rather than production), depending on whether a project’s capital costs have been recovered and, if they have been, which rate yields the most revenue for the government.13 In both cases, the roy-alty rate is a function of the WTI price in terms of CA$/bbl.14 The pre-payout rate varies from 1 percent to 9 percent of gross revenue. The rate applicable in the post-payout case is from 25 percent to 40 percent of net revenue, or 1 percent to 9 percent of gross revenue, whichever is greater.15
If exports of raw and upgraded oil sands bitumen increase as a consequence of new pipelines being connected to tidewater port facilities, thereby pro-viding access to alternative markets, Alberta oil sands royalties will increase in accordance with the incremental revenue.16 In this way, not only will the producers benefit, but so will Albertans at large.
By way of example, if 500,000 barrels of bitumen were exported per day as a consequence of tidewater connections, exports to the US were unchanged, net revenue from the additional oil sands operations at a WTI price of CA$60/bbl averaged 20 percent of gross revenue, and the “after payout” royalty rate of 26.15 percent applied, annual royalty revenue would increase by approximately $570 million.
11. The 40 percent rate ceiling is reached at lower production volumes when the oil price is relatively high. For example, with a $100/bbl price the ceiling is reached when daily production is a bit less than 50 barrels per day. But with a $50/bbl price the ceiling is not reached until production is about 140 barrels per day.12. The new provincial government’s royalty review, completed in January 2016, will result in some chan-ges to the relationship of royalty rates to both oil price and conventional oil production discussed in this paragraph. Under the new royalty system, companies will pay a 5 percent royalty on crude oil production until capital costs have been recovered, after which royalty rates will range between 5 percent and 40 percent depending on price of oil (Alberta Energy, 2016b). The new royalty regime will apply to wells drilled starting in 2017. Until 2027 the current royalty system will apply to all wells drilled prior to 2017.13. If development and related capital costs have not been fully recovered, a “pre-payout” royalty applies. Once capital expenditures have been recovered, the “post-payout” royalty applies.14. The royalty formula is based on the WTI price in terms of Canadian dollars. As noted elsewhere, WTI is a higher grade of crude oil, both lighter and sweeter, than raw and upgraded bitumen produced from the Alberta oil sands.15. The oil sands royalty rate schedule has been left intact by the recent royalty review process.16. As noted above, in the case of oil sands production royalties are based on sales revenue rather than price.

13 COSTS OF PIPELINE OBSTRUCTIONISM
www.fraserinstitute.org
Saskatchewan
The Saskatchewan Government’s February 29, 2016 Budget Update indi-cated oil royalty revenue during fiscal year 2015–16 of $347.9 million, or 38.5 percent less than projected in the original budget. The reduction was almost entirely the result of lower oil prices as the expected average price of WTI was lowered to US$44.78/bbl from US$57.15/bbl in the budget (a 21.7 percent reduction), while estimated oil production was adjusted downward by only 3 percent (Saskatchewan, 2016a).
At or below a $15.89/bbl price, the monthly royalty applicable to a given level of conventional heavy crude oil production is essentially a function of the production volume. But at higher prices, the royalty share of monthly production is calculated by applying the “base” royalty rate applicable to a “base” price and a “marginal” royalty rate to the portion of the average heavy oil price for the month (as calculated by the government) that is above the base price. That marginal royalty rate, which applies to all so-called “Fourth Tier” wells (i.e., wells drilled by or after October 1, 2002), is 30 percent.
The sensitivity of the Saskatchewan Crown royalty rate on conventional crude oil production with respect to the price of oil at a given monthly production rate is illustrated in figure 7. For example, for a well producing at the rate of 90 barrels per day during a given month, if the price is $30/bbl the royalty is 20 percent. However, at a $60/bbl price the royalty is about 28 percent.
Figure 7: Saskatchewan conventional oil fourth tier royalty curve price sensitivity
Source: Saskatchewan, 2016b.
0
5
10
15
20
25
30
35
40
0 10 20 30 40 50 60 70 80 90 100 110 120 130 140 150 160 170 180 190 200
Crow
n Ro
yalty
Rat
e (p
er c
ent)
Monthly Well Productivity (bbls/day)
Saskatchewan Conventional Oil Fourth Tier Royalty Curve Price Sensitivity
@ $15.89/bbl ($100/m3)
@ Infinite Price
@ $60/bbl
@ $30/bbl
@ $90/bbl
Monthly well productivity (bbls/day)
Crow
n ro
yalt
y ra
te (p
erce
nt)

14 COSTS OF PIPELINE OBSTRUCTIONISM
www.fraserinstitute.org
Figure 8 illustrates that the Saskatchewan Crown royalty rate increases in step with the price of heavy oil in the case of a well producing only 25 barrels per day. As the price increases from about $15/bbl to $80/bbl, the royalty rate increases from about 2 percent to 14 percent.
Clearly, higher heavy oil netbacks resulting from Saskatchewan production gaining access to world oil prices would increase royalty revenues. The mag-nitude of the increase would depend on the netback (i.e., the effective price) realized from sales to markets accessed from connections at ocean port facilities and the volume of heavy oil exported to those markets.
In this regard, the Saskatchewan Ministry of Economy has indicated that a US$5/bbl increase in the netback above the current WTI price would increase the Province’s annual royalty revenue on heavy oil production by approxi-mately $29.5 million, and total oil production royalties by about $94.5 mil-lion (Saskatchewan, 2016c).17 The impacts would be approximately the same whether the price of oil before the increase were $40/bbl or $60/bbl. This assumes that production would not increase in response to higher prices. In fact, some increase in light/medium production could occur, thereby gener-ating additional royalty revenues, as the National Energy Board is predicting Saskatchewan light/medium crude oil production to increase as the price of
17. In their analysis, Government of Saskatchewan officials assumed an exchange rate of 71.5 US cents per Canadian dollar and that the price increase of US$5/bbl would apply to all of the Province’s crude oil production.
Figure 8: Saskatchewan fourth tier royalty curve at constant production (25 bbl/day)
Source: Saskatchewan, 2016b.
Average Saskatchewan heavy oil well-head price ($/bbl)
Crow
n ro
yalt
y ra
te (p
erce
nt)
0
2
4
6
8
10
12
14
16
18
20
0 10 20 30 40 50 60 70 80 90 100 110 120 130 140 150 160 170 180 190 200
Cro
wn
Roy
alty
Rat
e (%
)
Average Saskatchewan Heavy Oil Well-Head Price ($/bbl)
Saskatchewan Fourth Tier Royalty Curve at Constant Production (25 bbl/day)

15 COSTS OF PIPELINE OBSTRUCTIONISM
www.fraserinstitute.org
oil recovers and horizontal drilling and multiple-stage fracking techniques are applied to tight reservoirs. After 2030, production of light/medium oil is expected to decline as reservoirs become depleted. In addition, the Board expects Saskatchewan conventional heavy crude oil production to decline throughout the projection period (NEB, 2016c).
Table 2 provides a scenario of the royalty revenues that would be lost if the WTI price were US$61/bbl instead of US$68/bbl. Those reference prices were chosen because they were used for an Alberta Government projection of royalty revenues for the 2016–17 and 2017–18 target years that provided estimates of bitumen royalties at those prices (Alberta, 2015a). Because the production estimates for the two fiscal years were different, in order to estimate the impact on bitumen royalties from the change in price alone production was held constant at the 2016–17 volume.18, 19
The bottom line in table 2 indicates that at the lower (US$ 61/bbl) price, roy-alty revenues of approximately CA$1.2 billion would be lost compared with the higher price. This provides a rough indication of royalty revenues lost from not being able to achieve world market prices for Western Canadian oil production.
18. Given that the bitumen royalty rate varies depending on whether or not the capital expenditures have been recouped, and which rate schedule the owner of a paid-out project chooses to apply, estimation of bitumen royalties at different prices using a more rigorous approach would not only have required a con-siderable amount of detailed information but would also have been subject to a number of assumptions.19. The change in royalty revenue from Alberta conventional crude oil production was based on infor-mation pertaining to the sensitivity of the US dollar price of WTI/barrel provided by Alberta Finance via direct telephone and email communication. The Saskatchewan royalty revenue change estimate was derived from information provided by the Ministries of Finance and Economy.
Production category $ millions / year
Alberta raw bitumen 1 814
Alberta conventional crude oil 2 287
Saskatchewan crude oil 3 119
Total impact 1,220
Table 2: Lost Alberta and Saskatchewan royalties (if US$ WTI price were $61/bbl instead of $68/bbl)
1. Estimated assuming production of 2,646,000 barrels per day as per the 2016/17 target in the 2015/16 Fiscal Plan (Alberta Finance, 2015) and applying the implied average royalty per unit of bitumen production in the 2017/18 target (for which the WTI price was assumed to be US$68/bbl).2. Based on information re royalty revenue sensitivity per US$1/bbl change in the WTI oil price provided by the Alberta government (Alberta, 2016c).3. At estimated 2015/16 production rate (173.4 million barrels; Saskatchewan Ministry of Finance) and assuming CA$1.00 = US$0.80.

16 COSTS OF PIPELINE OBSTRUCTIONISM
www.fraserinstitute.org
Canadian Crude Oil Production Outlook: Implications for Pipeline Infrastructure
What the Forecasts Suggest
More Western Canadian crude oil is able to reach United States coastal des-tinations now that TransCanada and Enbridge have some capacity to ship oil from Cushing OK to Texas refineries. Also, the capacity to transport oil from Alberta and Saskatchewan to refineries in the mid-Atlantic region of the US by rail, rail/barge, and rail/tanker linkages has been increased. Some western Canadian oil has also been transported to the Irving Oil refinery in Saint John, New Brunswick despite the absence of a pipeline connection. But the capacity to reach coastal refineries is insufficient to solve the pricing dilemma that western Canadian oil producers face due to heavy dependence on refiners in the US mid-continent region. Moreover, the existing crude oil pipeline system will not have enough take-away capacity if the increase in Western Canadian crude oil production that has been projected to occur during the next 10 to 20 years actually occurs.
When the Fraser Institute’s previous (2013) paper on the subject of oil trans-portation bottlenecks was drafted, the most recent long-term Canadian oil production forecast available from the National Energy Board suggested that production would increase from about 3 million barrels per day (MMbpd) in 2010 to as much as 5.7 MMbpd by 2030, with most of the 2.7 MMbpd increase occurring in Alberta (NEB, 2011). The Board’s most recent long-term projection, released in January 2016, points to an increase in total Canadian crude oil production of 2.0 MMbpd during the period from 2015 to 2040, a smaller increment than previously, and spread over 25 years rather than 20.20 All of the increase except for small growth in condensate production in the WCSB comes from oil sands bitumen production, where 78 percent of the growth is from in situ facilities and 22 percent from mining. Production of conventional light and heavy crude oil in the WCSB and Eastern Canadian production is expected to decline from 2015 to 2040 (NEB, 2016b).
The Canadian Association of Petroleum Producers’ (CAPP) crude oil supply forecasts have also been lowered. The CAPP projection available when the 2013 bottlenecks assessment paper was drafted indicated an increase in Western Canadian crude oil supplying trunk pipelines and markets of 4.6 MMbpd during the 2012 to 2030 period, of which all but about 5 percent was attributed to an increase in production of oil-sands bitumen and related
20. The 20-year (2015 to 2035) increment in the most recent forecast is 1.9 MMbpd, or 30 percent less than the 2011 projection.

17 COSTS OF PIPELINE OBSTRUCTIONISM
www.fraserinstitute.org
products (CAPP, 2013). The June 2015 CAPP forecast has Western Canadian oil supply reaching 6.1 MMbpd in 2030, an increase of only 2.6 MMbpd from 2013 (CAPP, 2015). The less robust projection than in the 2013 and 2014 forecasts is attributed to slower growth of heavy crude oil production from the oil sands because of reduced capital spending driven by the sharp decline in oil prices witnessed during the first half of 2015.
A Western Canada crude oil supply forecast prepared by IHS Inc. on behalf of TransCanada Pipelines Limited’s amended Energy East Pipeline application, filed with the National Energy Board in December 2015, shows supplies to trunk pipelines and markets increasing from 3.7 MMbpd in 2014 to 5.9 MMbpd in 2030 (IHS, 2015). That 2.2 MMbpd increase in Western Canada crude oil supply deliverability is very similar to the increase of 2.3 MMbpd in the 2015 CAPP forecast with regard to the same sixteen-year period.21 When both forecasts were being prepared (during the second quarter of 2015), oil prices had tumbled from the vicinity of US$100/bbl in June 2014 to the US$40–60/bbl range—with WTI averaging US$58/bbl and WCS, US$46/bbl.
Implications
IHS Inc. assumed that crude oil prices had bottomed out and based its projections on the assumption that world oil prices would recover to the vicinity of US$80/bbl by 2020.22 CAPP does not forecast oil prices but rather depends on information received from the producers with regard to project investment, capacity and start-up when undertaking its forecast. Given the continued decline in oil prices to the vicinity of US$25/bbl in January 2016, it is reasonable to expect that such unrealistic oil price projections as IHS was touting a year ago will be modified, and that western crude oil produc-tion forecasts will be adjusted downward accordingly.
Furthermore, given the dramatic change in anticipated cash flows as a con-sequence of the further drop in oil prices that has occurred since the spring of 2015, it can be expected that oil producers will be less optimistic with regard to both project expansions and greenfield projects than they were in 2015, and that this will be reflected in CAPP’s 2016 forecast. It is likely that more realistic forecasts will reflect further reductions in the outlook for oil sands production facility investment and output during the next 15 to 20 years. This suggests that new pipeline transportation infrastructure requirements will be adjusted downward as well.
21. Assuming that the two forecasts were prepared independently might add to their credibility. However, there is no reason to assume that that was the case.22. Such a rapid recovery in oil prices appears unrealistic in light of increasing oil production capacity as a consequence of technological advancements (as with horizontal drilling and multi-stage fracking) and the lifting of sanctions on Iranian oil production.

18 COSTS OF PIPELINE OBSTRUCTIONISM
www.fraserinstitute.org
Alberta’s Climate Change Plan: Implications for Oil Sands Investment, Production, and Additions to Takeaway Capacity
In the most recent “energy future” scenario unveiled by the National Energy Board, virtually all of the approximate 2.04 MMbpd increase in Western Canadian oil production during 2015 to 2035 comes from Alberta oil sands bitumen production, with about 76.5 percent from in situ (i.e. “in place”) production as opposed to surface mining operations. For many years, most of the oil sands bitumen production came from mining production. However, output from in situ operations overtook bitumen production from mining in 2014. Looking forward, the National Energy Board anticipates that the in situ share of total output will continue to increase and reach 65 percent by 2035.
The increasing share of output from relatively smaller in situ projects than from typically larger open pit bitumen mining operations that are often tied to onsite upgraders is quite significant in light of the United Nations Panel on Climate Change’s (UNPCC) emphasis on the need for placing limits on, and reducing, greenhouse gas (GHG) emissions such as CO2 (UNPCC, 2014). The reason for this is that GHG emissions per unit of output are about 60 percent greater in the case of in situ bitumen production, where natural gas combustion is relied on to generate steam for injection, than in bitumen mining.23 Consequently, in situ production’s increasing share of oil sands activity is attracting the attention of environmental advocates. On the other hand, there is less concern with prospective growth of GHG emissions from new bitumen upgrading facilities that the NEB suggests will be few and far between.24
In November 2015, the Alberta Government announced that it was placing a limit of 100 Megatonnes (Mt) per year on GHG emissions from oil sands production, including both bitumen recovery and upgrading operations. This begs the question as to when the 100 Mt limit is likely to constrain future oil sands investment and how the need for new production facilities and infrastructure, especially pipelines, could be affected.
23. Based on average CO2 emissions per unit of bitumen produced during 2011, 2012, and 2013, as pub-lished by Environment Canada reports on greenhouse gas sources and sinks in Canada (2013, 2014).24. According to the National Energy Board, investment in upgraders is unlikely because the economics is regarded as problematic. For example, the economic threshold for such projects is indicated by the Board to require a WTI oil price in the $US80–100 per barrel range. This compares with a threshold of $US50–60 per barrel with regard to investment in proven technology for in situ bitumen recovery facilities (NEB, 2016b).

19 COSTS OF PIPELINE OBSTRUCTIONISM
www.fraserinstitute.org
The difference in global temperature in 2100 from producing, say, 2 million barrels of bitumen per day from in situ facilities compared with open pit mining operations may be insignificant according to temperature projec-tions with models such as the US Environmental Protection Agency’s cli-mate model. But given that Alberta has placed a ceiling on oil sands GHG emissions, and that in situ operations are recognized as the major emitter of the two kinds of production, in situ production will inevitably be the primary focus of efforts to lower emissions from the oil sands.
In order to determine how soon the Alberta Government’s 100 Mt limit could constrain oil sands bitumen production and how investment in pro-duction facilities and transportation infrastructure could be affected, GHG emissions from oil sands operations were projected from 2013 to 2035. For this purpose, actual annual production data up to 2014 were used along with the NEB’s Reference Case projections for bitumen mining and in situ production for the years 2015 to 2035. Environment Canada data with regard to GHG emissions per unit of each type of bitumen production, and for upgraders, during the 2011–2013 period were also used (Environment Canada, 2013, 2014). For both bitumen mining and in situ operations, 3-year average annual GHG emissions rates (MT CO2 per unit of production) during 2011–2013 were applied to estimated production volumes in each of the ensuing years.25
GHG emissions from upgraders were held constant at the 2013 rate of 18 Mt of CO2. This reflects the fact that the Northwest Upgrader currently under construction near Edmonton will include facilities that will allow the capture of CO2 for transport to conventional oil wells deemed or proven appropriate for enhanced oil recovery technologies utilizing CO2 flood technology. It also assumes that few, if any, additional new upgraders are likely to be built during the indicated 20-year period, and reflects the fact that the Alberta Government’s plan to legislate a limit of 100 Mt on oil sands emissions in any year is reported to contain special “provisions for cogeneration and new upgrading capacity” (Alberta, 2015b).
Figure 9 illustrates that, on the basis of the assumptions outlined above, the 100 Mt limit on oil sands GHG emissions would be reached in 2025. The main reason why the GHG emissions limit is reached in as little as 10 years is a 22.8 Mt increase (65 percent) in emissions from in situ bitumen recovery operations. At that point, total oil sands production is projected by the National Energy Board to have increased from 2.5 MMbpd in 2015
25. Keeping the GHG emissions rate constant, and thereby not building in an allowance for techno-logical improvement, provides a benchmark against which to assess the impacts of lower rates triggered by the 100 Mt limit on oil sands GHG emissions.

20 COSTS OF PIPELINE OBSTRUCTIONISM
www.fraserinstitute.org
to 3.8 MMbpd—an increase of 1.5 MMbpd.26 This compares with the NEB’s 2013 projection of combined oil sands mined and in situ production of 4.2 MMbpd by 2025 (NEB, 2013).
Beyond 2025, investment in new oil sands production facilities may be limited because of the cost of meeting GHG emissions limits and other new environmental requirements, and oil supply investment alternatives. Consequently, further oil sands production growth—to 4.6 MMbpd in 2035 in the Board’s most recent “Energy Future” projection (NEB, 2016c; com-pared with 5.0 MMbpd in the 2013 version)—is by no means assured. In turn, this raises uncertainties regarding the extent of additional pipeline infrastructure requirements.
If, as the NEB’s Reference Case suggests, Western Canadian conventional oil production will have peaked by 2025 and bitumen production growth is constrained at that point by the 100 Mt limit on annual GHG emissions, the required increase in takeaway capacity would be not be more than about 1.9 MMbpd.27 This suggests that, unless significant progress is made in lowering GHG emission rates, much of the additional crude oil pipeline capacity that
26. The National Energy Board did not attempt to quantify how Alberta’s GHG emissions ceiling would impact investment in new or expanded oil sands bitumen production facilities and production because the Board’s “Energy Future” projections are based on existing laws and regulations and do not take proposed changes into consideration. However, the Board did indicate that possible changes in environmental regulations could reduce investment because of the uncertainties involved.27. Considering the projected 1.5 MMbpd increase in production to that point and assuming average capacity utilization of new pipeline infrastructure in the vicinity of 80 percent.
Figure 9: Oil sands GHG emissions
0
20
40
60
80
100
120
2035203220292026202320202017201420112008
Mt C
O 2
In situ bitumen
Mined bitumen
Upgrading
Sources: National Energy Board, 2016b; Environment Canada, 2013; Environment Canada, 2014; author calculations.

21 COSTS OF PIPELINE OBSTRUCTIONISM
www.fraserinstitute.org
is currently under consideration or review may not be required. Clearly, reduced pipeline investment and the substantial negative impacts that this would have on employment, labour income, and GDP growth would be the consequence of the cap on emissions on oil sands investment and produc-tion levels, not oil market conditions.

22 COSTS OF PIPELINE OBSTRUCTIONISM
www.fraserinstitute.org
Obstacles Faced by Major Pipeline Projects
This section outlines the range and types of challenges being faced by pro-ponents of the three major Canadian crude oil pipeline projects that would transport primarily conventional heavy oil and raw and upgraded oil sands bitumen from western Canadian oil to new markets. The proposed projects are important because the pipelines would help to eliminate the dilemma confronting producers almost totally dependent on US oil refinery markets—markets that are benefiting from growing supplies of lighter domestic crudes.
TransCanada’s Energy East Pipeline
Initially, TransCanada faced opposition from industrial users and natural gas distribution companies who feared that the plan to convert underuti-lised sections of the main natural gas west-to-east pipeline would result in gas supply risk because of reduced transportation flexibility (McCarthy, 2014). India-based IFFCO Canada Enterprises Ltd. indicated that it would cancel plans to build a $1.6 billion nitrogen plant at Becancour on the St. Lawrence River if it were unable to secure gas supplies at reasonable prices as the result of TransCanada’s plan to convert sections of its west-to-east natural gas Mainline to transport oil. Attention was focused on the part of the Mainline that runs from North Bay to Ottawa. The Mainline is underuti-lized west of North Bay yet is an important conduit for Ontario and Quebec customers to the east. And the pipeline that carries gas from the US, which ties into the Mainline via southwest Ontario, at times is at full capacity.
In August 2015, TransCanada indicated that it had reached an agreement with Gas Metro Limited partnership, Enbridge Gas Distribution Inc., and Union Gas Limited that addresses the gas supply concerns that they had raised and ensures that there will be sufficient gas transmission capacity in place to meet the requirements of consumers. To this end, TransCanada also indicated that it will size the gas mainline to meet all firm transportation commitments, including transmission obligations arising from open sea-sons for new capacity to be held during 2016 and 2017, plus approximately 50 million cubic feet per day of additional capacity (TransCanada, 2015).
Numerous municipalities, such as Laval and Oka in Quebec, have indicated that they are opposed to the Energy East Pipeline because of the potential risk to lakes, rivers, and water supplies from possible pipeline leaks (CBC, 2015). The Conservation Council of New Brunswick opposes construction of Energy East because of the risk of spills from tankers shipping crude oil and refined oil product from the proposed Saint John, New Brunswick oil

23 COSTS OF PIPELINE OBSTRUCTIONISM
www.fraserinstitute.org
terminal and the Irving Oil refinery. The Council claims that oil spills in the Bay of Fundy would threaten the livelihood of some 5,000 fishermen in the region and the risk of spills along with increased oil tanker traffic in the Bay place many species of marine life, including whale at great risk (Abbott, 2015).
Other groups lobbying against the Energy East project, including the Council of Canadians, Greenpeace Canada, Environmental Defence, and the Association Québécoise de Lutte Contre la Pollution Atmosphérique (AQLPA), are opposed to any increase in the capacity to transport oil from Western Canada. This, they argue, would facilitate growth in crude oil pro-duction from the oil sands, thereby increasing greenhouse gas emissions and making it very difficult for Canada to achieve its global warming related environmental objectives (Council of Canadians, 2015).
In December 2015, the Assembly of First Nations of Quebec and Labrador (AFNQL), the Assembly of Manitoba Chiefs (AMC), and the Union of British Columbia Indian Chiefs (UBCIC) sent an open letter to the Prime Minister asking that the allegedly “broken review process for tar sands pipelines”28 be fixed, and that National Energy Board reviews currently in progress, including the Kinder Morgan Trans Mountain expansion, Enbridge Line 3 replacement, and TransCanada Energy East pipeline proposals, be halted until the process has been fixed: The letter states that the current system is flawed because it has:
... recklessly compressed pipeline reviews; sidelined critics; excluded essential considerations such as climate change; and violated Indigenous rights and sovereignty. Meanwhile, the National Energy Board (NEB) is no longer an indepen-dent arbiter in such reviews. It has become a politicized and industry-captured ‘rubber stamper’ that pays only lip service to the respect for the positions and rights of First Nations. All of these changes unravel opportunities for First Nations who are directly impacted by regulators like the NEB to offer them and industry vitally important information about the lands and resources. The current restrictions further damage the relationship with First Nations and undermine the public trust, legitimacy and openness of the federal environmental assessment process.
28. First Nations most likely would not be making this argument if they were in agreement with the National Energy Board’s decision. The existing review process is not flawless, but if it were, parties unhappy with the result would still be prone to blame the system rather than the rational for the decision.

24 COSTS OF PIPELINE OBSTRUCTIONISM
www.fraserinstitute.org
Further, the current review and assessment process for the above pipelines has violated:
• The Crown’s Constitutional consultation and accommoda-tion duties.
• The Aboriginal Title, Aboriginal Rights and Treaty Rights of First Nations, which are all protected by the Constitution of Canada as well as the Royal Proclamation.
• The Principle of Free, Prior and Informed Consent enshrined in the United Nations Declaration on the Rights of Indigenous Peoples (which we were very happy to hear that Canada will finally implement).
• The bans instituted by a number of First Nations, including under their inherent authority and jurisdiction over their territory pursuant to their own Indigenous laws and cus-toms, refusing passage to the pipelines as a result of the unacceptable risks and impacts that they present for such First Nations.
(AFNQL, AMC, and UBCIC, 2015)
The First Nations signatories go on to argue that the NEB review process fails to provide adequate funding for First Nations participants29 and that the NEB “has demonstrated a clear bias in favour of pipelines by almost never rejecting a pipeline project30 and … shamefully giving conditional approval to the Northern Gateway project despite it being firmly opposed by First Nations across B.C.
Finally, and perhaps most importantly … the NEB continues to exclude from its analysis one of the biggest impacts of the Tar Sands pipelines: their heavy contribution to climate change as a result of the expanded Tar Sands pro-duction that the pipelines will allow. First Nations were never consulted on the original decisions to exclude such a critical issue from the NEB reviews31 and the NEB’s continued refusal to reconsider such exclusion makes their reviews completely devoid of legitimacy. … Full consideration of climate change impacts has to be a major focus of any new review and assessment process for the pipelines.”
29. This suggests that if “adequate” funds had been made available the First Nations would have been more inclined to accept the decisions.30. This completely ignores the fact that companies are unlikely to put forward proposals for major new pipeline projects if such proposals are likely to be rejected31. This ignores the fact that the National Energy Board’s mandate does not require the Board to assess the affect of proposed projects on climate change. Essentially, the First Nations are calling for a change in that mandate and for the proposal to be assessed according to new rules.

25 COSTS OF PIPELINE OBSTRUCTIONISM
www.fraserinstitute.org
In closing, the signatories “call for the establishment of a new pipeline review and assessment process, to be developed and implemented in col-laboration with First Nations, that will enable a thorough and objective environmental assessment of these pipelines that respects our rights under the Constitution of Canada as well as under the United Nations Declaration on the Rights of Indigenous Peoples.”
The Enbridge Northern Gateway Pipeline
The Northern Gateway project is opposed by various First Nations orga-nizations within BC because of concerns in relation to environmental risk associated with potential pipeline leaks and ruptures, which could result in considerable damage to water and land resources and significantly constrain the livelihood of people in affected areas. Oil spills in coastal waters related to loading of tankers and tanker leakage and mishaps are also of great concern. As noted in the previous section, various First Nations also have serious objections to the current review process pertaining to oil pipeline applications, most importantly the fact that the process doesn’t consider the environmental impacts of upstream (e.g., oil production) and downstream consequences from the operation of proposed oil pipelines.32
In July 2012, the BC Government laid out five conditions, which must be met before the province can consider the construction and operation of new or expanded oil pipelines (British Columbia, 2012):
1. Successful completion of the environmental review process. In the case of the Enbridge Northern Gateway project, this would mean a recom-mendation by the National Energy Board Joint Review Panel that the project proceed;
2. Development of world-leading33 marine oil spill response, prevention, and recovery systems for BC’s coastline and ocean to manage and miti-gate the risks and costs of heavy oil pipelines and shipments;
3. Adoption of world-leading practices for land oil spill prevention, response, and recovery systems to manage and mitigate the risks and costs of heavy oil pipelines;
32. This appears to be all encompassing. If they could, how far downstream from crude oil production would First Nations’ require assessment of “downstream” consequences? Would this include all conse-quences from the use of petroleum products, including, for example, diesel fuel derived from oil sands bitumen that is used in farm tractors?33. Here and in the following paragraph the Province of BC uses the adjective “world-leading”. It is unclear precisely what this is means. Possibly what is intended is to for a system, technique, or practice, to be innovative and/or one of the first applications of its kind.

26 COSTS OF PIPELINE OBSTRUCTIONISM
www.fraserinstitute.org
4. That legal requirements regarding Aboriginal and treaty rights be addressed, and First Nations provided with the opportunities, informa-tion, and resources necessary to participate in and benefit from a heavy-oil project;
5. That BC receives a fair share of the fiscal and economic benefits of a proposed heavy oil project that reflects the level, degree, and nature of the risk borne by the province, the environment and taxpayers.34
The arguments put forward in the December 2015 letter from First Nations groups to the Prime Minister—with regard to the serious reviews in the pipeline review process and alternative fixes—apply to this project as well to the others.
On January 13, 2016, the Supreme Court of British Columbia ruled in a Decision that, when the BC Environmental Assessment Office (BCEAO) entered into an “equivalency” agreement with the National Energy Board in June 2010 according to which an environmental assessment undertaken by the NEB in relation to a “transmission pipeline” and certain other projects subject to review under the BC Environmental Assessment Act would be equivalent to an assessment carried out by the BCEAO, the BCEAO failed to fulfill the province’s obligation to consult with First Nations (NEB and BCEAO, 2010; BC Supreme Court 2016). Essentially, the Court indicated that the environmental certificate issued by the NEB with regard to the Enbridge Northern Gateway project is invalid in so far as British Columbia is concerned, regardless of any conditions that may have been attached. This appears to be a major setback for the Northern Gateway project, as it implies that the project proposal may have to be examined in accordance with the British Columbia Environmental Assessment Act in order not to abrogate the province’s obligation to consult with First Nations pertaining to the project.35
Kinder Morgan Trans Mountain Pipeline Expansion
Like the Northern Gateway project, the Trans Mountain Expansion project is opposed by various First Nations organizations because of concerns about environmental risks associated with potential pipeline leaks and ruptures. Oil spills in coastal waters related to loading of tankers and tanker leakage and mishaps are also of great concern. Also, as noted above, various First Nations also have serious objections to the review process pertaining to oil
34. How BC proposes to measure the “level, degree, and nature of the risk” is not specified.35. While the Decision is based on the Supreme Court’s interpretation of the law, from a political per-spective it appears to support the provincial government’s apparent desire to prevent the Northern Gateway project from proceeding unless certain conditions are met or, at least, delaying progress.

27 COSTS OF PIPELINE OBSTRUCTIONISM
www.fraserinstitute.org
pipeline applications, most importantly the fact that the process doesn’t consider the environmental impacts of upstream (e.g., oil production) and downstream consequences from the operation of proposed oil pipelines.36
On January 11, 2016, the Province of British Columbia reaffirmed that the Kinder Morgan Trans Mountain Expansion project must meet five require-ments for any new heavy oil pipeline to receive provincial support. Two of those conditions pertain to oil spill response, prevention, and recovery sys-tems with regard to BC coastline, ocean, and onshore situations. Because the company had not provided sufficient information to allow the province to determine whether the company would use a “world-leading spills regime,” the province indicated that it is “unable to support the project at this time, based on the evidence submitted” (British Columbia, 2016).
The January 13, 2016 decision of the BC Supreme Court with regard to British Columbia’s obligation to consult with First Nations affects the regulatory review process for the Trans Mountain Expansion as well as the Enbridge Northern Gateway project. Because the Trans Mountain project regula-tory review process is still underway, we believe that the NEB and the BC Government should review the implications of their 2010 “equivalency” agree-ment in light of the January 13, 2016 Decision, and make appropriate adjust-ments to their approach to the environmental assessment review process.
36. As noted earlier, there is no apparent limit on the scope of the downstream consequences that First Nations insist must be assessed.

28 COSTS OF PIPELINE OBSTRUCTIONISM
www.fraserinstitute.org
Changes to the Pipeline Project Review Process
On January 27, 2016, Natural Resources Canada announced interim changes to the environmental assessment process in relation to major projects cur-rently under review by the National Energy Board. The changes are designed to address certain criticisms of the review process, until the present envi-ronmental assessment review process can be revamped as the result of extensive public consultation. The interim measures embrace the following principles that are intended to indicate how the federal government will be guided in making decisions (Natural Resources Canada, 2016a):
1. No project proponent will be asked to return to the starting line—project reviews will continue within the current legislative framework and in accordance with treaty provisions, under the auspices of relevant respon-sible authorities and Northern regulatory boards;
2. Decisions will be based on science, traditional knowledge of Indigenous peoples, and other relevant evidence;
3. The views of the public and affected communities will be sought and considered;
4. Indigenous peoples will be meaningfully consulted, and where appropri-ate, impacts on their rights and interests will be accommodated; and
5. Direct and upstream greenhouse gas emissions linked to the projects under review will be assessed.
The new rules require that First Nations’ perspectives be fully understood and considered and that impacts on upstream greenhouse gas emissions be assessed.
However, some clarification is required. For example, who decides or defines what is meant by “traditional knowledge”? If this is to be determined by the “indigenous peoples,” it appears to be yet another opportunity to provide support to those peoples. But just who “indigenous peoples” are is unclear. And what is meant by “meaningfully” in the context of consultation? Further, who is to decide when it is “appropriate” to accommodate impacts on rights and interests, and when it isn’t? Finally, regarding greenhouse gas emissions, precisely what is to be assessed is not specified. Is it the volume of emissions and/or temperature effects, or something else?
With regard to the Trans Mountain Expansion Project and the Energy East Pipeline, the Government has committed to undertake deeper consultations with indigenous peoples and to provide funding to support participation in
29 COSTS OF PIPELINE OBSTRUCTIONISM
www.fraserinstitute.org
these consultations. It has also committed to “assess” in some yet unspeci-fied manner and extent the upstream greenhouse gas emissions associated with the projects, and to make the findings public. Further, in the case of the Trans Mountain Expansion Project, the Government is to appoint a Ministerial Representative to engage communities, including indigenous communities potentially affected by the project, to seek their views, and to report back to the Minister of Natural Resources. Regarding the Energy East Pipeline, the Government will help to facilitate expanded public interest37 into the National Energy Board Review process, and the Minister of Natural Resources will recommend the appointment of three interim members to the Board.
Because the interim measures mean that additional time will be required to compete the review process, in the case of the Trans Mountain project the Government intends to extend the legislated time limit for the Government’s decision from August 2016 to December 2016. With regard to the Energy East Pipeline, the Government intends to seek an extension to the legislated review time limit of six months (a total of 21 months), and a three-month extension (to 6 months) to the time required for the Government to make a decision once the NEB’s report has been tabled. That is, the Government is seeking an extension to the review process of a total of nine months in the Energy East Pipeline case (Natural Resources Canada, 2016b).
37. It is unclear how the Government plans to achieve greater public interest and how the extent of such interest is to be assessed or measured.

30 COSTS OF PIPELINE OBSTRUCTIONISM
www.fraserinstitute.org
Recommendations for Expediting Pipeline Projects of Strategic and National Interest
In view of the fact that windows of opportunity for access to new markets via new or expanded pipelines are generally time sensitive, and given that delays can be very costly for project investors, shareholders, and consumers alike, shortening the length of the regulatory review process should be made a priority. Governments must be made much more aware of the potentially enormous economic and commercial consequences of extending regulatory review and decision-making periods. More important, instead of length-ening such times, as the federal government recently did in relation to the Energy East Pipeline and Trans Mountain Pipeline Expansion projects, they need to streamline the project review and decision-making processes with a view to shortening the times involved.
In this regard, we propose that the provincial and federal governments estab-lish standing committees on regulatory streamlining with clearly defined goals. The primary objective would be to determine means to achieve spec-ified reductions in times allocated for environmental review assessments, project application reviews, regulatory decisions, and permitting. This may involve specifying particular regulators to take the lead in particular cases, depending on project scope and location, such that applicants have to file with only a single entity (i.e., one-stop shopping). If it is found that the bud-gets for such undertakings need to be increased in order to achieve mean-ingful time reductions, the governments must not balk at the extra cost, because the economic benefits from enabling pipeline projects determined to be in the public interest to proceed sooner will surely offset any additional environmental and regulatory review costs.38
Obligations on the part of project proponents and governments to consult with First Nations should be initiated well before project applications are filed for review by the regulators. Provincial and municipal governments that would be affected, as well as the federal government, need to become involved in such consultations in the very early stage. It is important that they actively participate in discussions with First Nations about the environ-mental, social, and economic aspects of projects being put forward by devel-opers in order to achieve agreements in principle sooner rather than later. The various government organizations must also allocate more resources (both personnel and money) to the consultation process, and coordinate their respective roles, both before and during the project review phase. The
38. As an alternative to paying the incremental cost of expedited review processes, governments may wish to consider having project applicants who seek speeded-up processes pay for the extra cost at their option.

31 COSTS OF PIPELINE OBSTRUCTIONISM
www.fraserinstitute.org
overriding objective must be to shorten both the consultation and the regu-latory review processes and to prevent the latter from becoming protracted and unduly expensive.39
Frequent changes in laws and regulations applicable to major projects are costly and disconcerting to proponents, and increase uncertainty. Such actions should be avoided because they may cause investors to rethink their plans with regard to the jurisdiction in question and turn their attention to opportunities in other provinces, states, or countries. This is evidenced by the marked increase in negative sentiment with regard to upstream petro-leum investment in Alberta when the provincial government has intro-duced higher royalties, as in 2008, or launched a royalty review, as in 2015 (Angevine et al., 2009; Green and Jackson, 2015).
The federal government has an important role to play in ensuring that projects that are clearly in the national interest are approved as quickly as possible, subject to whatever special terms and conditions may be deemed appropriate by review panels and the government itself. If the legislated reg-ulatory review process with regard to a particular project becomes bogged down and unduly delayed, the government may need to assume a leadership role. This could require working with stakeholders to resolve impasses, or introducing special legislation.
39. There is the risk that earlier consultation could mobilize ideological opponents sooner than other-wise. But this would bring such opponents to the attention of the project proponents earlier in the process and allow them more time to address and mitigate opposing arguments.

32 COSTS OF PIPELINE OBSTRUCTIONISM
www.fraserinstitute.org
Conclusion
Western Canadian conventional heavy crude oil and oil sands bitumen producers continue to suffer from severe price discounting in US markets relative to the WTI oil price. Two projects that would transport oil from Alberta to ports that would provide access to alternative markets and prices that are likely to be higher, the Energy East Pipeline and the Trans Mountain Pipeline Expansion, are currently under review by the National Energy Board, and the Board’s recommendations will be subject to scrutiny by the federal government. The Northern Gateway Project has been approved but, because of the long list of onerous conditions laid down by the regulator and strong opposition from environmentalists and First Nation’s groups, the new pipelines that would transport crude oil to the Pacific Coast for export to Asia and return diluent supplies to Edmonton may not be put in place—at least for many years. Alberta and Saskatchewan governments will continue to lose considerable oil royalty revenues if access to overseas markets and higher prices are not attained.
Because oil production royalties in Alberta and Saskatchewan are oil-price-sensitive, an increase in average prices resulting from access to new markets could give a considerable lift to royalties from oil production. Of course, royalty revenues have suffered from the severe drop in crude oil prices that began in late 2014. In Alberta, provincial government rev-enues from oil sands bitumen production were indicated in the October 2016 budget as likely to drop to as low as $1.5 billion in fiscal 2015–16 from $5.0 billion in the preceding year, despite an estimated 6 percent increase in production. Royalties from Alberta’s conventional oil production were also estimated to fall considerably. Similarly, a Saskatchewan Government budget update indicated that oil royalty revenue in fiscal 2015–16 would be 38.5 percent less than projected earlier. But higher prices, whether from oil price recovery or from access to new markets, would increase both govern-ments’ royalty revenues considerably.
Our analysis (table 2) suggests that annual royalty revenues in Alberta and Saskatchewan would decrease by approximately CA$1.2 billion as a conse-quence of a decrease in the WTI crude oil price of US$7/bbl. About two-thirds of the change would result from lower royalty revenues from Alberta oil sands bitumen production, and about 23.5 percent from reduced revenues from royalties on Alberta conventional crude oil production. Approximately 10 percent of the change would come from the effect on royalty revenues of oil production in Saskatchewan. Depending on the price difference that one assumes, this provides a rough indication of the extent of royalty revenues that are being lost each year from not being able to achieve higher oil prices for Western Canadian oil production.

33 COSTS OF PIPELINE OBSTRUCTIONISM
www.fraserinstitute.org
The oil price tumble has already caused, and is causing, many Western Canadian oil producers to cancel, delay, or reduce investment in previously planned oil sands production facilities. With oil production growing more slowly, the need for additional oil pipeline transportation takeaway capacity from Western Canada during the next 20 years will be less than antici-pated only a few years ago. This suggests that some of the new pipelines and expansions that have been proposed could be postponed, downsized, or shelved.
Regarding construction of vital pipeline connections to tidewater, the expressions of interest that would-be shippers have provided to the project proponents (as evidenced in their National Energy Board applications) sug-gest that the Northern Gateway Pipeline, the Energy East Pipeline, and the Trans Mountain Pipeline Expansion projects are commercially viable.40 If, as a consequence of less robust production growth, the substantial increase in takeaway capacity that had been anticipated is not required, it would appear to be in the producers’ best interest (and the national interest) that these projects be implemented, as they would provide access to potentially lucrative alternative export markets and, in the case of Energy East, a stable, Canadian crude oil supply alternative for Quebec and New Brunswick refin-ers heavily dependent on imports from overseas.41 However, which pipelines actually come to fruition and in what order will depend on decisions by the various regulators and governments, and on market conditions as perceived by the proponents when deciding whether or not to proceed.
As the National Energy Board recently pointed out (NEB, 2016), the oil sands are essentially Western Canada’s only remaining source of oil pro-duction growth. While the 100 megatonne annual ceiling imposed on oil sands GHG emissions by the Government of Alberta could put a limit on that growth as early as 2025, it is anticipated that technological advances will reduce GHG emissions from bitumen extraction and upgrading facili-ties sufficiently to allow oil sands production and, therefore, total Western Canadian oil production, to continue to grow well beyond 2025. If this turns out to be the case, new oil pipeline transportation capacity will continue to be required.42
40. Assuming that the projected throughput volumes can be realized.41. Some of the crude oil being imported by the oil refineries in Quebec and New Brunswick has been coming from Saudi Arabia, Angola, Nigeria, and other countries that don’t share Canadian values with regard to labour and employment conditions and standards. Moreover, these countries lack environ-mental protection standards as rigorous as those in place in Canada, and fail to match our national and provincial GHG emissions goals (Cattaneo, 2016). Displacing crude oil imports from such countries with oil produced and transported in Canada would therefore be desirable for non-economic reasons. But from an economic perspective, displacing imported crude oil with domestic supplies can only be attractive if it lowers the cost of feedstock for refineries that have been dependent on imports.42. Unless technological advances pertaining to greenhouse gas emissions make the 100 megatonne GHG emission limit ineffective, thereby triggering successful calls by environmentalists for the gov-ernment to lower the ceiling.

34 COSTS OF PIPELINE OBSTRUCTIONISM
www.fraserinstitute.org
Every effort should be made to expedite the pipeline project review and assessment processes before windows of opportunity for access to new markets are largely pre-empted by competitors. If the legislated regula-tory review process with regard to a particular project for some reason is unduly delayed, the federal government may need to step in to help resolve impasses or even, in the case of projects that are truly in the national inter-est, introduce special legislation to allow a project to proceed.

35 COSTS OF PIPELINE OBSTRUCTIONISM
www.fraserinstitute.org
Appendix: Major Crude Oil Pipeline Projects Underway or Proposed
If the NEB’s 2016 Reference Case oil sands production projection to 2035 is more or less on the mark, which of course assumes that technological improvement will prevent the GHG emissions ceiling from constraining out-put before then, by 2035 bitumen production could be 2 MMbpd greater than in 2015. Assuming an average capacity utilization rate of 80 percent, this suggests that in 19 years the required increase in the pipeline takeaway capacity from Western Canada could be about 2.5 MMbpd. This implies that not all of the 4.1 MMbpd increase in export capacity represented by the pipeline projects summarized in table A1 (page 36) will be required.
Ideally, market realities will determine which projects proceed, and which are delayed or cancelled. Unfortunately, in some cases, non-market barriers may prevent commercially viable projects from going ahead until windows of opportunity to access potentially lucrative new markets have closed. Strategically, given the benefits from gaining access to markets other than in the US mid-continent region, and the risk that oil sales to US refineries could be displaced by rising US crude oil production, pipelines that would provide connections to tidewater refining and export facilities would appear to be of most value.

36 COSTS OF PIPELINE OBSTRUCTIONISM
www.fraserinstitute.org
Project StatusCapacitybbl/day In-service date
Enbridge Line 9 Reversal Approved; service commenced year-end 2015 300,000 Year-end 2015
Enbridge Mainline Line 3 Replacement Application before the NEB. The Line 3 rebuild will restore capacity to 760 from 390 Mbpd.
370,000 End 2017
Enbridge has additional plans to increase its Western Canada mainline capacity to position for growth beyond 2017. Since expansion of the Western Canada Mainline will create a bottleneck at Superior, WI, the company plans to twin Line 61 from Superior to Flanagan. Additional upgrades south of Flanagan will facilitate the flow of primarily heavy crude to the US Gulf Coast oil refinery market.
Line 4: rate optimization (mostly carries heavy crude oil) 50,000 Unclear
Line 2: elimination of North Dakota receipts 150,000 Unclear
Line 65 Gretna, MB to Clearbrook, MN: pump capacity 100,000 Unclear
Line 3, after replacement: additional pumping 100,000 Unclear
TransCanada Energy East Pipeline Amended proposal filed with the NEB in December 2015 removes possibility of shipments from Cacouna on the St. Lawrence River in order to safeguard local beluga whale population.
1,100,000 Was 4Q2020 but delayed at least 9 months by new review process
Trans Mountain Pipeline Expansion Application before the NEB. City of Burnaby and many First Nations groups opposed. NEB plans to make recommendation in 2Q2016.
590,000 Was 3Q2019 but delayed at least 3 months by new review process
Enbridge Northern Gateway Pipeline Govt. Decision Statement following ministerial review of recommendations by the Joint Review Panel established under the NEB Act and the Canadian Environmenal Assessment Act issued June 17, 2014, approved project subject to 209 conditions. Considerable opposition by various First Nations groups.
BC Supreme Court ruling states that BC Govt. failed to meet obligation to consult directly with aboriginal groups.
BC Govt. will not support the project until 5 specific conditions are met. Federal government opposition to coastal oil tanker traffic may be a problem.
On June 30, 2016, the Federal Court of Appeal overturned the federal government’s approval of the Northern Gateway pipeline, citing failures by the federal government to ensure adequate consultation with aboriginal communities that might be affected by the pipeline (CBC, 2016). The NEB has suspended its activities on the file, and its fate is uncertain. Enbridge remains committed to the project.
525,000 4 years from decicions to proceed
TransCanada Keystone XL Pipeline Rejected by President Obama Novermber 2015. TransCanada claiming damages under NAFTA. Application could be resubmitted at a future date.
825,000 Indefinite
Total takeaway capacity that could be added if all projects were to proceed 4,110,000
Table A1: Western Canada crude oil pipeline takeaway capacity increases approved or proposed

37 COSTS OF PIPELINE OBSTRUCTIONISM
www.fraserinstitute.org
References
Abbott, Matthew (2015). Tanker Traffic and Tar Balls: What TransCanada’s Energy East Pipeline Means for the Bay of Fundy and Gulf of Maine. Conservation Council of New Brunswick. <http://www.conservationcouncil.ca/wp-content/uploads/2015/08/Bay-of-Fundy-Report-Eng.pdf>
Alberta, Department of Finance (2015a). 2015–16 Budget and Fiscal Plan: Revenue. Government of Alberta. <http://finance.alberta.ca/publications/budget/budget2015-october/fiscal-plan-revenue.pdf>
Alberta (2015b). Climate Leadership Plan: Capping Oil Sands Emissions. <http://www.alberta.ca/climate-oilsands-emissions.cfm>
Alberta, Department of Energy (2016a). Crude Oil Royalty Rate Calculator. Government of Alberta. <http://www.energy.alberta.ca/Oil/2344.asp>
Alberta, Department of Energy (2016b). Alberta’s Modernized Royalty Framework Overview. Government of Alberta. <http://energy.alberta.ca/Org/pdfs/MRFFactsheet.pdf>
Alberta, Department of Finance (2016c, March 7). Communication with Barry Thompson, Chief Revenue Officer.
Alberta, Treasury Board and Finance (2016d). Energy/Heavy Crude Oil Reference Prices. Government of Alberta. <http://finance.alberta.ca/aboutalberta/osi/aos/Energy.html>
Angevine, Gerry (2013). Transportation Bottlenecks faced by Canada’s Oil Producers. Fraser Institute.
Angevine, Gerry, Matthew Brown, and Miguel Cervantes (2009). Global Petroleum Survey 2009. Fraser Institute. <https://www.fraserinstitute.org/sites/default/files/GlobalPetroleumSurvey2009.pdf>
British Columbia (2012). Conditions for BC Consideration of the Construction or Operation of New or Expanded Heavy Oil Pipelines within its Borders. Government of British Columbia. <http://www.courts.gov.bc.ca/jdb-txt/sc/16/00/2016BCSC0034.htm#_Toc440289205>
All websites retrievable as of June 15, 2016.

38 COSTS OF PIPELINE OBSTRUCTIONISM
www.fraserinstitute.org
British Columbia (2016). Province Reaffirms Trans Mountain Pipeline Must Meet Five Conditions. Media Release. Government of British Columbia. <https://news.gov.bc.ca/releases/2016ENV0001-000020>
BC Supreme Court (2016, January 13). Coastal First Nations vs. British Columbia Environment (Decision). <https://assets.documentcloud.org/documents/2686393/Judge-Koenigsberg-Re-Coastal-First-Nations-v.pdf>
BNN News (2013, November 13). Explaining Oil price Differentials. BNN News. <http://www.bnn.ca/News/2013/11/21/Explaining-oil-price-differentials-0.aspx>
Canadian Association of Petroleum Producers [CAPP] (2013). 2013 CAPP Crude Oil Forecast, Markets and Transportation. CAPP.
Canadian Association of Petroleum Producers [CAPP] (2014). 2014 CAPP Crude Oil Forecast, Markets and Transportation. CAPP. <http://www.capp.ca/media/news-releases/capp-crude-oil-forecast-oil-sands-development-drives-steady-canadian-oil-production-growth-to-2030>
Canadian Association of Petroleum Producers [CAPP] (2015). 2015 CAPP Crude Oil Forecast, Markets and Transportation. CAPP. <http://capp.ca/publications-and-statistics/publications/264673>
Cattaneo, Claudia (2016, February 9). As Oil Sands Punished, Tanker Loads of Cheap Saudi Oil Sail into Canadian Ports Daily. Financial Post. <http://business.financialpost.com/news/energy/as-politicians-gloat-about-climate-leadership-saudi-arabias-oil-is-dumped-in-canada?__lsa=bbb4-52b6>
CBC (2015, September 15). Oka Denounces Energy East Pipeline Plans. CBC. <http://www.huffingtonpost.ca/2015/09/15/oka-denounces-energy-east-pipeline-plans_n_8139746.html>
CBC (2016, June 30). Northern Gateway Pipeline Approval Overturned. CBC. <http://www.cbc.ca/news/canada/british-columbia/northern-gateway-pipeline-federal-court-of-appeal-1.3659561>
Council of Canadians (2015, December 17). Energy East Won’t Get Built. Media Release. Council of Canadians. <http://www.noenergyeastnb.ca/media_release_energy_east_won_t_get_built>
Energy East Pipeline Amended Application (2015). Tolls. <https://docs.neb-one.gc.ca/ll-eng/llisapi.dll/fetch/2000/90464/90552/2432218/2540913/2543426/2887424/A74779-14_Vol_1_Sec_07_Oil__Commercial_-_A4W7I4.pdf?nodeid=2887220&vernum=-2>
39 COSTS OF PIPELINE OBSTRUCTIONISM
www.fraserinstitute.org
Environment Canada (2013). National Inventory Reports on Greenhouse Gas Sources and Sinks in Canada 1990–2012. Government of Canada.
Environment Canada (2014). National Inventory Reports on Greenhouse Gas Sources and Sinks in Canada 1990–2013. Government of Canada.
Green, Kenneth P., and Taylor Jackson (2015). Investor Perceptions of Alberta’s Oil and Gas Policy Changes. Fraser Institute. <https://www.fraserinstitute.org/sites/default/files/investor-perceptions-of-albertas-oil-and-gas-policy-changes-rev.pdf>
Hussain, Yadullah (2015, February 9). Oil-by-Rail Economics Suffers Amid Narrowing Spreads. Financial Post. <http://business.financialpost.com/news/energy/oil-by-rail-economics-suffers-amid-narrowing-spreads?__lsa=3c07-283c>
IHS Inc. (2015, December). IHD Report, Supply and Market Study for the Energy East Project. Energy East Project Application Amendment Volume 1, Appendix Vol. 1-14. <https://docs.neb-one.gc.ca/ll-eng/llisapi.dll/fetch/2000/90464/90552/2432218/2540913/2543426/2995824/2957152/A76909-6_V3_Appendix_3-6_IHS_Report_Supply_and_Market_Sept_2015_-_A5A0K5.pdf?nodeid=2957372&vernum=1>
Assembly of First Nations of Quebec and Labrador [AFNQL], Assembly of Manitoba Chiefs [AMC], and Union of British Columbia Indian Chiefs [UBCIC] (2015, December 17). Open Letter to the Right Honourable Prime Minister Trudeau. Press Release. <http://www.newswire.ca/news-releases/open-letter-to-the-right-honourable-prime-minister-trudeau-562800671.html>
McCarthy, Shawn (2014, October 13). Opposition Builds to Energy East Pipeline Plan. Globe and Mail. <http://www.theglobeandmail.com/report-on-business/industry-news/energy-and-resources/opposition-builds-to-energy-east-pipeline-plan/article21082836/>
National Energy Board [NEB] (2011). Canada’s Energy Future: Energy Supply and Demand Projections to 2035. Government of Canada. <http://www.neb-one.gc.ca/nrg/ntgrtd/ftr/archive/2011/nrgsppldmndprjctn2035-eng.pdf>
National Energy Board [NEB] (2013). Canada’s Energy Future 2013: Energy Supply and Demand Projections to 2013—Appendices. Government of Canada. <http://www.neb-one.gc.ca/nrg/ntgrtd/ftr/2013/ppndcs/ppndcs-eng.html>
National Energy Board [NEB] (2014). Canadian Pipeline Transportation System—Energy Market Assessment. Government of Canada. <https://www.neb-one.gc.ca/nrg/ntgrtd/trnsprttn/2014/2014trnsprttnssssmnt-eng.pdf>

40 COSTS OF PIPELINE OBSTRUCTIONISM
www.fraserinstitute.org
National Energy Board [NEB] (2015). Market Snapshot: Oil Sands Production to Increase, but Effects of Low Prices are Evident. Government of Canada. <https://www.neb-one.gc.ca/nrg/ntgrtd/mrkt/snpsht/2015/12-03lsndsprdctn-eng.html>
National Energy Board [NEB] (2016a). Disposition of Domestic Crude Oil and Imports. Data tables. Government of Canada. <http://www.neb-one.gc.ca/nrg/sttstc/crdlndptrlmprdct/stt/dspstnfdmstccrdlndmprts-eng.html>
National Energy Board [NEB] (2016b). Canadian Crude Oil Exports by Rail. Government of Canada. <http://www.neb-one.gc.ca/nrg/sttstc/crdlndptrlmprdct/stt/cndncrdlxprtsrl-eng.html>
National Energy Board [NEB] (2016c). Canada’s Energy Future. Government of Canada. <http://www.neb-one.gc.ca/nrg/ntgrtd/ftr/2016/2016nrgftr-eng.pdf>
National Energy Board and the BC Environmental Assessment Office [NEB and BCEAO] (2010). Environmental Assessment Equivalency Agreement. <http://www.eao.gov.bc.ca/pdf/NEB-EAO_Equivilancy_Agreement_20100621.pdf>
Natural Resources Canada (2016a). Government of Canada Moves to Restore Trust in Environmental Assessment. Government of Canada. <http://news.gc.ca/web/article-en.do?nid=1029999>
Natural Resources Canada (2016b). Interim Measures for Pipeline Reviews. Backgrounder. Government of Canada. <http://news.gc.ca/web/article-en.do?mthd=tp&crtr.page=1&nid=1029989&crtr.tp1D=930>
Natural Resources Canada (2016c). Selected Oil Prices Monthly: Canadian Light Sweet Oil. Government of Canada. <http://www.nrcan.gc.ca/energy/fuel-prices/crude/17087>
Petroleum Association of Japan (2015). Oil Statistics/Oil Import Price. <http://www.paj.gr.jp/english/statis/>
President Obama (2015, November 6). Statement by the President on the Keystone XL Pipeline. <https://www.whitehouse.gov/the-press-office/2015/11/06/statement-president-keystone-xl-pipeline>
Saskatchewan, Ministry of Finance (2016a). Budget Update, Third Quarter Report. Government of Saskatchewan. <http://www.saskatchewan.ca/government/news-and-media/2016/february/29/third-quarter>

41 COSTS OF PIPELINE OBSTRUCTIONISM
www.fraserinstitute.org
Saskatchewan, Ministry of the Economy (2016b, January 25). Personal communication from Megan McGillivary, Petroleum Royalties Branch.
Saskatchewan, Ministry of the Economy (2016c, February 9). Personal communication from Paul Wagner, Petroleum Royalties Branch.
TransCanada (2015, August 24). TransCanada Reaches Agreement with Eastern LDCs on Energy East and Eastern Mainline Project. Media Release.
United Nations Panel on Climate Change [UNPCC] (2014). Climate Change 2014: Synthesis Report. Summary for Policy Makers. United Nations Panel on Climate Change. <http://www.ipcc.ch/pdf/assessment-report/ar5/syr/AR5_SYR_FINAL_SPM.pdf>
US Energy Information Administration (2016a). US Field Production of Crude Oil. <https://www.eia.gov/dnav/pet/hist/LeafHandler.ashx?n=pet&s=mcrfpus1&f=a>
US Energy Information Administration (2016b). Petroleum & Other Liquids Spot Prices. <https://www.eia.gov/dnav/pet/PET_PRI_SPT_S1_M.htm>
Wikipedia. List of Crude Oil Products. <https://en.wikipedia.org/wiki/List_of_crude_oil_products>

42 COSTS OF PIPELINE OBSTRUCTIONISM
www.fraserinstitute.org
About the Authors
Gerry Angevine is Senior Fellow in the Fraser Institute’s Centre for Energy and Natural Resource Studies. Mr. Angevine has been President of AECL, an energy eco-nomics consulting firm, since 1999, and was a Managing Consultant with Navigant Consulting Ltd. from 2001 to 2004. He was President, CEO, and a Director of the Canadian Energy Research Institute from 1979 to 1999. Prior to that, he worked as an economist at the Canadian Imperial Bank of Commerce and the Bank of Canada. Mr. Angevine has undertaken domestic and internation-al studies in the markets for natural gas (including trade, pipelines, and storage), oil and oil products (including oil sands, refining, and investment), and electricity (including deregulation, water rentals, and renewables). He has advised the Alberta Department of Energy and testified before the National Energy Board as an expert witness. He has A.M. and Ph.D. degrees in Economics from the University of Michigan, an M.A. Economics degree from Dalhousie University, and a B.Comm. from Mount Allison University.
Kenneth P. Green is Senior Director, Natural Resources Studies at the Fraser Institute. He received his doctor-ate in Environmental Science and Engineering from the University of California, Los Angeles (UCLA), an M.S. in Molecular Genetics from San Diego State University, and a B.S. Biology from UCLA. Dr. Green has studied public policy involving risk, regulation, and the environ-ment for more than 16 years at public policy research institutions across North America. He has an extensive publication list of policy studies, magazine articles, opin-ion columns, book and encyclopedia chapters, and two supplementary text books on climate change and energy policy intended for middle-school and collegiate audi-ences respectively. Ken’s writing has appeared in major newspapers across the US and Canada, and he is a regular presence on both Canadian and American radio and tele-vision. Ken has testified before several state legislatures and regulatory agencies, as well as giving testimony to a variety of committees of the US House and Senate.

43 COSTS OF PIPELINE OBSTRUCTIONISM
www.fraserinstitute.org
Acknowledgements
The authors wish to thank the anonymous reviewers for their comments, suggestions, and insights. Any remaining errors or oversights are the sole responsibility of the authors. As the researchers have worked independent-ly, the views and conclusions expressed in this paper do not necessarily reflect those of the Board of Directors of the Fraser Institute, the staff, or supporters.
About the Fraser Institute
Our mis sion is to improve the quality of life for Canadians, their families, and future generations by studying, measuring, and broadly communicating the effects of government policies, entrepreneurship, and choice on their well-being.
Notre mission consiste à améliorer la qualité de vie des Canadiens et des générations à venir en étudiant, en mesurant et en diffusant les effets des politiques gouvernementales, de l’entrepreneuriat et des choix sur leur bien-être.
Peer review —validating the accuracy of our research
The Fraser Institute maintains a rigorous peer review process for its research. New research, major research projects, and substantively modified research conducted by the Fraser Institute are reviewed by experts with a recognized expertise in the topic area being addressed. Whenever possible, external review is a blind process. Updates to previously reviewed research or new editions of previously reviewed research are not reviewed unless the update includes substantive or material changes in the methodology.
The review process is overseen by the directors of the Institute’s research departments who are responsible for ensuring all research published by the Institute passes through the appropriate peer review. If a dispute about the recommendations of the reviewers should arise during the Institute’s peer review process, the Institute has an Editorial Advisory Board, a panel of scholars from Canada, the United States, and Europe to whom it can turn for help in resolving the dispute.
44 COSTS OF PIPELINE OBSTRUCTIONISM
www.fraserinstitute.org
Publishing Information
DistributionThese publications are available from <http://www.fraserinstitute.org> in Portable Document Format (PDF) and can be read with Adobe Acrobat Pro® or Adobe Acrobat Reader®, versions 8/9 or later. Adobe Acrobat Reader DC®, the most recent version, is available free of charge from Adobe Systems Inc. at <http://get.adobe.com/reader/>. Readers having trouble viewing or printing our PDF files using applications from other manufacturers (e.g., Apple’s Preview) should use Adobe Acrobat Reader or Adobe Acrobat Pro.
Ordering publicationsTo order printed publications from the Fraser Institute, please contact:
• e-mail: [email protected]• telephone: 604.688.0221 ext. 580 or, toll free, 1.800.665.3558 ext. 580• fax: 604.688.8539
MediaFor media enquiries, please contact our Communications Department:
• 604.714.4582or our Media Specialist in Toronto:
• 416.363.6575 ext. 238• e-mail: [email protected].
CopyrightCopyright © 2016 by the Fraser Institute. All rights reserved. No part of this publication may be reproduced in any manner whatsoever without written permission except in the case of brief passages quoted in critical articles and reviews.
Date of issueJuly 2016
ISBN978-0-88975-414-0
CitationAngevine, Gerry, and Kenneth P. Green (2015). The Costs of Pipeline Obstructionism. Fraser Institute. <http://www.fraserinstitute.org>.

45 COSTS OF PIPELINE OBSTRUCTIONISM
www.fraserinstitute.org
Supporting the Fraser Institute
To learn how to support the Fraser Institute, please contact
• Development Department, Fraser Institute Fourth Floor, 1770 Burrard Street Vancouver, British Columbia, V6J 3G7 Canada
• telephone, toll-free: 1.800.665.3558 ext. 574
• e-mail: [email protected]
• website: <http://www.fraserinstitute.org/donate>
Purpose, Funding, and Independence
The Fraser Institute provides a useful public service. We report objective information about the economic and social effects of current public policies, and we offer evidence-based research and education about policy options that can improve the quality of life.
The Institute is a non-profit organization. Our activities are funded by char-itable donations, unrestricted grants, ticket sales, and sponsorships from events, the licensing of products for public distribution, and the sale of publications.
All research is subject to rigorous review by external experts, and is con-ducted and published separately from the Institute’s Board of Directors and its donors.
The opinions expressed by the author are his own, and do not necessarily reflect those of the Institute, its Board of Directors, its donors and support-ers, or its staff. This publication in no way implies that the Fraser Institute, its trustees, or staff are in favour of, or oppose the passage of, any bill; or that they support or oppose any particular political party or candidate.
As a healthy part of public discussion among fellow citizens who desire to improve the lives of people through better public policy, the Institute welcomes evidence-focused scrutiny of the research we publish, including verification of data sources, replication of analytical methods, and intelli-gent debate about the practical effects of policy recommendations.

46 COSTS OF PIPELINE OBSTRUCTIONISM
www.fraserinstitute.org
Editorial Advisory Board
* deceased; † Nobel Laureate
Prof. Terry L. Anderson
Prof. Robert Barro
Prof. Michael Bliss
Prof. Jean-Pierre Centi
Prof. John Chant
Prof. Bev Dahlby
Prof. Erwin Diewert
Prof. Stephen Easton
Prof. J.C. Herbert Emery
Prof. Jack L. Granatstein
Prof. Herbert G. Grubel
Prof. James Gwartney
Prof. Ronald W. Jones
Dr. Jerry Jordan
Prof. Ross McKitrick
Prof. Michael Parkin
Prof. Friedrich Schneider
Prof. Lawrence B. Smith
Dr. Vito Tanzi
Prof. Armen Alchian*
Prof. James M. Buchanan* †
Prof. Friedrich A. Hayek* †
Prof. H.G. Johnson*
Prof. F.G. Pennance*
Prof. George Stigler* †
Sir Alan Walters*
Prof. Edwin G. West*
Members
Past members


![[Pipeline] Inspecting Pipeline Installation](https://img.pdfslide.us/doc/110x75/55cf8d045503462b1391543e/pipeline-inspecting-pipeline-installation.jpg)