Embed Size (px)
Citation preview
The Costs and Benefits of Half a Loaf:
The Economic Effects of Recent Regulation of
Debit Card Interchange Fees
Robert J. Shapiro
October 1, 2013
1
The Costs and Benefits of Half a Loaf:
The Economic Effects of Recent Regulation of Debit Card Interchange Fees1
Robert J. Shapiro
I. Introduction
The ultimate benefits and costs associated with the Dodd-Frank “Wall Street Reform and
Consumer Act” enacted in July 2010 are matters of heated debate among public officials,
financial-sector experts, and economists. This study examines one section of that Act,
sponsored by Senator Richard Durbin, which directed the Federal Reserve Board to develop new
regulations for the “interchange fees” charged for debit card transactions. These are fees charged
by the banks that issue debit cards and paid by merchants every time a customer uses a debit
card. The Durbin amendment, intended to “help small businesses, merchants, and consumers by
providing relief from high interchange fees,”2 instructed the Federal Reserve Board to develop
binding standards for debit interchange fees that would be “reasonable and proportional” to the
costs of processing these transactions.3 In December 2010, the Board issued its proposed rule;
and six months later, on June 29, 2011, the Board issued its final rule, “Regulation II: Debit Card
Interchange Fees and Routing,” which became effective on October 1, 2011.4 As we will see,
new data show that under most conditions, this final rule has achieved significant savings for
consumers and merchants. However, the evidence also shows that the new regulation has had
certain perverse results harmful to the same consumers and merchants. The standards set out in
the final rule also depart sharply from those provided under the Board’s original proposal, and in
ways which impose much greater costs on consumers and merchants.
With more than two-thirds of U.S. households now using debit cards, Regulation II
affects most Americans. In the first three quarters of 2011, before the Durbin Amendment took
effect, Americans used their debit cards more than 3.8 billion times per month for purchases
totaling some $150 billion each month. Debit card issuers collected interchange fees averaging
$0.48 on each of those transactions, for a total of $16.7 billion over the nine-month period; and
most of these charges were passed along to consumers through higher prices. Yet, the Federal
Reserve Board found that the actual costs of processing these transactions averaged just $0.05
per transaction. The large gap between these costs and the interchange fees charged to cover
them drove the new public demands to regulate these fees.
The standards for debit interchange fees set out in Regulation II have two major
components. First, they cap debit card interchange fees at $0.21 per transaction, plus 5 basis
points (0.05 percent) of the transaction’s value, plus a $0.01 charge per transaction for debit card
issuers that meet certain fraud prevention standards. Second, these standards apply only to
1 The author gratefully acknowledges the research provided by Dr. Nam Pham and Doug Dowson, and the support
provided by the Merchants Payments Coalition. The views and analysis are solely those of the author. 2 Congressional Record (May 13, 2010).
3 Sec. 1075, Wall Street Reform and Consumer Protection Act: Reasonable Fees and Rules for Payment Card
Transactions. 4 Federal Reserve Board (June 29, 2011).
2
transactions with debit cards issued by financial institutions with assets of $10 billion or more,
covering about two-thirds of all debit transactions.5
Our analysis shows that these standards have had significant effects. We find, first, that
the new cap on debit interchange fees reduced the fee on the debit transactions covered by the
regulation from an average of $0.51 per transaction (with large variations) to $0.24 (with less
variation).6 This overall reduction saved consumers and merchants an estimated $8.5 billion in
2012, although some sectors such as supermarkets benefited little or, in some cases, are paying
more. We also estimate that $5.87 billion of the $8.5 billion in 2012 savings was passed along to
consumers in lower prices, and merchants retained $2.64 billion. Economic theory and evidence
suggest that these savings supported job gains in certain sectors. Lower prices for consumers
lead to more consumption of goods and services, which drives the employment to produce them.
Merchants’ higher retained earnings also support more consumption by them as well, with the
same employment effects, Merchants also use some of those higher earnings for additional
investment that supports more jobs, as well as for direct hiring. All told, we estimate that the
$8.5 billion in 2012 cost savings was sufficient to support 37,501 new jobs.
These savings and job gains could and should have been substantially larger. While the
bulk of most interchange fees before Regulation II depended on the transaction’s size, the terms
of Regulation II include a $0.21 fixed fee per transaction, which disproportionately burdens
small transactions and merchants that rely on them. We found that Regulation II actually raised
interchange fees on transactions of $15 or less. In fact, under Regulation II, the fee on the
average small transaction of $7.50, as a share of the transaction, exceeds the profit margins on
such transactions for six industries that depend on small purchases, including supermarkets,
groceries, convenience stores, gas stations and pharmacies. We found that if Regulation II had
not raised interchange fees on small debit transactions, consumers and merchants would have
saved an additional $690 million in 2012, which could have supported 3,044 more jobs.7
The standards for debit interchange fees contained in Regulation II also are much less
strict than those first proposed by the Federal Reserve Board. The Board’s original proposal to
cap debit interchange fees at $0.12 per transaction attracted major lobbying efforts by financial
institutions. As directed by the Durbin amendment, that $0.12 cap reflected the costs for the
median debit card issuer to authorize, clear and settle a debit transaction. Our analysis found that
the Board’s original proposal would have increased the benefits for consumers and merchants
from $8.5 billion to $12.54 billion in 2012, an increase of $4.04 billion or 52 percent. Moreover,
these additional benefits could have supported substantial employment, which we estimate at an
additional 17,815 jobs in 2012. All told, therefore, the Federal Reserve’s original proposal would
have generated benefits sufficient to support 55,316 new jobs in 2012 alone.
5 To encourage competition, Regulation II also stipulates that debit card issuers allow their cards to be used on at
least two unaffiliated networks (for example, Visa and Discover). 6 Before Regulation II, the average fee for a signature debit transaction was $0.57, versus $0.33 for a PIN debt
transaction. Moreover, since most of the fee before Regulation II depended on a transaction’s size, the regulation
did not cut interchange fees on most smaller transactions – and raised them on many small purchases. 7 The Durbin Amendment applies to interchange fees collected only on cards issued by financial institutions with
assets of $10 billion or more. The 7,494 banks and credit unions with assets of less than $10 billion issued debit
cards which accounted for 34 percent of 2012 debit transactions, totaling some $664 billion. The interchange fees
charged on these exempt transactions have not declined and averaged $0.43 per transaction in 2012.
3
Finally, the new standards do not affect credit card transactions. Americans made an
estimated 25.4 billion credit card purchases in 2012 with a total value of $2.4 trillion. These
transactions carried interchange fees which in 2012 totaled an estimated $41.2 billion and
averaged $1.62 per transaction. Our analysis found that if credit card interchange fees on the two
dominant, four-party payment networks, Visa and MasterCard, were capped at the maximum
$0.24 per-transaction rate set by Regulation II for covered debit transactions, consumers and
merchants would have saved an additional $ 22.4 billion in 2012. Consumers would capture
$15.4 billion of those benefits, and their additional spending could support 56,733 jobs.
Merchants would likely retain roughly $6.9 billion of the cost savings, and their additional
spending and investments could support another 41,918 jobs. Extending Regulation II in its
current form to Visa and MasterCard credit card transactions in 2012, therefore, would have
produced savings sufficient to support an additional 98,651 jobs.
Congress and the Federal Reserve have reduced excessive interchange fees on many debit
transactions. However, they could substantially improve on that work. First, the standards for
interchange fees should reflect the real costs of processing debit transactions, as reflected in the
Federal Reserve’s first proposal and as directed by the Durbin Amendment. Second, these
standards should ensure that the fees for small transactions do not impose a disproportionate
burden. Finally, Congress should extend these standards to credit card transactions.
II. The Economics of Interchange Fees
The economics of interchange fees, like the economics of many things, are more
complicated than they initially may seem to be. First, the basic process: When a merchant
processes a sale paid for with a debit or credit card, his bank charges him a fee to cover its own
costs as well as fees it has to pay to the bank that issued the card and the payment card network.
These fees are set by the payment card networks, such as Visa and MasterCard, and collected by
card issuers such as Bank of America, Wells Fargo, and JP Morgan Chase. The largest of these
fees is the interchange charge that goes to the card-issuing bank, applied to more than 200
million debit and credit card transactions every day across the United States.8
In a typical transaction, a cardholder swipes a debit card at a point of sale. Immediately,
the merchant’s bank receives an electronic authorization request with the debit card holder’s
account information and transaction amount. In less than a second, the merchant’s bank
transmits these data to the bank that issued the card, which transmits its approval or rejection of
the transaction to the debit card network, the merchant’s bank, and the merchant. In approved
transactions, the card-issuing bank posts the debit to the cardholder’s account, the card network
processes the transaction on behalf of the cardholder’s and merchant’s banks, and the merchant’s
bank credits his account for the transaction, minus a “merchant discount” fee. The interchange
fee accounts for about 80 percent of the merchant discount.
8 The cash flow runs in the opposite direction, from the cardholder to the card-issuing bank, to the card network, to
the merchant’s bank, and finally to the merchant. After the transaction is authorized, the issuing bank posts the
charge on the cardholder’s account and sends the charge less the interchange fee to the merchant’s bank. Both the
network and the merchant’s bank deduct their own fees, and then send the charge less the fees to the merchant.
4
The merchants who pay interchange fees and many of their customers receive certain
services. Some customers will purchase more using debit cards than with cash, and merchants
receive payment more quickly than when they accept personal checks. The proper level of these
fees, however, remains controversial – and consequential, since debit cards are the most popular
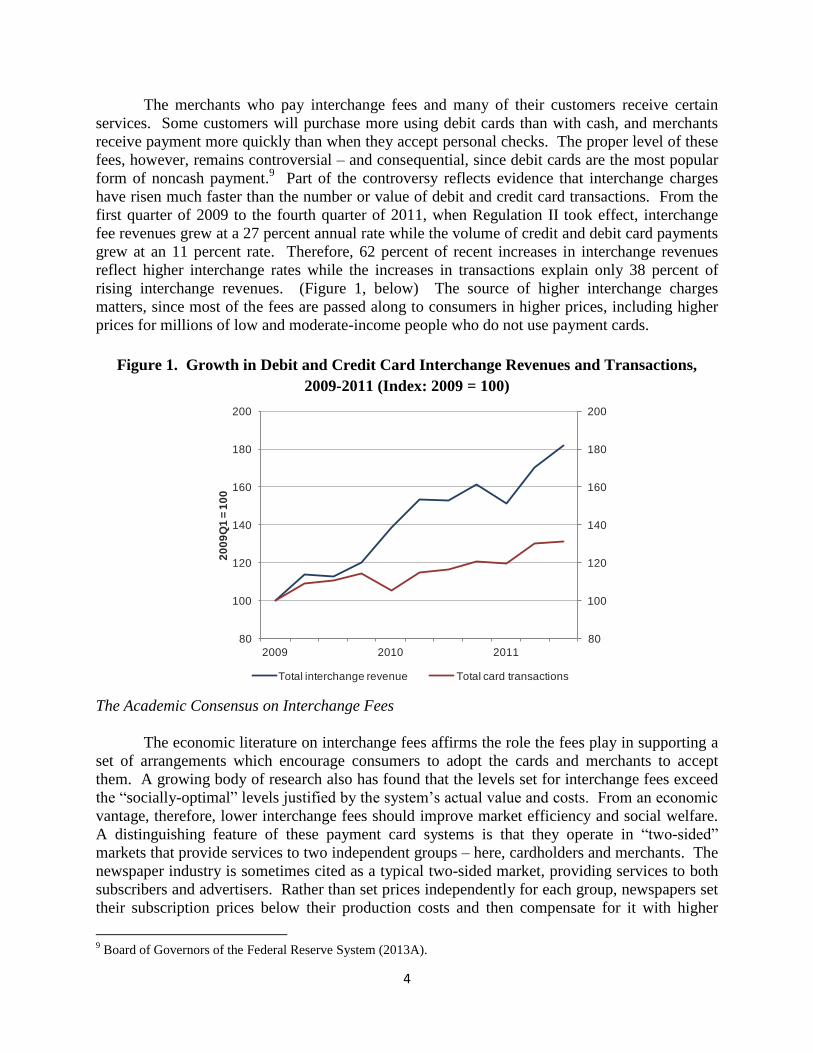
form of noncash payment.9 Part of the controversy reflects evidence that interchange charges
have risen much faster than the number or value of debit and credit card transactions. From the
first quarter of 2009 to the fourth quarter of 2011, when Regulation II took effect, interchange
fee revenues grew at a 27 percent annual rate while the volume of credit and debit card payments
grew at an 11 percent rate. Therefore, 62 percent of recent increases in interchange revenues
reflect higher interchange rates while the increases in transactions explain only 38 percent of
rising interchange revenues. (Figure 1, below) The source of higher interchange charges
matters, since most of the fees are passed along to consumers in higher prices, including higher
prices for millions of low and moderate-income people who do not use payment cards.
Figure 1. Growth in Debit and Credit Card Interchange Revenues and Transactions,
2009-2011 (Index: 2009 = 100)
The Academic Consensus on Interchange Fees
The economic literature on interchange fees affirms the role the fees play in supporting a
set of arrangements which encourage consumers to adopt the cards and merchants to accept
them. A growing body of research also has found that the levels set for interchange fees exceed
the “socially-optimal” levels justified by the system’s actual value and costs. From an economic
vantage, therefore, lower interchange fees should improve market efficiency and social welfare.
A distinguishing feature of these payment card systems is that they operate in “two-sided”
markets that provide services to two independent groups – here, cardholders and merchants. The
newspaper industry is sometimes cited as a typical two-sided market, providing services to both
subscribers and advertisers. Rather than set prices independently for each group, newspapers set
their subscription prices below their production costs and then compensate for it with higher
9 Board of Governors of the Federal Reserve System (2013A).
80
100
120
140
160
180
200
80
100
120
140
160
180
200
2009 2010 2011
20
09
Q1
= 1
00
Total interchange revenue Total card transactions
5
prices for advertising. By using advertising revenues to subsidize subscribers, newspapers can
increase their circulation, for the benefit of both subscribers and advertisers.
In an early (1983) study, the lawyer-economist and U.S. Assistant Attorney General
William Baxter demonstrated that, in principal, payment card networks set their fees in much the
same way as newspapers.10
At the optimal level of interchange fees, the costs of the payment
network should be distributed in ways which attract the highest numbers of cardholders and
merchants. The interchange fee helps balance the two sides of the payment card market and, in
theory, ensure that cards are adopted and accepted at levels which maximize social welfare.
Many empirical studies, however, have found that interchange fees are generally set at
relatively high levels that are not economically and socially optimal. To begin, Baxter’s classical
interchange model depends on the unrealistic assumptions that merchants, customers and
payment card issuers all operate in perfectly competitive markets that lead to efficient
interchange fees.11
In fact, merchants have little choice but to accept most major payment cards
even when their interchange fee rises; and a 2002 study found that when merchants’ demand for
network card services is “price inelastic” in this way, the fee will exceed the socially-optimal
level.12
In a similar vein, a 2004 study found that when the card-issuing side of the market is less
competitive than the card-accepting side, interchange fees also will be set too high.13
In other
words, both studies showed how merchants will accept cards even when the fee exceeds the
benefits, which in turn allows card networks to set those fees at inefficiently high levels.
Other economic analyses have explored why consumers adopt and use cards in ways that
lead to excessively high interchange fees. A 2009 study noted that consumers generally pay the
same retail price regardless of how they pay, giving them an incentive to sign up and use cards
with generous rewards and higher interchange fees to finance them.14
Building on this and other
research, another recent analysis showed that when consumers’ decisions about whether to use
cards are sensitive to the membership or late fees they pay to card companies, the interchange
fees paid by merchants again tend to exceed optimal levels.15
That researcher, as well as another
study, also found that when card holders’ costs fall – for example, by paying their bills on time –
card issuers raise interchange fees to maintain their profits from the system. They concluded,
“…market-determined merchant fees tend to be too high from a consumer welfare point of view
… imposing a cap on merchant (interchange) fees may improve consumer welfare.”16
III. Evidence that Interchange Fees Are Set Too High
Real world experience with debit and credit card markets confirms most economists’
view that interchange fees are likely to exceed socially optimal levels, and that therefore
10
Baxter (1983. 11
Under this assumption, interchange fees serve simply as transfer payments between merchants and cardholders.
Any increase in interchange fees is simply competed away by issuers in the form of lower fees or higher benefits for
cardholders, and any decrease in interchange fees is competed away by acquirers in the form of reduced merchant
discounts. 12
Rochet and Tirole (2002); Wang (2010). 13
Wright (2004). 14
Bedre-Defolie et al. (2009). 15
Wang (2010); McAndrews and Wang (2012). 16
McAndrews and Wang (2012).
6
regulation to limit them could be economically warranted and desirable. One example is evident
in the PIN and signature debit card systems. Signature debit cards have relatively high
interchange fees, and yet are more popular than PIN debit cards with lower fees. With PIN debit,
users input their personal identification numbers (PIN) and their transactions are routed through
electronic-funds-transfer (EFT) networks, the same networks that process ATM transactions. By
contrast, signature debit card transactions require the cardholder’s signature and are then routed
through the Visa and MasterCard’s credit card networks. So, while PIN debit transactions are
processed in a single step, signature debit transactions require two steps (authorization, followed
by settlement). PIN debit cards also have a lower risk of fraud, because a PIN code is easier to
verify than a signature.
In fact, when PIN debit cards were first introduced, they did not carry any interchange fee
at all, since the funds to cover the charge were immediately debited from the customer’s bank
account. By contrast, signature debit cards were introduced in the late-1970s by VISA and
Mastercard, which used their existing credit card networks and applied a 1.3 percent interchange
fee to signature debit transactions. VISA and Mastercard then introduced their own PIN debit
cards and applied interchange fees to those transactions as well.
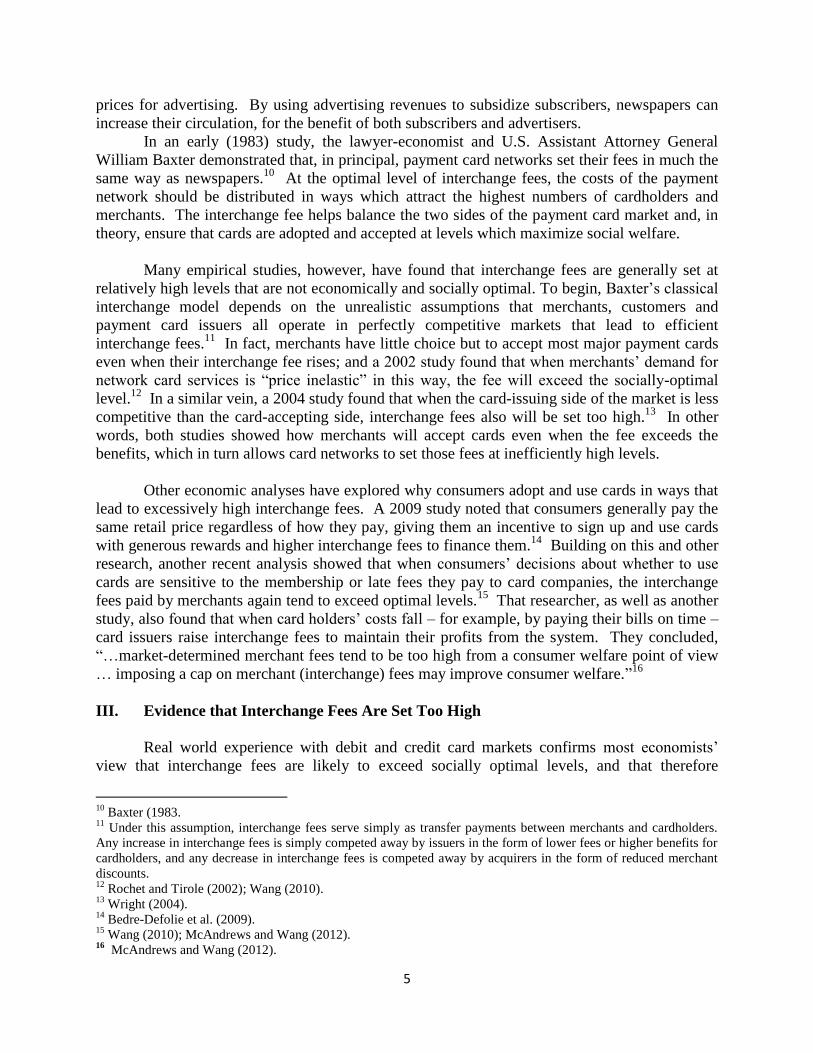
In 2011, according to the Federal Reserve, the processing costs were 1.8 times higher for
signature debit transactions than for PIN debit transactions. In addition, fraud was seven times
more likely with signature cards than PIN card, and total fraud costs were 3.2 times higher with
signature cards.17
(Table 1, below) Yet, signature debit card transactions, which provide no
additional service, account for 63 percent of all debit card transactions while PIN debit
transactions comprise the remaining 37 percent.
Other data on signature and PIN debit cards illustrate the absence of a reliable
relationship between processing costs and interchange fees. Processing a signature card
transaction in 2011 cost $0.055. Yet, before Regulation II took effect, the interchange fees for
signature debit transactions averaged $0.57 or 10.4 times the processing costs.18
(Table 1)
Processing a PIN debit transaction is less costly: $0.031 for authorization, clearance and
settlement. The interchange fees for these PIN debit transactions averaged $0.33 in 2011 before
Regulation II took effect – about 10.6 times the processing costs but still $0.24 less than the
average cost for signature debit transactions.
Table 1. Costs of Debit Card Use, Per-Transaction, and Related Interchange Fees,
January – September 201119
Authorization, Clearing, and
Settlement Costs, Per Transaction
Interchange Fee
Per Transaction
Signature $0.055 $0.57
PIN $0.031 $0.33
Prepaid $0.122 $0.44
All Types $0.050 $0.48
17
Board of Governors of the Federal Reserve System (2013). 18
Ibid. 19
Ibid.
7
The Relationship of Debit System Costs and Interchange Fees
The two largest debit card networks, Visa and MasterCard, insist that their interchange
fees are determined by objective economic criteria. Visa, for example, claims that “dynamic and
highly competitive market forces” determine its interchange rates.20
MasterCard insists that its
interchange fees are determined by costs, merchant incentives, and new payment card programs
and technologies, among other factors.21
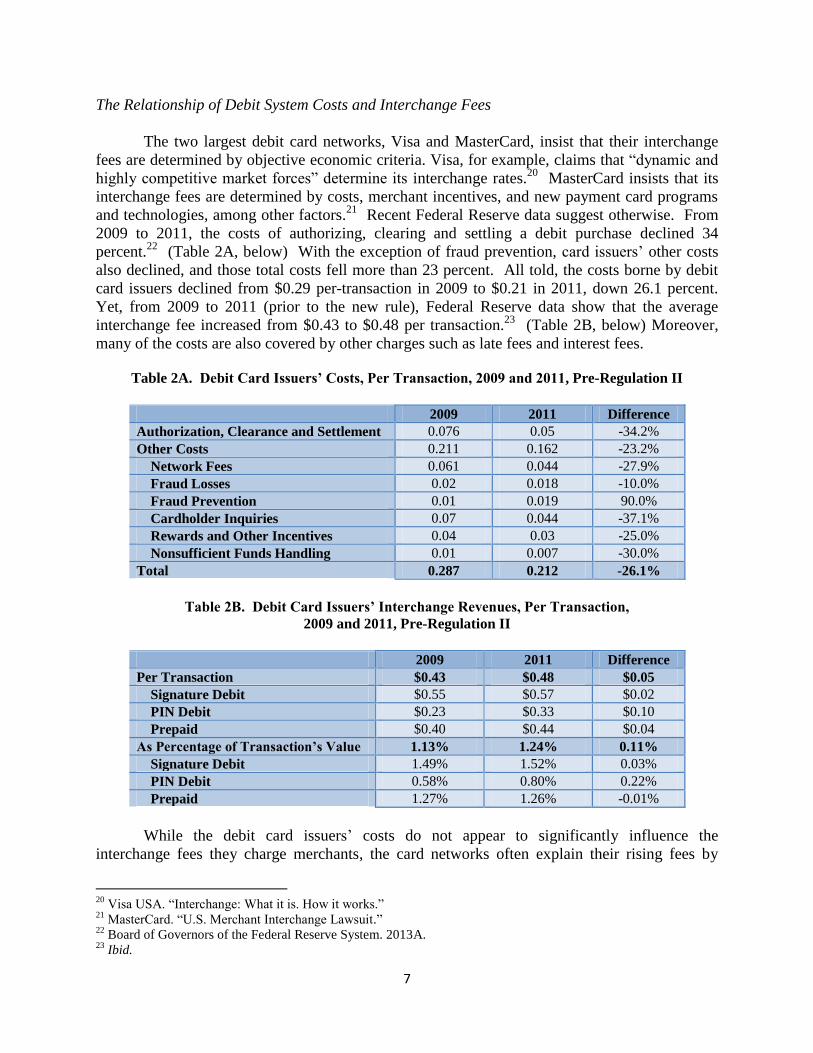
Recent Federal Reserve data suggest otherwise. From
2009 to 2011, the costs of authorizing, clearing and settling a debit purchase declined 34
percent.22
(Table 2A, below) With the exception of fraud prevention, card issuers’ other costs
also declined, and those total costs fell more than 23 percent. All told, the costs borne by debit
card issuers declined from $0.29 per-transaction in 2009 to $0.21 in 2011, down 26.1 percent.
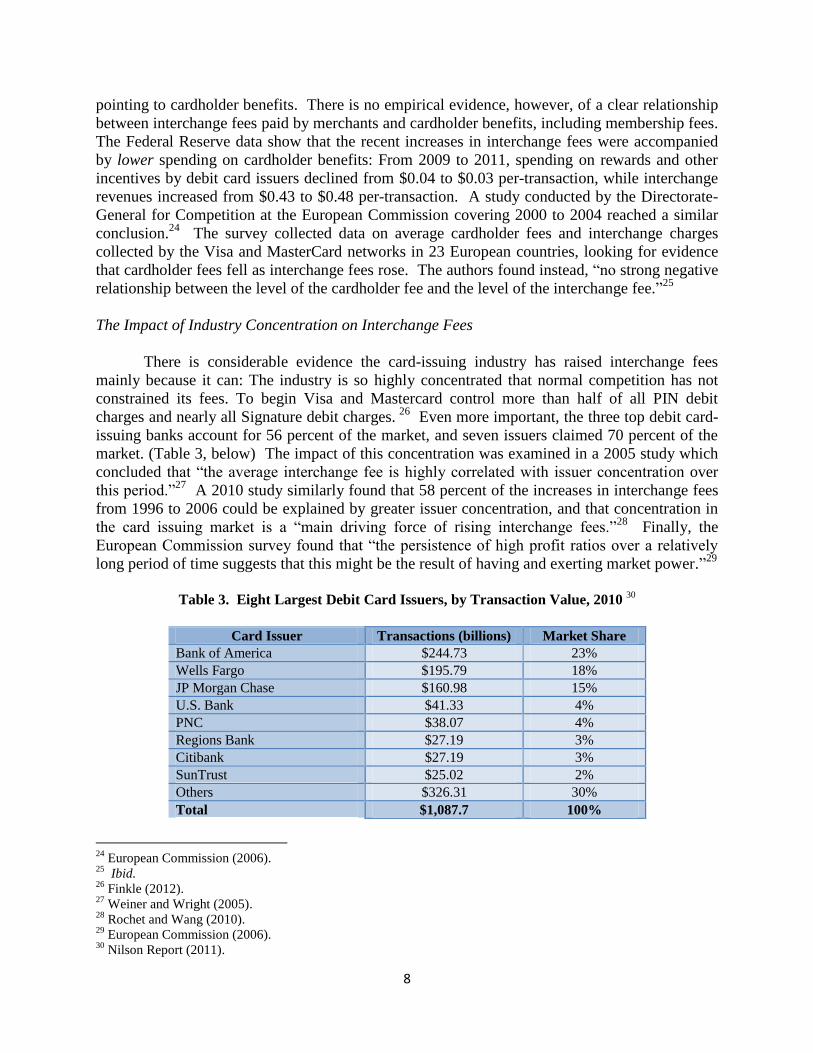
Yet, from 2009 to 2011 (prior to the new rule), Federal Reserve data show that the average
interchange fee increased from $0.43 to $0.48 per transaction.23
(Table 2B, below) Moreover,
many of the costs are also covered by other charges such as late fees and interest fees.
Table 2A. Debit Card Issuers’ Costs, Per Transaction, 2009 and 2011, Pre-Regulation II
2009 2011 Difference
Authorization, Clearance and Settlement 0.076 0.05 -34.2%
Other Costs 0.211 0.162 -23.2%
Network Fees 0.061 0.044 -27.9%
Fraud Losses 0.02 0.018 -10.0%
Fraud Prevention 0.01 0.019 90.0%
Cardholder Inquiries 0.07 0.044 -37.1%
Rewards and Other Incentives 0.04 0.03 -25.0%
Nonsufficient Funds Handling 0.01 0.007 -30.0%
Total 0.287 0.212 -26.1%
Table 2B. Debit Card Issuers’ Interchange Revenues, Per Transaction,
2009 and 2011, Pre-Regulation II
2009 2011 Difference
Per Transaction $0.43 $0.48 $0.05
Signature Debit $0.55 $0.57 $0.02
PIN Debit $0.23 $0.33 $0.10
Prepaid $0.40 $0.44 $0.04
As Percentage of Transaction’s Value 1.13% 1.24% 0.11%
Signature Debit 1.49% 1.52% 0.03%
PIN Debit 0.58% 0.80% 0.22%
Prepaid 1.27% 1.26% -0.01%
While the debit card issuers’ costs do not appear to significantly influence the
interchange fees they charge merchants, the card networks often explain their rising fees by
20
Visa USA. “Interchange: What it is. How it works.” 21
MasterCard. “U.S. Merchant Interchange Lawsuit.” 22
Board of Governors of the Federal Reserve System. 2013A. 23
Ibid.
8
pointing to cardholder benefits. There is no empirical evidence, however, of a clear relationship
between interchange fees paid by merchants and cardholder benefits, including membership fees.
The Federal Reserve data show that the recent increases in interchange fees were accompanied
by lower spending on cardholder benefits: From 2009 to 2011, spending on rewards and other
incentives by debit card issuers declined from $0.04 to $0.03 per-transaction, while interchange
revenues increased from $0.43 to $0.48 per-transaction. A study conducted by the Directorate-
General for Competition at the European Commission covering 2000 to 2004 reached a similar
conclusion.24
The survey collected data on average cardholder fees and interchange charges
collected by the Visa and MasterCard networks in 23 European countries, looking for evidence
that cardholder fees fell as interchange fees rose. The authors found instead, “no strong negative
relationship between the level of the cardholder fee and the level of the interchange fee.”25
The Impact of Industry Concentration on Interchange Fees
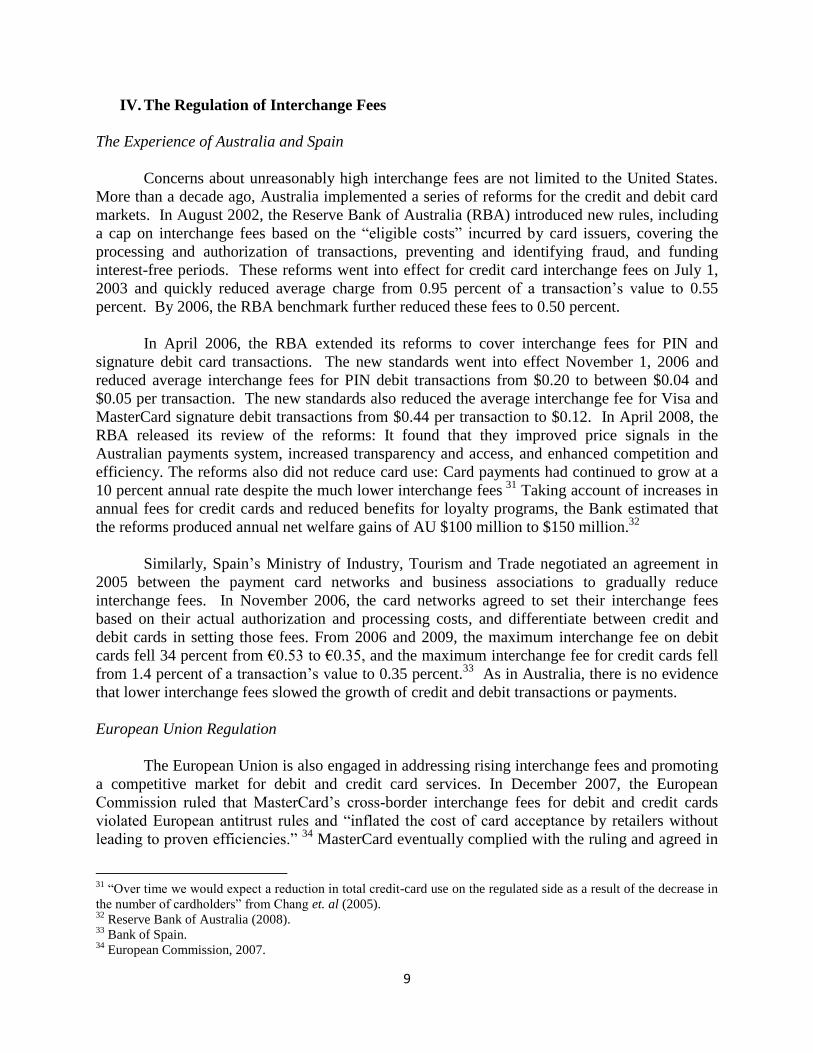
There is considerable evidence the card-issuing industry has raised interchange fees
mainly because it can: The industry is so highly concentrated that normal competition has not
constrained its fees. To begin Visa and Mastercard control more than half of all PIN debit
charges and nearly all Signature debit charges. 26
Even more important, the three top debit card-
issuing banks account for 56 percent of the market, and seven issuers claimed 70 percent of the
market. (Table 3, below) The impact of this concentration was examined in a 2005 study which
concluded that “the average interchange fee is highly correlated with issuer concentration over
this period.”27
A 2010 study similarly found that 58 percent of the increases in interchange fees
from 1996 to 2006 could be explained by greater issuer concentration, and that concentration in
the card issuing market is a “main driving force of rising interchange fees.”28
Finally, the
European Commission survey found that “the persistence of high profit ratios over a relatively
long period of time suggests that this might be the result of having and exerting market power.”29
Table 3. Eight Largest Debit Card Issuers, by Transaction Value, 2010
30
Card Issuer Transactions (billions) Market Share
Bank of America $244.73 23%
Wells Fargo $195.79 18%
JP Morgan Chase $160.98 15%
U.S. Bank $41.33 4%
PNC $38.07 4%
Regions Bank $27.19 3%
Citibank $27.19 3%
SunTrust $25.02 2%
Others $326.31 30%
Total $1,087.7 100%
24
European Commission (2006). 25
Ibid. 26
Finkle (2012). 27
Weiner and Wright (2005). 28
Rochet and Wang (2010). 29
European Commission (2006). 30
Nilson Report (2011).
9
IV. The Regulation of Interchange Fees
The Experience of Australia and Spain
Concerns about unreasonably high interchange fees are not limited to the United States.
More than a decade ago, Australia implemented a series of reforms for the credit and debit card
markets. In August 2002, the Reserve Bank of Australia (RBA) introduced new rules, including
a cap on interchange fees based on the “eligible costs” incurred by card issuers, covering the
processing and authorization of transactions, preventing and identifying fraud, and funding
interest-free periods. These reforms went into effect for credit card interchange fees on July 1,
2003 and quickly reduced average charge from 0.95 percent of a transaction’s value to 0.55
percent. By 2006, the RBA benchmark further reduced these fees to 0.50 percent.
In April 2006, the RBA extended its reforms to cover interchange fees for PIN and
signature debit card transactions. The new standards went into effect November 1, 2006 and
reduced average interchange fees for PIN debit transactions from $0.20 to between $0.04 and
$0.05 per transaction. The new standards also reduced the average interchange fee for Visa and
MasterCard signature debit transactions from $0.44 per transaction to $0.12. In April 2008, the
RBA released its review of the reforms: It found that they improved price signals in the
Australian payments system, increased transparency and access, and enhanced competition and
efficiency. The reforms also did not reduce card use: Card payments had continued to grow at a
10 percent annual rate despite the much lower interchange fees 31
Taking account of increases in
annual fees for credit cards and reduced benefits for loyalty programs, the Bank estimated that
the reforms produced annual net welfare gains of AU $100 million to $150 million.32
Similarly, Spain’s Ministry of Industry, Tourism and Trade negotiated an agreement in
2005 between the payment card networks and business associations to gradually reduce
interchange fees. In November 2006, the card networks agreed to set their interchange fees
based on their actual authorization and processing costs, and differentiate between credit and
debit cards in setting those fees. From 2006 and 2009, the maximum interchange fee on debit
cards fell 34 percent from €0.53 to €0.35, and the maximum interchange fee for credit cards fell
from 1.4 percent of a transaction’s value to 0.35 percent.33
As in Australia, there is no evidence
that lower interchange fees slowed the growth of credit and debit transactions or payments.
European Union Regulation
The European Union is also engaged in addressing rising interchange fees and promoting
a competitive market for debit and credit card services. In December 2007, the European
Commission ruled that MasterCard’s cross-border interchange fees for debit and credit cards
violated European antitrust rules and “inflated the cost of card acceptance by retailers without
leading to proven efficiencies.” 34
MasterCard eventually complied with the ruling and agreed in
31
“Over time we would expect a reduction in total credit-card use on the regulated side as a result of the decrease in
the number of cardholders” from Chang et. al (2005). 32
Reserve Bank of Australia (2008). 33
Bank of Spain. 34
European Commission, 2007.
10
April 2009 to cap its weighted average cross-border interchange fees at 0.2 percent of the value
of debit transactions and 0.3 percent of the value of credit card purchases.35
Similarly, Visa
agreed in December 2010 to cap its weighted average cross-border interchange fees at 0.2
percent for debit transactions.36
In July 2013, the Commission proposed to cap domestic as well
as cross-border interchange fees at 0.2 percent for debit transactions and 0.3 percent for credit
cards.37
The average EU debit card transaction is €47.18 ($63.18), implying a debit interchange
fee under the current proposal of €0.094 ($0.13). The average EU credit card transaction is
€60.71 ($81.28), implying a credit card interchange fee under the proposal of €0.182 ($0.24).
U.S. Regulation
American merchant and retail associations have long argued that high interchange fees
and various restrictions imposed on merchants by the payment card networks and the card-
issuing banks harm consumers. The restrictions included exclusivity agreements barring the
banks from issuing debit cards on competing card networks – a practice ruled illegal for credit
cards in 2001 on competition grounds.38
Until the 2011 reforms, each issuer could still restrict
its debit card transactions to a single card network, such as Visa for signature transactions and its
affiliated Interlink network for PIN transactions.39
The Durbin Amendment ended network
exclusivity arrangements for debit cards by directing the Fed to set new regulations prohibiting
an issuer or payment card network from restricting the processing of debit transactions to a
single payment card network. It also directed the Federal Reserve to end certain other
restrictions set by the card network and/or card-issuing banks.
The Durbin Amendment also directed the Fed to set rules for debit card interchange fees
to ensure fees proportional to the costs of processing debit card transactions. In December 2010,
the Federal Reserve Board issued a proposed rule for the fees, creating two alternative standards
for determining if an interchange fee is reasonable and propotional to the costs of authorizing,
clearing, and settling an individual debit card transaction. These standards were based on the
results of a survey conducted by the Fed in September 2010, which found that the “allowable
costs” for debit card issuers averaged $0.04 per transaction in 2009, with the median issuer
reporting costs of $0.07 per transaction and issuers at the 80th percentile reporting costs of about
$0.12.40
The Board concluded that a “safe harbor” interchange fee set at the median issuer’s
variable costs of $0.07 and a top fee set at $0.12 would allow “a large majority” of issuers to
recover their variable costs. The Board did not consider network processing fees, fraud losses,
transaction monitoring costs, or other fraud-prevention costs in setting these proposed standards,
noting that the Amendment directed that the costs to be taken into account in setting interchange
fees be limited to those incurred in processing debit transactions.
35
European Commission, 2009. 36
European Commission, 2010. 37
European Commission, 2013B, 2013A. 38
U.S. v. VISA USA, et al., 2001. 39
The card network rules also allowed issuers to specify that all transaction using their cards be routed over a
preferred network, even if another network was available at a lower cost. 40
In 2009, the average variable costs per-transaction were $0.04, plus $0.01 fixed costs and $0.03 in network fees,
for a total $0.08. The median variable costs per transaction were $0.06, plus $0.01 fixed costs and $0.04 network
fees for a total $0.11. Board of Governors of the Federal Reserve System, 2010. In 2011, the variable processing
costs for covered issues average $0.05 per transaction. Board of Governors of the Federal Reserve System, 2013A.
11
Under Alternative 1 proposed by the Fed, issuers would be limited to the “safe harbor”
interchange fee of $0.07 per debit card transaction, or a fee of up to $0.12 depending on the
issuer’s “allowable costs.” Under its Alternative 2, the Fed limited the interchange fees charged
by card issuers to $0.12 cents per debit card transaction, with no $0.07 safe harbor interchange
rate. As required by law, the Fed solicited comments on its proposed alternative rules.
On June 29, 2011, after what the Washington Post described as “an aggressive campaign”
by the financial services industry,41
the Fed issued its final rule capping debit interchange fees at
much higher levels than either of the proposed alternatives. The final rule limits these fees to
$0.21 cents per transaction, plus 5 basis points (0.05 percent) of a transaction’s value and a $0.01
fee if the card issuer meets certain fraud-prevention standards. For an average debit card
transaction of $38, the new standard is equivalent to a $0.24 charge or twice the fee under the
Board’s original proposal. The Financial Times described the final rule as a “victory” for the
card-issuing banks and networks.42
In any case, based on the Fed’s September 2010 survey, the
new rates were not proportional to the costs of authorizing, clearing and settling a transaction, as
the Durbin Amendment seems to direct. On July 31, 2013, U.S. District Court Judge Richard
Leon concurred, holding that the final rule did not follow the language of the law on this point.43
As directed by the Durbin Amendment, the new rules also are limited to transactions with
debit cards issued by financial institutions with $10 billion or more in consolidated assets,
referred to as “covered” or “nonexempt” issuers. In 2011, this provision limited the rule’s
application to 109 large commercial banks or 1.5 percent of the 7,494 commercial banks in the
United States.44
The rule also affects only three large credit unions while exempting 6,911
smaller ones.45
In 2012, this limit exempted 34 percent of debit transactions, totaling $664
billion, from the terms of Regulation II.
V. The Impact of the New Regulation of Interchange Fees on Debit Card Transactions
Analysis of the impact of the new regulations shows that they have reduced interchange
charges overall to a significant degree. However, the rules also lead to relatively high
interchange fees for small purchases, fees which often exceed the profit margins on those
purchases. Moreover, the Fed’s shift from the rules it originally proposed has entailed
substantial additional costs for merchants and consumers. As we will see, consumers and the
overall economy would benefit substantially from the application of the original proposed rules.
The Value and Average Interchange Fees Applied to Debit Card Transactions
To calculate the costs and benefits of the new rules, we begin with data on the level of
debt card transactions. Transactions by debit card have grown faster than any other form of
payment over the last ten to 15 years. The annual dollar value of these transactions increased
from $311 billion in 2000 to over $1.9 trillion in 2012, growing at an average annual rate of 15.5
41
Mui. June 29, 2011. 42
Baer, op. cit. 43
NACS et. al, v. Board of Governors of the Federal Reserve System. July 31, 2013. 44
GAO. 2012. 45
Current data show that Regulation II now covers 558 financial institutions and exempts 13,725 institutions.
http://www.federalreserve.gov/paymentsystems/regii-interchange-fee-standards.htm
12
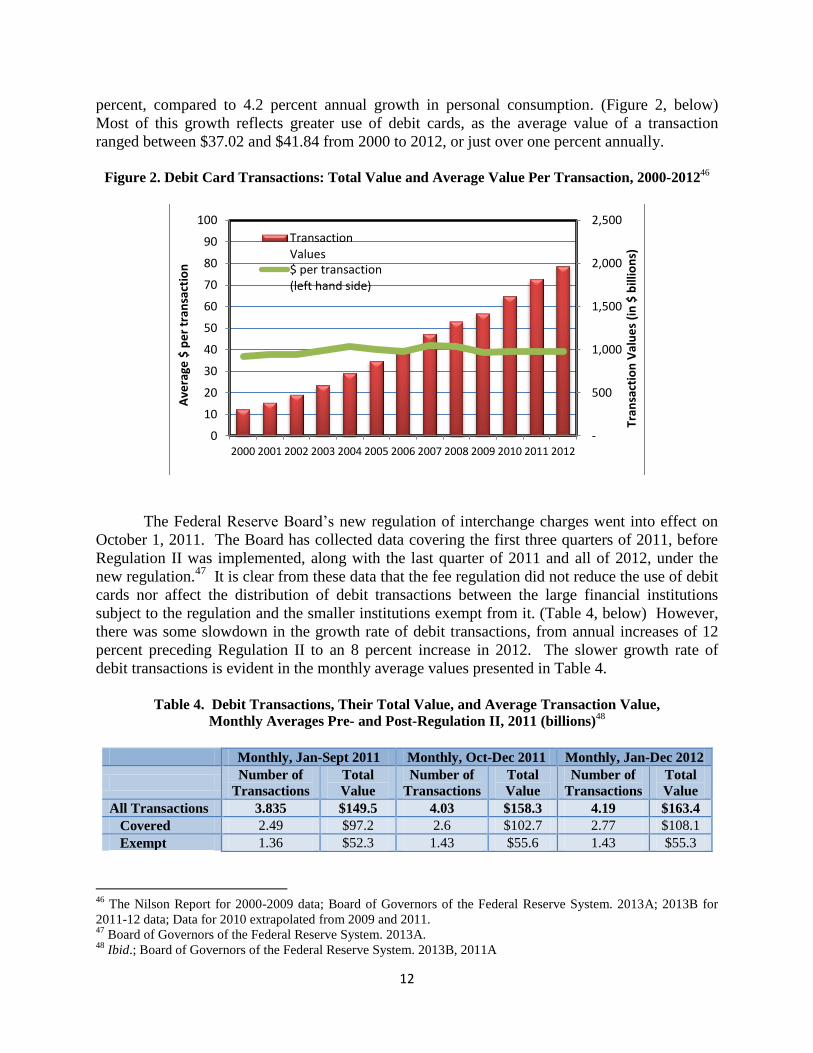
percent, compared to 4.2 percent annual growth in personal consumption. (Figure 2, below)
Most of this growth reflects greater use of debit cards, as the average value of a transaction
ranged between $37.02 and $41.84 from 2000 to 2012, or just over one percent annually.
Figure 2. Debit Card Transactions: Total Value and Average Value Per Transaction, 2000-2012
46
The Federal Reserve Board’s new regulation of interchange charges went into effect on
October 1, 2011. The Board has collected data covering the first three quarters of 2011, before
Regulation II was implemented, along with the last quarter of 2011 and all of 2012, under the
new regulation.47
It is clear from these data that the fee regulation did not reduce the use of debit
cards nor affect the distribution of debit transactions between the large financial institutions
subject to the regulation and the smaller institutions exempt from it. (Table 4, below) However,
there was some slowdown in the growth rate of debit transactions, from annual increases of 12
percent preceding Regulation II to an 8 percent increase in 2012. The slower growth rate of
debit transactions is evident in the monthly average values presented in Table 4.
Table 4. Debit Transactions, Their Total Value, and Average Transaction Value,
Monthly Averages Pre- and Post-Regulation II, 2011 (billions)48
Monthly, Jan-Sept 2011 Monthly, Oct-Dec 2011 Monthly, Jan-Dec 2012
Number of
Transactions
Total
Value
Number of
Transactions
Total
Value
Number of
Transactions
Total
Value
All Transactions 3.835 $149.5 4.03 $158.3 4.19 $163.4
Covered 2.49 $97.2 2.6 $102.7 2.77 $108.1
Exempt 1.36 $52.3 1.43 $55.6 1.43 $55.3
46
The Nilson Report for 2000-2009 data; Board of Governors of the Federal Reserve System. 2013A; 2013B for
2011-12 data; Data for 2010 extrapolated from 2009 and 2011. 47
Board of Governors of the Federal Reserve System. 2013A. 48
Ibid.; Board of Governors of the Federal Reserve System. 2013B, 2011A
-
500
1,000
1,500
2,000
2,500
0
10
20
30
40
50
60
70
80
90
100
2000 2001 2002 2003 2004 2005 2006 2007 2008 2009 2010 2011 2012
Tran
sact
ion
Val
ue
s (i
n $
bill
ion
s)
Ave
rage
$ p
er
tran
sact
ion
TransactionValues$ per transaction(left hand side)
13
Regulation II and Its Effects on Debit Card Interchange Fees
The data also show that the card-issuing institutions and networks raised their debit
interchange fees in the period from 2010 through the third quarter of 2011, while the Durbin
Amendment was debated and adopted, and the Federal Reserve proposed and finalized the
regulation mandated by the Amendment. In 2009, before this process began, debit interchange
fees averaged $0.43 per transaction, or 1.13 percent of the value of an average transaction.
(Table 5, below) In the three quarters preceding the implementation of Regulation II, those fees
averaged $0.48 per transaction, a 9.1 percent increase and equivalent to 1.24 percent of the
average value of those transactions.
Table 5. Debit Card Interchange Fees in 2009 and January–September 2011
49
2009 January – September 2011
Interchange
Fees
( billions)
Fee per
Transaction
Fees as a
Share of
Purchase
Interchange
Fee
( billions)
Fee Per
Transaction
Fee as
Share of
Purchase
All Transactions $15.7 $0.43 1.13% $16.7 $0.48 1.24%
Signature $12.5 $0.55 1.49% $12.5 $0.57 1.52%
PIN $3.2 $0.23 0.58% $4.2 $0.33 0.80%
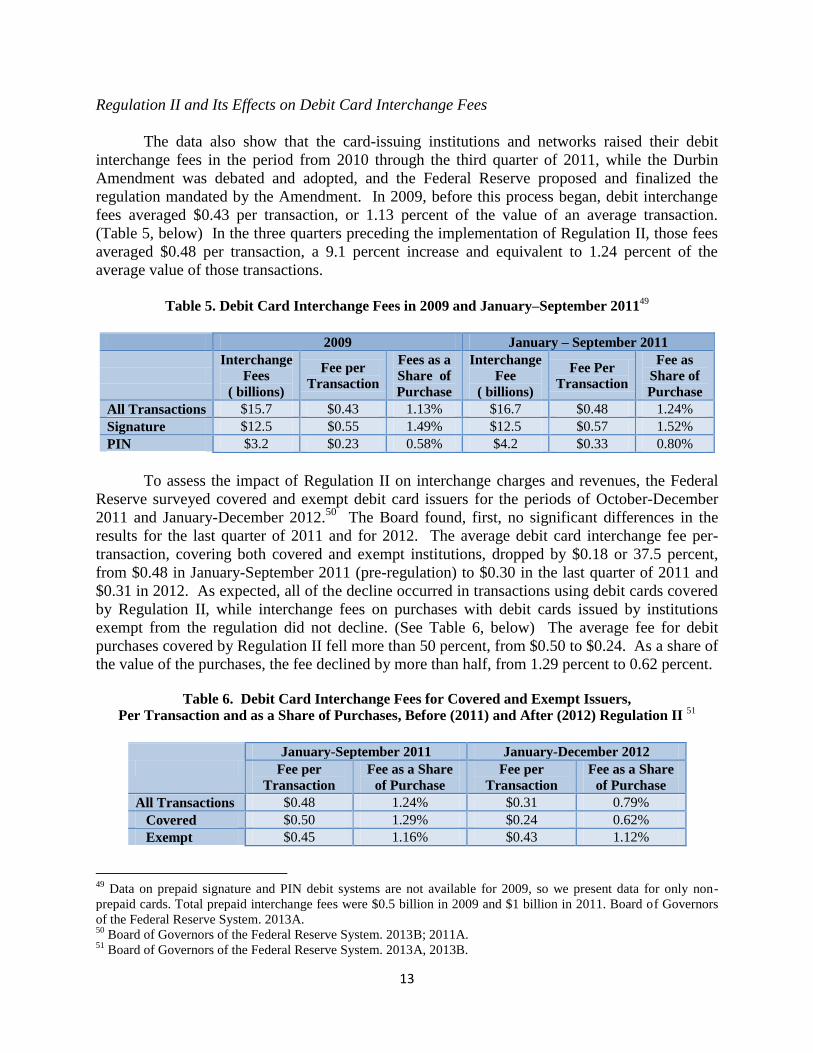
To assess the impact of Regulation II on interchange charges and revenues, the Federal
Reserve surveyed covered and exempt debit card issuers for the periods of October-December
2011 and January-December 2012.50
The Board found, first, no significant differences in the
results for the last quarter of 2011 and for 2012. The average debit card interchange fee per-
transaction, covering both covered and exempt institutions, dropped by $0.18 or 37.5 percent,
from $0.48 in January-September 2011 (pre-regulation) to $0.30 in the last quarter of 2011 and
$0.31 in 2012. As expected, all of the decline occurred in transactions using debit cards covered
by Regulation II, while interchange fees on purchases with debit cards issued by institutions
exempt from the regulation did not decline. (See Table 6, below) The average fee for debit
purchases covered by Regulation II fell more than 50 percent, from $0.50 to $0.24. As a share of
the value of the purchases, the fee declined by more than half, from 1.29 percent to 0.62 percent.
Table 6. Debit Card Interchange Fees for Covered and Exempt Issuers,
Per Transaction and as a Share of Purchases, Before (2011) and After (2012) Regulation II 51
January-September 2011 January-December 2012
Fee per
Transaction
Fee as a Share
of Purchase
Fee per
Transaction
Fee as a Share
of Purchase
All Transactions $0.48 1.24% $0.31 0.79%
Covered $0.50 1.29% $0.24 0.62%
Exempt $0.45 1.16% $0.43 1.12%
49
Data on prepaid signature and PIN debit systems are not available for 2009, so we present data for only non-
prepaid cards. Total prepaid interchange fees were $0.5 billion in 2009 and $1 billion in 2011. Board of Governors
of the Federal Reserve System. 2013A. 50
Board of Governors of the Federal Reserve System. 2013B; 2011A. 51
Board of Governors of the Federal Reserve System. 2013A, 2013B.
14
VI. The Benefits of Regulation II
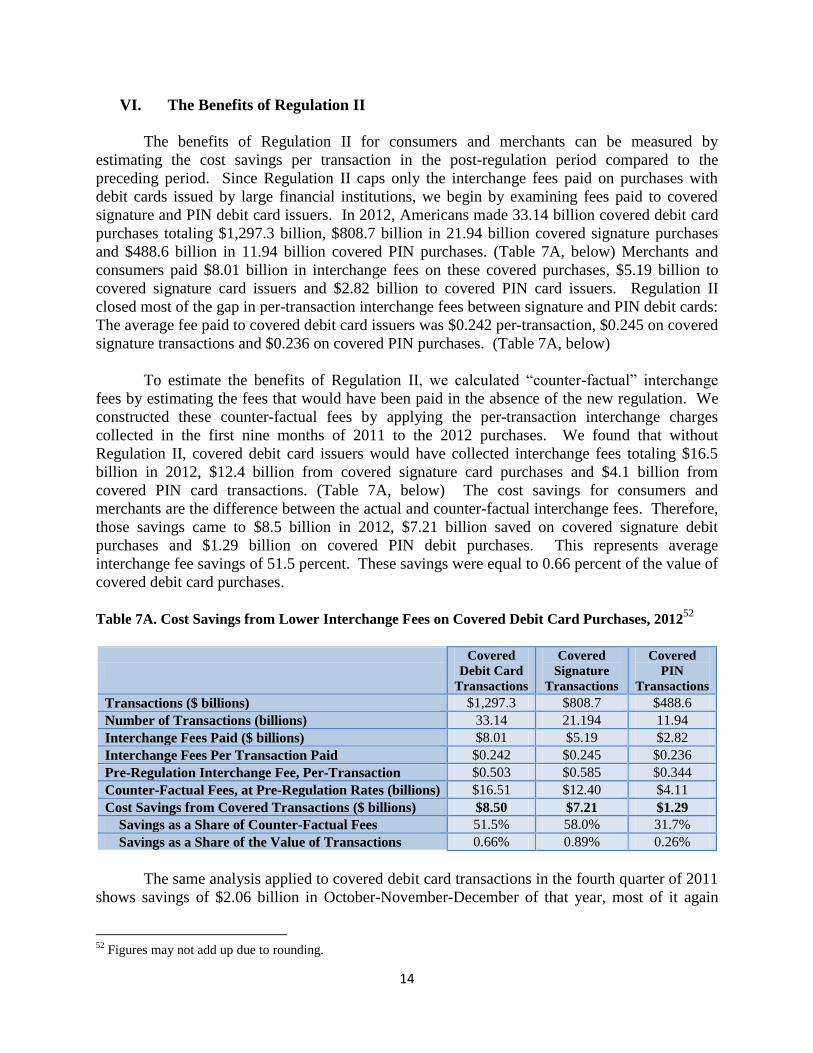
The benefits of Regulation II for consumers and merchants can be measured by
estimating the cost savings per transaction in the post-regulation period compared to the
preceding period. Since Regulation II caps only the interchange fees paid on purchases with
debit cards issued by large financial institutions, we begin by examining fees paid to covered
signature and PIN debit card issuers. In 2012, Americans made 33.14 billion covered debit card
purchases totaling $1,297.3 billion, $808.7 billion in 21.94 billion covered signature purchases
and $488.6 billion in 11.94 billion covered PIN purchases. (Table 7A, below) Merchants and
consumers paid $8.01 billion in interchange fees on these covered purchases, $5.19 billion to
covered signature card issuers and $2.82 billion to covered PIN card issuers. Regulation II
closed most of the gap in per-transaction interchange fees between signature and PIN debit cards:
The average fee paid to covered debit card issuers was $0.242 per-transaction, $0.245 on covered
signature transactions and $0.236 on covered PIN purchases. (Table 7A, below)
To estimate the benefits of Regulation II, we calculated “counter-factual” interchange
fees by estimating the fees that would have been paid in the absence of the new regulation. We
constructed these counter-factual fees by applying the per-transaction interchange charges
collected in the first nine months of 2011 to the 2012 purchases. We found that without
Regulation II, covered debit card issuers would have collected interchange fees totaling $16.5
billion in 2012, $12.4 billion from covered signature card purchases and $4.1 billion from
covered PIN card transactions. (Table 7A, below) The cost savings for consumers and
merchants are the difference between the actual and counter-factual interchange fees. Therefore,
those savings came to $8.5 billion in 2012, $7.21 billion saved on covered signature debit
purchases and $1.29 billion on covered PIN debit purchases. This represents average
interchange fee savings of 51.5 percent. These savings were equal to 0.66 percent of the value of
covered debit card purchases.
Table 7A. Cost Savings from Lower Interchange Fees on Covered Debit Card Purchases, 201252
Covered
Debit Card
Transactions
Covered
Signature
Transactions
Covered
PIN
Transactions
Transactions ($ billions) $1,297.3 $808.7 $488.6
Number of Transactions (billions) 33.14 21.194 11.94
Interchange Fees Paid ($ billions) $8.01 $5.19 $2.82
Interchange Fees Per Transaction Paid $0.242 $0.245 $0.236
Pre-Regulation Interchange Fee, Per-Transaction $0.503 $0.585 $0.344
Counter-Factual Fees, at Pre-Regulation Rates (billions) $16.51 $12.40 $4.11
Cost Savings from Covered Transactions ($ billions) $8.50 $7.21 $1.29
Savings as a Share of Counter-Factual Fees 51.5% 58.0% 31.7%
Savings as a Share of the Value of Transactions 0.66% 0.89% 0.26%
The same analysis applied to covered debit card transactions in the fourth quarter of 2011
shows savings of $2.06 billion in October-November-December of that year, most of it again
52
Figures may not add up due to rounding.
15
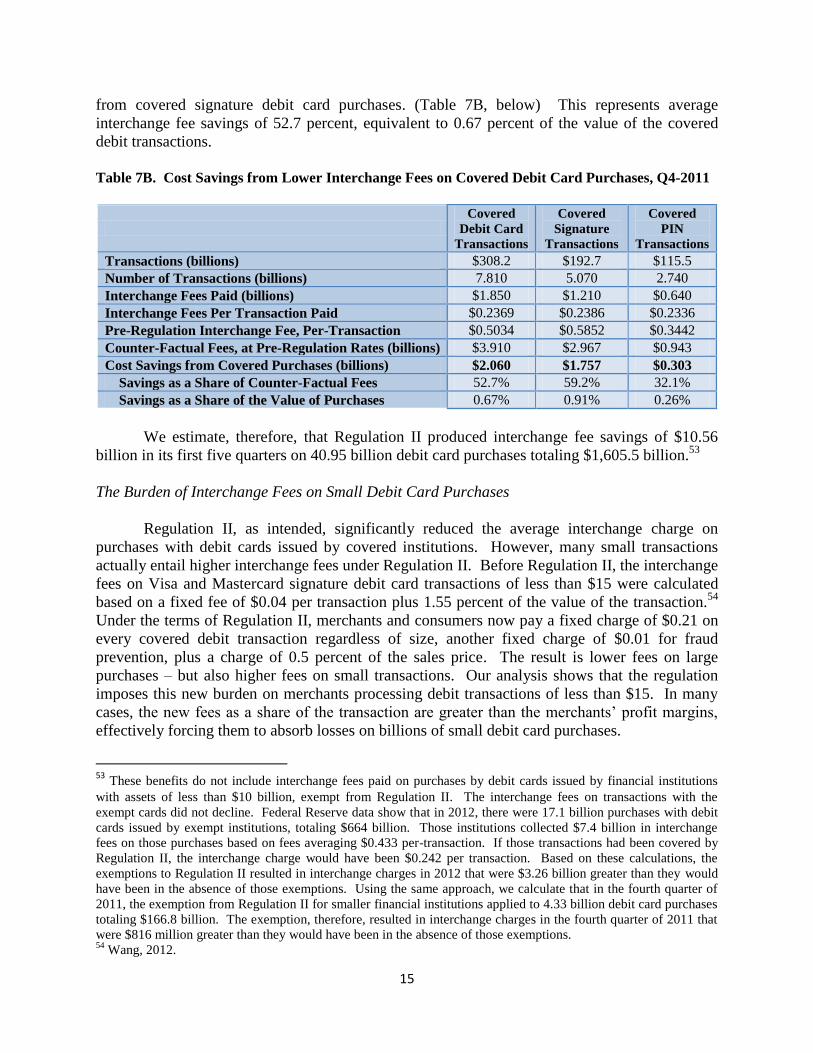
from covered signature debit card purchases. (Table 7B, below) This represents average
interchange fee savings of 52.7 percent, equivalent to 0.67 percent of the value of the covered
debit transactions.
Table 7B. Cost Savings from Lower Interchange Fees on Covered Debit Card Purchases, Q4-2011
Covered
Debit Card
Transactions
Covered
Signature
Transactions
Covered
PIN
Transactions
Transactions (billions) $308.2 $192.7 $115.5
Number of Transactions (billions) 7.810 5.070 2.740
Interchange Fees Paid (billions) $1.850 $1.210 $0.640
Interchange Fees Per Transaction Paid $0.2369 $0.2386 $0.2336
Pre-Regulation Interchange Fee, Per-Transaction $0.5034 $0.5852 $0.3442
Counter-Factual Fees, at Pre-Regulation Rates (billions) $3.910 $2.967 $0.943
Cost Savings from Covered Purchases (billions) $2.060 $1.757 $0.303
Savings as a Share of Counter-Factual Fees 52.7% 59.2% 32.1%
Savings as a Share of the Value of Purchases 0.67% 0.91% 0.26%
We estimate, therefore, that Regulation II produced interchange fee savings of $10.56
billion in its first five quarters on 40.95 billion debit card purchases totaling $1,605.5 billion.53
The Burden of Interchange Fees on Small Debit Card Purchases
Regulation II, as intended, significantly reduced the average interchange charge on
purchases with debit cards issued by covered institutions. However, many small transactions
actually entail higher interchange fees under Regulation II. Before Regulation II, the interchange
fees on Visa and Mastercard signature debit card transactions of less than $15 were calculated
based on a fixed fee of $0.04 per transaction plus 1.55 percent of the value of the transaction.54
Under the terms of Regulation II, merchants and consumers now pay a fixed charge of $0.21 on
every covered debit transaction regardless of size, another fixed charge of $0.01 for fraud
prevention, plus a charge of 0.5 percent of the sales price. The result is lower fees on large
purchases – but also higher fees on small transactions. Our analysis shows that the regulation
imposes this new burden on merchants processing debit transactions of less than $15. In many
cases, the new fees as a share of the transaction are greater than the merchants’ profit margins,
effectively forcing them to absorb losses on billions of small debit card purchases.
53 These benefits do not include interchange fees paid on purchases by debit cards issued by financial institutions
with assets of less than $10 billion, exempt from Regulation II. The interchange fees on transactions with the
exempt cards did not decline. Federal Reserve data show that in 2012, there were 17.1 billion purchases with debit
cards issued by exempt institutions, totaling $664 billion. Those institutions collected $7.4 billion in interchange
fees on those purchases based on fees averaging $0.433 per-transaction. If those transactions had been covered by
Regulation II, the interchange charge would have been $0.242 per transaction. Based on these calculations, the
exemptions to Regulation II resulted in interchange charges in 2012 that were $3.26 billion greater than they would
have been in the absence of those exemptions. Using the same approach, we calculate that in the fourth quarter of
2011, the exemption from Regulation II for smaller financial institutions applied to 4.33 billion debit card purchases
totaling $166.8 billion. The exemption, therefore, resulted in interchange charges in the fourth quarter of 2011 that
were $816 million greater than they would have been in the absence of those exemptions. 54
Wang, 2012.
16
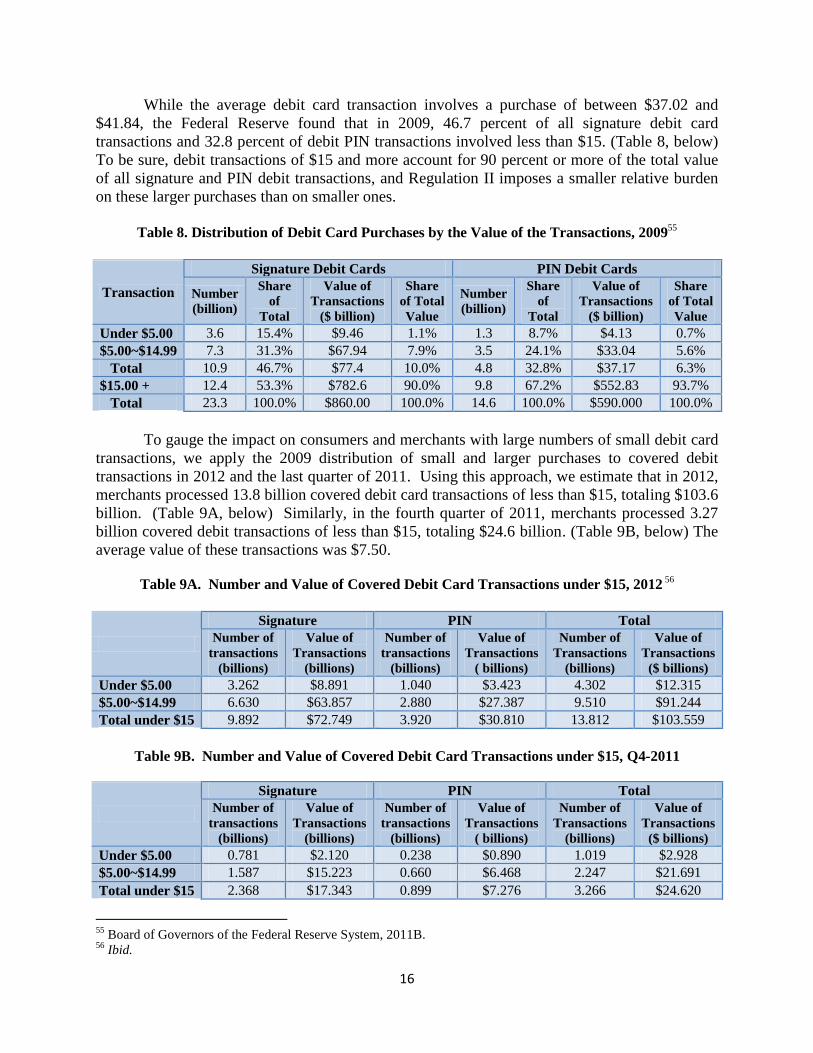
While the average debit card transaction involves a purchase of between $37.02 and
$41.84, the Federal Reserve found that in 2009, 46.7 percent of all signature debit card
transactions and 32.8 percent of debit PIN transactions involved less than $15. (Table 8, below)
To be sure, debit transactions of $15 and more account for 90 percent or more of the total value
of all signature and PIN debit transactions, and Regulation II imposes a smaller relative burden
on these larger purchases than on smaller ones.
Table 8. Distribution of Debit Card Purchases by the Value of the Transactions, 2009
55
Transaction
Signature Debit Cards PIN Debit Cards
Number
(billion)
Share
of
Total
Value of
Transactions
($ billion)
Share
of Total
Value
Number
(billion)
Share
of
Total
Value of
Transactions
($ billion)
Share
of Total
Value
Under $5.00 3.6 15.4% $9.46 1.1% 1.3 8.7% $4.13 0.7%
$5.00~$14.99 7.3 31.3% $67.94 7.9% 3.5 24.1% $33.04 5.6%
Total 10.9 46.7% $77.4 10.0% 4.8 32.8% $37.17 6.3%
$15.00 + 12.4 53.3% $782.6 90.0% 9.8 67.2% $552.83 93.7%
Total 23.3 100.0% $860.00 100.0% 14.6 100.0% $590.000 100.0%
To gauge the impact on consumers and merchants with large numbers of small debit card
transactions, we apply the 2009 distribution of small and larger purchases to covered debit
transactions in 2012 and the last quarter of 2011. Using this approach, we estimate that in 2012,
merchants processed 13.8 billion covered debit card transactions of less than $15, totaling $103.6
billion. (Table 9A, below) Similarly, in the fourth quarter of 2011, merchants processed 3.27
billion covered debit transactions of less than $15, totaling $24.6 billion. (Table 9B, below) The
average value of these transactions was $7.50.
Table 9A. Number and Value of Covered Debit Card Transactions under $15, 2012 56
Signature PIN Total
Number of
transactions
(billions)
Value of
Transactions
(billions)
Number of
transactions
(billions)
Value of
Transactions
( billions)
Number of
Transactions
(billions)
Value of
Transactions
($ billions)
Under $5.00 3.262 $8.891 1.040 $3.423 4.302 $12.315
$5.00~$14.99 6.630 $63.857 2.880 $27.387 9.510 $91.244
Total under $15 9.892 $72.749 3.920 $30.810 13.812 $103.559
Table 9B. Number and Value of Covered Debit Card Transactions under $15, Q4-2011
Signature PIN Total
Number of
transactions
(billions)
Value of
Transactions
(billions)
Number of
transactions
(billions)
Value of
Transactions
( billions)
Number of
Transactions
(billions)
Value of
Transactions
($ billions)
Under $5.00 0.781 $2.120 0.238 $0.890 1.019 $2.928
$5.00~$14.99 1.587 $15.223 0.660 $6.468 2.247 $21.691
Total under $15 2.368 $17.343 0.899 $7.276 3.266 $24.620
55
Board of Governors of the Federal Reserve System, 2011B. 56
Ibid.
17
Most of these small debit charges occur at supermarkets and groceries, convenience
stores, fast food restaurants, coffee shops, parking lots and garages, movie theaters, laundries and
dry cleaners, newsstands, printing and copy shops, car washes, and for commuter transport and
taxicab rides. Before Regulation II, debit card networks and issuers charged lower fees for small
transactions. As noted earlier, a Federal Reserve study, published in the Economics Quarterly
Journal, found that prior to Regulation II, Visa and MasterCard had charged interchange fees on
debit card sales of less than $15 that averaged 1.55 percent of the transaction’s value plus a fixed
fee of $0.04.57
In October 2011, they raised their interchange fees of smaller transactions to the
maximum level allowed under the new regulation.
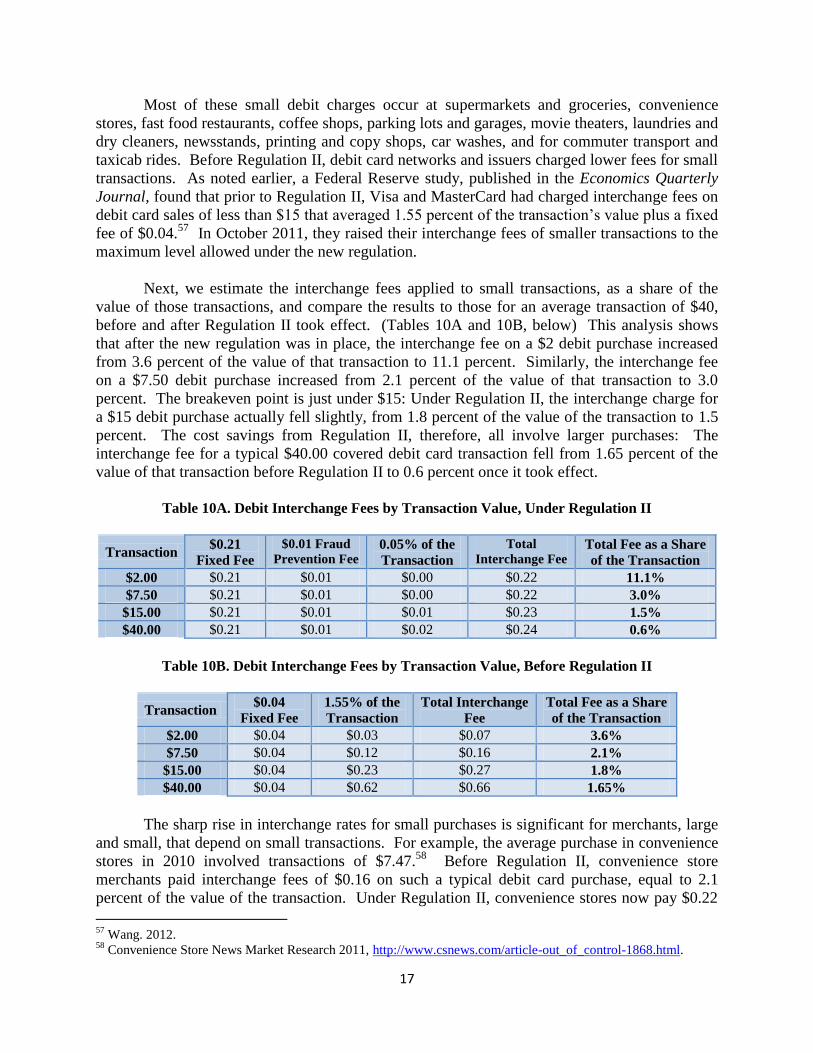
Next, we estimate the interchange fees applied to small transactions, as a share of the
value of those transactions, and compare the results to those for an average transaction of $40,
before and after Regulation II took effect. (Tables 10A and 10B, below) This analysis shows
that after the new regulation was in place, the interchange fee on a $2 debit purchase increased
from 3.6 percent of the value of that transaction to 11.1 percent. Similarly, the interchange fee
on a $7.50 debit purchase increased from 2.1 percent of the value of that transaction to 3.0
percent. The breakeven point is just under $15: Under Regulation II, the interchange charge for
a $15 debit purchase actually fell slightly, from 1.8 percent of the value of the transaction to 1.5
percent. The cost savings from Regulation II, therefore, all involve larger purchases: The
interchange fee for a typical $40.00 covered debit card transaction fell from 1.65 percent of the
value of that transaction before Regulation II to 0.6 percent once it took effect.
Table 10A. Debit Interchange Fees by Transaction Value, Under Regulation II
Transaction $0.21
Fixed Fee
$0.01 Fraud Prevention Fee
0.05% of the
Transaction
Total
Interchange Fee Total Fee as a Share
of the Transaction
$2.00 $0.21 $0.01 $0.00 $0.22 11.1%
$7.50 $0.21 $0.01 $0.00 $0.22 3.0%
$15.00 $0.21 $0.01 $0.01 $0.23 1.5%
$40.00 $0.21 $0.01 $0.02 $0.24 0.6%
Table 10B. Debit Interchange Fees by Transaction Value, Before Regulation II
Transaction $0.04
Fixed Fee
1.55% of the
Transaction
Total Interchange
Fee
Total Fee as a Share
of the Transaction
$2.00 $0.04 $0.03 $0.07 3.6%
$7.50 $0.04 $0.12 $0.16 2.1%
$15.00 $0.04 $0.23 $0.27 1.8%
$40.00 $0.04 $0.62 $0.66 1.65%
The sharp rise in interchange rates for small purchases is significant for merchants, large
and small, that depend on small transactions. For example, the average purchase in convenience
stores in 2010 involved transactions of $7.47.58
Before Regulation II, convenience store
merchants paid interchange fees of $0.16 on such a typical debit card purchase, equal to 2.1
percent of the value of the transaction. Under Regulation II, convenience stores now pay $0.22
57
Wang. 2012. 58
Convenience Store News Market Research 2011, http://www.csnews.com/article-out_of_control-1868.html.
18
on that same debit purchase, equal to 3.0 percent of the transaction’s value or twice the 1.5
percent average profit margin for convenience stores. (Table 11, below) Similarly, the average
cost of a movie ticket is $7.93.59
Under Regulation II, theater owners pay $0.22 in interchange
fees on tickets paid for with covered debit cards, equal to 2.8 percent of the ticket price,
compared to fees of $0.16 or 2.1 percent of the price before Regulation II. The current
interchange fee on such a transaction is equal to two-thirds of the 4.2 percent average profit
margin for movie theaters.
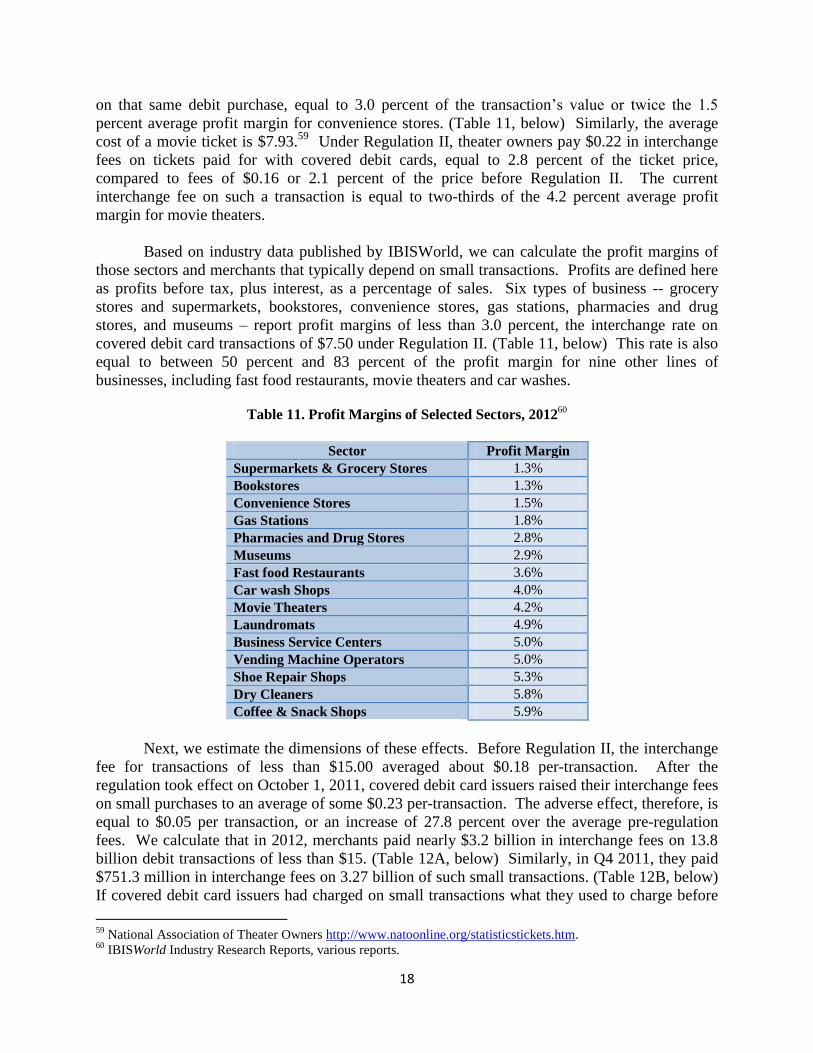
Based on industry data published by IBISWorld, we can calculate the profit margins of
those sectors and merchants that typically depend on small transactions. Profits are defined here
as profits before tax, plus interest, as a percentage of sales. Six types of business -- grocery
stores and supermarkets, bookstores, convenience stores, gas stations, pharmacies and drug
stores, and museums – report profit margins of less than 3.0 percent, the interchange rate on
covered debit card transactions of $7.50 under Regulation II. (Table 11, below) This rate is also
equal to between 50 percent and 83 percent of the profit margin for nine other lines of
businesses, including fast food restaurants, movie theaters and car washes.
Table 11. Profit Margins of Selected Sectors, 201260
Sector Profit Margin
Supermarkets & Grocery Stores 1.3%
Bookstores 1.3%
Convenience Stores 1.5%
Gas Stations 1.8%
Pharmacies and Drug Stores 2.8%
Museums 2.9%
Fast food Restaurants 3.6%
Car wash Shops 4.0%
Movie Theaters 4.2%
Laundromats 4.9%
Business Service Centers 5.0%
Vending Machine Operators 5.0%
Shoe Repair Shops 5.3%
Dry Cleaners 5.8%
Coffee & Snack Shops 5.9%
Next, we estimate the dimensions of these effects. Before Regulation II, the interchange
fee for transactions of less than $15.00 averaged about $0.18 per-transaction. After the
regulation took effect on October 1, 2011, covered debit card issuers raised their interchange fees
on small purchases to an average of some $0.23 per-transaction. The adverse effect, therefore, is
equal to $0.05 per transaction, or an increase of 27.8 percent over the average pre-regulation
fees. We calculate that in 2012, merchants paid nearly $3.2 billion in interchange fees on 13.8
billion debit transactions of less than $15. (Table 12A, below) Similarly, in Q4 2011, they paid
$751.3 million in interchange fees on 3.27 billion of such small transactions. (Table 12B, below)
If covered debit card issuers had charged on small transactions what they used to charge before
59
National Association of Theater Owners http://www.natoonline.org/statisticstickets.htm. 60
IBISWorld Industry Research Reports, various reports.
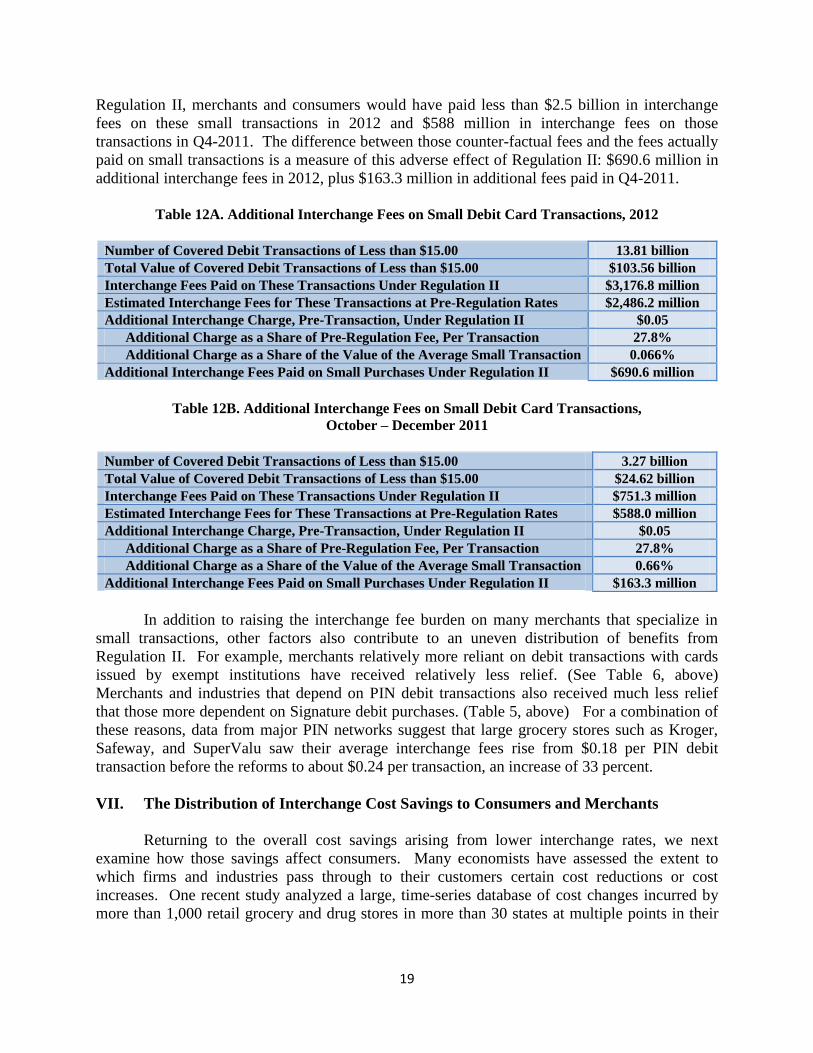
19
Regulation II, merchants and consumers would have paid less than $2.5 billion in interchange
fees on these small transactions in 2012 and $588 million in interchange fees on those
transactions in Q4-2011. The difference between those counter-factual fees and the fees actually
paid on small transactions is a measure of this adverse effect of Regulation II: $690.6 million in
additional interchange fees in 2012, plus $163.3 million in additional fees paid in Q4-2011.
Table 12A. Additional Interchange Fees on Small Debit Card Transactions, 2012
Number of Covered Debit Transactions of Less than $15.00 13.81 billion
Total Value of Covered Debit Transactions of Less than $15.00 $103.56 billion
Interchange Fees Paid on These Transactions Under Regulation II $3,176.8 million
Estimated Interchange Fees for These Transactions at Pre-Regulation Rates $2,486.2 million
Additional Interchange Charge, Pre-Transaction, Under Regulation II $0.05
Additional Charge as a Share of Pre-Regulation Fee, Per Transaction 27.8%
Additional Charge as a Share of the Value of the Average Small Transaction 0.066%
Additional Interchange Fees Paid on Small Purchases Under Regulation II $690.6 million
Table 12B. Additional Interchange Fees on Small Debit Card Transactions,
October – December 2011
Number of Covered Debit Transactions of Less than $15.00 3.27 billion
Total Value of Covered Debit Transactions of Less than $15.00 $24.62 billion
Interchange Fees Paid on These Transactions Under Regulation II $751.3 million
Estimated Interchange Fees for These Transactions at Pre-Regulation Rates $588.0 million
Additional Interchange Charge, Pre-Transaction, Under Regulation II $0.05
Additional Charge as a Share of Pre-Regulation Fee, Per Transaction 27.8%
Additional Charge as a Share of the Value of the Average Small Transaction 0.66%
Additional Interchange Fees Paid on Small Purchases Under Regulation II $163.3 million
In addition to raising the interchange fee burden on many merchants that specialize in
small transactions, other factors also contribute to an uneven distribution of benefits from
Regulation II. For example, merchants relatively more reliant on debit transactions with cards
issued by exempt institutions have received relatively less relief. (See Table 6, above)
Merchants and industries that depend on PIN debit transactions also received much less relief
that those more dependent on Signature debit purchases. (Table 5, above) For a combination of
these reasons, data from major PIN networks suggest that large grocery stores such as Kroger,
Safeway, and SuperValu saw their average interchange fees rise from $0.18 per PIN debit
transaction before the reforms to about $0.24 per transaction, an increase of 33 percent.
VII. The Distribution of Interchange Cost Savings to Consumers and Merchants
Returning to the overall cost savings arising from lower interchange rates, we next
examine how those savings affect consumers. Many economists have assessed the extent to
which firms and industries pass through to their customers certain cost reductions or cost
increases. One recent study analyzed a large, time-series database of cost changes incurred by
more than 1,000 retail grocery and drug stores in more than 30 states at multiple points in their
20
distribution networks.61
The researchers estimated the “elasticity” for the pass-through – how
much retail prices change in response to merchants’ cost savings – based on 23,147 cases of
promotions which reduced costs for grocery and drug store merchants. They found a distribution
of pass-through rates, ranging from 0.25 for the 10th
percentile to 1.14 for the 90th
percentile,
with an average pass-through rate from retailers to customers of 0.69: When a merchant’s costs
were reduced by $1.00, they responded by cutting prices for customers by $0.69. The study also
found that market structure and competition have only modest effects of pass-through rates. The
study’s results were consistent with theoretical work in this area and other empirical studies
using smaller databases.62
Using the average pass-through rate of 0.69, we can estimate the benefits of Regulation II
for consumers and merchants. As noted earlier, Regulation II produced $2.06 billion in cost-
savings from lower average debit interchange charges in Q4-2011 and savings of $8.5 billion in
2012. With this pass-through rate of 0.69, we estimate that Regulation II saved consumers
$1.42 billion in Q4-2011 and $5.87 billion in 2012. (Table 13) The pass-through to consumers
in the form of lower prices also affects employment: Consumers increase their demand by a
comparable amount, resulting in $5.87 billion in additional spending in 2012. The Census
Bureau reports that labor accounts for 16.4 percent of all revenues for all manufacturing and non-
manufacturing sectors.63
Therefore, the pass-through to consumers could support $962 million
in additional labor costs. Using the 2012 average annual wage of $44,600 for all sectors, the
cost-savings from Regulation II in 2012 would support up to 21,566 additional jobs.64
The $2.42
billion retained by merchants in 2012 presumably was used to improve their profitability, which
in turn would increase their spending which consequently would lead to new jobs. Here, we
assume that half of the retained cost-savings flow through to higher spending by merchants, and
again use the Census Bureau estimate that 16.4 percent of revenues for all sectors go to labor.
Merchants also would use their retained savings to directly hire additional workers or raise
wages, as well as to purchase new equipment and otherwise expand their businesses, also
stimulating additional employment. We assume that one-quarter of the remaining retained
earnings ultimately went to labor, and apply the 2012 average annual wage for all retail
businesses of $29,700. We estimate, therefore, that the savings for merchants could finance an
additional 15,935 jobs.65
All told, therefore, the reduction in overall interchange fees arising
from Regulation II was sufficient in 2012 to support the creation of 37,501 jobs.
61
Nijs et al. 2009. 62
For example, Werden et al. (2006) and Besanko et al. (2005). Many economic studies have also found evidence
that retailers do not change their prices quickly in response to cost changes which they believe may not be lasting
ones. For example, a 2008 study estimated the frequency of price changes using confidential databases of price data
for 1998 to 2005 from the Bureau of Labor Statistics. (Nakamura and Steinsson. 2008). They found that prices for
all products change, on average, once every 11 months, with average periods ranging from two weeks for vehicle
fuel to 27.3 months for apparel. In the case of interchange fees, however, we would expect the price adjustment to
occur fairly quickly, since it reflects a “permanent” change in Federal law and Federal Reserve regulation. 63
U.S. Census Bureau, Industry Statistics Sampler; http://www.census.gov/econ/industry/def/d44-45.htm 64
Bureau of Labor Statistics, Occupational Employment Statistics. 65
For example, we calculated these estimate as follows. Consumers: $8.50 billion * 0.69 = $5.87 billion * 0.164 =
$962.68 billion / $44,600 = 21,585 jobs; Merchants: $8.50 billion * 0.31 = $2.64 billon, * 0.5 * 0.164 = $216.48
million / $44,600 = 4,854 jobs) + $2.64 billion * 0.5 * 0.25 = $330.0 million / $29,700 = 11,111). 4,864 + 11,111 =
15,965 jobs.
21
The same analysis for Q4-2011 finds that the savings from lower average interchange
rates in October-November-December of 2011 would support 5,227 additional jobs from the
pass-through to consumers, and an additional 3,862 jobs from half of the savings retained by
merchants. All told, the reduction in interchange fees arising from Regulation II was sufficient
in Q4-2011 to support the creation of 9,088 additional jobs. (Table 13, below)
We also examined the impact under Regulation II of the high fixed fee which sharply
increases the interchange charge for purchases of less than $15. We estimate that if the
interchange fee on small transactions had not increased under Regulation II, the additional cost
savings of $690 million in 2012 could have supported an additional 3,044 jobs. (Table 13,
below) This change also would have increased the savings in Q4-2011 by $163 million, which
could have supported an additional 719 jobs.
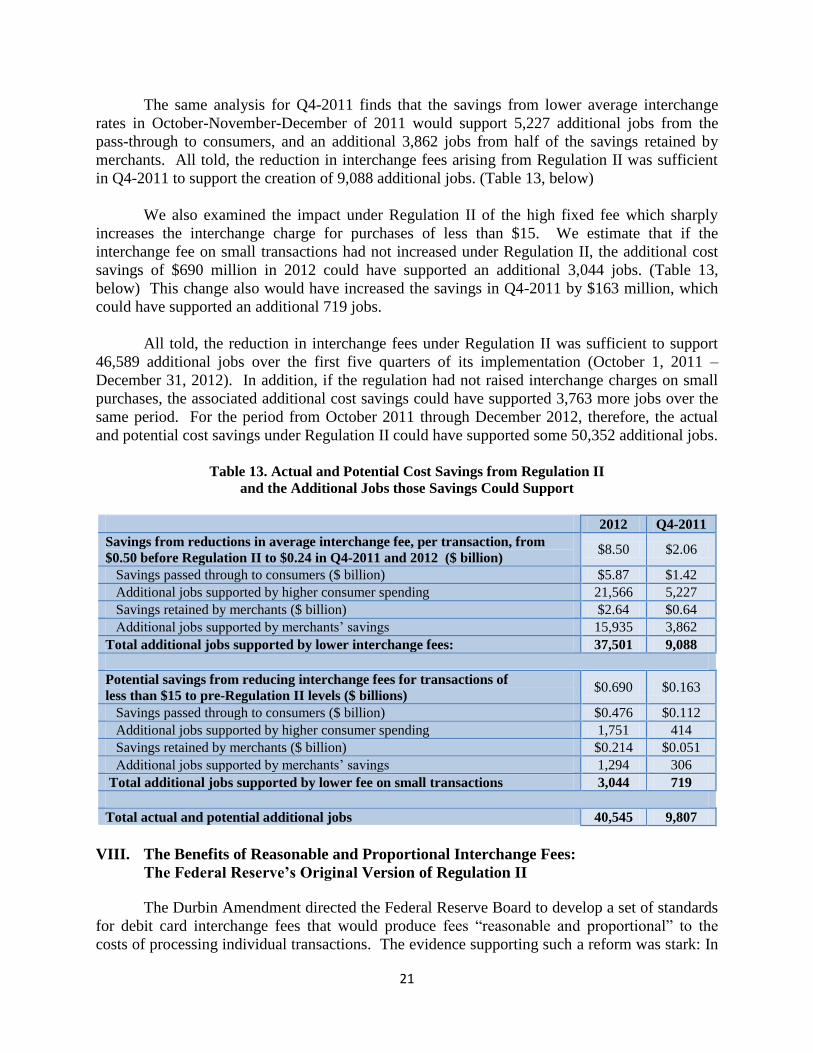
All told, the reduction in interchange fees under Regulation II was sufficient to support
46,589 additional jobs over the first five quarters of its implementation (October 1, 2011 –
December 31, 2012). In addition, if the regulation had not raised interchange charges on small
purchases, the associated additional cost savings could have supported 3,763 more jobs over the
same period. For the period from October 2011 through December 2012, therefore, the actual
and potential cost savings under Regulation II could have supported some 50,352 additional jobs.
Table 13. Actual and Potential Cost Savings from Regulation II
and the Additional Jobs those Savings Could Support
2012 Q4-2011
Savings from reductions in average interchange fee, per transaction, from
$0.50 before Regulation II to $0.24 in Q4-2011 and 2012 ($ billion) $8.50 $2.06
Savings passed through to consumers ($ billion) $5.87 $1.42
Additional jobs supported by higher consumer spending 21,566 5,227
Savings retained by merchants ($ billion) $2.64 $0.64
Additional jobs supported by merchants’ savings 15,935 3,862
Total additional jobs supported by lower interchange fees: 37,501 9,088
Potential savings from reducing interchange fees for transactions of
less than $15 to pre-Regulation II levels ($ billions) $0.690 $0.163
Savings passed through to consumers ($ billion) $0.476 $0.112
Additional jobs supported by higher consumer spending 1,751 414
Savings retained by merchants ($ billion) $0.214 $0.051
Additional jobs supported by merchants’ savings 1,294 306
Total additional jobs supported by lower fee on small transactions 3,044 719
Total actual and potential additional jobs 40,545 9,807
VIII. The Benefits of Reasonable and Proportional Interchange Fees:
The Federal Reserve’s Original Version of Regulation II
The Durbin Amendment directed the Federal Reserve Board to develop a set of standards
for debit card interchange fees that would produce fees “reasonable and proportional” to the
costs of processing individual transactions. The evidence supporting such a reform was stark: In
22
2011, before Regulation II went into effect, the costs of authorizing, clearing and settling debit
transactions averaged $0.05 per-transaction, compared to interchange fees averaging $0.48 per
transaction. For setting new rates, the Board was instructed to consider the “incremental cost
incurred by an issuer for the role of the issuer in the authorization, clearance, or settlement of a
particular electronic debit transaction,” and an adjustment to cover “costs incurred by the issuer
in preventing fraud in relation to electronic debit transactions.”66
Congress also directed the
Board to not include or consider any costs not “specific to a particular electronic debit
transaction,” such as card member rewards or other incentives.
As noted earlier, in December 2010, the Federal Reserve Board issued a proposed rule
providing two alternative standards for determining whether an interchange fee was “reasonable
and proportional” to the costs of processing a debit card transaction. Under Alternative 1, debit
card issuers could charge a safe harbor interchange fee of $0.07 per transaction or a fee of up to
$0.12 depending on the issuer’s “allowable costs” for authorizing, clearing and settling debit
transactions. Alternative 2 simply capped interchange fees at $0.12 per transaction. These
options were drawn from a September 2010 Fed survey which found that debit card issuers in
2009 had incurred authorization, clearance and settlement costs averaging $0.04 per transaction
and median costs of $0.07, with issuers in the 80th
percentile reporting costs of $0.12 per
transaction. The Board concluded that a safe harbor set at the $0.07 median cost and a $0.12 cap
would ensure that almost all issuers would cover their variable costs. In so doing, the Board
determined to not consider other expenses incurred by card issuers, such as network processing,
fraud, fraud prevention, and transaction monitoring, as well as cardholder benefits and rewards.
The proposed rule drew thousands of comments and what the Washington Post described
as a massive and aggressive lobbying campaign by the financial services industry.67
On June 29,
2011, following that campaign, the Board issued a final rule that differed markedly from the
original proposal. The final rule caps debit card interchange fees at $0.21 per transaction, plus 5
basis points of the value of the transaction, and an additional $0.01 fee for card issuers that meet
certain fraud-prevention standards. Under the new standard, the interchange fee on an average
debit card transaction of $38 is $0.24, twice the cap under the Board’s original proposed rule.
In propounding the final rule, the Board said it had “revisited” its previous interpretation
of the Durbin Amendment as requiring that the Board distinguish between the incremental costs
of processing a debit transaction and other expenses by card issuers not specific to a particular
transaction. Under its new interpretation, the Board took into account a card issuer’s network
processing fees and transaction monitoring costs as well as fraud and fraud prevention costs.
The Board said that these additional expenses, while not “incremental” costs, are nevertheless
“specific to a particular transaction” and thus could be considered under the Durbin Amendment.
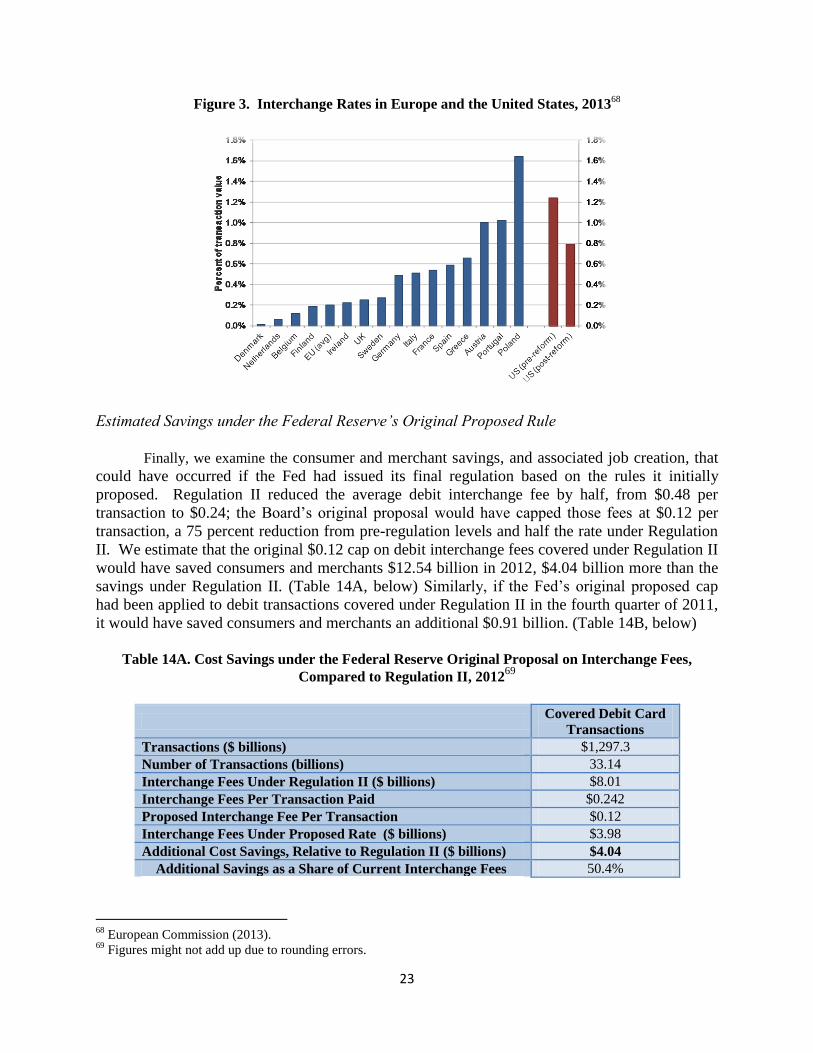
The results are U.S. debit card interchange fees which remain among the highest in the
world. A recent survey of 15 European nations and the United States found that the debit
interchange fees under the new American standard are four times the European Union average.
(Figure 3, below) Across Europe, only card issuers in Poland, Portugal and Austria charge higher
interchange fees than their American counterparts under Regulation II.
66
Dodd-Frank Act (2010). 67
Mui (2011).
23
Figure 3. Interchange Rates in Europe and the United States, 201368
Estimated Savings under the Federal Reserve’s Original Proposed Rule
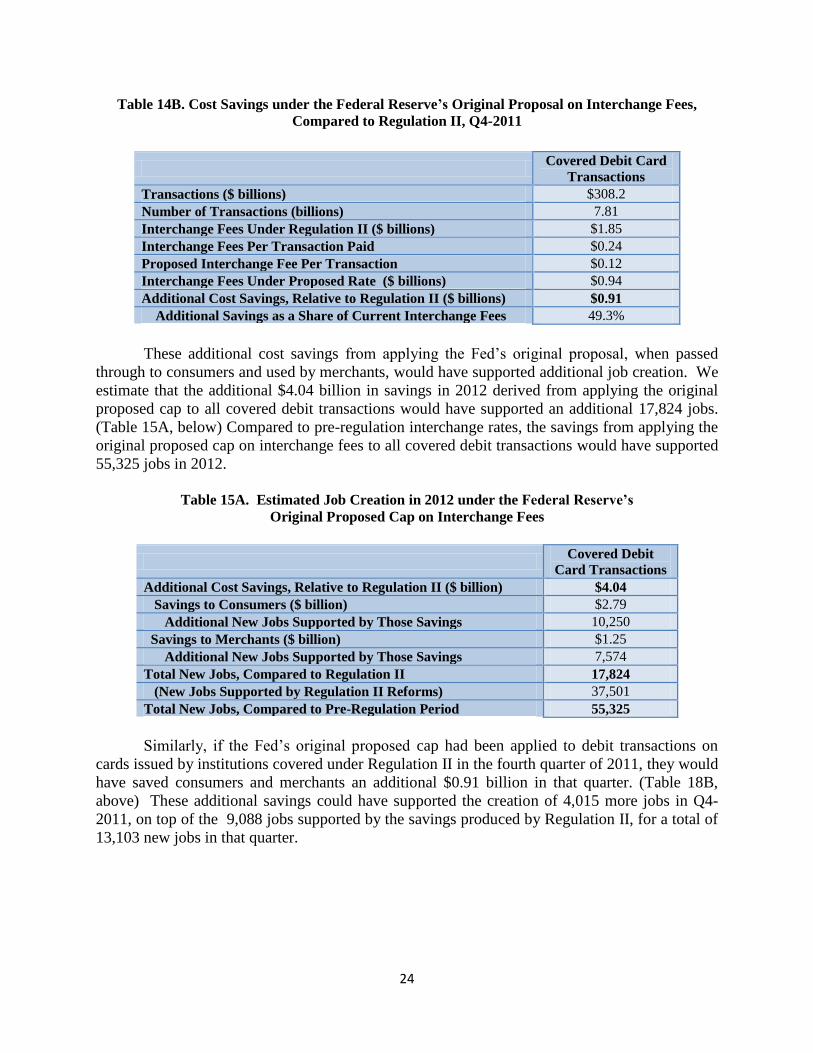
Finally, we examine the consumer and merchant savings, and associated job creation, that
could have occurred if the Fed had issued its final regulation based on the rules it initially
proposed. Regulation II reduced the average debit interchange fee by half, from $0.48 per
transaction to $0.24; the Board’s original proposal would have capped those fees at $0.12 per
transaction, a 75 percent reduction from pre-regulation levels and half the rate under Regulation
II. We estimate that the original $0.12 cap on debit interchange fees covered under Regulation II
would have saved consumers and merchants $12.54 billion in 2012, $4.04 billion more than the
savings under Regulation II. (Table 14A, below) Similarly, if the Fed’s original proposed cap
had been applied to debit transactions covered under Regulation II in the fourth quarter of 2011,
it would have saved consumers and merchants an additional $0.91 billion. (Table 14B, below)
Table 14A. Cost Savings under the Federal Reserve Original Proposal on Interchange Fees,
Compared to Regulation II, 201269
Covered Debit Card
Transactions
Transactions ($ billions) $1,297.3
Number of Transactions (billions) 33.14
Interchange Fees Under Regulation II ($ billions) $8.01
Interchange Fees Per Transaction Paid $0.242
Proposed Interchange Fee Per Transaction $0.12
Interchange Fees Under Proposed Rate ($ billions) $3.98
Additional Cost Savings, Relative to Regulation II ($ billions) $4.04
Additional Savings as a Share of Current Interchange Fees 50.4%
68
European Commission (2013). 69
Figures might not add up due to rounding errors.
24
Table 14B. Cost Savings under the Federal Reserve’s Original Proposal on Interchange Fees,
Compared to Regulation II, Q4-2011
Covered Debit Card
Transactions
Transactions ($ billions) $308.2
Number of Transactions (billions) 7.81
Interchange Fees Under Regulation II ($ billions) $1.85
Interchange Fees Per Transaction Paid $0.24
Proposed Interchange Fee Per Transaction $0.12
Interchange Fees Under Proposed Rate ($ billions) $0.94
Additional Cost Savings, Relative to Regulation II ($ billions) $0.91
Additional Savings as a Share of Current Interchange Fees 49.3%
These additional cost savings from applying the Fed’s original proposal, when passed
through to consumers and used by merchants, would have supported additional job creation. We
estimate that the additional $4.04 billion in savings in 2012 derived from applying the original
proposed cap to all covered debit transactions would have supported an additional 17,824 jobs.
(Table 15A, below) Compared to pre-regulation interchange rates, the savings from applying the
original proposed cap on interchange fees to all covered debit transactions would have supported
55,325 jobs in 2012.
Table 15A. Estimated Job Creation in 2012 under the Federal Reserve’s
Original Proposed Cap on Interchange Fees
Covered Debit
Card Transactions
Additional Cost Savings, Relative to Regulation II ($ billion) $4.04
Savings to Consumers ($ billion) $2.79
Additional New Jobs Supported by Those Savings 10,250
Savings to Merchants ($ billion) $1.25
Additional New Jobs Supported by Those Savings 7,574
Total New Jobs, Compared to Regulation II 17,824
(New Jobs Supported by Regulation II Reforms) 37,501
Total New Jobs, Compared to Pre-Regulation Period 55,325
Similarly, if the Fed’s original proposed cap had been applied to debit transactions on
cards issued by institutions covered under Regulation II in the fourth quarter of 2011, they would
have saved consumers and merchants an additional $0.91 billion in that quarter. (Table 18B,
above) These additional savings could have supported the creation of 4,015 more jobs in Q4-
2011, on top of the 9,088 jobs supported by the savings produced by Regulation II, for a total of
13,103 new jobs in that quarter.
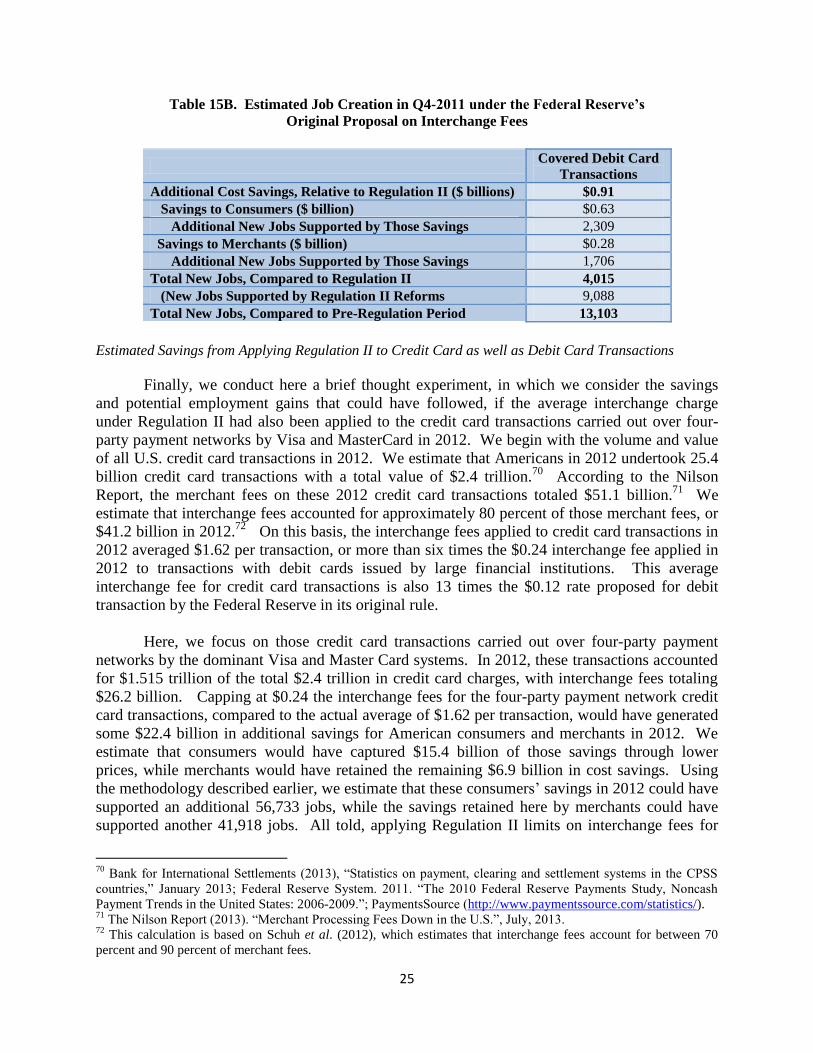
25
Table 15B. Estimated Job Creation in Q4-2011 under the Federal Reserve’s
Original Proposal on Interchange Fees
Covered Debit Card
Transactions
Additional Cost Savings, Relative to Regulation II ($ billions) $0.91
Savings to Consumers ($ billion) $0.63
Additional New Jobs Supported by Those Savings 2,309
Savings to Merchants ($ billion) $0.28
Additional New Jobs Supported by Those Savings 1,706
Total New Jobs, Compared to Regulation II 4,015
(New Jobs Supported by Regulation II Reforms 9,088
Total New Jobs, Compared to Pre-Regulation Period 13,103
Estimated Savings from Applying Regulation II to Credit Card as well as Debit Card Transactions
Finally, we conduct here a brief thought experiment, in which we consider the savings
and potential employment gains that could have followed, if the average interchange charge
under Regulation II had also been applied to the credit card transactions carried out over four-
party payment networks by Visa and MasterCard in 2012. We begin with the volume and value
of all U.S. credit card transactions in 2012. We estimate that Americans in 2012 undertook 25.4
billion credit card transactions with a total value of $2.4 trillion.70
According to the Nilson
Report, the merchant fees on these 2012 credit card transactions totaled $51.1 billion.71
We
estimate that interchange fees accounted for approximately 80 percent of those merchant fees, or
$41.2 billion in 2012.72
On this basis, the interchange fees applied to credit card transactions in
2012 averaged $1.62 per transaction, or more than six times the $0.24 interchange fee applied in
2012 to transactions with debit cards issued by large financial institutions. This average
interchange fee for credit card transactions is also 13 times the $0.12 rate proposed for debit
transaction by the Federal Reserve in its original rule.
Here, we focus on those credit card transactions carried out over four-party payment
networks by the dominant Visa and Master Card systems. In 2012, these transactions accounted
for $1.515 trillion of the total $2.4 trillion in credit card charges, with interchange fees totaling
$26.2 billion. Capping at $0.24 the interchange fees for the four-party payment network credit
card transactions, compared to the actual average of $1.62 per transaction, would have generated
some $22.4 billion in additional savings for American consumers and merchants in 2012. We
estimate that consumers would have captured $15.4 billion of those savings through lower
prices, while merchants would have retained the remaining $6.9 billion in cost savings. Using
the methodology described earlier, we estimate that these consumers’ savings in 2012 could have
supported an additional 56,733 jobs, while the savings retained here by merchants could have
supported another 41,918 jobs. All told, applying Regulation II limits on interchange fees for
70
Bank for International Settlements (2013), “Statistics on payment, clearing and settlement systems in the CPSS
countries,” January 2013; Federal Reserve System. 2011. “The 2010 Federal Reserve Payments Study, Noncash
Payment Trends in the United States: 2006-2009.”; PaymentsSource (http://www.paymentssource.com/statistics/). 71
The Nilson Report (2013). “Merchant Processing Fees Down in the U.S.”, July, 2013. 72
This calculation is based on Schuh et al. (2012), which estimates that interchange fees account for between 70
percent and 90 percent of merchant fees.
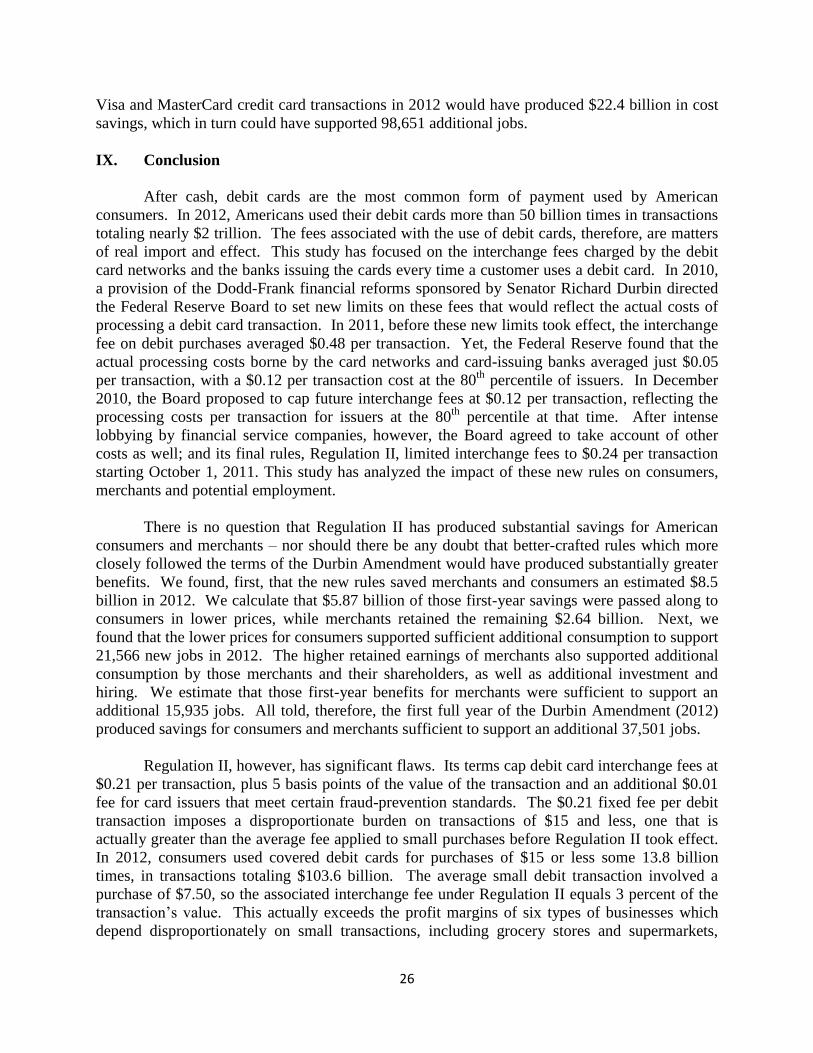
26
Visa and MasterCard credit card transactions in 2012 would have produced $22.4 billion in cost
savings, which in turn could have supported 98,651 additional jobs.
IX. Conclusion
After cash, debit cards are the most common form of payment used by American
consumers. In 2012, Americans used their debit cards more than 50 billion times in transactions
totaling nearly $2 trillion. The fees associated with the use of debit cards, therefore, are matters
of real import and effect. This study has focused on the interchange fees charged by the debit
card networks and the banks issuing the cards every time a customer uses a debit card. In 2010,
a provision of the Dodd-Frank financial reforms sponsored by Senator Richard Durbin directed
the Federal Reserve Board to set new limits on these fees that would reflect the actual costs of
processing a debit card transaction. In 2011, before these new limits took effect, the interchange
fee on debit purchases averaged $0.48 per transaction. Yet, the Federal Reserve found that the
actual processing costs borne by the card networks and card-issuing banks averaged just $0.05
per transaction, with a $0.12 per transaction cost at the 80th
percentile of issuers. In December
2010, the Board proposed to cap future interchange fees at $0.12 per transaction, reflecting the
processing costs per transaction for issuers at the 80th
percentile at that time. After intense
lobbying by financial service companies, however, the Board agreed to take account of other
costs as well; and its final rules, Regulation II, limited interchange fees to $0.24 per transaction
starting October 1, 2011. This study has analyzed the impact of these new rules on consumers,
merchants and potential employment.
There is no question that Regulation II has produced substantial savings for American
consumers and merchants – nor should there be any doubt that better-crafted rules which more
closely followed the terms of the Durbin Amendment would have produced substantially greater
benefits. We found, first, that the new rules saved merchants and consumers an estimated $8.5
billion in 2012. We calculate that $5.87 billion of those first-year savings were passed along to
consumers in lower prices, while merchants retained the remaining $2.64 billion. Next, we
found that the lower prices for consumers supported sufficient additional consumption to support
21,566 new jobs in 2012. The higher retained earnings of merchants also supported additional
consumption by those merchants and their shareholders, as well as additional investment and
hiring. We estimate that those first-year benefits for merchants were sufficient to support an
additional 15,935 jobs. All told, therefore, the first full year of the Durbin Amendment (2012)
produced savings for consumers and merchants sufficient to support an additional 37,501 jobs.
Regulation II, however, has significant flaws. Its terms cap debit card interchange fees at
$0.21 per transaction, plus 5 basis points of the value of the transaction and an additional $0.01
fee for card issuers that meet certain fraud-prevention standards. The $0.21 fixed fee per debit
transaction imposes a disproportionate burden on transactions of $15 and less, one that is
actually greater than the average fee applied to small purchases before Regulation II took effect.
In 2012, consumers used covered debit cards for purchases of $15 or less some 13.8 billion
times, in transactions totaling $103.6 billion. The average small debit transaction involved a
purchase of $7.50, so the associated interchange fee under Regulation II equals 3 percent of the
transaction’s value. This actually exceeds the profit margins of six types of businesses which
depend disproportionately on small transactions, including grocery stores and supermarkets,
27
bookstores, convenience stores, gas stations, pharmacies and drug stores, and museums. The
interchange fee on covered debit transactions of $7.50 is also equal to between 50 percent and 83
percent of the profit margins for nine other lines of businesses, including fast food restaurants,
movie theaters and car washes. We found that if Regulation II had left the interchange fees on
small debit transactions unchanged, merchants and consumers would have saved an additional
$690 million in 2012; and those additional, first-year savings could have supported 3,044 more
jobs in 2012. The Durbin Amendment surely was not intended to force merchants to take losses
on billions of purchases every year, and Congress or the Federal Reserve Board should reduce
the current high fixed fee.
We also analyzed the benefits which American consumers and merchants would have
derived if the Federal Reserve Board had not revised its original proposed rule, which had
capped interchange fees at $0.12 per covered debit card transaction based on the actual costs of
processing those transactions. We found that this original rule would have produced additional
first-year cost savings of $4.04 billion (2012). Some $2.79 billion of that total would have been
passed through to consumers in lower prices, and we found that the consequent additional
consumption would have been sufficient to support 10,250 new jobs. We further estimate that
merchants would have retained the remaining $1.25 billion in cost savings; and the additional
consumption, investment and hiring based on those savings could have supported 7,574 more
jobs. The Board’s original proposal for covered debit card interchange fees, therefore, would
have generated sufficient first-year savings to support an additional 17,818 jobs, on top of the
37,501 jobs supported by the savings from Regulation II. Therefore, the Federal Reserve’s
original proposal capping debit card interchange fees to reflect the actual costs of authorizing,
clearing and settling these transactions, as directed by the Durbin Amendment, would have
produced first-year savings for consumers and merchants sufficient to support 55,325 jobs.
Finally, we considered the potential savings and employment benefits from capping
interchange fees for those credit card transactions carried out over four-party payment networks,
by Visa and MasterCard, at the $0.24 per-transaction level applied to covered debit transactions.
Since current interchange fees for credit card transactions are much higher than the fees for debit
transactions before the Durbin Amendment, extending the $0.24 cap under Regulation II to most
credit card transactions would generate large savings. We found that if the Regulation II cap had
covered these credit card transactions in 2012, American consumers and merchants would have
saved some $22.4 billion in interchange fees. Consumers would have captured an estimated
$15.4 billion of those first-year savings through lower prices, which would have been sufficient
to support 56,733 more jobs. Similarly, the $6.9 billion in first-year cost savings retained by
merchants could have supported another 41,918 jobs. Analysis shows, therefore, that applying
Regulation II limits on interchange fees to all credit card transactions in 2012 would have
produced sufficient cost savings for consumers and merchants to support an estimated 98,651
new jobs.
The Congress was right to direct the Federal Reserve Board to regulate debit card
interchange fees to closely reflect the costs of authorizing, clearing and settling debit
transactions. Regulation II produced substantial savings for American consumers and
merchants, which in turn were sufficient to support significant employment gains. However, the
new rules remain flawed: They cap the interchange fee for covered debit transactions at twice
28
the amount they originally recommended and raise the fee on small transactions. Congress and
the Federal Reserve Board should revisit the matter of interchange fees to address these
deficiencies.
29
References
Baer, Justin. “Visa and MasterCard shares lifted by Fed's 21 cents cap on debit fees,” Financial
Times, June 30, 2011.
Bank of Spain, data,
http://www.bde.es/f/webbde/SPA/sispago/ficheros/en/estadisticas_ingles.pdf.
Bank for International Settlements (2013). “Statistics on payment, clearing and settlement
systems in the CPSS countries,” January 2013
Baxter, William F. (1983) “Bank Interchange of Transactional Paper: Legal and Economic
Perspectives,” Journal of Law and Economics, 26(3): 541-588.
Besanko, David, Jena-Pierre Dube, and Sachin Gupta. 2005. “Own-Brand and Cross-Brand
Retail Pass-Through.” Marketing Science
Board of Governors of the Federal Reserve System. 2013A. “2011 Interchange Fee Revenue,
Covered Issuer and Merchant Fraud Losses to Debit Card Transactions.” March 5.
______. 2013B. “Average Debit Card Interchange Fee by Payment Card Network.” Regulation
II (Debit Card Interchange Fees and Routing)
______. 2011. “The 2010 Federal Reserve Payment Study, Noncash Payment Trends in the
United States, 2006-2009.” Research Sponsored by the Federal Reserve System.
______. 2010. “2009 Interchange Revenue, Covered Issuer Cost, and Covered Issuer and
Merchant Fraud Loss Related to Debit Card Transactions.”
______ . Survey of Consumer Finances.
__________. June 29, 2011. “Federal Reserve issues a final rule establishing standards for debit
card interchange fees and prohibiting network exclusivity arrangements and routing restrictions,”
press release, http://federalreserve.gov/newsevents/press/bcreg/20110629a.htm.
Chang, Howard, David S. Evans, and Daniel D. Garcia Swartz (2005). “The Effect of Regulatory
Intervention in Two-Sided Markets: An Assessment of Interchange-Fee Capping in Australia,”
Review of Network Economics Vol. 4, Issue 4.
Congressional Record, Proceedings and Debates of the 111th Congress, Second Session, May
13, 2010 http://beta.congress.gov/crec/2010/05/13/CREC-2010-05-13.pdf.
Convenience Store News Market Research 2011, http://www.csnews.com/article-out_of_control-
1868.html.
30
European Commission (2013A). “Proposal for a Regulation of the European Parliament and of
the Council on interchange fees for card-based payment transactions: Impact Assessment,” July
24, 2013. http://ec.europa.eu/danmark/documents/alle_emner/okonomisk/130724_impact-
assessment-full-text_en.pdf.
__________ (2013B). Europa press release database, 24 July 2013. http://europa.eu/rapid/press-
release_IP-13-730_en.htm;
__________ (2010). Europa press release database. 8 December 2010.
http://europa.eu/rapid/press-release_IP-10-1684_en.htm
__________ (2009). Europa press release database, 1 April 2009. http://europa.eu/rapid/press-
release_IP-09-515_en.htm
__________ (2007). Europa press release database, 19 December 2007.
http://europa.eu/rapid/press-release_IP-07-1959_en.htm
__________ (2006). Interim Report I Payment Cards: Sector Inquiry under Article 17 Regulation
1/2003 on retail banking, April 12, 2006.
http://ec.europa.eu/competition/sectors/financial_services/inquiries/interim_report_1.pdf.
Finkle, Victoria (2012). “Down, But Not Out: Visa Tries to Claw Back PIN Debit Business.”
American Banker. August 10, 2012. http://www.americanbanker.com/issues/177_155/visa-
tries-to-claw-back-pin-debit-business-1051755-1.html?zkPrintable=1&nopagination=1
GAO. 2012. “Community Banks and Credit Unions, Impact of the Dodd-Frank Act Depends
Largely on Future Rule Making.” Report to Congressional Requesters, September 2012.
IBISWorld Industry Research Reports.
MasterCard. “U.S. Merchant Interchange Lawsuit”
http://www.mastercard.com/us/company/en/newsroom/us_merchant_interchange_lawsuit.html.
McAndrews, James and Zhu Wang (2012) “The Economics of Two-Sided Payment Card
Markets: Pricing, Adoption and Usage,” Working Paper 12-06, Federal Reserve Bank of
Richmond.
Mui, Ylan Q. 2011. “Banks convince Fed to raise swipe fee limit,” Washington Post, June 29,
2011.
NACS. National Retail Federation, Food Marketing Institute, Miller Oil Co., Boscov’s
Department Store, LLC, and National Restaurant Association, versus Board of Governors of the
Federal Reserve System. July 31, 2013.
https://ecf.dcd.uscourts.gov/cgi-bin/show_public_doc?2011cv2075-38.
31
Nakamura, Emi and Jon Steinsson. 2008. “Five Facts about Prices: A Reevaluation of Menu
Cost Models.” Quarterly Journal of Economics.
National Association of Theater Owners http://www.natoonline.org/statisticstickets.htm.
Nijs, Vincent, Kanishka Misra, Eric T. Anderson, Karsten Hansen, and Lakshman
Krishnamurthi. 2009. “Channel Pass-Through of Trade Promotions.” Marketing Science.
Reserve Bank of Australia (2008). “Reform of Australia’s Payments System: Preliminary
Conclusions of the 2007/08 Review,” April 2008.
Rochet, J.C. and J. Tirole (2002) “Cooperation among Competitors: Some Economics of
Payment Card Associations,” RAND Journal of Economics, 33: 1-22.
Rochet, Jean-Charles and Zhu Wang (2010). “Issuer Competition and the Credit Card
Interchange Fee Puzzle.” Working Paper, February, 2010.
Schuh, Scott, Oz Shy, Joanna Stavins, and Robert Triest (2012). “An Economic Analysis of the
2011 Settlement between the Department of Justice and Credit Card Networks.” Journal of
Competition Law & Economics, 8(1): 107-144.
U.S. Census Bureau, Statistical Abstract of the United States: 2012.
______ . Industry Statistics Sampler.
U.S. Bureau of Labor Statistics. Occupational Employment Statistics.
Visa USA. “Interchange: What it is. How it works.”
http://usa.visa.com/download/merchants/interchange-brochure.pdf.
Wang, Zhu. 2012. “Debit Card Interchange Fee Regulation: Some Assessment and
Considerations.” Economic Quarterly Journal, Volume 98, Number 3.
____________. 2010. “Market structure and payment card pricing: What drives the
interchange?” International Journal of Industrial Organization 28: 86–98.
Werden, Gregory J., Luke M. Froeb, and Steven Tschantz. 2006. “The Effects of Merger
Efficiencies on Consumers of Differentiated Product.” Working Paper.
Wright, Julian (2004). “The Determinants of Optimal Interchange Fees in Payment Systems,”
The Journal of Industrial Economics, 52(1): 1-26.
32
About the Author
Robert J. Shapiro is the chairman of Sonecon, LLC, a private firm that provides advice, analysis
and support to senior officials of the U.S. and foreign governments, senior executives of U.S. and
foreign firms, and directors and managers of non-profit organizations. He is an internationally-
known economist who has advised, among others, President Bill Clinton, Vice President Al
Gore, Jr., British Prime Minister Tony Blair, U.S. Treasury Secretaries Timothy Geithner and
Robert Rubin, British Foreign Minister David Milliband, U.S. Senators Barack Obama and
Hillary Clinton, as well as senior executives at many Fortune 100 companies. Currently, he is
also a Senior Policy Fellow of the Georgetown University McDonough School of Business, an
advisor to the International Monetary Fund, chairman of the U.S. Climate Task Force, and
director of the Globalization Initiative at NDN. Prior to founding Sonecon, Dr. Shapiro was
Under Secretary of Commerce for Economic Affairs from 1998 to 2001. Prior to that post, he
was co-founder and Vice President of the Progressive Policy Institute and, before that,
Legislative Director and Economic Counsel for Senator Daniel Patrick Moynihan. He also was
the principal economic advisor to Bill Clinton in his 1991-1992 campaign and a senior economic
advisor to Vice President Gore and Senator John Kerry in their presidential campaigns. In 2008
and 2012, he advised the campaigns and transition of Barack Obama. Dr. Shapiro has been a
Fellow of Harvard University, the Brookings Institution, and the National Bureau of Economic
Research. He holds a Ph.D. and M.A. from Harvard University, a M.Sc. from the London
School of Economics and Political Science, and an A.B. from the University of Chicago.


![CREDIT CARD AUTHORIZATION - LA Film Rentals · 2019-03-11 · CREDIT CARD AUTHORIZATION CUSTOMER INFO PHOTO ID CREDIT CARD CREDIT CARD INFO BILLING ADDRESS PICKUP CONSENT [ ] HAVE](https://img.pdfslide.us/doc/110x75/5f05b4857e708231d4144a44/credit-card-authorization-la-film-rentals-2019-03-11-credit-card-authorization.jpg)