Embed Size (px)
DESCRIPTION
Requiring school districts to pay the employer share of their employees’ 401(k)-style retirement savings plans creates an incentive to be more prudent with the compensation packages they award, thereby increasing the overall security of the retirement system. This plan also ends state subsidies to wealthy school districts and enhances spending accountability, because costs are paid where they are incurred.
Citation preview
illinois Policy institute May 16, 2013
Budget solutions 2014 suPPleMental rePort Budget and tax
The cost shift: why school districts would benefit from a 401(k)-style retirement planBen VanMetre, Senior Budget and Tax Policy Analyst
The problemIllinois has the worst-funded pension systems in the nation. The structure of Illinois’ current defined benefit system coupled with the political unwillingness to reform has left the state’s pension systems in danger of running completely dry. Even the head of the Illinois Teachers’ Retirement System, or TRS, Dick Ingram, said the fund may run dry by 2029.1
Unfortunately for students and schools in Illinois, the state’s pension crisis is crowding out money for the classroom. Gov. Pat Quinn’s proposed 2014 budget cuts $400 million from the classroom to make room for a $900 million increase in pension costs.2
A significant driver of Illinois’ $97 billion pension crisis is the fact that the state makes pension contributions to TRS on behalf of school districts, even though teachers aren’t employees of the state.3
Under the current system, local school districts set salaries for teachers. These salaries determine a teacher’s eventual pension benefit. In order to fund these pensions, the employee (the teacher) and the employer (the school district) contribute specific amounts to the teacher retirement funds each year. But presently, the school district – the employer of these teachers – does not pay the full employer contribution to TRS. Instead, the state pays on behalf of these districts.
The state pays more than $632 million a year in retirement costs for local suburban and downstate school districts.4 By paying the employer contribution of teachers’ pensions on behalf of school districts, the state is essentially paying for spending decisions over which it has little control. This means that one unit of government hands out benefits while another pays for them, leading to abuse and the destruction of spending accountability.
The current arrangement allows school districts to offer teachers overly generous benefits, including end-of-career salary spikes, sick day accumulations and other pension sweeteners, with little incentive to curb retirement costs because the state picks up the pension payments. In fact, this arrangement provides an incentive for school districts to continually increase teacher benefits. As more school districts balloon benefit packages to attract talent, other districts compete by doing the same – which ultimately perpetuates the cycle of unaffordable and unsustainable retirement benefits.
Additional resources: illinoispolicy.org190 s. lasalle st., suite 1630, chicago, il 60603 | 312.346.5700 | 802 s. 2nd st., springfield, il 62704 | 217.528.8800
Currently, the wealthiest school districts benefit the most from the state’s role in funding pensions because they offer the highest compensation packages. That means that all taxpayers, including those from downstate, are on the hook for North Shore pension benefits.
A look at state pension contributions per pupil shows the dramatic disparities between districts. For example, the state contributes $1,100 per pupil to cover the annual cost of teacher pensions in Rondout District 72 in Lake County. Meanwhile, the state only contributes $249 per pupil to cover the annual cost of teacher pensions in Dalzell District 98 in Bureau County.5,6
Sending scarce state tax dollars to the wealthiest districts is regressive and directly contradicts the state’s goal of sending education money to districts based on need.
Many school districts have claimed that the cost of making the employer contribution would be difficult to bear and could, for example, result in property tax increases. This is simply untrue. The average cost increase is modest and can be reconciled with additional spending reforms.
Our solutionThe Illinois Policy Institute’s comprehensive pension solution freezes the current defined benefit plan and protects already-earned benefits for current workers and retirees.
Going forward the Institute’s plan moves government workers to a 401(k)-style retirement system.7 Rather than the state making contributions to TRS, the Institute’s plan requires school districts to pay the employer share of their employees’ retirement savings plans. This reform is necessary in order to increase accountability and prevent the current pension system from crowding out state dollars meant for the classroom.
The Institute’s plan is based on the self-managed 401(a) plan currently operating in the State Universities’ Retirement System, or SURS.8 The SURS self-managed plan had more than 17,500 participants in 2012.9
illinoispolicy.org 2
Under the Institute’s plan, a teacher pays 8 percent of her salary into her own 401(k)-style plan, and the school district contributes 7 percent of that teacher’s salary to her retirement plan.
The 7 percent match under the defined contribution system is a contractual agreement between the school and the teacher. The school district’s match would be visible in every paycheck and the contribution would be automatic.
And the cost to school districts is a simple calculation – 7 percent of the district’s TRS payroll. This gives school districts more stability and predictability in budgeting teacher retirement costs. The 7 percent employer contribution will cost school districts, on average, an amount equal to 2.9 percent of their total education expenditures. The costs are, therefore, not of the magnitude that opponents to this reform have portrayed. The appendix of this report includes the specific cost increase for each downstate and suburban school district.
In exchange for paying the retirement costs of their employees, school districts should be given more freedom and flexibility.
They should be given the ability to manage the increased costs by renegotiating the prevailing wage requirement, project labor agreements and other unfunded mandates. School districts can also manage costs by opening up teacher contracts, negotiating benefits and ending the practice of picking up the pension contributions for their employees.
Local school districts should also have the freedom to exit the state’s retirement systems in the future. School districts should be free to stay in the new defined contribution plan going forward or design their own retirement plans from the ground up.
Why it worksRequiring school districts to pay the employer share of their employees’ 401(k)-style retirement savings plans creates an incentive to be more prudent with the compensation packages they award, thereby increasing the overall security of the retirement system. This plan also ends state subsidies to wealthy school districts and enhances spending accountability, because costs are paid where they are incurred.
Requiring school districts to be directly accountable for their employees reduces the state’s cost by more than $632 million. The state could save an additional $440 million by implementing similar reforms for public universities.10 Combined, these reforms would ultimately reduce the overall cost of state government by approximately $1 billion.
Accountability for retirement costs, coupled with the rest of the Illinois Policy Institute’s pension reform plan, ultimately restores fiscal order to the state by eliminating unsustainable pensions and unfunded liabilities. This paves the way for the economy to flourish, fostering an environment where businesses can thrive and create the jobs Illinoisans need.
illinoispolicy.org 3
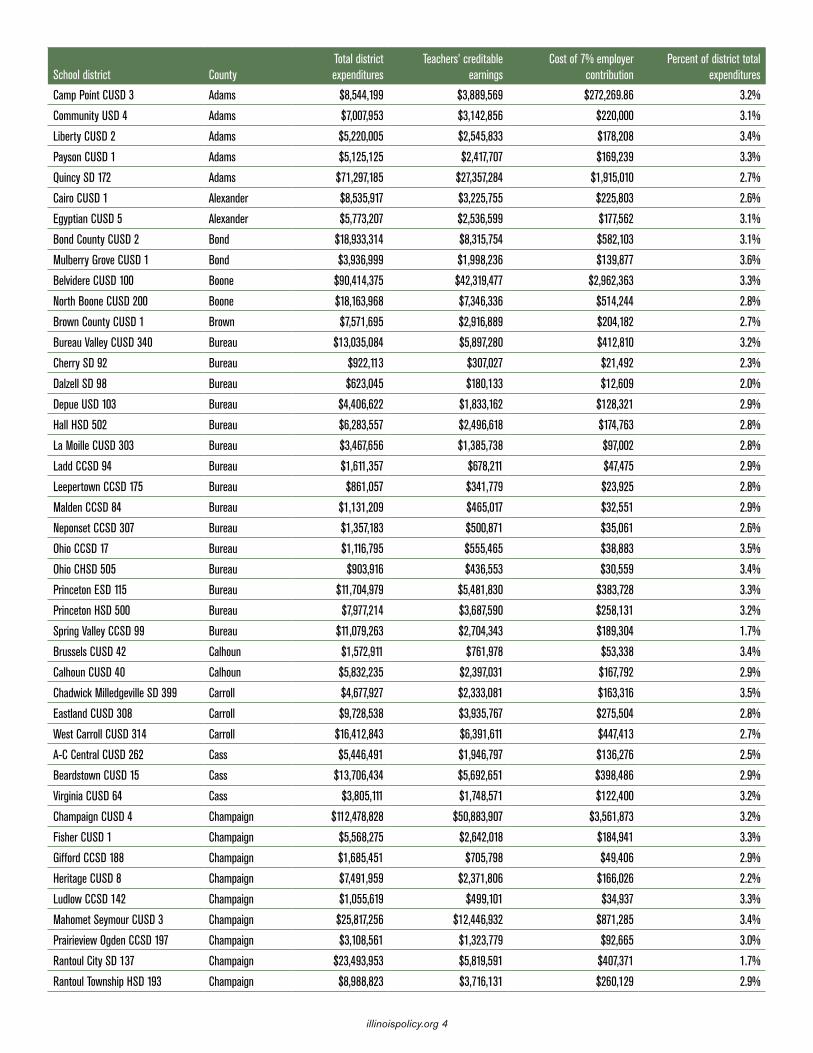
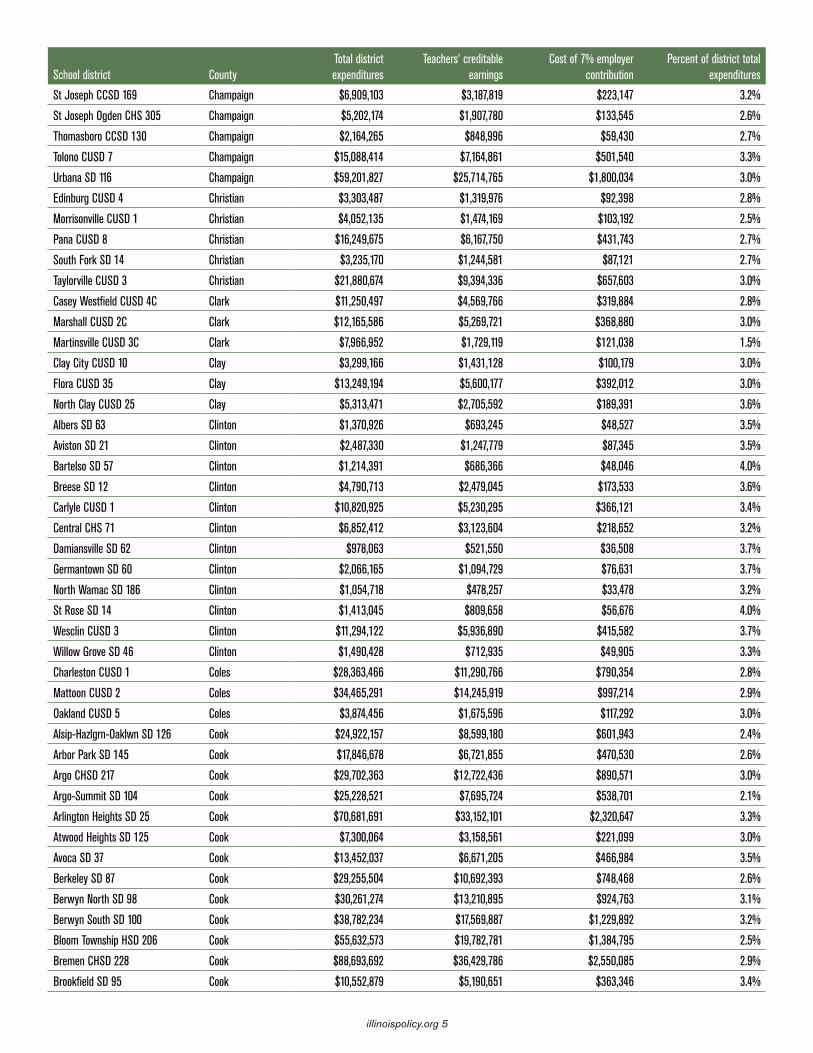
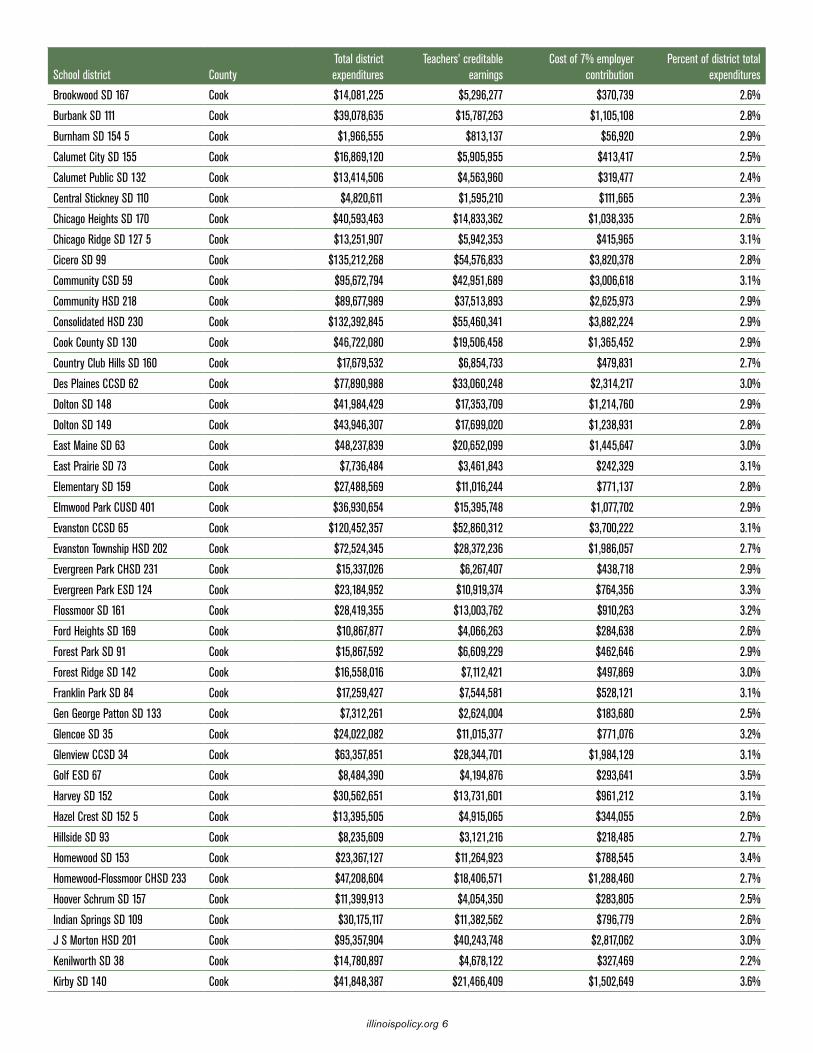
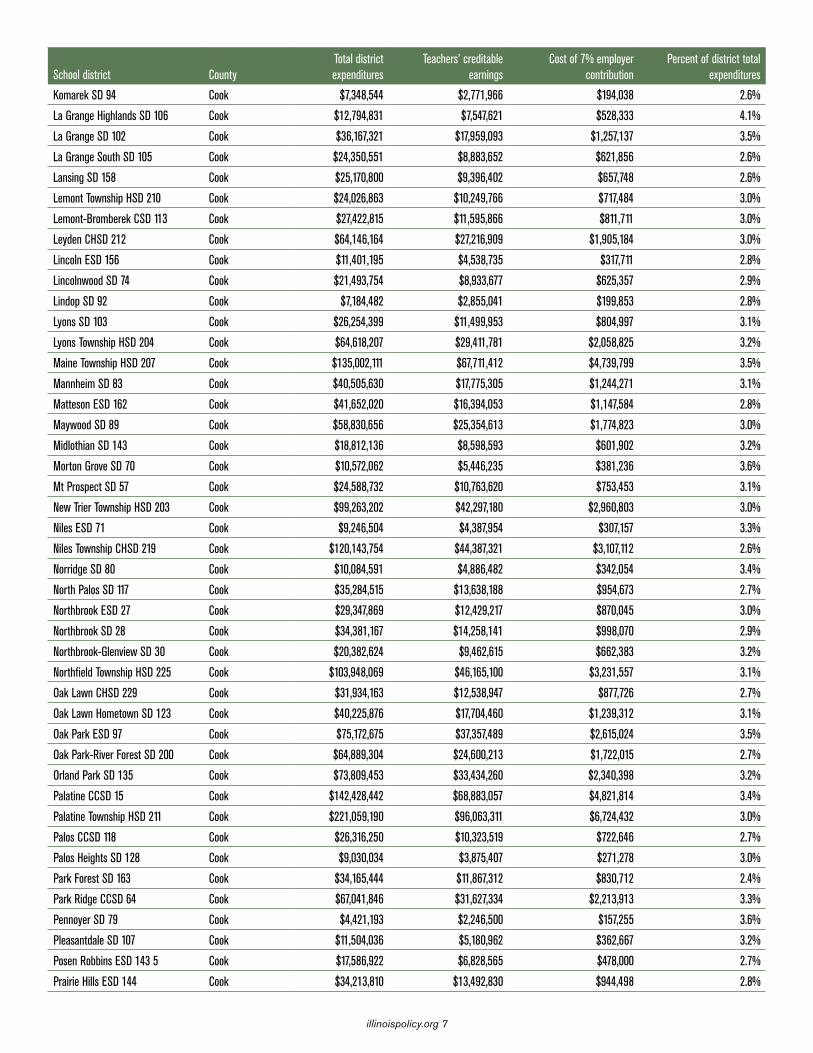
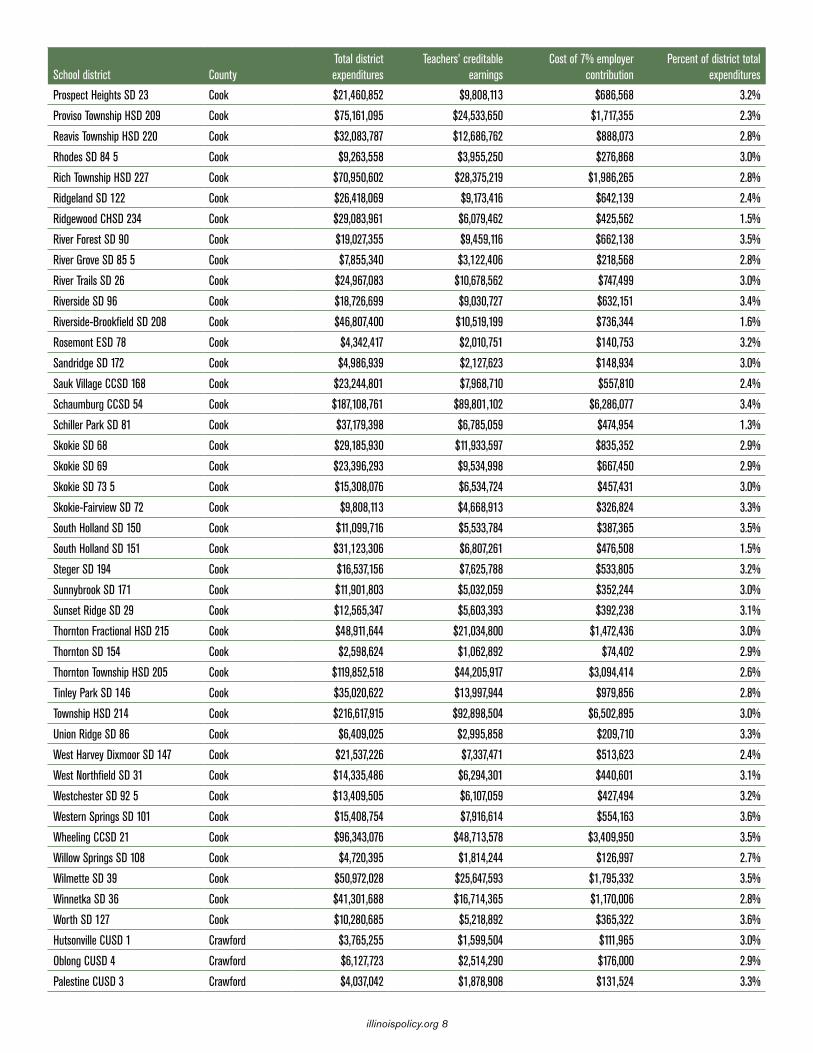
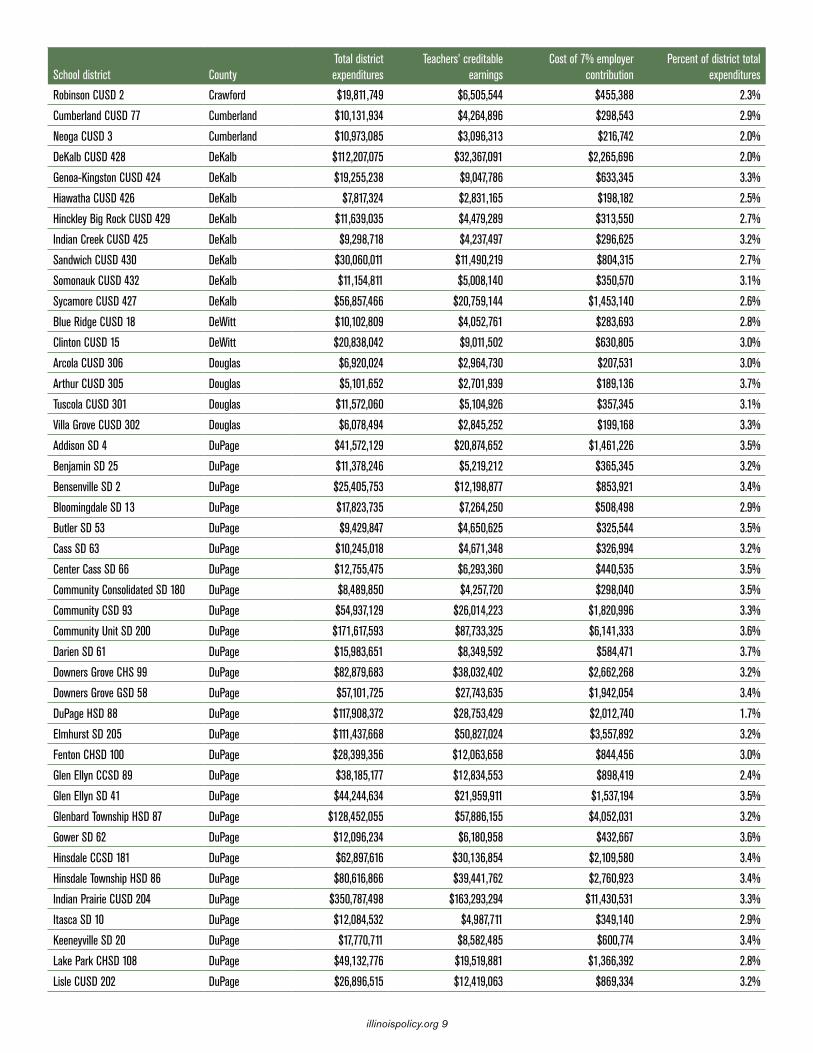
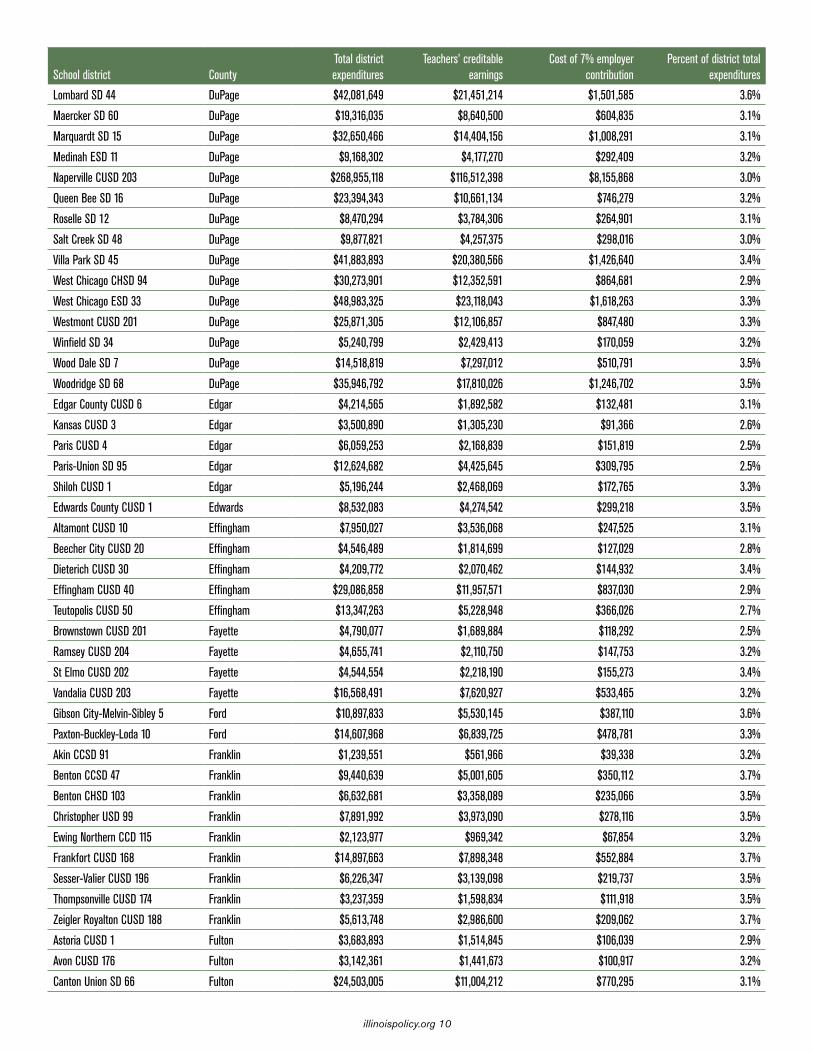
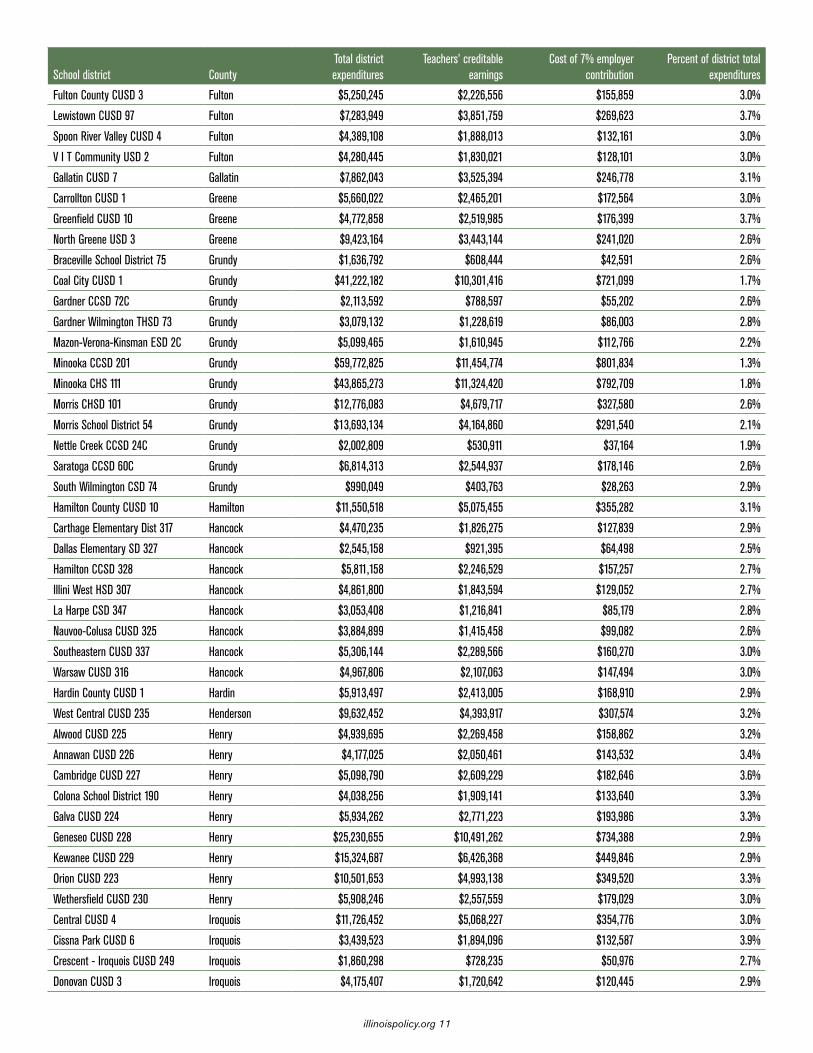
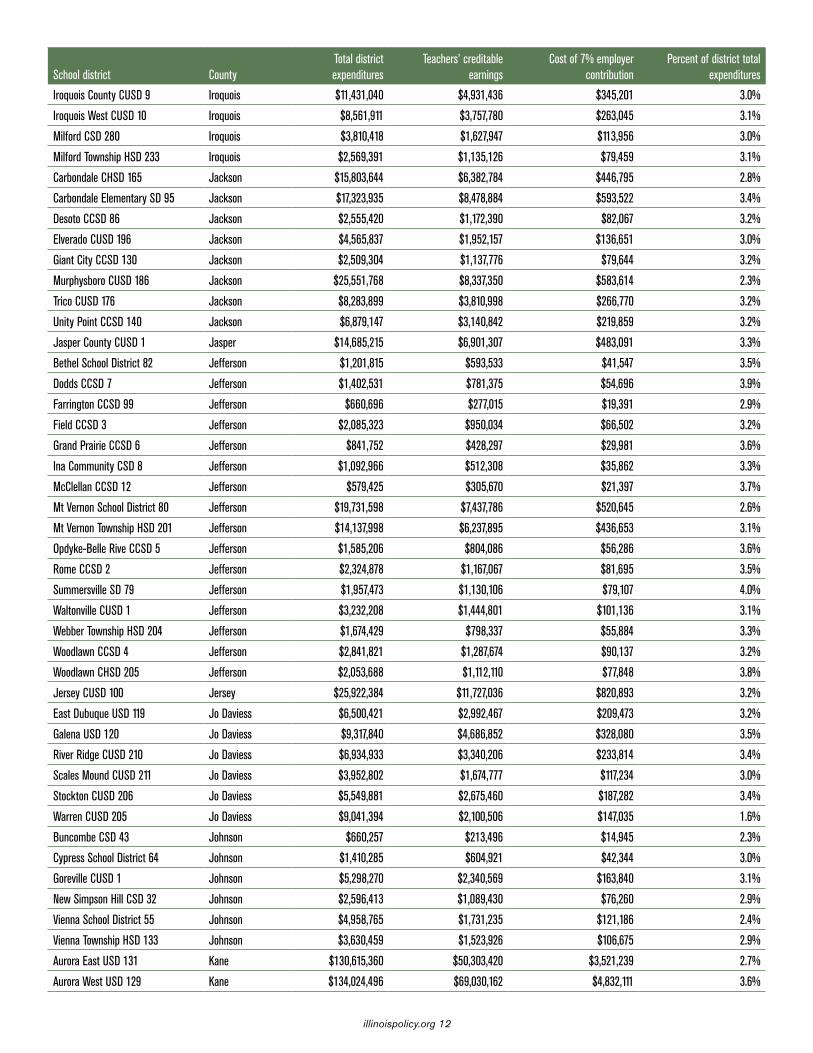
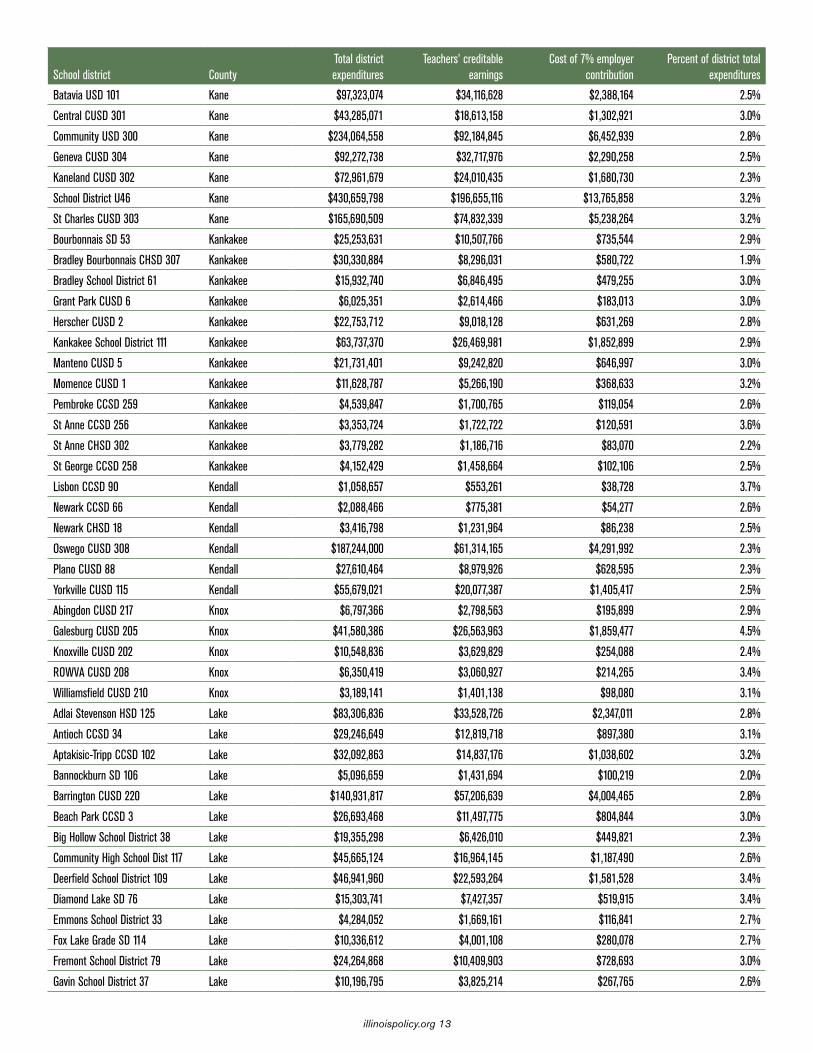
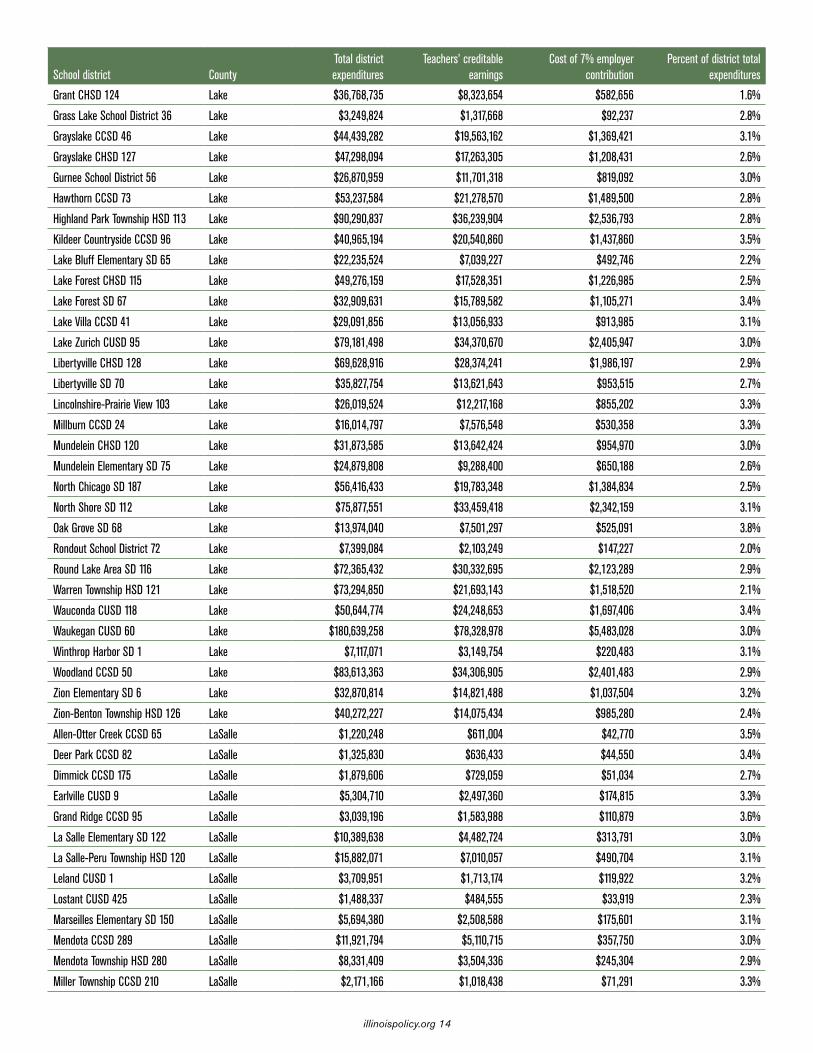
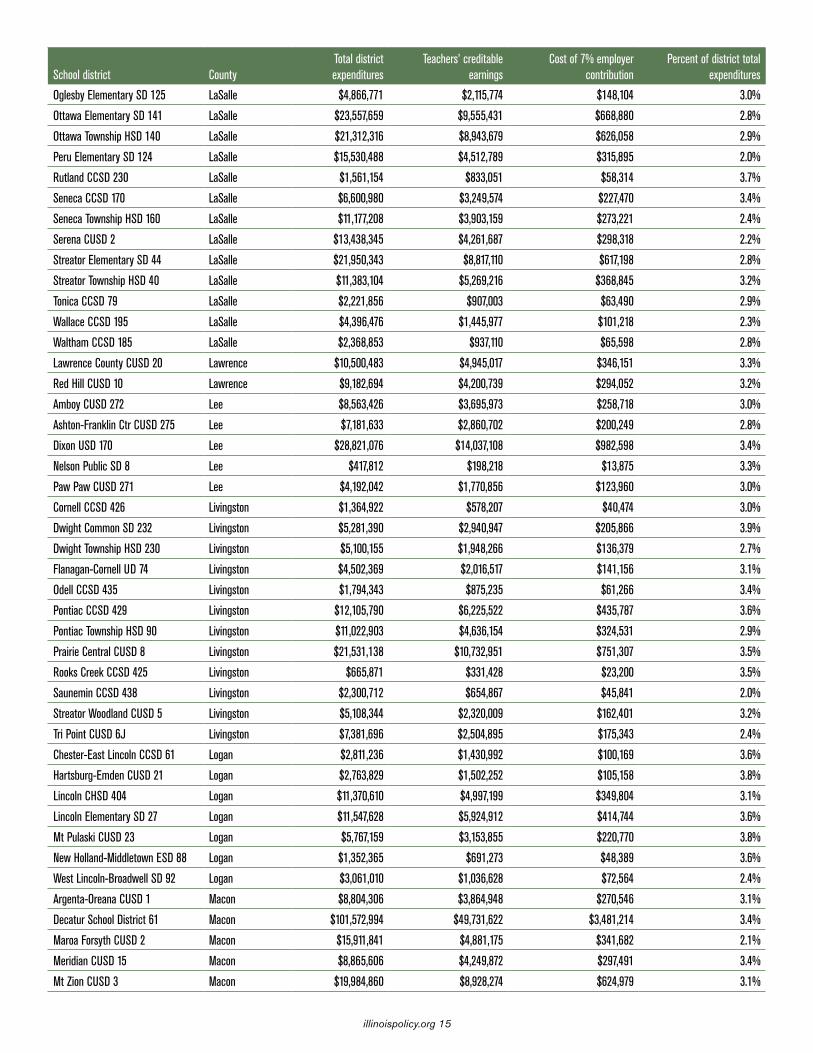
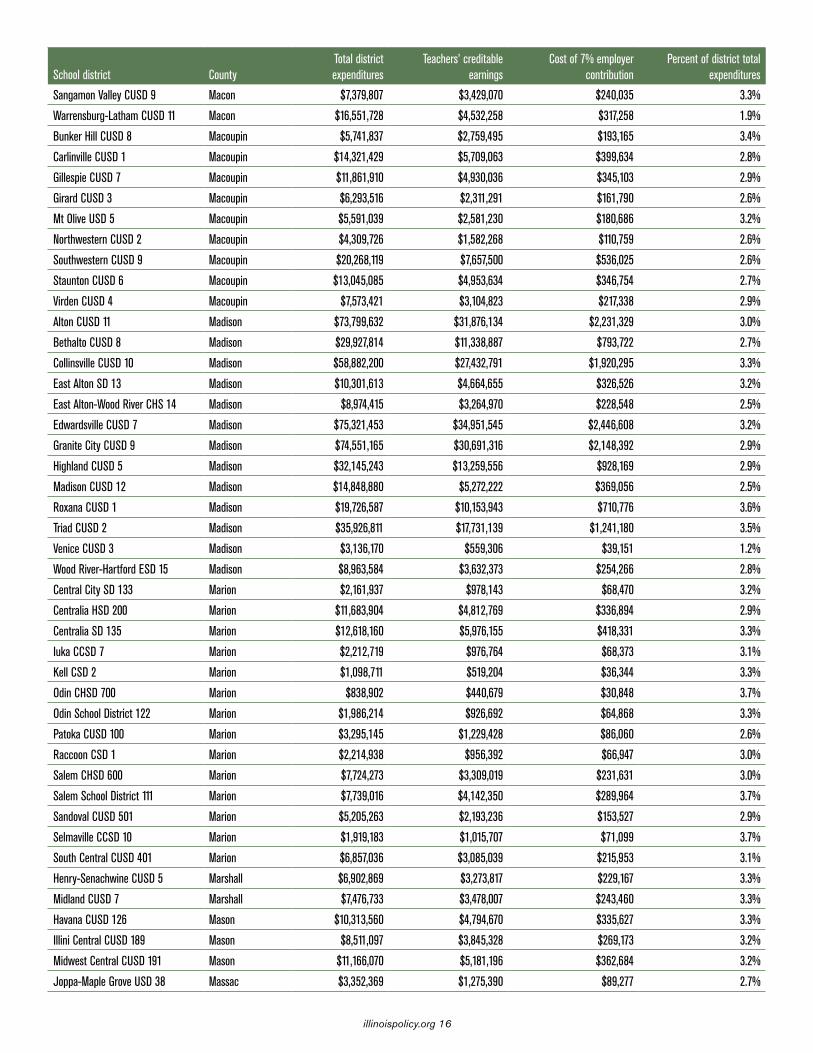
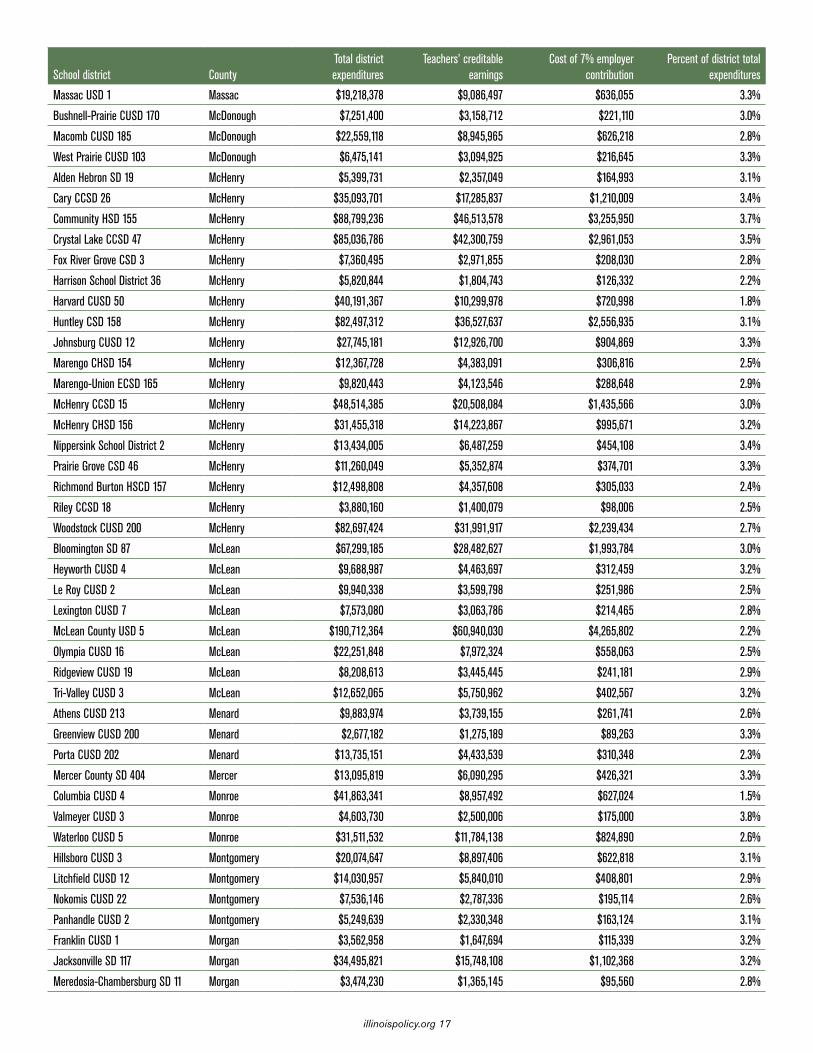
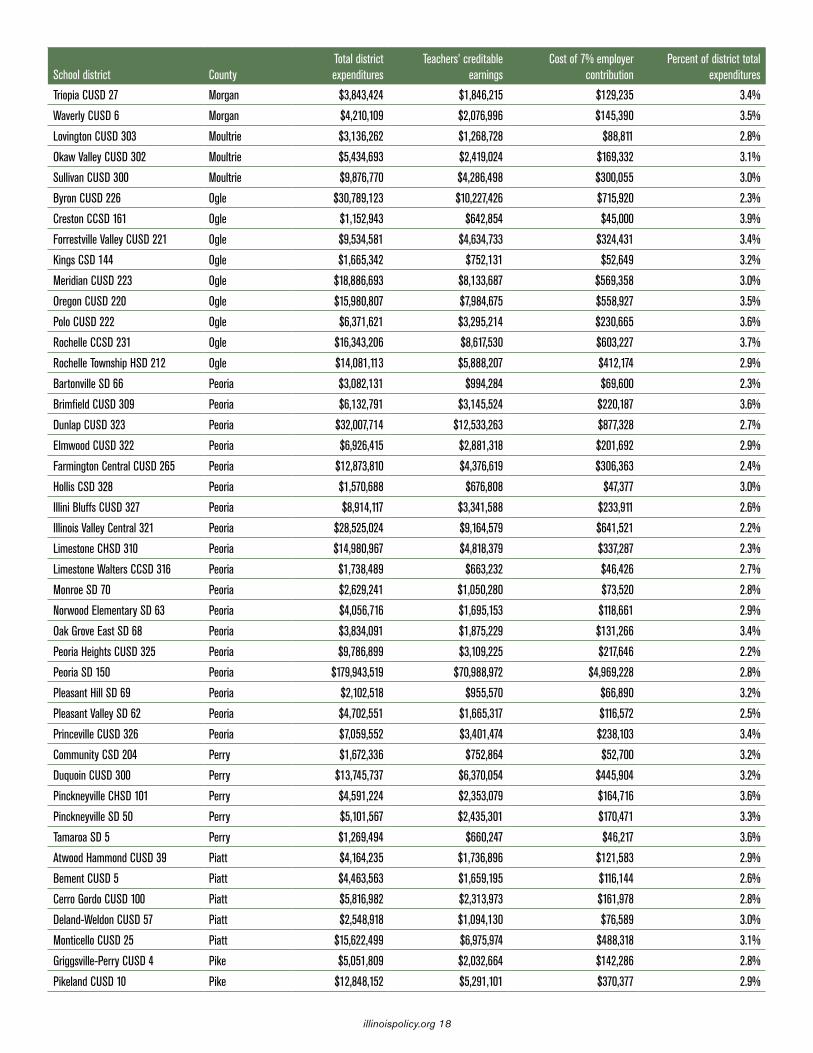
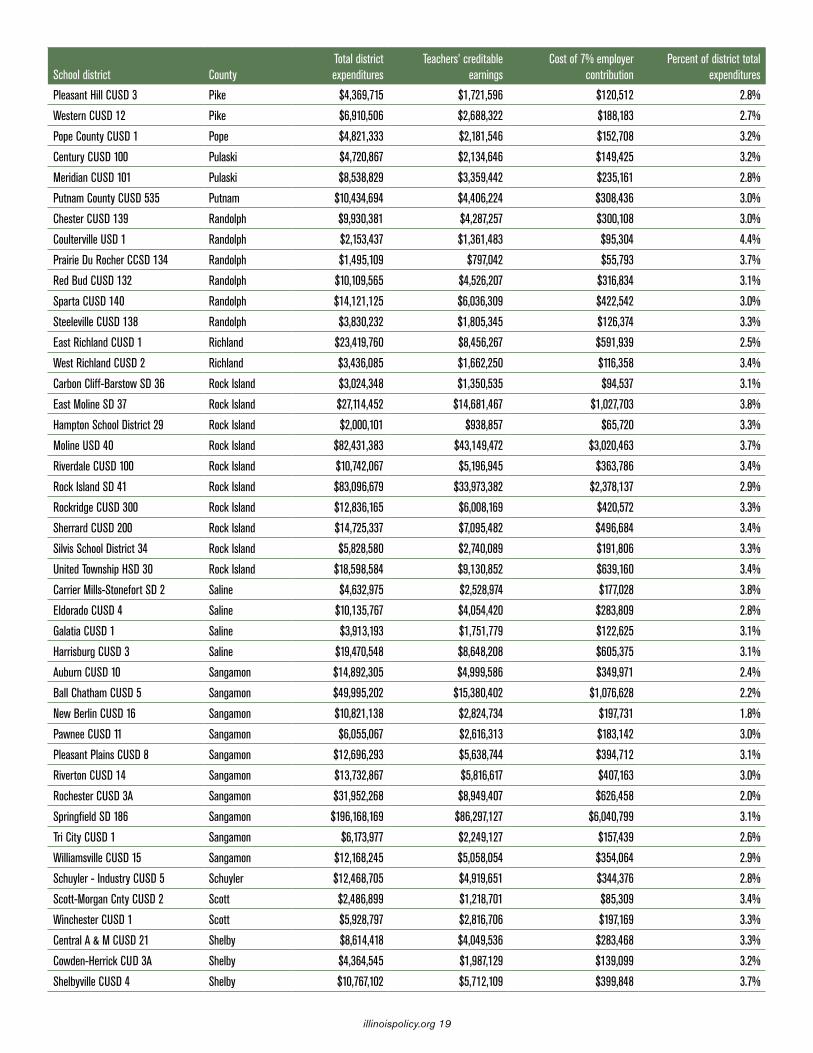
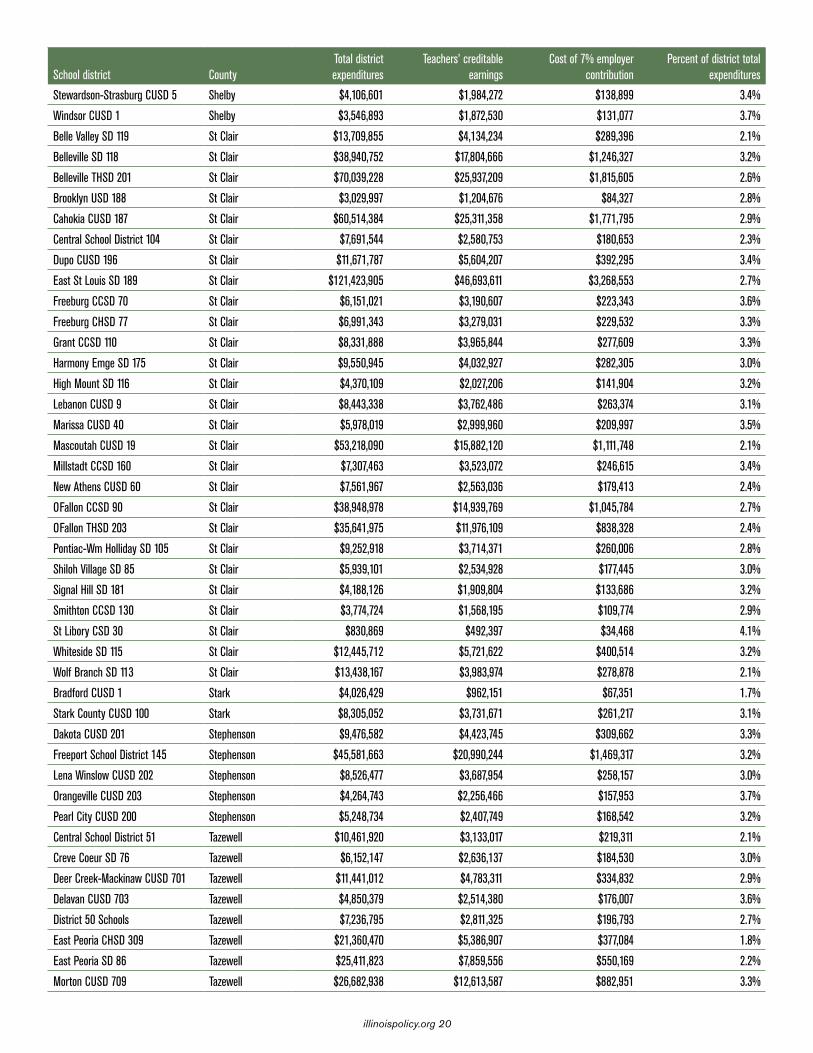
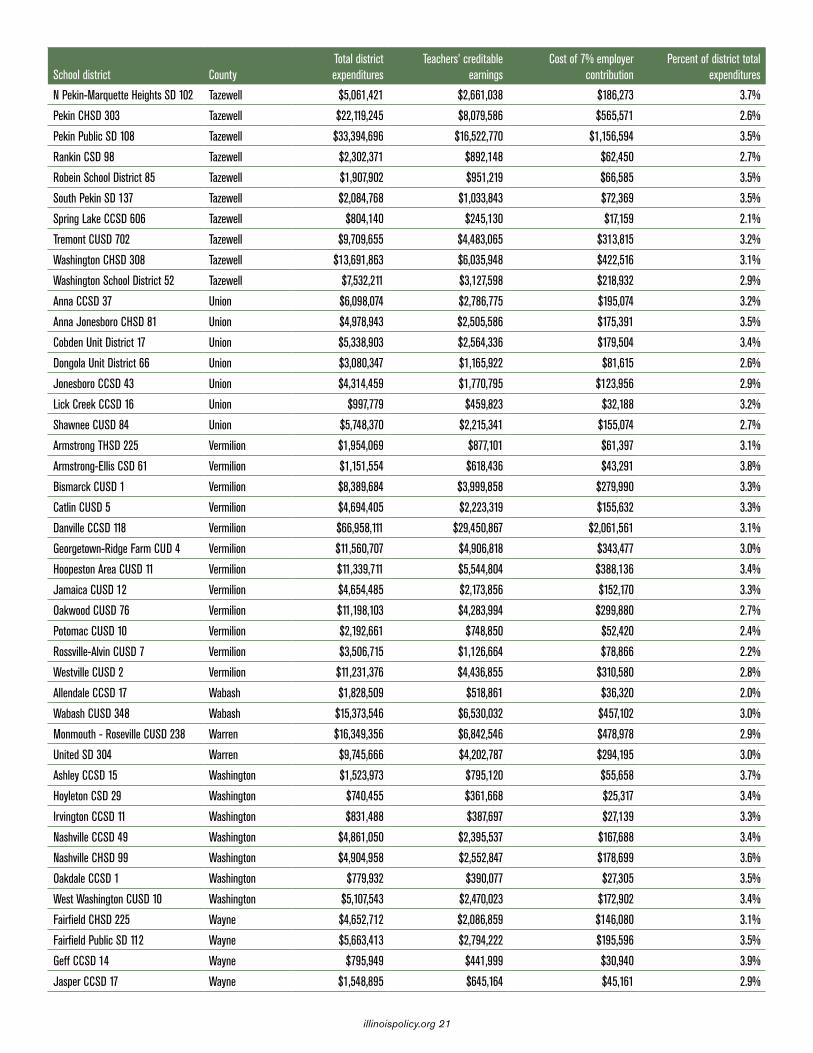
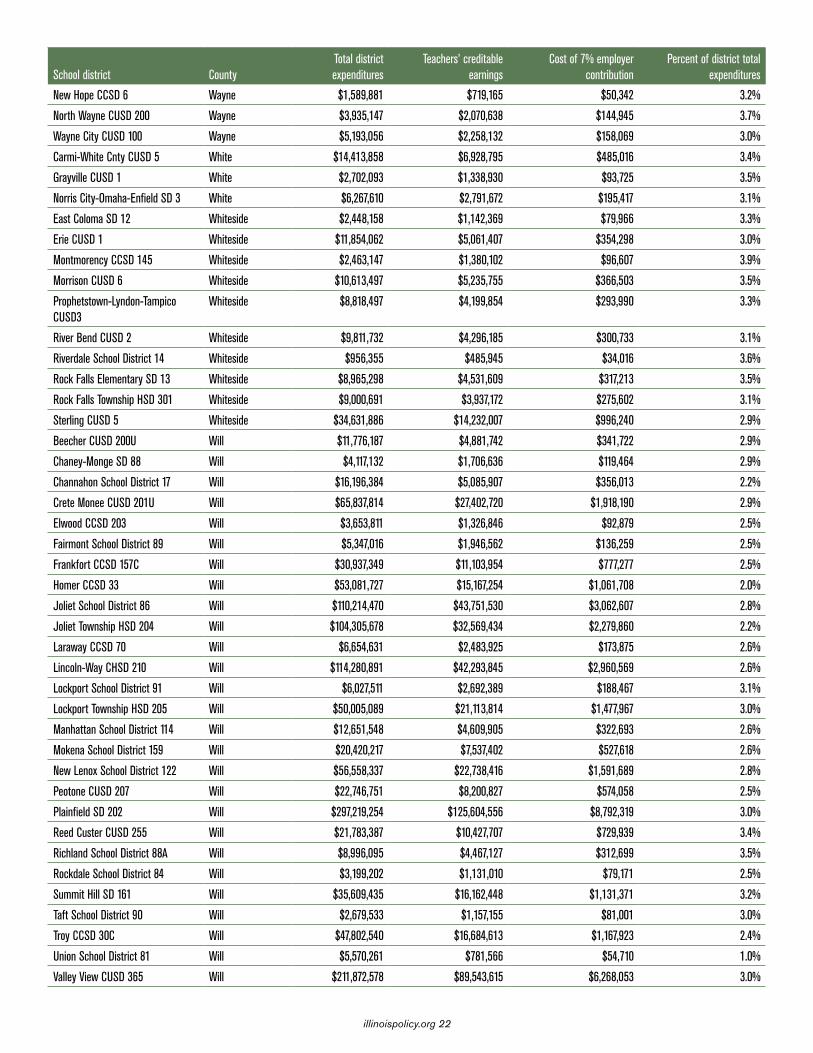
AppendixThis appendix includes data for 862 school districts in Illinois.11 The data are for fiscal year 2010 and the list is organized by county. The following definitions describe each variable:
• Total district expenditures: This column of information includes the total expenditures for each school district. Total expenditures include instruction, general administration, support services and other expenditures.12
• Teachers’ creditable earnings: The Illinois Teachers’ Retirement System, or TRS, defines creditable earnings as, “In general, ‘creditable earnings’ are forms of compensation that are recognized by TRS as salary for reporting and retirement purposes. TRS accepts many, but not all, types of compensation … Creditable earnings are the basis upon which member contributions, employer contributions, and benefits are calculated.”13,14
• Cost of 7 percent employer contribution: Under the Illinois Policy Institute’s plan, a teacher pays 8 percent of her earnings into her own 401(k)-style plan and the school district contributes 7 percent of that teacher’s earnings to her retirement plan. The 7 percent contribution equals 7 percent of teachers’ creditable earnings for each district.15
• Contribution as a percent of total expenditures: This is a simple calculation: Contribution as a percent of total expenditures = 7 percent contribution / total district expenditures.16
illinoispolicy.org 4
School district CountyTotal district expenditures
Teachers’ creditable earnings
Cost of 7% employer contribution
Percent of district total expenditures
Camp Point CUSD 3 Adams $8,544,199 $3,889,569 $272,269.86 3.2%
Community USD 4 Adams $7,007,953 $3,142,856 $220,000 3.1%
Liberty CUSD 2 Adams $5,220,005 $2,545,833 $178,208 3.4%
Payson CUSD 1 Adams $5,125,125 $2,417,707 $169,239 3.3%
Quincy SD 172 Adams $71,297,185 $27,357,284 $1,915,010 2.7%
Cairo CUSD 1 Alexander $8,535,917 $3,225,755 $225,803 2.6%
Egyptian CUSD 5 Alexander $5,773,207 $2,536,599 $177,562 3.1%
Bond County CUSD 2 Bond $18,933,314 $8,315,754 $582,103 3.1%
Mulberry Grove CUSD 1 Bond $3,936,999 $1,998,236 $139,877 3.6%
Belvidere CUSD 100 Boone $90,414,375 $42,319,477 $2,962,363 3.3%
North Boone CUSD 200 Boone $18,163,968 $7,346,336 $514,244 2.8%
Brown County CUSD 1 Brown $7,571,695 $2,916,889 $204,182 2.7%
Bureau Valley CUSD 340 Bureau $13,035,084 $5,897,280 $412,810 3.2%
Cherry SD 92 Bureau $922,113 $307,027 $21,492 2.3%
Dalzell SD 98 Bureau $623,045 $180,133 $12,609 2.0%
Depue USD 103 Bureau $4,406,622 $1,833,162 $128,321 2.9%
Hall HSD 502 Bureau $6,283,557 $2,496,618 $174,763 2.8%
La Moille CUSD 303 Bureau $3,467,656 $1,385,738 $97,002 2.8%
Ladd CCSD 94 Bureau $1,611,357 $678,211 $47,475 2.9%
Leepertown CCSD 175 Bureau $861,057 $341,779 $23,925 2.8%
Malden CCSD 84 Bureau $1,131,209 $465,017 $32,551 2.9%
Neponset CCSD 307 Bureau $1,357,183 $500,871 $35,061 2.6%
Ohio CCSD 17 Bureau $1,116,795 $555,465 $38,883 3.5%
Ohio CHSD 505 Bureau $903,916 $436,553 $30,559 3.4%
Princeton ESD 115 Bureau $11,704,979 $5,481,830 $383,728 3.3%
Princeton HSD 500 Bureau $7,977,214 $3,687,590 $258,131 3.2%
Spring Valley CCSD 99 Bureau $11,079,263 $2,704,343 $189,304 1.7%
Brussels CUSD 42 Calhoun $1,572,911 $761,978 $53,338 3.4%
Calhoun CUSD 40 Calhoun $5,832,235 $2,397,031 $167,792 2.9%
Chadwick Milledgeville SD 399 Carroll $4,677,927 $2,333,081 $163,316 3.5%
Eastland CUSD 308 Carroll $9,728,538 $3,935,767 $275,504 2.8%
West Carroll CUSD 314 Carroll $16,412,843 $6,391,611 $447,413 2.7%
A-C Central CUSD 262 Cass $5,446,491 $1,946,797 $136,276 2.5%
Beardstown CUSD 15 Cass $13,706,434 $5,692,651 $398,486 2.9%
Virginia CUSD 64 Cass $3,805,111 $1,748,571 $122,400 3.2%
Champaign CUSD 4 Champaign $112,478,828 $50,883,907 $3,561,873 3.2%
Fisher CUSD 1 Champaign $5,568,275 $2,642,018 $184,941 3.3%
Gifford CCSD 188 Champaign $1,685,451 $705,798 $49,406 2.9%
Heritage CUSD 8 Champaign $7,491,959 $2,371,806 $166,026 2.2%
Ludlow CCSD 142 Champaign $1,055,619 $499,101 $34,937 3.3%
Mahomet Seymour CUSD 3 Champaign $25,817,256 $12,446,932 $871,285 3.4%
Prairieview Ogden CCSD 197 Champaign $3,108,561 $1,323,779 $92,665 3.0%
Rantoul City SD 137 Champaign $23,493,953 $5,819,591 $407,371 1.7%
Rantoul Township HSD 193 Champaign $8,988,823 $3,716,131 $260,129 2.9%
illinoispolicy.org 5
School district CountyTotal district expenditures
Teachers’ creditable earnings
Cost of 7% employer contribution
Percent of district total expenditures
St Joseph CCSD 169 Champaign $6,909,103 $3,187,819 $223,147 3.2%
St Joseph Ogden CHS 305 Champaign $5,202,174 $1,907,780 $133,545 2.6%
Thomasboro CCSD 130 Champaign $2,164,265 $848,996 $59,430 2.7%
Tolono CUSD 7 Champaign $15,088,414 $7,164,861 $501,540 3.3%
Urbana SD 116 Champaign $59,201,827 $25,714,765 $1,800,034 3.0%
Edinburg CUSD 4 Christian $3,303,487 $1,319,976 $92,398 2.8%
Morrisonville CUSD 1 Christian $4,052,135 $1,474,169 $103,192 2.5%
Pana CUSD 8 Christian $16,249,675 $6,167,750 $431,743 2.7%
South Fork SD 14 Christian $3,235,170 $1,244,581 $87,121 2.7%
Taylorville CUSD 3 Christian $21,880,674 $9,394,336 $657,603 3.0%
Casey Westfield CUSD 4C Clark $11,250,497 $4,569,766 $319,884 2.8%
Marshall CUSD 2C Clark $12,165,586 $5,269,721 $368,880 3.0%
Martinsville CUSD 3C Clark $7,966,952 $1,729,119 $121,038 1.5%
Clay City CUSD 10 Clay $3,299,166 $1,431,128 $100,179 3.0%
Flora CUSD 35 Clay $13,249,194 $5,600,177 $392,012 3.0%
North Clay CUSD 25 Clay $5,313,471 $2,705,592 $189,391 3.6%
Albers SD 63 Clinton $1,370,926 $693,245 $48,527 3.5%
Aviston SD 21 Clinton $2,487,330 $1,247,779 $87,345 3.5%
Bartelso SD 57 Clinton $1,214,391 $686,366 $48,046 4.0%
Breese SD 12 Clinton $4,790,713 $2,479,045 $173,533 3.6%
Carlyle CUSD 1 Clinton $10,820,925 $5,230,295 $366,121 3.4%
Central CHS 71 Clinton $6,852,412 $3,123,604 $218,652 3.2%
Damiansville SD 62 Clinton $978,063 $521,550 $36,508 3.7%
Germantown SD 60 Clinton $2,066,165 $1,094,729 $76,631 3.7%
North Wamac SD 186 Clinton $1,054,718 $478,257 $33,478 3.2%
St Rose SD 14 Clinton $1,413,045 $809,658 $56,676 4.0%
Wesclin CUSD 3 Clinton $11,294,122 $5,936,890 $415,582 3.7%
Willow Grove SD 46 Clinton $1,490,428 $712,935 $49,905 3.3%
Charleston CUSD 1 Coles $28,363,466 $11,290,766 $790,354 2.8%
Mattoon CUSD 2 Coles $34,465,291 $14,245,919 $997,214 2.9%
Oakland CUSD 5 Coles $3,874,456 $1,675,596 $117,292 3.0%
Alsip-Hazlgrn-Oaklwn SD 126 Cook $24,922,157 $8,599,180 $601,943 2.4%
Arbor Park SD 145 Cook $17,846,678 $6,721,855 $470,530 2.6%
Argo CHSD 217 Cook $29,702,363 $12,722,436 $890,571 3.0%
Argo-Summit SD 104 Cook $25,228,521 $7,695,724 $538,701 2.1%
Arlington Heights SD 25 Cook $70,681,691 $33,152,101 $2,320,647 3.3%
Atwood Heights SD 125 Cook $7,300,064 $3,158,561 $221,099 3.0%
Avoca SD 37 Cook $13,452,037 $6,671,205 $466,984 3.5%
Berkeley SD 87 Cook $29,255,504 $10,692,393 $748,468 2.6%
Berwyn North SD 98 Cook $30,261,274 $13,210,895 $924,763 3.1%
Berwyn South SD 100 Cook $38,782,234 $17,569,887 $1,229,892 3.2%
Bloom Township HSD 206 Cook $55,632,573 $19,782,781 $1,384,795 2.5%
Bremen CHSD 228 Cook $88,693,692 $36,429,786 $2,550,085 2.9%
Brookfield SD 95 Cook $10,552,879 $5,190,651 $363,346 3.4%
illinoispolicy.org 6
School district CountyTotal district expenditures
Teachers’ creditable earnings
Cost of 7% employer contribution
Percent of district total expenditures
Brookwood SD 167 Cook $14,081,225 $5,296,277 $370,739 2.6%
Burbank SD 111 Cook $39,078,635 $15,787,263 $1,105,108 2.8%
Burnham SD 154 5 Cook $1,966,555 $813,137 $56,920 2.9%
Calumet City SD 155 Cook $16,869,120 $5,905,955 $413,417 2.5%
Calumet Public SD 132 Cook $13,414,506 $4,563,960 $319,477 2.4%
Central Stickney SD 110 Cook $4,820,611 $1,595,210 $111,665 2.3%
Chicago Heights SD 170 Cook $40,593,463 $14,833,362 $1,038,335 2.6%
Chicago Ridge SD 127 5 Cook $13,251,907 $5,942,353 $415,965 3.1%
Cicero SD 99 Cook $135,212,268 $54,576,833 $3,820,378 2.8%
Community CSD 59 Cook $95,672,794 $42,951,689 $3,006,618 3.1%
Community HSD 218 Cook $89,677,989 $37,513,893 $2,625,973 2.9%
Consolidated HSD 230 Cook $132,392,845 $55,460,341 $3,882,224 2.9%
Cook County SD 130 Cook $46,722,080 $19,506,458 $1,365,452 2.9%
Country Club Hills SD 160 Cook $17,679,532 $6,854,733 $479,831 2.7%
Des Plaines CCSD 62 Cook $77,890,988 $33,060,248 $2,314,217 3.0%
Dolton SD 148 Cook $41,984,429 $17,353,709 $1,214,760 2.9%
Dolton SD 149 Cook $43,946,307 $17,699,020 $1,238,931 2.8%
East Maine SD 63 Cook $48,237,839 $20,652,099 $1,445,647 3.0%
East Prairie SD 73 Cook $7,736,484 $3,461,843 $242,329 3.1%
Elementary SD 159 Cook $27,488,569 $11,016,244 $771,137 2.8%
Elmwood Park CUSD 401 Cook $36,930,654 $15,395,748 $1,077,702 2.9%
Evanston CCSD 65 Cook $120,452,357 $52,860,312 $3,700,222 3.1%
Evanston Township HSD 202 Cook $72,524,345 $28,372,236 $1,986,057 2.7%
Evergreen Park CHSD 231 Cook $15,337,026 $6,267,407 $438,718 2.9%
Evergreen Park ESD 124 Cook $23,184,952 $10,919,374 $764,356 3.3%
Flossmoor SD 161 Cook $28,419,355 $13,003,762 $910,263 3.2%
Ford Heights SD 169 Cook $10,867,877 $4,066,263 $284,638 2.6%
Forest Park SD 91 Cook $15,867,592 $6,609,229 $462,646 2.9%
Forest Ridge SD 142 Cook $16,558,016 $7,112,421 $497,869 3.0%
Franklin Park SD 84 Cook $17,259,427 $7,544,581 $528,121 3.1%
Gen George Patton SD 133 Cook $7,312,261 $2,624,004 $183,680 2.5%
Glencoe SD 35 Cook $24,022,082 $11,015,377 $771,076 3.2%
Glenview CCSD 34 Cook $63,357,851 $28,344,701 $1,984,129 3.1%
Golf ESD 67 Cook $8,484,390 $4,194,876 $293,641 3.5%
Harvey SD 152 Cook $30,562,651 $13,731,601 $961,212 3.1%
Hazel Crest SD 152 5 Cook $13,395,505 $4,915,065 $344,055 2.6%
Hillside SD 93 Cook $8,235,609 $3,121,216 $218,485 2.7%
Homewood SD 153 Cook $23,367,127 $11,264,923 $788,545 3.4%
Homewood-Flossmoor CHSD 233 Cook $47,208,604 $18,406,571 $1,288,460 2.7%
Hoover Schrum SD 157 Cook $11,399,913 $4,054,350 $283,805 2.5%
Indian Springs SD 109 Cook $30,175,117 $11,382,562 $796,779 2.6%
J S Morton HSD 201 Cook $95,357,904 $40,243,748 $2,817,062 3.0%
Kenilworth SD 38 Cook $14,780,897 $4,678,122 $327,469 2.2%
Kirby SD 140 Cook $41,848,387 $21,466,409 $1,502,649 3.6%
illinoispolicy.org 7
School district CountyTotal district expenditures
Teachers’ creditable earnings
Cost of 7% employer contribution
Percent of district total expenditures
Komarek SD 94 Cook $7,348,544 $2,771,966 $194,038 2.6%
La Grange Highlands SD 106 Cook $12,794,831 $7,547,621 $528,333 4.1%
La Grange SD 102 Cook $36,167,321 $17,959,093 $1,257,137 3.5%
La Grange South SD 105 Cook $24,350,551 $8,883,652 $621,856 2.6%
Lansing SD 158 Cook $25,170,800 $9,396,402 $657,748 2.6%
Lemont Township HSD 210 Cook $24,026,863 $10,249,766 $717,484 3.0%
Lemont-Bromberek CSD 113 Cook $27,422,815 $11,595,866 $811,711 3.0%
Leyden CHSD 212 Cook $64,146,164 $27,216,909 $1,905,184 3.0%
Lincoln ESD 156 Cook $11,401,195 $4,538,735 $317,711 2.8%
Lincolnwood SD 74 Cook $21,493,754 $8,933,677 $625,357 2.9%
Lindop SD 92 Cook $7,184,482 $2,855,041 $199,853 2.8%
Lyons SD 103 Cook $26,254,399 $11,499,953 $804,997 3.1%
Lyons Township HSD 204 Cook $64,618,207 $29,411,781 $2,058,825 3.2%
Maine Township HSD 207 Cook $135,002,111 $67,711,412 $4,739,799 3.5%
Mannheim SD 83 Cook $40,505,630 $17,775,305 $1,244,271 3.1%
Matteson ESD 162 Cook $41,652,020 $16,394,053 $1,147,584 2.8%
Maywood SD 89 Cook $58,830,656 $25,354,613 $1,774,823 3.0%
Midlothian SD 143 Cook $18,812,136 $8,598,593 $601,902 3.2%
Morton Grove SD 70 Cook $10,572,062 $5,446,235 $381,236 3.6%
Mt Prospect SD 57 Cook $24,588,732 $10,763,620 $753,453 3.1%
New Trier Township HSD 203 Cook $99,263,202 $42,297,180 $2,960,803 3.0%
Niles ESD 71 Cook $9,246,504 $4,387,954 $307,157 3.3%
Niles Township CHSD 219 Cook $120,143,754 $44,387,321 $3,107,112 2.6%
Norridge SD 80 Cook $10,084,591 $4,886,482 $342,054 3.4%
North Palos SD 117 Cook $35,284,515 $13,638,188 $954,673 2.7%
Northbrook ESD 27 Cook $29,347,869 $12,429,217 $870,045 3.0%
Northbrook SD 28 Cook $34,381,167 $14,258,141 $998,070 2.9%
Northbrook-Glenview SD 30 Cook $20,382,624 $9,462,615 $662,383 3.2%
Northfield Township HSD 225 Cook $103,948,069 $46,165,100 $3,231,557 3.1%
Oak Lawn CHSD 229 Cook $31,934,163 $12,538,947 $877,726 2.7%
Oak Lawn Hometown SD 123 Cook $40,225,876 $17,704,460 $1,239,312 3.1%
Oak Park ESD 97 Cook $75,172,675 $37,357,489 $2,615,024 3.5%
Oak Park-River Forest SD 200 Cook $64,889,304 $24,600,213 $1,722,015 2.7%
Orland Park SD 135 Cook $73,809,453 $33,434,260 $2,340,398 3.2%
Palatine CCSD 15 Cook $142,428,442 $68,883,057 $4,821,814 3.4%
Palatine Township HSD 211 Cook $221,059,190 $96,063,311 $6,724,432 3.0%
Palos CCSD 118 Cook $26,316,250 $10,323,519 $722,646 2.7%
Palos Heights SD 128 Cook $9,030,034 $3,875,407 $271,278 3.0%
Park Forest SD 163 Cook $34,165,444 $11,867,312 $830,712 2.4%
Park Ridge CCSD 64 Cook $67,041,846 $31,627,334 $2,213,913 3.3%
Pennoyer SD 79 Cook $4,421,193 $2,246,500 $157,255 3.6%
Pleasantdale SD 107 Cook $11,504,036 $5,180,962 $362,667 3.2%
Posen Robbins ESD 143 5 Cook $17,586,922 $6,828,565 $478,000 2.7%
Prairie Hills ESD 144 Cook $34,213,810 $13,492,830 $944,498 2.8%
illinoispolicy.org 8
School district CountyTotal district expenditures
Teachers’ creditable earnings
Cost of 7% employer contribution
Percent of district total expenditures
Prospect Heights SD 23 Cook $21,460,852 $9,808,113 $686,568 3.2%
Proviso Township HSD 209 Cook $75,161,095 $24,533,650 $1,717,355 2.3%
Reavis Township HSD 220 Cook $32,083,787 $12,686,762 $888,073 2.8%
Rhodes SD 84 5 Cook $9,263,558 $3,955,250 $276,868 3.0%
Rich Township HSD 227 Cook $70,950,602 $28,375,219 $1,986,265 2.8%
Ridgeland SD 122 Cook $26,418,069 $9,173,416 $642,139 2.4%
Ridgewood CHSD 234 Cook $29,083,961 $6,079,462 $425,562 1.5%
River Forest SD 90 Cook $19,027,355 $9,459,116 $662,138 3.5%
River Grove SD 85 5 Cook $7,855,340 $3,122,406 $218,568 2.8%
River Trails SD 26 Cook $24,967,083 $10,678,562 $747,499 3.0%
Riverside SD 96 Cook $18,726,699 $9,030,727 $632,151 3.4%
Riverside-Brookfield SD 208 Cook $46,807,400 $10,519,199 $736,344 1.6%
Rosemont ESD 78 Cook $4,342,417 $2,010,751 $140,753 3.2%
Sandridge SD 172 Cook $4,986,939 $2,127,623 $148,934 3.0%
Sauk Village CCSD 168 Cook $23,244,801 $7,968,710 $557,810 2.4%
Schaumburg CCSD 54 Cook $187,108,761 $89,801,102 $6,286,077 3.4%
Schiller Park SD 81 Cook $37,179,398 $6,785,059 $474,954 1.3%
Skokie SD 68 Cook $29,185,930 $11,933,597 $835,352 2.9%
Skokie SD 69 Cook $23,396,293 $9,534,998 $667,450 2.9%
Skokie SD 73 5 Cook $15,308,076 $6,534,724 $457,431 3.0%
Skokie-Fairview SD 72 Cook $9,808,113 $4,668,913 $326,824 3.3%
South Holland SD 150 Cook $11,099,716 $5,533,784 $387,365 3.5%
South Holland SD 151 Cook $31,123,306 $6,807,261 $476,508 1.5%
Steger SD 194 Cook $16,537,156 $7,625,788 $533,805 3.2%
Sunnybrook SD 171 Cook $11,901,803 $5,032,059 $352,244 3.0%
Sunset Ridge SD 29 Cook $12,565,347 $5,603,393 $392,238 3.1%
Thornton Fractional HSD 215 Cook $48,911,644 $21,034,800 $1,472,436 3.0%
Thornton SD 154 Cook $2,598,624 $1,062,892 $74,402 2.9%
Thornton Township HSD 205 Cook $119,852,518 $44,205,917 $3,094,414 2.6%
Tinley Park SD 146 Cook $35,020,622 $13,997,944 $979,856 2.8%
Township HSD 214 Cook $216,617,915 $92,898,504 $6,502,895 3.0%
Union Ridge SD 86 Cook $6,409,025 $2,995,858 $209,710 3.3%
West Harvey Dixmoor SD 147 Cook $21,537,226 $7,337,471 $513,623 2.4%
West Northfield SD 31 Cook $14,335,486 $6,294,301 $440,601 3.1%
Westchester SD 92 5 Cook $13,409,505 $6,107,059 $427,494 3.2%
Western Springs SD 101 Cook $15,408,754 $7,916,614 $554,163 3.6%
Wheeling CCSD 21 Cook $96,343,076 $48,713,578 $3,409,950 3.5%
Willow Springs SD 108 Cook $4,720,395 $1,814,244 $126,997 2.7%
Wilmette SD 39 Cook $50,972,028 $25,647,593 $1,795,332 3.5%
Winnetka SD 36 Cook $41,301,688 $16,714,365 $1,170,006 2.8%
Worth SD 127 Cook $10,280,685 $5,218,892 $365,322 3.6%
Hutsonville CUSD 1 Crawford $3,765,255 $1,599,504 $111,965 3.0%
Oblong CUSD 4 Crawford $6,127,723 $2,514,290 $176,000 2.9%
Palestine CUSD 3 Crawford $4,037,042 $1,878,908 $131,524 3.3%
illinoispolicy.org 9
School district CountyTotal district expenditures
Teachers’ creditable earnings
Cost of 7% employer contribution
Percent of district total expenditures
Robinson CUSD 2 Crawford $19,811,749 $6,505,544 $455,388 2.3%
Cumberland CUSD 77 Cumberland $10,131,934 $4,264,896 $298,543 2.9%
Neoga CUSD 3 Cumberland $10,973,085 $3,096,313 $216,742 2.0%
DeKalb CUSD 428 DeKalb $112,207,075 $32,367,091 $2,265,696 2.0%
Genoa-Kingston CUSD 424 DeKalb $19,255,238 $9,047,786 $633,345 3.3%
Hiawatha CUSD 426 DeKalb $7,817,324 $2,831,165 $198,182 2.5%
Hinckley Big Rock CUSD 429 DeKalb $11,639,035 $4,479,289 $313,550 2.7%
Indian Creek CUSD 425 DeKalb $9,298,718 $4,237,497 $296,625 3.2%
Sandwich CUSD 430 DeKalb $30,060,011 $11,490,219 $804,315 2.7%
Somonauk CUSD 432 DeKalb $11,154,811 $5,008,140 $350,570 3.1%
Sycamore CUSD 427 DeKalb $56,857,466 $20,759,144 $1,453,140 2.6%
Blue Ridge CUSD 18 DeWitt $10,102,809 $4,052,761 $283,693 2.8%
Clinton CUSD 15 DeWitt $20,838,042 $9,011,502 $630,805 3.0%
Arcola CUSD 306 Douglas $6,920,024 $2,964,730 $207,531 3.0%
Arthur CUSD 305 Douglas $5,101,652 $2,701,939 $189,136 3.7%
Tuscola CUSD 301 Douglas $11,572,060 $5,104,926 $357,345 3.1%
Villa Grove CUSD 302 Douglas $6,078,494 $2,845,252 $199,168 3.3%
Addison SD 4 DuPage $41,572,129 $20,874,652 $1,461,226 3.5%
Benjamin SD 25 DuPage $11,378,246 $5,219,212 $365,345 3.2%
Bensenville SD 2 DuPage $25,405,753 $12,198,877 $853,921 3.4%
Bloomingdale SD 13 DuPage $17,823,735 $7,264,250 $508,498 2.9%
Butler SD 53 DuPage $9,429,847 $4,650,625 $325,544 3.5%
Cass SD 63 DuPage $10,245,018 $4,671,348 $326,994 3.2%
Center Cass SD 66 DuPage $12,755,475 $6,293,360 $440,535 3.5%
Community Consolidated SD 180 DuPage $8,489,850 $4,257,720 $298,040 3.5%
Community CSD 93 DuPage $54,937,129 $26,014,223 $1,820,996 3.3%
Community Unit SD 200 DuPage $171,617,593 $87,733,325 $6,141,333 3.6%
Darien SD 61 DuPage $15,983,651 $8,349,592 $584,471 3.7%
Downers Grove CHS 99 DuPage $82,879,683 $38,032,402 $2,662,268 3.2%
Downers Grove GSD 58 DuPage $57,101,725 $27,743,635 $1,942,054 3.4%
DuPage HSD 88 DuPage $117,908,372 $28,753,429 $2,012,740 1.7%
Elmhurst SD 205 DuPage $111,437,668 $50,827,024 $3,557,892 3.2%
Fenton CHSD 100 DuPage $28,399,356 $12,063,658 $844,456 3.0%
Glen Ellyn CCSD 89 DuPage $38,185,177 $12,834,553 $898,419 2.4%
Glen Ellyn SD 41 DuPage $44,244,634 $21,959,911 $1,537,194 3.5%
Glenbard Township HSD 87 DuPage $128,452,055 $57,886,155 $4,052,031 3.2%
Gower SD 62 DuPage $12,096,234 $6,180,958 $432,667 3.6%
Hinsdale CCSD 181 DuPage $62,897,616 $30,136,854 $2,109,580 3.4%
Hinsdale Township HSD 86 DuPage $80,616,866 $39,441,762 $2,760,923 3.4%
Indian Prairie CUSD 204 DuPage $350,787,498 $163,293,294 $11,430,531 3.3%
Itasca SD 10 DuPage $12,084,532 $4,987,711 $349,140 2.9%
Keeneyville SD 20 DuPage $17,770,711 $8,582,485 $600,774 3.4%
Lake Park CHSD 108 DuPage $49,132,776 $19,519,881 $1,366,392 2.8%
Lisle CUSD 202 DuPage $26,896,515 $12,419,063 $869,334 3.2%
illinoispolicy.org 10
School district CountyTotal district expenditures
Teachers’ creditable earnings
Cost of 7% employer contribution
Percent of district total expenditures
Lombard SD 44 DuPage $42,081,649 $21,451,214 $1,501,585 3.6%
Maercker SD 60 DuPage $19,316,035 $8,640,500 $604,835 3.1%
Marquardt SD 15 DuPage $32,650,466 $14,404,156 $1,008,291 3.1%
Medinah ESD 11 DuPage $9,168,302 $4,177,270 $292,409 3.2%
Naperville CUSD 203 DuPage $268,955,118 $116,512,398 $8,155,868 3.0%
Queen Bee SD 16 DuPage $23,394,343 $10,661,134 $746,279 3.2%
Roselle SD 12 DuPage $8,470,294 $3,784,306 $264,901 3.1%
Salt Creek SD 48 DuPage $9,877,821 $4,257,375 $298,016 3.0%
Villa Park SD 45 DuPage $41,883,893 $20,380,566 $1,426,640 3.4%
West Chicago CHSD 94 DuPage $30,273,901 $12,352,591 $864,681 2.9%
West Chicago ESD 33 DuPage $48,983,325 $23,118,043 $1,618,263 3.3%
Westmont CUSD 201 DuPage $25,871,305 $12,106,857 $847,480 3.3%
Winfield SD 34 DuPage $5,240,799 $2,429,413 $170,059 3.2%
Wood Dale SD 7 DuPage $14,518,819 $7,297,012 $510,791 3.5%
Woodridge SD 68 DuPage $35,946,792 $17,810,026 $1,246,702 3.5%
Edgar County CUSD 6 Edgar $4,214,565 $1,892,582 $132,481 3.1%
Kansas CUSD 3 Edgar $3,500,890 $1,305,230 $91,366 2.6%
Paris CUSD 4 Edgar $6,059,253 $2,168,839 $151,819 2.5%
Paris-Union SD 95 Edgar $12,624,682 $4,425,645 $309,795 2.5%
Shiloh CUSD 1 Edgar $5,196,244 $2,468,069 $172,765 3.3%
Edwards County CUSD 1 Edwards $8,532,083 $4,274,542 $299,218 3.5%
Altamont CUSD 10 Effingham $7,950,027 $3,536,068 $247,525 3.1%
Beecher City CUSD 20 Effingham $4,546,489 $1,814,699 $127,029 2.8%
Dieterich CUSD 30 Effingham $4,209,772 $2,070,462 $144,932 3.4%
Effingham CUSD 40 Effingham $29,086,858 $11,957,571 $837,030 2.9%
Teutopolis CUSD 50 Effingham $13,347,263 $5,228,948 $366,026 2.7%
Brownstown CUSD 201 Fayette $4,790,077 $1,689,884 $118,292 2.5%
Ramsey CUSD 204 Fayette $4,655,741 $2,110,750 $147,753 3.2%
St Elmo CUSD 202 Fayette $4,544,554 $2,218,190 $155,273 3.4%
Vandalia CUSD 203 Fayette $16,568,491 $7,620,927 $533,465 3.2%
Gibson City-Melvin-Sibley 5 Ford $10,897,833 $5,530,145 $387,110 3.6%
Paxton-Buckley-Loda 10 Ford $14,607,968 $6,839,725 $478,781 3.3%
Akin CCSD 91 Franklin $1,239,551 $561,966 $39,338 3.2%
Benton CCSD 47 Franklin $9,440,639 $5,001,605 $350,112 3.7%
Benton CHSD 103 Franklin $6,632,681 $3,358,089 $235,066 3.5%
Christopher USD 99 Franklin $7,891,992 $3,973,090 $278,116 3.5%
Ewing Northern CCD 115 Franklin $2,123,977 $969,342 $67,854 3.2%
Frankfort CUSD 168 Franklin $14,897,663 $7,898,348 $552,884 3.7%
Sesser-Valier CUSD 196 Franklin $6,226,347 $3,139,098 $219,737 3.5%
Thompsonville CUSD 174 Franklin $3,237,359 $1,598,834 $111,918 3.5%
Zeigler Royalton CUSD 188 Franklin $5,613,748 $2,986,600 $209,062 3.7%
Astoria CUSD 1 Fulton $3,683,893 $1,514,845 $106,039 2.9%
Avon CUSD 176 Fulton $3,142,361 $1,441,673 $100,917 3.2%
Canton Union SD 66 Fulton $24,503,005 $11,004,212 $770,295 3.1%
illinoispolicy.org 11
School district CountyTotal district expenditures
Teachers’ creditable earnings
Cost of 7% employer contribution
Percent of district total expenditures
Fulton County CUSD 3 Fulton $5,250,245 $2,226,556 $155,859 3.0%
Lewistown CUSD 97 Fulton $7,283,949 $3,851,759 $269,623 3.7%
Spoon River Valley CUSD 4 Fulton $4,389,108 $1,888,013 $132,161 3.0%
V I T Community USD 2 Fulton $4,280,445 $1,830,021 $128,101 3.0%
Gallatin CUSD 7 Gallatin $7,862,043 $3,525,394 $246,778 3.1%
Carrollton CUSD 1 Greene $5,660,022 $2,465,201 $172,564 3.0%
Greenfield CUSD 10 Greene $4,772,858 $2,519,985 $176,399 3.7%
North Greene USD 3 Greene $9,423,164 $3,443,144 $241,020 2.6%
Braceville School District 75 Grundy $1,636,792 $608,444 $42,591 2.6%
Coal City CUSD 1 Grundy $41,222,182 $10,301,416 $721,099 1.7%
Gardner CCSD 72C Grundy $2,113,592 $788,597 $55,202 2.6%
Gardner Wilmington THSD 73 Grundy $3,079,132 $1,228,619 $86,003 2.8%
Mazon-Verona-Kinsman ESD 2C Grundy $5,099,465 $1,610,945 $112,766 2.2%
Minooka CCSD 201 Grundy $59,772,825 $11,454,774 $801,834 1.3%
Minooka CHS 111 Grundy $43,865,273 $11,324,420 $792,709 1.8%
Morris CHSD 101 Grundy $12,776,083 $4,679,717 $327,580 2.6%
Morris School District 54 Grundy $13,693,134 $4,164,860 $291,540 2.1%
Nettle Creek CCSD 24C Grundy $2,002,809 $530,911 $37,164 1.9%
Saratoga CCSD 60C Grundy $6,814,313 $2,544,937 $178,146 2.6%
South Wilmington CSD 74 Grundy $990,049 $403,763 $28,263 2.9%
Hamilton County CUSD 10 Hamilton $11,550,518 $5,075,455 $355,282 3.1%
Carthage Elementary Dist 317 Hancock $4,470,235 $1,826,275 $127,839 2.9%
Dallas Elementary SD 327 Hancock $2,545,158 $921,395 $64,498 2.5%
Hamilton CCSD 328 Hancock $5,811,158 $2,246,529 $157,257 2.7%
Illini West HSD 307 Hancock $4,861,800 $1,843,594 $129,052 2.7%
La Harpe CSD 347 Hancock $3,053,408 $1,216,841 $85,179 2.8%
Nauvoo-Colusa CUSD 325 Hancock $3,884,899 $1,415,458 $99,082 2.6%
Southeastern CUSD 337 Hancock $5,306,144 $2,289,566 $160,270 3.0%
Warsaw CUSD 316 Hancock $4,967,806 $2,107,063 $147,494 3.0%
Hardin County CUSD 1 Hardin $5,913,497 $2,413,005 $168,910 2.9%
West Central CUSD 235 Henderson $9,632,452 $4,393,917 $307,574 3.2%
Alwood CUSD 225 Henry $4,939,695 $2,269,458 $158,862 3.2%
Annawan CUSD 226 Henry $4,177,025 $2,050,461 $143,532 3.4%
Cambridge CUSD 227 Henry $5,098,790 $2,609,229 $182,646 3.6%
Colona School District 190 Henry $4,038,256 $1,909,141 $133,640 3.3%
Galva CUSD 224 Henry $5,934,262 $2,771,223 $193,986 3.3%
Geneseo CUSD 228 Henry $25,230,655 $10,491,262 $734,388 2.9%
Kewanee CUSD 229 Henry $15,324,687 $6,426,368 $449,846 2.9%
Orion CUSD 223 Henry $10,501,653 $4,993,138 $349,520 3.3%
Wethersfield CUSD 230 Henry $5,908,246 $2,557,559 $179,029 3.0%
Central CUSD 4 Iroquois $11,726,452 $5,068,227 $354,776 3.0%
Cissna Park CUSD 6 Iroquois $3,439,523 $1,894,096 $132,587 3.9%
Crescent - Iroquois CUSD 249 Iroquois $1,860,298 $728,235 $50,976 2.7%
Donovan CUSD 3 Iroquois $4,175,407 $1,720,642 $120,445 2.9%
illinoispolicy.org 12
School district CountyTotal district expenditures
Teachers’ creditable earnings
Cost of 7% employer contribution
Percent of district total expenditures
Iroquois County CUSD 9 Iroquois $11,431,040 $4,931,436 $345,201 3.0%
Iroquois West CUSD 10 Iroquois $8,561,911 $3,757,780 $263,045 3.1%
Milford CSD 280 Iroquois $3,810,418 $1,627,947 $113,956 3.0%
Milford Township HSD 233 Iroquois $2,569,391 $1,135,126 $79,459 3.1%
Carbondale CHSD 165 Jackson $15,803,644 $6,382,784 $446,795 2.8%
Carbondale Elementary SD 95 Jackson $17,323,935 $8,478,884 $593,522 3.4%
Desoto CCSD 86 Jackson $2,555,420 $1,172,390 $82,067 3.2%
Elverado CUSD 196 Jackson $4,565,837 $1,952,157 $136,651 3.0%
Giant City CCSD 130 Jackson $2,509,304 $1,137,776 $79,644 3.2%
Murphysboro CUSD 186 Jackson $25,551,768 $8,337,350 $583,614 2.3%
Trico CUSD 176 Jackson $8,283,899 $3,810,998 $266,770 3.2%
Unity Point CCSD 140 Jackson $6,879,147 $3,140,842 $219,859 3.2%
Jasper County CUSD 1 Jasper $14,685,215 $6,901,307 $483,091 3.3%
Bethel School District 82 Jefferson $1,201,815 $593,533 $41,547 3.5%
Dodds CCSD 7 Jefferson $1,402,531 $781,375 $54,696 3.9%
Farrington CCSD 99 Jefferson $660,696 $277,015 $19,391 2.9%
Field CCSD 3 Jefferson $2,085,323 $950,034 $66,502 3.2%
Grand Prairie CCSD 6 Jefferson $841,752 $428,297 $29,981 3.6%
Ina Community CSD 8 Jefferson $1,092,966 $512,308 $35,862 3.3%
McClellan CCSD 12 Jefferson $579,425 $305,670 $21,397 3.7%
Mt Vernon School District 80 Jefferson $19,731,598 $7,437,786 $520,645 2.6%
Mt Vernon Township HSD 201 Jefferson $14,137,998 $6,237,895 $436,653 3.1%
Opdyke-Belle Rive CCSD 5 Jefferson $1,585,206 $804,086 $56,286 3.6%
Rome CCSD 2 Jefferson $2,324,878 $1,167,067 $81,695 3.5%
Summersville SD 79 Jefferson $1,957,473 $1,130,106 $79,107 4.0%
Waltonville CUSD 1 Jefferson $3,232,208 $1,444,801 $101,136 3.1%
Webber Township HSD 204 Jefferson $1,674,429 $798,337 $55,884 3.3%
Woodlawn CCSD 4 Jefferson $2,841,821 $1,287,674 $90,137 3.2%
Woodlawn CHSD 205 Jefferson $2,053,688 $1,112,110 $77,848 3.8%
Jersey CUSD 100 Jersey $25,922,384 $11,727,036 $820,893 3.2%
East Dubuque USD 119 Jo Daviess $6,500,421 $2,992,467 $209,473 3.2%
Galena USD 120 Jo Daviess $9,317,840 $4,686,852 $328,080 3.5%
River Ridge CUSD 210 Jo Daviess $6,934,933 $3,340,206 $233,814 3.4%
Scales Mound CUSD 211 Jo Daviess $3,952,802 $1,674,777 $117,234 3.0%
Stockton CUSD 206 Jo Daviess $5,549,881 $2,675,460 $187,282 3.4%
Warren CUSD 205 Jo Daviess $9,041,394 $2,100,506 $147,035 1.6%
Buncombe CSD 43 Johnson $660,257 $213,496 $14,945 2.3%
Cypress School District 64 Johnson $1,410,285 $604,921 $42,344 3.0%
Goreville CUSD 1 Johnson $5,298,270 $2,340,569 $163,840 3.1%
New Simpson Hill CSD 32 Johnson $2,596,413 $1,089,430 $76,260 2.9%
Vienna School District 55 Johnson $4,958,765 $1,731,235 $121,186 2.4%
Vienna Township HSD 133 Johnson $3,630,459 $1,523,926 $106,675 2.9%
Aurora East USD 131 Kane $130,615,360 $50,303,420 $3,521,239 2.7%
Aurora West USD 129 Kane $134,024,496 $69,030,162 $4,832,111 3.6%
illinoispolicy.org 13
School district CountyTotal district expenditures
Teachers’ creditable earnings
Cost of 7% employer contribution
Percent of district total expenditures
Batavia USD 101 Kane $97,323,074 $34,116,628 $2,388,164 2.5%
Central CUSD 301 Kane $43,285,071 $18,613,158 $1,302,921 3.0%
Community USD 300 Kane $234,064,558 $92,184,845 $6,452,939 2.8%
Geneva CUSD 304 Kane $92,272,738 $32,717,976 $2,290,258 2.5%
Kaneland CUSD 302 Kane $72,961,679 $24,010,435 $1,680,730 2.3%
School District U46 Kane $430,659,798 $196,655,116 $13,765,858 3.2%
St Charles CUSD 303 Kane $165,690,509 $74,832,339 $5,238,264 3.2%
Bourbonnais SD 53 Kankakee $25,253,631 $10,507,766 $735,544 2.9%
Bradley Bourbonnais CHSD 307 Kankakee $30,330,884 $8,296,031 $580,722 1.9%
Bradley School District 61 Kankakee $15,932,740 $6,846,495 $479,255 3.0%
Grant Park CUSD 6 Kankakee $6,025,351 $2,614,466 $183,013 3.0%
Herscher CUSD 2 Kankakee $22,753,712 $9,018,128 $631,269 2.8%
Kankakee School District 111 Kankakee $63,737,370 $26,469,981 $1,852,899 2.9%
Manteno CUSD 5 Kankakee $21,731,401 $9,242,820 $646,997 3.0%
Momence CUSD 1 Kankakee $11,628,787 $5,266,190 $368,633 3.2%
Pembroke CCSD 259 Kankakee $4,539,847 $1,700,765 $119,054 2.6%
St Anne CCSD 256 Kankakee $3,353,724 $1,722,722 $120,591 3.6%
St Anne CHSD 302 Kankakee $3,779,282 $1,186,716 $83,070 2.2%
St George CCSD 258 Kankakee $4,152,429 $1,458,664 $102,106 2.5%
Lisbon CCSD 90 Kendall $1,058,657 $553,261 $38,728 3.7%
Newark CCSD 66 Kendall $2,088,466 $775,381 $54,277 2.6%
Newark CHSD 18 Kendall $3,416,798 $1,231,964 $86,238 2.5%
Oswego CUSD 308 Kendall $187,244,000 $61,314,165 $4,291,992 2.3%
Plano CUSD 88 Kendall $27,610,464 $8,979,926 $628,595 2.3%
Yorkville CUSD 115 Kendall $55,679,021 $20,077,387 $1,405,417 2.5%
Abingdon CUSD 217 Knox $6,797,366 $2,798,563 $195,899 2.9%
Galesburg CUSD 205 Knox $41,580,386 $26,563,963 $1,859,477 4.5%
Knoxville CUSD 202 Knox $10,548,836 $3,629,829 $254,088 2.4%
ROWVA CUSD 208 Knox $6,350,419 $3,060,927 $214,265 3.4%
Williamsfield CUSD 210 Knox $3,189,141 $1,401,138 $98,080 3.1%
Adlai Stevenson HSD 125 Lake $83,306,836 $33,528,726 $2,347,011 2.8%
Antioch CCSD 34 Lake $29,246,649 $12,819,718 $897,380 3.1%
Aptakisic-Tripp CCSD 102 Lake $32,092,863 $14,837,176 $1,038,602 3.2%
Bannockburn SD 106 Lake $5,096,659 $1,431,694 $100,219 2.0%
Barrington CUSD 220 Lake $140,931,817 $57,206,639 $4,004,465 2.8%
Beach Park CCSD 3 Lake $26,693,468 $11,497,775 $804,844 3.0%
Big Hollow School District 38 Lake $19,355,298 $6,426,010 $449,821 2.3%
Community High School Dist 117 Lake $45,665,124 $16,964,145 $1,187,490 2.6%
Deerfield School District 109 Lake $46,941,960 $22,593,264 $1,581,528 3.4%
Diamond Lake SD 76 Lake $15,303,741 $7,427,357 $519,915 3.4%
Emmons School District 33 Lake $4,284,052 $1,669,161 $116,841 2.7%
Fox Lake Grade SD 114 Lake $10,336,612 $4,001,108 $280,078 2.7%
Fremont School District 79 Lake $24,264,868 $10,409,903 $728,693 3.0%
Gavin School District 37 Lake $10,196,795 $3,825,214 $267,765 2.6%
illinoispolicy.org 14
School district CountyTotal district expenditures
Teachers’ creditable earnings
Cost of 7% employer contribution
Percent of district total expenditures
Grant CHSD 124 Lake $36,768,735 $8,323,654 $582,656 1.6%
Grass Lake School District 36 Lake $3,249,824 $1,317,668 $92,237 2.8%
Grayslake CCSD 46 Lake $44,439,282 $19,563,162 $1,369,421 3.1%
Grayslake CHSD 127 Lake $47,298,094 $17,263,305 $1,208,431 2.6%
Gurnee School District 56 Lake $26,870,959 $11,701,318 $819,092 3.0%
Hawthorn CCSD 73 Lake $53,237,584 $21,278,570 $1,489,500 2.8%
Highland Park Township HSD 113 Lake $90,290,837 $36,239,904 $2,536,793 2.8%
Kildeer Countryside CCSD 96 Lake $40,965,194 $20,540,860 $1,437,860 3.5%
Lake Bluff Elementary SD 65 Lake $22,235,524 $7,039,227 $492,746 2.2%
Lake Forest CHSD 115 Lake $49,276,159 $17,528,351 $1,226,985 2.5%
Lake Forest SD 67 Lake $32,909,631 $15,789,582 $1,105,271 3.4%
Lake Villa CCSD 41 Lake $29,091,856 $13,056,933 $913,985 3.1%
Lake Zurich CUSD 95 Lake $79,181,498 $34,370,670 $2,405,947 3.0%
Libertyville CHSD 128 Lake $69,628,916 $28,374,241 $1,986,197 2.9%
Libertyville SD 70 Lake $35,827,754 $13,621,643 $953,515 2.7%
Lincolnshire-Prairie View 103 Lake $26,019,524 $12,217,168 $855,202 3.3%
Millburn CCSD 24 Lake $16,014,797 $7,576,548 $530,358 3.3%
Mundelein CHSD 120 Lake $31,873,585 $13,642,424 $954,970 3.0%
Mundelein Elementary SD 75 Lake $24,879,808 $9,288,400 $650,188 2.6%
North Chicago SD 187 Lake $56,416,433 $19,783,348 $1,384,834 2.5%
North Shore SD 112 Lake $75,877,551 $33,459,418 $2,342,159 3.1%
Oak Grove SD 68 Lake $13,974,040 $7,501,297 $525,091 3.8%
Rondout School District 72 Lake $7,399,084 $2,103,249 $147,227 2.0%
Round Lake Area SD 116 Lake $72,365,432 $30,332,695 $2,123,289 2.9%
Warren Township HSD 121 Lake $73,294,850 $21,693,143 $1,518,520 2.1%
Wauconda CUSD 118 Lake $50,644,774 $24,248,653 $1,697,406 3.4%
Waukegan CUSD 60 Lake $180,639,258 $78,328,978 $5,483,028 3.0%
Winthrop Harbor SD 1 Lake $7,117,071 $3,149,754 $220,483 3.1%
Woodland CCSD 50 Lake $83,613,363 $34,306,905 $2,401,483 2.9%
Zion Elementary SD 6 Lake $32,870,814 $14,821,488 $1,037,504 3.2%
Zion-Benton Township HSD 126 Lake $40,272,227 $14,075,434 $985,280 2.4%
Allen-Otter Creek CCSD 65 LaSalle $1,220,248 $611,004 $42,770 3.5%
Deer Park CCSD 82 LaSalle $1,325,830 $636,433 $44,550 3.4%
Dimmick CCSD 175 LaSalle $1,879,606 $729,059 $51,034 2.7%
Earlville CUSD 9 LaSalle $5,304,710 $2,497,360 $174,815 3.3%
Grand Ridge CCSD 95 LaSalle $3,039,196 $1,583,988 $110,879 3.6%
La Salle Elementary SD 122 LaSalle $10,389,638 $4,482,724 $313,791 3.0%
La Salle-Peru Township HSD 120 LaSalle $15,882,071 $7,010,057 $490,704 3.1%
Leland CUSD 1 LaSalle $3,709,951 $1,713,174 $119,922 3.2%
Lostant CUSD 425 LaSalle $1,488,337 $484,555 $33,919 2.3%
Marseilles Elementary SD 150 LaSalle $5,694,380 $2,508,588 $175,601 3.1%
Mendota CCSD 289 LaSalle $11,921,794 $5,110,715 $357,750 3.0%
Mendota Township HSD 280 LaSalle $8,331,409 $3,504,336 $245,304 2.9%
Miller Township CCSD 210 LaSalle $2,171,166 $1,018,438 $71,291 3.3%
illinoispolicy.org 15
School district CountyTotal district expenditures
Teachers’ creditable earnings
Cost of 7% employer contribution
Percent of district total expenditures
Oglesby Elementary SD 125 LaSalle $4,866,771 $2,115,774 $148,104 3.0%
Ottawa Elementary SD 141 LaSalle $23,557,659 $9,555,431 $668,880 2.8%
Ottawa Township HSD 140 LaSalle $21,312,316 $8,943,679 $626,058 2.9%
Peru Elementary SD 124 LaSalle $15,530,488 $4,512,789 $315,895 2.0%
Rutland CCSD 230 LaSalle $1,561,154 $833,051 $58,314 3.7%
Seneca CCSD 170 LaSalle $6,600,980 $3,249,574 $227,470 3.4%
Seneca Township HSD 160 LaSalle $11,177,208 $3,903,159 $273,221 2.4%
Serena CUSD 2 LaSalle $13,438,345 $4,261,687 $298,318 2.2%
Streator Elementary SD 44 LaSalle $21,950,343 $8,817,110 $617,198 2.8%
Streator Township HSD 40 LaSalle $11,383,104 $5,269,216 $368,845 3.2%
Tonica CCSD 79 LaSalle $2,221,856 $907,003 $63,490 2.9%
Wallace CCSD 195 LaSalle $4,396,476 $1,445,977 $101,218 2.3%
Waltham CCSD 185 LaSalle $2,368,853 $937,110 $65,598 2.8%
Lawrence County CUSD 20 Lawrence $10,500,483 $4,945,017 $346,151 3.3%
Red Hill CUSD 10 Lawrence $9,182,694 $4,200,739 $294,052 3.2%
Amboy CUSD 272 Lee $8,563,426 $3,695,973 $258,718 3.0%
Ashton-Franklin Ctr CUSD 275 Lee $7,181,633 $2,860,702 $200,249 2.8%
Dixon USD 170 Lee $28,821,076 $14,037,108 $982,598 3.4%
Nelson Public SD 8 Lee $417,812 $198,218 $13,875 3.3%
Paw Paw CUSD 271 Lee $4,192,042 $1,770,856 $123,960 3.0%
Cornell CCSD 426 Livingston $1,364,922 $578,207 $40,474 3.0%
Dwight Common SD 232 Livingston $5,281,390 $2,940,947 $205,866 3.9%
Dwight Township HSD 230 Livingston $5,100,155 $1,948,266 $136,379 2.7%
Flanagan-Cornell UD 74 Livingston $4,502,369 $2,016,517 $141,156 3.1%
Odell CCSD 435 Livingston $1,794,343 $875,235 $61,266 3.4%
Pontiac CCSD 429 Livingston $12,105,790 $6,225,522 $435,787 3.6%
Pontiac Township HSD 90 Livingston $11,022,903 $4,636,154 $324,531 2.9%
Prairie Central CUSD 8 Livingston $21,531,138 $10,732,951 $751,307 3.5%
Rooks Creek CCSD 425 Livingston $665,871 $331,428 $23,200 3.5%
Saunemin CCSD 438 Livingston $2,300,712 $654,867 $45,841 2.0%
Streator Woodland CUSD 5 Livingston $5,108,344 $2,320,009 $162,401 3.2%
Tri Point CUSD 6J Livingston $7,381,696 $2,504,895 $175,343 2.4%
Chester-East Lincoln CCSD 61 Logan $2,811,236 $1,430,992 $100,169 3.6%
Hartsburg-Emden CUSD 21 Logan $2,763,829 $1,502,252 $105,158 3.8%
Lincoln CHSD 404 Logan $11,370,610 $4,997,199 $349,804 3.1%
Lincoln Elementary SD 27 Logan $11,547,628 $5,924,912 $414,744 3.6%
Mt Pulaski CUSD 23 Logan $5,767,159 $3,153,855 $220,770 3.8%
New Holland-Middletown ESD 88 Logan $1,352,365 $691,273 $48,389 3.6%
West Lincoln-Broadwell SD 92 Logan $3,061,010 $1,036,628 $72,564 2.4%
Argenta-Oreana CUSD 1 Macon $8,804,306 $3,864,948 $270,546 3.1%
Decatur School District 61 Macon $101,572,994 $49,731,622 $3,481,214 3.4%
Maroa Forsyth CUSD 2 Macon $15,911,841 $4,881,175 $341,682 2.1%
Meridian CUSD 15 Macon $8,865,606 $4,249,872 $297,491 3.4%
Mt Zion CUSD 3 Macon $19,984,860 $8,928,274 $624,979 3.1%
illinoispolicy.org 16
School district CountyTotal district expenditures
Teachers’ creditable earnings
Cost of 7% employer contribution
Percent of district total expenditures
Sangamon Valley CUSD 9 Macon $7,379,807 $3,429,070 $240,035 3.3%
Warrensburg-Latham CUSD 11 Macon $16,551,728 $4,532,258 $317,258 1.9%
Bunker Hill CUSD 8 Macoupin $5,741,837 $2,759,495 $193,165 3.4%
Carlinville CUSD 1 Macoupin $14,321,429 $5,709,063 $399,634 2.8%
Gillespie CUSD 7 Macoupin $11,861,910 $4,930,036 $345,103 2.9%
Girard CUSD 3 Macoupin $6,293,516 $2,311,291 $161,790 2.6%
Mt Olive USD 5 Macoupin $5,591,039 $2,581,230 $180,686 3.2%
Northwestern CUSD 2 Macoupin $4,309,726 $1,582,268 $110,759 2.6%
Southwestern CUSD 9 Macoupin $20,268,119 $7,657,500 $536,025 2.6%
Staunton CUSD 6 Macoupin $13,045,085 $4,953,634 $346,754 2.7%
Virden CUSD 4 Macoupin $7,573,421 $3,104,823 $217,338 2.9%
Alton CUSD 11 Madison $73,799,632 $31,876,134 $2,231,329 3.0%
Bethalto CUSD 8 Madison $29,927,814 $11,338,887 $793,722 2.7%
Collinsville CUSD 10 Madison $58,882,200 $27,432,791 $1,920,295 3.3%
East Alton SD 13 Madison $10,301,613 $4,664,655 $326,526 3.2%
East Alton-Wood River CHS 14 Madison $8,974,415 $3,264,970 $228,548 2.5%
Edwardsville CUSD 7 Madison $75,321,453 $34,951,545 $2,446,608 3.2%
Granite City CUSD 9 Madison $74,551,165 $30,691,316 $2,148,392 2.9%
Highland CUSD 5 Madison $32,145,243 $13,259,556 $928,169 2.9%
Madison CUSD 12 Madison $14,848,880 $5,272,222 $369,056 2.5%
Roxana CUSD 1 Madison $19,726,587 $10,153,943 $710,776 3.6%
Triad CUSD 2 Madison $35,926,811 $17,731,139 $1,241,180 3.5%
Venice CUSD 3 Madison $3,136,170 $559,306 $39,151 1.2%
Wood River-Hartford ESD 15 Madison $8,963,584 $3,632,373 $254,266 2.8%
Central City SD 133 Marion $2,161,937 $978,143 $68,470 3.2%
Centralia HSD 200 Marion $11,683,904 $4,812,769 $336,894 2.9%
Centralia SD 135 Marion $12,618,160 $5,976,155 $418,331 3.3%
Iuka CCSD 7 Marion $2,212,719 $976,764 $68,373 3.1%
Kell CSD 2 Marion $1,098,711 $519,204 $36,344 3.3%
Odin CHSD 700 Marion $838,902 $440,679 $30,848 3.7%
Odin School District 122 Marion $1,986,214 $926,692 $64,868 3.3%
Patoka CUSD 100 Marion $3,295,145 $1,229,428 $86,060 2.6%
Raccoon CSD 1 Marion $2,214,938 $956,392 $66,947 3.0%
Salem CHSD 600 Marion $7,724,273 $3,309,019 $231,631 3.0%
Salem School District 111 Marion $7,739,016 $4,142,350 $289,964 3.7%
Sandoval CUSD 501 Marion $5,205,263 $2,193,236 $153,527 2.9%
Selmaville CCSD 10 Marion $1,919,183 $1,015,707 $71,099 3.7%
South Central CUSD 401 Marion $6,857,036 $3,085,039 $215,953 3.1%
Henry-Senachwine CUSD 5 Marshall $6,902,869 $3,273,817 $229,167 3.3%
Midland CUSD 7 Marshall $7,476,733 $3,478,007 $243,460 3.3%
Havana CUSD 126 Mason $10,313,560 $4,794,670 $335,627 3.3%
Illini Central CUSD 189 Mason $8,511,097 $3,845,328 $269,173 3.2%
Midwest Central CUSD 191 Mason $11,166,070 $5,181,196 $362,684 3.2%
Joppa-Maple Grove USD 38 Massac $3,352,369 $1,275,390 $89,277 2.7%
illinoispolicy.org 17
School district CountyTotal district expenditures
Teachers’ creditable earnings
Cost of 7% employer contribution
Percent of district total expenditures
Massac USD 1 Massac $19,218,378 $9,086,497 $636,055 3.3%
Bushnell-Prairie CUSD 170 McDonough $7,251,400 $3,158,712 $221,110 3.0%
Macomb CUSD 185 McDonough $22,559,118 $8,945,965 $626,218 2.8%
West Prairie CUSD 103 McDonough $6,475,141 $3,094,925 $216,645 3.3%
Alden Hebron SD 19 McHenry $5,399,731 $2,357,049 $164,993 3.1%
Cary CCSD 26 McHenry $35,093,701 $17,285,837 $1,210,009 3.4%
Community HSD 155 McHenry $88,799,236 $46,513,578 $3,255,950 3.7%
Crystal Lake CCSD 47 McHenry $85,036,786 $42,300,759 $2,961,053 3.5%
Fox River Grove CSD 3 McHenry $7,360,495 $2,971,855 $208,030 2.8%
Harrison School District 36 McHenry $5,820,844 $1,804,743 $126,332 2.2%
Harvard CUSD 50 McHenry $40,191,367 $10,299,978 $720,998 1.8%
Huntley CSD 158 McHenry $82,497,312 $36,527,637 $2,556,935 3.1%
Johnsburg CUSD 12 McHenry $27,745,181 $12,926,700 $904,869 3.3%
Marengo CHSD 154 McHenry $12,367,728 $4,383,091 $306,816 2.5%
Marengo-Union ECSD 165 McHenry $9,820,443 $4,123,546 $288,648 2.9%
McHenry CCSD 15 McHenry $48,514,385 $20,508,084 $1,435,566 3.0%
McHenry CHSD 156 McHenry $31,455,318 $14,223,867 $995,671 3.2%
Nippersink School District 2 McHenry $13,434,005 $6,487,259 $454,108 3.4%
Prairie Grove CSD 46 McHenry $11,260,049 $5,352,874 $374,701 3.3%
Richmond Burton HSCD 157 McHenry $12,498,808 $4,357,608 $305,033 2.4%
Riley CCSD 18 McHenry $3,880,160 $1,400,079 $98,006 2.5%
Woodstock CUSD 200 McHenry $82,697,424 $31,991,917 $2,239,434 2.7%
Bloomington SD 87 McLean $67,299,185 $28,482,627 $1,993,784 3.0%
Heyworth CUSD 4 McLean $9,688,987 $4,463,697 $312,459 3.2%
Le Roy CUSD 2 McLean $9,940,338 $3,599,798 $251,986 2.5%
Lexington CUSD 7 McLean $7,573,080 $3,063,786 $214,465 2.8%
McLean County USD 5 McLean $190,712,364 $60,940,030 $4,265,802 2.2%
Olympia CUSD 16 McLean $22,251,848 $7,972,324 $558,063 2.5%
Ridgeview CUSD 19 McLean $8,208,613 $3,445,445 $241,181 2.9%
Tri-Valley CUSD 3 McLean $12,652,065 $5,750,962 $402,567 3.2%
Athens CUSD 213 Menard $9,883,974 $3,739,155 $261,741 2.6%
Greenview CUSD 200 Menard $2,677,182 $1,275,189 $89,263 3.3%
Porta CUSD 202 Menard $13,735,151 $4,433,539 $310,348 2.3%
Mercer County SD 404 Mercer $13,095,819 $6,090,295 $426,321 3.3%
Columbia CUSD 4 Monroe $41,863,341 $8,957,492 $627,024 1.5%
Valmeyer CUSD 3 Monroe $4,603,730 $2,500,006 $175,000 3.8%
Waterloo CUSD 5 Monroe $31,511,532 $11,784,138 $824,890 2.6%
Hillsboro CUSD 3 Montgomery $20,074,647 $8,897,406 $622,818 3.1%
Litchfield CUSD 12 Montgomery $14,030,957 $5,840,010 $408,801 2.9%
Nokomis CUSD 22 Montgomery $7,536,146 $2,787,336 $195,114 2.6%
Panhandle CUSD 2 Montgomery $5,249,639 $2,330,348 $163,124 3.1%
Franklin CUSD 1 Morgan $3,562,958 $1,647,694 $115,339 3.2%
Jacksonville SD 117 Morgan $34,495,821 $15,748,108 $1,102,368 3.2%
Meredosia-Chambersburg SD 11 Morgan $3,474,230 $1,365,145 $95,560 2.8%
illinoispolicy.org 18
School district CountyTotal district expenditures
Teachers’ creditable earnings
Cost of 7% employer contribution
Percent of district total expenditures
Triopia CUSD 27 Morgan $3,843,424 $1,846,215 $129,235 3.4%
Waverly CUSD 6 Morgan $4,210,109 $2,076,996 $145,390 3.5%
Lovington CUSD 303 Moultrie $3,136,262 $1,268,728 $88,811 2.8%
Okaw Valley CUSD 302 Moultrie $5,434,693 $2,419,024 $169,332 3.1%
Sullivan CUSD 300 Moultrie $9,876,770 $4,286,498 $300,055 3.0%
Byron CUSD 226 Ogle $30,789,123 $10,227,426 $715,920 2.3%
Creston CCSD 161 Ogle $1,152,943 $642,854 $45,000 3.9%
Forrestville Valley CUSD 221 Ogle $9,534,581 $4,634,733 $324,431 3.4%
Kings CSD 144 Ogle $1,665,342 $752,131 $52,649 3.2%
Meridian CUSD 223 Ogle $18,886,693 $8,133,687 $569,358 3.0%
Oregon CUSD 220 Ogle $15,980,807 $7,984,675 $558,927 3.5%
Polo CUSD 222 Ogle $6,371,621 $3,295,214 $230,665 3.6%
Rochelle CCSD 231 Ogle $16,343,206 $8,617,530 $603,227 3.7%
Rochelle Township HSD 212 Ogle $14,081,113 $5,888,207 $412,174 2.9%
Bartonville SD 66 Peoria $3,082,131 $994,284 $69,600 2.3%
Brimfield CUSD 309 Peoria $6,132,791 $3,145,524 $220,187 3.6%
Dunlap CUSD 323 Peoria $32,007,714 $12,533,263 $877,328 2.7%
Elmwood CUSD 322 Peoria $6,926,415 $2,881,318 $201,692 2.9%
Farmington Central CUSD 265 Peoria $12,873,810 $4,376,619 $306,363 2.4%
Hollis CSD 328 Peoria $1,570,688 $676,808 $47,377 3.0%
Illini Bluffs CUSD 327 Peoria $8,914,117 $3,341,588 $233,911 2.6%
Illinois Valley Central 321 Peoria $28,525,024 $9,164,579 $641,521 2.2%
Limestone CHSD 310 Peoria $14,980,967 $4,818,379 $337,287 2.3%
Limestone Walters CCSD 316 Peoria $1,738,489 $663,232 $46,426 2.7%
Monroe SD 70 Peoria $2,629,241 $1,050,280 $73,520 2.8%
Norwood Elementary SD 63 Peoria $4,056,716 $1,695,153 $118,661 2.9%
Oak Grove East SD 68 Peoria $3,834,091 $1,875,229 $131,266 3.4%
Peoria Heights CUSD 325 Peoria $9,786,899 $3,109,225 $217,646 2.2%
Peoria SD 150 Peoria $179,943,519 $70,988,972 $4,969,228 2.8%
Pleasant Hill SD 69 Peoria $2,102,518 $955,570 $66,890 3.2%
Pleasant Valley SD 62 Peoria $4,702,551 $1,665,317 $116,572 2.5%
Princeville CUSD 326 Peoria $7,059,552 $3,401,474 $238,103 3.4%
Community CSD 204 Perry $1,672,336 $752,864 $52,700 3.2%
Duquoin CUSD 300 Perry $13,745,737 $6,370,054 $445,904 3.2%
Pinckneyville CHSD 101 Perry $4,591,224 $2,353,079 $164,716 3.6%
Pinckneyville SD 50 Perry $5,101,567 $2,435,301 $170,471 3.3%
Tamaroa SD 5 Perry $1,269,494 $660,247 $46,217 3.6%
Atwood Hammond CUSD 39 Piatt $4,164,235 $1,736,896 $121,583 2.9%
Bement CUSD 5 Piatt $4,463,563 $1,659,195 $116,144 2.6%
Cerro Gordo CUSD 100 Piatt $5,816,982 $2,313,973 $161,978 2.8%
Deland-Weldon CUSD 57 Piatt $2,548,918 $1,094,130 $76,589 3.0%
Monticello CUSD 25 Piatt $15,622,499 $6,975,974 $488,318 3.1%
Griggsville-Perry CUSD 4 Pike $5,051,809 $2,032,664 $142,286 2.8%
Pikeland CUSD 10 Pike $12,848,152 $5,291,101 $370,377 2.9%
illinoispolicy.org 19
School district CountyTotal district expenditures
Teachers’ creditable earnings
Cost of 7% employer contribution
Percent of district total expenditures
Pleasant Hill CUSD 3 Pike $4,369,715 $1,721,596 $120,512 2.8%
Western CUSD 12 Pike $6,910,506 $2,688,322 $188,183 2.7%
Pope County CUSD 1 Pope $4,821,333 $2,181,546 $152,708 3.2%
Century CUSD 100 Pulaski $4,720,867 $2,134,646 $149,425 3.2%
Meridian CUSD 101 Pulaski $8,538,829 $3,359,442 $235,161 2.8%
Putnam County CUSD 535 Putnam $10,434,694 $4,406,224 $308,436 3.0%
Chester CUSD 139 Randolph $9,930,381 $4,287,257 $300,108 3.0%
Coulterville USD 1 Randolph $2,153,437 $1,361,483 $95,304 4.4%
Prairie Du Rocher CCSD 134 Randolph $1,495,109 $797,042 $55,793 3.7%
Red Bud CUSD 132 Randolph $10,109,565 $4,526,207 $316,834 3.1%
Sparta CUSD 140 Randolph $14,121,125 $6,036,309 $422,542 3.0%
Steeleville CUSD 138 Randolph $3,830,232 $1,805,345 $126,374 3.3%
East Richland CUSD 1 Richland $23,419,760 $8,456,267 $591,939 2.5%
West Richland CUSD 2 Richland $3,436,085 $1,662,250 $116,358 3.4%
Carbon Cliff-Barstow SD 36 Rock Island $3,024,348 $1,350,535 $94,537 3.1%
East Moline SD 37 Rock Island $27,114,452 $14,681,467 $1,027,703 3.8%
Hampton School District 29 Rock Island $2,000,101 $938,857 $65,720 3.3%
Moline USD 40 Rock Island $82,431,383 $43,149,472 $3,020,463 3.7%
Riverdale CUSD 100 Rock Island $10,742,067 $5,196,945 $363,786 3.4%
Rock Island SD 41 Rock Island $83,096,679 $33,973,382 $2,378,137 2.9%
Rockridge CUSD 300 Rock Island $12,836,165 $6,008,169 $420,572 3.3%
Sherrard CUSD 200 Rock Island $14,725,337 $7,095,482 $496,684 3.4%
Silvis School District 34 Rock Island $5,828,580 $2,740,089 $191,806 3.3%
United Township HSD 30 Rock Island $18,598,584 $9,130,852 $639,160 3.4%
Carrier Mills-Stonefort SD 2 Saline $4,632,975 $2,528,974 $177,028 3.8%
Eldorado CUSD 4 Saline $10,135,767 $4,054,420 $283,809 2.8%
Galatia CUSD 1 Saline $3,913,193 $1,751,779 $122,625 3.1%
Harrisburg CUSD 3 Saline $19,470,548 $8,648,208 $605,375 3.1%
Auburn CUSD 10 Sangamon $14,892,305 $4,999,586 $349,971 2.4%
Ball Chatham CUSD 5 Sangamon $49,995,202 $15,380,402 $1,076,628 2.2%
New Berlin CUSD 16 Sangamon $10,821,138 $2,824,734 $197,731 1.8%
Pawnee CUSD 11 Sangamon $6,055,067 $2,616,313 $183,142 3.0%
Pleasant Plains CUSD 8 Sangamon $12,696,293 $5,638,744 $394,712 3.1%
Riverton CUSD 14 Sangamon $13,732,867 $5,816,617 $407,163 3.0%
Rochester CUSD 3A Sangamon $31,952,268 $8,949,407 $626,458 2.0%
Springfield SD 186 Sangamon $196,168,169 $86,297,127 $6,040,799 3.1%
Tri City CUSD 1 Sangamon $6,173,977 $2,249,127 $157,439 2.6%
Williamsville CUSD 15 Sangamon $12,168,245 $5,058,054 $354,064 2.9%
Schuyler - Industry CUSD 5 Schuyler $12,468,705 $4,919,651 $344,376 2.8%
Scott-Morgan Cnty CUSD 2 Scott $2,486,899 $1,218,701 $85,309 3.4%
Winchester CUSD 1 Scott $5,928,797 $2,816,706 $197,169 3.3%
Central A & M CUSD 21 Shelby $8,614,418 $4,049,536 $283,468 3.3%
Cowden-Herrick CUD 3A Shelby $4,364,545 $1,987,129 $139,099 3.2%
Shelbyville CUSD 4 Shelby $10,767,102 $5,712,109 $399,848 3.7%
illinoispolicy.org 20
School district CountyTotal district expenditures
Teachers’ creditable earnings
Cost of 7% employer contribution
Percent of district total expenditures
Stewardson-Strasburg CUSD 5 Shelby $4,106,601 $1,984,272 $138,899 3.4%
Windsor CUSD 1 Shelby $3,546,893 $1,872,530 $131,077 3.7%
Belle Valley SD 119 St Clair $13,709,855 $4,134,234 $289,396 2.1%
Belleville SD 118 St Clair $38,940,752 $17,804,666 $1,246,327 3.2%
Belleville THSD 201 St Clair $70,039,228 $25,937,209 $1,815,605 2.6%
Brooklyn USD 188 St Clair $3,029,997 $1,204,676 $84,327 2.8%
Cahokia CUSD 187 St Clair $60,514,384 $25,311,358 $1,771,795 2.9%
Central School District 104 St Clair $7,691,544 $2,580,753 $180,653 2.3%
Dupo CUSD 196 St Clair $11,671,787 $5,604,207 $392,295 3.4%
East St Louis SD 189 St Clair $121,423,905 $46,693,611 $3,268,553 2.7%
Freeburg CCSD 70 St Clair $6,151,021 $3,190,607 $223,343 3.6%
Freeburg CHSD 77 St Clair $6,991,343 $3,279,031 $229,532 3.3%
Grant CCSD 110 St Clair $8,331,888 $3,965,844 $277,609 3.3%
Harmony Emge SD 175 St Clair $9,550,945 $4,032,927 $282,305 3.0%
High Mount SD 116 St Clair $4,370,109 $2,027,206 $141,904 3.2%
Lebanon CUSD 9 St Clair $8,443,338 $3,762,486 $263,374 3.1%
Marissa CUSD 40 St Clair $5,978,019 $2,999,960 $209,997 3.5%
Mascoutah CUSD 19 St Clair $53,218,090 $15,882,120 $1,111,748 2.1%
Millstadt CCSD 160 St Clair $7,307,463 $3,523,072 $246,615 3.4%
New Athens CUSD 60 St Clair $7,561,967 $2,563,036 $179,413 2.4%
OFallon CCSD 90 St Clair $38,948,978 $14,939,769 $1,045,784 2.7%
OFallon THSD 203 St Clair $35,641,975 $11,976,109 $838,328 2.4%
Pontiac-Wm Holliday SD 105 St Clair $9,252,918 $3,714,371 $260,006 2.8%
Shiloh Village SD 85 St Clair $5,939,101 $2,534,928 $177,445 3.0%
Signal Hill SD 181 St Clair $4,188,126 $1,909,804 $133,686 3.2%
Smithton CCSD 130 St Clair $3,774,724 $1,568,195 $109,774 2.9%
St Libory CSD 30 St Clair $830,869 $492,397 $34,468 4.1%
Whiteside SD 115 St Clair $12,445,712 $5,721,622 $400,514 3.2%
Wolf Branch SD 113 St Clair $13,438,167 $3,983,974 $278,878 2.1%
Bradford CUSD 1 Stark $4,026,429 $962,151 $67,351 1.7%
Stark County CUSD 100 Stark $8,305,052 $3,731,671 $261,217 3.1%
Dakota CUSD 201 Stephenson $9,476,582 $4,423,745 $309,662 3.3%
Freeport School District 145 Stephenson $45,581,663 $20,990,244 $1,469,317 3.2%
Lena Winslow CUSD 202 Stephenson $8,526,477 $3,687,954 $258,157 3.0%
Orangeville CUSD 203 Stephenson $4,264,743 $2,256,466 $157,953 3.7%
Pearl City CUSD 200 Stephenson $5,248,734 $2,407,749 $168,542 3.2%
Central School District 51 Tazewell $10,461,920 $3,133,017 $219,311 2.1%
Creve Coeur SD 76 Tazewell $6,152,147 $2,636,137 $184,530 3.0%
Deer Creek-Mackinaw CUSD 701 Tazewell $11,441,012 $4,783,311 $334,832 2.9%
Delavan CUSD 703 Tazewell $4,850,379 $2,514,380 $176,007 3.6%
District 50 Schools Tazewell $7,236,795 $2,811,325 $196,793 2.7%
East Peoria CHSD 309 Tazewell $21,360,470 $5,386,907 $377,084 1.8%
East Peoria SD 86 Tazewell $25,411,823 $7,859,556 $550,169 2.2%
Morton CUSD 709 Tazewell $26,682,938 $12,613,587 $882,951 3.3%
illinoispolicy.org 21
School district CountyTotal district expenditures
Teachers’ creditable earnings
Cost of 7% employer contribution
Percent of district total expenditures
N Pekin-Marquette Heights SD 102 Tazewell $5,061,421 $2,661,038 $186,273 3.7%
Pekin CHSD 303 Tazewell $22,119,245 $8,079,586 $565,571 2.6%
Pekin Public SD 108 Tazewell $33,394,696 $16,522,770 $1,156,594 3.5%
Rankin CSD 98 Tazewell $2,302,371 $892,148 $62,450 2.7%
Robein School District 85 Tazewell $1,907,902 $951,219 $66,585 3.5%
South Pekin SD 137 Tazewell $2,084,768 $1,033,843 $72,369 3.5%
Spring Lake CCSD 606 Tazewell $804,140 $245,130 $17,159 2.1%
Tremont CUSD 702 Tazewell $9,709,655 $4,483,065 $313,815 3.2%
Washington CHSD 308 Tazewell $13,691,863 $6,035,948 $422,516 3.1%
Washington School District 52 Tazewell $7,532,211 $3,127,598 $218,932 2.9%
Anna CCSD 37 Union $6,098,074 $2,786,775 $195,074 3.2%
Anna Jonesboro CHSD 81 Union $4,978,943 $2,505,586 $175,391 3.5%
Cobden Unit District 17 Union $5,338,903 $2,564,336 $179,504 3.4%
Dongola Unit District 66 Union $3,080,347 $1,165,922 $81,615 2.6%
Jonesboro CCSD 43 Union $4,314,459 $1,770,795 $123,956 2.9%
Lick Creek CCSD 16 Union $997,779 $459,823 $32,188 3.2%
Shawnee CUSD 84 Union $5,748,370 $2,215,341 $155,074 2.7%
Armstrong THSD 225 Vermilion $1,954,069 $877,101 $61,397 3.1%
Armstrong-Ellis CSD 61 Vermilion $1,151,554 $618,436 $43,291 3.8%
Bismarck CUSD 1 Vermilion $8,389,684 $3,999,858 $279,990 3.3%
Catlin CUSD 5 Vermilion $4,694,405 $2,223,319 $155,632 3.3%
Danville CCSD 118 Vermilion $66,958,111 $29,450,867 $2,061,561 3.1%
Georgetown-Ridge Farm CUD 4 Vermilion $11,560,707 $4,906,818 $343,477 3.0%
Hoopeston Area CUSD 11 Vermilion $11,339,711 $5,544,804 $388,136 3.4%
Jamaica CUSD 12 Vermilion $4,654,485 $2,173,856 $152,170 3.3%
Oakwood CUSD 76 Vermilion $11,198,103 $4,283,994 $299,880 2.7%
Potomac CUSD 10 Vermilion $2,192,661 $748,850 $52,420 2.4%
Rossville-Alvin CUSD 7 Vermilion $3,506,715 $1,126,664 $78,866 2.2%
Westville CUSD 2 Vermilion $11,231,376 $4,436,855 $310,580 2.8%
Allendale CCSD 17 Wabash $1,828,509 $518,861 $36,320 2.0%
Wabash CUSD 348 Wabash $15,373,546 $6,530,032 $457,102 3.0%
Monmouth - Roseville CUSD 238 Warren $16,349,356 $6,842,546 $478,978 2.9%
United SD 304 Warren $9,745,666 $4,202,787 $294,195 3.0%
Ashley CCSD 15 Washington $1,523,973 $795,120 $55,658 3.7%
Hoyleton CSD 29 Washington $740,455 $361,668 $25,317 3.4%
Irvington CCSD 11 Washington $831,488 $387,697 $27,139 3.3%
Nashville CCSD 49 Washington $4,861,050 $2,395,537 $167,688 3.4%
Nashville CHSD 99 Washington $4,904,958 $2,552,847 $178,699 3.6%
Oakdale CCSD 1 Washington $779,932 $390,077 $27,305 3.5%
West Washington CUSD 10 Washington $5,107,543 $2,470,023 $172,902 3.4%
Fairfield CHSD 225 Wayne $4,652,712 $2,086,859 $146,080 3.1%
Fairfield Public SD 112 Wayne $5,663,413 $2,794,222 $195,596 3.5%
Geff CCSD 14 Wayne $795,949 $441,999 $30,940 3.9%
Jasper CCSD 17 Wayne $1,548,895 $645,164 $45,161 2.9%
illinoispolicy.org 22
School district CountyTotal district expenditures
Teachers’ creditable earnings
Cost of 7% employer contribution
Percent of district total expenditures
New Hope CCSD 6 Wayne $1,589,881 $719,165 $50,342 3.2%
North Wayne CUSD 200 Wayne $3,935,147 $2,070,638 $144,945 3.7%
Wayne City CUSD 100 Wayne $5,193,056 $2,258,132 $158,069 3.0%
Carmi-White Cnty CUSD 5 White $14,413,858 $6,928,795 $485,016 3.4%
Grayville CUSD 1 White $2,702,093 $1,338,930 $93,725 3.5%
Norris City-Omaha-Enfield SD 3 White $6,267,610 $2,791,672 $195,417 3.1%
East Coloma SD 12 Whiteside $2,448,158 $1,142,369 $79,966 3.3%
Erie CUSD 1 Whiteside $11,854,062 $5,061,407 $354,298 3.0%
Montmorency CCSD 145 Whiteside $2,463,147 $1,380,102 $96,607 3.9%
Morrison CUSD 6 Whiteside $10,613,497 $5,235,755 $366,503 3.5%
Prophetstown-Lyndon-Tampico CUSD3
Whiteside $8,818,497 $4,199,854 $293,990 3.3%
River Bend CUSD 2 Whiteside $9,811,732 $4,296,185 $300,733 3.1%
Riverdale School District 14 Whiteside $956,355 $485,945 $34,016 3.6%
Rock Falls Elementary SD 13 Whiteside $8,965,298 $4,531,609 $317,213 3.5%
Rock Falls Township HSD 301 Whiteside $9,000,691 $3,937,172 $275,602 3.1%
Sterling CUSD 5 Whiteside $34,631,886 $14,232,007 $996,240 2.9%
Beecher CUSD 200U Will $11,776,187 $4,881,742 $341,722 2.9%
Chaney-Monge SD 88 Will $4,117,132 $1,706,636 $119,464 2.9%
Channahon School District 17 Will $16,196,384 $5,085,907 $356,013 2.2%
Crete Monee CUSD 201U Will $65,837,814 $27,402,720 $1,918,190 2.9%
Elwood CCSD 203 Will $3,653,811 $1,326,846 $92,879 2.5%
Fairmont School District 89 Will $5,347,016 $1,946,562 $136,259 2.5%
Frankfort CCSD 157C Will $30,937,349 $11,103,954 $777,277 2.5%
Homer CCSD 33 Will $53,081,727 $15,167,254 $1,061,708 2.0%
Joliet School District 86 Will $110,214,470 $43,751,530 $3,062,607 2.8%
Joliet Township HSD 204 Will $104,305,678 $32,569,434 $2,279,860 2.2%
Laraway CCSD 70 Will $6,654,631 $2,483,925 $173,875 2.6%
Lincoln-Way CHSD 210 Will $114,280,891 $42,293,845 $2,960,569 2.6%
Lockport School District 91 Will $6,027,511 $2,692,389 $188,467 3.1%
Lockport Township HSD 205 Will $50,005,089 $21,113,814 $1,477,967 3.0%
Manhattan School District 114 Will $12,651,548 $4,609,905 $322,693 2.6%
Mokena School District 159 Will $20,420,217 $7,537,402 $527,618 2.6%
New Lenox School District 122 Will $56,558,337 $22,738,416 $1,591,689 2.8%
Peotone CUSD 207 Will $22,746,751 $8,200,827 $574,058 2.5%
Plainfield SD 202 Will $297,219,254 $125,604,556 $8,792,319 3.0%
Reed Custer CUSD 255 Will $21,783,387 $10,427,707 $729,939 3.4%
Richland School District 88A Will $8,996,095 $4,467,127 $312,699 3.5%
Rockdale School District 84 Will $3,199,202 $1,131,010 $79,171 2.5%
Summit Hill SD 161 Will $35,609,435 $16,162,448 $1,131,371 3.2%
Taft School District 90 Will $2,679,533 $1,157,155 $81,001 3.0%
Troy CCSD 30C Will $47,802,540 $16,684,613 $1,167,923 2.4%
Union School District 81 Will $5,570,261 $781,566 $54,710 1.0%
Valley View CUSD 365 Will $211,872,578 $89,543,615 $6,268,053 3.0%

illinoispolicy.org 23
School district CountyTotal district expenditures
Teachers’ creditable earnings
Cost of 7% employer contribution
Percent of district total expenditures
Will Cnty School District 92 Will $20,881,337 $8,838,307 $618,682 3.0%
Wilmington CUSD 209 Will $19,219,282 $5,336,654 $373,566 1.9%
Carterville CUSD 5 Williamson $27,475,513 $7,116,803 $498,176 1.8%
Crab Orchard CUSD 3 Williamson $4,030,121 $1,405,830 $98,408 2.4%
Herrin CUSD 4 Williamson $26,429,289 $9,028,146 $631,970 2.4%
Johnston City CUSD 1 Williamson $11,568,110 $4,262,485 $298,374 2.6%
Marion CUSD 2 Williamson $37,555,415 $16,012,955 $1,120,907 3.0%
Durand CUSD 322 Winnebago $9,225,811 $3,970,291 $277,920 3.0%
Harlem USD 122 Winnebago $85,816,234 $39,255,890 $2,747,912 3.2%
Hononegah CHSD 207 Winnebago $25,083,412 $10,077,039 $705,393 2.8%
Kinnikinnick CCSD 131 Winnebago $16,888,819 $9,023,824 $631,668 3.7%
Pecatonica CUSD 321 Winnebago $9,639,076 $4,195,490 $293,684 3.0%
Prairie Hill CCSD 133 Winnebago $8,608,221 $3,098,371 $216,886 2.5%
Rockford School District 205 Winnebago $338,049,697 $149,861,050 $10,490,273 3.1%
Rockton School District 140 Winnebago $14,330,488 $7,000,129 $490,009 3.4%
Shirland CCSD 134 Winnebago $1,666,455 $754,590 $52,821 3.2%
South Beloit CUSD 320 Winnebago $10,749,062 $3,787,704 $265,139 2.5%
Winnebago CUSD 323 Winnebago $18,168,943 $7,460,915 $522,264 2.9%
El Paso - Gridley CUSD 11 Woodford $13,860,459 $5,991,671 $419,417 3.0%
Eureka CUSD 140 Woodford $13,271,160 $6,672,986 $467,109 3.5%
Fieldcrest CUSD 6 Woodford $12,430,765 $5,939,489 $415,764 3.3%
Germantown Hills SD 69 Woodford $7,628,293 $3,456,418 $241,949 3.2%
Lowpoint-Washburn CUSD 21 Woodford $4,183,366 $1,951,372 $136,596 3.3%
Metamora CCSD 1 Woodford $9,665,371 $2,820,744 $197,452 2.0%
Metamora Township HSD 122 Woodford $11,304,030 $4,642,393 $324,967 2.9%
Riverview CCSD 2 Woodford $2,162,705 $952,961 $66,707 3.1%
Roanoke Benson CUSD 60 Woodford $5,791,144 $2,639,843 $184,789 3.2%
Total $21,035,926,909 $8,809,667,026 $616,676,692
Average $24,403,628 $10,220,031 $715,4022.9%
illinoispolicy.org 24
1 Ted Dabrowski, “Lessons from Puerto Rico: the problem with big pension debts and little solutions,” Illinois Policy Institute (2013), http://illinoispolicy.org/blog/blog.asp?ArticleSource=5701
2 Benjamin VanMetre, “The budget truths behind Quinn’s ‘honest’ budget address,” Illinois Policy Institute (2013), http://illinoispolicy.org/blog/blog.asp?ArticleSource=5604
3 The school district’s portion of the normal cost is 0.58 percent of payroll. The state currently pays the remainder of the employer share.
4 Illinois Policy Institute calculations based upon fiscal year 2012 actuarial valuations for the Teachers’ Retirement System and the State Universities Retirement System
5 Amanda Griffin-Johnson, Ted Dabrowski, Collin Hitt & Diana Sroka Rickert, “Playing favorites, Education pension spending favors wealth suburban schools,” Illinois Policy Institute (2012), http://illinoispolicy.org/uploads/files/Playing_Favorites_Full_Report_050312.pdf
6 The annual cost of teacher pensions referred to here is the district normal cost–the cost of pension benefits accrued by active employees in a given year.
7 Ted Dabrowski, Benjamin VanMetre & Jonathan Ingram, “Budget Solutions 2014: Pension reform and responsible spending for state and local governments,” Illinois Policy Institute (2013), http://illinoispolicy.org/news/article.asp?ArticleSource=5568
8 Leslie L. Thompson et al., “Actuarial valuation report as of June 30, 2012,” State Universities Retirement System (2012), http://www.surs.com/pdfs/invinfo/avr12.pdf
9 Information collected through a Freedom of Information Act request sent to the State Universities’ Retirement System of Illinois
10 Ibid.
11 Due to discrepancies between data sources, some Illinois school districts were not included in this report: Bellwood SD 88, Bluford CCSD 114, Eswood CCS 269, Steward Elementary SD 220 and Chester N HSD 122. These data do not include teachers from Chicago Public Schools, or CPS, because CPS has its own pension system that is independent of TRS and not funded by the state.
12 Illinois Local Education Agency Retrieval Network, http://webprod1.isbe.net/ilearn/ASP/index.asp
13 Illinois Policy Institute Freedom of Information Act request sent to the Illinois Board of Education. These are FY 2010 data.
14 Teachers’ Retirement System of the State of Illinois, “Employer guide,” (2012), http://trs.illinois.gov/subsections/employers/pubs/employerguide/EmployerGuide_print.pdf
15 Ted Dabrowski, Benjamin VanMetre & Jonathan Ingram, “Budget Solutions 2014: Pension reform and responsible spending for state and local governments,” Illinois Policy Institute (2013), http://illinoispolicy.org/news/article.asp?ArticleSource=5568
16 Illinois Policy Institute calculations.
Guarantee of quality scholarshipThe Illinois Policy Institute is committed to delivering the highest quality and most reliable research on matters of public policy.
The Institute guarantees that all original factual data (including studies, viewpoints, reports, brochures and videos) are true and correct, and that information attributed to other sources is accurately represented.
The Institute encourages rigorous critique of its research. If the accuracy of any material fact or reference to an independent source is questioned and brought to the Institute’s attention in writing with supporting evidence, the Institute will respond. If an error exists, it will be corrected in subsequent distributions. This constitutes the complete and final remedy under this guarantee.