Embed Size (px)
Citation preview
The Cost of the Food Ration Basket: A Tool for PDS Monitoring and Evaluation
June 2006
This publication was produced for review by the United States Agency for International Development. It was prepared by Development Alternatives, Inc.

The Cost of the Food Ration Basket: A Tool for PDS Monitoring and Evaluation
Agriculture Reconstruction and Development Program for Iraq (ARDI)
Government to Market Transition Team
June 2006
The authors’ views expressed in this publication do not necessarily reflect the views of the United States Agency for International Development or the United States Government.

EXECUTIVE SUMMARY
The Food Ration Cost (FRC) presented in this report is an aggregate of commercially available commodities that are nutritionally equivalent to the main products in the monthly PDS rations. The FRC represents the open market cost of purchasing the most significant products contained in an individual’s monthly food ration. Products that originate from the PDS are not used in the FRC.
Monthly rations are distributed to 95% of Iraq’s citizens and provide the bulk of an individual’s dietary needs. Although the PDS has proven to be an effective social safety net, it is often criticized for being costly, inefficient and detrimental to domestic agriculture and the Iraqi economy. Multiple reform strategies have been discussed, including means-targeting and the monetization of the current program. The FRC should serve as a tool to assist in the evaluation of PDS reform and to monitor important food markets.
From November 2005 to May 2006 the average wholesale cost of purchasing an individual’s monthly rations of wheat flour, rice, cooking oil, sugar and pulses was 11,927 ID. Assuming a 20% retail markup, the cost to consumers would be 14,312 ID. This figure should be considered an upper-bound estimate due to the characteristics of the products used in the FRC. In comparison, the government’s monthly PDS expenditures per recipient are estimated at approximately 19,500 ID. The market costs of PDS equivalent goods and the continued monitoring of commercial markets are important elements in evaluating any reform of the current food ration system.

Table of Contents
1 INTRODUCTION ........................................................................................................................................................ 1
2 PDS BACKGROUND .................................................................................................................................................. 1
3 ARDI’S WHOLESALE PRICE MONITORING PROGRAM..................................................................................... 2
4 FOOD RATION COST METHODOLOGY................................................................................................................. 3
5 THE FOOD RATION COST: NOVEMBER 2005 – MAY 2006................................................................................. 6
6 APPLICATION OF THE FOOD RATION COST....................................................................................................... 8
6.1 EVALUATION OF PDS REFORM.......................................................................................................................... 8
6.2 THE FOOD RATION COST AS A TOOL FOR MONITORING .......................................................................... 10
7 CONCLUSION........................................................................................................................................................... 10
REFERENCES ............................................................................................................................................................... 11
APPENDIX A: GOVERNORATE LEVEL PRICE CHARTS...................................................................................... 12
APPENDIX B: REGIONAL PRICE CHARTS............................................................................................................. 15

1
1 INTRODUCTION Since 2005, ARDI’s wholesale Price Monitoring Program has collected price data from wholesale markets across Iraq. Products equivalent to those distributed by the Public Distribution System (PDS)1 are found in the market, and their prices have been recorded since the inception of the program. The PDS currently provides monthly food rations for approximately 95% of Iraq’s citizens. While the current system serves as an effective safety net for a large portion of the population, the phasing out of universal coverage and the monetization of the monthly rations has been discussed at length.
The purpose of this paper is to propose the use of domestic food prices as a tool for making decisions on the future of the PDS. The prices of commercially available products, which are equivalent to those distributed in the monthly rations, are aggregated using their ration weights. This Food Ration Cost (FRC) is intended to:
• Serve as a tool for policy makers to evaluate the current food ration system; • Assist in the formation of effective PDS reform policy; • Monitor markets as the supply of commercial imports and domestic production takes on a
greater significance in the food security and well-being of citizens in Iraq.
This report explains how the FRC is formed and details its levels over the past seven months. The market cost of the main food products distributed by the PDS is an important piece of information for policy makers considering reform of the current food ration system. With a smart PDS reform strategy, the food security needs of Iraq can be met while allowing the private sector to take on a larger role in the food marketing system.
2 PDS BACKGROUND
The food ration program was established by the previous regime in 1991 in response to the total trade embargo on Iraq, imposed by the United Nations. The purpose of the ration system was to ensure that available supplies of domestically produced food were distributed fairly among the population. However, supplies were insufficient and widespread hunger ensued. In 1996 the United Nations adopted the Oil for Food Program, by which proceeds from the sale of Iraqi oil were used by the World Food Program to pay for imports of food, which were in turn delivered to the people using the existing PDS.
The composition of the ration basket has remained more or less the same since the United Nations took custody of the program. A basic monthly ration includes 9 kg of flour, 3 kg of rice, 2 kg of sugar, 1.25 kg of cooking oil and 1.5 kg of pulses. Other minor items in the ration include powdered milk, tea, salt, laundry detergent and soap. Consumers receive the food ration free of charge, but distributor "agents" charge a few dinars (250-400 ID) per family to help cover transport costs.
Food ration supplies flow through a distribution network of over 40,000 centers located throughout the country. Over 95% of the population receives monthly rations, and the composition of the PDS food basket is the same across the country. It should be recognized that the PDS has served as an effective social safety net. It is credited with preventing and removing
1 The terms “PDS”, “food ration system”, and “food rations” are used interchangeably in this report.

2
widespread hunger in Iraq, though pockets of hunger and malnutrition still remain among the poorer regions and segments of the population.
Under the Oil-for-Food program almost all the food supplies distributed by the PDS were purchased overseas. Approximately 750,000 tons of wheat are currently purchased annually from Iraqi farmers. However, this is only a fraction of the approximately 3.5 million tons needed to produce the amount of flour distributed in the food rations. Rice, chickpeas, lentils, cooking oil, sugar and tea are all imported.
The poor quality of the food items distributed by the PDS is a source of constant complaints. Better-off consumers often sell their rations and purchase better quality items in the open market. Poor families sometimes sell a portion of their food rations to earn cash income. The sale of food rations out of necessity to gain disposable income may contribute to the continued food insecurity of at-risk groups. Approximately 11% of households in Iraq are food insecure despite the PDS rations.2 There is an active and legal market for food ration products, and there are no restrictions on the sale or disposal of food rations. Some items (e.g. cooking oil and wheat flour) are used by farmers as feed for livestock.
The food ration system has survived nearly intact since 2003 despite the economic reforms brought about by the change in regime. Procurement was transferred from the United Nations to the Government of Iraq (GOI) with few glitches, and the PDS is now completely administered by the Ministry of Trade. Despite the heavy financial burden (estimated at about US $4 billion per year) the GOI has not been willing to reform or reduce food rations for fear of the political repercussions that might ensue.
There have been several initiatives proposed over the past three years for reforming the PDS food ration system. There have even been successful pilot projects that utilized direct cash transfers. None of these initiatives has been implemented on a wider scale, mainly because of the risk of social disturbances. It is hoped that the new popularly elected government will find appropriate ways to introduce reforms in the food ration system.
3 ARDI’S WHOLESALE PRICE MONITORING PROGRAM
The prices used in the FRC are obtained through ARDI’s wholesale Price Monitoring Program. The prices of dry goods and animal products are collected on a weekly basis, and the prices of fruits and vegetables are collected daily. Displayed in Figure 1 are the approximate locations of the monitored wholesale markets. Monitors in each governorate visit the main wholesale market early in the morning and consult with the principal vendors to determine the prices for the day. The price, unit of sale, variety, origin, and grade are recorded for each product. Prices are disseminated daily through email, SMS messages, radio and television. Data are also posted on the project website www.iraqmarketprices.net.
2 World Food Programme. 2004. Baseline Food Security Analysis in Iraq.

3
ARDI’s price monitoring program focuses on wholesale markets primarily because they provide an ideal place to collect price data. Each day traders and vendors from around the region gather at the main wholesale markets to conduct business. Data for a wide variety of products, which are sold over a large area, can be collected by observing transactions at the wholesale markets.
The price monitoring program began in April 2005 with a select group of governorates, and over time, additional governorates were added and the monitoring process was improved. As of November 2005 data were being collected from wholesale markets in 15 out of 18 governorates. The FRC presented in this report is constructed using data from November 2005 to May 2006 for 14 governorates. Data from Tameem are excluded due to questions about accuracy, and will be included once these issues are resolved. In recent weeks price monitoring has begun in remaining governorates of Anbar, Najaf, and Salah al-Din, and they will be incorporated into the FRC in the future.
Iraq is divided into three regions for the purposes of discussion and comparison in this report (see Figure 1). The northern region includes Erbil, Dahuk, Sulaymaniyah and Ninewa. The central region includes Diyala, Baghdad, Kerbala, Babylon, Wassit and Qadissiya. Muthanna, Thi-Qar, Missan and Basrah are grouped together in the southern region.
4 FOOD RATION COST METHODOLOGY
The FRC is constructed with prices of commodities similar to those that are distributed with the monthly rations. The component products are available on the open market, and do not originate from PDS procurement. Prices for wheat flour, rice, cooking oil, sugar and pulses are included in the FRC, and they are most significant in terms cost and nutritional value. Small amounts of powdered milk, soap, detergent, salt and tea are also distributed by the PDS. They are not included primarily due to the fact that their prices are not collected. However, these products cost relatively little compared to those used in the FRC.

4
Infants under one year of age are entitled to monthly rations of fortified weaning cereal and infant formula. Unfortunately, ARDI’s Price Monitoring Program does not currently collect prices for the products included in the infant ration. These products do represent significant costs to households with young children, and they provide important nutritional supplement for many infants across Iraq. However, they are less significant in terms of overall PDS government expenditures, and in terms of average household FRC values. Their costs are not included FRC, but their importance should not be ignored.
The aggregation of prices is complicated by the fact that there are various brands, varieties and grades available on the market. Additionally, data for many products are incomplete. To deal with these issues, either representative varieties (or brands) are used, or an average was made. Table 1 details the type, origin(s), and weight for each of the FRC components. Graphs detailing regional and governorate level prices can be found in the appendix to this report.
Table 1: Components of Food Ration Cost
FRC Component Origin (Variety) Average Monthly Ration (kg)
Percent of Total Weight
Flour (Grade 0) Turkey No 9 54%
Rice Iraq (Anbar), Thailand (Ahmadi), India (Sultan) Yes 3 18%
Sugar (Granular) Brazil No 2 12%
Cooking Oil (Liquid) Average of Imported Yes 1.25 7%
Pulses Imported and Domestic Chickpeas Yes 1.5 9%
Total - - 16.75 100%
For wheat flour, the most consistent data are available for grade 0, imported from Turkey. There are other data recorded for flour produced domestically and imported from Syria, the UAE, and France. However, these products are found only sporadically in the markets that are monitored. Grade 0 wheat flour from Turkey is used to provide consistency in the FRC. The monthly ration of wheat flour is nine kg per person, or 54% of the weight of the products used in the FRC.
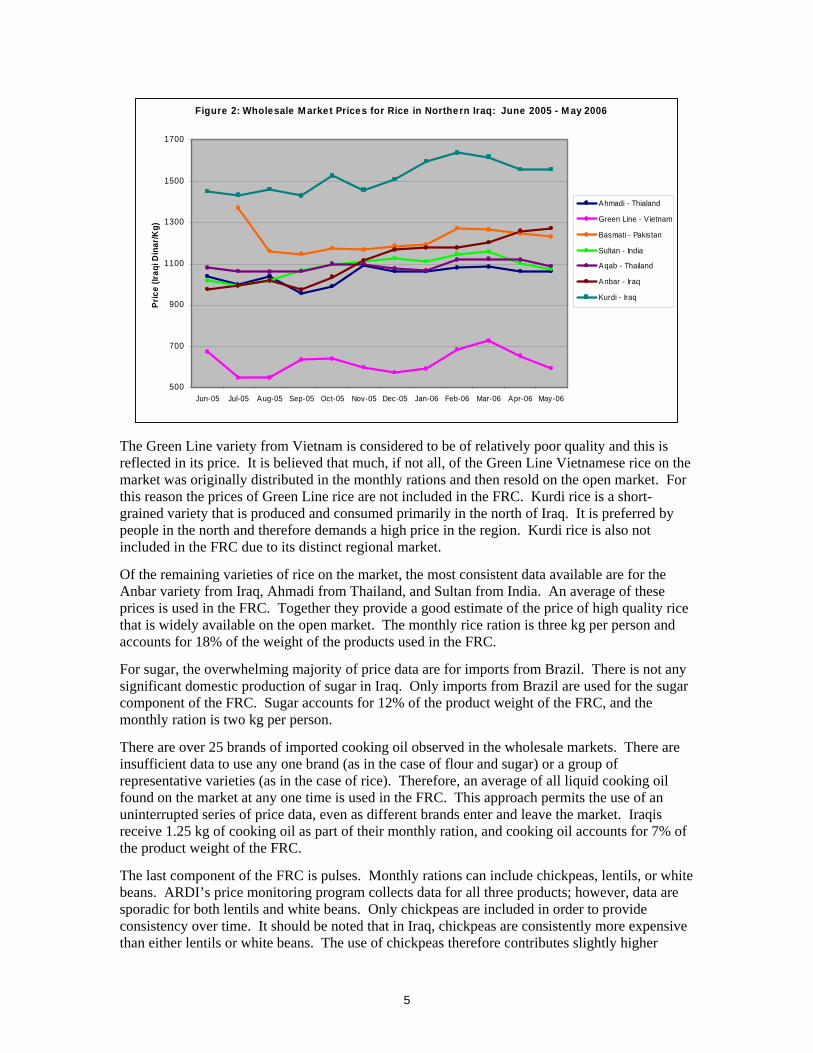
Price monitors observe many varieties of domestic and imported rice on the market. They include but are not limited to: Ahmadi and Aqab from Thailand; Basmati from Pakistan; Sultan from India; Anbar and Kurdi from Iraq; and Green Line from Vietnam. Figure 2 shows the wholesale prices for these varieties in northern Iraq. Prices from the northern region are displayed due to the fact that prices have been recorded from the northern region for the longest period of time.
5
Figure 2: Wholesale M arket Prices for Rice in Northern Iraq: June 2005 - M ay 2006
500
700
900
1100
1300
1500
1700
Jun-05 Jul-05 Aug-05 Sep-05 Oct-05 Nov-05 Dec-05 Jan-06 Feb-06 Mar-06 Apr-06 May-06
Pric
e (Ir
aqi D
inar
/Kg)
Ahmadi - Thialand
Green Line - V ietnam
Basmati - Pakistan
Sultan - India
Aqab - Thailand
Anbar - Iraq
Kurdi - Iraq
The Green Line variety from Vietnam is considered to be of relatively poor quality and this is reflected in its price. It is believed that much, if not all, of the Green Line Vietnamese rice on the market was originally distributed in the monthly rations and then resold on the open market. For this reason the prices of Green Line rice are not included in the FRC. Kurdi rice is a short-grained variety that is produced and consumed primarily in the north of Iraq. It is preferred by people in the north and therefore demands a high price in the region. Kurdi rice is also not included in the FRC due to its distinct regional market.
Of the remaining varieties of rice on the market, the most consistent data available are for the Anbar variety from Iraq, Ahmadi from Thailand, and Sultan from India. An average of these prices is used in the FRC. Together they provide a good estimate of the price of high quality rice that is widely available on the open market. The monthly rice ration is three kg per person and accounts for 18% of the weight of the products used in the FRC.
For sugar, the overwhelming majority of price data are for imports from Brazil. There is not any significant domestic production of sugar in Iraq. Only imports from Brazil are used for the sugar component of the FRC. Sugar accounts for 12% of the product weight of the FRC, and the monthly ration is two kg per person.
There are over 25 brands of imported cooking oil observed in the wholesale markets. There are insufficient data to use any one brand (as in the case of flour and sugar) or a group of representative varieties (as in the case of rice). Therefore, an average of all liquid cooking oil found on the market at any one time is used in the FRC. This approach permits the use of an uninterrupted series of price data, even as different brands enter and leave the market. Iraqis receive 1.25 kg of cooking oil as part of their monthly ration, and cooking oil accounts for 7% of the product weight of the FRC.
The last component of the FRC is pulses. Monthly rations can include chickpeas, lentils, or white beans. ARDI’s price monitoring program collects data for all three products; however, data are sporadic for both lentils and white beans. Only chickpeas are included in order to provide consistency over time. It should be noted that in Iraq, chickpeas are consistently more expensive than either lentils or white beans. The use of chickpeas therefore contributes slightly higher
6
prices to the FRC than would alternative products. Chickpeas account for 9% of the weight of the FRC, and a monthly ration of 1.5 kg is distributed by the PDS.
5 THE FOOD RATION COST: NOVEMBER 2005 – MAY 2006
As previously mentioned, the FRC includes prices of products similar to those distributed in the monthly rations. Prices collected from 14 out of the 18 governorates in Iraq are used. Anbar, Najaf and Salah al-Din are not included due to incomplete data, and Tameem is not included due to suspect data.
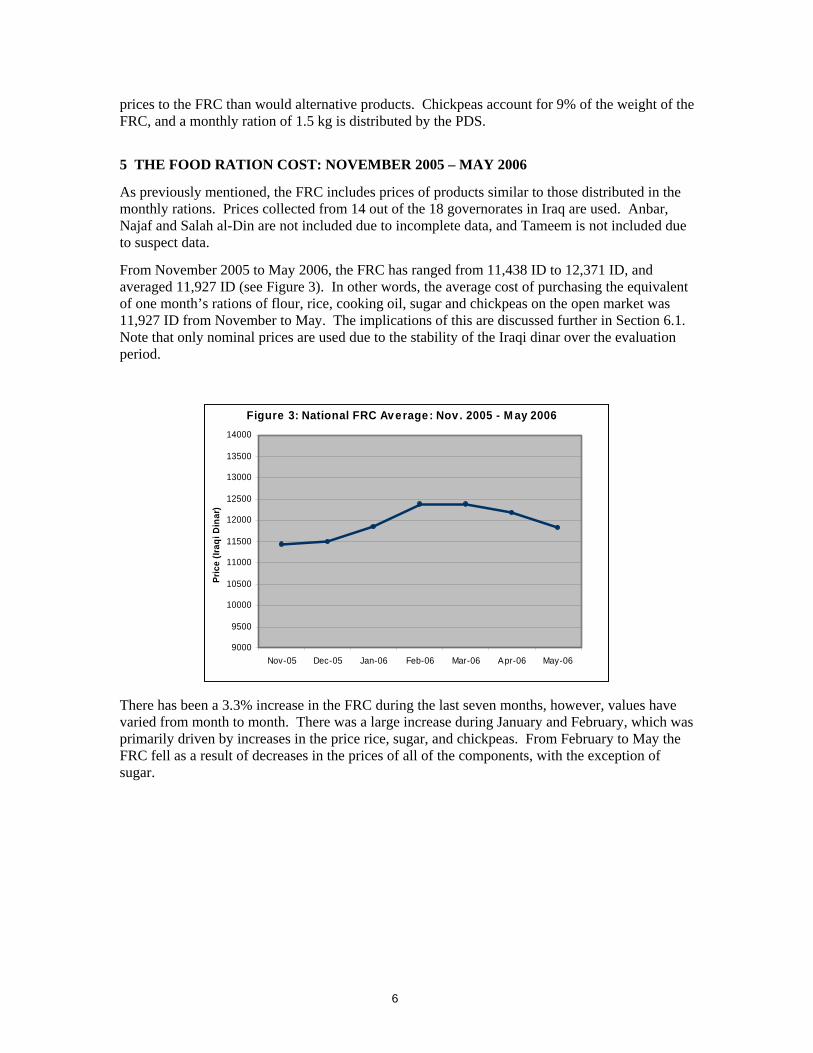
From November 2005 to May 2006, the FRC has ranged from 11,438 ID to 12,371 ID, and averaged 11,927 ID (see Figure 3). In other words, the average cost of purchasing the equivalent of one month’s rations of flour, rice, cooking oil, sugar and chickpeas on the open market was 11,927 ID from November to May. The implications of this are discussed further in Section 6.1. Note that only nominal prices are used due to the stability of the Iraqi dinar over the evaluation period.
Figure 3: National FRC Average: Nov . 2005 - M ay 2006
9000
9500
10000
10500
11000
11500
12000
12500
13000
13500
14000
Nov-05 Dec-05 Jan-06 Feb-06 Mar-06 Apr-06 May-06
Pric
e (Ir
aqi D
inar
)
There has been a 3.3% increase in the FRC during the last seven months, however, values have varied from month to month. There was a large increase during January and February, which was primarily driven by increases in the price rice, sugar, and chickpeas. From February to May the FRC fell as a result of decreases in the prices of all of the components, with the exception of sugar.

7
Table 2: Food Ration Cost Components
Component Nov-05
Dec-05 Jan-06 Feb-06 Mar-
06 Apr-06
May-06 Average
Value 3962 3914 3973 3900 3806 3808 3633 Flour
Percent Change - -1.2% 1.5% -1.8% -2.4% 0.0% -4.6% 3857
Value 2809 2811 2918 3034 3053 2984 2841 Rice
Percent Change - 0.1% 3.8% 3.9% 0.6% -2.3% -4.8% 2921
Value 1885 1914 1931 1938 1916 1877 1855 Cooking Oil Percent Change - 1.5% 0.9% 0.4% -1.1% -2.0% -1.2%
1902
Value 1287 1288 1301 1510 1569 1564 1583 Sugar
Percent Change - 0.1% 1.0% 16.1% 3.9% -0.3% 1.2% 1443
Value 1495 1567 1714 1990 2020 1938 1905 Chickpeas
Percent Change - 4.8% 9.4% 16.1% 1.5% -4.0% -1.7% 1804
Value 11438 11495 11837 12371 12364 12171 11817 FRC
Percent Change - 0.5% 3.0% 4.5% -0.1% -1.6% -2.9% 11927
The FRC increased during a period when many seasonal products in Iraq demand higher prices. However, the products that make up the FRC are dry goods with long shelf lives and generally do not exhibit seasonal patterns. The jump in the prices of rice, sugar, and chickpeas were more likely the result of other factors. More than anything else, disruptions in PDS deliveries have the potential to affect the prices of the goods in question. If, for example, rice rations were cut in half because of PDS supply shortages, the price of commercially available rice varieties would increase. While it is not known whether food ration distribution was interrupted from November to May, disruptions in the PDS system are common.
In addition to PDS supply fluctuations, world markets can also affect domestic prices. The products that make up the FRC are almost entirely imported, and thus a commodity’s world price must also be considered. The world price of sugar is closely related to the price of crude oil. In Iraq, the price of imported Brazilian sugar increased during the months of December, January, and February in tandem with the world price of oil.
There has been significant variation in the FRC on a regional level. On average the north has had higher FRC values, followed by the south and the center of Iraq (see Figure 4). Values for the north have trended upward, while the center and south have been more erratic from month to month.

8
Figure 4: Regional FRC Average: July 2005 - May 2006
9000
10000
11000
12000
13000
14000
15000
Jul-05 Aug-05 Sep-05 Oct-05 Nov-05 Dec-05 Jan-06 Feb-06 Mar-06 Apr-06 May-06
Pric
e (Ir
aqi D
inar
/Kg)
NorthCenterSouth
6 APPLICATION OF THE FOOD RATION COST
The FRC is an aggregate of the costs of PDS equivalent products. The information that it provides is not only necessary for evaluating PDS reform, but also for purposes of monitoring any transition from the current food distribution system.
6.1 EVALUATION OF PDS REFORM
The phasing out and reform of the PDS has been discussed at length by the GOI and international donors. The most frequently discussed strategies include monetization of the program and increased targeting of the poorer segments of society. Many have recognized the need for PDS reform, including the GOI. In the 2005 National Development Strategy (NDS) the GOI stated its intent to “identify and remove from the food ration system certain segments of the population who are not identified as food insecure.” The FRC provides an important benchmark if the reform of the current food rationing system were to include monetization or the targeting of certain groups.
As of May 2006, the FRC was 11,817 ID. Using a 20% retail markup, the costs to consumers would be 14,180 ID or US $9.54.3 A 20% markup may seem low when compared to marketing systems in other countries. However, its use is appropriate due to the nature of the value chain in Iraq, and the fact that the goods distributed in the PDS have long self lives and are usually sold in bulk. Interviews with vendors of these goods confirm that a 20% markup is reasonable.
The adjusted FRC value of US $9.54 can be compared to monthly government expenditures per PDS recipient. Total actual costs of the PDS are difficult to obtain, but the GOI budgeted over US $4 billion for the program in 2005.4 The PDS program costs approximately US $13 per person per month, assuming a total population of 27 million and 95% coverage. The individual cost of purchasing the most significant PDS equivalent products on the open market is therefore only
3 Exchange rate of 1,500 Iraqi Dinar per US $1. 4 World Bank. 2006. ibid.

9
73% of what the government spends per person. This difference has clear implications for any reform of the food ration program.
As previously mentioned, powdered milk, soap, detergent, salt, tea and infant rations are normally part of the PDS ration basket, but were omitted from the FRC. The decision to exclude these products was primarily driven by the fact that ARDI does not currently collect their prices. The omission of some products that make up the adult ration does not greatly diminish the utility of the FRC, mainly because the excluded products are less significant in terms of nutritional value and cost. Powdered milk is the only excluded product of notable nutritional value, and an adult ration only provides approximately 83 calories per day.5 The costs of the excluded adult ration goods would add to the FRC total; however, their open market value is estimated to be only 1,000 ID per month.6 As discussed in Section 4, infant rations do represent significant costs to some households and provide important nutritional supplement to small children. Still, infant rations are less significant in terms of overall PDS government expenditures, and in terms of average household FRC values.
The FRC can be thought of as an upper-bound of the cost of purchasing an individual’s monthly rations of wheat flour, rice, cooking oil, sugar, and pulses, primarily because of the specific products used to construct the aggregate price. Except for Anbar rice, high quality imports that do not originate from PDS procurement are utilized for each of the FRC components. One would expect even lower prices if the market for wheat flour, rice, cooking oil, sugar, and pulses were to expand as result of PDS reform. If a large segment of the population had to purchase these goods, the market for alternatives that do not command such a premium price would grow. Domestic agriculture could fill the gap as it is pulled back into the market, but imports would probably continue to play an important role. Lower quality imports are currently available on the world market, but they are not commercially available in large quantities in Iraq due to the large shadow cast by PDS rations.
The FRC further represents an upper-bound due to the fact that consumers have the opportunity to purchase whatever combination of goods meets their needs. Most likely, people will adjust their consumption patterns as prices change. For example, if the price of rice doubles more flour could be purchased and cheaper types of rice would be consumed. The cost of purchasing the equivalent amount of calories will change and will most likely be less than the costs implied by the FRC.
PDS reform would most likely imply a large increase in demand for the goods that make up the FRC. Despite an increase in demand, the cost of purchasing these goods would not increase greatly. The key to understanding how a large increase in Iraq’s demand would impact prices is to realize that the world market for imported goods is competitive, and that relative to the size of the Iraqi market there are essentially unlimited supplies available for import. Currently, there are imported PDS equivalent goods on the market, and they are being purchased despite the distribution of monthly rations. In the case of rice, there are more than ten different brands observed in wholesale markets across Iraq. The price paid by consumers is a competitive price that is directly related to worldwide supply and domestic demand. If the domestic demand for imported rice was to increase by, say, ten times, the domestic price would change very little due to the fact that the impact on the worldwide demand of rice would be minimal. The supply of imported rice in Iraq is, for all intents and purposes, perfectly elastic.
5 .5 kg monthly ration, at 2480 total calories 6 Using values from the 2005, COSIT, Household Budget Survey.

10
The FRC provides the relative costs of PDS equivalent goods. However, this information does not provide irrefutable evidence of the necessity to maintain the current food ration system or to form a new policy. Nor does it suggest how to best to facilitate any transition or how to design a new program. The FRC is intended to serve as another piece of information to help the Iraqi government provide for the needs of its citizens in the most efficient and effective way possible.
6.2 THE FOOD RATION COST AS A TOOL FOR MONITORING
The continued monitoring of market prices will be essential if the current food ration system is reformed. The current system successfully delivers food rations to all parts of the country and provides a necessary social safety net for a large part of the population. With any changes in the current system, food markets need to be closely watched to ensure that the needs of Iraqi citizens are still met. A sharp jump in prices could indicate a food shortage. Private traders and policy makers can quickly identify a shortage and react if there is an effective price monitoring program in place.
The FRC is constructed using the weights of the different products in the food ration basket. This allows some level of comparison between the price of food in domestic food markets and the cost of the PDS rations. In the event of monetization or the phasing out of the program, consumers will adjust their consumption patterns to best meet their needs. Any future price monitoring or analysis should include not only those goods that are part of the FRC but also a wide variety of other products that are available on the market, such as fruit, vegetables, and the full range of animal products. The FRC could also be modified once more information is available on consumption patterns.
7 CONCLUSION
The FRC is intended to assist in evaluating the phasing out of the PDS program and to monitor the markets if such a shift was made. The results presented in this report have shown the relative cost of PDS equivalent goods. Additional insights can be gained by further analysis. Additional data will permit a more complete assessment of how Iraq’s food marketing system is evolving.
A wide range of additional information is necessary to evaluate any change in the current food ration system. Policy makers need to consider the capacity of the private sector, the needs of vulnerable segments of society, and the social ramifications of PDS reform strategies.
The fact that the PDS system provides food security and a higher standard of living for a large segment of the population should not be overlooked. The program is very important, especially considering the fact that no other comparable social safety net current exists in Iraq. Approximately 25% of the population is highly dependent on the PDS.7 Without the monthly rations, approximately 6.2 million people would be food insecure or face a high probability of becoming food insecure. PDS reform can not be discussed without ensuring that the welfare of the poorest sectors of society is protected as too many lives depend on it.
7 WFP. 2004. ibid.

11
REFERENCES
Edirisinghe, Neville. June 2004. A Study of Food Grain Markets in Iraq. A Joint Report by the World Bank and United Nations World Food Program.
Government of Iraq, Central Organization for Statistics and Information Technology (COSIT). 2005.
Government of Iraq. June 2005. National Development Strategy.
World Bank. February 2006. Rebuilding Iraq: Economic Reform and Transition.
World Food Programme. 2004. Baseline Food Security Analysis in Iraq.

12
APPENDIX A: GOVERNORATE LEVEL PRICE CHARTS
Wholesale Market Prices for Flour from Turkey: June 2005 - May 2006
150
250
350
450
550
650
Jun-05 Jul-05 Aug-05 Sep-05 Oct-05 Nov-05 Dec-05 Jan-06 Feb-06 Mar-06 Apr-06 May-06
Pri
ce (I
raqi
Din
ar/K
g)
Dahuk
Erbil
Ninew a
Sulaymaniyah
Babil
Baghdad
Diyala
Kerbala
Qadissiya
Wassit
Basrah
Missan
Muthanna
Thi-Qar

13
Wholesale Market Prices for Rice (FRC Average): June 2005 - May 2006
500
600
700
800
900
1000
1100
1200
1300
1400
1500
Jun-05 Jul-05 Aug-05 Sep-05 Oct-05 Nov-05 Dec-05 Jan-06 Feb-06 Mar-06 Apr-06 May-06
Pric
e (Ir
aqi D
inar
/Kg)
Dahuk
ErbilNinewa
Sulaym aniyahBabil
BaghdadDiyalaKerbala
Qadiss iyaWass it
BasrahMissan
MuthannaThi-Qar
Wholesale Market Prices for Sugar from Brazil: June 2005 - May 2006
400
500
600
700
800
900
1000
Jun-05 Jul-05 Aug-05 Sep-05 Oct-05 Nov-05 Dec-05 Jan-06 Feb-06 Mar-06 Apr-06 May-06
Pric
e (Ir
aqi D
inar
/Kg)
Dahuk
Erbil
Ninew a
Sulaymaniyah
Babil
Baghdad
Diyala
Kerbala
Qadissiya
Wassit
Basrah
Missan
Muthanna
Thi-Qar

14
Wholesale Market Prices for Imported Cooking Oil: June 2005 - May 2006
1000
1200
1400
1600
1800
2000
2200
2400
Jun-05 Jul-05 Aug-05 Sep-05 Oct-05 Nov-05 Dec-05 Jan-06 Feb-06 Mar-06 Apr-06 May-06
Pri
ce (I
raqi
Din
ar/K
g)
Dahuk
Erbil
Ninew a
Sulaymaniyah
Babil
Baghdad
Diyala
Kerbala
Qadissiya
Wassit
Basrah
Missan
Muthanna
Thi-Qar
Wholesale Market Prices for Chickpeas: June 2005 - May 2006
300
500
700
900
1100
1300
1500
1700
1900
2100
Jun-05 Jul-05 Aug-05 Sep-05 Oct-05 Nov-05 Dec-05 Jan-06 Feb-06 Mar-06 Apr-06 May-06
Pric
e (Ir
aqi D
inar
/Kg)
Dahuk
Erbil
Ninew a
Sulaymaniyah
Babil
Baghdad
Diyala
Kerbala
Qadissiya
Wassit
Basrah
Missan
Muthanna
Thi-Qar

15
APPENDIX B: REGIONAL PRICE CHARTS
Regional Wholesale Market Prices for Flour from Turkey: June 2005 - May 2006
150
250
350
450
550
650
Jun-05 Jul-05 Aug-05 Sep-05 Oct-05 Nov-05 Dec-05 Jan-06 Feb-06 Mar-06 Apr-06 May-06
Pric
e (Ir
aqi D
inar
/Kg) North
Center
South
Regional Wholesale Market Prices for Rice (FRC Average): June 2005 - May 2006
500
600
700
800
900
1000
1100
1200
1300
1400
1500
Jun-05 Jul-05 Aug-05 Sep-05 Oct-05 Nov -05 Dec-05 Jan-06 Feb-06 Mar-06 Apr-06 May -06
Pric
e (Ir
aqi D
inar
/Kg)
North
Center
South

16
Regional Wholesale Market Prices for Sugar From Brazil: July 2005 - May 2006
400
500
600
700
800
900
1000
Jul-05 Aug-05 Sep-05 Oct-05 Nov-05 Dec-05 Jan-06 Feb-06 Mar-06 Apr-06 May-06
Pric
e (Ir
aqi D
inar
/Kg)
North
Center
South
Regional Wholesale Market Prices for Imported Cooking Oil: June, 2005 - May, 2006
1000
1200
1400
1600
1800
2000
2200
2400
Jun-05 Jul-05 Aug-05 Sep-05 Oct-05 Nov-05 Dec-05 Jan-06 Feb-06 Mar-06 Apr-06 May-06
Pric
e (Ir
aqi D
inar
/Kg)
North
Center
South

17
Regional Wholesale Market Prices for Chickpeas: June 2005 - May 2006
300
500
700
900
1100
1300
1500
1700
1900
2100
Jun-05 Jul-05 Aug-05 Sep-05 Oct-05 Nov-05 Dec-05 Jan-06 Feb-06 Mar-06 Apr-06 May-06
Pric
e (Ir
aqi D
inar
/Kg)
North
Center
South