Embed Size (px)
Citation preview
THE COST OF CAPITAL FOR FINANCIAL FIRMS
By C. J. Exley and A. D. Smith
[Presented to the Institute of Actuaries, 23 January 2006]
abstract
Most businesses have assets financed by capital providers. The cost of capital is a measure ofthe returns required by those capital providers. Its main use is to set a target for the profits,which must be achieved on the firm’s assets in order to satisfy equity and bond holders.This paper describes the classical theory of the cost of capital, and then applies it to the
special case of banking and insurance firms. We develop implications for product pricing,performance measurement and capital structure optimisation.
keywords
Cost of Capital; Capital Asset Pricing Model; Franchise Value; Market ConsistentValuation; Embedded Value; Franchise Insurance Premium; Frictional Costs; Taxation;Performance Measurement
contact addresses
C. Jon Exley, Barclays Capital, 5 The North Colonnade, Canary Wharf, London E14 4BB,U.K. E-mail: [email protected] D. Smith, Deloitte & Touche LLP, Stonecutter Court, 1 Stonecutter Street, LondonEC4A 4TR, U.K. E-mail: [email protected]
Charlie [Munger] and I have not the faintest idea what our cost of capital is and we think thewhole concept is fairly crazy, frankly Warren Buffett, May 2003
". Introduction
1.1 Why does the Cost of Capital Matter?1.1.1 Some people think that capital incurs a cost just by being there. A
business must meet capital costs in addition to other expenses of doingbusiness. Others talk confidently about the cost of capital, as if they havealready measured it, comprehensively taken account of all accounting effects,risks, regulations, taxes and other complications, survived a rigorous auditprocess, and now use cost of capital as a guiding principle for running everyaspect of their lives. The rest of us sit in meetings feeling left out, making amental note to research the ingenious secret. If that sounds familiar, then thispaper is for you.
# Institute of Actuaries and Faculty of Actuaries
1.1.2 Some firms have made significant investment in advancedquantitative systems for risk management and economic capital quantification.We believe that a similar degree of effort and science can profitably be appliedassessing the commercial cost of meeting economic capital requirements.1.1.3 Cost of capital has become an important deduction from accounting
profit in performance measurement and reporting. Thousands of financialsector employees find that a cost of capital calculation affects their bonuses.Business units are bought, sold, closed down or expanded on the basis ofwhether they meet their cost of capital. Apparently, you make bettercommercial decisions if you take account of capital costs.
1.1.4 Many analysts’ corporate valuation models feature the cost ofcapital as an input. Ideally, a cost of capital used in this way should reflect,not only the risk and potential of a firm, but also conditions in the capitalmarket. To the extent that one believes that analysts’ opinions affect securityprices, these calculations of a firm’s cost of capital potentially affect itsshare price and its ability to raise finance when required. At the very least,the way in which analysts do their cost of capital calculations is important ifmanagement behaviour reflects attempts to second-guess analysts’ cost ofcapital estimates.1.1.5 If capital has a real cost, then that cost should feed through into
the prices which consumers pay for financial products. Accurate assessmentof capital cost means a competitive advantage in accurate product pricing. Insome jurisdictions, financial firms have to satisfy price regulators thatcustomers are not being overcharged. Capital costs in a disclosed pricingbasis can justify greater pricing freedom, while demonstrating thatshareholder returns remain fair.
1.1.6 Some regulators are considering whether financial firms shoulddemonstrate financial resources, not only to meet customer liabilities in oneyear with a high probability, but also to meet the cost of any capital tied upover the period for which the liabilities exist. If that were the case, then thehigher the cost of capital, the more the regulator would expect firms tohold.
1.1.7 If the cost of capital increases, you might expect firms to findways to use less capital or use it more efficiently, just as motorists seek moreefficient cars when the price of fuel rises.1.1.8 All of these issues increase pressure on managements to articulate
their capital strategy and assessment of capital costs.
1.2 What is the Cost of Capital?1.2.1 Let us start where the literature starts. Modigliani & Miller (1958)
consider a simple company with a set of assets, for example representingplant and inventory. The assets are financed partly out of borrowed money(debt) and partly by shareholders (equity).
1.2.2 The lenders may be banks providing overdraft facilities, or may be
2 The Cost of Capital for Financial Firms
subscribers to an issue of commercial paper or corporate bonds. Theshareholders and lenders are, in aggregate, known as capital providers.
1.2.3 In the past, companies used to set budgets to ensure positiveoperating results. In other words, the price charged for goods must cover thecost of the labour and materials to make the goods. A company wasconsidered broadly healthy, provided that its operating result was positive orthat its dividends were maintained.
1.2.4 More recently, companies have focused on adding value. This isdefined as covering, not only the operating cost, but also providing anacceptable return to capital providers. The cost of debt is interpreted as theinterest payable, while some economists refer to a cost of equity as the profitwhich shareholders require. The weighted average cost of capital, as amoney amount, is the total cost of equity and cost of debt.
1.2.5 References to ‘cost of equity’ are controversial and sometimesconfusing. The cost of equity is not a cash flow. Neither accounting standardsetters nor taxation authorities recognise cost of equity as a cost. Evensolvency regulators are not yet requiring firms to provide for future equitycosts. Cost of equity does not accumulate arrears if you miss a payment, andcannot trigger default or bankruptcy. Nevertheless, describing requiredreturns on equity as a cost has fallen into common usage, and we follow thathere.
1.2.6 The usual approach for measuring the cost of equity is the conceptof opportunity cost. This means the return which a shareholder could haveobtained with alternative investments of similar risk.
1.3 Customers as Capital Providers1.3.1 How then can we apply the cost of capital ideas to financial firms?
Many of the ideas are applicable, but only after some conversion interminology. The main additional complication is that financial firms,typically, have significant customer liabilities, either in the form of bankdeposits accepted or provisions for insurance claims and associated expenses.These customer commitments are often highly regulated. There may also beadditional borrowings, usually subordinated to (i.e. lower priority than) thecustomer commitments, sometimes raised at a parent level and then injectedas equity into a financial subsidiary.
1.3.2 In classical corporate finance parlance, all of these are sources ofcapital, and should be taken into account in a cost of capital calculation. Onthe other hand, when financial firms talk about capital, they usually meanequity and subordinated debt, excluding liabilities to retail customers.Confusion can easily arise from these conflicting uses of the word ‘capital’.
1.3.3 It is difficult to assign a cost of debt to customer liabilities. Bankdeposits may appear to be a cheap source of capital, if customers demand anannual interest rate below that of the capital markets. However, a focus oncredited rates overlooks the high front-end costs in terms of marketing and
The Cost of Capital for Financial Firms 3
commission for attracting the customers in the first place. Althoughaccountants may treat marketing as an expense rather than as an investment,shareholders are equally entitled to demand that expenditure on marketingis justified by future returns.
1.3.4 Insurance liabilities are also problematic. We might value themusing a discounted cash flow calculation, but where does the discount ratecome from? Whatever discount rate is chosen, this will turn out to be the costof debt. For example, if reserves are computed on a prudent statutory basis,then the cost of debt will appear equal to the statutory discount rate.However, it would be a mistake to interpret a low discount rate as anindication that customers supply cheap capital.
1.3.5 As a result of difficulties in debt cost measurement, the weightedaverage cost of capital (WACC) and associated measures are challenging toapply to financial firms if customers are treated as capital providers. Instead,in a financial context, the stated WACC usually averages capital costs onlyover equity and subordinated bondholders, excluding customer liabilitiesfrom the equation.
1.4 Reported Cost of Capital1.4.1 Many financial companies report financial results net of cost of
capital, to disclose some measure of value added which is used forperformance measurement. For example, Lloyds TSB provides the followingcommentary in their 2004 financial statements:
“A common approach is applied across the Group to assess the creation of shareholdervalue. This is measured by economic profit (the profit attributable to shareholders, less anotional charge for the equity invested in the business). The focus on economic profitallows the Group to compare the returns being made on capital employed in eachbusiness.’’
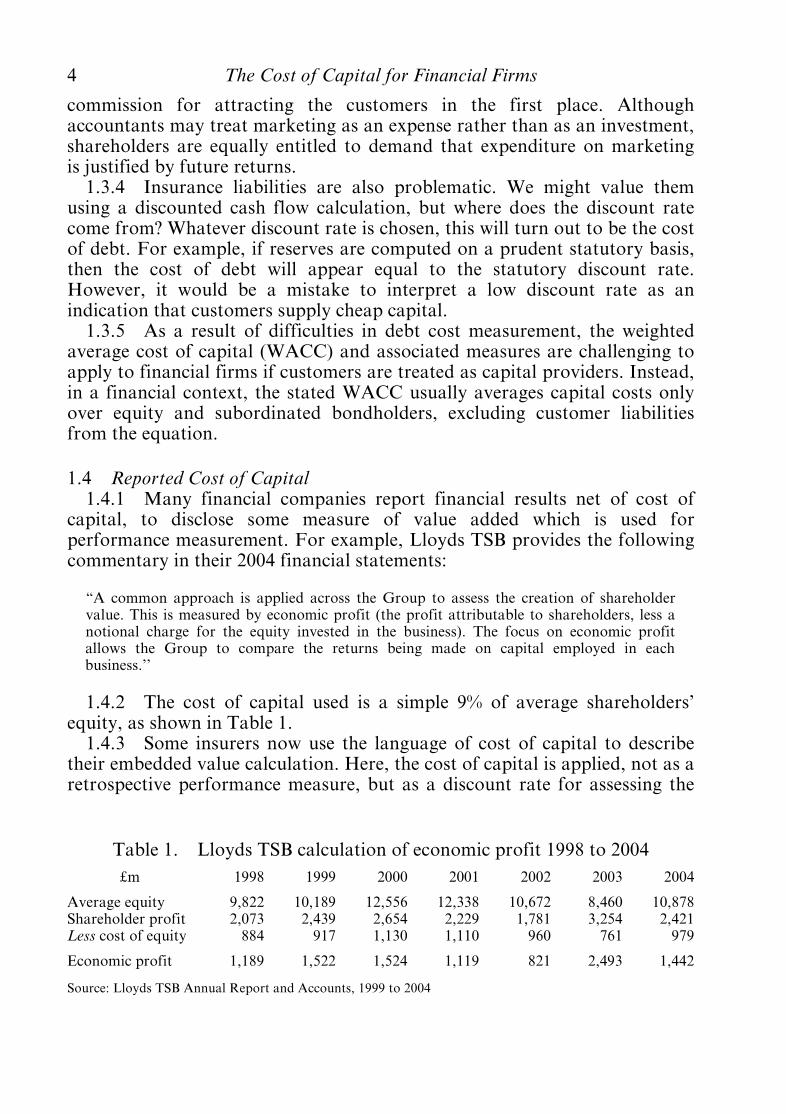
1.4.2 The cost of capital used is a simple 9% of average shareholders’equity, as shown in Table 1.
1.4.3 Some insurers now use the language of cost of capital to describetheir embedded value calculation. Here, the cost of capital is applied, not as aretrospective performance measure, but as a discount rate for assessing the
Table 1. Lloyds TSB calculation of economic profit 1998 to 2004»m 1998 1999 2000 2001 2002 2003 2004
Average equity 9,822 10,189 12,556 12,338 10,672 8,460 10,878Shareholder profit 2,073 2,439 2,654 2,229 1,781 3,254 2,421Less cost of equity 884 917 1,130 1,110 960 761 979
Economic profit 1,189 1,522 1,524 1,119 821 2,493 1,442
Source: Lloyds TSB Annual Report and Accounts, 1999 to 2004
4 The Cost of Capital for Financial Firms
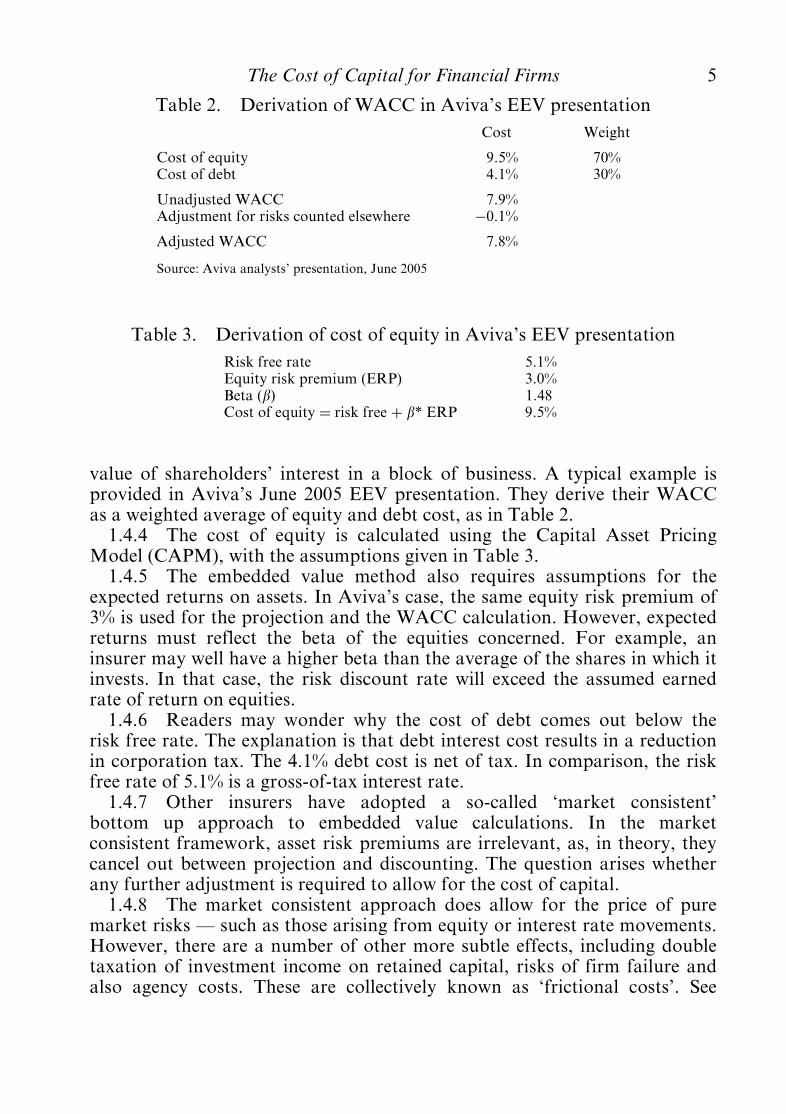
value of shareholders’ interest in a block of business. A typical example isprovided in Aviva’s June 2005 EEV presentation. They derive their WACCas a weighted average of equity and debt cost, as in Table 2.
1.4.4 The cost of equity is calculated using the Capital Asset PricingModel (CAPM), with the assumptions given in Table 3.
1.4.5 The embedded value method also requires assumptions for theexpected returns on assets. In Aviva’s case, the same equity risk premium of3% is used for the projection and the WACC calculation. However, expectedreturns must reflect the beta of the equities concerned. For example, aninsurer may well have a higher beta than the average of the shares in which itinvests. In that case, the risk discount rate will exceed the assumed earnedrate of return on equities.
1.4.6 Readers may wonder why the cost of debt comes out below therisk free rate. The explanation is that debt interest cost results in a reductionin corporation tax. The 4.1% debt cost is net of tax. In comparison, the riskfree rate of 5.1% is a gross-of-tax interest rate.1.4.7 Other insurers have adopted a so-called ‘market consistent’
bottom up approach to embedded value calculations. In the marketconsistent framework, asset risk premiums are irrelevant, as, in theory, theycancel out between projection and discounting. The question arises whetherany further adjustment is required to allow for the cost of capital.
1.4.8 The market consistent approach does allow for the price of puremarket risks ö such as those arising from equity or interest rate movements.However, there are a number of other more subtle effects, including doubletaxation of investment income on retained capital, risks of firm failure andalso agency costs. These are collectively known as ‘frictional costs’. See
Table 2. Derivation of WACC in Aviva’s EEV presentationCost Weight
Cost of equity 9.5% 70%Cost of debt 4.1% 30%
Unadjusted WACC 7.9%Adjustment for risks counted elsewhere ÿ0.1%
Adjusted WACC 7.8%
Source: Aviva analysts’ presentation, June 2005
Table 3. Derivation of cost of equity in Aviva’s EEV presentationRisk free rate 5.1%Equity risk premium (ERP) 3.0%Beta (b) 1.48Cost of equity ¼ risk free þ b* ERP 9.5%
The Cost of Capital for Financial Firms 5
Cumberworth et al. (2000), Hancock et al. (2001), or Ng et al. (2003) formore details on these items.
1.4.9 Firms are beginning to get to grips with some of the more subtlefrictional costs. O’Keeffe et al. (2005) provides a description of recentdevelopments in this area. A recent disclosure by Friends Provident describesthe additional allowances as follows:
“We have allowed for the frictional costs of holding this locked-in shareholder capital,being the tangible costs of holding capital on a market-consistent basis.’’
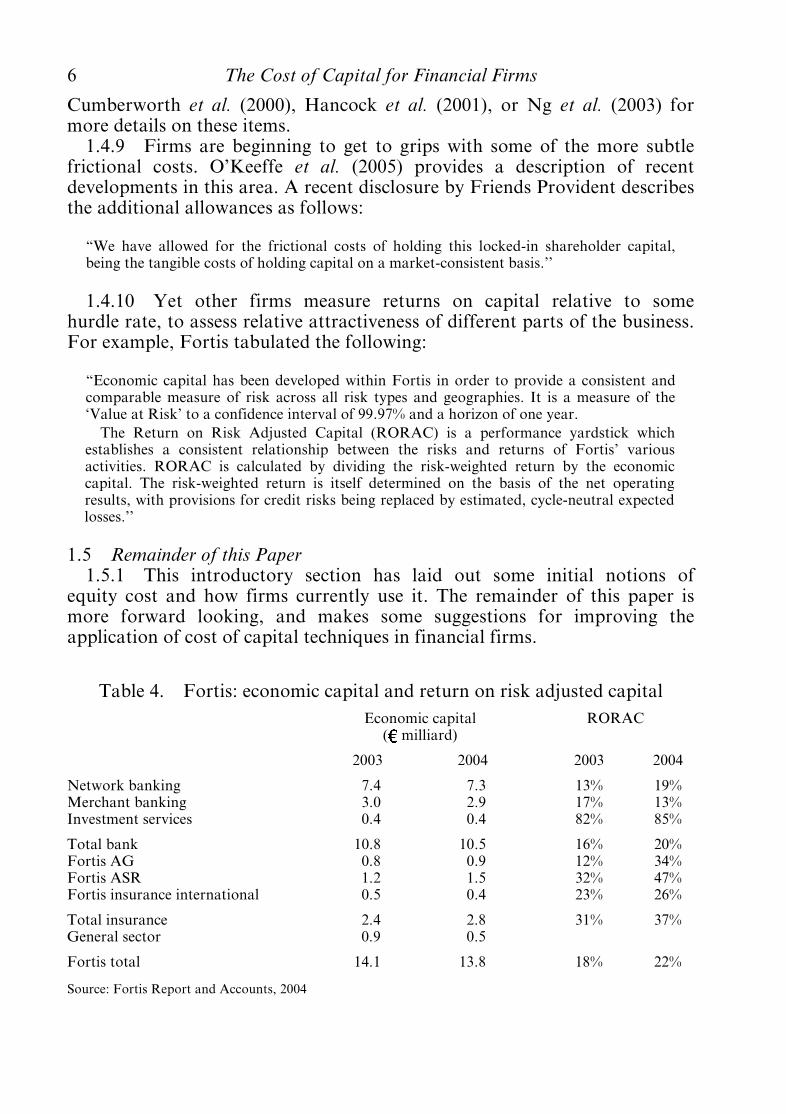
1.4.10 Yet other firms measure returns on capital relative to somehurdle rate, to assess relative attractiveness of different parts of the business.For example, Fortis tabulated the following:
“Economic capital has been developed within Fortis in order to provide a consistent andcomparable measure of risk across all risk types and geographies. It is a measure of the‘Value at Risk’ to a confidence interval of 99.97% and a horizon of one year.The Return on Risk Adjusted Capital (RORAC) is a performance yardstick which
establishes a consistent relationship between the risks and returns of Fortis’ variousactivities. RORAC is calculated by dividing the risk-weighted return by the economiccapital. The risk-weighted return is itself determined on the basis of the net operatingresults, with provisions for credit risks being replaced by estimated, cycle-neutral expectedlosses.’’
1.5 Remainder of this Paper1.5.1 This introductory section has laid out some initial notions of
equity cost and how firms currently use it. The remainder of this paper ismore forward looking, and makes some suggestions for improving theapplication of cost of capital techniques in financial firms.
Table 4. Fortis: economic capital and return on risk adjusted capitalEconomic capital
( milliard)RORAC
2003 2004 2003 2004
Network banking 7.4 7.3 13% 19%Merchant banking 3.0 2.9 17% 13%Investment services 0.4 0.4 82% 85%
Total bank 10.8 10.5 16% 20%Fortis AG 0.8 0.9 12% 34%Fortis ASR 1.2 1.5 32% 47%Fortis insurance international 0.5 0.4 23% 26%
Total insurance 2.4 2.8 31% 37%General sector 0.9 0.5
Fortis total 14.1 13.8 18% 22%
Source: Fortis Report and Accounts, 2004
6 The Cost of Capital for Financial Firms
1.5.2 Section 2 considers what we know about shareholder requiredreturns. These are taken from the body of academic literature known as‘asset pricing theory’. These theories seek to explain market returns in termsof risks underlying different investments. Required market returns form thetheoretical basis of most attempts in practice to assess capital costs.1.5.3 Section 3 raises the main theme of this paper, that is return biases.
While asset pricing theory informs our understanding of required returns onmarket value, many applications require hurdle returns to be set in terms ofaccounting quantities, such as return on equity. The difference indenominators, combined with differences in risk, can give rise to biases whichdistort the apparent attractiveness of different investment opportunities. Weinvestigate possible adjustments to relate a market value return to accountingreturns, including an allowance for franchise value (which we define), andthe use of economic, rather than accounting, capital measures.1.5.4 Section 4 investigates alternative models of corporate valuation
allowing for capital costs. We compare dividend discount models to marketconsistent methods. We also discuss how financial firms create value, the roleof frictional costs, and use these ideas to motivate the calibration ofvaluation models. Finally, we consider the possibility of ruin and its effect oncorporate valuations.
1.5.5 Section 5 considers what capital costs can tell us about the idealamount of capital for a financial firm to hold. The optimum balancesfrictional costs of overcapitalisation against financial distress costs ofundercapitalisation. We consider reasons why economic capital is not thesame as the amount of capital which a firm might wish to hold. Finally, weare able to identify a cost of economic capital in terms of default spreads,and their effect on corporate valuations.
1.5.6 Section 6 concludes with a proposed holistic approach to financialmanagement, applying consistent science to financial reporting, riskmanagement and product pricing.
Æ. What Returns do Shareholders Require?
2.1 Long-Term Equity Returns2.1.1 For many years, Barclays capital has published an annual study of
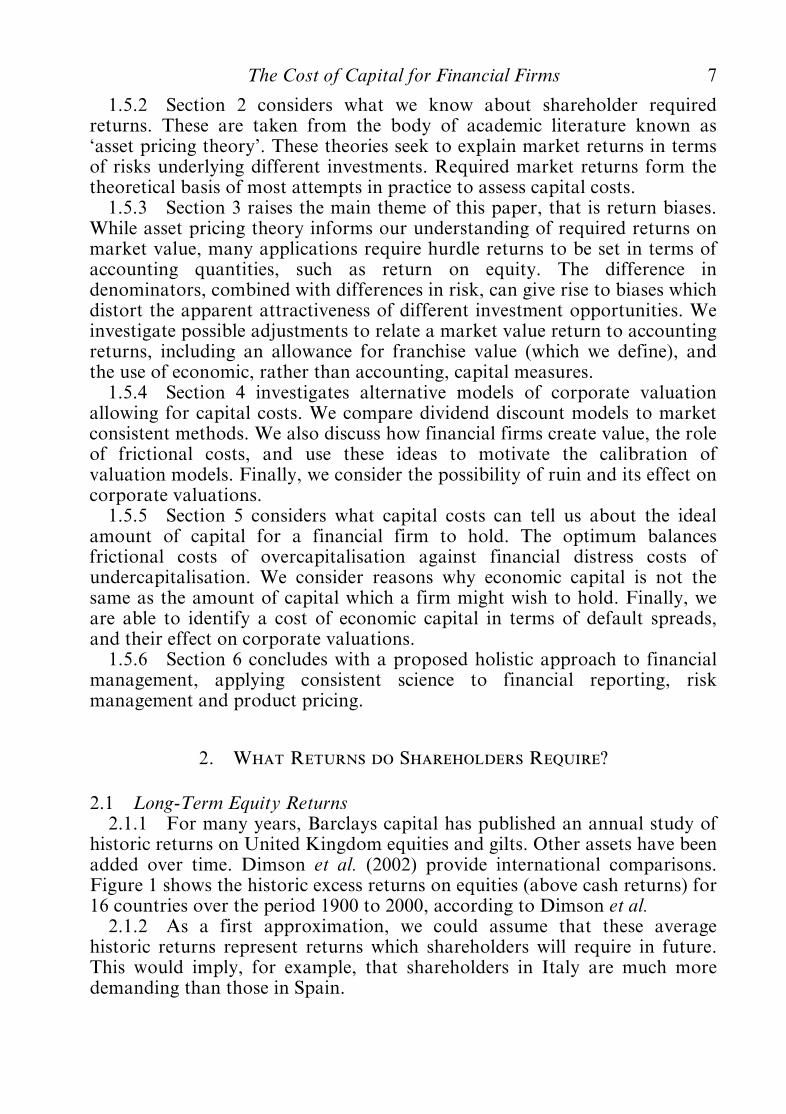
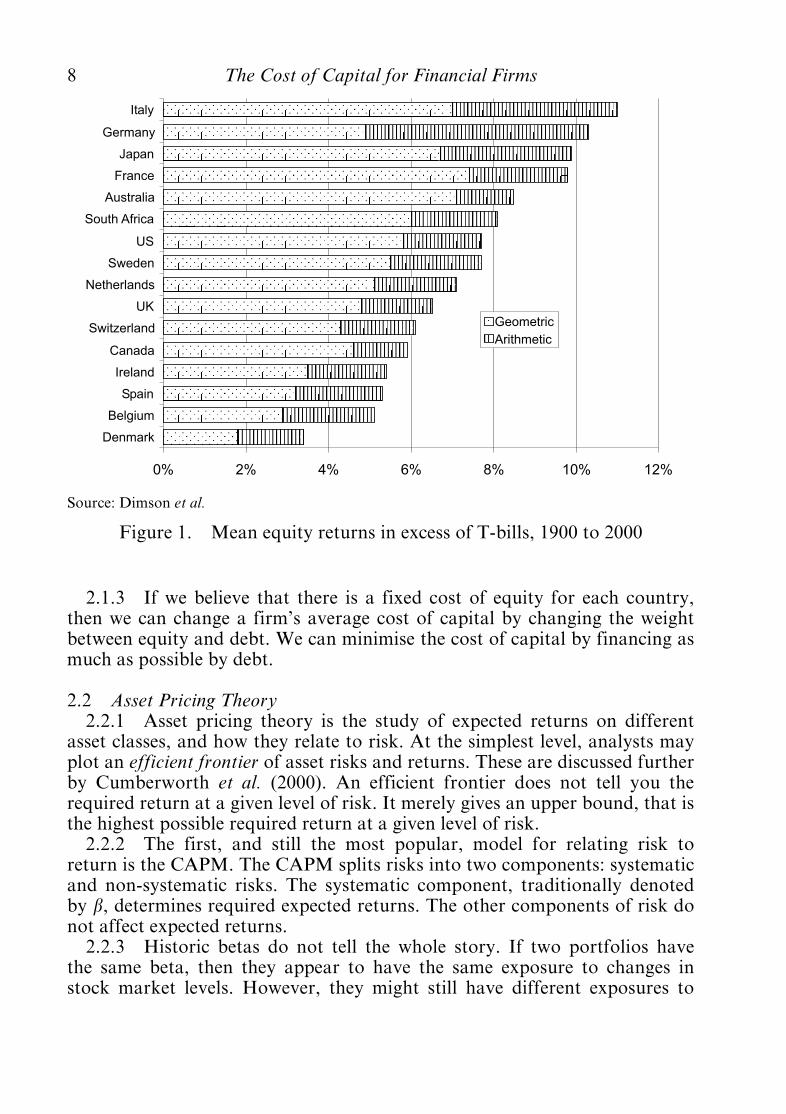
historic returns on United Kingdom equities and gilts. Other assets have beenadded over time. Dimson et al. (2002) provide international comparisons.Figure 1 shows the historic excess returns on equities (above cash returns) for16 countries over the period 1900 to 2000, according to Dimson et al.
2.1.2 As a first approximation, we could assume that these averagehistoric returns represent returns which shareholders will require in future.This would imply, for example, that shareholders in Italy are much moredemanding than those in Spain.
The Cost of Capital for Financial Firms 7
2.1.3 If we believe that there is a fixed cost of equity for each country,then we can change a firm’s average cost of capital by changing the weightbetween equity and debt. We can minimise the cost of capital by financing asmuch as possible by debt.
2.2 Asset Pricing Theory2.2.1 Asset pricing theory is the study of expected returns on different
asset classes, and how they relate to risk. At the simplest level, analysts mayplot an efficient frontier of asset risks and returns. These are discussed furtherby Cumberworth et al. (2000). An efficient frontier does not tell you therequired return at a given level of risk. It merely gives an upper bound, that isthe highest possible required return at a given level of risk.
2.2.2 The first, and still the most popular, model for relating risk toreturn is the CAPM. The CAPM splits risks into two components: systematicand non-systematic risks. The systematic component, traditionally denotedby b, determines required expected returns. The other components of risk donot affect expected returns.2.2.3 Historic betas do not tell the whole story. If two portfolios have
the same beta, then they appear to have the same exposure to changes instock market levels. However, they might still have different exposures to
0% 2% 4% 6% 8% 10% 12%
Denmark
Belgium
Spain
Ireland
Canada
Switzerland
UK
Netherlands
Sweden
US
South Africa
Australia
France
Japan
Germany
Italy
Geometric
Arithmetic
Source: Dimson et al.
Figure 1. Mean equity returns in excess of T-bills, 1900 to 2000
8 The Cost of Capital for Financial Firms
movements in yield curves, real estate markets, credit spreads, currencies orimplied volatilities. The Casualty Actuarial Society, in the United States ofAmerica, commissioned a report to define best practice on the cost of capital.The output was a survey of many possible models (Cummins et al., 2000),including some which allow for other market exposures.
2.2.4 Some financial firms use stochastic scenario generators, forexample in order to assess economic capital or for quantifying the cost ofoptions or guarantees. In most cases, these scenario generators will alreadyinclude a relationship between investment risks and returns. These samemodels can then be used for assessment of capital costs.
2.3 Expected or Actual Returns?2.3.1 Traditional returns on equity models work out the long-term
returns which shareholders require. If the risk free rate is 4.5% and the equityrisk premium is 6%, then this implies that a share with a beta of 80%should return 9.3%.
2.3.2 This is a blunt tool which works well in a year where there is noadverse stock market performance, but life insurance companies are at animmediate disadvantage in years where the stock market performs poorly.This is because the long-run average return is a poor estimate of the actualreturn in a given year, and yet the asset performance of a financial firm(unlike an industrial company) depends directly on the actual marketreturn.2.3.3 Hancock et al. (2001) describe an alternative approach for
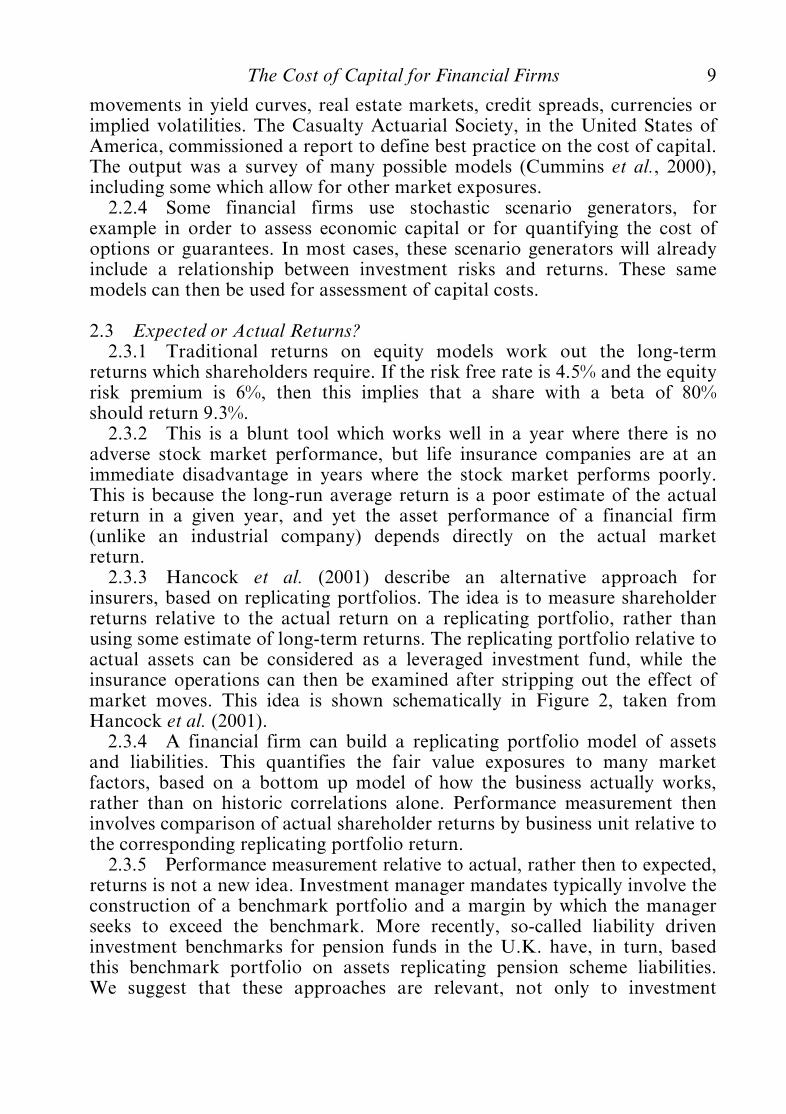
insurers, based on replicating portfolios. The idea is to measure shareholderreturns relative to the actual return on a replicating portfolio, rather thanusing some estimate of long-term returns. The replicating portfolio relative toactual assets can be considered as a leveraged investment fund, while theinsurance operations can then be examined after stripping out the effect ofmarket moves. This idea is shown schematically in Figure 2, taken fromHancock et al. (2001).2.3.4 A financial firm can build a replicating portfolio model of assets
and liabilities. This quantifies the fair value exposures to many marketfactors, based on a bottom up model of how the business actually works,rather than on historic correlations alone. Performance measurement theninvolves comparison of actual shareholder returns by business unit relative tothe corresponding replicating portfolio return.
2.3.5 Performance measurement relative to actual, rather then to expected,returns is not a new idea. Investment manager mandates typically involve theconstruction of a benchmark portfolio and a margin by which the managerseeks to exceed the benchmark. More recently, so-called liability driveninvestment benchmarks for pension funds in the U.K. have, in turn, basedthis benchmark portfolio on assets replicating pension scheme liabilities.We suggest that these approaches are relevant, not only to investment
The Cost of Capital for Financial Firms 9
management contracts and pension fund benchmarks, but also to theassessment of financial firms’ performance.
2.3.6 The replicating portfolio method is more informative than thetraditional beta approach, because it:ö eliminates any effect of market moves, whether beneficial or
detrimental, by capturing market moves in the replicating portfolio;ö is objective rather than subjective;ö removes the need to estimate long-term parameters, such as the equity
risk premium; andö can price correctly for interest rates, credit, and other sensitivities, as
well as for stock market movements.
2.4 Introducing Franchise Value2.4.1 However, the replicating portfolio described above does not quite
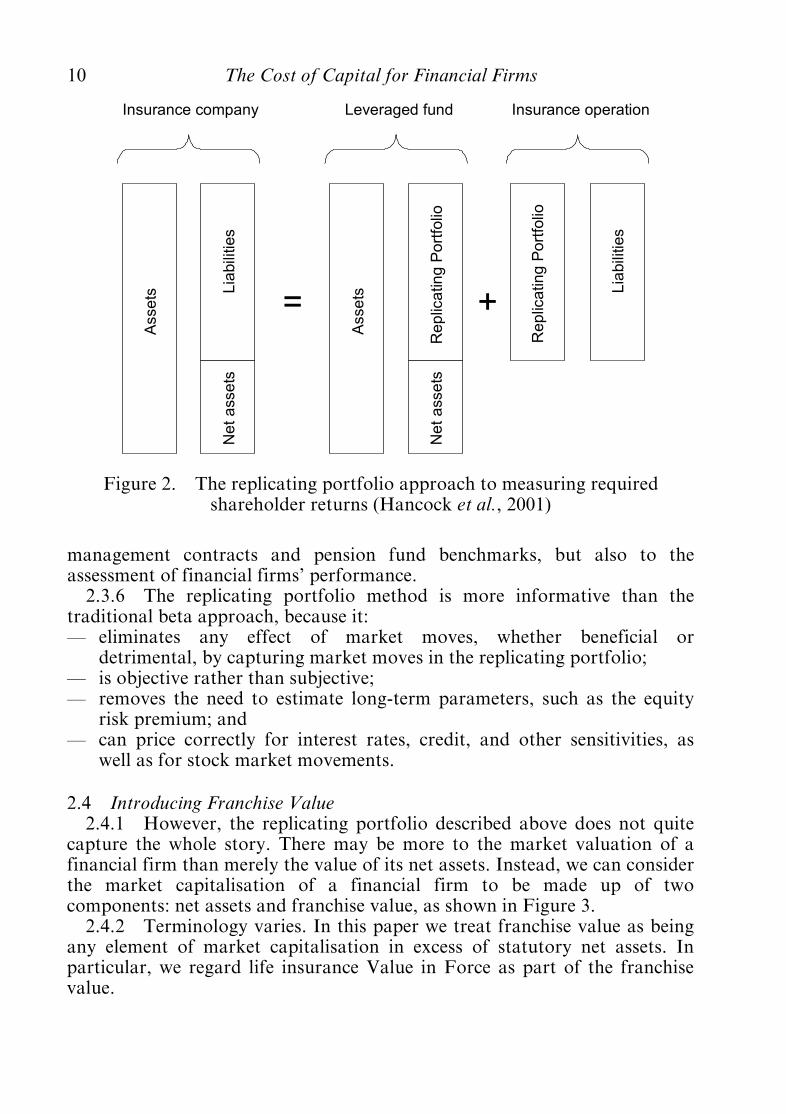
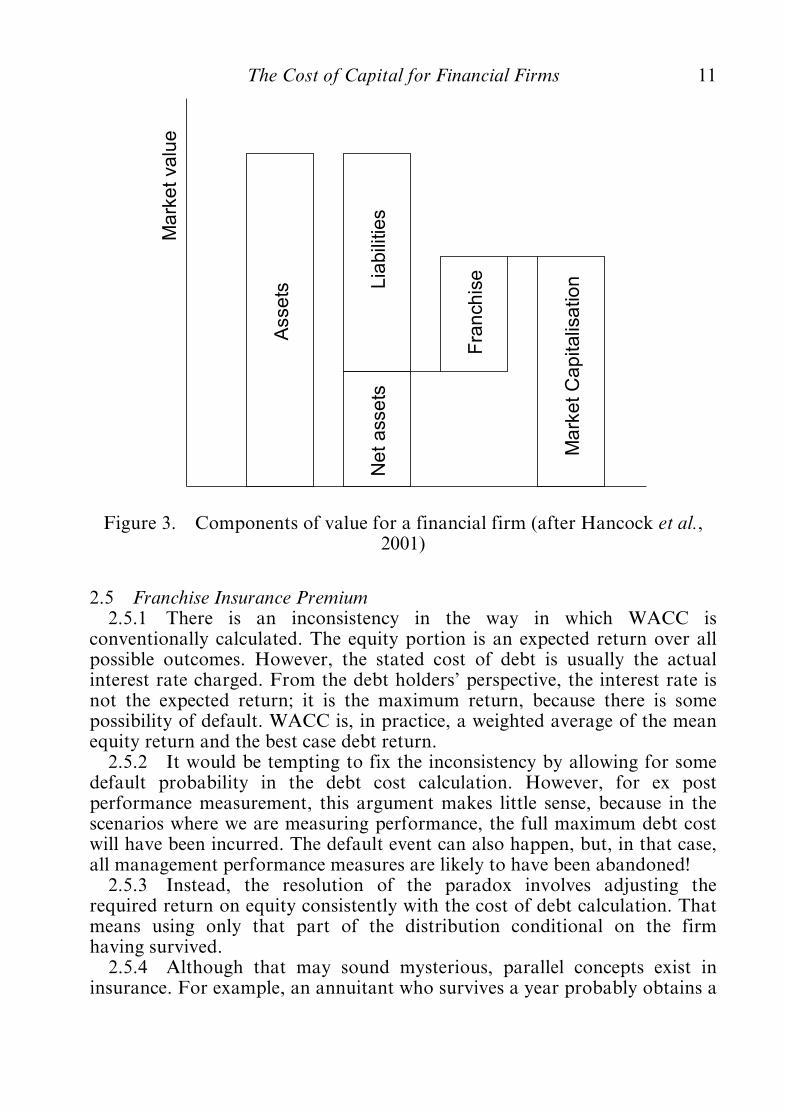
capture the whole story. There may be more to the market valuation of afinancial firm than merely the value of its net assets. Instead, we can considerthe market capitalisation of a financial firm to be made up of twocomponents: net assets and franchise value, as shown in Figure 3.
2.4.2 Terminology varies. In this paper we treat franchise value as beingany element of market capitalisation in excess of statutory net assets. Inparticular, we regard life insurance Value in Force as part of the franchisevalue.
Asse
ts Lia
bili
ties
Ne
ta
sse
ts
Insurance company
Asse
ts
Re
plic
atin
gP
ort
folio
Ne
ta
sse
ts
Leveraged fund
Lia
bili
ties
Insurance operation
Re
plic
atin
gP
ort
folio
= +
Figure 2. The replicating portfolio approach to measuring requiredshareholder returns (Hancock et al., 2001)
10 The Cost of Capital for Financial Firms
2.5 Franchise Insurance Premium2.5.1 There is an inconsistency in the way in which WACC is
conventionally calculated. The equity portion is an expected return over allpossible outcomes. However, the stated cost of debt is usually the actualinterest rate charged. From the debt holders’ perspective, the interest rate isnot the expected return; it is the maximum return, because there is somepossibility of default. WACC is, in practice, a weighted average of the meanequity return and the best case debt return.
2.5.2 It would be tempting to fix the inconsistency by allowing for somedefault probability in the debt cost calculation. However, for ex postperformance measurement, this argument makes little sense, because in thescenarios where we are measuring performance, the full maximum debt costwill have been incurred. The default event can also happen, but, in that case,all management performance measures are likely to have been abandoned!
2.5.3 Instead, the resolution of the paradox involves adjusting therequired return on equity consistently with the cost of debt calculation. Thatmeans using only that part of the distribution conditional on the firmhaving survived.
2.5.4 Although that may sound mysterious, parallel concepts exist ininsurance. For example, an annuitant who survives a year probably obtains a
Asse
ts Lia
bili
ties
Ne
ta
sse
ts
Fra
nch
ise
Ma
rke
tC
ap
italis
atio
n
Ma
rke
tva
lue
Figure 3. Components of value for a financial firm (after Hancock et al.,2001)
The Cost of Capital for Financial Firms 11
better than the risk free return, made possible by the cessation of annuitypayments to those who died. A benchmark annuity return for application tothe living would incorporate this survivorship effect. To take anotherexample, a catastrophe reinsurer expects to collect premiums for beingexposed to risks, even in a year where none of the risks materialise ö andtheir budgeting process reflects this.
2.5.5 We can interpret the additional required return as a form ofinsurance premium against the death of a firm. To put the investor in afinancial firm into the same position as a holder of the replicating portfolio,the financial firm investor needs also to purchase insurance against the lossof franchise value should the firm fail.
2.5.6 In the case of an annuity or catastrophe reinsurance contract, wellestablished procedures exist for determining the sum at risk and theassociated risk premium. For an insurance investor, we argue that therelevant sum at risk is the franchise value, with the appropriate risk premiumbeing related to the spread on credit default swaps. For this reason, wethink of the adjustment as a franchise insurance premium.
2.5.7 Well established procedures exist for calculating replicatingportfolios which mirror the balance sheet sensitivities to market moves. Wepropose that replicating portfolios should also replicate with regard to creditrisk. To replicate the loss of franchise value in the event of failure, thereplicating portfolio might include a sold credit default swap. In that case,the credit spread on the swap forms part of the replicating portfolio return,and there is no need for a separate manual addition of a franchise insurancepremium for performance measurement purposes. Section 4 considers thisidea in more detail, including a calculation of the notional swap amount forinclusion in the replicating portfolio.
2.6 Return Denominators2.6.1 All our theories of required returns are based on market value
returns. We know a lot ö or at least, have many theories ö for market valuereturns on different asset classes.2.6.2 However, applications in performance measurement often relate to
accounting numbers rather than to observable prices. For example, mostWACC calculations use as weights the relative accounting values of equityand debt, rather than the market values.
2.6.3 Sometimes the use of accounting values is forced upon us. This isparticularly the case for performance measures at the business unit or moregranular levels, where separate market values may not be readily available.In other cases, the avoidance of market values may be deliberate, for examplein order to avoid volatility in performance measures linked to marketprices.
2.6.4 There is no reason why accounting returns should equal marketvalue returns. In the next section we consider the reasons for differences, or
12 The Cost of Capital for Financial Firms
biases, between accounting and market value returns, and suggest somecorrections to ensure that accounting-based performance measures makesense.
2.7 Required Returns at Business Unit Level2.7.1 Performance measures are straightforward to define at a group
level. Whether we measure performance on market capitalisation oraccounting net assets, this information is readily available at an aggregatelevel.
2.7.2 However, management decisions usually require a greater degreeof granularity. Allocating profit by business unit is a routine accountingexercise. We can also evaluate replicating portfolios based on the assets andliabilities of each business unit. It is less obvious how to allocate marketcapitalisation or balance sheet equity.
2.7.3 The most popular algorithm for allocating capital betweenbusiness units involves the measurement of each unit’s risk exposure ö forexample in terms of modelled ‘Value at Risk’. The hypothesis is that capitalis required to absorb risks; therefore relative risk becomes an attractive wayof allocating capital between units for performance measurement.2.7.4 An alternative, and potentially superior, approach is, instead, to
allocate market capitalisation between business units. A quick way to do thisis to use analysts’ rules of thumb, such as the price earnings ratio, toapportion value. Comparisons with the market prices of peer group firms,particularly specialist mono-line firms, can give further information.
2.7.5 A more intensive approach to value apportionment makes use ofappraisal values. This is a discounted profit valuation of the whole business(see Burrows & Whitehead, 1987; Burrows & Lang, 1997). The assumptionsare chosen to replicate the known market value ö for example by flexingnew business growth until the present value comes into line with the marketcapitalisation. The present value of business unit profits then provides anindication of how the market capitalisation splits between business units. Thebreakdown is not unique, so the process of setting appraisal valueassumptions can be the subject of heated negotiation. While many insurershave adopted appraisal value techniques, banks have shown lessenthusiasm.
â. Mending Bias in Accounting Measures of Return
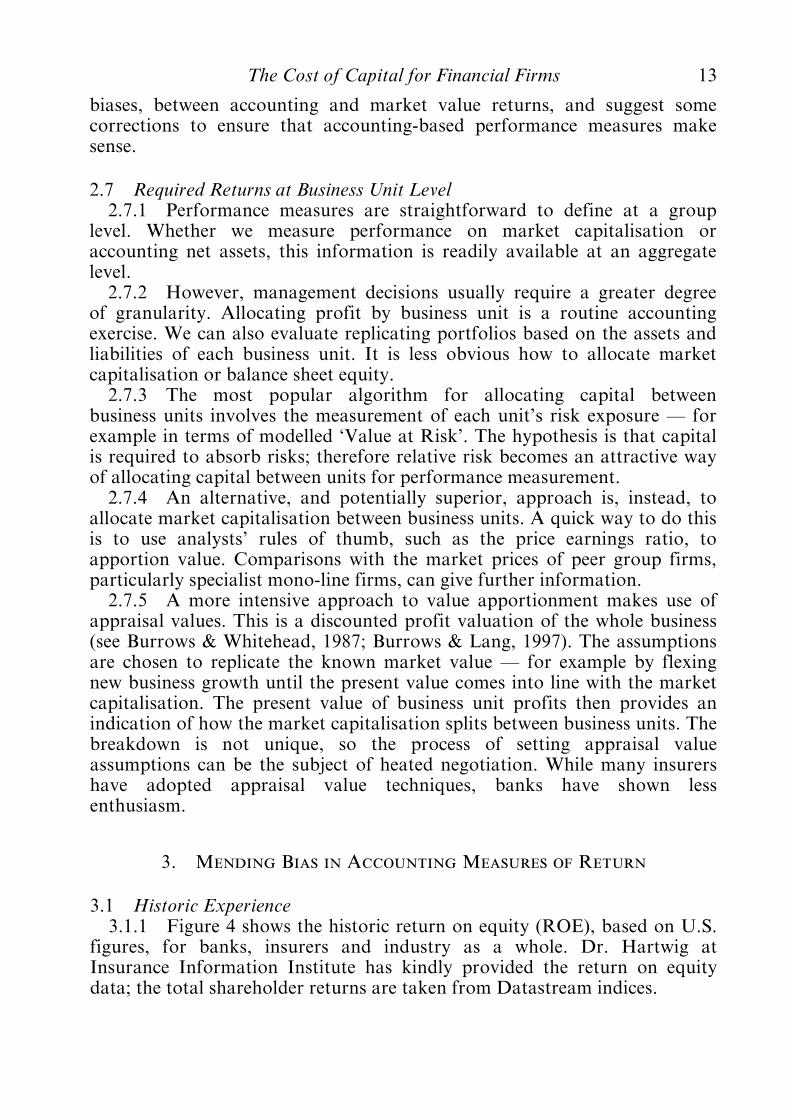
3.1 Historic Experience3.1.1 Figure 4 shows the historic return on equity (ROE), based on U.S.
figures, for banks, insurers and industry as a whole. Dr. Hartwig atInsurance Information Institute has kindly provided the return on equitydata; the total shareholder returns are taken from Datastream indices.
The Cost of Capital for Financial Firms 13
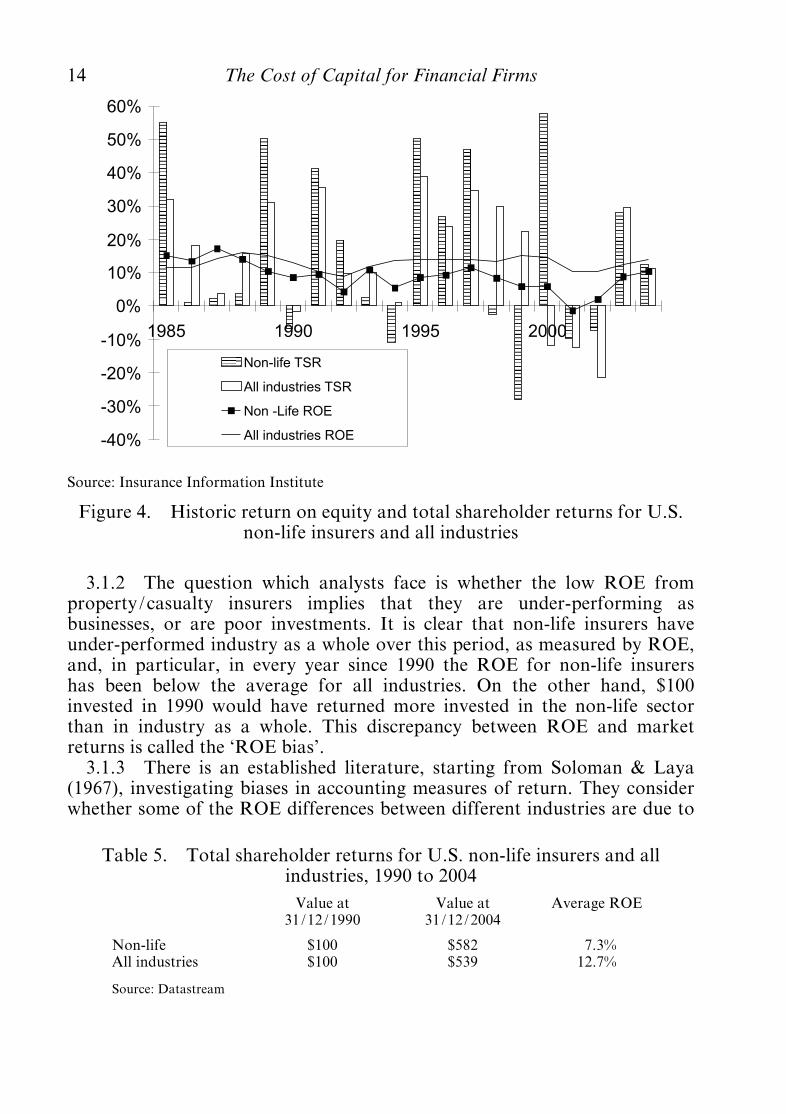
3.1.2 The question which analysts face is whether the low ROE fromproperty/casualty insurers implies that they are under-performing asbusinesses, or are poor investments. It is clear that non-life insurers haveunder-performed industry as a whole over this period, as measured by ROE,and, in particular, in every year since 1990 the ROE for non-life insurershas been below the average for all industries. On the other hand, $100invested in 1990 would have returned more invested in the non-life sectorthan in industry as a whole. This discrepancy between ROE and marketreturns is called the ‘ROE bias’.
3.1.3 There is an established literature, starting from Soloman & Laya(1967), investigating biases in accounting measures of return. They considerwhether some of the ROE differences between different industries are due to
-40%
-30%
-20%
-10%
0%
10%
20%
30%
40%
50%
60%
1985 1990 1995 2000
Non-life TSR
All industries TSR
Non -Life ROE
All industries ROE
Source: Insurance Information Institute
Figure 4. Historic return on equity and total shareholder returns for U.S.non-life insurers and all industries
Table 5. Total shareholder returns for U.S. non-life insurers and allindustries, 1990 to 2004Value at
31/12/1990Value at
31/12/2004Average ROE
Non-life $100 $582 7.3%All industries $100 $539 12.7%
Source: Datastream
14 The Cost of Capital for Financial Firms
imperfections in measurement rather than to differences in managementperformance. However, ROE biases are still little understood amongpractitioners, and we think that this needs to change, especially for financialfirms. For example, the recent Financial Times/PriceWaterhouseCoopers texton cost of capital (Ogier et al., 2004) makes no mention of ROE biases, nor,indeed, of frictional costs.
3.1.4 The classic example in Brealey & Myers, Section 12.5 (1983)compares pharmaceutical and chemical companies. Chemical companieshave mostly fixed assets, consisting of bricks and mortar ö or plant andmachinery. Pharmaceutical companies have many intangible assets, such asintellectual property (research and development) and patent rights.3.1.5 Financial statements typically capitalise fixed assets, but do not
recognise intangible assets. Therefore, the pharmaceutical company willproduce a higher return on equity number than the chemical company, evenif the underlying cash flows are the same. This shows that the definition ofequity is not absolute, and may not be applied consistently, even within asingle organisation.
3.1.6 Thus, the low ROE for U.S. non-life insurers can be explained bythe relatively low barriers to entry, yet the need for significant capital tosupport non-life risk. Non-life insurers, therefore, tend to have relatively lowfranchise value and relatively high equity, relative to annual profits. Asshareholders pay little more than net assets to acquire shares in a non-lifeinsurer, a relatively low ROE can still result in an acceptable market returnto shareholders. There is no reason to doubt that the bias can be sustainedindefinitely.
3.1.7 Of course, equity is one factor of production which happens to beimportant for financial firms. Another factor of production is iron ö theentire workforce may be supported by chair legs made of it. Carmanufacturers and construction firms have a low return on iron (ROI),because their businesses are iron intensive. By this measure, financial firmsare highly efficient, because their ferrous needs are actually quite modest.This does not mean, however, that society, as a whole, benefits from closingdown manufacturers and reallocating resources to the financial servicesindustry. After all, someone has to assemble the cars and the buildings sothat the insurers can insure them.
3.1.8 Brealey & Myers (1983) outline the theoretical solutions to ROEbias in terms of discounted cash flow valuations for assets and liabilities,using methodologies consistent with the market value of the firm. However,they then dismiss these tools for practical use, arguing that the cost ofpreparing the discounted cash flow projections would exceed any benefit ofimproved management.
3.1.9 For financial firms the situation is different. Discounted cash flowvaluations are already available for most assets and liabilities, for with-profitsinsurance funds, and these are increasingly prepared under market consistent
The Cost of Capital for Financial Firms 15
methods, as part of principles and practice of financial management.Therefore, the kind of improvements in performance measurement whichelude pharmaceutical companies can still benefit financial firms.3.1.10 We were flattered to notice that our original drafting of this
section featured in a specimen examination paper for Communication,subject CA3. Candidates were invited to explain the nature of the problemfor the benefit of a works production manager. The question, and modelsolution, are available at www.actuaries.org.uk.
3.2 The Illusion of Equity Efficiency3.2.1 A focus on ROE, rather than on total shareholder returns, creates
two particular biases:ö a failure to recognise activities which build franchise value; andö an artificial incentive to reduce reported equity.
3.2.2 The desire to reduce ‘expensive’ balance sheet equity has been amajor plank of financial strategy, not only for banks, but also for otherfinancial institutions. The market in credit derivatives and asset securitisationhas been helpful for institutions seeking a leaner, more highly geared,balance sheet. Similar patterns are seen elsewhere, for example airlines,which increasingly lease rather than buy their aircraft.
3.2.3 The case for (and against) straightforward leverage of a balancesheet is well rehearsed in the world of classical finance literature. However, inthe world of accounting numbers, the benefits of a financial engineeringsolution which reduces balance sheet equity may be very misleading, since theaccounting cost of debt (in the form of leasing arrangements, for example)can appear low compared with an artificially inflated ROE (due to theunderstated balance sheet equity in the denominator). Indeed, in the airlineindustry it is interesting to consider whether apparently more efficient capitalusage, through reduced balance sheet equity, has produced the bettershareholder returns suggested by the accounting measures, or has simplyincreased the financial distress costs identified by classical finance.
3.3 Return Biases and Portfolio Selection3.3.1 There is a helpful analogy which relates the group function in a
corporation to the role of an active investment manager. Just as aninvestment manager seeks investments with a high return and low risk, so thecorporate centre of a financial group allocates capital to businesses whichproduce a high return on capital.
3.3.2 Return biases often arise because of inconsistencies in accountingtreatment. For example, consider a three-year-old portfolio of poorlyperforming mortgages, compared with a portfolio of high interest credit cardreceivables. The mortgage portfolio might have a return on equity of ÿ10%,while the credit cards show a return on equity of 30%. A RORAC analysis
16 The Cost of Capital for Financial Firms
suggests the allocation of more equity to the credit card business at theexpense of the mortgage business.
3.3.3 This strategy involves disposing of mortgage assets and acquiringnew credit card assets at face value. We would love to return bad mortgagesto the shop, like unwanted Christmas presents, and trade them in forsomething which suits us better. Unfortunately, financial markets are lessforgiving than Marks and Spencer. You can buy and sell blocks ofbusiness at market value, for example using securitisations, but historic costtransactions are harder to arrange. This is especially the case in our example,where the market value of the mortgage book is below face value, and thecredit card receivables trade above face value. Our RORAC methodologyhas told us nothing more than to buy assets cheap and sell them dear.
3.3.4 Ironically, the transaction may still be positive for managementbonuses. The reason is that the sale and acquisition of portfolios may betreated as an exceptional item, and therefore taken below the line of theincome statement. It is interesting to consider whether the reduced flexibilityunder International Financial Reporting Standards (IFRS) relating to below-the-line items will dampen the enthusiasm for RORAC driven transactions.
3.3.5 If we revalue the portfolios at their securitisation value, the ROEdifferential goes away. The high ROE on the credit card portfolio is anartefact of its prudent valuation, just as the low ROE on the low qualitymortgage portfolio is an artefact of its less than prudent valuation. Decisionsto buy or sell portfolios turn out to be driven by ROE bias, and not byshareholder value.
3.3.6 The same issues arise in insurance. Businesses with low ROE oftencorrespond to life products with embedded options and guarantees; thecorresponding liabilities may be undervalued on the balance sheet.Conversely, non-life run-off portfolios can appear to have a high ROE,because of the prudence implicit in undiscounted reserves. However, it wouldbe na|« ve to assume that capital can easily be reallocated from life to non-life, as this would require charitable third parties prepared to take on the lifeliabilities at their understated value, while happy to pay an undiscountedprice to cede non-life liabilities.
3.4 Return Biases and Monopoly Regulation3.4.1 Accounting biases also have interesting consequences for price
regulation. Some competition regulators argue that a loading for profit of,say, $10, is evidence of market failure, because shareholders get $10 fornothing. Their solution is the regulation of the price of financial services toeliminate the $10 margin, thus protecting consumers from exploitativefinancial firms. Most recently, we have seen such intervention in lending tosmall and medium sized enterprises.
3.4.2 To charge the $10, the firm must persuade the regulator that $10represents a fair return to shareholders. The difficulty is that a CAPM return
The Cost of Capital for Financial Firms 17
applied to capital produces a lower number. However, we now know thatsuch an application of CAPM creates a bias which may require correction.
3.4.3 A firm might legitimately argue that its ability to commandpremium prices reflects past investments in customer service and branding. Ifthe observable franchise value reflects a stream of $10 profits, then thefranchise correction to the ROE bias justifies the inclusion of the $10 profitmargin.
3.4.4 Suppose that the regulator disputes the use of franchise value toremove ROE bias. The predictable effect of such an attitude is to discouragefirms’ investment in the brand or service which develops the franchise value.This results in reduced customer loyalty and greater customer switchingbetween financial service providers, and ö here is the irony ö the switchinggenerates additional administrative and acquisition costs of, say, $20, whichare recognised in the regulatory formula, thereby permitting firms to passthem on to consumers. A na|« ve monopoly regulators’ impact is to confiscate$10 from consumers, $10 from shareholders and spend the $20 on avoidableadministration.
3.4.5 We conclude that, while firms need to understand ROE biases foraccurate pricing, so too must price regulators.
3.5 Fixing the Bias3.5.1 On a market value basis, the shareholder return is any gain in the
market value of the share plus dividends paid (or less any new equitysubscribed). We can also write the total shareholder return as a weightedaverage of the return on equity and the franchise growth rate, for thefollowing reason:
(Equity þ Franchise) � Total shareholder return¼ Increase in net assets þ Increase in franchise value þ Dividend¼ Increase in franchise value þ Retained profit þ Dividend¼ Franchise � Franchise growth rate þ Equity � Return on equity.
3.5.2 This identity holds in theory, but validation in practice is afearsome challenge, especially when working from published financialstatements. It is difficult to find a single company for which the stateddividend plus the increase in equity actually equals the stated profit. Thereasons are many and varied, sometimes relating to prior year adjustments orrestatements due to share splits, scrip dividends or other capitaltransactions. Current accounting standards provide a number of loopholes,where firms can report changes to balance sheets without any effect on theincome statement. IFRS should alleviate this problem, although not entirelyeliminate it.
3.5.3 It would be convenient for performance measurement if the return
18 The Cost of Capital for Financial Firms
on equity corresponded directly to the total shareholder return. This wouldhappen if franchise growth is the same as return on equity.
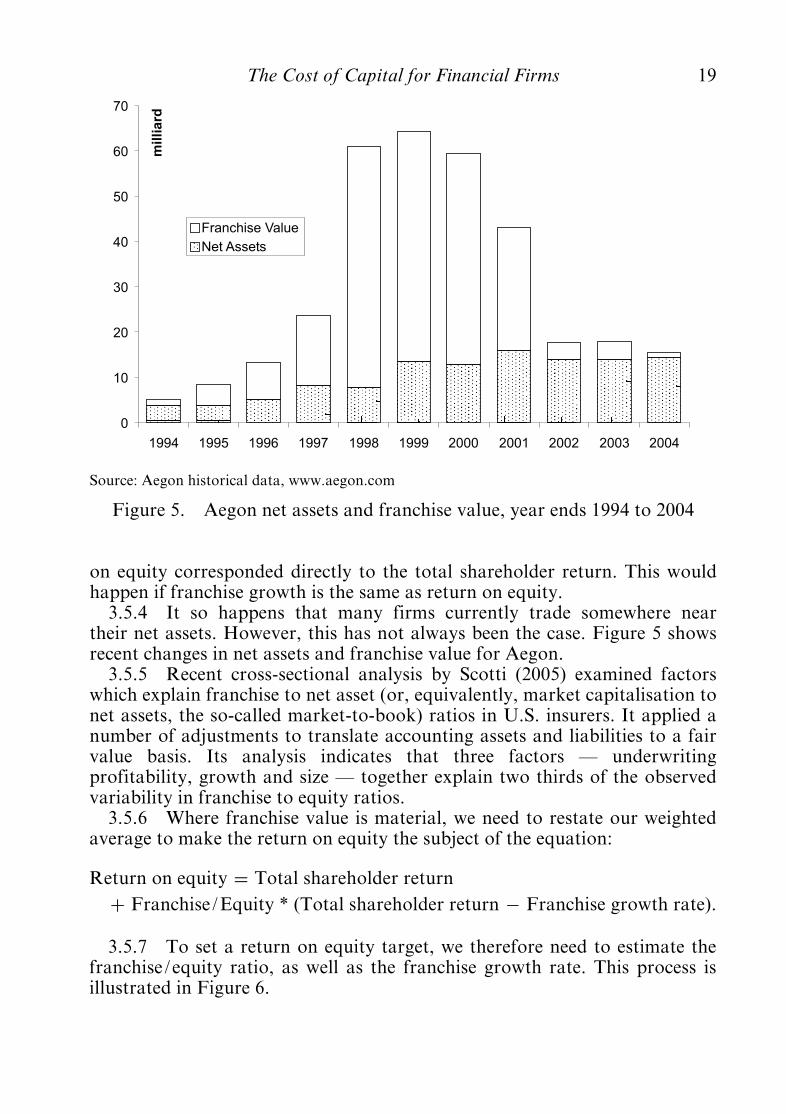
3.5.4 It so happens that many firms currently trade somewhere neartheir net assets. However, this has not always been the case. Figure 5 showsrecent changes in net assets and franchise value for Aegon.
3.5.5 Recent cross-sectional analysis by Scotti (2005) examined factorswhich explain franchise to net asset (or, equivalently, market capitalisation tonet assets, the so-called market-to-book) ratios in U.S. insurers. It applied anumber of adjustments to translate accounting assets and liabilities to a fairvalue basis. Its analysis indicates that three factors ö underwritingprofitability, growth and size ö together explain two thirds of the observedvariability in franchise to equity ratios.
3.5.6 Where franchise value is material, we need to restate our weightedaverage to make the return on equity the subject of the equation:
Return on equity ¼ Total shareholder returnþ Franchise/Equity * (Total shareholder return ÿ Franchise growth rate).
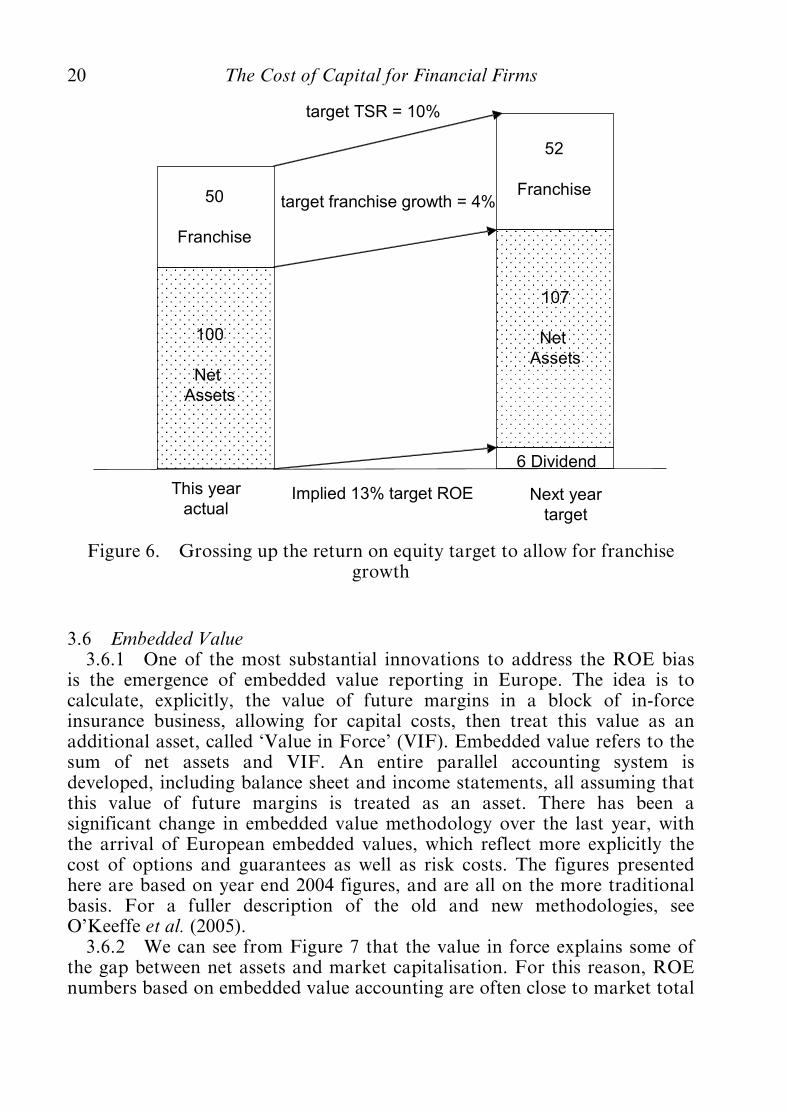
3.5.7 To set a return on equity target, we therefore need to estimate thefranchise/equity ratio, as well as the franchise growth rate. This process isillustrated in Figure 6.
0
10
20
30
40
50
60
70
1994 1995 1996 1997 1998 1999 2000 2001 2002 2003 2004
�m
illi
ard
Franchise Value
Net Assets
Source: Aegon historical data, www.aegon.com
Figure 5. Aegon net assets and franchise value, year ends 1994 to 2004
The Cost of Capital for Financial Firms 19
3.6 Embedded Value3.6.1 One of the most substantial innovations to address the ROE bias
is the emergence of embedded value reporting in Europe. The idea is tocalculate, explicitly, the value of future margins in a block of in-forceinsurance business, allowing for capital costs, then treat this value as anadditional asset, called ‘Value in Force’ (VIF). Embedded value refers to thesum of net assets and VIF. An entire parallel accounting system isdeveloped, including balance sheet and income statements, all assuming thatthis value of future margins is treated as an asset. There has been asignificant change in embedded value methodology over the last year, withthe arrival of European embedded values, which reflect more explicitly thecost of options and guarantees as well as risk costs. The figures presentedhere are based on year end 2004 figures, and are all on the more traditionalbasis. For a fuller description of the old and new methodologies, seeO’Keeffe et al. (2005).3.6.2 We can see from Figure 7 that the value in force explains some of
the gap between net assets and market capitalisation. For this reason, ROEnumbers based on embedded value accounting are often close to market total
This year
actualNext year
target
100
Net
Assets
50
Franchise
6 Dividend
52
Franchise
107
Net
Assets
Implied 13% target ROE
target TSR = 10%
target franchise growth = 4%
Figure 6. Grossing up the return on equity target to allow for franchisegrowth
20 The Cost of Capital for Financial Firms
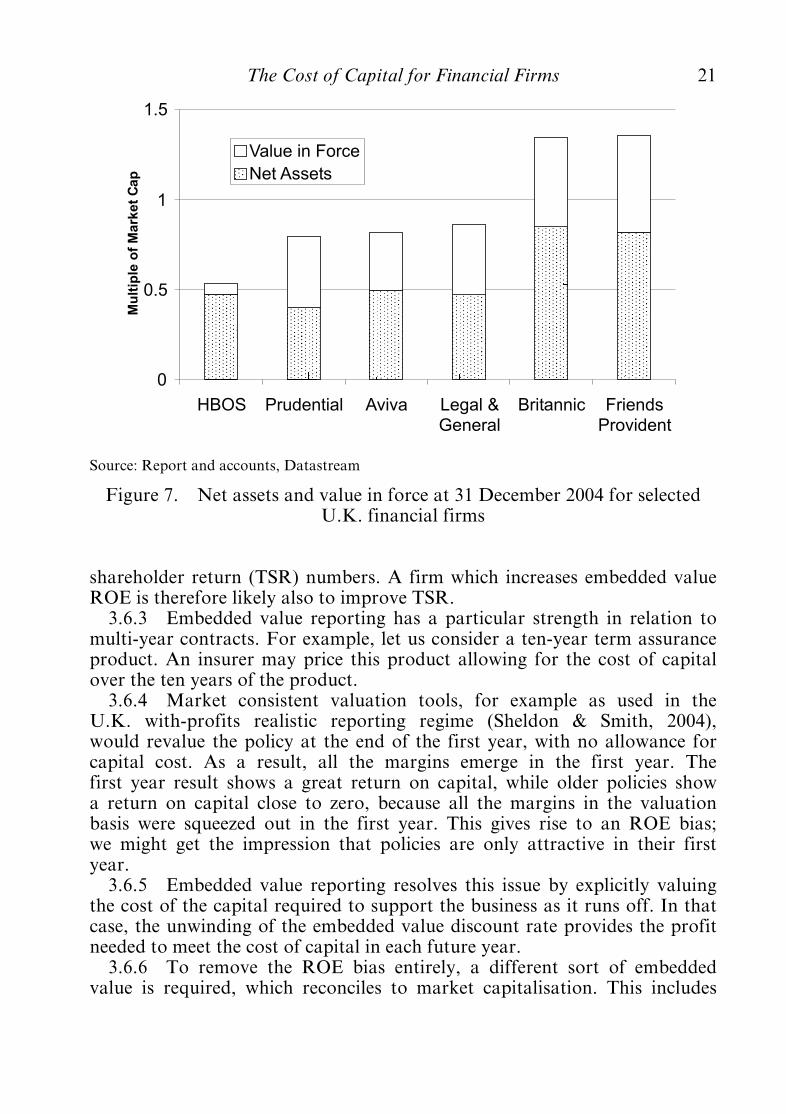
shareholder return (TSR) numbers. A firm which increases embedded valueROE is therefore likely also to improve TSR.
3.6.3 Embedded value reporting has a particular strength in relation tomulti-year contracts. For example, let us consider a ten-year term assuranceproduct. An insurer may price this product allowing for the cost of capitalover the ten years of the product.
3.6.4 Market consistent valuation tools, for example as used in theU.K. with-profits realistic reporting regime (Sheldon & Smith, 2004),would revalue the policy at the end of the first year, with no allowance forcapital cost. As a result, all the margins emerge in the first year. Thefirst year result shows a great return on capital, while older policies showa return on capital close to zero, because all the margins in the valuationbasis were squeezed out in the first year. This gives rise to an ROE bias;we might get the impression that policies are only attractive in their firstyear.
3.6.5 Embedded value reporting resolves this issue by explicitly valuingthe cost of the capital required to support the business as it runs off. In thatcase, the unwinding of the embedded value discount rate provides the profitneeded to meet the cost of capital in each future year.3.6.6 To remove the ROE bias entirely, a different sort of embedded
value is required, which reconciles to market capitalisation. This includes
0
0.5
1
1.5
HBOS Prudential Aviva Legal &General
Britannic FriendsProvident
Mu
ltip
leo
fM
ark
et
Ca
p
Value in Force
Net Assets
Source: Report and accounts, Datastream
Figure 7. Net assets and value in force at 31 December 2004 for selectedU.K. financial firms
The Cost of Capital for Financial Firms 21
making an allowance for new business and using profitability assumptionsconsistent with the market view rather than based on internal managementviews, as well as allowing for all capital likely to be held on a balance sheetrather than a statutory minimum.
3.6.7 Insurers seeking to explain embedded value techniques would findit helpful if these tools were not unique to the life insurance industry. It isinteresting to consider why banks, non-life insurers and other financial firmshave not developed their own versions of embedded value reporting,especially in relation to the valuation of bank loan portfolios. Here are threepossible reasons:ö There is a perception that the need for embedded value arises only
because the statutory reporting regime is artificially prudent. Some wouldargue that, if you value the balance sheet accurately in the first place,then there is no need for embedded value adjustments.
ö Overdrafts and credit cards are open-ended facilities. Customers haveflexibility over their loan balances, within authorised lending limits.Therefore, the projection of future margins is more speculative than isthe case for an insurance policy with fixed contractual cash flows.Indeed, the fundamental embedded value distinction between in forceand new business is difficult to apply. If a customer starts to use a long-standing overdraft facility, is this in-force or new business? Similar issuesapply to some degree with personal lines insurance ö it is ambiguouswhether a renewed motor insurance policy represents new business or alow customer lapse rate.
ö Banks, encouraged by regulators, have poured resources into thecalculation of economic capital. Approaches abound for managingbusinesses and measuring value based on economic capital calculations.Arguably, the enthusiasm for economic capital methodologies hascrowded out alternative value measures.
3.7 Economic Capital3.7.1 There are two popular approaches to the allowance for risk in
performance measurement:ö modify the required return to reflect risk, for example using replicating
portfolios; orö modify the equity on which a cost of capital is charged.
3.7.2 The first of these is called ‘contingent claim pricing’ or ‘assetpricing theory’, while the second route is called ‘economic capital’ or‘RORAC’ ö return on risk adjusted capital. Economic capital is the amountof equity required such that a firm has a specified probability of meeting adefined liability over a defined time horizon. The probability is often set byreference to historic defaults for corporate bonds with a particular credit
22 The Cost of Capital for Financial Firms
grade. Economic capital is often measured on a fair value net assets basis,ignoring the impact of regulatory or accounting constraints.
3.7.3 The methodology recognises that the required profit for eachbusiness unit depends on its risk. Capitalising operating units to an agreedrating standard is an attempt to standardise the risk. The implicit assumptionis that two units capitalised to the same rating standard would merit thesame required return. In other words, the cost of capital is assumed to be afunction of the aspired credit grade. Risk from a shareholder perspective isequated to the risk of default.
3.7.4 Economic capital can be looked at from a bottom-up and a top-down manner. Top-down economic capital can mean different things todifferent people ö for example, owing to a different choice of time horizon(measuring daily, yearly or longer-term risk) or to different approaches to theconstraints imposed by regulatory regimes (with pure approaches pretendingthat these regimes do not exist). Economic capital can help investors tounderstand the level of risk capital and diversification which a company has.It can be useful for regulators and rating agencies as well.
3.7.5 The divergence of approaches leads to the following commoncriticisms. Firstly, it is impossible to compare economic capital from oneorganisation to another, because no two organisations use the same metric.This undermines claims that ‘economic’ capital measures are free of arbitraryconventions or are more fundamental than accounting or regulatory capitalmeasures. Secondly, the lack of uniform standards and independent auditprocedures leave users of economic capital numbers uncertain as to how theyhave been calculated or how reliable they are.
3.7.6 For pricing, a bottom-up approach can be used, whichincorporates both market consistent pricing and economic capital in respectof non-hedgeable risk, from which a frictional cost of risk capital is obtained.To the extent that a mismatch risk is taken, additional capital is calculatedand charged for. We develop this further in Section 4.
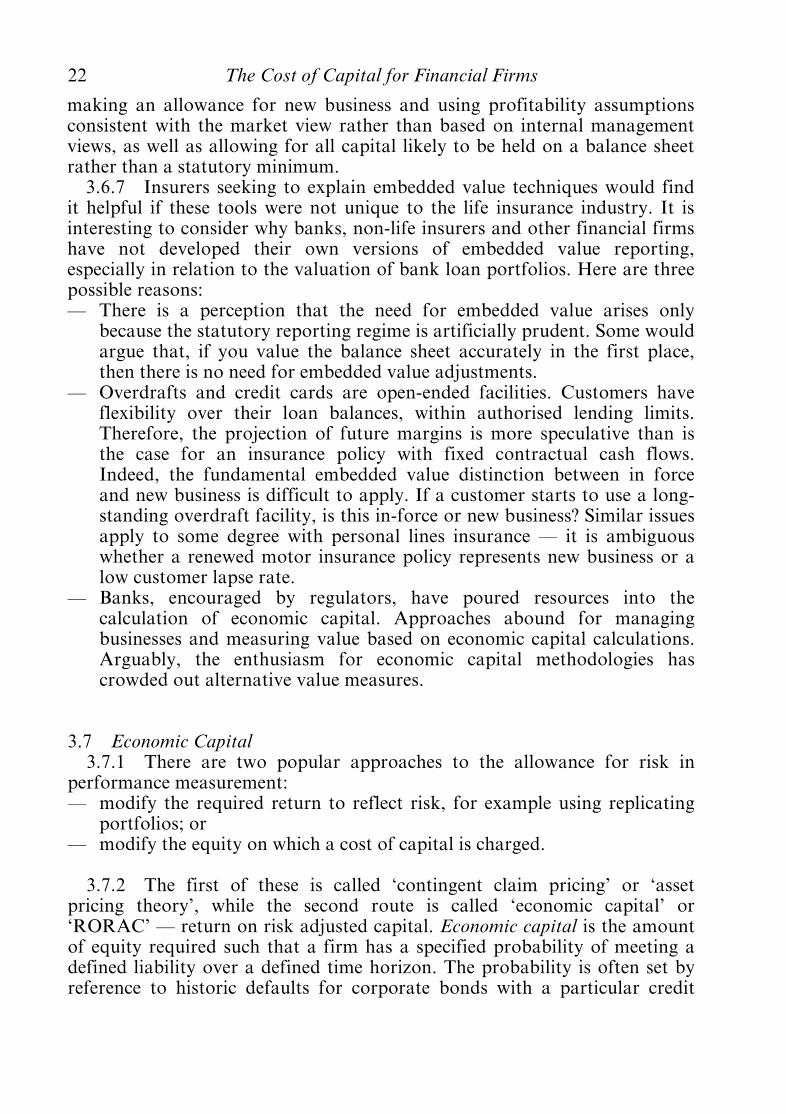
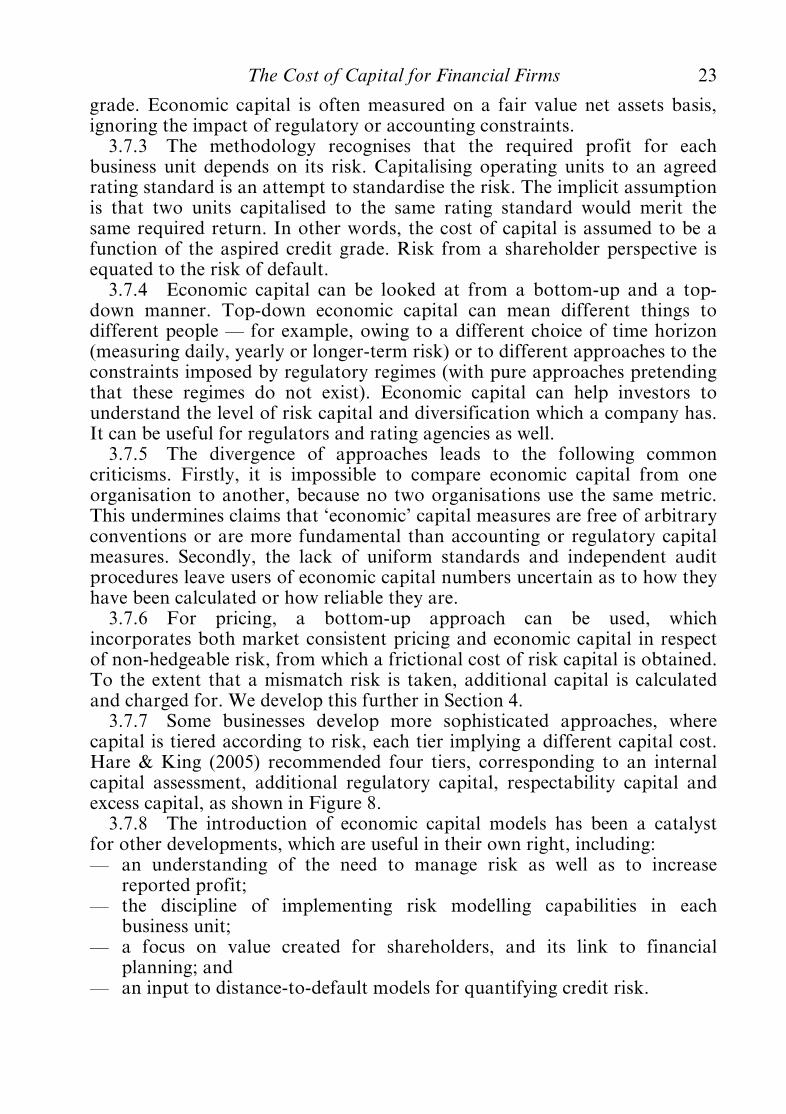
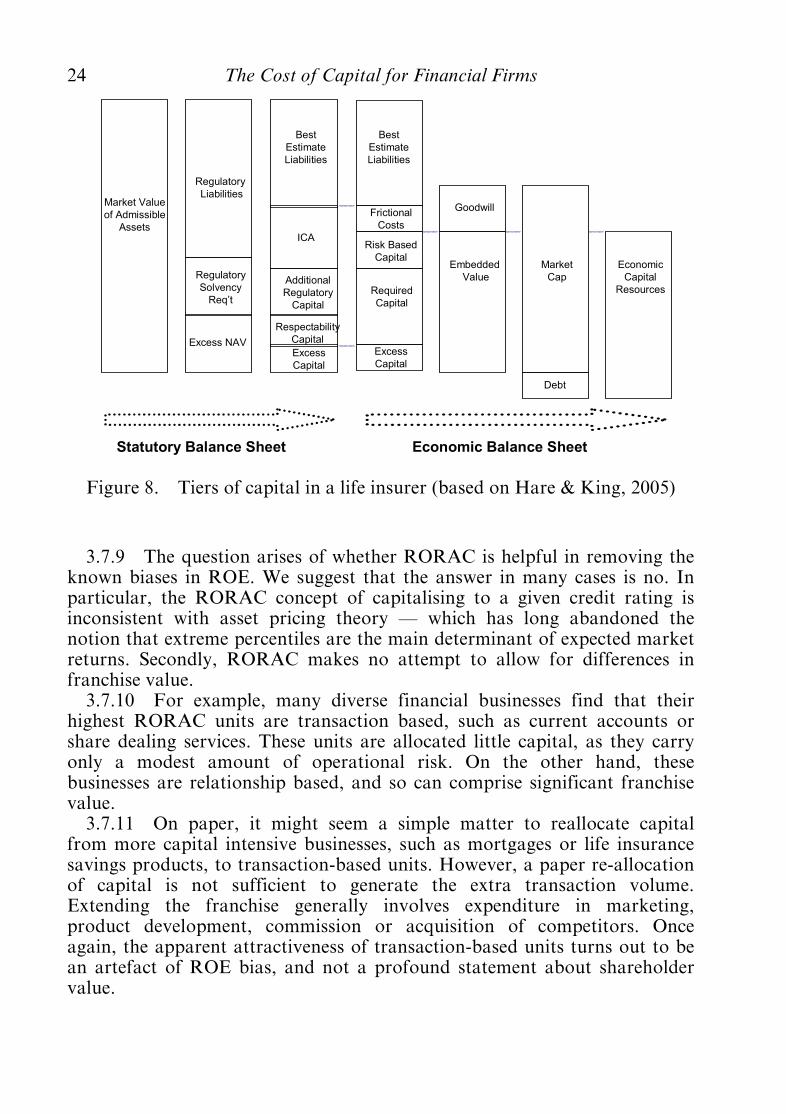
3.7.7 Some businesses develop more sophisticated approaches, wherecapital is tiered according to risk, each tier implying a different capital cost.Hare & King (2005) recommended four tiers, corresponding to an internalcapital assessment, additional regulatory capital, respectability capital andexcess capital, as shown in Figure 8.
3.7.8 The introduction of economic capital models has been a catalystfor other developments, which are useful in their own right, including:ö an understanding of the need to manage risk as well as to increase
reported profit;ö the discipline of implementing risk modelling capabilities in each
business unit;ö a focus on value created for shareholders, and its link to financial
planning; andö an input to distance-to-default models for quantifying credit risk.
The Cost of Capital for Financial Firms 23
3.7.9 The question arises of whether RORAC is helpful in removing theknown biases in ROE. We suggest that the answer in many cases is no. Inparticular, the RORAC concept of capitalising to a given credit rating isinconsistent with asset pricing theory ö which has long abandoned thenotion that extreme percentiles are the main determinant of expected marketreturns. Secondly, RORAC makes no attempt to allow for differences infranchise value.
3.7.10 For example, many diverse financial businesses find that theirhighest RORAC units are transaction based, such as current accounts orshare dealing services. These units are allocated little capital, as they carryonly a modest amount of operational risk. On the other hand, thesebusinesses are relationship based, and so can comprise significant franchisevalue.
3.7.11 On paper, it might seem a simple matter to reallocate capitalfrom more capital intensive businesses, such as mortgages or life insurancesavings products, to transaction-based units. However, a paper re-allocationof capital is not sufficient to generate the extra transaction volume.Extending the franchise generally involves expenditure in marketing,product development, commission or acquisition of competitors. Onceagain, the apparent attractiveness of transaction-based units turns out to bean artefact of ROE bias, and not a profound statement about shareholdervalue.
Additional
Regulatory
Capital
Statutory Balance Sheet
Market Value
of Admissible
Assets
Regulatory
Liabilities
Excess NAV
Embedded
Value
Goodwill
Best
Estimate
Liabilities
Market
Cap
Debt
Regulatory
Solvency
Req’t
Risk Based
Capital
Frictional
Costs
Excess
Capital
Respectability
Capital
Economic
Capital
Resources
ICA
Best
Estimate
Liabilities
Excess
Capital
Required
Capital
Economic Balance Sheet
Figure 8. Tiers of capital in a life insurer (based on Hare & King, 2005)
24 The Cost of Capital for Financial Firms
ª. Corporate Valuation and the Cost of Capital
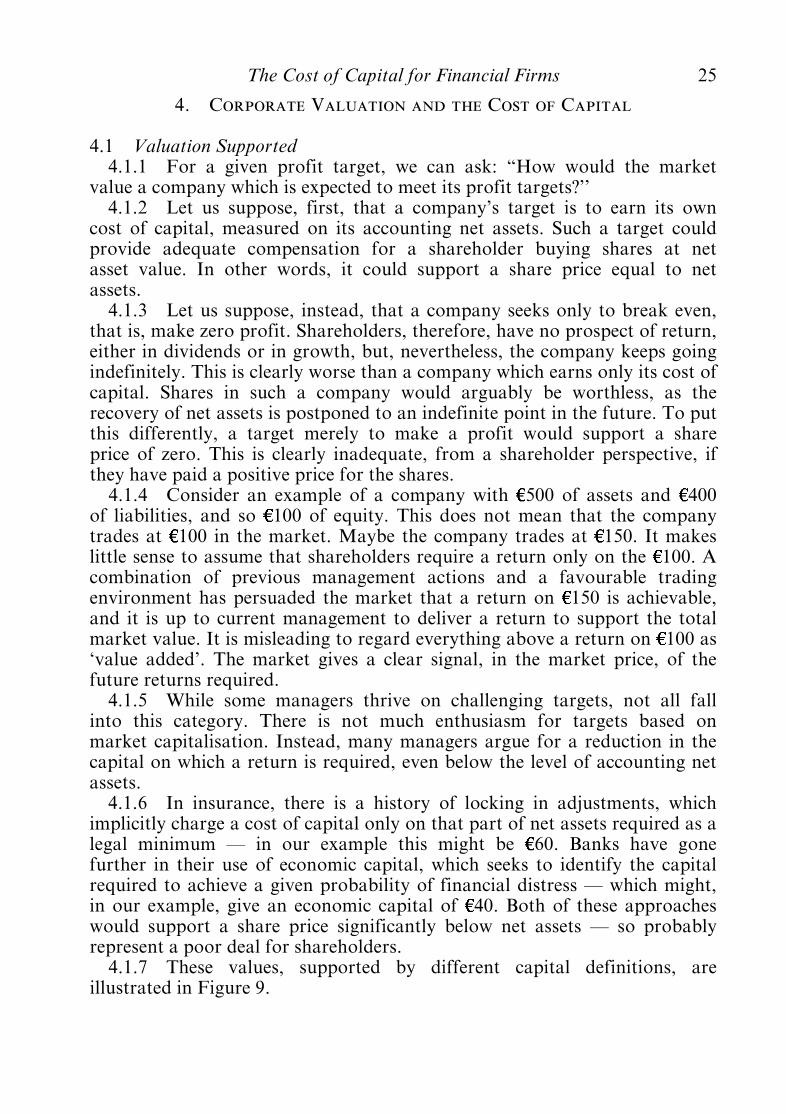
4.1 Valuation Supported4.1.1 For a given profit target, we can ask: “How would the market
value a company which is expected to meet its profit targets?’’4.1.2 Let us suppose, first, that a company’s target is to earn its own
cost of capital, measured on its accounting net assets. Such a target couldprovide adequate compensation for a shareholder buying shares at netasset value. In other words, it could support a share price equal to netassets.
4.1.3 Let us suppose, instead, that a company seeks only to break even,that is, make zero profit. Shareholders, therefore, have no prospect of return,either in dividends or in growth, but, nevertheless, the company keeps goingindefinitely. This is clearly worse than a company which earns only its cost ofcapital. Shares in such a company would arguably be worthless, as therecovery of net assets is postponed to an indefinite point in the future. To putthis differently, a target merely to make a profit would support a shareprice of zero. This is clearly inadequate, from a shareholder perspective, ifthey have paid a positive price for the shares.
4.1.4 Consider an example of a company with 500 of assets and 400of liabilities, and so 100 of equity. This does not mean that the companytrades at 100 in the market. Maybe the company trades at 150. It makeslittle sense to assume that shareholders require a return only on the 100. Acombination of previous management actions and a favourable tradingenvironment has persuaded the market that a return on 150 is achievable,and it is up to current management to deliver a return to support the totalmarket value. It is misleading to regard everything above a return on 100 as‘value added’. The market gives a clear signal, in the market price, of thefuture returns required.
4.1.5 While some managers thrive on challenging targets, not all fallinto this category. There is not much enthusiasm for targets based onmarket capitalisation. Instead, many managers argue for a reduction in thecapital on which a return is required, even below the level of accounting netassets.
4.1.6 In insurance, there is a history of locking in adjustments, whichimplicitly charge a cost of capital only on that part of net assets required as alegal minimum ö in our example this might be 60. Banks have gonefurther in their use of economic capital, which seeks to identify the capitalrequired to achieve a given probability of financial distress ö which might,in our example, give an economic capital of 40. Both of these approacheswould support a share price significantly below net assets ö so probablyrepresent a poor deal for shareholders.
4.1.7 These values, supported by different capital definitions, areillustrated in Figure 9.
The Cost of Capital for Financial Firms 25
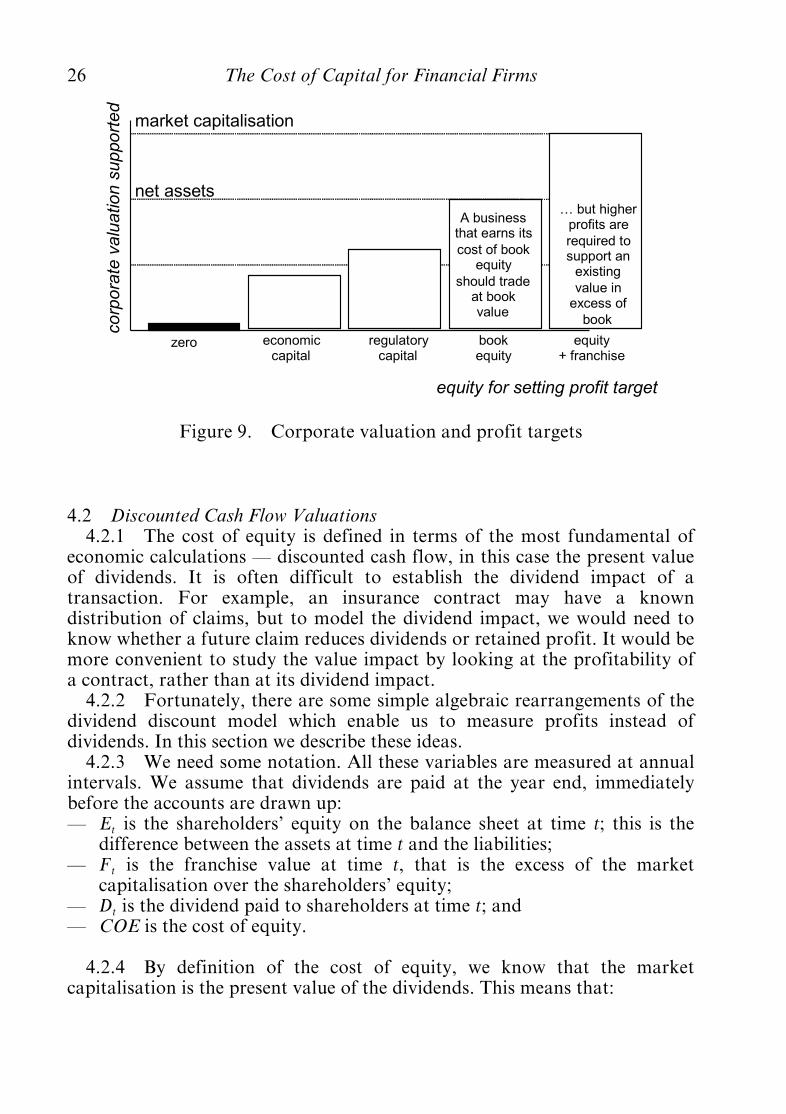
4.2 Discounted Cash Flow Valuations4.2.1 The cost of equity is defined in terms of the most fundamental of
economic calculations ö discounted cash flow, in this case the present valueof dividends. It is often difficult to establish the dividend impact of atransaction. For example, an insurance contract may have a knowndistribution of claims, but to model the dividend impact, we would need toknow whether a future claim reduces dividends or retained profit. It would bemore convenient to study the value impact by looking at the profitability ofa contract, rather than at its dividend impact.
4.2.2 Fortunately, there are some simple algebraic rearrangements of thedividend discount model which enable us to measure profits instead ofdividends. In this section we describe these ideas.
4.2.3 We need some notation. All these variables are measured at annualintervals. We assume that dividends are paid at the year end, immediatelybefore the accounts are drawn up:ö Et is the shareholders’ equity on the balance sheet at time t; this is the
difference between the assets at time t and the liabilities;ö Ft is the franchise value at time t, that is the excess of the market
capitalisation over the shareholders’ equity;ö Dt is the dividend paid to shareholders at time t; andö COE is the cost of equity.
4.2.4 By definition of the cost of equity, we know that the marketcapitalisation is the present value of the dividends. This means that:
corp
ora
tevalu
ation
support
ed
equity for setting profit target
zero economiccapital
net assets
market capitalisation
regulatorycapital
bookequity
equity+ franchise
A businessthat earns its
cost of bookequity
should tradeat bookvalue
… but higherprofits are
required tosupport an
existing
value inexcess of
book
Figure 9. Corporate valuation and profit targets
26 The Cost of Capital for Financial Firms
E0 þ F0 ¼X1t¼1
Dt
ð1þ COEÞt :
4.2.5 The profit during the year can be expressed as:ö distributed profit, that is dividend; plusö retained profit, that is increase in equity.
4.2.6 To make the accounting work, we need to treat new equity raisedas a negative dividend. We can then rewrite the corporate valuation to referto profit (the term in square brackets):
E0 þ F0 ¼X1t¼1
Dt þ Et ÿ Etÿ1½ �ÿCOE:Etÿ1
ð1þ COEÞt ÿ
X1t¼1
Et
ð1þ COEÞt þX1t¼1
Etÿ1
ð1þ COEÞtÿ1 :
4.2.7 The last two sums cancel, except for the term E0. This impliesthat:
F0 ¼X1t¼1
ROEt ÿ COE
ð1þ COEÞt Etÿ1:
4.2.8 We have, therefore, expressed the franchise value as the presentvalue of profit, minus an additional term COE:Etÿ1. This term is the productof the cost of equity and the equity on the balance sheet. It reflects the profitmargin required to satisfy a valuation equal to the net assets.
4.2.9 The expression ½ROEt ÿ COE�Etÿ1 is sometimes called the economicvalue added, or (as that phrase has been trademarked by Stern Stewart andCo.), economic profit. The accounting equity represents original capitalsubscribed plus cumulative retained earnings, that is the historic shareholderinvestment. To the extent that franchise value is positive, it represents thegain to shareholders over and above their historic investment. Our identityhas, therefore, demonstrated that franchise value is the present value ofeconomic profit discounted at the cost of equity.
4.2.10 In Section 3 we repeatedly cautioned against biases which arisewhen a market value cost of equity is applied to an accounting equitynumber. Yet, here we have precisely that product appearing in a valuationidentity. The reader might conclude that it is correct, after all, to apply amarket return to accounting equity in order to establish economic profit.
4.2.11 On the other hand, we could argue that economic profit turns outto be precisely the accounting bias, that is the difference between theaccounting return ROE and market return COE. The fact that franchisevalue is the present value of accounting biases emphasises the importance ofaccounting biases. If we use COE na|« vely as a hurdle rate for ROE, we areunlikely to gain insight into franchise value.
The Cost of Capital for Financial Firms 27
4.2.12 The relationship between franchise value and economic valueadded does not depend on finding a theoretically pure or market consistentset of accounting procedures. Of course, a change in accounting practicewould affect reported equity, and so would alter both franchise value andfuture reported profit. However, the identity that:
Franchise value ¼ Present value of economic value added
holds, irrespective of the chosen accounting conventions. We cannot use thisidentify to justify one accounting framework against another, or to arguethat one definition of profit is more economic than another.
4.2.13 To take two extreme examples: suppose that we could find anaccounting standard where net assets were equal to equity marketcapitalisation. In that case, the observed return on equity is the market returnon the shares, which is a form of cost of capital. Furthermore, since themarket capitalisation and the balance sheet equity remain in step, we findthat the franchise value is zero. To take the other extreme, we could accounton a cash flow basis with all assets and liabilities valued at zero. In thatcase, the ‘economic profit’ is defined as the dividend payment, the net assetsare zero, and the franchise value is the present value of dividends.
4.3 Market Consistent Valuations4.3.1 Financial firms usually have assets or liabilities which also trade in
financial markets. Ensuring that these assets and liabilities are pricedconsistently with capital markets removes some of the subjectivity whichaccompanies dividend discount models. Other subjectivity remains,particularly in relation to expenses, margins and new business volumes.
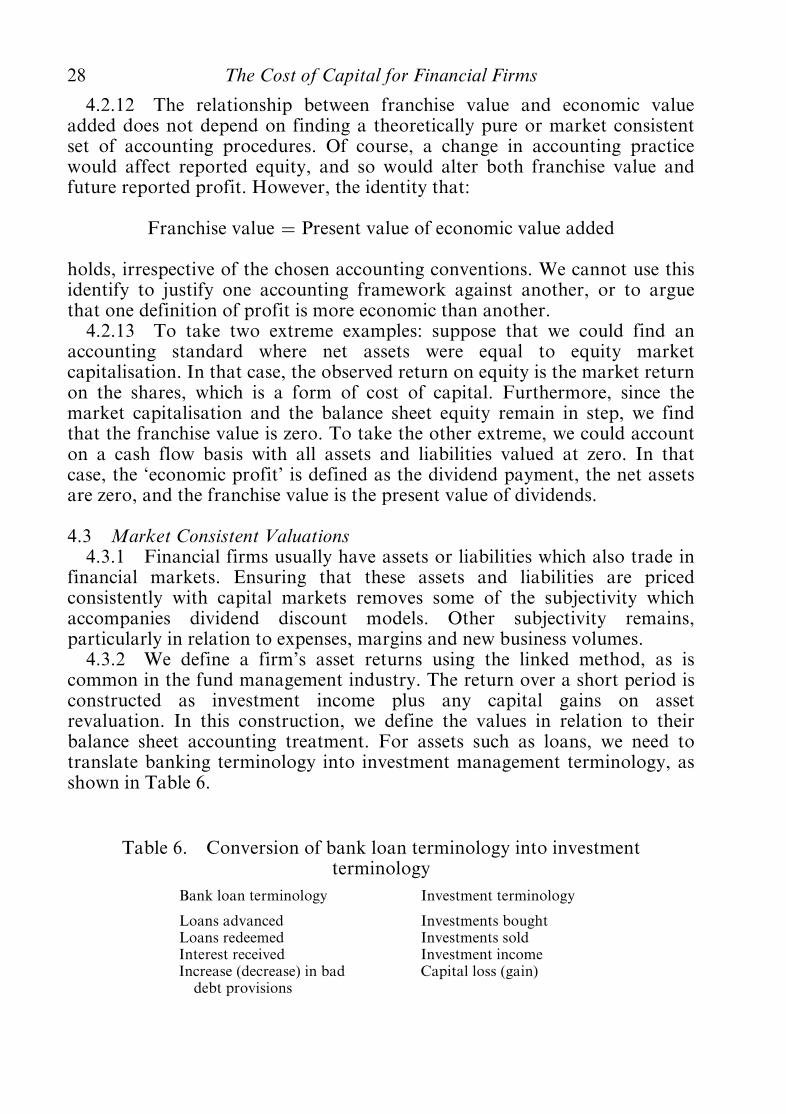
4.3.2 We define a firm’s asset returns using the linked method, as iscommon in the fund management industry. The return over a short period isconstructed as investment income plus any capital gains on assetrevaluation. In this construction, we define the values in relation to theirbalance sheet accounting treatment. For assets such as loans, we need totranslate banking terminology into investment management terminology, asshown in Table 6.
Table 6. Conversion of bank loan terminology into investmentterminology
Bank loan terminology Investment terminology
Loans advanced Investments boughtLoans redeemed Investments soldInterest received Investment incomeIncrease (decrease) in baddebt provisions
Capital loss (gain)
28 The Cost of Capital for Financial Firms
4.3.3 We define liability returns as the returns obtained over a period bya firm’s creditors ö that is depositors, policyholders and bondholders. Thisreflects the fact that a financial firm’s liabilities are someone else’s assets. Weconsider all creditors in aggregate. Our return calculation reflects openingand closing balance sheets, as well as intermediate cash flows. In thiscalculation, inward cash flows, such as funds deposited or insurancepremiums, are treated as investment purchases by the creditors. Conversely,outward cash flows, such as deposits redeemed or insurance claims paid, areconsidered to be the proceeds of investment sales.
4.3.4 Now let us suppose the following:ö the financial firm has no expenses and pays no tax;ö investors can also invest directly in the firm’s assets;ö investors can invest directly in the firm’s liabilities;ö the asset and liability valuations on the balance sheet are at market prices;ö external investors earn the same asset and liability returns as the firm;
andö the firm never goes bankrupt.
4.3.5 In this case, we could compare a financial firm to a gearedinvestment trust. The investment trust raises debt and equity in order toacquire assets. Most investment trusts trade at close to net asset value, orslightly below. Franchise value is negligible.
4.3.6 The absence of franchise value comes from an arbitrage argument.To replicate the firm’s assets, we can either buy those assets directly, or wecan acquire the firm and simultaneously buy the liabilities in the market.Therefore, the price which we pay for the firm must be the difference betweenits assets and liabilities.
4.3.7 All of this thought experiment is counterfactual. Financial firmsare not free of costs and taxes. Balance sheets are not always on a marketvalue basis. Bankruptcy can happen. Firms’ assets and liabilities are not alltraded on financial markets, although some of them are. Franchise valueexists. We now explore the implications of non-traded assets and liabilities.
4.4 Margins and how they Persist4.4.1 It is worth considering the reason why retail borrowers pay higher
interest rates than capital markets, and why investors in insurance policiesmay obtain lower returns than other investors in the market. The reasons forthese margins explain why financial intermediaries have a role in society,and why shareholders get compensated for financing these intermediaries.
4.4.2 A different way of asking this question is to consider why retailcustomers do not simply buy and sell their insurance policies, savings anddebt on a huge public exchange. The answer is that operating such anexchange would be costly; so costly, in fact, that less transparent bilateraltransactions with financial firms are economically more efficient. To
The Cost of Capital for Financial Firms 29
understand the role of financial firms, we need to explain why their coststructure is efficient compared with the public exchange alternative. Weinvestigate several reasons:ö customisation and transaction costs;ö fiscal reasons;ö market failures;ö regulated sales process;ö depositor protection;ö relationships and service; andö underwriting and information asymmetries.
4.4.3 Personal loans, deposits and insurance policies are customisedproducts which are special to one individual. Customers will pay to find aproduct which is suitable for them. Financial intermediaries offer anenvironment which makes that search easy, and allows deals to beconsolidated in smaller quantities than would be possible in capital markets.This explains, from the customer perspective, why companies may earnmargins from meeting customer needs.
4.4.4 Products delivered by financial intermediaries may be taxed orsubsidised differently from those delivered directly via capital markets. Forexample, in many countries benefits paid under insurance policies are taxexempt. Income tax may be rebated in relation to pension savings ormortgage interest. Smaller effects may include a financial firm’s abilitylonger to defer tax on capital gains, or to take advantage of tax managementeconomies of scale, which would be too costly for customers to implementon their own.
4.4.5 From the intermediaries’ perspective, it is worth considering whyretail profit margins do not get competed out of the market. One reasoncould be lack of competition. Perhaps, a few large players have sufficienteconomies of scale or control over distribution channels to exclude smallercompetitors. Price fixing cartels may be in operation.
4.4.6 Customers may pay margins in order to benefit from a regulatedenvironment. In many cases, financial intermediaries operate within aregulatory environment which seeks to find the most suitable product for theconsumer, with a wide variety available under one roof, and rights ofredress if, with hindsight, advice was inappropriate. Industry or governmentbacked funds often provide an additional layer of protection if the originalcontracting firm is unable to meet its obligations. In comparison, capitalmarkets usually force buyers to perform their own research, and stand or fallby their own decisions.
4.4.7 Although we measure accounting returns on asset value, theaccounting asset value does not capture all the resources which shareholdersmay have invested. Airlines also invest in their people and distributioncapabilities. A producer must market his products to potential customers. A
30 The Cost of Capital for Financial Firms
hotelier seeks to build a good reputation. All of these firms are spendingshareholder resources in order to gain some intangible benefits, even thoughthe accounting treatment immediately writes off the expenditure. Likewise,many financial service customers value their relationships with banks orinsurers. Competition is not purely on price. Retail financial services rely to adegree on trust; this trust may take many years to establish. Financialservices will invest in infrastructure, customer service and brand in order toretain profitable customers.4.4.8 The underwriting of loans and insurance policies involves the
processing of personal and confidential information. Privacy concernsprevent individual policies from trading in open markets. Part of the profitmargin which financial intermediaries achieve can be considered a fee for thesafe and responsible handling of personal data.
4.4.9 These are the economic factors which we can expect to explain thefranchise value which we see in financial markets.
4.5 Asset Swaps4.5.1 We have considered how financial firms are valued when their
assets and liabilities are traded. We now seek to construct a similar arbitrageargument for non-traded assets. To do this, we need to assume that outsideinvestors can access a firm’s assets, but only via a derivative contract, whichwe describe, for ease of explanation, as an asset swap. Strictly speaking, thecontract may be better described as a total return swap, but we adopt theterm ‘asset swap’ for convenience, when introducing the concept of a‘liability swap’ counterpart, below.
4.5.2 The return on assets is a vital lever of shareholder value for mostenterprises. An airline seeks to gain the maximum revenue from a limitednumber of airplanes. A producer seeks the maximum production from hisfarm or factory. A retailer maximises traffic through a supermarket. Anhotelier seeks to maximise occupancy. All of these businesses try to createwealth by working their assets as hard as possible.
4.5.3 The accounting return on assets is usually measured as income lessexpenditure, making an allowance also for depreciation on the assets. Theaccounting return does not try to incorporate past intangible investments initems such as staff training, marketing or distribution networks.
4.5.4 Therefore, even when capital markets are competitive, we wouldnot expect accounted returns on balance sheet assets to correspond directlyto returns available in competitive markets, unless some allowance is madefor investments in intangibles.
4.5.5 In the same way, mortgage lenders seek to maximise the return ontheir loan advances. For example, a mortgage lender may seek to lendmoney at some margin over base interest rates to prudent customers who willrepay in full.
4.5.6 In the case of mortgage lending, we do have some measure to
The Cost of Capital for Financial Firms 31
relate accounting returns to market returns. The comparison arises becausemany lenders now securitise their asset portfolios, and sell them on intocapital markets. Interestingly, the market value of a securitised mortgageportfolio is usually higher than the face value of the mortgages. For example,a lender may be able to lend »95m face value of loans, and re-sell them viasecuritisation for »100m.
4.5.7 An alternative route to compare market returns is to enter an assetswap. Under the terms of such a swap, the lender pays to a third party thereturn on a mortgage portfolio, in return for a series of floating payments,for example LIBOR þ 1%. The 1% is a market number which would bedetermined by the asset swap market at the time when the swap is entered. Insome sense, the 1% compensates the lender for past investments in intangibleassets, such as underwriting capability, which allow the lender to writemortgages profitably. The other swap party is then able to gain exposure tothe return on mortgage portfolios, paying an additional 1% to avoid theoverhead of building its own underwriting and distribution capability.
4.5.8 The present value of the 1% stream for a block of business roughlycorresponds to the 5% difference between loan face value and securitisedvalue. Conversely, if we re-invent the asset swap based on the securitisedvalue, the 1% spread above LIBOR disappears. After all, the point ofsecuritisation is to give investors direct access to mortgage returns. Wheninvestors have an option of direct investment in a securitisation, there is noreason to forgo 1% return to achieve the same exposure via an asset swap.We note that, in real markets, the swap based on market value is more likelyto trade than the swap based on face value. However, as the price of theone is easily transformed into the price of the other, we continue here toconsider the more exotic book value hedge, which will make our subsequentarbitrage arguments more transparent.
4.5.9 Asset returns for insurers are much more challenging, as themajority of insurers’ assets will be direct investments held at market value.Investment markets are highly competitive, and it is open to questionwhether insurers, generally, have any competitive advantage in selectingundervalued investments. In theory, one could imagine an asset swap wherean investor pays LIBOR in exchange for the return on an insurer’s assetportfolio. However, it is unlikely that the insurer would gain any spreadabove LIBOR, because the swap counterparty has the alternative of simplybuying the underlying assets.
4.5.10 This introduces an important difference between insurers andother firms. Most firms would expect to gain a positive spread to LIBOR ifthey swapped their asset return in the market, while insurers would notexpect to see such a spread. This conclusion changes if assets are notaccounted at market value ö for example, if assets are held at historic cost,which happens to be below current market values, then an asset swap for theaccounting returns could well deliver a spread above LIBOR.
32 The Cost of Capital for Financial Firms
4.5.11 There are several more subtle effects which affect asset swapmargins. There may be small margins for traded assets, where there aredifferences in tax or liquidity. An example would be gilts going special onrepurchase, when there is a squeeze on a particular stock.
4.5.12 The margin is positive if the firm enhances returns by particularskills which are not generally available. Examples would include loanunderwriting and active investment management. Equally, it is possible to beless than averagely skilful, in which case the market determines a negativeswap spread. A negative swap spread could also occur if the underlying assetswere priced to produce profit margins for third parties.
4.5.13 The asset swap margin is unaffected by market risk premiums. Ifan asset earns a long-term risk premium relative to LIBOR, then the assetswap markets do not reflect that risk premium in the form of a spread aboveLIBOR. Instead, the risk premium is reflected in a positive expectation ofswap payments, for the party paying LIBOR, and receiving the asset return.For this reason, risk premium estimates do not feature in valuations based onthe arbitrage construction.
4.6 Liability Swaps4.6.1 We have considered a derivative which exchanges asset returns for
LIBOR plus or minus a spread. In the same way, we could considerderivatives based on liability returns. The derivatives which we have in mindexchange a liability return for LIBOR minus a spread. We use thisconvention ö that the spread is measured below LIBOR ö to be consistentwith our asset swap convention that a positive spread means positive valuefor the financial firm’s shareholders.
4.6.2 These derivatives also exist for some liabilities, although in a verylimited form. Most of the examples in issue relate to catastrophe bonds, thatis bonds whose coupons are forfeit in the event, either of a market loss of acertain size or the loss to a particular insurer. See Ahmed et al. (1997) forsome descriptions of how they work. Scotti (2005) provides a chart of historicspreads to LIBOR on the few actively traded insurance linked securities,which mostly relate to non-life insurance. See Blake et al. (2006) for adiscussion of similar products in relation to mortality risk.
4.6.3 Some liabilities are traded in the market, most obviously corporatedebt in issue. In that case, we would expect the liability spread to be zero, orclose to zero, enforced by arbitrage. Tax and liquidity may be possiblereasons for deviations from zero.
4.6.4 If liabilities are valued on a market consistent basis, and there isno new business, then the liability swap margin should still be zero. Where afirm is open to new business, the liability swap margin approximates to thevalue of one year’s new business, divided by total liabilities.
4.6.5 Where customers are granted below market returns, the liabilityswap margin reflects the discount to market returns which is passed on to
The Cost of Capital for Financial Firms 33
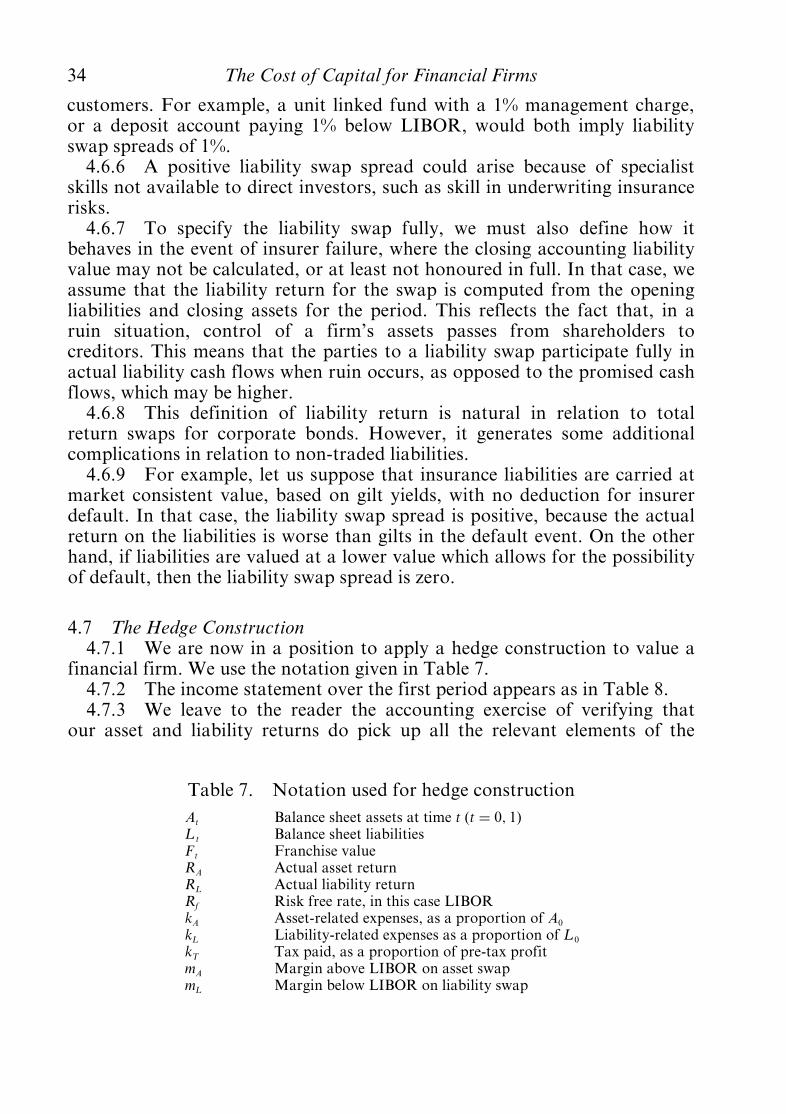
customers. For example, a unit linked fund with a 1% management charge,or a deposit account paying 1% below LIBOR, would both imply liabilityswap spreads of 1%.
4.6.6 A positive liability swap spread could arise because of specialistskills not available to direct investors, such as skill in underwriting insurancerisks.
4.6.7 To specify the liability swap fully, we must also define how itbehaves in the event of insurer failure, where the closing accounting liabilityvalue may not be calculated, or at least not honoured in full. In that case, weassume that the liability return for the swap is computed from the openingliabilities and closing assets for the period. This reflects the fact that, in aruin situation, control of a firm’s assets passes from shareholders tocreditors. This means that the parties to a liability swap participate fully inactual liability cash flows when ruin occurs, as opposed to the promised cashflows, which may be higher.
4.6.8 This definition of liability return is natural in relation to totalreturn swaps for corporate bonds. However, it generates some additionalcomplications in relation to non-traded liabilities.
4.6.9 For example, let us suppose that insurance liabilities are carried atmarket consistent value, based on gilt yields, with no deduction for insurerdefault. In that case, the liability swap spread is positive, because the actualreturn on the liabilities is worse than gilts in the default event. On the otherhand, if liabilities are valued at a lower value which allows for the possibilityof default, then the liability swap spread is zero.
4.7 The Hedge Construction4.7.1 We are now in a position to apply a hedge construction to value a
financial firm. We use the notation given in Table 7.4.7.2 The income statement over the first period appears as in Table 8.4.7.3 We leave to the reader the accounting exercise of verifying that
our asset and liability returns do pick up all the relevant elements of the
Table 7. Notation used for hedge constructionAt Balance sheet assets at time t (t ¼ 0; 1)L t Balance sheet liabilitiesFt Franchise valueRA Actual asset returnRL Actual liability returnRf Risk free rate, in this case LIBORkA Asset-related expenses, as a proportion of A0
kL Liability-related expenses as a proportion of L 0
kT Tax paid, as a proportion of pre-tax profitmA Margin above LIBOR on asset swapmL Margin below LIBOR on liability swap
34 The Cost of Capital for Financial Firms
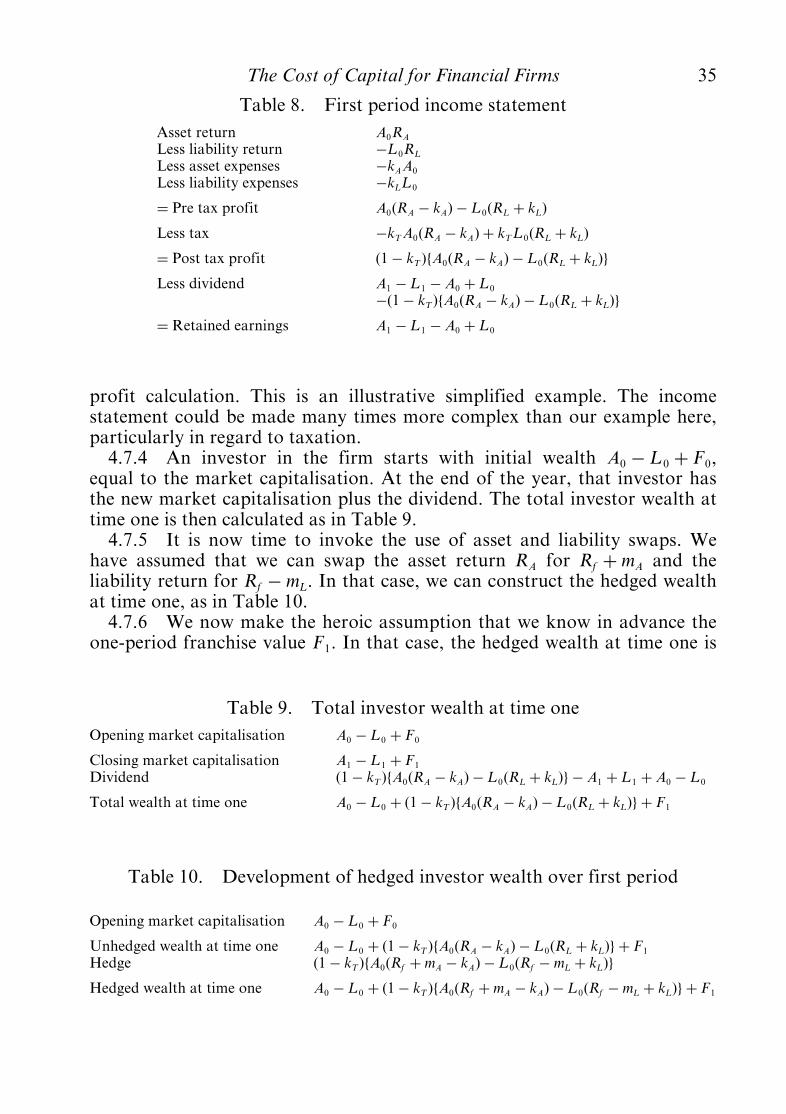
profit calculation. This is an illustrative simplified example. The incomestatement could be made many times more complex than our example here,particularly in regard to taxation.
4.7.4 An investor in the firm starts with initial wealth A0 ÿ L 0 þ F0,equal to the market capitalisation. At the end of the year, that investor hasthe new market capitalisation plus the dividend. The total investor wealth attime one is then calculated as in Table 9.
4.7.5 It is now time to invoke the use of asset and liability swaps. Wehave assumed that we can swap the asset return RA for Rf þ mA and theliability return for Rf ÿ mL . In that case, we can construct the hedged wealthat time one, as in Table 10.
4.7.6 We now make the heroic assumption that we know in advance theone-period franchise value F1. In that case, the hedged wealth at time one is
Table 8. First period income statementAsset return A0RA
Less liability return ÿL 0RL
Less asset expenses ÿkAA0
Less liability expenses ÿkL L 0
¼ Pre tax profit A0ðRA ÿ kAÞ ÿ L 0ðRL þ kL Þ
Less tax ÿkT A0ðRA ÿ kAÞ þ kT L 0ðRL þ kL Þ
¼ Post tax profit ð1ÿ kT ÞfA0ðRA ÿ kAÞ ÿ L 0ðRL þ kL Þg
Less dividend A1 ÿ L 1 ÿ A0 þ L 0
ÿð1ÿ kT ÞfA0ðRA ÿ kAÞ ÿ L 0ðRL þ kL Þg
¼ Retained earnings A1 ÿ L 1 ÿ A0 þ L 0
Table 9. Total investor wealth at time oneOpening market capitalisation A0 ÿ L 0 þ F0
Closing market capitalisation A1 ÿ L 1 þ F1
Dividend ð1ÿ kT ÞfA0ðRA ÿ kAÞ ÿ L 0ðRL þ kL Þg ÿ A1 þ L 1 þ A0 ÿ L 0
Total wealth at time one A0 ÿ L 0 þ ð1ÿ kT ÞfA0ðRA ÿ kAÞ ÿ L 0ðRL þ kL Þg þ F1
Table 10. Development of hedged investor wealth over first period
Opening market capitalisation A0 ÿ L 0 þ F0
Unhedged wealth at time one A0 ÿ L 0 þ ð1ÿ kT ÞfA0ðRA ÿ kAÞ ÿ L 0ðRL þ kL Þg þ F1
Hedge ð1ÿ kT ÞfA0ðRf þ mA ÿ kAÞ ÿ L 0ðRf ÿ mL þ kL Þg
Hedged wealth at time one A0 ÿ L 0 þ ð1ÿ kT ÞfA0ðRf þ mA ÿ kAÞ ÿ L 0ðRf ÿ mL þ kL Þg þ F1
The Cost of Capital for Financial Firms 35
deterministic, and we have created a risk free asset. To prevent arbitrage, itmust earn the risk free rate. We equate the initial value rolled up at the riskfree rate to the final value:
ð1þ Rf ÞfA0 ÿ L 0 þ F0g ¼A0 ÿ L 0 þ ð1ÿ kT ÞfA0ðRf þ mA ÿ kAÞ
ÿ L 0ðRf ÿ mL þ kL Þg þ F1:
4.7.7 We can re-arrange this to give an inductive expression for thefranchise value:
ð1þ Rf ÞF0 ¼ ð1ÿ kT ÞfA0ðmA ÿ kAÞ þ L 0ðmL ÿ kL Þg ÿ kT Rf ðA0 ÿ L 0Þ þ F1:
4.7.8 We can interpret the right hand side as follows. The first twoterms are the post-tax margins on assets and liabilities, after deduction ofexpenses. The penultimate term is a frictional cost of holding capital. In thiscase, the effect is double taxation, since, even if capital is invested in cash atthe risk free rate, the interest received is subject to corporate tax.4.7.9 We can apply this result inductively. For example, if we assume
that the firm lasts 1,000 years, then the franchise value is zero after 1,000 years.We can then use the relation in annual steps to deduce F999 and so on, until,finally, we have an estimate of the warranted franchise value F0 at time zero.4.7.10 These ideas are well known in the finance literature. The allowance
for tax in the general case derives from Modigliani & Miller (1963), whichforms the basis for the WACC methodology. Myers & Cohn (1987) providedformulae equivalent to those above in the special case of non-life insurance.
4.7.11 We can relax the assumption that F1 is known in advance. Forexample, it suffices to know the forward value of time one franchise.Alternatively, we might think that we know the mean value, combined withan appropriate risky discount rate. Although future growth rates areuncertain, the growth rate is often a balancing item in setting the modelledcapitalisation to its market value. This gives a market implied growth ratewhich, despite fluctuations over time, is still more robustly defined than itmight, at first, appear.
4.8 The Mechanics of Failure4.8.1 We now consider a final enhancement to our model ö an allowance
for possible financial failure. One possible model of bankruptcy events isillustrated in Figure 10.
4.8.2 In default, a number of events are assumed to take place:ö net assets become negative (this is the usual trigger for default);ö control of the firm’s assets passes from shareholders to creditors;ö shareholders also lose any franchise value which may have built up; andö a tax loss occurs, resulting in an irrecoverable tax credit.
36 The Cost of Capital for Financial Firms
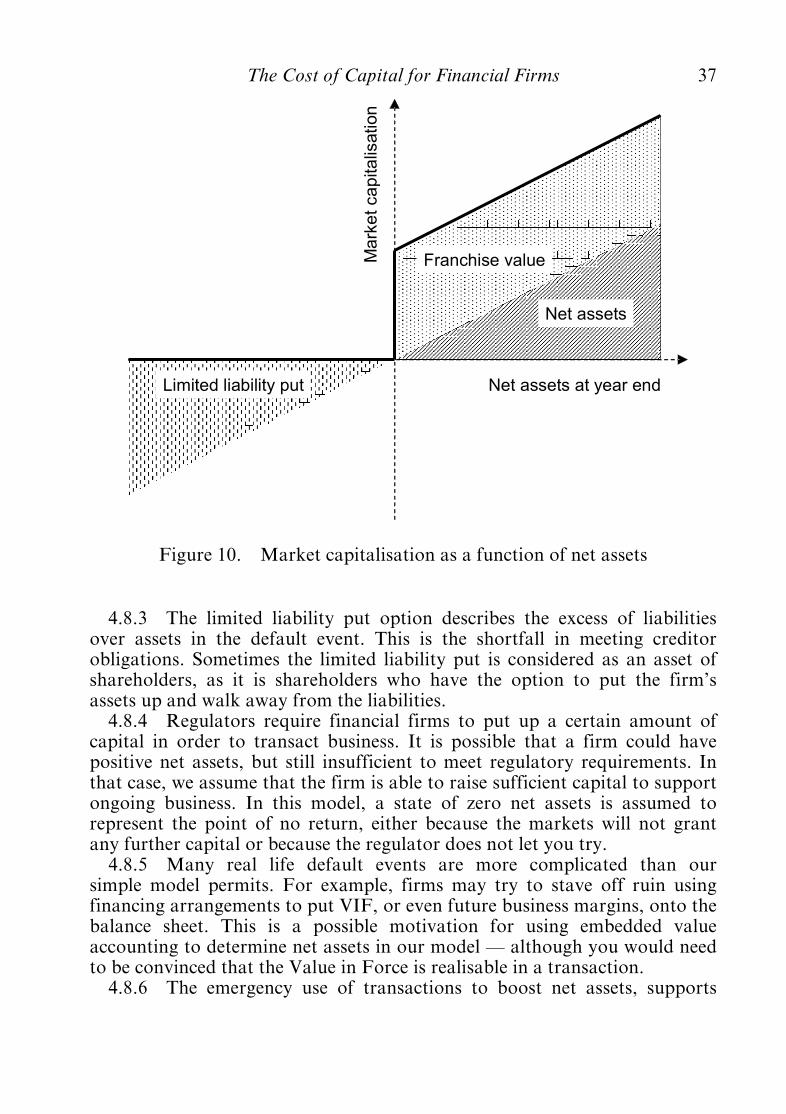
4.8.3 The limited liability put option describes the excess of liabilitiesover assets in the default event. This is the shortfall in meeting creditorobligations. Sometimes the limited liability put is considered as an asset ofshareholders, as it is shareholders who have the option to put the firm’sassets up and walk away from the liabilities.
4.8.4 Regulators require financial firms to put up a certain amount ofcapital in order to transact business. It is possible that a firm could havepositive net assets, but still insufficient to meet regulatory requirements. Inthat case, we assume that the firm is able to raise sufficient capital to supportongoing business. In this model, a state of zero net assets is assumed torepresent the point of no return, either because the markets will not grantany further capital or because the regulator does not let you try.
4.8.5 Many real life default events are more complicated than oursimple model permits. For example, firms may try to stave off ruin usingfinancing arrangements to put VIF, or even future business margins, onto thebalance sheet. This is a possible motivation for using embedded valueaccounting to determine net assets in our model ö although you would needto be convinced that the Value in Force is realisable in a transaction.
4.8.6 The emergency use of transactions to boost net assets, supports
Net assets at year endM
ark
et
ca
pita
lisation
Franchise value
Net assets
Limited liability put
Figure 10. Market capitalisation as a function of net assets
The Cost of Capital for Financial Firms 37
analysts’ arguments for restating financial firms’ accounts in marketconsistent terms. However, a firm’s deathbed conversion to marketconsistency may be partial in effect, with the greatest zeal being applied toareas where assets would increase or liabilities decrease.
4.8.7 More complex capital structures may provide for several tiers ofcapital, capable of defaulting separately. There may also be multipleaccounting bases in use, for separate determination of solvency, tax orGAAP reporting. Segregated funds bring complications of their own; forexample, a proprietary with-profits life office can fail because of inadequatetotal assets, but it could also fail if shareholder equity is exhausted, evenwhen the life fund itself has a healthy surplus. See, for example, Doherty(1997), Froot & Stein (1998), Hancock et al. (2001), Merton & Perold (1999)for more details in these areas.
4.9 Revised Hedge Valuation4.9.1 To complete our hedge construction, we need to introduce a final
derivative which will enable us to price the risk of failure. We choose a creditdefault swap (CDS).
4.9.2 A CDS usually offers an option to sell a corporate bond issued bya specified entity at its par value, usually including accrued interest. Theoption to sell the bond only comes into effect if a specified default eventoccurs ö and, in that case, the option is almost always in the money. Theoption premium is expressed as an annual rate calculated on the bond parvalue. The annual premiums continue until the entity defaults or the swapmatures, whichever is the earlier.
4.9.3 If the corporate bond becomes worthless on default, then thecredit default swap is worth the full par value. More usually, a bond falls invalue, but does not become totally worthless. The bond market value,expressed as a proportion of par, is known as the recovery rate. The value ofa CDS on default is then the par value multiplied by (one minus therecovery rate). There is an arbitrage relationship which keeps CDS premiumsclose to the yield premium on a corporate bond, expressed relative to riskfree rates.4.9.4 To construct our hedging argument, we need the price of a more
exotic derivative ö the zero recovery CDS. A zero recovery CDS pays afixed amount if the default event occurs, and zero otherwise. Although wecannot observe prices of zero recovery CDSs exactly, we can estimatetheoretical prices from the premiums on conventional CDSs, grossing up foran assumed recovery rate. We denote the zero recovery swap rate by s.4.9.5 The CDS premium is not a good forecast of actual default
frequencies. Default expectations are difficult to estimate, chiefly because ofuncertainty regarding the frequency of the rare liquidity crises causing anavalanche of defaults. Current default spreads are higher than recent defaultfrequencies in many economies. There is no contradiction here; lenders can
38 The Cost of Capital for Financial Firms
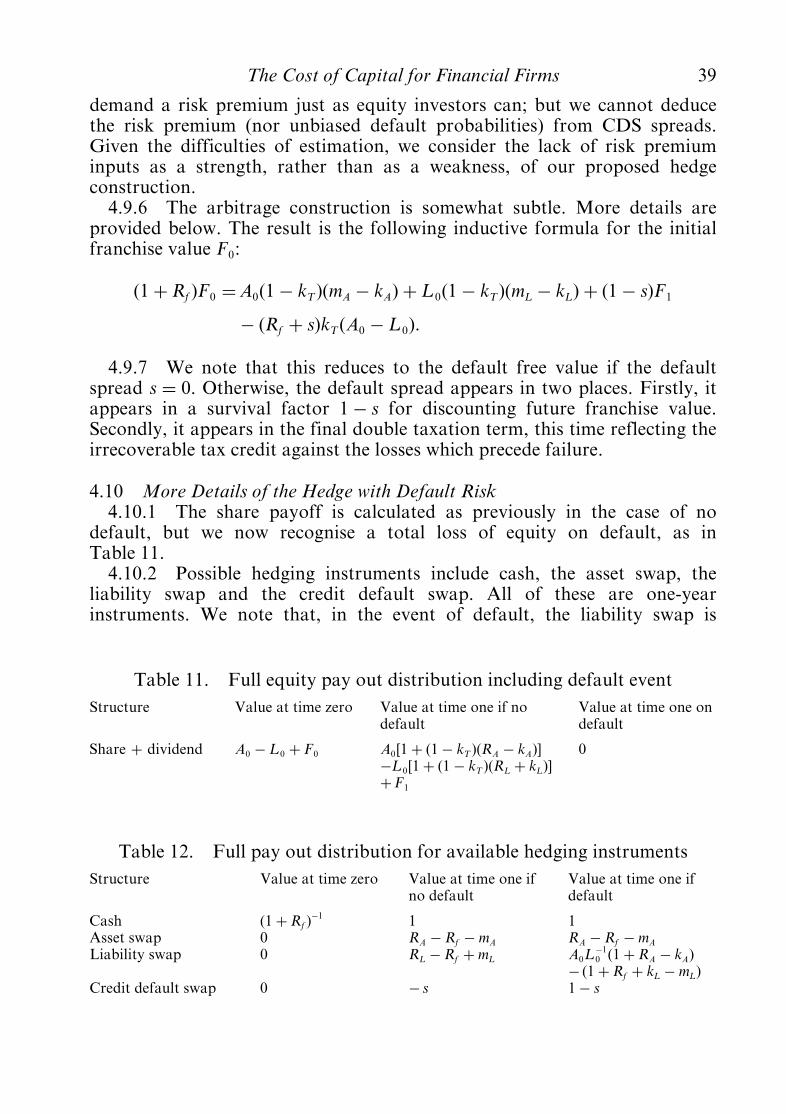
demand a risk premium just as equity investors can; but we cannot deducethe risk premium (nor unbiased default probabilities) from CDS spreads.Given the difficulties of estimation, we consider the lack of risk premiuminputs as a strength, rather than as a weakness, of our proposed hedgeconstruction.
4.9.6 The arbitrage construction is somewhat subtle. More details areprovided below. The result is the following inductive formula for the initialfranchise value F0:
ð1þ Rf ÞF0 ¼A0ð1ÿ kT ÞðmA ÿ kAÞ þ L 0ð1ÿ kT ÞðmL ÿ kL Þ þ ð1ÿ sÞF1
ÿ ðRf þ sÞkT ðA0 ÿ L 0Þ:
4.9.7 We note that this reduces to the default free value if the defaultspread s ¼ 0. Otherwise, the default spread appears in two places. Firstly, itappears in a survival factor 1ÿ s for discounting future franchise value.Secondly, it appears in the final double taxation term, this time reflecting theirrecoverable tax credit against the losses which precede failure.
4.10 More Details of the Hedge with Default Risk4.10.1 The share payoff is calculated as previously in the case of no
default, but we now recognise a total loss of equity on default, as inTable 11.
4.10.2 Possible hedging instruments include cash, the asset swap, theliability swap and the credit default swap. All of these are one-yearinstruments. We note that, in the event of default, the liability swap is
Table 11. Full equity pay out distribution including default eventStructure Value at time zero Value at time one if no
defaultValue at time one ondefault
Share þ dividend A0 ÿ L 0 þ F0 A0½1þ ð1ÿ kT ÞðRA ÿ kAÞ�
ÿL 0½1þ ð1ÿ kT ÞðRL þ kL Þ�
þF1
0
Table 12. Full pay out distribution for available hedging instrumentsStructure Value at time zero Value at time one if
no defaultValue at time one ifdefault
Cash ð1þ Rf Þÿ1 1 1
Asset swap 0 RA ÿ Rf ÿ mA RA ÿ Rf ÿ mA
Liability swap 0 RL ÿ Rf þ mL A0Lÿ10 ð1þ RA ÿ kAÞ
ÿ ð1þ Rf þ kL ÿ mL Þ
Credit default swap 0 ÿ s 1ÿ s
The Cost of Capital for Financial Firms 39
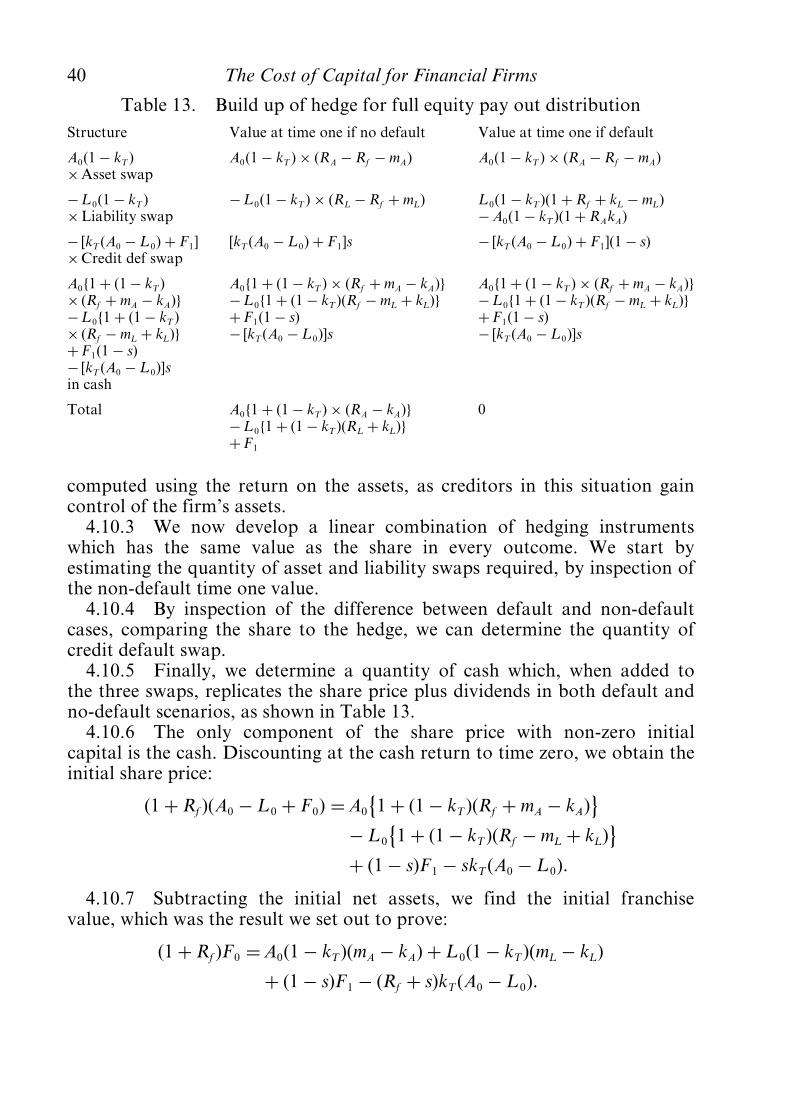
computed using the return on the assets, as creditors in this situation gaincontrol of the firm’s assets.
4.10.3 We now develop a linear combination of hedging instrumentswhich has the same value as the share in every outcome. We start byestimating the quantity of asset and liability swaps required, by inspection ofthe non-default time one value.
4.10.4 By inspection of the difference between default and non-defaultcases, comparing the share to the hedge, we can determine the quantity ofcredit default swap.
4.10.5 Finally, we determine a quantity of cash which, when added tothe three swaps, replicates the share price plus dividends in both default andno-default scenarios, as shown in Table 13.
4.10.6 The only component of the share price with non-zero initialcapital is the cash. Discounting at the cash return to time zero, we obtain theinitial share price:
ð1þ Rf ÞðA0 ÿ L 0 þ F0Þ ¼A0 1þ ð1ÿ kT ÞðRf þ mA ÿ kAÞ� ÿ L 0 1þ ð1ÿ kT ÞðRf ÿ mL þ kL Þ
� þ ð1ÿ sÞF1 ÿ skT ðA0 ÿ L 0Þ:
4.10.7 Subtracting the initial net assets, we find the initial franchisevalue, which was the result we set out to prove:
ð1þ Rf ÞF0 ¼A0ð1ÿ kT ÞðmA ÿ kAÞ þ L 0ð1ÿ kT ÞðmL ÿ kL Þ
þ ð1ÿ sÞF1 ÿ ðRf þ sÞkT ðA0 ÿ L 0Þ:
Table 13. Build up of hedge for full equity pay out distributionStructure Value at time one if no default Value at time one if default
A0ð1ÿ kT Þ
�Asset swapA0ð1ÿ kT Þ � ðRA ÿ Rf ÿ mAÞ A0ð1ÿ kT Þ � ðRA ÿ Rf ÿ mAÞ
ÿ L 0ð1ÿ kT Þ
�Liability swapÿ L 0ð1ÿ kT Þ � ðRL ÿ Rf þ mL Þ L 0ð1ÿ kT Þð1þ Rf þ kL ÿ mL Þ
ÿA0ð1ÿ kT Þð1þ RAkAÞ
ÿ ½kT ðA0 ÿ L 0Þ þ F1�
�Credit def swap½kT ðA0 ÿ L 0Þ þ F1�s ÿ ½kT ðA0 ÿ L 0Þ þ F1�ð1ÿ sÞ
A0f1þ ð1ÿ kT Þ
� ðRf þ mA ÿ kAÞg
ÿ L 0f1þ ð1ÿ kT Þ
� ðRf ÿ mL þ kL Þg
þF1ð1ÿ sÞÿ ½kT ðA0 ÿ L 0Þ�sin cash
A0f1þ ð1ÿ kT Þ � ðRf þ mA ÿ kAÞg
ÿ L 0f1þ ð1ÿ kT ÞðRf ÿ mL þ kL Þg
þF1ð1ÿ sÞÿ ½kT ðA0 ÿ L 0Þ�s
A0f1þ ð1ÿ kT Þ � ðRf þ mA ÿ kAÞg
ÿ L 0f1þ ð1ÿ kT ÞðRf ÿ mL þ kL Þg
þF1ð1ÿ sÞÿ ½kT ðA0 ÿ L 0Þ�s
Total A0f1þ ð1ÿ kT Þ � ðRA ÿ kAÞg
ÿ L 0f1þ ð1ÿ kT ÞðRL þ kL Þg
þF1
0
40 The Cost of Capital for Financial Firms
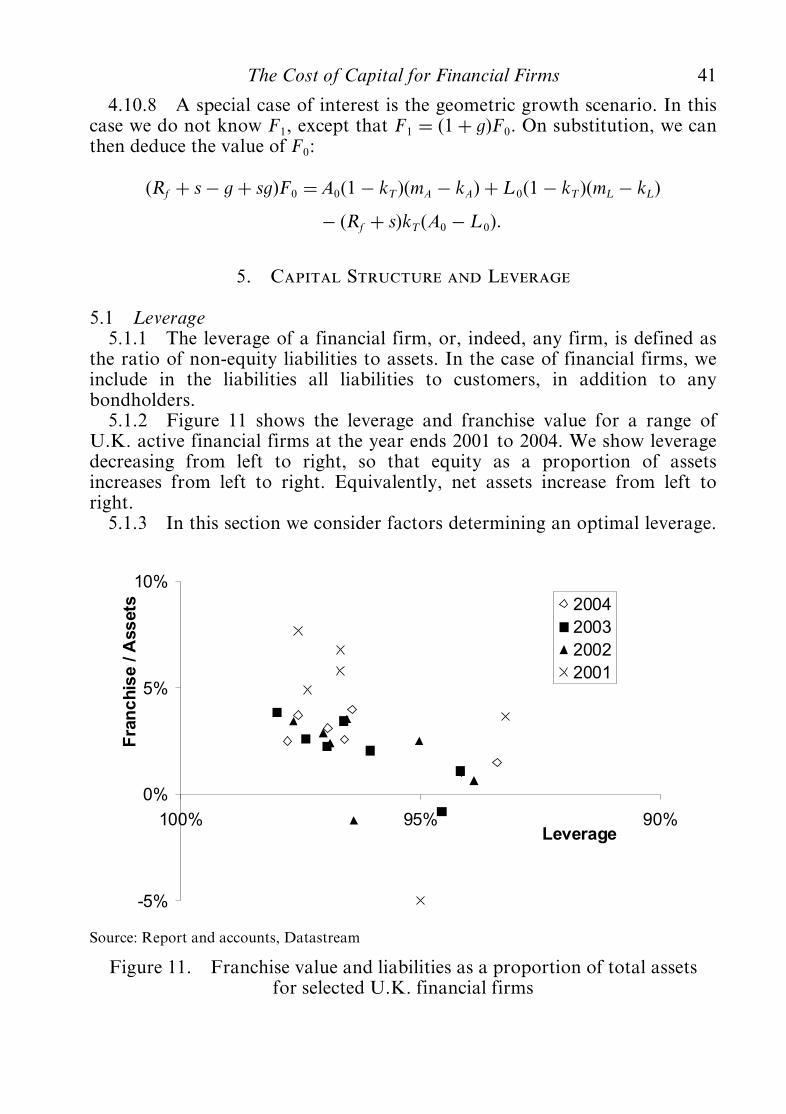
4.10.8 A special case of interest is the geometric growth scenario. In thiscase we do not know F1, except that F1 ¼ ð1þ gÞF0. On substitution, we canthen deduce the value of F0:
ðRf þ sÿ gþ sgÞF0 ¼A0ð1ÿ kT ÞðmA ÿ kAÞ þ L 0ð1ÿ kT ÞðmL ÿ kL Þ
ÿ ðRf þ sÞkT ðA0 ÿ L 0Þ:
ä. Capital Structure and Leverage
5.1 Leverage5.1.1 The leverage of a financial firm, or, indeed, any firm, is defined as
the ratio of non-equity liabilities to assets. In the case of financial firms, weinclude in the liabilities all liabilities to customers, in addition to anybondholders.
5.1.2 Figure 11 shows the leverage and franchise value for a range ofU.K. active financial firms at the year ends 2001 to 2004. We show leveragedecreasing from left to right, so that equity as a proportion of assetsincreases from left to right. Equivalently, net assets increase from left toright.
5.1.3 In this section we consider factors determining an optimal leverage.
-5%
0%
5%
10%
90%95%100%Leverage
Fra
nc
his
e/A
ss
ets 2004
2003
2002
2001
Source: Report and accounts, Datastream
Figure 11. Franchise value and liabilities as a proportion of total assetsfor selected U.K. financial firms
The Cost of Capital for Financial Firms 41
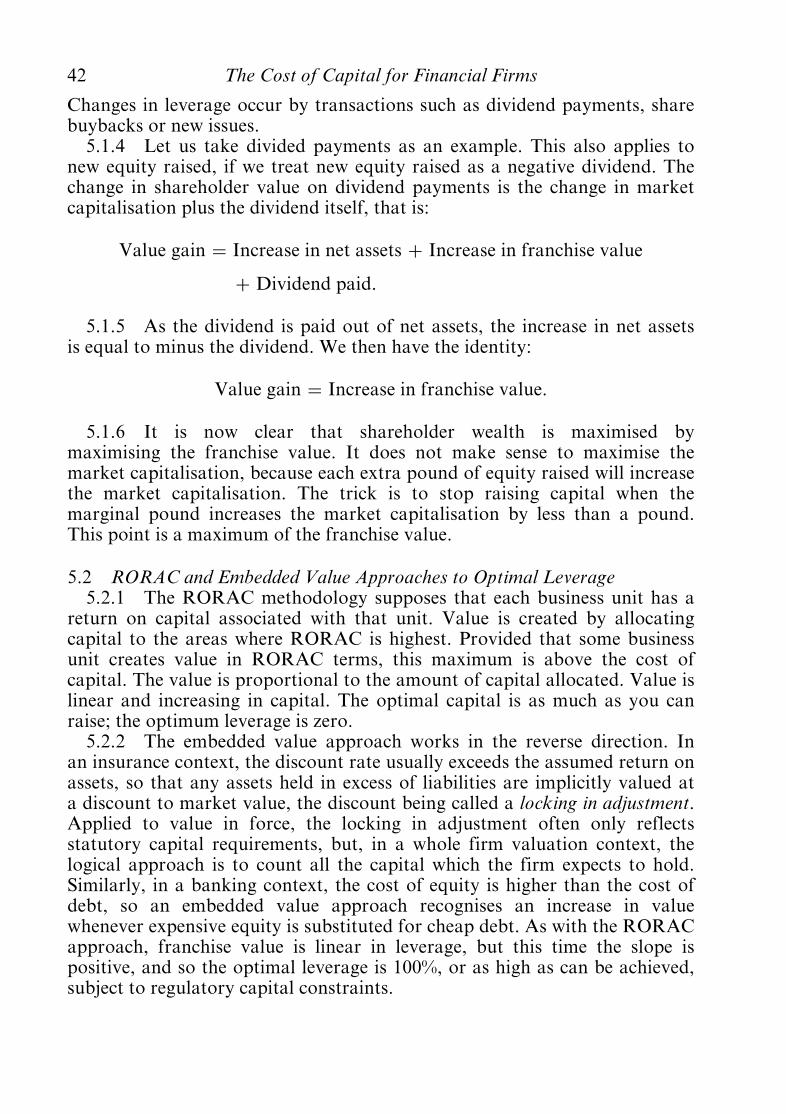
Changes in leverage occur by transactions such as dividend payments, sharebuybacks or new issues.
5.1.4 Let us take divided payments as an example. This also applies tonew equity raised, if we treat new equity raised as a negative dividend. Thechange in shareholder value on dividend payments is the change in marketcapitalisation plus the dividend itself, that is:
Value gain ¼ Increase in net assets þ Increase in franchise value
þ Dividend paid.
5.1.5 As the dividend is paid out of net assets, the increase in net assetsis equal to minus the dividend. We then have the identity:
Value gain ¼ Increase in franchise value.
5.1.6 It is now clear that shareholder wealth is maximised bymaximising the franchise value. It does not make sense to maximise themarket capitalisation, because each extra pound of equity raised will increasethe market capitalisation. The trick is to stop raising capital when themarginal pound increases the market capitalisation by less than a pound.This point is a maximum of the franchise value.
5.2 RORAC and Embedded Value Approaches to Optimal Leverage5.2.1 The RORAC methodology supposes that each business unit has a
return on capital associated with that unit. Value is created by allocatingcapital to the areas where RORAC is highest. Provided that some businessunit creates value in RORAC terms, this maximum is above the cost ofcapital. The value is proportional to the amount of capital allocated. Value islinear and increasing in capital. The optimal capital is as much as you canraise; the optimum leverage is zero.
5.2.2 The embedded value approach works in the reverse direction. Inan insurance context, the discount rate usually exceeds the assumed return onassets, so that any assets held in excess of liabilities are implicitly valued ata discount to market value, the discount being called a locking in adjustment.Applied to value in force, the locking in adjustment often only reflectsstatutory capital requirements, but, in a whole firm valuation context, thelogical approach is to count all the capital which the firm expects to hold.Similarly, in a banking context, the cost of equity is higher than the cost ofdebt, so an embedded value approach recognises an increase in valuewhenever expensive equity is substituted for cheap debt. As with the RORACapproach, franchise value is linear in leverage, but this time the slope ispositive, and so the optimal leverage is 100%, or as high as can be achieved,subject to regulatory capital constraints.
42 The Cost of Capital for Financial Firms
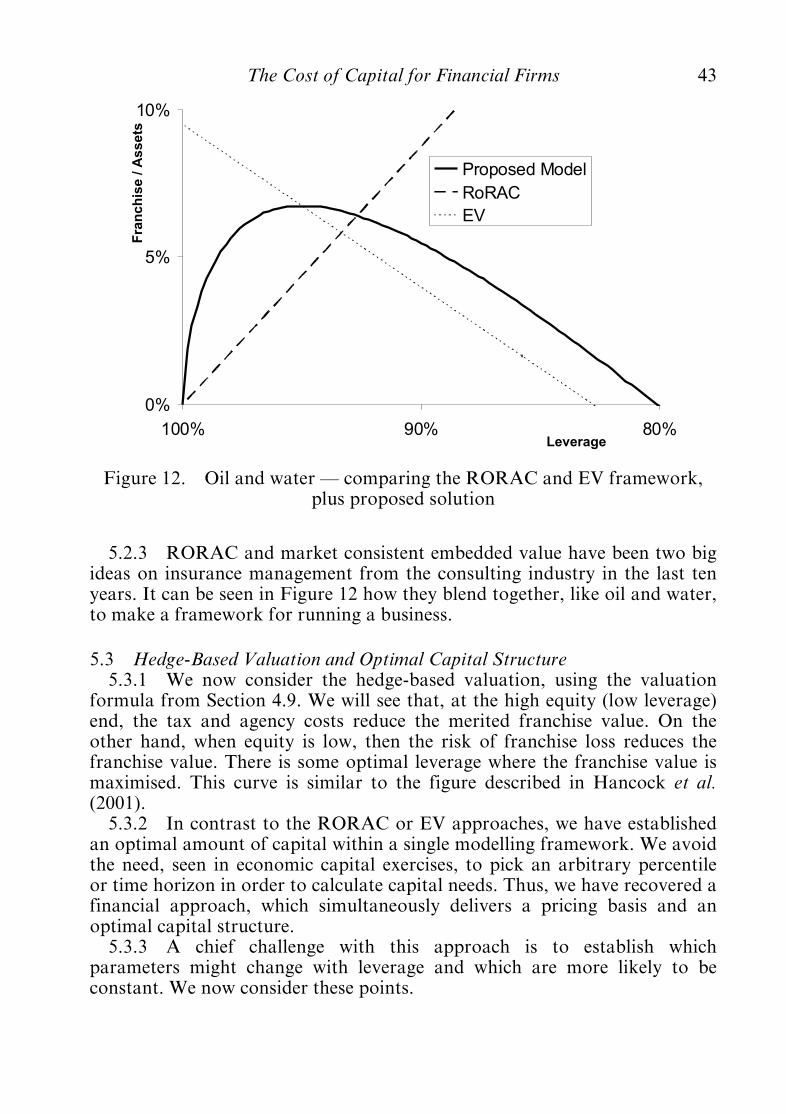
5.2.3 RORAC and market consistent embedded value have been two bigideas on insurance management from the consulting industry in the last tenyears. It can be seen in Figure 12 how they blend together, like oil and water,to make a framework for running a business.
5.3 Hedge-Based Valuation and Optimal Capital Structure5.3.1 We now consider the hedge-based valuation, using the valuation
formula from Section 4.9. We will see that, at the high equity (low leverage)end, the tax and agency costs reduce the merited franchise value. On theother hand, when equity is low, then the risk of franchise loss reduces thefranchise value. There is some optimal leverage where the franchise value ismaximised. This curve is similar to the figure described in Hancock et al.(2001).
5.3.2 In contrast to the RORAC or EV approaches, we have establishedan optimal amount of capital within a single modelling framework. We avoidthe need, seen in economic capital exercises, to pick an arbitrary percentileor time horizon in order to calculate capital needs. Thus, we have recovered afinancial approach, which simultaneously delivers a pricing basis and anoptimal capital structure.5.3.3 A chief challenge with this approach is to establish which
parameters might change with leverage and which are more likely to beconstant. We now consider these points.
0%
5%
10%
80%90%100%Leverage
Fra
nch
ise
/A
ssets
Proposed Model
RoRAC
EV
Figure 12. Oil and water ö comparing the RORAC and EV framework,plus proposed solution
The Cost of Capital for Financial Firms 43
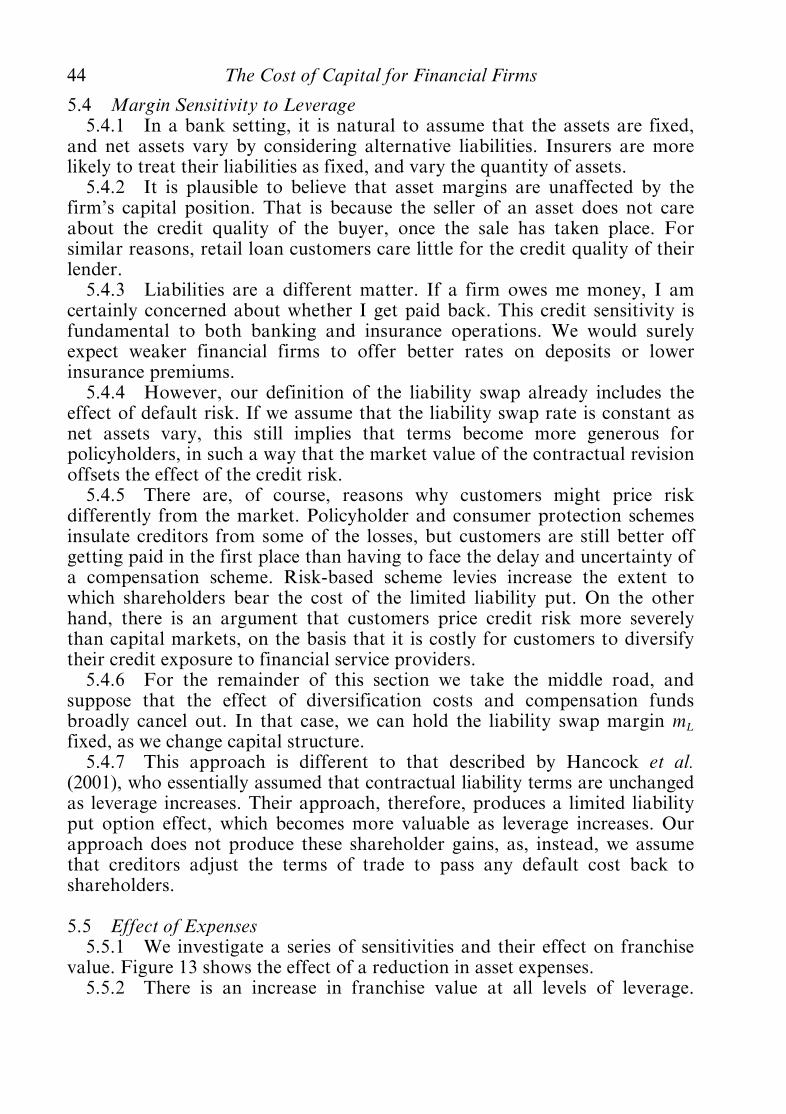
5.4 Margin Sensitivity to Leverage5.4.1 In a bank setting, it is natural to assume that the assets are fixed,
and net assets vary by considering alternative liabilities. Insurers are morelikely to treat their liabilities as fixed, and vary the quantity of assets.
5.4.2 It is plausible to believe that asset margins are unaffected by thefirm’s capital position. That is because the seller of an asset does not careabout the credit quality of the buyer, once the sale has taken place. Forsimilar reasons, retail loan customers care little for the credit quality of theirlender.
5.4.3 Liabilities are a different matter. If a firm owes me money, I amcertainly concerned about whether I get paid back. This credit sensitivity isfundamental to both banking and insurance operations. We would surelyexpect weaker financial firms to offer better rates on deposits or lowerinsurance premiums.
5.4.4 However, our definition of the liability swap already includes theeffect of default risk. If we assume that the liability swap rate is constant asnet assets vary, this still implies that terms become more generous forpolicyholders, in such a way that the market value of the contractual revisionoffsets the effect of the credit risk.5.4.5 There are, of course, reasons why customers might price risk
differently from the market. Policyholder and consumer protection schemesinsulate creditors from some of the losses, but customers are still better offgetting paid in the first place than having to face the delay and uncertainty ofa compensation scheme. Risk-based scheme levies increase the extent towhich shareholders bear the cost of the limited liability put. On the otherhand, there is an argument that customers price credit risk more severelythan capital markets, on the basis that it is costly for customers to diversifytheir credit exposure to financial service providers.
5.4.6 For the remainder of this section we take the middle road, andsuppose that the effect of diversification costs and compensation fundsbroadly cancel out. In that case, we can hold the liability swap margin mL
fixed, as we change capital structure.5.4.7 This approach is different to that described by Hancock et al.
(2001), who essentially assumed that contractual liability terms are unchangedas leverage increases. Their approach, therefore, produces a limited liabilityput option effect, which becomes more valuable as leverage increases. Ourapproach does not produce these shareholder gains, as, instead, we assumethat creditors adjust the terms of trade to pass any default cost back toshareholders.
5.5 Effect of Expenses5.5.1 We investigate a series of sensitivities and their effect on franchise
value. Figure 13 shows the effect of a reduction in asset expenses.5.5.2 There is an increase in franchise value at all levels of leverage.
44 The Cost of Capital for Financial Firms
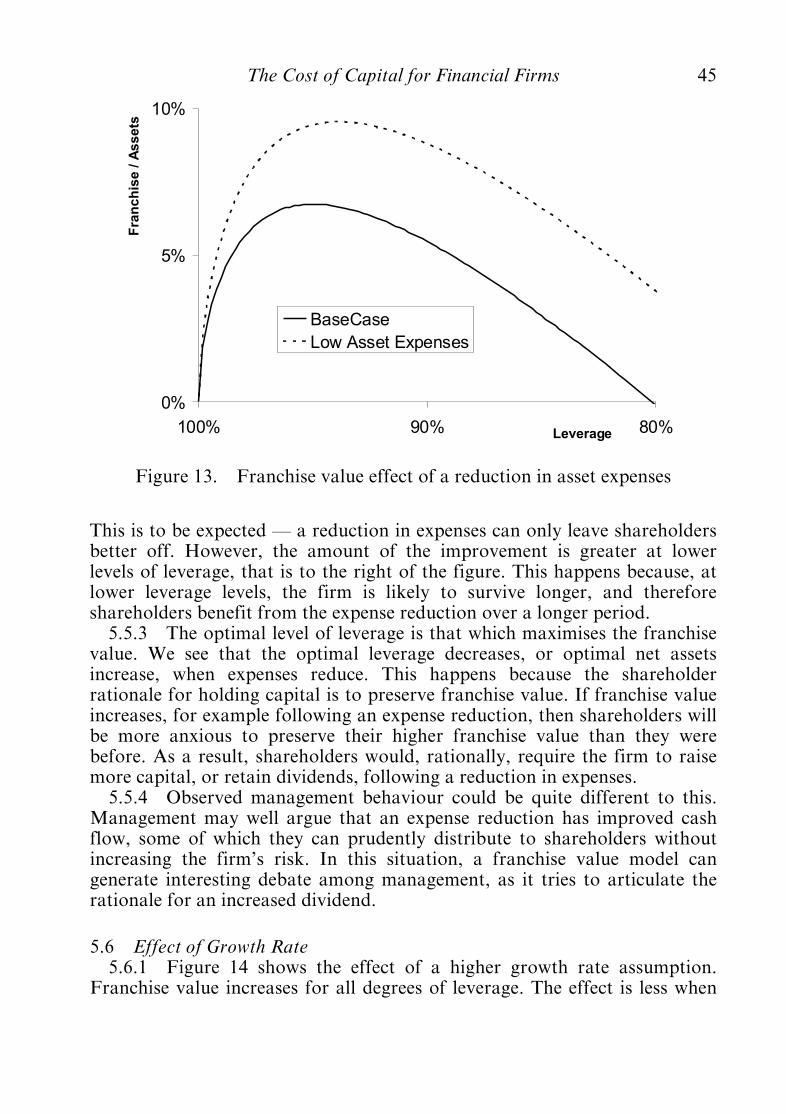
This is to be expected ö a reduction in expenses can only leave shareholdersbetter off. However, the amount of the improvement is greater at lowerlevels of leverage, that is to the right of the figure. This happens because, atlower leverage levels, the firm is likely to survive longer, and thereforeshareholders benefit from the expense reduction over a longer period.
5.5.3 The optimal level of leverage is that which maximises the franchisevalue. We see that the optimal leverage decreases, or optimal net assetsincrease, when expenses reduce. This happens because the shareholderrationale for holding capital is to preserve franchise value. If franchise valueincreases, for example following an expense reduction, then shareholders willbe more anxious to preserve their higher franchise value than they werebefore. As a result, shareholders would, rationally, require the firm to raisemore capital, or retain dividends, following a reduction in expenses.
5.5.4 Observed management behaviour could be quite different to this.Management may well argue that an expense reduction has improved cashflow, some of which they can prudently distribute to shareholders withoutincreasing the firm’s risk. In this situation, a franchise value model cangenerate interesting debate among management, as it tries to articulate therationale for an increased dividend.
5.6 Effect of Growth Rate5.6.1 Figure 14 shows the effect of a higher growth rate assumption.
Franchise value increases for all degrees of leverage. The effect is less when
0%
5%
10%
80%90%100% Leverage
Fra
nch
ise
/A
ssets
BaseCase
Low Asset Expenses
Figure 13. Franchise value effect of a reduction in asset expenses
The Cost of Capital for Financial Firms 45
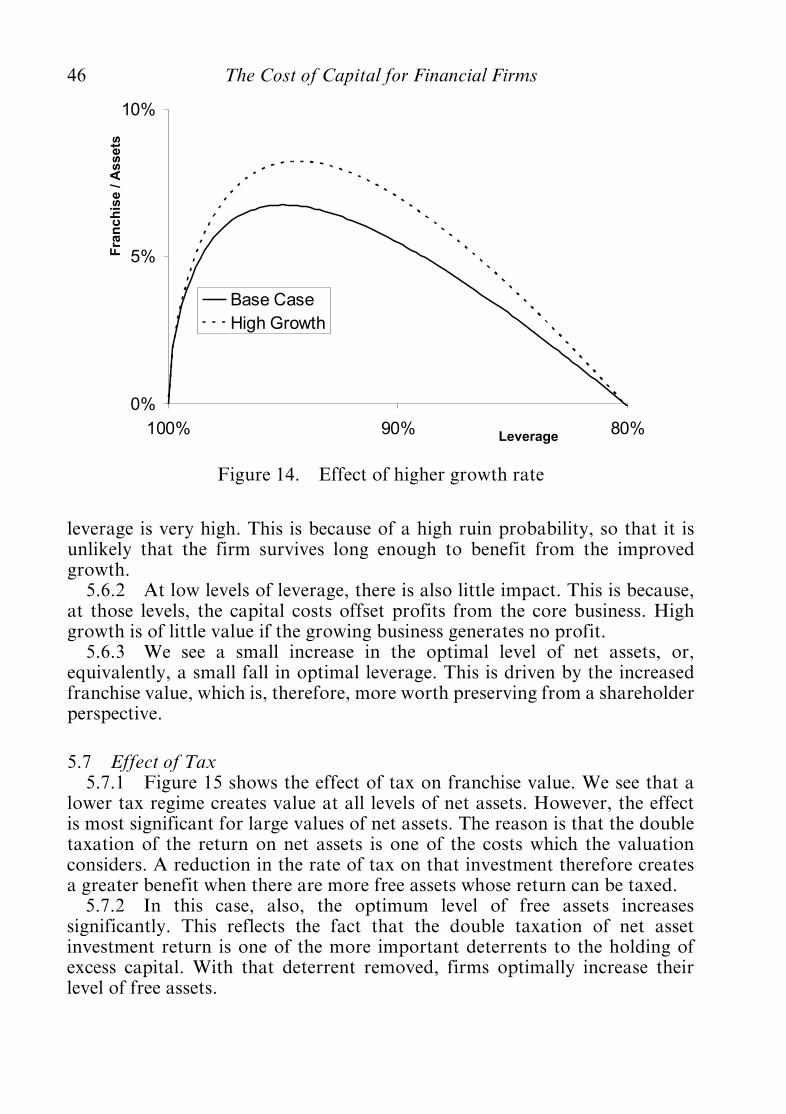
leverage is very high. This is because of a high ruin probability, so that it isunlikely that the firm survives long enough to benefit from the improvedgrowth.
5.6.2 At low levels of leverage, there is also little impact. This is because,at those levels, the capital costs offset profits from the core business. Highgrowth is of little value if the growing business generates no profit.
5.6.3 We see a small increase in the optimal level of net assets, or,equivalently, a small fall in optimal leverage. This is driven by the increasedfranchise value, which is, therefore, more worth preserving from a shareholderperspective.
5.7 Effect of Tax5.7.1 Figure 15 shows the effect of tax on franchise value. We see that a
lower tax regime creates value at all levels of net assets. However, the effectis most significant for large values of net assets. The reason is that the doubletaxation of the return on net assets is one of the costs which the valuationconsiders. A reduction in the rate of tax on that investment therefore createsa greater benefit when there are more free assets whose return can be taxed.5.7.2 In this case, also, the optimum level of free assets increases
significantly. This reflects the fact that the double taxation of net assetinvestment return is one of the more important deterrents to the holding ofexcess capital. With that deterrent removed, firms optimally increase theirlevel of free assets.
0%
5%
10%
80%90%100%Leverage
Fra
nch
ise
/A
ssets
Base Case
High Growth
Figure 14. Effect of higher growth rate
46 The Cost of Capital for Financial Firms
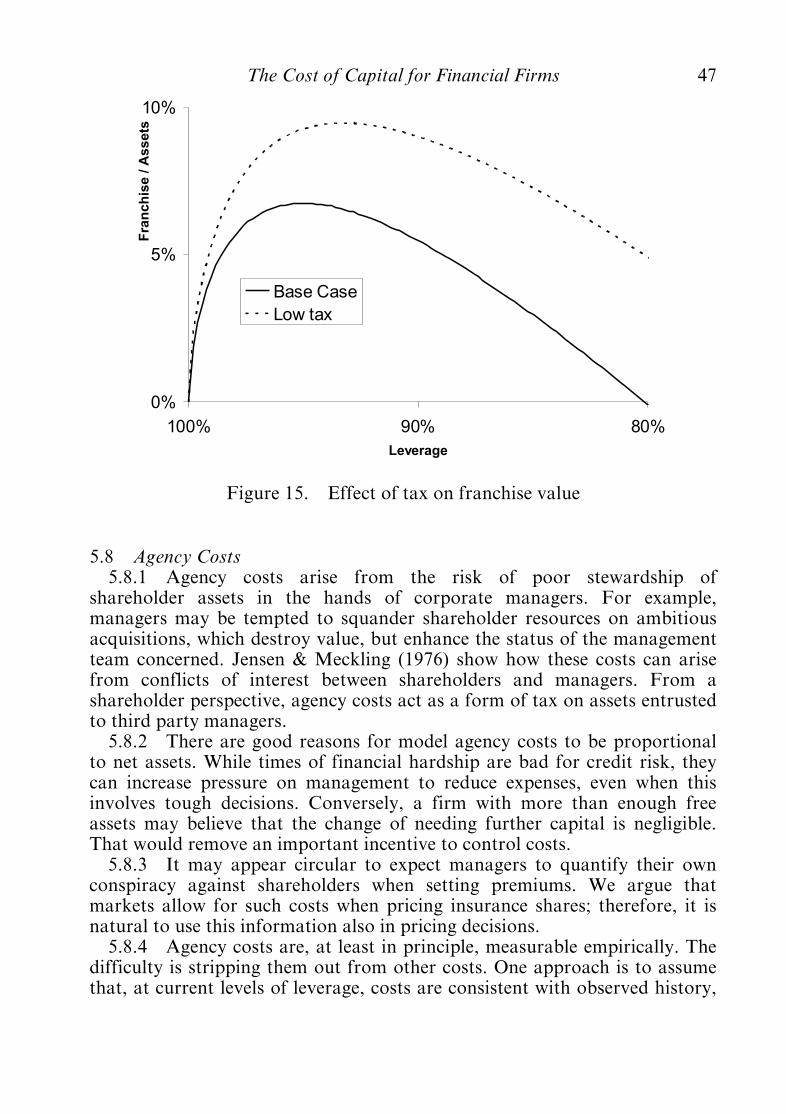
5.8 Agency Costs5.8.1 Agency costs arise from the risk of poor stewardship of
shareholder assets in the hands of corporate managers. For example,managers may be tempted to squander shareholder resources on ambitiousacquisitions, which destroy value, but enhance the status of the managementteam concerned. Jensen & Meckling (1976) show how these costs can arisefrom conflicts of interest between shareholders and managers. From ashareholder perspective, agency costs act as a form of tax on assets entrustedto third party managers.
5.8.2 There are good reasons for model agency costs to be proportionalto net assets. While times of financial hardship are bad for credit risk, theycan increase pressure on management to reduce expenses, even when thisinvolves tough decisions. Conversely, a firm with more than enough freeassets may believe that the change of needing further capital is negligible.That would remove an important incentive to control costs.
5.8.3 It may appear circular to expect managers to quantify their ownconspiracy against shareholders when setting premiums. We argue thatmarkets allow for such costs when pricing insurance shares; therefore, it isnatural to use this information also in pricing decisions.
5.8.4 Agency costs are, at least in principle, measurable empirically. Thedifficulty is stripping them out from other costs. One approach is to assumethat, at current levels of leverage, costs are consistent with observed history,
0%
5%
10%
80%90%100%
Leverage
Fra
nch
ise
/A
ssets
Base Case
Low tax
Figure 15. Effect of tax on franchise value
The Cost of Capital for Financial Firms 47
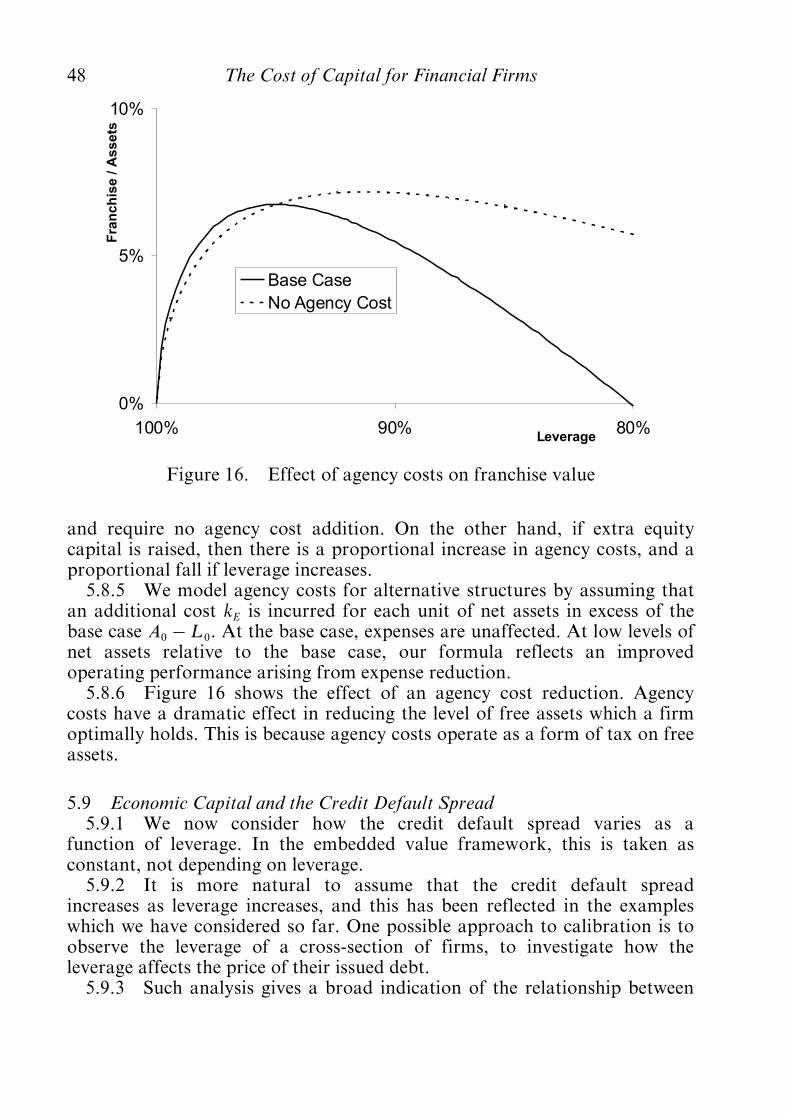
and require no agency cost addition. On the other hand, if extra equitycapital is raised, then there is a proportional increase in agency costs, and aproportional fall if leverage increases.
5.8.5 We model agency costs for alternative structures by assuming thatan additional cost kE is incurred for each unit of net assets in excess of thebase case A0 ÿ L 0. At the base case, expenses are unaffected. At low levels ofnet assets relative to the base case, our formula reflects an improvedoperating performance arising from expense reduction.
5.8.6 Figure 16 shows the effect of an agency cost reduction. Agencycosts have a dramatic effect in reducing the level of free assets which a firmoptimally holds. This is because agency costs operate as a form of tax on freeassets.
5.9 Economic Capital and the Credit Default Spread5.9.1 We now consider how the credit default spread varies as a
function of leverage. In the embedded value framework, this is taken asconstant, not depending on leverage.
5.9.2 It is more natural to assume that the credit default spreadincreases as leverage increases, and this has been reflected in the exampleswhich we have considered so far. One possible approach to calibration is toobserve the leverage of a cross-section of firms, to investigate how theleverage affects the price of their issued debt.
5.9.3 Such analysis gives a broad indication of the relationship between
0%
5%
10%
80%90%100%Leverage
Fra
nch
ise
/A
ssets
Base Case
No Agency Cost
Figure 16. Effect of agency costs on franchise value
48 The Cost of Capital for Financial Firms
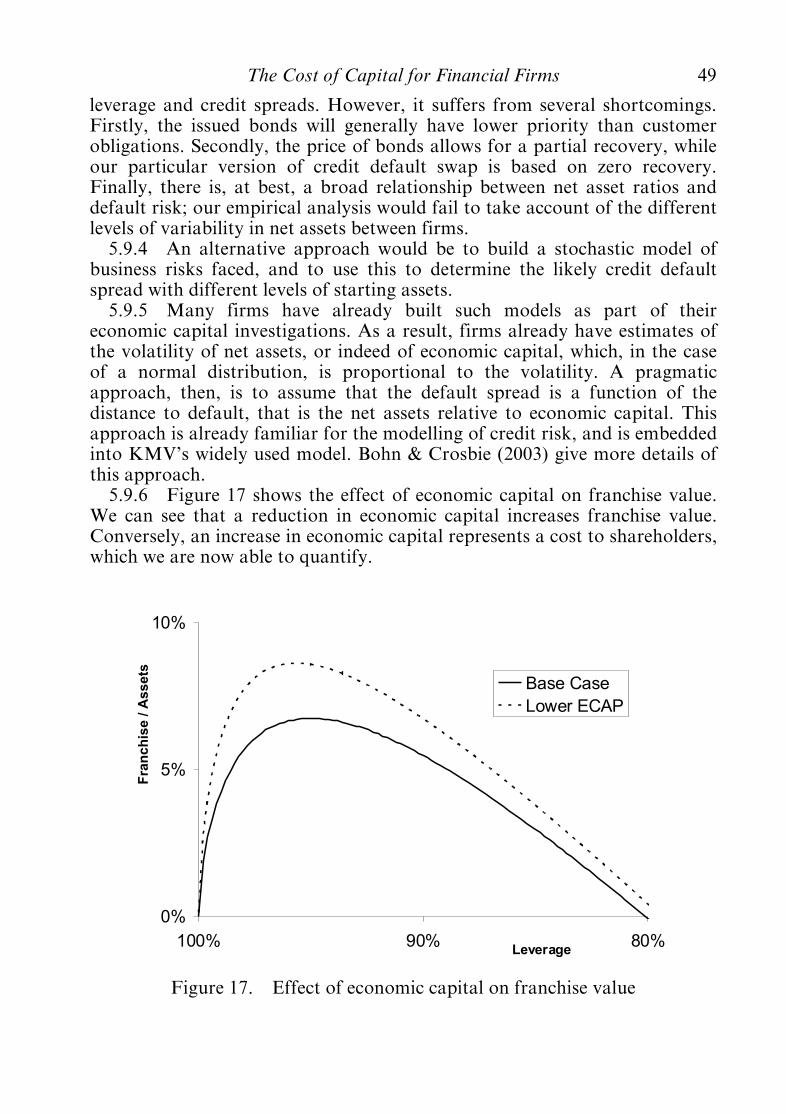
leverage and credit spreads. However, it suffers from several shortcomings.Firstly, the issued bonds will generally have lower priority than customerobligations. Secondly, the price of bonds allows for a partial recovery, whileour particular version of credit default swap is based on zero recovery.Finally, there is, at best, a broad relationship between net asset ratios anddefault risk; our empirical analysis would fail to take account of the differentlevels of variability in net assets between firms.
5.9.4 An alternative approach would be to build a stochastic model ofbusiness risks faced, and to use this to determine the likely credit defaultspread with different levels of starting assets.
5.9.5 Many firms have already built such models as part of theireconomic capital investigations. As a result, firms already have estimates ofthe volatility of net assets, or indeed of economic capital, which, in the caseof a normal distribution, is proportional to the volatility. A pragmaticapproach, then, is to assume that the default spread is a function of thedistance to default, that is the net assets relative to economic capital. Thisapproach is already familiar for the modelling of credit risk, and is embeddedinto KMV’s widely used model. Bohn & Crosbie (2003) give more details ofthis approach.
5.9.6 Figure 17 shows the effect of economic capital on franchise value.We can see that a reduction in economic capital increases franchise value.Conversely, an increase in economic capital represents a cost to shareholders,which we are now able to quantify.
0%
5%
10%
80%90%100%Leverage
Fra
nc
his
e/
As
se
ts
Base Case
Lower ECAP
Figure 17. Effect of economic capital on franchise value
The Cost of Capital for Financial Firms 49
5.9.7 As with all our previous examples, the effect on franchise valueat high leverage is negligible. The effect is also modest at low levels ofleverage. Here, the reason is that actual capital is so large relative toeconomic capital that the calculated level of economic capital becomesirrelevant.
5.9.8 However, unlike the previous examples, we now see that theoptimal level of capital has fallen as economic capital fell. This is because,with a lower level of risk, we can afford to hold less actual capital.
5.10 The Cost of Economic Capital5.10.1 We have now come full circle. We started with a survey of all the
business decisions where cost of capital has a role to play. We now have atool to quantify the cost of risk capital in financial decision making.
5.10.2 There are many ways in which financial firms can reduceexposures to risk. For example, firms can buy reinsurance or derivativehedges from external providers. Asset securitisation is another popular toolfor managing default risk. In addition to external transactions, firms canadjust internal processes to reduce risk, such as restrictions on lendingcriteria or insurance underwriting.
5.10.3 In all these cases, the cost is a reduction in expected profit,because of margins paid to third parties. The benefit is a reduction in risk,usually measured as a reduction in economic capital. Therefore, decisionsrest critically on the assumed cost saving when economic capital isreduced.
5.10.4 RORAC theory prices the capital reduction using an expectedshareholder return. The most important inputs are the firm’s beta and theassumed equity risk premium. If a firm believes in a large equity riskpremium, it will hedge more market risk, securitise more credit risk, buymore reinsurance and operate tight underwriting criteria.
5.10.5 Our hedge-based valuation gives an alternative view. We quantifythe cost of economic capital by its effect on the franchise value. That effect isdetermined by the frictional costs of capital, by CDS spreads and by thefranchise value at risk. Risk premiums are irrelevant, because risk premiumsalways cancel out in hedge constructions.
5.10.6 Economic capital is most important for firms where capital is anactive constraint. In these cases, our analysis shows that franchise value issensitive to economic capital. Economic capital is less costly for highlyleveraged firms, especially those with low franchise value. In that case, ouranalysis suggests that the optimal shareholder strategy is the pursuit of profitwith comparatively less regard for risk.
5.10.7 Economic capital is also less costly for firms with very largecapital resources, relative to risks run. That is because capital is unlikelyto be a constraint on business decisions, nor to affect shareholder cashflows.
50 The Cost of Capital for Financial Firms
å. Conclusions
6.1 No Big Secret, but Many Definitions6.1.1 After much deliberation, we have come to this conclusion: the only
secret about the cost of capital is that there is no secret. Different peoplemean different things when they refer to the cost of capital. Clear definitionsare a prerequisite for a productive discussion.
6.1.2 Firms are right to be concerned when they fail to find a universalcapital definition which makes sense for all their businesses. The capitalneeded to secure a given credit rating is not the same as the capital on whichshareholders require a return, and is different again from the optimalcapital to hold on the balance sheet. The cost of capital which analysts use tovalue a firm is not the same as the cost of capital for use in performancemeasurement or product pricing. Neither of these is the same as the CAPMimplied cost of capital, which you can find at the push of a button from yourmarket data supplier.
6.1.3 When analysts talk about the cost of capital, they usually meanthe return which shareholders require on an investment, given a level of risk.This percentage return applies to the whole market capitalisation, ratherthan merely to the balance sheet net assets. The expected return is difficult toobserve, and most firms rely on theoretical models, such as the CAPM, toconstruct expected return estimates.
6.2 Financial Firms6.2.1 Although all firms have a cost of capital, application of the
concept to financial firms is challenging, because:ö liabilities to customers represent a form of debt capital (and these
customers may be particularly credit sensitive);ö rather than balance sheet assets being invested in plant and machinery,
they may be invested in financial instruments, whose values may bemarked to market, and their growth unsuited to comparison againstCAPM expected returns; and
ö the difference between balance sheet net assets and total equity marketcapitalisation may be material, reflecting significant franchise value,which can be identified in terms of customer relationships.
6.2.2 The good news is that known biases in the cost of capital methodsfor other industries are most easily remedied for financial firms. This isbecause, provided that each of the above issues is addressed carefully, theassets and liabilities of financial firms can more easily be represented in termsof replicating portfolios, including information from securitisation andother financial transactions. Thanks to the replication approach, CAPMimplied capital costs, based on expected returns, are irrelevant in thiscalculation.
The Cost of Capital for Financial Firms 51
6.3 The Importance of Frictional Costs6.3.1 Apart from required shareholder returns, there are cash flow costs
associated with the actual level of capital on the balance sheet. These arecollectively known as frictional costs, including double taxation and agencycosts. Measurement of frictional costs is an empirical question. As yet,theoretical models of frictional costs have been slow to develop, but it isplausible that frictional costs are related to the accounting balance sheet netassets.
6.3.2 Frictional costs may be offset by the benefits of holding capital, inparticular the reduction in the risk of failure. This normally benefits bothcustomers, who experience lower default risk, and shareholders, who increasethe probability of retaining franchise value.
6.4 Economic Capital6.4.1 Financial firms often identify their ‘economic capital’, usually
defined as the difference between current net assets and some low percentileof an estimated future net asset probability distribution. Economic capitalalso generates costs: firstly, the cost of computing it; plus any increases inthe compensation which managers negotiate with reference to economiccapital arguments; and, finally, the effect of economic capital on theprobability of ruin. The economic capital calculation is one importantfactor in determining how much actual capital a firm chooses to hold.However, the other factors discussed above, including the frictional costs ofholding capital and the impact of franchise value, are, potentially, just asimportant.
6.4.2 Capital held affects performance measurement, because of itseffect on the possibility of failure. A firm, whose actual capital is a smallmultiple of economic capital, must set demanding performance targets in theevents where it survives, in order to offset the total shareholder loss whichaccompanies failure. The effect is most marked for firms with a largefranchise value, as shareholders then have most to lose.
6.5 Using the Cost of Capital in Practical Applications6.5.1 Hurdle rates used in transactions, product pricing or embedded
value reporting may, at first sight, be hard to explain. We can rationaliseobserved rates as a combination of CAPM implied returns, plus a loading toreflect the possibility that a firm fails before the cash flows are realised, plusa further loading to offset optimism in cash flows. The optimism may bepartly due to a failure to model frictional costs.
6.5.2 Market consistent reporting provides an improved substitute forthe CAPM component, but the need remains to allow for possible firmfailure, frictional costs and other cash flow optimism.
6.5.3 This paper proposes empirical investigations, which may be usedto quantify these effects, and suggests that financial firms are an ideal setting
52 The Cost of Capital for Financial Firms
for cost of capital methodologies in developing pricing tools and targetsetting.
Acknowledgements
This paper is based on another paper of the same title, presented to theInstitute and Faculty of Actuaries Finance and Investment Conference in2003.
We are grateful to many friends, colleagues and clients who haveencouraged us to develop our models in this area. Particular thanks are dueto Richard Baddon, Paul Coulthard, Rolf van den Heever, Martin Lees, TimMedcalf, Shyam Mehta, Ian Moran, Norbert Schnadt, Tim Sheldon,Guillaume Valois, Elliot Varnell, David Walczak, Andrew Wallace-Barnett,Martin White and two anonymous scrutineers. We would also like to thankparticipants at a pricing for risk workshop in May 2003, discussants at the2003 Finance and Investment Conference, participants in the 2004 Bowlessymposium in Atlanta, Georgia, and contributors to a discussion at the PolishSociety of Actuaries, Warsaw, in 2005. Any remaining errors are our own.
References
The following list includes, not only the works referred to in the paper, butother publications which would be of use to readers.
Ahmed, M.A., Bulmer, J.R., Clark, P.K., Collins, J.A., Fulcher, G., Lualdi, M.,
Robinson, E.J.A., Sayers, J.E., Spence, A.C. & Walker, S.R. (1997). Thesecuritisation of insurance risk. General Insurance Convention.
Artzner, P., Delbaen, F., Eber, J.-M. & Heath, D. (1999). Coherent measures of risk.Mathematical Finance, 9(3), 203-228.
Blake, D., Cairns, A.J.G. & Dowd, K. (2006). Living with mortality: longevity bonds andother mortality-linked securities. British Actuarial Journal (to appear).
Bohn, J. & Crosbie, P. (2003). Modelling default risk. Moody’s KMV. Downloadable athttp://www.moodyskmv.com/research/files/wp/ModelingDefaultRisk.pdf
Borch, K. (1969). The optimal reinsurance treaty. The ASTIN Bulletin, V(2), 16-20.Borch, K. (1982). Additive insurance premiums: a note. Journal of Finance, 37, 1295-1298.Boulton, R., Roberts, D., Smith, A.D. & White, M. (2002). Investment strategies for
general insurers. General Insurance Convention, Institute of Actuaries.Brealey, R.A. & Myers, S. (1983). Principles of corporate finance, 8th edition (2005).
McGraw Hill.Burrows, R.P. & Lang, J. (1997). Risk discount rates for actuarial appraisal values of life
insurance companies. 7th AFIR International Colloquium, 1.Burrows, R.P. & Whitehead, G.H. (1987). The determination of life office appraisal values.
Journal of the Institute of Actuaries, 114, 411-465.Butsic, R., Cummins, D., Derrig, R. & Phillips, R. (2000). The risk premium project.
Phase I and II Report. CAS Website, http://casact.org/cotor/rppreport.pdfChristofides, S. & Smith, A.D. (2001). DFA The value of risk. CAS Spring Forum, Casualty
Actuarial Society. http://casact.org/pubs/forum/01spforum/01spf153.pdf
The Cost of Capital for Financial Firms 53
Cumberworth, M., Hitchcox, A., McConnell, W. & Smith, A. (2000). Corporatedecisions in general insurance: beyond the frontier. British Actuarial Journal, 6, 259-296.
Cummins, J.D. (1990). Multi-period discounted cash flow models in property-liabilityinsurance. Journal of Risk and Insurance.
Cummins, J.D., Phillips, R.D., Butsic, R.P. & Derrig, R.A. (2000). The risk premiumproject. Phase I and II Report. Casualty Actuarial Society. http://www.casact.org/pubs/forum/00fforum/00ff165.pdf
Dimson, E., Marsh, P. & Stanton, M. (2002). Triumph of the optimists. 101 years of globalinvestment returns. Princeton.
Doherty, N. (1997). Financial innovation in the management of catastrophe risk. Proceedingsof the 28th Astin Colloquium/7th AFIR Colloquium. Institute of Actuaries of Australia.
Duffie, D. (1996). Dynamic asset pricing theory. Princeton University Press.Exley, C.J. & Smith, A.D. (2003). The cost of capital for financial firms. Finance and
Investment Conference.Fama, E.F. & French, K.R. (1988). The corporate cost of capital and the return on corporate
investment. CRSP working paper. http://ssrn.com/abstract=75999Froot, K. & Stein, J. (1998). Risk management, capital budgeting and capital structure policy
for financial institutions, an integrated approach. Journal of Financial Economics, 47,55-82.
Hancock, J., Huber, P. & Koch, P. (2001). The economics of insurance ö how insurers createvalue for shareholders. Swiss Re Technical Publishing.
Hare, D. & King, D. (2005). Capital allocation and performance measurement: a case study.Life Convention.
Jensen, M. & Meckling, W. (1976). Theory of the firm: managerial behaviour, agency costsand ownership structure. Journal of Financial Economics, 3, 305-340.
Moran, I.R., Smith, A.D. & Walczak, D. (2003). Why financial firms can charge fordiversifiable risk. Bowles Symposium, Society of Actuaries.
Merton, R. & Perold, A. (1999). Theory of risk capital in financial firms. In Chew, D.(ed.), The new corporate finance: where theory meets practice. Boston: Irwin ö McGrawHill.
Miller, M. (1999). Does M&M apply to banks? In Merton Miller on Derivatives, Princeton.Modigliani, F. & Miller, M. (1958). The cost of capital, corporation finance and the theory
of investment. American Economic Review, 48, 261-297.Modigliani, F. & Miller, M. (1963). Corporate income taxes and the cost of capital.
American Economic Review, 433-443.Myers, S.C. & Cohn, R.A. (1987). A discounted cash flow approach to property-liability
insurance rate regulation, fair rate of return in property-liability insurance. Kluwer-Nijhoff.
Ng, H.M. & Varnell, E.M. (2003). Frictional costs. Paper presented to the Staple InnActuarial Society.
O’Keeffe, P.J.L., Desai, A.J., Foroughi, K., Hibbett, G.J., Maxwell, A.F., Sharp,
A.C., Taverner, N.H., Ward, M.B. & Willis, F.J.P. (2005). Current developments inembedded value reporting. British Actuarial Journal (to appear).
Ogier, T., Rugman, J. & Spicer, L. (2004). The real cost of capital ö a business field guide tobetter financial decisions. Prentice Hall.
Perold, A.F. (2001). Capital allocation in financial firms (2001). Harvard Business School No.98-072. http://ssrn.com/abstract=267282
Scotti, V. (2005). Insurers’ cost of capital and economic value creation: principles andpractical implications. Sigma 2005, 3. Swiss Re publications.
Sheldon, T.J. & Smith, A.D. (2004). Realistic valuation of life insurance business. BritishActuarial Journal, 10, 543-626.
Sherris, M. (2002). Economic valuation: something old, something new. Australian ActuarialJournal, 9(4).
54 The Cost of Capital for Financial Firms
Solomon, E. & Laya, J.C. (1967). Measurement of company profitability: some systematicerrors in the accounting rate of return. Financial research and management decisions. (A.A.Rominchek, ed.) John Wiley, New York.
Taylor, G. (1994). Fair premium rating methods and the relations between them. Journal ofRisk and Insurance, 61(4), 592-615.
Wang, S. (2002). A universal framework for pricing financial and insurance risks. SCORworking paper.
Wang, S., Young, V. & Panjer, H. (1997). Axiomatic characterisation of insurance prices.Insurance Mathematics and Economics, 21, 173-182.
Printed by Bell & Bain Ltd., Glasgow
The Cost of Capital for Financial Firms 55


![THE COST OF CAPITAL FOR FINANCIAL FIRMS · THE COST OF CAPITAL FOR FINANCIAL FIRMS By C. J. Exley and A. D. Smith [Presented to the Institute of Actuaries, 23 January 2006] abstract](https://img.pdfslide.us/doc/110x75/5edbbff3ad6a402d66661f02/the-cost-of-capital-for-financial-firms-the-cost-of-capital-for-financial-firms.jpg)