Embed Size (px)
Citation preview

1
Insiders Ownership Concentration and Firms Cost of Debt:
Evidence from Bank Loans
Stefano Lugo
Utrecht University School of Economics. Kriekenpitplein 21-22, 3584 EC Utrecht, Netherlands. Phone:
+31302537297; Fax: +31302537373; E-mail address: [email protected]
Abstract This paper investigates the relationship between insiders ownership concentration and firms
cost of borrowing. Building on asset substitution and market for corporate control theories, we predict
and show empirical evidence of a non-monotonic relationship, with cost of bank loans increasing and
then decreasing with the level of ownership concentration. Leverage and anti-takeover provisions are
found to moderate the relationship in a coherent fashion with the proposed theoretical arguments.
Finally, we show that – while more costly – financial covenants are more effective than performance
pricing clauses in reducing the sensitivity of loan prices to the ownership structure of the borrower.
JEL classification: G21, G30, G32
EFM classification: 110, 150, 210
Keywords: ownership structure, agency costs, market for corporate control, cost of debt, bank loans

2
1 Introduction
Since Jensen and Meckling published in 1976 their work on agency costs and ownership structure, the
relevance and impact of conflicts of interest between firms insiders on the one hand and other firms
stakeholders on the other hand has been one of the most investigated topic in the field of corporate
finance, as Shleifer and Vishny (1997) survey on corporate governance well illustrates. While
empirical studies have mainly focused on the conflict of interest between insiders and minority
shareholders (e.g. Gompers et al. 2003; Cremers and Nair 2005) conflicts exist as well between insiders
and creditors. Empirical studies on this conflict have generally set their focus on wealth changes
associated to certain events (e.g. Warga and Welch 2003; Billett et al. 2004) or investigated the impact
of corporate governance mechanisms on the value of corporate bonds (e.g. Klock et al. 2005; Cremers
et al. 2007).
Several previous studies on conflicts of interest between creditors and managers build on arguments
specifically developed for the conflict of interest between managers and minority shareholders;
however, as noted by Cremers et al. (2007), non-controlling shareholders and creditors interests are not
necessarily always aligned. Arguments based on the risk of asset substitution (Jensen and Meckling
1976) and tunneling (Johnson et al. 2000) see minority shareholders and creditors interests quite
aligned, and predict an increase in conflicts of interest when the separation between ownership and
control increase. Market for corporate control (e.g. Stulz 1988) theories depict instead a different
situation for the two classes of stakeholders: while an increase in insiders ownership can be beneficial
for minority shareholders, it would harm creditors.
The two arguments thus predict opposite relationships between insiders ownership concentration and
the strength of conflict of interests between insiders and creditors. As market for corporate control
effects are more influential when control is disputable (i.e. when ownership concentration is low) we
predict a non-monotonic relationship between the level of ownership by insiders and the relevance of
their conflicts with creditors, and thus with cost of debt. We empirically investigate this relationship by
studying how the level of ownership by firms insiders affect the cost of bank loans. We use a large
sample of bank loans issued between 1996 and 2010 and, controlling for several borrower, loans,
lenders, market and country law characteristics, we find that at 0.1% statistical confidence level the
relationship between insiders ownership and firms cost of borrowing is inverse U-shaped, with the cost
of debt increasing (decreasing) with insiders ownership when the latter is low (high). The turning point
is found for a level of ownership by insiders of 43.1% – 49.3% (depending on the model), as control
3
becomes no longer disputable. Beside statistical significance, the effect of insiders ownership on firms
cost of borrowing is economically sizable: ceteris paribus, a firm where insiders own 43% – 49.3% of
equity pays on average 12.5% – 20% (or 20.5 – 32.5 bps) higher spreads on bank loans than a widely
held firm and 21.5 – 22% (34 – 35.5 bps) higher than a firm where insiders hold all equity. The
functional form is robust to the use of different empirical strategies to test it, such as using a piecewise
linear regression or splitting our sample by levels of insiders ownership. Estimations accounting for
potential panel unobserved effects and endogeneity in the ownership structure also confirm our main
result. We provide further evidence of the role played by market for corporate control by studying how
governance provisions protecting insiders from external challenge moderate the phenomenon. We find
that the positive relationship between insiders ownership and loans spreads is not in place for
borrowers characterized by multiple anti-takeover provisions.
We then turn our attention toward how the relationship between insiders ownership concentration and
cost of borrowing is moderated by capital structure. Theory predicts that leverage reduces the
sensitivity of the cost of debt to the ownership structure, as lower free cash flow reduce the
discretionary use of resources by insiders (Jensen 1986). Moreover, high leverage reduce the role of
market for corporate control, as creditors can gain more control on the firm (Burkart et al. 1997) and
the likelihood of a takeover is reduced (Novaes 2002). Indeed, we find that the correlation between cost
of debt and the separation of ownership and control is strongly reduced for high levels of leverage, and
especially so for low levels of insiders ownership. The negative relationship found for high levels of
ownership concentration is instead still in place, although mitigated.
Finally, we study how contingent clauses of loans contracts such as financial covenants and
performance pricing moderate the relationship between ownership concentration and cost of debt.
While both class of clauses as predictable reduce the sensitivity of debt price to insiders ownership, the
former appear to be significantly more effective in doing so.
The determinants of bank loans pricing, contract and syndicate structure have recently received strong
attention (e.g. Carey and Nini 2007; Sufi 2007; Gatev and Strahan 2009; Ivashina 2009; Mattes et al.
2013). In particular, few papers have investigated the relationship between firms ownership and the
cost of bank loans. (e.g. Lin et al. 2011, 2012; Saunders and Steffen 2011; Roberts and Yuan 2010).
We add to the findings of previous literature in several ways: first, we document that the relationship
between the separation of ownership and control - as measured by the share held by firms’ insiders -
and the cost of bank loans is non-monotonic. Few studies so far have assessed theoretically (e.g. Stulz
1988) and empirically (e.g. Morck et al. 1988; Wright et al. 1996) a potentially non-linear effect of
4
ownership concentration on operative performances or equity value. To the best of our knowledge, this
is the first study to show empirical evidence of a non-monotonic effect of insiders ownership on loans
pricing.
Second, we focus on insiders ownership concentration rather than different proxies for separation of
ownership and control used in previous studies. Lin et al. (2011, 2012) use the difference between
control rights and cash flow rights. This measure has long been used in the literature (e.g. Claessens et
al. 2002; Faccio and Lang 2001); however, as noted by the authors it identifies a separation of
ownership and control only in presence of “pyramidal structures, dual-class shares, and multiple
control chains” (Lin et al. 2011; p. 5). We focus instead our attention on insiders ownership
concentration (Grossman and Hart 1986; Hart and Moore 1990).1 This variable allows us to consider
the effect of the separation between ownership and control simply arising when insiders own less than
100% of firm’s equity. Moreover, while it does not allow to consider the effect of particular control
structures as the wedge between control and cash flow right does, it has the great advantage of being an
information easily available for a large number of firms, allowing to study its effect on a broader
sample.2
Finally, we contribute to the literature by studying how the influence of insiders ownership
concentration on cost of bank loans is moderated by the capital structure of the firm and by the
covenants and performance pricing clauses banks can include in loan contracts to protect themselves.
The rest of the paper proceeds as follow: in Section 2 we describe the dataset used. In Section 3 we
discuss how theory predicts a non-monotonic relationship between insiders ownership concentration
and the cost of debt, an present supporting empirical results. Section 4 reports additional empirical
evidence on the role played by the market for corporate control in shaping the relationship between
insiders ownership and cost of debt. In Section 5 we discuss the role played by borrowers leverage in
moderating this relationship, and show related empirical results. Section 6 investigates to what extent
1 Studies focusing on conflicts of interest between shareholders and managers often model these two entities as separated even when there is a shareholder with a relevant share of control rights (e.g. Shleifer and Vishny 1986). Given our goal to study conflicts of interests with creditors, we follow here the approach of Grossman and Hart (1986) and Hart and Moore (1990) among others to consider one of the actor involved to be a manager-owner, who benefit from controlling the firm while providing less than 100% of the capital. Incidentally, the same definition of manager-owner was assumed also by Jensen and Meckling (1976), even though their most interesting predictions relate to the case where the amount of capital provided by the manager tends toward zero. The crucial difference is that with our approach control under existing management is not exogenous, but exist exactly because managers have enough control rights to govern the firm. This in turns gives greater relevance to market for corporate control arguments (e.g. Manne 1965). 2 In our most parsimonious model, we are able to include 6,423 distinct borrowers from 65 countries between 1996 and March 2010; Lin et al. (2011) study includes 3,468 borrowers from 22 countries between 1996 and 2008.
5
loans contract clauses are effective in reducing the relevance of potential conflicts of interest between
insiders and creditors. Section 7 concludes.
2 Data
The two main datasets used in this study are the SDC Dealscan database, where we get information on
bank loans, and the Worldscope database, where we get firm level data.
Worldscope dataset initially includes 67,526 firms, corresponding to 979,746 yearly observations
between 1995 and 2009. Dealscan dataset includes, up to March 2010, 41,476 distinct firms codes
associated to 106,613 loans packages3 divided into 154,488 facilities. Following Ivashina (2009), we
keep only one facility per package, using the biggest one starting at loan initiations. We decide to not
use data before August 1996 as they are largely incomplete because they have been collected
retroactively (e.g. Ivashina 2009). The portion of Dealscan we consider includes 35,261 borrowing
firms and 83,551 deals.
Since Dealscan database appears to be more affected by duplicate identification codes for each firm, we
use the Worldscope dataset as master in merging the two, meaning that multiple Dealscan identification
codes may be associated to a single Worldscope id.
We start building our dataset cleaning Worldscope for: a) duplicates firms (by name, country and
sector) and ADRs; b) observations where no variable is non-missing; c) observation where the year or
the firm sector is missing. We are then left with 62,648 unique firms with 939,720 yearly observations
between 1995 and 2009. In the spirit of Faccio et al. (2001), we drop observations characterized by
suspicious values, such as negative assets or liabilities, or when total assets is not equal to the sum of
total equity and liabilities (with an acceptable margin of error of 5%). After this check, we are left with
60,399 firms (432,594 observations) where at least sector, country and total assets of the firm are
available. To further limit the potential for suspicious data to affect our results , we winsorize all
Worldscope continuous variables at 1% level for each tail.4
We then merge Worldscope with Dealscan using firms name, country and sector (at 2-digit SIC code
level); we find at least one correspondence for 15,623 Worldscope unique firms. We are further able to
hand-match 1,195 entities, bringing the total number of Worldscope firms with a match in Dealscan to
16,818. The number of deals where we can identify the borrowing firm in Worldscope is then 34,648 –
3 As usually done in the literature on syndicated loans, we use the terms “loan deal” and “loan package” as synonyms. 4 However, we do not winsorize or main independent variable for insiders ownership concentration defined below, as it correctly varies between 0 and 1. All the main results presented in this paper holds using non winsorized data as well.

6
or 41.47% of the total – where for 27,954 of them (corresponding to 8,334 borrowers from 76 different
countries) at least the 1 year lagged information about firm’s country, sector and total assets is
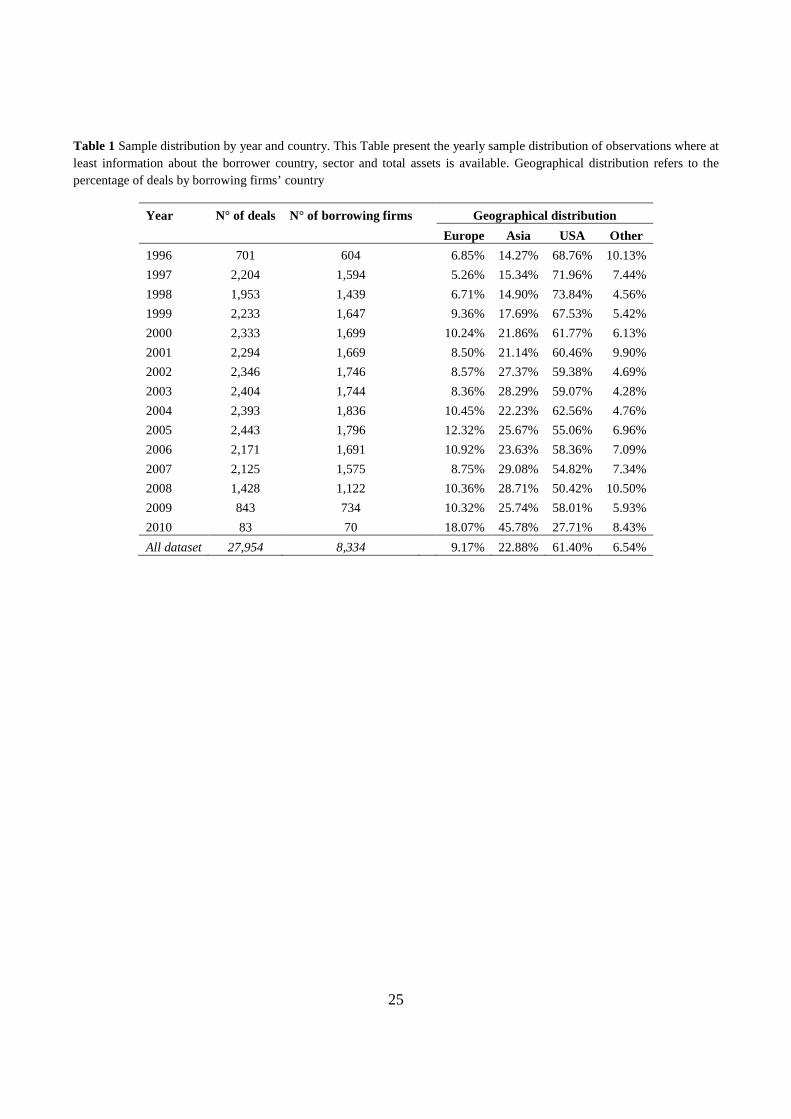
available. Table 1 shows the distribution of deals and borrowing firms by year and geographical area.
[Insert Table 1 about here]
The main dependent variable in our study is the spread over the reference index paid by the borrower
for each deal. As customary in the literature on syndicated loans pricing (e.g. Lin et al. 2011) we use
the all-in spread drawn in basis points (source: Dealscan), defined as the total annual cost, including a
set of fees and fixed spread, paid for each amount effectively used under the loan commitment.
To measure insiders ownership concentration we use the percentage of Closely Held Shares (CHS,
source: Worldscope) in decimals. CHS is defined as the share of equity held by insiders. It includes
shares held by officers, directors and their immediate families; shares held in trust; shares of the
company held by any other corporation; shares held by pension/benefit plans; shares held by
individuals who hold more than 5% or more of the outstanding shares. CHS has been used in several
previous study as a measure of insiders ownership concentration (e.g. Mitton 2002; Thomsen et al.
2006; Doidge et al. 2007).
In our analyses we include several controls that have been found in the literature to significantly
influence the cost of corporate borrowing. Below are described all the borrowers, loans, lenders, legal
environment and market rates characteristics included in this study; descriptive statistics for all
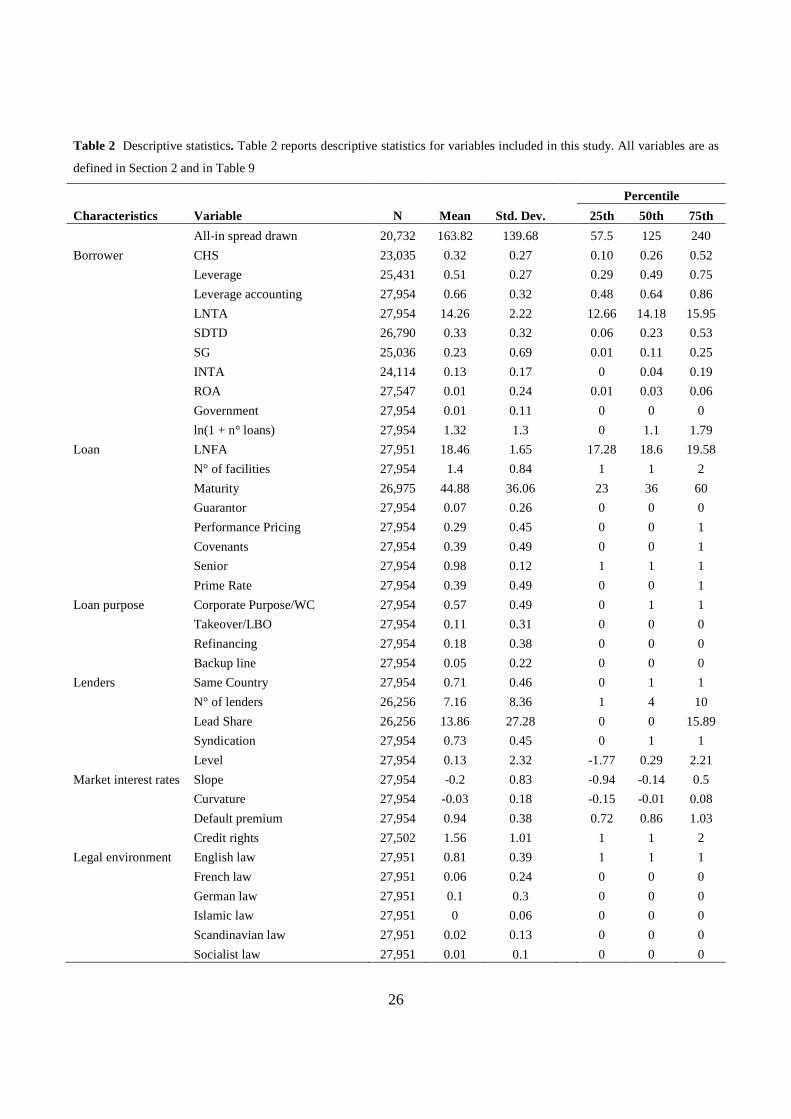
variables are then reported in Table 2. Variables definition is summarized in Table 9, reported in the
Appendix.
2.1 Borrowers characteristics
We use several firms characteristics relating to borrower credit quality and/or the level of asymmetric
information between borrowers and lenders. The main control variable is the firm Leverage, which has
long been recognized as the main firm-specific determinant of credit spreads (e.g. Collin-Dufresne et
al. 2001). It is defined as the ratio of total liabilities over the sum of total liabilities and the market
value of equity; in order to be able to include more observations, in our most parsimonious model we
use a measure of leverage based only on accounting data (Leverage accounting), defined as the ratio of
total liabilities over total assets. We use total liabilities instead of total debt - which is often used in the
7
literature - because non-financial liabilities tend to have a higher seniority than debt (Welch 2011), and
thus play a relevant role on the credit risk for lenders. We control for firms dimension using the natural
logarithm of Total Assets in thousands of USD (LNTA), as bigger firms are usually found to face lower
costs of capital. The ratio of debt maturing within a year (short-term debt) over the sum of short and
long-term debt (SDTD) account for the borrower debt maturity structure, as firms with higher credit
quality tend to prefer short-term debt (Diamond 1991). The ratio of Intangible over Total Assets
(INTDA) is included to proxy for the quality of the collateral (from the lenders’ point of view) in case
of default (e.g. Lin et al. 2011). We control for firms operative performance using the Return on Assets,
defined as Net Income over Total Assets (ROA); we also include in our study the yearly percentage
growth of Net Sales (SG), as growth opportunities increase potential conflicts of interests between
shareholders and creditors (Myers 1977). All raw data for computing these variables come from
Worldscope, and are lagged 1 year to reduce endogeneity.
Following Sufi (2007), we control for the natural logarithm of 1 plus the number of previous loans in
Dealscan database to the same borrower (ln(1 + n° of loans)) to approximate for the information on the
firm held by potential lenders. Since an high level of ownership concentration can be associated with
Government ownership – especially in some countries5 – and given that Government ownership
significantly affects the cost of borrowing (Borisova and Megginson 2011), we also include a dummy
variable equal to 1 if the borrower is indicated in Dealscan as a Government entity or a Government-
owned enterprise (GOE) and 0 otherwise (Government).
2.2 Loans and lenders characteristics
We consider several deal characteristics typically included in all studies on bank loans. We control for:
the natural logarithm of the facility amount in USD (LNFA); the number of facilities in each package
(Number of facilities); the maturity expressed in months (Maturity); a dummy variable equal to 1 if the
loan is senior debt and 0 otherwise (Senior); three dummy variables equal to 1 if respectively; a) there
is a loan guarantor (Guarantor); b) the contract includes performance pricing clauses (Performance
Pricing); or c) financial covenants (Covenants), and 0 otherwise. A series of indicators is used to
control for the loan stated purpose. We follow Sufi (2007) and group purposes in 5 categories: Working
Capital and corporate purposes, Refinancing, Acquisitions, Backup line and Other. As in Ivashina
5 The incidence of GOEs is significantly (at 1% confidence level) higher in Europe and Asia than in the rest of our sample. GOEs exhibit a mean value of CHS of 0.582 while other firms average is 0.318, the difference being statistically significant at customary confidence levels.

8
(2009), we also include a dummy equal to 1 if the base rate is a prime rate and 0 otherwise (Prime
Rate).
Together with loans characteristics, we also control for few relevant aspects of the lending group; first,
we use a dummy variable equal to 1 if the loan is indicated as syndicate and 0 otherwise (Syndication);
as shown in Table 2, syndicate loans account for 73% of our sample. We include the number of lenders
(N° of lenders) and the percentage of loan retained by lead banks (Lead Share) because the level of
concentration in lead lenders increase the effectiveness of monitoring, but at the same time a more
disperse lending base allow to reduce the concentration of risk (e.g. Ivashina 2009). Finally, we use a
dummy variable to control for the lead lender6 and the borrower being from the same country (Same
Country), as foreign banks are associated on average with higher costs of debt (Qian and Strahan
2007).
2.3 Legal environment
Several studies (e.g. Esty and Megginson 2003; Qian and Strahan 2007; Bae and Goyal 2009) have
shown the relevance of laws on creditors protection in explaining cross-country differences in bank
loans structure and pricing. To account for this, we use Qian and Strahan (2007, QS hereafter) creditor
rights indicator for the borrower’s country of origin derived from La Porta, Lopez-de-Silanes, Shleifer
and Vishny (1997, LLSV hereafter) seminal paper on law and finance. For countries not considered in
QS work we use original values reported in LLSV. As customary, we also use several indicators for the
country legal framework, assigning each country to one of 6 possible law systems (English, French,
German, Islamic, Scandinavian and Socialist).
2.4 Market rates
Studies on loan pricing usually do not consider among explanatory variables the general level of
market interest rates and premia required by the market by the time the deal is settled. However, it
seems fair to assume that these affect the cost of debt in a way that simply using year indicators cannot
account for. To control for the term structure of interest rates, we use the value of the first three
principal components of the US Treasury yield curve as on the day the loan becomes active; these
components are usually thought of as representing the Level, Slope and Curvature of the yields term
structure (Litterman and Scheinkman 1991). To control for the Default Premium required by the
6 When more than one lead lender is present, we consider the one retaining the highest share.

9
market, we use the spread between the average yield on corporate bonds rated respectively Baa and
Aaa by Moody’s (e.g. Chen et al. 2009). All yields data are from the Federal Reserve website.7
[Insert Table 2 about here]
3 Insiders ownership concentration and the cost of debt
Within the agency theory framework, several different predictable effect of the separation between
ownership and control for firm’s stakeholders have been proposed. Surely, the conflict of interest most
investigated is the one between insiders on the one hand and minority shareholders on the other hand.
Two of the most prominent effects of the separation between ownership and control were already
discussed by Jensen and Meckling (1976): Tunneling and Asset Substitution (also referred to as risk
shifting).
Tunneling refers to “the transfer of resources out of a company to its controlling shareholder” (Johnson
et al. 2000; p. 22). It is expected to affect minority shareholders and creditors alike, and it is the more
likely the more the separation of ownership and control increase. An inverse relationship between
insiders ownership concentration and agency costs affecting creditors is thus expected; if the latter are
rational, they will make the shareholders bear the agency cost by asking higher interests on debt. As a
result, insiders ownership concentration is predicted to have a negative effect on the cost of debt.
A similar prediction is associated with asset substitution; as the fraction of firm’s capital held by
insiders decrease, they have an incentive toward riskier investments regardless of their net present
value, as they get a big upside potential without bearing financial losses if the investment fail. Debt
Overhang problems identified by Myers (1977) are just a particular application of the asset substitution
argument.
The negative relationship between insiders ownership concentration and cost of debt predicted by
tunneling and asset substitution arguments has received empirical validation from several studies: in
particular, Lin et al. (2011) focus on bank loans and show that the cost of debt increases with the wedge
between control and ownership and decreases with the cash flow right retained by insiders.
Theoretical works discussed so far make the implicit assumption that insiders have a full control of the
firm and its resources and that they cannot easily be substituted. However, if insiders own a small share
of equity, the Market for Corporate Control (e.g. Manne 1965; Scharfstein 1988; Stulz 1988) is likely
7 http://www.federalreserve.gov/releases/h15/data.htm#fn15

10
to exert a strong disincentive for insiders to extract private wealth, as external shareholders and even
creditors in particular instances might take control of the firm. Insiders thus need a certain minimum
level of ownership for the incentives toward tunneling and risk shifting not being overcompensated by
the thread of losing control over the firm. It is interesting to notice that, while asset substitution and
tunneling arguments see the interests of creditors and minority shareholders aligned, market for
corporate control depicts a different situation for the two classes of stakeholder. On the one hand, an
higher level of insiders ownership concentration translates into an higher premium paid in case of
takeover as long as control is disputable (e.g. Stulz 1988; Song and Walkling 1993). For low levels of
insiders ownership (i.e. when control is disputable), an increase in ownership concentration is thus
beneficial for minority shareholders.
On the other hand, creditors do not beneficiate from this increase in the value of shares. A decrease in
the disputability of control thus only translates for creditors into an higher likelihood of tunneling and
risk shifting. As such, market for corporate control predicts a positive relationship between insiders
ownership concentration and the strength of conflict of interests between insiders and creditors, which
in turns translate into a positive relationship between insiders ownership and the cost of debt.
The relevance of market for corporate control for firms creditors has received as well empirical
validation; for example, Klock et al. (2005) and Chava et al. (2009) show that anti-takeover provisions
reduce ceteris paribus bonds yields and loans spread respectively. More to the point, Cremers et al.
(2007) provide empirical evidence that ownership concentration is positively correlated with bonds
yields when the firm is exposed to takeovers. To the best of our knowledge, no study has assessed so
far how market for corporate control moderates the relationship between ownership structure and cost
of debt in the context of bank loans.
Asset substitution and tunneling on the one hand and market for corporate control on the other hand
thus predict opposite relationships between the level of insiders ownership concentration and the cost
of firms borrowing. Moreover, as discussed above, the latter becomes irrelevant when insiders
ownership concentration is high; on the contrary, asset substitution and risk shifting increase in
relevance when control is hardly disputable.
For this, we predict that insiders ownership concentration and cost of debt have an inverse U-shaped
relationship. When insiders ownership concentration is low, it positive correlate with the cost of debt
due to market for corporate control effects; the relationship becomes instead negative when insiders
ownership concentration is high, as asset substitution and tunneling concerns become more relevant.
11
3.1 Empirical evidence
To study empirically the relationship between insiders ownership and cost of debt, we formulate a
pricing model for the spread paid on bank loans which include both CHS and its square value (CHS^2)
among the determinants. We expect the coefficient for CHS^2 to be significant and negative, while the
coefficient for CHS should be positive and significant; the sum of the linear and quadratic effect of
CHS on loan spread characterizes a situation where CHS increase the cost of debt as long as an higher
CHS provide a stronger control to insiders; once CHS is high enough to grant insiders full control of the
firm, an increase in CHS should actually decrease the cost of debt, as insiders have lower incentives to
extract private benefits from the firm.
Following Lin et al. (2011) we use as dependent variable the natural logarithm of the all-in spread
drawn in bps;8 borrowers, loans, lenders, market rates and legal environment characteristics are the
control variables presented in Section 2. In all models we include indicators for the country of loan
origination because, as noted by Carey and Nini (2007), loans originated in Europe and Asia appear to
be characterized on average by lower spreads. As customary, we include also indicators for the
borrower industry (at 2-digit level SIC code) and for the year of loan issuance. Table 3 reports the OLS
coefficient estimation for different specifications of the model, together with their standard errors
robust to heteroskedasticity and clustered at firm level.
[Insert Table 3 about here]
Model (1) is the most parsimonious: we include as controls only the most relevant and frequently
available borrower characteristics (LNTA and Leverage accounting) and loans characteristics and
purpose, together with market interest rates and country, industry and year indicators. Model (2)
augments Model (1) by controlling for the structure of the lending group. In Model (3) we use the
market measure of borrower leverage (Leverage) and include additional borrower characteristics. In
Model (4) we control for government ownership and for the legal environment of the borrower country
of origin. Finally, in Model (5) we follow Qian and Strahan (2007) and exclude firms in the financial
and public sector industries (1-digit SIC codes 6 and 9) because their risks might be substantially
different from those of firms in other industries.
8 All presented empirical results are qualitatively similar when directly using the all-in-spread drawn without the logarithm transformation

12
For all models CHS and CHS^2 coefficients are respectively positive and negative and both highly
significant (at 0.1% confidence level), giving empirical confirmation that the relationship between
insiders ownership and cost of debt is non-monotonic; specifically, it is an inverse U-shaped
relationship, with cost of debt increasing in CHS when the latter is low and decreasing in CHS when
the latter is high. For example, when CHS is equal to 0.1 the marginal effect of an increase of CHS by
0.01 (i.e. 1%, from 10% to 11%) drives an increase of the spread by 0.45% – 0.64% depending on the
model, meaning an average increase of the spread of 0.75 – 1.05 bps. Conversely, when CHS is equal
to 0.9 an increase by 0.01 drives a reduction of the spread by 0.67% – 0.83% (1.10 – 1.35 bps). It is
interesting to state that the marginal effect of CHS on ln(spread) changes in sign for values of CHS of
43.1% – 49.3%, i.e. fairly close to the value of 50% after which an increase in ownership by insiders
does not grant them any additional control over the firm resources.9
Figure 1 represent graphically the relationship between CHS and the spread using Model (1) estimated
coefficients; to make results more easily interpretable in terms of cost of debt, we compute the non-
linear effect of CHS on the natural logarithm of the spread over the latter sample mean and reconvert
the predicted results in basis points.10 As can be seen, widely and closely held firms are those
exhibiting ceteris paribus the lowest cost of debt, while firms with an high degree of separation of
ownership and control but a sufficient ownership concentration as to avoid the pressure of potential
external raiders are those paying the highest cost of debt. Aside from statistical significance, the
estimated difference between this ownership structure and widely and closely held firm structures is
economically sizable: ceteris paribus, a firm where insiders own 43% – 49.3% of equity pays on
average 12.5% – 20% (or 20.5 – 32.5 bps) higher spreads on bank loans than a widely held firm and
21.5 – 22% (34 – 35.5 bps) higher than a firm where insiders hold all equity.
[Insert Figure 1 about here]
9 Indeed, for Model (1) a nonlinear Wald-type test does not reject the null hypothesis that the peak of the inverse U-shaped relationship between CHS and ln(spread) occurs for CHS equal to 0.5. Anyway, insiders actually needs less than 50% of equity to assure themselves a non-disputable control in most of the cases; it thus makes sense that the positive effect of the market for corporate control evanish before the 0.5 threshold. 10 i.e. ��������� = exp�ln(������)��������������� + ������� + ����^����^2 , where ln(������) is the sample mean of the natural logarithm of the all-in spread drawn.

13
3.2 Robustness checks on the functional form
We use three alternative approaches to provide further evidence of the inverse U-shaped relationship
between insiders ownership and loans spread.
First, we use a piecewise linear regression approach in the spirit of Morck et al. (1988), and substitute
the variable CHS with four variables, CHS0to0.1, CHS0.1to0.3, CHS0.3to0.5 and CHS0.5to1, defined
as in Equation 1
���0"#0.1 = &���, ��� < 0.10.1, ��� ≥ 0.1
(1)
���0.1"#0.3 = + 0, ��� < 0.1��� − 0.1, 0.1 ≤ ��� < 0.30.2, ��� ≥ 0.3
���0.3"#0.5 = + 0, ��� < 0.3��� − 0.3, 0.3 ≤ ��� < 0.50.2, ��� ≥ 0.5
���0.5"#1 = / 0, ��� < 0.5��� − 0.5, ��� ≥ 0.5
Thus, for example, if CHS is 0.4 we have CHS0to0.1 equal to 0.1, CHS0.1to0.3 equal to 0.2 and
CHS0.3to0.5 equal to 0.1. In this way each variable allows to capture the marginal effect of CHS for
each interval of CHS itself.
The second approach we use is simply to split our sample by values of CHS and then use a first order
model (i.e. including only CHS but not CHS^2 among regressors) for the cost of debt. We use the same
threshold for CHS as in the piecewise regression, namely 0.1, 0.3 and 0.5.
The choice of thresholds is somehow arbitrary but does not lack theoretical underpinning: 0.1 is the
threshold usually used in the literature to define “large” shareholders (e.g. La Porta et al. 1999; Laeven
and Levine 2008); 0.3 identifies in several countries the threshold for mandatory tender offers (e.g.
Dyck and Zingales 2004), implying it can be considered a level of ownership granting a control that
cannot be easily challenged; with an ownership by insiders higher than 50% of firm equity of course
control and ownership tend to overlap.11
Finally, we control in Model (3) for unobserved panel-level effects by using an Arellano and Bond
(1991) estimator, using for each firm-year the biggest deal in terms of facility amount. Also, we
11 In unreported analyses, we use alternative thresholds, dividing for example CHS by distribution quartiles. Results are qualitatively similar.
14
account for the potential endogeneity of the ownership structure by treating CHS as endogenous and
including among instruments the industrial (at 2-digits SIC code level) average of CHS in the spirit of
Laeven and Levine (2009). Of course, since: a) only one deal per firm-year can be considered; b)
ownership structure tend to be persistent and; c) not every borrower receive different loans in
subsequent years, this empirical strategy strongly shrink the usable sample. For this, we only consider
two subsamples (CHS < 0.3 and CHS > 0.5) to investigate the functional form of the relationship
between insiders ownership and cost of borrowing.
Table 4 reports the results for these alternative models specification. Model (1) reports results for the
piecewise regression, Model (2), (a) – (d) reports results for a first order model on split samples, using
CHS as main independent variable; Model (3), (i) and (ii) reports Arellano and Bond (1991)
estimations for the two subsamples considered. All models include also control variables used in Model
(1) of Table 3.12 To save space we do not report controlling variables coefficients; their sign, magnitude
and statistical significance is however largely aligned with results reported in Table 3. As can be
noticed, the inverse U-shaped relationship between CHS and spreads is confirmed: looking at Model
(1) coefficients, we can see that a 0.01 higher level of ownership concentration significantly (at 0.1%
confidence level) increase the spread on loans by 1.4% when CHS is lower than 0.1; when CHS is
between 0.1. and 0.3 the effect is still positive and statistically significant (at 5% confidence level) but
smaller in magnitude (the spread is 0.3% higher for an increase of 0.01 of CHS); between 0.3 and 0.5
we have a null marginal effect of CHS on loan spreads; finally, for values of CHS higher than 0.5 the
marginal effect becomes significantly (at 1% confidence level) negative, and an increase of 0.01 of
CHS is associated with a decrease of the spread by 0.3%. Model (2) coefficients draw a similar picture;
the marginal effect of CHS is positive and significant (at 5% confidence level) for values of CHS below
0.3 and negative and significant when CHS is higher than 0.5, while is negative and only marginally (at
10% confidence level) significant in between. Finally, Model (3) shows that the effect of CHS is
positive when CHS is lower than 0.3 and negative when it is higher than 0.5; coefficients for both
subsample are significant at 10% confidence level. We can thus find robust confirmation for the
predicted functional form.
[Insert Table 4 about here]
12 Of course Model (3) does not include country and industry effects, as they are time-invariant characteristics of the borrower.
15
4 The role of market for corporate control: additional evidence
Section 3 presents robust empirical evidence of the inverse U-shaped relationship between insiders
ownership and loans spread. In this Section we provide additional empirical evidence that market for
corporate control is actually responsible for the observed functional form for low levels of CHS. To do
so, we investigate how the presence of anti-takeover provisions moderate the effect of CHS on spreads;
if market for corporate control is the reason why we observe a positive effect, this should be strongly
reduced for firms presenting provisions making harder to challenge the control of exiting management.
To account for provisions protecting insiders from losing their control we use the Entrenchment Index
(“E Index”) proposed by Bebchuk, Cohen and Ferrell (2009, BCF hereafter).13 The E index is built
summing one point for each of the 6 corporate governance provisions – i.e. staggered boards, limits to
shareholder amendments of the by-laws, supermajority requirements for mergers, supermajority
requirements for charter amendments, poison pills and golden parachutes – identified by BCF as the
most relevant in explaining the effect of corporate governance on firms financial performances. The E
index thus varies between 0 and 6, where higher values identify an higher level of protection of insiders
from market for corporate control. Data on provisions are from the Investor Responsibility Research
Center (IRRC) reports. IRRC data are updated every 2-3 years, and each report covers 1,400-1,800 US
firms (BCF, 2009). As customary for studies based on IRRC data (e.g. Gompers et al. 2003), for
missing years we assign to the E index the last known value, as provisions at firm level tend to be quite
stable across time.
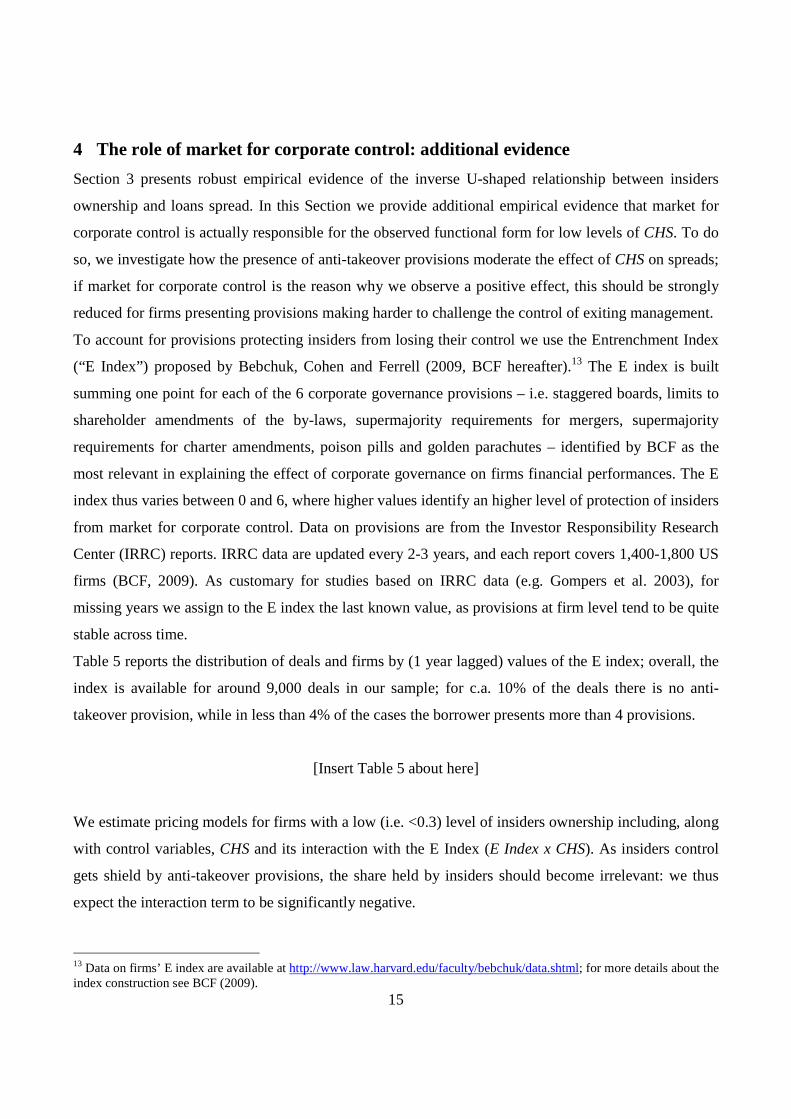
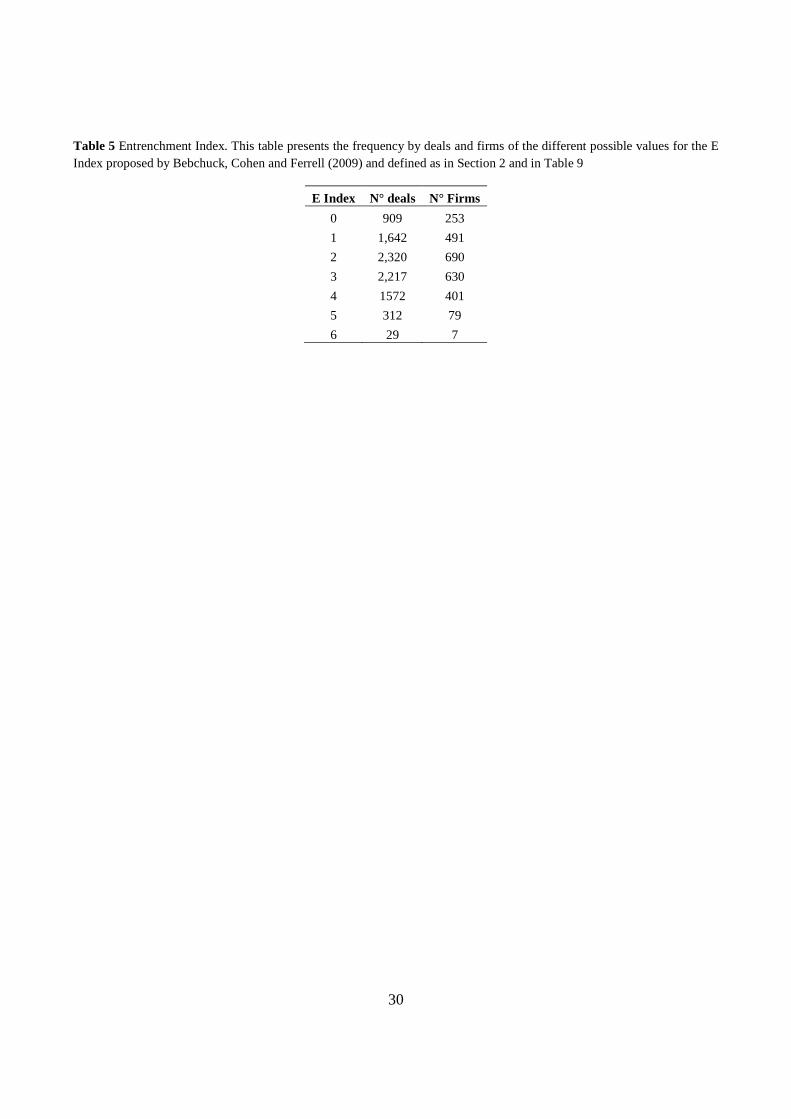
Table 5 reports the distribution of deals and firms by (1 year lagged) values of the E index; overall, the
index is available for around 9,000 deals in our sample; for c.a. 10% of the deals there is no anti-
takeover provision, while in less than 4% of the cases the borrower presents more than 4 provisions.
[Insert Table 5 about here]
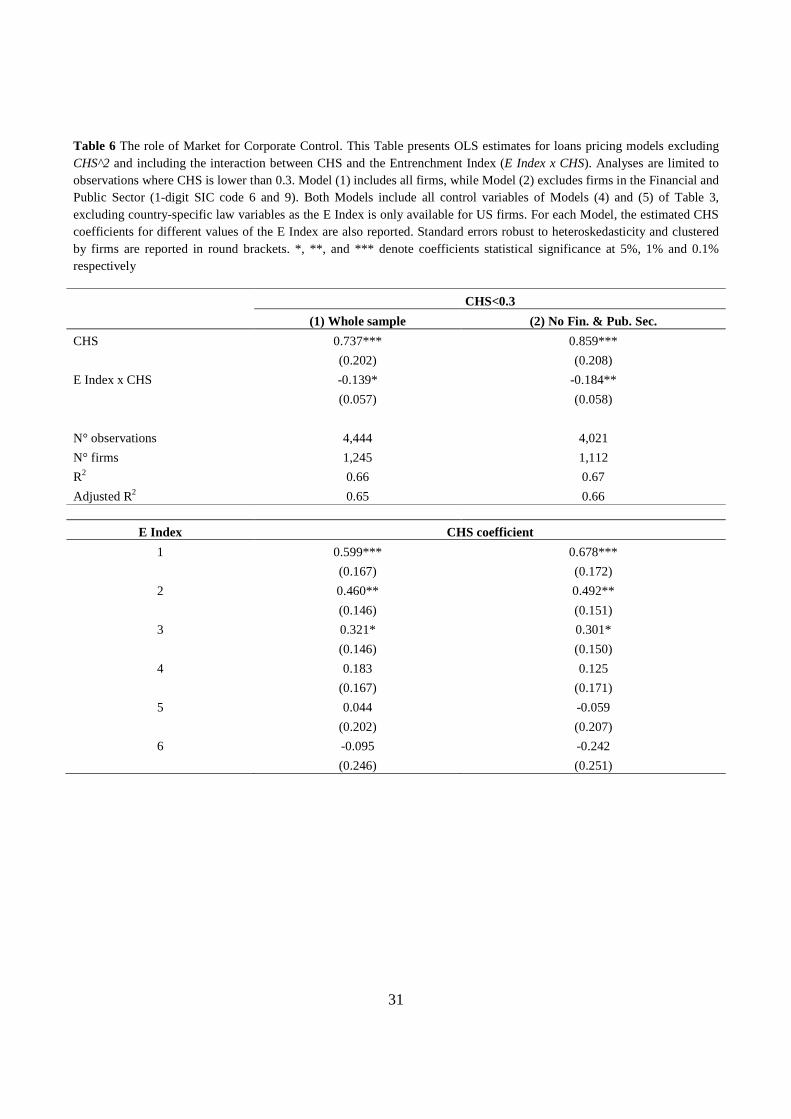
We estimate pricing models for firms with a low (i.e. <0.3) level of insiders ownership including, along
with control variables, CHS and its interaction with the E Index (E Index x CHS). As insiders control
gets shield by anti-takeover provisions, the share held by insiders should become irrelevant: we thus
expect the interaction term to be significantly negative.
13 Data on firms’ E index are available at http://www.law.harvard.edu/faculty/bebchuk/data.shtml; for more details about the index construction see BCF (2009).

16
Table 6 reports estimated coefficients as well as the combined coefficient for each level of the E Index.
Model (1) performs the analysis on the whole usable sample, while Model (2) excludes firms in the
financial and public sectors. Both Models include all the control variables used in Models (4) and (5) of
Table 4 but country-level law variables, as the E index is available only for US firms.14
As expected, the positive effect of CHS on the cost of debt is decreasing in the E index: while an
increase by 1% of CHS results in a 0.7% – 0.9% increase in the cost of debt when no anti-takeover
provision is present (significant at 0.1% confidence level), the relationship between CHS and cost of
debt is no longer statistically significant when the E index is 4 or higher. These results are coherent
with those by Cremers et al. (2007) on bonds yields, and confirms that market for corporate control
effects can indeed explain the verified positive marginal effect of insiders ownership on cost of loans.
[Insert Table 6 about here]
5 The role of capital structure
Capital structure is often considered to play a relevant role in moderating conflicts of interests between
shareholders and creditors (Hart 1995). Three main arguments can be used to explain why capital
structure might influence the relationship between insiders ownership and cost of debt.
First, Jensen (1986) predicts that debt reduce the potential for suboptimal use of firm’s capital by
manager by reducing the amount of free cash flow they can dispose of. Since interests and debt
repayments have an higher priority over investments or distribution of generated wealth to
shareholders, an high level of debt reduce the insiders degree of discretion over the use of firms
resources. In this sense, leverage should be expected to reduce the sensitivity of cost of debt to
separation of ownership and control for any level of the latter.
Second, for high levels of leverage, creditors are likely to have an higher control over the firm (e.g.
Burkart et al. 1997); this reduces the need for monitoring provided by the market for corporate control
and the potential for tunneling by insiders.
Finally, an high leverage reduce the effectiveness of market for corporate control because it reduces the
likelihood of a takeover (e.g. Novaes 2002).
14 To address concerns about a potential selection bias, in unreported analysis we re-estimated our quadratic Models (4) and (5) presented in Table 4 using only observations where the E index is available. The inverse U-shaped functional form is confirmed. Notice that country of origination controls are still included as not all loans to US borrowers are originated in the US.
17
All in all, all these theoretical arguments predict a relevant moderating role of leverage on the conflict
of interest between inside shareholders and creditor linked to the separation of ownership and control.
Leverage is expected to decrease the sensitivity of cost of debt to ownership concentration, as insiders
have lower discretion on the use of firms resources; but also to increase the relevance of risk shifting
and tunneling for low levels of insiders ownership, as market for corporate control effects should be
strongly mitigated.
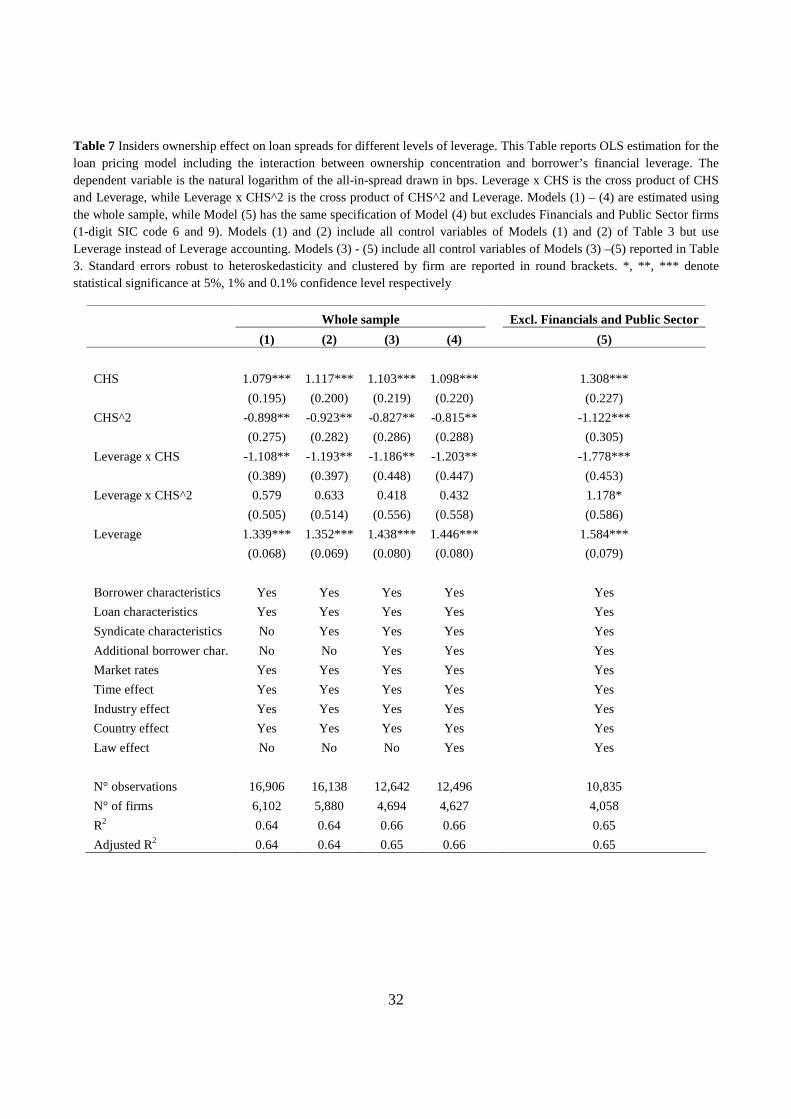
To study empirically the effect of leverage on the relationship between ownership concentration on cost
of debt, we introduce in our pricing models two interaction variables (Leverage x CHS and Leverage x
CHS^2) representing the cross product between Leverage and CHS and CHS^2 respectively.
Results are reported in Table 7; control variables included in Models (1) – (5) are the same used for
models (1) – (5) in Table 3. The only exception is that, given the scope of these analyses, we use
Leverage instead of Leverage accounting also in Models (1) and (2). Since we are studying a quadratic
model with interaction terms, coefficients interpretation is more easily done by looking at the
relationship between CHS and spreads for different level of leverage depicted graphically in Figure 2.
Table 7 coefficients however confirm us that capital structure plays a relevant role in moderating this
relationship: the coefficient for Leverage x CHS is statistically significant at 0.1% confidence level in
all model specifications; also the coefficient for Leverage x CHS^2 is statistically significant (at 5%
confidence level) when financial and public sector firms are excluded (Model (5)); CHS and CHS^2
coefficients still exhibit the same sign and statistical significance as in Table 3.
[Insert Table 7 about here]
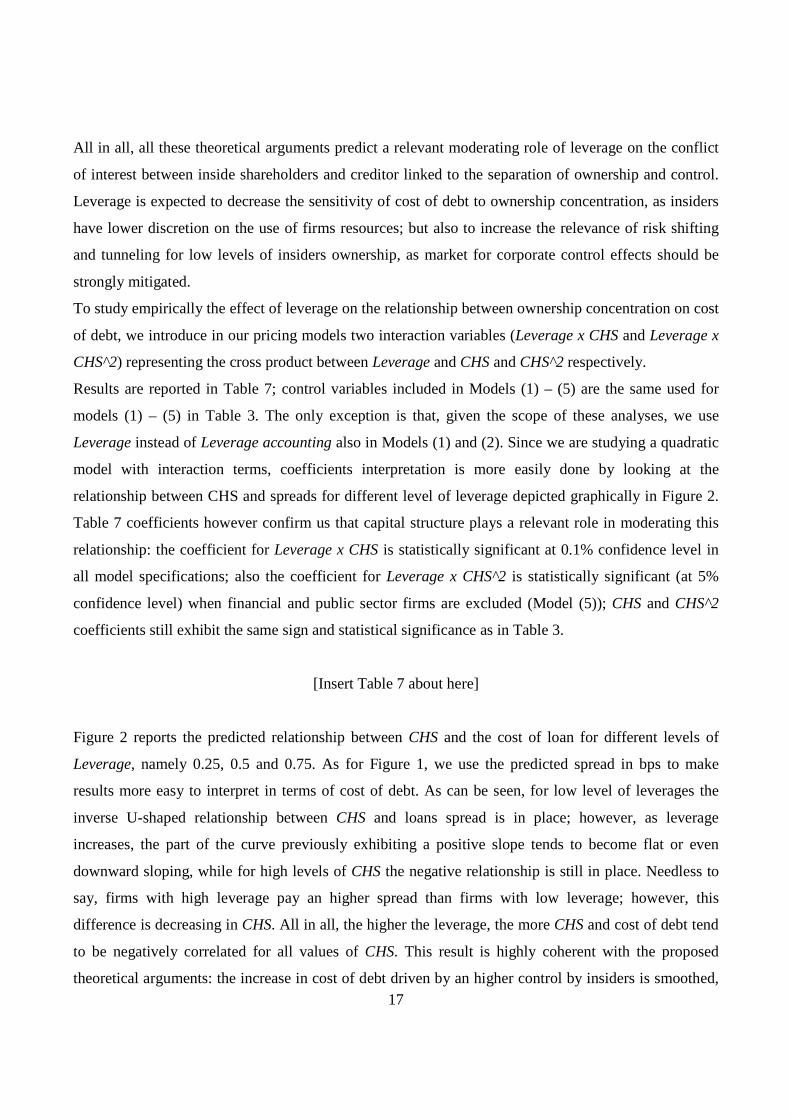
Figure 2 reports the predicted relationship between CHS and the cost of loan for different levels of
Leverage, namely 0.25, 0.5 and 0.75. As for Figure 1, we use the predicted spread in bps to make
results more easy to interpret in terms of cost of debt. As can be seen, for low level of leverages the
inverse U-shaped relationship between CHS and loans spread is in place; however, as leverage
increases, the part of the curve previously exhibiting a positive slope tends to become flat or even
downward sloping, while for high levels of CHS the negative relationship is still in place. Needless to
say, firms with high leverage pay an higher spread than firms with low leverage; however, this
difference is decreasing in CHS. All in all, the higher the leverage, the more CHS and cost of debt tend
to be negatively correlated for all values of CHS. This result is highly coherent with the proposed
theoretical arguments: the increase in cost of debt driven by an higher control by insiders is smoothed,
18
as market for corporate control becomes irrelevant; while mitigated, the potential for tunneling and risk
shifting becomes the only effect in place, driving toward a (negative) monotonic relationship between
insiders ownership concentration and cost of debt.
[Insert Figure 2 about here]
6 The role of loan contract clauses
One of the most investigated topic in the literature on bank loans, especially syndicated loans, is how
the presence of asymmetric information and agency costs influence the loan characteristics and
syndicate structure (e.g. Qian and Strahan 2007; Ivashina 2009; Lin et al. 2012). In this section we
explore to what extent two main classes of provisions, namely financial covenants and performance
pricing, are effective in moderating the effect of insiders ownership concentration on the cost of debt.
Both financial covenants and performance pricing are common clauses in bank loans contracts;15 they
link the ongoing of the loan contract terms to the borrower credit quality, usually measured in terms of
credit rating or interest coverage. The main difference between these two class of provisions is that if
performance requirements are not satisfied, financial covenants give the right to the lender to call the
loan; on the contrary, performance pricing clauses set ex-ante a change in the interest paid by the
borrower in case of a deterioration (or improvement) of her financial performances (Asquith et al.
2005). Performance pricing clauses have being introduced relatively recently, and have become popular
especially in the syndicate loan market: this is because the break of financial covenants by the
borrower, while giving the lender the right to call the debt, actually result in the bulk of cases in a
renegotiation (e.g. Asquith et al. 1994). This process can be very costly, especially if several lenders
(like in the case of syndicate loans) are involved. The expected cost of this process is usually
transferred to the borrower in terms of higher spreads.16
On the other hand, performance pricing provisions require to set ex-ante the cost (or premium) for the
borrower to deviate from the agreed credit quality; this might prove a hard task, as it requires to
estimate not only the likelihood that credit quality will change for exogenous reasons, but also: a) the
potential change in incentives for the manager to extract private benefits at the expense of creditors and
b) the risk premia the market will require in the future. Thus, as conditions change, performance 15 Financial covenants and performance pricing provisions appear in 39% and 29% of our sample respectively, as Table 2 shows. 16 Indeed, our analyses reported in Table 4 show a significant positive effect of the presence of financial covenants on the cost of loans. Ivashina (2009) finds similar results.

19
pricing might prove not an effective deterrent for insiders; contract renegotiation allowed by financial
covenants, while more costly, allows lenders to require the new agreement to reflect the new conditions
by the time the negotiation is made. Thus, it seems fair to expect financial covenants to be more
effective in reducing the effect of ownership retained by insiders on the cost of debt.
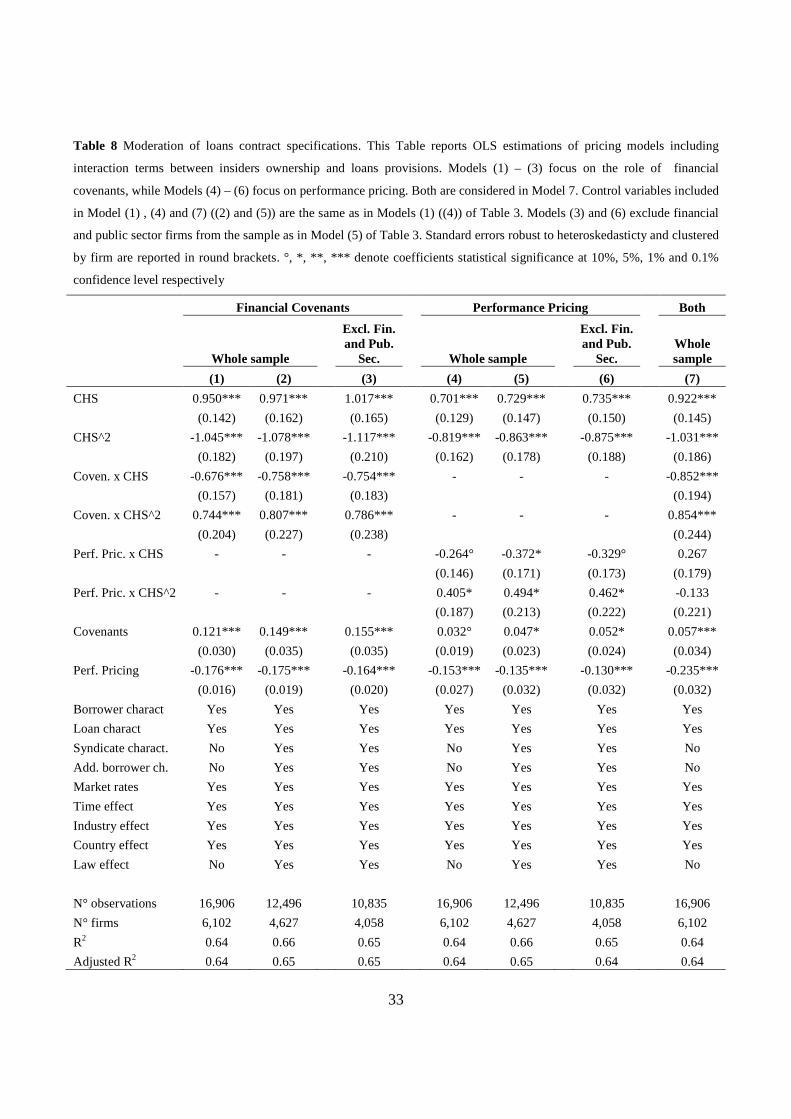
To test this hypothesis, we follow the same empirical strategy adopted in Sections 4 and 5 and include
in our pricing model for loans the cross product of CHS and CHS^2 with Covenants (Covenants x CHS
and Covenants x CHS^2) and Performance Pricing (Performance Pricing x CHS and Performance
Pricing x CHS^2).
Table 8 reports the estimated coefficients for these models. Models (1) – (3) include the two cross
products with Financial Covenants; Model (1) is specified as Model (1) of Table 3, using Leverage
instead of Leverage accounting; Model (2) use all the control variables of Model (4) of Table 3, while
Model (3) is as Model (2) but estimated excluding financial and public sector firms; Model (4) – (6) are
similarly specified for Performance Pricing; finally, Model (7) account for both clauses typologies
moderating effect and use the same controls as Models (1) and (4).
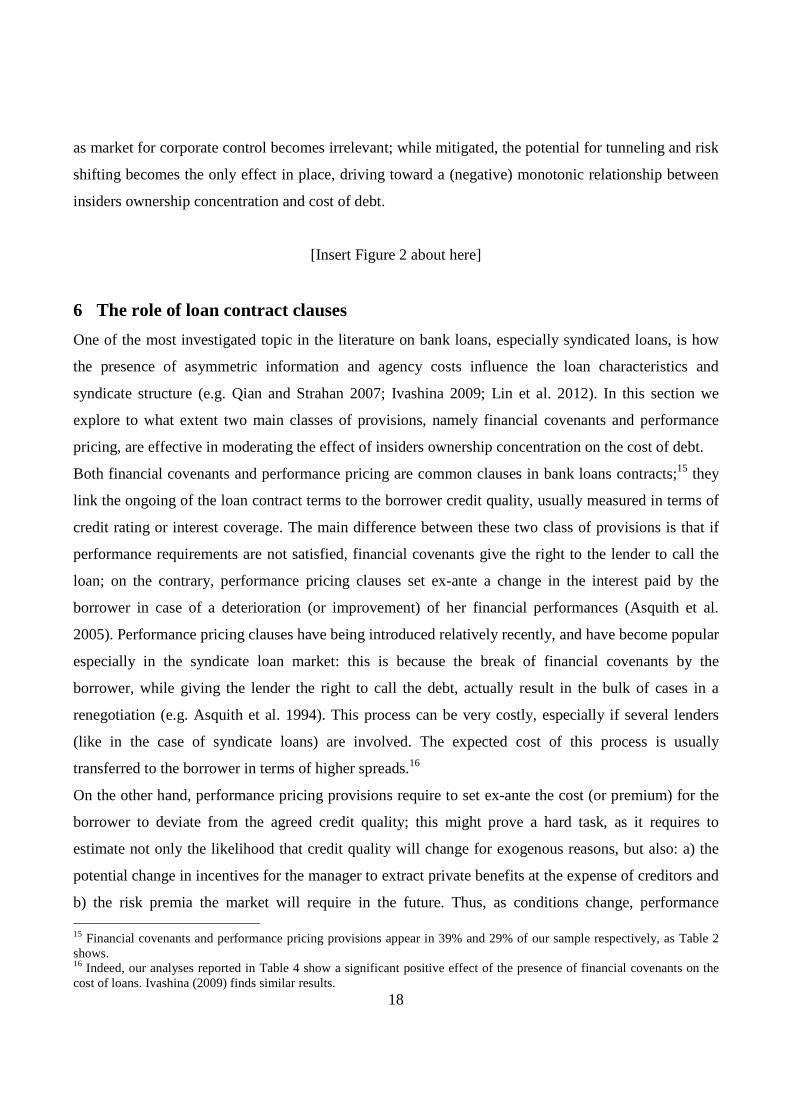
Models (1) – (3) and (7) show how the presence of financial covenants strongly reduces the impact of
insiders ownership on cost of debt: the coefficient for CHS is reduced by 0.68 – 0.85 (depending on the
model) when financial covenants are present, while the coefficient for CHS^2 is increased by 0.74 –
0.85; both effects are sizable compared to estimated coefficients for CHS and CHS^2 and statistically
significant at 0.1% confidence level. Altogether, financial covenants appear to strongly flatten the
relationship between CHS and cost of debt especially for low levels of the former, as Figure 3 well
illustrates. This result is coherent with those by Lin et al. (2012), who find loans covenants effective in
reducing the effect of the wedge between control and cash flow rights on the cost of debt. Model (4) –
(6) show that, while the sign of the interaction terms coefficients for performance pricing are the same,
they are both smaller and less statistically significant than those for financial covenants. Moreover,
when controlling for both clauses in Model (7), coefficients for Performance Pricing interaction with
CHS are no longer significant (albeit close to significance).
[Insert Table 8 about here]
Figure 3 represents the effect of insiders ownership on cost of debt in presence of contract provisions.
While performance pricing is on average related to lower costs of debt, it does not significantly reduce
the sensitivity of cost of debt to the share retained by insiders. On the contrary, financial covenants
20
strongly moderate this relationship. While more costly, financial covenants thus appear to be more
effective in reducing the agency costs associated with a separation of ownership concentration. This
can explain why they are still preferred by lenders to performance pricing provisions in debt contracts
(Asquith et al. 2005).
[Insert Figure 3 about here]
7 Conclusions
In this paper we investigate the relationship between the level of ownership retained by insiders and the
firms cost of bank debt. Tunneling and asset substitution arguments on the one hand and market for
corporate control on the other hand are associated with opposite predictions on the relationship between
these two variables. Market for corporate control predicts a positive correlation between insiders
ownership and agency costs for creditors; on the contrary, asset substitution and tunneling predict a
negative correlation. As the former effect is stronger for low levels of insiders ownership, we suggest
and find empirical evidence that the insiders ownership and cost of debt exhibit an inverse U-shaped
relationship. When insider ownership is low, its increase is detrimental for creditors, who thus requires
higher interest rates; when insiders ownership is high, its increase is associated with a reduction of the
cost of debt. This non-monotonic effect of insiders ownership on the cost of debt is confirmed after
several robustness checks and is economically meaningful: ceteris paribus, on average a firm where
insiders own 40% – 50% of equity pay 33bps (36) higher spreads than a widely (closely) held firm. The
positive correlation for low levels of insiders ownership is not in place for firms characterized by
multiple anti-takeovers provisions, confirming the key contribute by market for corporate control to the
verified functional form.
We then turn our attention toward the moderating role of capital structure; an higher leverage reduce
free cash flow to equity and the relevance of market for corporate control. The cumulate effect is that,
while of course firms with an higher leverage pay on average higher spreads, the difference in spreads
between highly and lowly-levered firms is ceteris paribus bigger for low levels of insiders ownership
concentration.
Finally, we investigate whether financial covenants and performance pricing provisions are effective in
moderating the relationship between insiders ownership and cost of capital. Financial covenants are
associated on average with an higher cost of debt because of costly debt renegotiation. However, they
are also more effective in reducing the sensitivity of cost of debt to insiders ownership, as they do not

21
require to set ex-ante the cost for managers to deviate from the optimal behavior (from creditors
perspective).
Our findings reconcile some pieces of empirical evidence reported in previous studies: Bhorjarj and
Sengupta (2003) for example find ownership concentration to increase bond yields, while Lin et al.
(2011) and Klock et al. (2005) find a negative effect of ownership concentration on the cost of debt.
We show that both direction are plausible, with one or the other prevailing depending on the level of
ownership concentration, leverage and on corporate governance mechanisms.
It is interesting to notice that our results are in stark contrast with those of the literature on ownership
structure and the value of equity (e.g. Wright et al. 1996). These studies provide empirical evidence
that conflicts of interest between insiders and minority shareholders decrease (increase) with ownership
concentration when the latter is low (high). Our results suggest that the opposite holds when creditors
instead of minority shareholders are considered.
Future research shall model altogether the non-monotonic effect of ownership structure on the value of
equity and debt, in order to estimate how much of the value created for one stakeholder with a
particular ownership structure comes at the expense of the other.
Acknowledgments for helpful suggestions and discussions, we would like to thank Fabio Bertoni, Veljko Fotak, Peter Jan
Engelen, Clemens Kool, Bill Megginson and seminar participants at the Utrecht University School of Economics.
22
References
Arellano M, Bond S (1991) Some tests of specification for panel data: Monte Carlo evidence and an application to employment equations. Rev Econ Stud 58:277–297
Asquith P, Beatty A, Weber J (2005) Performance pricing in bank debt contracts. J Account Econ 40:101–128
Asquith P, Gertner R, Scharfstein D (1994) Anatomy of financial distress: An examination of junk-bond issuers. Q J Econ 109:625–658
Bae, KH, Goyal VK (2009) Creditor rights, enforcement, and bank loans. J Finance 64:823–860
Bebchuk L, Cohen A, Ferrell A (2009) What matters in corporate governance? Rev Financ Stud 22:783–827
Billett MT, King THD, Mauer DC (2004) Bondholder wealth effects in mergers and acquisitions: New evidence from the 1980s and 1990s. J Finance 59:107–135
Borisova G, Megginson WL (2011) Does government ownership affect the cost of debt? Evidence from privatization. Rev Financ Stud 24:2693–2737
Bhojraj S, Sengupta P (2003) The effect of corporate governance mechanisms on bond ratings and yields: The role of institutional investors and outside directors. J Bus 76:455–75
Burkart, M, Gromb D, Panunzi F (1997) Large shareholders, monitoring, and the value of the firm. Q J Econ 112:693–728
Carey M, Nini G (2007) Is the corporate loan market globally integrated? A pricing puzzle. J Finance 62:2969–3007
Chava S, Livdan D, Purnanandam A (2009) Do shareholders rights affect the cost of bank loans? Rev Financ Stud 22:2973–3004
Chen L, Collin-Dufresne P, Goldstein RS (2009) On the relation between the credit spread puzzle and the equity premium puzzle. Rev Financ Stud 22:3367–3409
Claessens S, Djankov S, Fan JPH, Lang LHP (2002) Disentangling the incentive and entrenchment effects of large shareholdings. J Finance 57:2741–2771
Collin-Dufresne P, Goldstein RS, Martin JS (2001) The determinants of credit spreads changes. J Finance 56:2177–2208
Cremers KJM, Nair VB (2005) Governance mechanisms and equity prices. J Finance 60: 2859–2894
Cremers KJM., Nair VB, Wei C (2007) Governance mechanisms and bond prices. Rev Financ Stud 20:1359–1388
Diamond DW (1991) Debt maturity structure and liquidity risk. Q J Econ 106: 709–737
Dyck A, Zingales L (2004) Private benefits of control: An international comparison. J Finance 59:537–600
Doidge C, Karolyi GA, Stulz RM (2007) Why do countries matter so much for corporate governance? J Financ Econ 86:1–39
Esty BC, Megginson WL (2003) Creditor rights, enforcement, and debt ownership structure: Evidence from the global syndicated loan market. J Financ Quant Anal 38:37–59

23
Faccio M, Lang L (2001) The ultimate ownership of Western European corporations. J Financ Econ 65:365–395
Faccio M, Lang L, Young L (2001) Dividends and Expropriation. Am Econ Rev 91:54–78
Gatev E, Strahan PE (2009) Liquidity risk and syndicate structure. J Financ Econ 93:490–504
Gompers P, Ishii J, Metrick A (2003) Corporate governance and equity prices. Q J Econ 118:107–155
Grossman SJ, Hart OD (1986) The costs and benefits of ownership: A theory of vertical and lateral integration. J Polit Econ 94:691–719
Hart OD (1995) Corporate governance: Some theory and implication. Econ J 105:678–689
Hart OD, Moore J (1990) Property rights and the nature of the firm. J Polit Econ 98:1119–1158
Ivashina V (2009) Asymmetric information effects on loan spreads. J Financ Econ 92:300–319
Jensen MC (1986) Agency costs of free cash flow, corporate finance, and takeovers. Am Econ Rev 76:323–329
Jensen MC, Meckling WH (1976) Theory of the firm: Managerial behavior, agency costs and ownership structure. J Financ Econ 3:305–360
Johnson S, La Porta R, Lopez-de-Silanes F, Shleifer A (2000) Tunneling. Am Econ Rev 90:22–27
Klock, MS, Mansi SA, Maxwell WF (2005) Does corporate governance matter to bondholders? J Financ Quant Anal 40:693–719
Laeven L, Levine R (2008) Complex ownership structures and corporate valuations. Rev Financ Stud 21:579–604
Laeven L, Levine R (2009) Bank governance, regulation and risk taking. J Financ Econ 93:259–275
La Porta, R, Lopez-De-Silanes F, Shleifer A, Vishny RW (1997) Legal Determinants of External Finance. J Finance 52:1131–1150
La Porta R, Lopez-de-Silanes F, Shleifer A (1999) Corporate ownership around the World. J Finance 54:471–517
Lin C, Ma Y, Malatesta P, Xuan Y (2011) Ownership structure and the cost of corporate borrowing. J Financ Econ 100:1–23
Lin C, Ma Y, Malatesta P, Xuan Y (2012) Corporate ownership structure and bank loan syndicate structure. J Financ Econ 104:1–22
Litterman RB, Scheinkman J (1991) Common factors affecting bond returns. J Fixed Income 1:54–61
Manne HG (1965) Mergers and the market for corporate control. J Polit Econ 73:110–120
Mattes JA, Steffen S, Wahrenburg M (2013) Do information rents in loan spreads persist over the business cycles? J Financ Serv Res 43:175–195
Mitton T (2002) A cross-firm analysis of the impact of corporate governance on the East Asian financial crisis. J Financ Econ 64:215–241
Morck R, Shleifer A, Vishny RW (1988) Management ownership and market valuation : An empirical analysis. J Financ Econ 20:293–315
Myers SC (1977) Determinants of corporate borrowing. J Financ Econ 5:147–175
Novaes W (2002) Managerial turnover and leverage under a takeover threat. J Finance 57: 2619–2650
24
Qian J, Strahan PE (2007) How laws and institutions shape financial contracts: The case of bank loans. J Finance 62:2803–2834
Roberts G, Yuan LE (2010) Does institutional ownership affect the cost of bank borrowing? J Econ Bus 62:604–626
Saunders A, Steffen S (2011) The costs of being private: Evidence from the loan market. Rev Financ Stud 24:4091–4122
Scharfstein D (1988) The disciplinary role of takeovers. Rev Econ Stud 55:185–199
Shleifer A Vishny RW (1986) Large shareholders and corporate control. J Polit Econ 3:461–488
Shleifer A Vishny RW (1997) A survey of corporate governance. J Finance 52:737–783
Song MH, Walkling RA (1993) The impact of managerial ownership on acquisition attempts and target shareholder wealth. J Financ Quant Anal 28:439–457
Stulz R (1988) Managerial control of voting rights : Financing policies and the market for corporate control. J Financ Econ 20:25–54
Sufi A (2007) Information asymmetry and financing arrangements: Evidence from syndicated loans. J Finance 62:629–668
Thomsen S, Pedersen T, Kvist HK (2006) Blockholder ownership: Effects on firm value in market and control based governance systems. J Corp Finance 12:246–269
Warga A, Welch I (1993) Bondholder losses in leveraged buyouts. Rev Financ Stud 6:959–982
Welch I (2011) Two common problems in capital structure research: The financial-debt-to-asset ratio and issuing activity versus leverage changes. Int Rev Finance 11:1–17
Wright P, Ferris SP, Sarin A Awasthi V (1996) Impact of corporate insider, blockholder, and institutional equity ownership on firm risk taking. Acad Manage J 39:441–463
25
Table 1 Sample distribution by year and country. This Table present the yearly sample distribution of observations where at least information about the borrower country, sector and total assets is available. Geographical distribution refers to the percentage of deals by borrowing firms’ country
Year N° of deals N° of borrowing firms Geographical distribution
Europe Asia USA Other
1996 701 604 6.85% 14.27% 68.76% 10.13%
1997 2,204 1,594 5.26% 15.34% 71.96% 7.44%
1998 1,953 1,439 6.71% 14.90% 73.84% 4.56%
1999 2,233 1,647 9.36% 17.69% 67.53% 5.42%
2000 2,333 1,699 10.24% 21.86% 61.77% 6.13%
2001 2,294 1,669 8.50% 21.14% 60.46% 9.90%
2002 2,346 1,746 8.57% 27.37% 59.38% 4.69%
2003 2,404 1,744 8.36% 28.29% 59.07% 4.28%
2004 2,393 1,836 10.45% 22.23% 62.56% 4.76%
2005 2,443 1,796 12.32% 25.67% 55.06% 6.96%
2006 2,171 1,691 10.92% 23.63% 58.36% 7.09%
2007 2,125 1,575 8.75% 29.08% 54.82% 7.34%
2008 1,428 1,122 10.36% 28.71% 50.42% 10.50%
2009 843 734 10.32% 25.74% 58.01% 5.93%
2010 83 70 18.07% 45.78% 27.71% 8.43%
All dataset 27,954 8,334 9.17% 22.88% 61.40% 6.54%
26
Table 2 Descriptive statistics. Table 2 reports descriptive statistics for variables included in this study. All variables are as
defined in Section 2 and in Table 9
Percentile
Characteristics Variable N Mean Std. Dev. 25th 50th 75th
All-in spread drawn 20,732 163.82 139.68 57.5 125 240
Borrower CHS 23,035 0.32 0.27 0.10 0.26 0.52
Leverage 25,431 0.51 0.27 0.29 0.49 0.75
Leverage accounting 27,954 0.66 0.32 0.48 0.64 0.86
LNTA 27,954 14.26 2.22 12.66 14.18 15.95
SDTD 26,790 0.33 0.32 0.06 0.23 0.53
SG 25,036 0.23 0.69 0.01 0.11 0.25
INTA 24,114 0.13 0.17 0 0.04 0.19
ROA 27,547 0.01 0.24 0.01 0.03 0.06
Government 27,954 0.01 0.11 0 0 0
ln(1 + n° loans) 27,954 1.32 1.3 0 1.1 1.79
Loan LNFA 27,951 18.46 1.65 17.28 18.6 19.58
N° of facilities 27,954 1.4 0.84 1 1 2
Maturity 26,975 44.88 36.06 23 36 60
Guarantor 27,954 0.07 0.26 0 0 0
Performance Pricing 27,954 0.29 0.45 0 0 1
Covenants 27,954 0.39 0.49 0 0 1
Senior 27,954 0.98 0.12 1 1 1
Prime Rate 27,954 0.39 0.49 0 0 1
Loan purpose Corporate Purpose/WC 27,954 0.57 0.49 0 1 1
Takeover/LBO 27,954 0.11 0.31 0 0 0
Refinancing 27,954 0.18 0.38 0 0 0
Backup line 27,954 0.05 0.22 0 0 0
Lenders Same Country 27,954 0.71 0.46 0 1 1
N° of lenders 26,256 7.16 8.36 1 4 10
Lead Share 26,256 13.86 27.28 0 0 15.89
Syndication 27,954 0.73 0.45 0 1 1
Market interest rates
Level 27,954 0.13 2.32 -1.77 0.29 2.21
Slope 27,954 -0.2 0.83 -0.94 -0.14 0.5
Curvature 27,954 -0.03 0.18 -0.15 -0.01 0.08
Default premium 27,954 0.94 0.38 0.72 0.86 1.03
Legal environment
Credit rights 27,502 1.56 1.01 1 1 2
English law 27,951 0.81 0.39 1 1 1
French law 27,951 0.06 0.24 0 0 0
German law 27,951 0.1 0.3 0 0 0
Islamic law 27,951 0 0.06 0 0 0
Scandinavian law 27,951 0.02 0.13 0 0 0
Socialist law 27,951 0.01 0.1 0 0 0
27
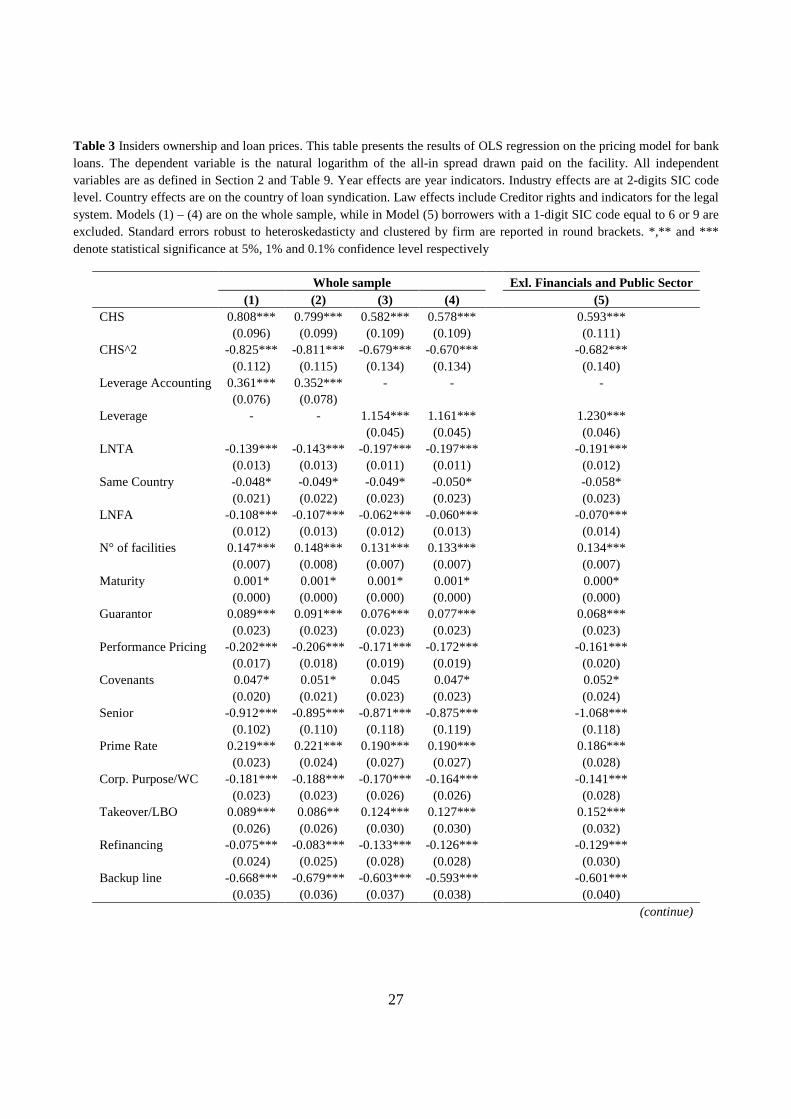
Table 3 Insiders ownership and loan prices. This table presents the results of OLS regression on the pricing model for bank loans. The dependent variable is the natural logarithm of the all-in spread drawn paid on the facility. All independent variables are as defined in Section 2 and Table 9. Year effects are year indicators. Industry effects are at 2-digits SIC code level. Country effects are on the country of loan syndication. Law effects include Creditor rights and indicators for the legal system. Models (1) – (4) are on the whole sample, while in Model (5) borrowers with a 1-digit SIC code equal to 6 or 9 are excluded. Standard errors robust to heteroskedasticty and clustered by firm are reported in round brackets. *,** and *** denote statistical significance at 5%, 1% and 0.1% confidence level respectively
Whole sample Exl. Financials and Public Sector (1) (2) (3) (4) (5) CHS 0.808*** 0.799*** 0.582*** 0.578*** 0.593***
(0.096) (0.099) (0.109) (0.109) (0.111) CHS^2 -0.825*** -0.811*** -0.679*** -0.670*** -0.682***
(0.112) (0.115) (0.134) (0.134) (0.140) Leverage Accounting 0.361*** 0.352*** - - -
(0.076) (0.078) Leverage - - 1.154*** 1.161*** 1.230***
(0.045) (0.045) (0.046) LNTA -0.139*** -0.143*** -0.197*** -0.197*** -0.191***
(0.013) (0.013) (0.011) (0.011) (0.012) Same Country -0.048* -0.049* -0.049* -0.050* -0.058*
(0.021) (0.022) (0.023) (0.023) (0.023) LNFA -0.108*** -0.107*** -0.062*** -0.060*** -0.070***
(0.012) (0.013) (0.012) (0.013) (0.014) N° of facilities 0.147*** 0.148*** 0.131*** 0.133*** 0.134***
(0.007) (0.008) (0.007) (0.007) (0.007) Maturity 0.001* 0.001* 0.001* 0.001* 0.000*
(0.000) (0.000) (0.000) (0.000) (0.000) Guarantor 0.089*** 0.091*** 0.076*** 0.077*** 0.068***
(0.023) (0.023) (0.023) (0.023) (0.023) Performance Pricing -0.202*** -0.206*** -0.171*** -0.172*** -0.161***
(0.017) (0.018) (0.019) (0.019) (0.020) Covenants 0.047* 0.051* 0.045 0.047* 0.052*
(0.020) (0.021) (0.023) (0.023) (0.024) Senior -0.912*** -0.895*** -0.871*** -0.875*** -1.068***
(0.102) (0.110) (0.118) (0.119) (0.118) Prime Rate 0.219*** 0.221*** 0.190*** 0.190*** 0.186***
(0.023) (0.024) (0.027) (0.027) (0.028) Corp. Purpose/WC -0.181*** -0.188*** -0.170*** -0.164*** -0.141***
(0.023) (0.023) (0.026) (0.026) (0.028) Takeover/LBO 0.089*** 0.086** 0.124*** 0.127*** 0.152***
(0.026) (0.026) (0.030) (0.030) (0.032) Refinancing -0.075*** -0.083*** -0.133*** -0.126*** -0.129***
(0.024) (0.025) (0.028) (0.028) (0.030) Backup line -0.668*** -0.679*** -0.603*** -0.593*** -0.601***
(0.035) (0.036) (0.037) (0.038) (0.040) (continue)
28
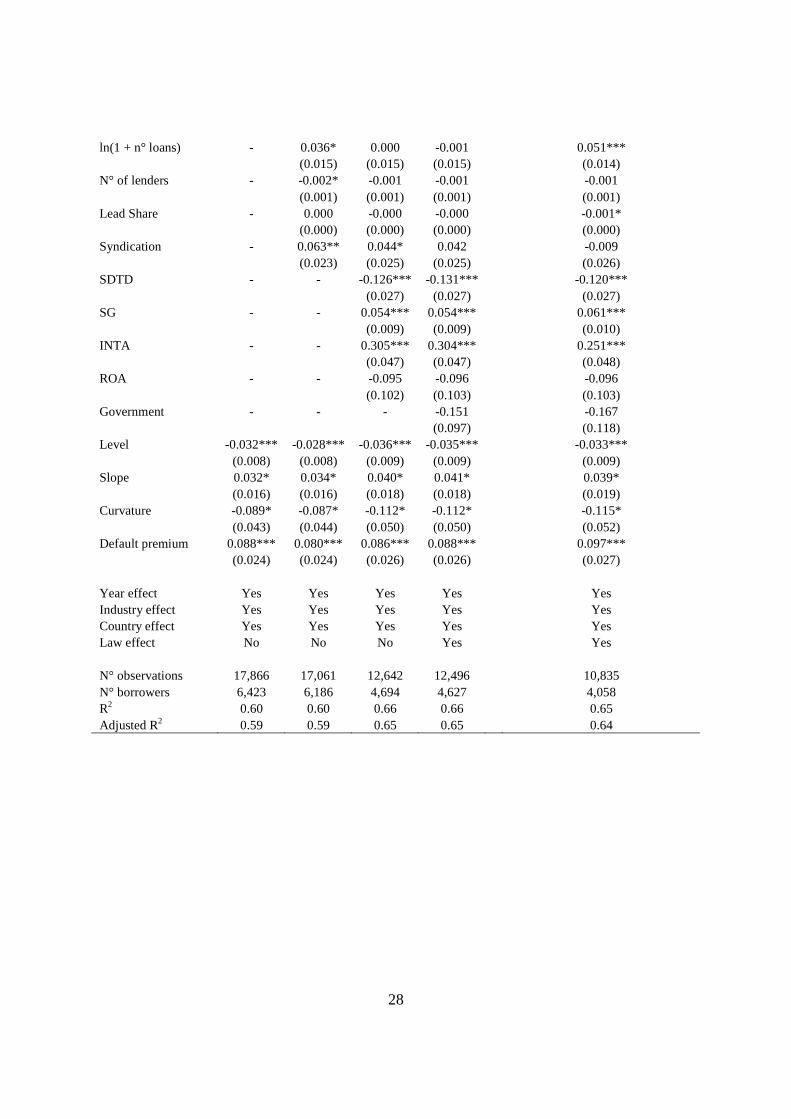
ln(1 + n° loans) - 0.036* 0.000 -0.001 0.051*** (0.015) (0.015) (0.015) (0.014)
N° of lenders - -0.002* -0.001 -0.001 -0.001 (0.001) (0.001) (0.001) (0.001)
Lead Share - 0.000 -0.000 -0.000 -0.001* (0.000) (0.000) (0.000) (0.000)
Syndication - 0.063** 0.044* 0.042 -0.009 (0.023) (0.025) (0.025) (0.026)
SDTD - - -0.126*** -0.131*** -0.120*** (0.027) (0.027) (0.027)
SG - - 0.054*** 0.054*** 0.061*** (0.009) (0.009) (0.010)
INTA - - 0.305*** 0.304*** 0.251*** (0.047) (0.047) (0.048)
ROA - - -0.095 -0.096 -0.096 (0.102) (0.103) (0.103)
Government - - - -0.151 -0.167 (0.097) (0.118)
Level -0.032*** -0.028*** -0.036*** -0.035*** -0.033*** (0.008) (0.008) (0.009) (0.009) (0.009)
Slope 0.032* 0.034* 0.040* 0.041* 0.039* (0.016) (0.016) (0.018) (0.018) (0.019)
Curvature -0.089* -0.087* -0.112* -0.112* -0.115* (0.043) (0.044) (0.050) (0.050) (0.052)
Default premium 0.088*** 0.080*** 0.086*** 0.088*** 0.097*** (0.024) (0.024) (0.026) (0.026) (0.027)
Year effect Yes Yes Yes Yes Yes Industry effect Yes Yes Yes Yes Yes Country effect Yes Yes Yes Yes Yes Law effect No No No Yes Yes
N° observations 17,866 17,061 12,642 12,496 10,835 N° borrowers 6,423 6,186 4,694 4,627 4,058 R2 0.60 0.60 0.66 0.66 0.65 Adjusted R2 0.59 0.59 0.65 0.65 0.64
29
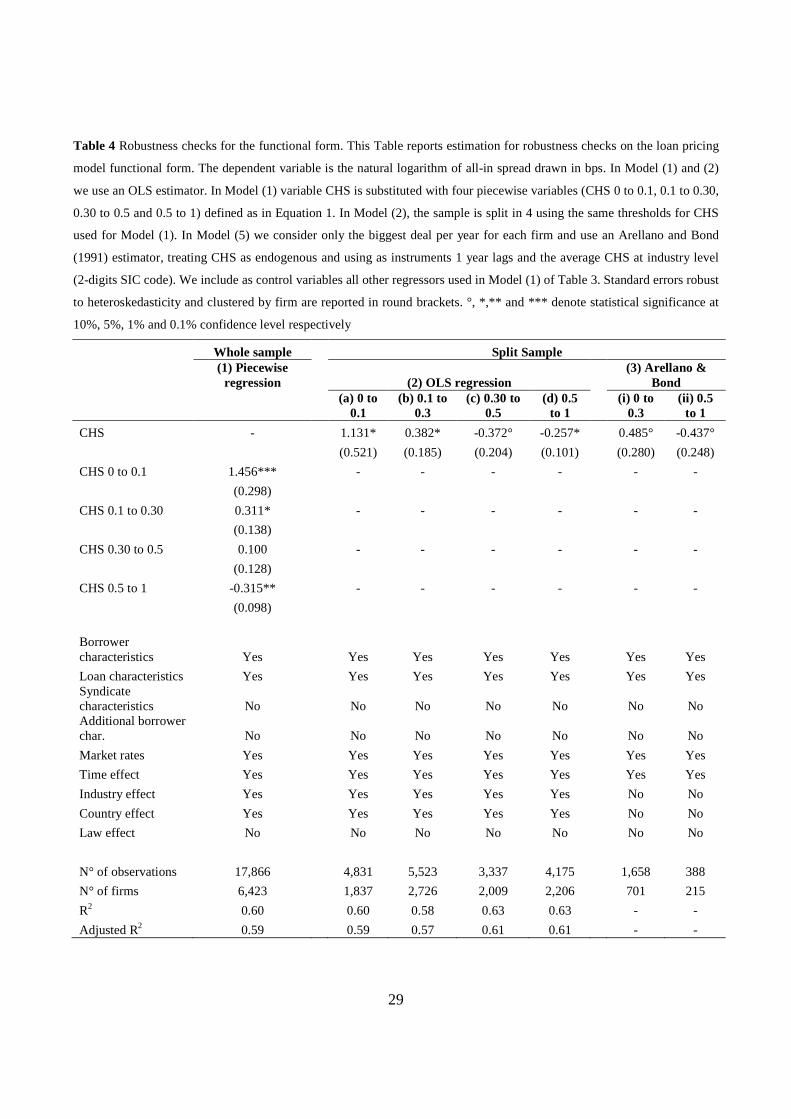
Table 4 Robustness checks for the functional form. This Table reports estimation for robustness checks on the loan pricing
model functional form. The dependent variable is the natural logarithm of all-in spread drawn in bps. In Model (1) and (2)
we use an OLS estimator. In Model (1) variable CHS is substituted with four piecewise variables (CHS 0 to 0.1, 0.1 to 0.30,
0.30 to 0.5 and 0.5 to 1) defined as in Equation 1. In Model (2), the sample is split in 4 using the same thresholds for CHS
used for Model (1). In Model (5) we consider only the biggest deal per year for each firm and use an Arellano and Bond
(1991) estimator, treating CHS as endogenous and using as instruments 1 year lags and the average CHS at industry level
(2-digits SIC code). We include as control variables all other regressors used in Model (1) of Table 3. Standard errors robust
to heteroskedasticity and clustered by firm are reported in round brackets. °, *,** and *** denote statistical significance at
10%, 5%, 1% and 0.1% confidence level respectively
Whole sample Split Sample (1) Piecewise
regression (2) OLS regression
(3) Arellano & Bond
(a) 0 to
0.1 (b) 0.1 to
0.3 (c) 0.30 to
0.5 (d) 0.5
to 1
(i) 0 to 0.3
(ii) 0.5 to 1
CHS - 1.131* 0.382* -0.372° -0.257*
0.485° -0.437°
(0.521) (0.185) (0.204) (0.101)
(0.280) (0.248)
CHS 0 to 0.1 1.456*** - - - -
- -
(0.298) CHS 0.1 to 0.30 0.311* - - - -
- -
(0.138) CHS 0.30 to 0.5 0.100 - - - -
- -
(0.128) CHS 0.5 to 1 -0.315** - - - -
- -
(0.098)
Borrower characteristics Yes Yes Yes Yes Yes
Yes Yes
Loan characteristics Yes Yes Yes Yes Yes
Yes Yes Syndicate characteristics No No No No No
No No Additional borrower char. No No No No No
No No
Market rates Yes Yes Yes Yes Yes
Yes Yes
Time effect Yes Yes Yes Yes Yes
Yes Yes
Industry effect Yes Yes Yes Yes Yes
No No
Country effect Yes Yes Yes Yes Yes
No No
Law effect No No No No No
No No
N° of observations 17,866 4,831 5,523 3,337 4,175
1,658 388
N° of firms 6,423 1,837 2,726 2,009 2,206
701 215
R2 0.60 0.60 0.58 0.63 0.63
- -
Adjusted R2 0.59 0.59 0.57 0.61 0.61 - -
30
Table 5 Entrenchment Index. This table presents the frequency by deals and firms of the different possible values for the E Index proposed by Bebchuck, Cohen and Ferrell (2009) and defined as in Section 2 and in Table 9
E Index N° deals N° Firms
0 909 253
1 1,642 491
2 2,320 690
3 2,217 630
4 1572 401
5 312 79
6 29 7
31
Table 6 The role of Market for Corporate Control. This Table presents OLS estimates for loans pricing models excluding CHS^2 and including the interaction between CHS and the Entrenchment Index (E Index x CHS). Analyses are limited to observations where CHS is lower than 0.3. Model (1) includes all firms, while Model (2) excludes firms in the Financial and Public Sector (1-digit SIC code 6 and 9). Both Models include all control variables of Models (4) and (5) of Table 3, excluding country-specific law variables as the E Index is only available for US firms. For each Model, the estimated CHS coefficients for different values of the E Index are also reported. Standard errors robust to heteroskedasticity and clustered by firms are reported in round brackets. *, **, and *** denote coefficients statistical significance at 5%, 1% and 0.1% respectively
CHS<0.3
(1) Whole sample (2) No Fin. & Pub. Sec.
CHS 0.737*** 0.859***
(0.202) (0.208)
E Index x CHS -0.139* -0.184**
(0.057) (0.058)
N° observations 4,444 4,021
N° firms 1,245 1,112
R2 0.66 0.67
Adjusted R2 0.65 0.66
E Index CHS coefficient
1 0.599*** 0.678***
(0.167) (0.172)
2 0.460** 0.492**
(0.146) (0.151)
3 0.321* 0.301*
(0.146) (0.150)
4 0.183 0.125
(0.167) (0.171)
5 0.044 -0.059
(0.202) (0.207)
6 -0.095 -0.242
(0.246) (0.251)
32
Table 7 Insiders ownership effect on loan spreads for different levels of leverage. This Table reports OLS estimation for the loan pricing model including the interaction between ownership concentration and borrower’s financial leverage. The dependent variable is the natural logarithm of the all-in-spread drawn in bps. Leverage x CHS is the cross product of CHS and Leverage, while Leverage x CHS^2 is the cross product of CHS^2 and Leverage. Models (1) – (4) are estimated using the whole sample, while Model (5) has the same specification of Model (4) but excludes Financials and Public Sector firms (1-digit SIC code 6 and 9). Models (1) and (2) include all control variables of Models (1) and (2) of Table 3 but use Leverage instead of Leverage accounting. Models (3) - (5) include all control variables of Models (3) –(5) reported in Table 3. Standard errors robust to heteroskedasticity and clustered by firm are reported in round brackets. *, **, *** denote statistical significance at 5%, 1% and 0.1% confidence level respectively
Whole sample Excl. Financials and Public Sector
(1) (2) (3) (4) (5)
CHS 1.079*** 1.117*** 1.103*** 1.098***
1.308***
(0.195) (0.200) (0.219) (0.220)
(0.227)
CHS^2 -0.898** -0.923** -0.827** -0.815**
-1.122***
(0.275) (0.282) (0.286) (0.288)
(0.305)
Leverage x CHS -1.108** -1.193** -1.186** -1.203**
-1.778***
(0.389) (0.397) (0.448) (0.447)
(0.453)
Leverage x CHS^2 0.579 0.633 0.418 0.432
1.178*
(0.505) (0.514) (0.556) (0.558)
(0.586)
Leverage 1.339*** 1.352*** 1.438*** 1.446***
1.584***
(0.068) (0.069) (0.080) (0.080)
(0.079)
Borrower characteristics Yes Yes Yes Yes
Yes
Loan characteristics Yes Yes Yes Yes
Yes
Syndicate characteristics No Yes Yes Yes
Yes
Additional borrower char. No No Yes Yes
Yes
Market rates Yes Yes Yes Yes
Yes
Time effect Yes Yes Yes Yes
Yes
Industry effect Yes Yes Yes Yes
Yes
Country effect Yes Yes Yes Yes
Yes
Law effect No No No Yes
Yes
N° observations 16,906 16,138 12,642 12,496
10,835
N° of firms 6,102 5,880 4,694 4,627
4,058
R2 0.64 0.64 0.66 0.66
0.65
Adjusted R2 0.64 0.64 0.65 0.66 0.65
33
Table 8 Moderation of loans contract specifications. This Table reports OLS estimations of pricing models including
interaction terms between insiders ownership and loans provisions. Models (1) – (3) focus on the role of financial
covenants, while Models (4) – (6) focus on performance pricing. Both are considered in Model 7. Control variables included
in Model (1) , (4) and (7) ((2) and (5)) are the same as in Models (1) ((4)) of Table 3. Models (3) and (6) exclude financial
and public sector firms from the sample as in Model (5) of Table 3. Standard errors robust to heteroskedasticty and clustered
by firm are reported in round brackets. °, *, **, *** denote coefficients statistical significance at 10%, 5%, 1% and 0.1%
confidence level respectively
Financial Covenants Performance Pricing Both
Whole sample
Excl. Fin. and Pub.
Sec. Whole sample
Excl. Fin. and Pub.
Sec. Whole sample
(1) (2) (3) (4) (5) (6) (7)
CHS 0.950*** 0.971*** 1.017*** 0.701*** 0.729*** 0.735***
0.922***
(0.142) (0.162) (0.165) (0.129) (0.147) (0.150)
(0.145)
CHS^2 -1.045*** -1.078*** -1.117*** -0.819*** -0.863*** -0.875***
-1.031***
(0.182) (0.197) (0.210) (0.162) (0.178) (0.188)
(0.186)
Coven. x CHS -0.676*** -0.758*** -0.754*** - - -
-0.852***
(0.157) (0.181) (0.183)
(0.194)
Coven. x CHS^2 0.744*** 0.807*** 0.786*** - - -
0.854***
(0.204) (0.227) (0.238)
(0.244)
Perf. Pric. x CHS - - - -0.264° -0.372* -0.329°
0.267
(0.146) (0.171) (0.173)
(0.179)
Perf. Pric. x CHS^2 - - - 0.405* 0.494* 0.462*
-0.133
(0.187) (0.213) (0.222)
(0.221)
Covenants 0.121*** 0.149*** 0.155*** 0.032° 0.047* 0.052* 0.057***
(0.030) (0.035) (0.035) (0.019) (0.023) (0.024) (0.034)
Perf. Pricing -0.176*** -0.175*** -0.164*** -0.153*** -0.135*** -0.130*** -0.235***
(0.016) (0.019) (0.020) (0.027) (0.032) (0.032) (0.032)
Borrower charact Yes Yes Yes Yes Yes Yes
Yes
Loan charact Yes Yes Yes Yes Yes Yes
Yes
Syndicate charact. No Yes Yes No Yes Yes
No
Add. borrower ch. No Yes Yes No Yes Yes
No
Market rates Yes Yes Yes Yes Yes Yes
Yes
Time effect Yes Yes Yes Yes Yes Yes
Yes
Industry effect Yes Yes Yes Yes Yes Yes
Yes
Country effect Yes Yes Yes Yes Yes Yes
Yes
Law effect No Yes Yes No Yes Yes
No
N° observations 16,906 12,496 10,835 16,906 12,496 10,835
16,906
N° firms 6,102 4,627 4,058 6,102 4,627 4,058
6,102
R2 0.64 0.66 0.65 0.64 0.66 0.65
0.64
Adjusted R2 0.64 0.65 0.65 0.64 0.65 0.64 0.64
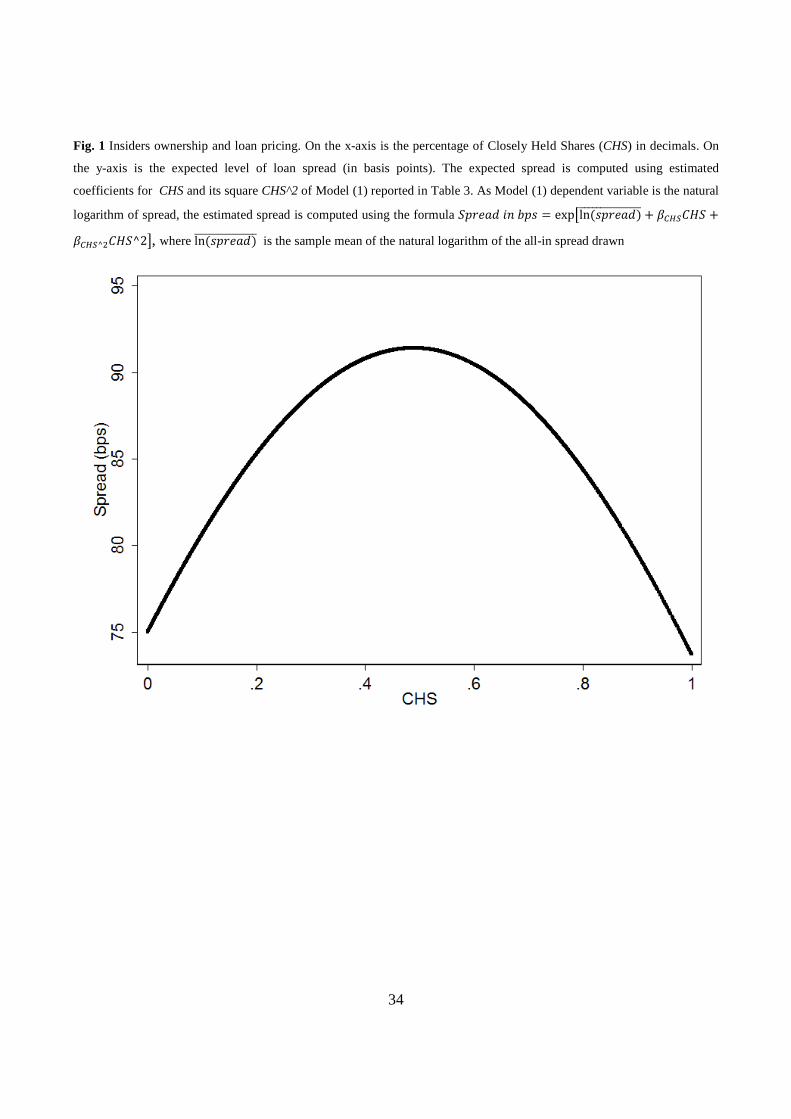
34
Fig. 1 Insiders ownership and loan pricing. On the x-axis is the percentage of Closely Held Shares (CHS) in decimals. On
the y-axis is the expected level of loan spread (in basis points). The expected spread is computed using estimated
coefficients for CHS and its square CHS^2 of Model (1) reported in Table 3. As Model (1) dependent variable is the natural
logarithm of spread, the estimated spread is computed using the formula ��������� = exp�ln(������)��������������� + ������� +����^����^2 , where ln(������)��������������� is the sample mean of the natural logarithm of the all-in spread drawn
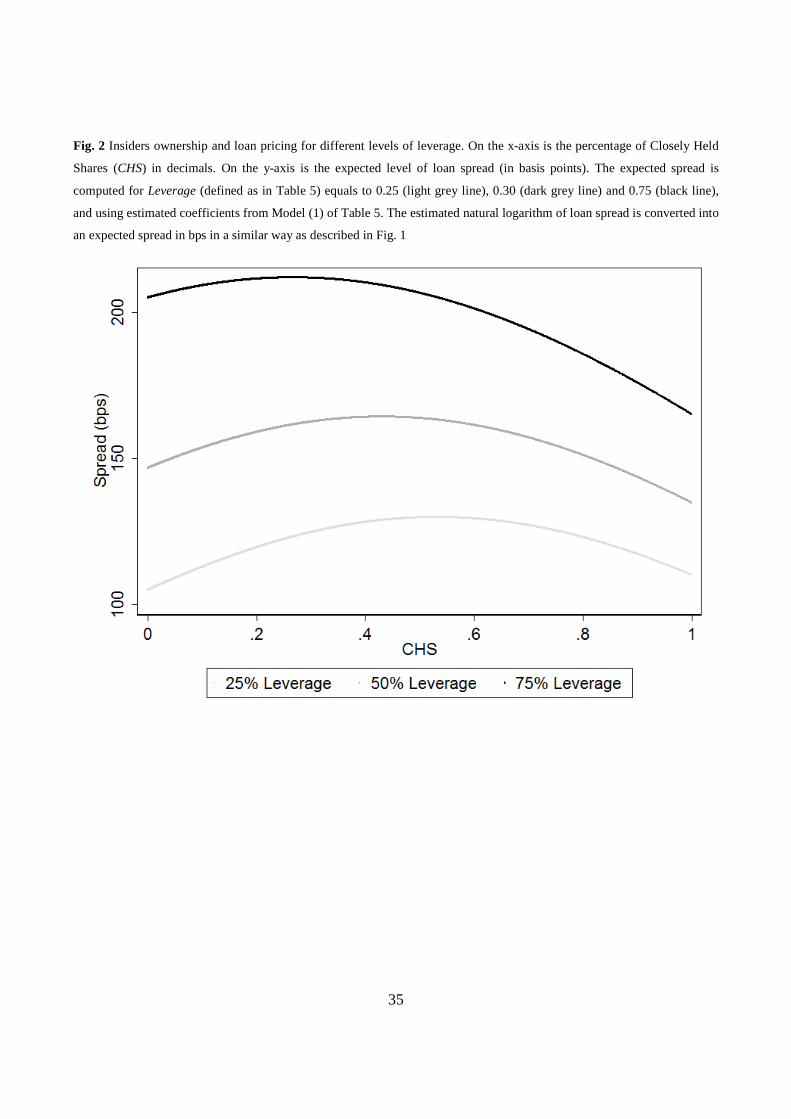
35
Fig. 2 Insiders ownership and loan pricing for different levels of leverage. On the x-axis is the percentage of Closely Held
Shares (CHS) in decimals. On the y-axis is the expected level of loan spread (in basis points). The expected spread is
computed for Leverage (defined as in Table 5) equals to 0.25 (light grey line), 0.30 (dark grey line) and 0.75 (black line),
and using estimated coefficients from Model (1) of Table 5. The estimated natural logarithm of loan spread is converted into
an expected spread in bps in a similar way as described in Fig. 1
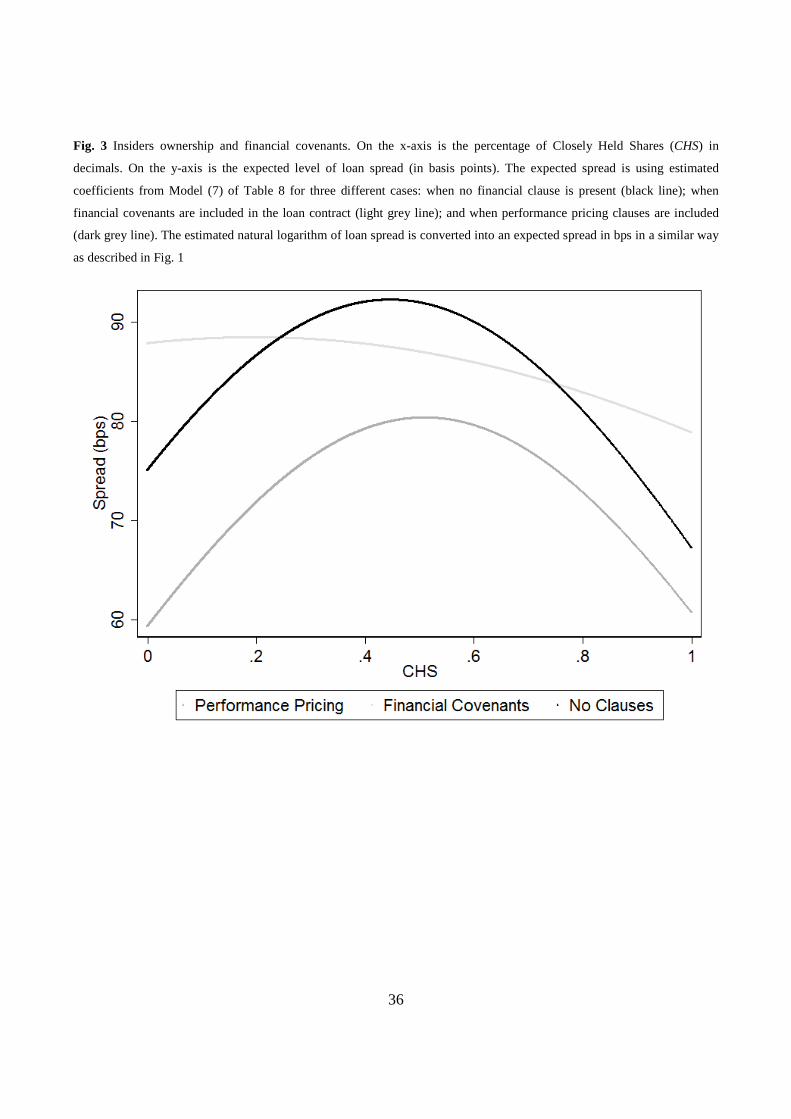
36
Fig. 3 Insiders ownership and financial covenants. On the x-axis is the percentage of Closely Held Shares (CHS) in
decimals. On the y-axis is the expected level of loan spread (in basis points). The expected spread is using estimated
coefficients from Model (7) of Table 8 for three different cases: when no financial clause is present (black line); when
financial covenants are included in the loan contract (light grey line); and when performance pricing clauses are included
(dark grey line). The estimated natural logarithm of loan spread is converted into an expected spread in bps in a similar way
as described in Fig. 1

37
Appendix Table 9 Variables definition. This table reports definition and source of all variables included in this study Variable Definition Source All-in spread drawn The total annual cost, including a set of fees and fixed spread, paid for each
amount effectively used under the loan commitment. Expressed as a spread in basis points over the reference rate
Dealscan
CHS Closely Held Shares. It's the percentage (in decimals) of total equity held by: officers, directors and their immediate families; trusts; any other corporation; pension/benefit plans; individuals who hold 5% or more of the outstanding shares
Worldscope
Leverage Total Liabilities/(Market Capitalization + Total Liabilities) Worldscope
Leverage accounting Total Liabilities/Total Assets Worldscope
LNTA ln(Total Assets in USD) Worldscope
SDTD Short-term Debt/(Short-term Debt + Long-term Debt) Worldscope
SG Sales Growth; it is the percentage yearly increase (in decimals) of Net Sales Worldscope
INTA Intangible Assets/Total Assets Worldscope
ROA Net Income/Total Assets Worldscope
Government A dummy equal to 1 if the borrower is indicated as a governmental entity or a fully or partially Government-owned enterprise and 0 otherwise
Dealscan
LNFA ln(Facility Ammount in USD) Dealscan
N° of facilities Number of facilities in each deal Dealscan
Maturity Facility matuirty expressed in months Dealscan
Guarantor A dummy variable equal to 1 there is a loan guarantor and 0 otherwise Dealscan
Performance Pricing A dummy variable equal to 1 if the loan cotract includes performance pricing and 0 otherwise
Dealscan
Covenants A dummy variable equal to 1 if the loan contract includes financial covenants and 0 otherwise
Dealscan
Senior A dummy variable equal to 1 if the loan is senior and 0 otherwise Dealscan
Prime Rate A dummy variable equal to 1 if the interest rate is a prime rate and 0 otherwise Dealscan
Corporate Purpose/WC A dummy variable equal to 1 if the loan purpose is corporate or working capital and 0 otherwise
Dealscan
Takeover/LBO A dummy variable equal to 1 if the loan purpose is a takeover or a levered buy-out
Dealscan
Refinancing A dummy variable equal to 1 if the loan purpose is refinancing maturing debt and 0 otherwise
Dealscan
Backup line A dummy variable if the loan purpose is a backup line and 0 otheriwse Dealscan
(continue)
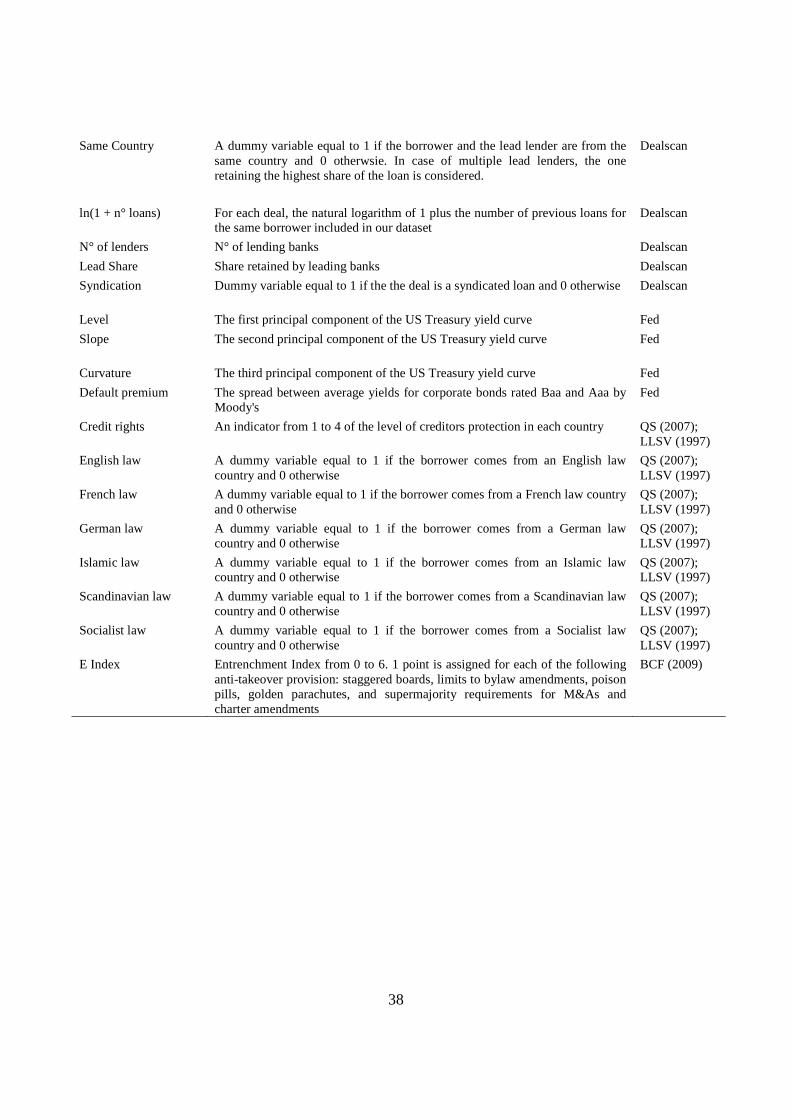
38
Same Country A dummy variable equal to 1 if the borrower and the lead lender are from the same country and 0 otherwsie. In case of multiple lead lenders, the one retaining the highest share of the loan is considered.
Dealscan
ln(1 + n° loans) For each deal, the natural logarithm of 1 plus the number of previous loans for the same borrower included in our dataset
Dealscan
N° of lenders N° of lending banks Dealscan
Lead Share Share retained by leading banks Dealscan
Syndication Dummy variable equal to 1 if the the deal is a syndicated loan and 0 otherwise Dealscan
Level The first principal component of the US Treasury yield curve Fed
Slope The second principal component of the US Treasury yield curve Fed
Curvature The third principal component of the US Treasury yield curve Fed
Default premium The spread between average yields for corporate bonds rated Baa and Aaa by Moody's
Fed
Credit rights An indicator from 1 to 4 of the level of creditors protection in each country QS (2007); LLSV (1997)
English law A dummy variable equal to 1 if the borrower comes from an English law country and 0 otherwise
QS (2007); LLSV (1997)
French law A dummy variable equal to 1 if the borrower comes from a French law country and 0 otherwise
QS (2007); LLSV (1997)
German law A dummy variable equal to 1 if the borrower comes from a German law country and 0 otherwise
QS (2007); LLSV (1997)
Islamic law A dummy variable equal to 1 if the borrower comes from an Islamic law country and 0 otherwise
QS (2007); LLSV (1997)
Scandinavian law A dummy variable equal to 1 if the borrower comes from a Scandinavian law country and 0 otherwise
QS (2007); LLSV (1997)
Socialist law A dummy variable equal to 1 if the borrower comes from a Socialist law country and 0 otherwise
QS (2007); LLSV (1997)
E Index Entrenchment Index from 0 to 6. 1 point is assigned for each of the following anti-takeover provision: staggered boards, limits to bylaw amendments, poison pills, golden parachutes, and supermajority requirements for M&As and charter amendments
BCF (2009)


![Ownership, Concentration, Convergence: Google [2010-11]](https://img.pdfslide.us/doc/110x75/559a5fac1a28abc41d8b4751/ownership-concentration-convergence-google-2010-11.jpg)