Embed Size (px)
Citation preview

The cost of Australia’s bulk grain export supply chainsA postscript
Version 2014.1

The cost of Australia’s bulk grain export supply chainsA postscript
Written by Ross Kingwell, Chris Carter and Peter White
May 2014
All contents copyright © AEGIC. All rights reserved.
The related bodies corporate, directors and employees of AEGIC accept no liability whatsoever for any injury, loss, claim, damage, incidental or consequential damage, arising out of, or in any way connected with, the use of any information, or any, error, omission or defect in the information contained in this publication. Whilst every care has been taken in the preparation of this publication AEGIC accepts no liability for the accuracy of the information supplied.
3 Baron-Hay Court South Perth Western Australia 6151 P: +61 8 9368 3785 E: [email protected]
aegic.org.au
ACN 160 912 032

1
Contents
Key points 2
Introduction 3
New infrastructure investments 3
Quattro Grain: Port Kembla (NSW) 3
Bunge: Bunbury (WA) 3
Heilongjiang Feng Agricultural: Albany (WA) 3
Implications 3
Australia’s grain supply chain costs in perspective 4
Historical comparison 4
The impact of Australia’s low density of grain production 4
The impact of Australia’s volatility of grain production 6
Australia’s path dependency impacts on supply chain costs 7

2
The cost of Australia’s bulk grain export supply chainsA postscript
Key points
• New grain export port facilities will become available at Bunbury (WA) and Port Kembla (NSW).
• Export grain supply chain costs currently are a lesser proportion of the wheat FOB price than was the case in the late 1980s.
• The low spatial density of grain production in Australia increases Australia’s export grain supply chain costs relative to other grain exporting nations.
• Australia’s marked climate variability leads to under-utilisation of storage and freight infrastructure. The costs of under-utilisation add to the costliness of Australia’s export grain supply chains.
• Some path dependencies lessen the cost efficiency of Australia’s export grain supply chains. Some historical investments in freight and storage facilities now weaken the current cost-efficiency of Australia’s export grain supply chains.

3
Introduction
The AEGIC report The cost of Australia’s bulk grain export supply chains: An information paper, released in early 2014, heightened discussion about the nature and costs of Australia’s export grain supply chains and stimulated further review of various features and parts of those supply chains.
The purpose of this postscript is firstly to update some of the information in the report, as a result of recent announcements of new major investments in grain supply chain infrastructure. Secondly, the postscript explains why some parts of Australia’s export grain supply chains are seemingly costly.
The report The cost of Australia’s bulk grain export supply chains: An information paper, is available at www.aegic.org.au/programs/gppf.aspx
New infrastructure investments
Quattro Grain: Port Kembla (NSW)
As announced at the end of March 2014, Qube Holdings will invest $50 million in a joint venture with Hong Kong based agricultural group Noble to build a new export grain terminal at Port Kembla. The joint venture includes arrangements with two major grain traders, Cargill Australia and Emerald Grain, and has involved raising $200 million in a private placement of stock at $2.12 per share.
The chair of Qube Holdings is Chris Corrigan, former managing director of Patrick Corporation prior to its take-over in 2006. The export terminal at Port Kembla will be known as Quattro Grain and it is expected to commence exporting up to 1.3 million tonnes of grain annually, starting midway through 2016.
Quattro Grain will directly compete against GrainCorp’s terminal at Port Kembla. Noble will use Qube’s rail services on a “take or pay” basis and the grain traders Emerald and Cargill will use Quattro Grain and Qube’s rail services. Emerald’s storage and receival sites at Ardlethan, Coolamon and Goolgowi will feed grain through to Quattro Grain by road and rail transport. Other grain traders have also been welcomed to use the port terminal.
Bunge: Bunbury (WA)
In early April 2014, the Bunge export grain terminal at the port of Bunbury is in its final stage of construction. Test receivals of grain are underway as part of the commissioning of the $40 million investment in the terminal. The terminal is planned to be operational by mid-2014 with growers delivering grain and possibly backloading lime or fertiliser.
Heilongjiang Feng Agricultural: Albany (WA)
In March 2013, the Albany Port Authority announced it had leased a former woodchip berth and biomass pellet storage shed to grain handler Vicstock Grain Pty Ltd. Vicstock had financial support from the Beidahuang Group who trade in Australia as Heilongjiang Feng Agricultural (HFA). Over the past two years HFA had purchased and leased around 85,000 hectares of farmland in the southern grain districts of Western Australia. Media reports outlined how the HFA and Vicstock would be developing an export grain terminal at the leased site in Albany, with the terminal being the outlet for grain grown on the farms owned by HFA, as well as grain from other farms.
However, in early April 2014 media reports surfaced that HFA was abandoning its development plans for the Albany port grain terminal. Nonetheless in late April other media reports emerged indicating that Vicstock Grain, a contractual partner to HFA, was continuing with its own plans to develop the terminal through which grain would be exported. Hence, at the time of writing some uncertainty remains about the capacity and date of operation of a new grain export terminal at Albany.
Implications
These current and planned investments are part of a trend whereby grain exporters are developing integrated supply chains that include up-country receival through to export port facilities. The reasons for these investments seems to be a desire to increase exposure to the more profitable areas of the supply chain (e.g. ports) whilst also securing greater control of grain movements hence reducing marketing risk.
The cost of Australia’s bulk grain export supply chainsA postscript
4
Australia’s grain supply chain costs in perspective
Historical comparison
Drawing on data in the AEGIC report, The cost of Australia’s bulk grain export supply chains: An information paper, wheat supply chain costs in 2013–14 were found to range from 18% to 23% of the wheat FOB price across the wheat growing regions of Australia. By contrast, in a previous comprehensive examination of Australia’s grain supply chains, the Royal Commission into Grain Storage, Handling and Transport (1988) found that in 1986 and 1987 the supply chain costs were 33% and 31% of the wheat FOB price, respectively. Hence, the regulated environment of grain handling, storage and marketing that existed in the 1980s entailed a sizeable cost to Australia’s grain growers.
Drawing on data in the Royal Commission’s report, if costs charged by the Australian Wheat Board for administration and financing (for pooling) were removed from the supply chain costs in 1986 and 1987, then the remaining supply chain costs would still have been 21% and 24% of the wheat FOB prices in those respective years. Hence, although grain growers may currently express concern about the magnitude of their supply chain costs, in fact by historical comparison those costs, in percentage terms, have actually diminished.
This diminution of cost is an encouraging trend. However, perhaps a more important trend to consider is how do Australian supply costs compare to those of its competitors. Work is in progress to establish that comparison. This postscript report points to some factors liable to make parts of the Australian supply chain relatively more expensive (e.g. low density of grain production and highly seasonal production).
The impact of Australia’s low density of grain production
The low density of grain production in the major grain-growing regions of Australia increases the cost of Australia’s grain supply chains. Australian farmers and other freight operators must travel further to collect a given volume of grain and thereby increasing logistics costs. Grain handlers also tend to be required to offer more receival sites within a geographical area to help lessen farmers’ travel distances and travel times.
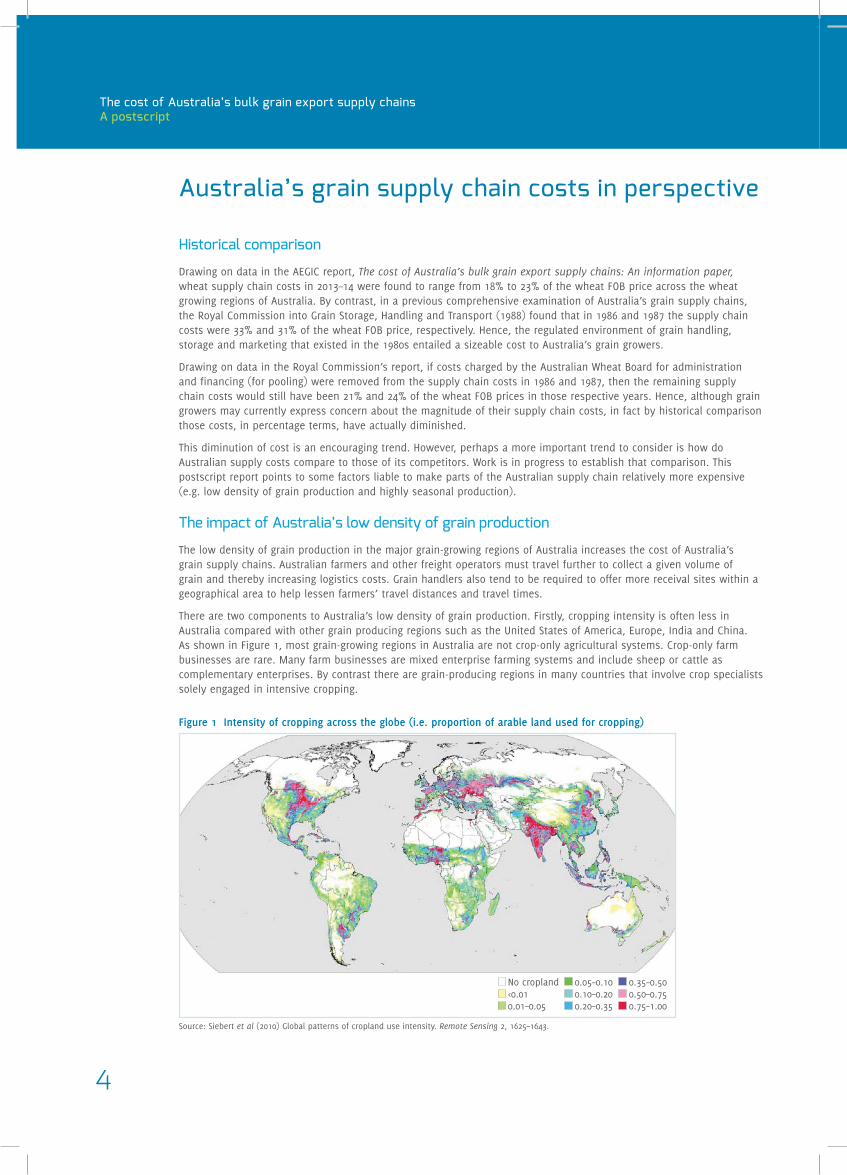
There are two components to Australia’s low density of grain production. Firstly, cropping intensity is often less in Australia compared with other grain producing regions such as the United States of America, Europe, India and China. As shown in Figure 1, most grain-growing regions in Australia are not crop-only agricultural systems. Crop-only farm businesses are rare. Many farm businesses are mixed enterprise farming systems and include sheep or cattle as complementary enterprises. By contrast there are grain-producing regions in many countries that involve crop specialists solely engaged in intensive cropping.
Figure 1 Intensity of cropping across the globe (i.e. proportion of arable land used for cropping)
Source: Siebert et al (2010) Global patterns of cropland use intensity. Remote Sensing 2, 1625–1643.
No cropland<0.010.01–0.05
0.05–0.100.10–0.200.20–0.35
0.35–0.500.50–0.750.75–1.00

5
The second factor affecting Australia’s low density of crop production is the low-yielding environments from which the bulk of Australia’s grain production comes. As shown in Figure 2, Australian average wheat yields are very low by international comparison; although wheat is, by far, Australia’s principal grain crop. These low yields when combined with the grain coming from mixed enterprise farms results in Australia being characterised by a low density of grain production. This low density impacts on the costs of grain aggregation. Within-farm travel costs and travel times are higher per tonne of grain harvested. Road and rail transport distances are greater per tonne of grain collected.
Figure 2 Average wheat yields in key wheat exporting countries or regions
0
1
2
3
4
5
6
2005 2006 2007 2008 2009 2010 2011
Whe
at y
ield
(t/
ha)
USA
Canada
EU
Australia
Argentina
Ukraine
Year
Low density of grain production is also due to there being only one harvest per year in Australia’s temperate regions (i.e. winter crops) that are the main source of Australia’s grain production. This low density problem is compounded for rail owners/operators because grain transport is often their sole revenue source and there are no other avenues for spreading some of their fixed costs and costs of track maintenance.
The low density of production also affects the profitability of rail transport and port terminals. Firstly it means that less frequent or smaller train sets are required to haul grain from inland production regions where grain yields are typically comparatively low (by international comparison). Secondly for ports closest to grain-growing regions, their grain catchment zones may not always or often contain large volumes of grain. Hence, these small volumes of grain available at some ports (Figure 3) may mean either economies of scale are low or that the grain terminals and associated rail and road infrastructure are under-utilised, adding to the unit costs of the grain supply chains in those regions. As shown by the comparison of grain exports through Australian ports versus Canadian ports, turnover and throughput at the port of Vancouver is very large and dominates grain export from Canada. By comparison Australia has many ports that offer much smaller volumes of exported grain.
The combination of all these costs and business impacts are that the cost of grain aggregation in Australia is likely to be much higher than in some other major grain-growing regions in the world.
Figure 3 Grain exports in 2011–12 from port and inland terminals in Canada and Australia
0
2,000
4,000
6,000
8,000
10,000
12,000
14,000
16,000
Vanc
ouve
r Pr
ince
Rup
ert
Prai
rie
Elev
ator
s Qu
ebec
Ba
ie C
omea
u Th
ree
Rive
rs
Mon
trea
l Th
unde
r Ba
y Po
rt C
artie
r Ch
urch
ill
Sore
l On
tario
Elev
ator
s Go
derich
Sa
rnia
Ha
lifax
Pr
esco
tt
Frem
antle
M
elbo
urne
Por
t Po
rt K
embl
a Po
rt A
dela
ide
Gera
ldto
n Po
rt L
inco
ln
Port
of Br
isba
ne
Alba
ny
Espe
ranc
e New
cast
le
Sydn
ey
Port
Gile
s Po
rtla
nd
Wal
laro
o Th
even
ard
Mac
kay
Glad
ston
e Bu
rnie
De
vonp
ort
(’00
0 to
nnes
)
CanadaAustralia

The cost of Australia’s bulk grain export supply chainsA postscript
6
The impact of Australia’s volatility of grain production
The AEGIC report indicated that the coefficient of variation in Australian export volumes is three times that of the US and Canada. The consequence for Australia is that the storage and freight industry must incorporate the capacity to flex up and down in response to production volumes and so excess capacity is built into the supply chain. The costs of the under-utilisation of the freight and storage assets however add to the costliness of Australia’s grain supply chains.
The volatility and uncertainty of Australia’s grain production also complicates logistics planning and management. As shown in Figures 4 and 5, there is temporal volatility (yield variability across years) and also spatial variability (yield variation within each grain-producing region). Because of the magnitude of this variation in Australia, logistics planning is difficult. Responding to these difficulties inevitably adds to the costs of service delivery within the supply chain. At the end of the supply chain, marketers may book more shipping slots than might be required; for example where unanticipated spring droughts greatly curtail grain production. Not knowing with sufficient accuracy the volume and qualities of different wheat grades produced can add to marketers’ aggregation costs in filling orders. Spatial variation in grain yield and quality can also increase grain storage and handling costs due to the spatial mis-matching of storage and handling capability with the inflow of grain at harvest. By illustration, if grain volumes and qualities are imprecisely known then at some locations the grain storage will incur additional costs through what is known as loss by division. This occurs where the grain storage is split into stacks to receive grain of different grades but the anticipated volumes by grade do not arrive, causing the grain storage to be inefficiently used.
Recent investments in supply chain infrastructure in Australia often involve complementary investments within the supply chain to provide a capacity to flex up and down in response to production volumes so that delivery contracts can be reliably executed. Provision of that surety can add to the costs of those supply chains, for example where excess capacity is purposefully built into the supply chain. However, increasingly investments are being made in more mobile storage structures to accommodate production volatility and avoid under-utilisation of fixed storage assets.
Figure 4 Wheat yields in Australian states, 2000–11
0
0.5
1.0
1.5
2.0
2.5
3.0
Whe
at y
ield
(t/
ha)
NSW Vic Qld SA WA
2000
2001
2002
2003
2004
2005
2006
2007
2008
2009
2010
2011
Year
Figure 5 Wheat yield rankings in shires in Australia in 2013 Predicted wheat yields for Australian shires, ranked against yields for all other years (1914–2012). Eastern states rankings for 8 December 2013 and Western Australia for 1 November. Ranking based on rainfall to date and assuming average annual rainfall for the past 30 years for the remainder of the season.
WESTERN AUSTRALIA
VICTORIA
SOUTH AUSTRALIA
TASMANIA
Percentile Ranking
Highest 10%Shire boundaries
70–90%50–70%30–50%10–30%5–10%Lowest 5%
NOTE: Based on preliminary BOM data that has not beensubject to quality control; Patched by DSITIA (Queensland)
NEW SOUTH WALES
QUEENSLAND
0 500 1000
Scale (km)
Source: AEGIC (2013)

7
Temporal volatility in grain production can increase the risks of asset degradation, particularly for rail and storage facilities. For example, in periods of prolonged drought there is a greatly reduced incentive to maintain rail and storage infrastructure as it is under-utilised for long periods. Because little revenue is generated from these assets during these dry periods, the justification for spending money on these assets is weak. Accordingly, there is a risk of the degradation of these assets that can limit their future use.
Also when volatility in grain production is combined with a longer-term drying in a region’s climate that lessens grain production, then there is a likelihood of asset stranding for grain storage and rail infrastructure. The lowered rate of return to the capital investment in these assets weakens the commercial strength of those firms that own and operate those assets. A consequence of this volatility and likelihood of a drying in the climate is that there is likely to be greater reliance on mobile storage and handling infrastructure in these regions. Also, road transport may become more cost-effective against rail transport in servicing these regions.
Australia’s path dependency impacts on supply chain costs
Many assets that form essential parts of grain supply chains are long-lived assets. Rail lines, permanent bulk grain storage and port infrastructure are often expensive, long-lived investments. Hence, the history and nature of those investments can have lasting effects on the nature and expense of grain supply chains. These ramifications are known as path dependency. For example, when railway construction began in Australia in the 1850s, the engineers often favoured the gauge system of their homeland. Hence, from England and mainland Europe came the standard gauge (rails 1,425 millimetres apart) whilst from Ireland came the broad gauge (rails 1,590 millimetres apart). Moreover a third system of a narrow gauge (rails 1,050mm apart) was chosen for Queensland, Tasmania and Western Australia. This narrow gauge system was also used in the other states for industries such as timber cutting and mining. This narrow gauge had advantages when working in hilly country as less earth or rock needed to be removed (or added) in constructing these lines.
The unfortunate consequence of these disparate and different investment choices was that Australia’s rail system comprised three different gauges: standard, broad and narrow (Figure 6). The resulting lack of uniformity has imposed additional costs on grain supply chains. By illustration, in eastern Australia grain wagons cannot be better utilised either by being moved away from a drought-affected region to another region with favourable production, nor can they follow the southwards movement of the grain harvest in eastern Australia. Queensland, New South Wales and Victoria each have different gauges, preventing the flow of grain wagons across state borders. Yet by contrast, contract grain harvesters can readily move across state borders and follow the course of the annual harvest.
Figure 6 Railway network by gauge system in 2012
Narrow gauge
Dual gauge
Broad gauge
Standard gauge
Cairns
Mount Isa
Longreach
Abbot Point
Hay Point
Gladstone
BRISBANE
SYDNEY
CANBERRA
MELBOURNE
ADELAIDE
Portland
Mildura
Broken Hill
Leigh Creek
WhyallaThevenard
Albury-Wodonga
HOBART
Newcastle
Wollongong
Newman
Leonora
Karara
Esperance
PERTH
DARWIN
0 500 1000
Scale (km)
Source: Bureau of Infrastructure, Transport and Regional Economics (BITRE), 2012, TrainLine 1, Statistical Report, Canberra ACT

The cost of Australia’s bulk grain export supply chainsA postscript
8
Another unfortunate consequence of historical rail construction is that each state government ensured that grain produced in its state flowed by rail to a port in that state, whereas in some states the nearest port was actually in an adjacent state. Hence, in some regions the supply chains that are meant to best serve those regions, in fact impose additional transport costs on those regions. For example, grain grown in south west New South Wales has its closest port in Victoria, yet the rail system in New South Wales directs grain to New South Wales ports.
Another example of path dependency concerns the construction and use of rail sidings and associated grain handling infrastructure. Often these facilities were constructed decades ago to cater for bag-based grain production supplied by numerous small farms. For example, some of GrainCorp’s receival sites were established as early as 1918 and most of its older infrastructure was established in the 1960s.
Over the decades however farm amalgamations have occurred and bulk handling methods have been adopted. Ordinarily such changes would have allowed closure of many less used sidings and small receival sites. As shown in Figure 7, depending on the region, up to a third of all receival sites only receive four or less segregations of grain. Often these are smaller receival points that nonetheless provide local employment and support for local populations, so closing these facilities can be difficult for socio-political reasons.
Figure 7 Percentages of all bins with different numbers of segregations by grain-growing region
20
18
16
14
12
10
8
6
4
2
0
Perc
enta
ge o
f bi
ns (
%)
East coast
SA
WA
Number of segregations
1 2 3 4 5 6 7 8 9 10 11 12 13 14 15 16 17 18 19 20 21 22 23 24 25 26 27 28 29 30
In most grain-growing regions of Australia a large proportion of grain production passes through a relatively small sub-set of receival sites. However, rationalising these facilities is not easy. This causes more facilities to be retained than would otherwise be justifiable on pure business grounds. Inevitably this raises the costs of operating and owning the supply chains that involve the retention of this myriad of receival sites and so the supply chain costs are higher on average than otherwise would be possible. Low receival volumes at some sites and in some regions increase the unit cost of rail, storage and handling services.


3 Baron-Hay CourtSouth PerthWestern Australia 6151P: +61 8 9368 3785E: [email protected]
aegic.org.au