Embed Size (px)
Citation preview

The cost of a healthy food basketStudy of six household types in the Republic of Ireland
e
e
e
e

The cost of a healthy food basket
Pilot study for six household types in the Republic of Ireland
ISBN: 978-1-905767-56-4
Publication date: May 2015
Suggested citation
When referencing this document, please use the following citation:
MacMahon, B and Weld, G (2015) The cost of a minimum essential food basket in the Republic of
Ireland. Study for six household types. Dublin: safefood

Table of contents
1 Introduction .......................................................................................................................................... 1
2 Methodology ....................................................................................................................................... 3
3 Impact of inflation on the minimum essential food basket 2006‒2014 ........................................ 14
4 Breakdown of the food basket by sub-category .............................................................................. 29
5 Food and household income ............................................................................................................. 49
6 Minimum essential food costs for children ..................................................................................... 64
7 Conclusions ........................................................................................................................................ 74
8 References .......................................................................................................................................... 76

List of tables
Table 1: 16 Minimum Essential Standard of Living expenditure items in the VPSJ research ...................... 4
Table 2: Sample menu – two parents and two children, one at primary and one at second level ............. 7
Table 3: Two parents with two children, at pre-school and primary school - core expenditure 2006‒
2014 ................................................................................................................................................................ 17
Table 4: Two parents with two children, at primary school and in second level - core expenditure 2006-2014 ................................................................................................................................................................ 18
Table 5: One parent and two children, at pre-school and primary school - core expenditure 2006-2014
excludes housing, childcare and the effect of secondary benefits ............................................................. 19
Table 6: Single adult male living alone - core expenditure 2006 to 2014 .................................................. 20
Table 7: Pensioner couple - core expenditure 2006-2014 excludes housing, childcare and the effect of
secondary benefits ........................................................................................................................................ 21
Table 8: Female pensioner living alone - core expenditure 2006-2014 excludes housing, childcare and
the effect of secondary benefits .................................................................................................................. 22
Table 9: Two parents and two children, at pre-school and primary school - core expenditure 2006-2014 excludes housing, childcare and the effect of secondary benefits .................................................. 23
Table 10: Two parents and two children, at primary school and in second level - core expenditure 2006-2014 excludes housing, childcare and the effect of secondary benefits .................................................. 24
Table 11: One parent and two children, pre-school and primary school - core expenditure 2006‒
2014 excludes housing, childcare and the effect of secondary benefits .................................................. 24
Table 12: Single adult male living alone - core expenditure 2006-2014 excludes housing, childcare and
the effect of secondary benefits .................................................................................................................. 25
Table 13: Pensioner couple - core expenditure 2006-2014 .......................................................................... 26
Table 14: Female pensioner, living alone - core expenditure 2006-2014 ................................................... 27
Table 15: Consumer Price Index food sub-categories .................................................................................. 29
Table 16: Two parents and two children, at pre-school and primary school ‒ food sub-categories 2006-
2014 ............................................................................................................................................................... 30

Table 17: Two parents and two children, at pre-school and primary school ‒ food sub-categories 2006‒
2014 .................................................................................................................................................................. 31
Table 18: Two parents and two children, at primary school and in second level ‒ food sub-categories
2006‒2014 ....................................................................................................................................................... 33
Table 19: Two parents and two children, at primary school and in second level ‒ food sub-categories
2006‒2014 ....................................................................................................................................................... 34
Table 20: One parent and two children, at pre-school and primary school ‒ food sub-categories 2006‒
2014 ................................................................................................................................................................. 36
Table 21: One parent and two children, at pre-school and primary school ‒ food sub-categories 2006‒
2014 ................................................................................................................................................................. 37
Table 22: Single adult male of working age ‒ food sub-categories 2006‒2014 ......................................... 39
Table 23: Single adult male of working age ‒ food sub-categories 2006‒2014 ........................................ 40
Table 24: Pensioner couple ‒ food sub-categories 2006‒2014 ................................................................... 42
Table 25: Pensioner couple ‒ food sub-categories 2006‒2014.................................................................... 43
Table 26: Female pensioner, living alone ‒ food sub-categories 2006‒2014 ............................................. 45
Table 27: Female pensioner living alone ‒ food sub-categories 2006‒2014 .............................................. 46
Table 28: Two parents and two children, at pre-school and primary school, dependent on social
welfare ............................................................................................................................................................. 50
Table 29: One parent working and earning the national minimum wage (NMW), the other parent at
home ............................................................................................................................................................... 50
Table 30: Dependent on social welfare ......................................................................................................... 52
Table 31: One parent working and earning the national minimum wage, the other a stay-at-home
parent .............................................................................................................................................................. 52
Table 32: Dependent on social welfare ......................................................................................................... 54
Table 33: One parent working and earning the national minimum wage ................................................. 54
Table 34: Single adult male of working age dependent on social welfare ................................................. 56
Table 35: Single adult male working fulltime and earning the national minimum wage ........................ 56
Table 36: One contributory pension and qualified adult payment ............................................................. 58

Table 37: One contributory pension and one non-contributory pension ................................................... 58
Table 38: Both in receipt of a Non-contributory Pension ............................................................................ 59
Table 39: Contributory pension ...................................................................................................................... 61
Table 40: Non-contributory pension.............................................................................................................. 61
Table 41: Urban ‒ direct cost of a child excludes housing, childcare and the effect of secondary
benefits ........................................................................................................................................................... 66
Table 42: Rural ‒ direct cost of a child .......................................................................................................... 66
Table 43: Urban ‒ direct cost of a child ........................................................................................................ 68
Table 44: Rural ‒ direct cost of a child excludes housing, childcare and the effect of secondary
benefits ........................................................................................................................................................... 68
Table 45: Urban ‒ direct cost of a child ........................................................................................................ 70
Table 46: Rural ‒ direct cost of a child .......................................................................................................... 70
Table 47: Urban food costs and the weekly value of child income supports in 2014 ................................ 72
Table 48: Rural food costs and the weekly value of child income supports in 2014 ................................. 72

List of figures
Figure 1: Overall inflation, food and non-alcoholic beverage inflation 2006-2014 ................................... 14

The cost of a healthy food basket
1
1 Introduction
Research context
A Minimum Essential Standard of Living (MESL) is derived from a negotiated consensus on what people
believe is a minimum standard. It is a standard of living that meets an individual’s or a household’s physical,
psychological and social needs. This is calculated by identifying the goods and services required by different
household types in order to meet their needs. While an MESL is based on needs, not wants, it is a standard of
living below which nobody should be expected to live.
This report focuses on food, one of the 16 elements of the Minimum Essential Standard of Living (MESL) data.
It is based on a methodology called Consensual Budget Standards (CBS). The report is presented in the
context of increasing concerns about the issue of food poverty in the Republic of Ireland (ROI) and an
increase in the number of people reporting that they do not have enough money to buy food. Recent data
from The Organisation for Economic Co-operation and Development (OECD) have shown that the number of
people believing they cannot afford food doubled from 4.2% in 2008 to 9% in 2014(1). Data from Eurostat
show that in 2013, food and non-alcoholic beverage prices in Ireland were 17% higher than the EU average (2).
Moreover, research by Carney and Maitre (3), using data from the Survey on Income and Living Conditions
(SILC), found that one in ten people are living in food poverty in Ireland. Food poverty is defined as the
inability to have an adequate and nutritious diet due to issues of affordability and access to food. This has
related effects on health, culture and social participation.
The 2013 data from the Survey on Income and Living Conditions (SILC) show that 1.4 million people, almost
31% of the population, suffer from deprivation. This means that they are unable to afford two items from a
list of 11 very basic items (of which one is not being able to eat a meal with meat, chicken, fish or a
vegetarian equivalent every second day). The highest levels of deprivation are experienced by lone parents
(63%), unemployed people (55%) and people not at work because of illness or disability (53%). The
experience of the Vincentian Partnership for Social Justice (VPSJ) is that expenditure on food tends to be one
of the least important considerations when households are dealing with competing demands on an
inadequate income.

The cost of a healthy food basket
2
Objectives of this report
1. To examine the food element of the Minimum Essential Budget Standards (MESL) data in the Republic
Of Ireland (ROI) from 2006 to 2014 for six sample household types:
Two parents and two children, one in pre-school (age 3) and one in primary school (age 10)
Two parents and two children, at primary school (age 10) and in second level (age 15)
One parent and two children, one in pre-school (age 3) and one in primary school (age 10)
Single adult male of working age, living alone
Pensioner couple
Female pensioner, living alone
2. To examine the expenditure on food as a proportion of core minimum essential expenditure. Core
expenditure excludes items that can vary according to location, employment status and secondary
social welfare entitlements. Therefore, the cost of housing, childcare and entitlement to secondary
benefits, such as a medical card, which affects health expenditure, is excluded from the analysis.
3. To examine expenditure on food in the context of household income for two income scenarios:
i. Dependent on social welfare transfers
ii. Working and earning the national minimum wage in working age households
4. To analyse food costs for children as part of a household.

The cost of a healthy food basket
3
2 Methodology
Background and development of the methodology research
Measuring deprivation
In 1999, the VPSJ studied 118 low-income households dependent on social welfare payments or low wages to
highlight their experience of deprivation (4).
This work was in a response to a plea from a group of women who asked, “Will no one ever show the
Government what it is like to never have enough to make ends meet?”
The findings showed that none of the households could meet the weekly cost of rent, energy, clothing,
education, over-the-counter medication and food. A significant finding was that an inadequate diet, and, at
worst, the experience of hunger on a weekly basis, was the reality for the majority of these households.
The cost of a minimum essential standard of living with the primary focus on experts
In 2004, the focus of the VPSJ changed from measuring deprivation to determining the minimum level of
expenditure needed for a Minimum Essential Standard of Living using Low Cost but Acceptable (LCA) Budget
Standards, as developed by the Family Budget Unit (FBU) at the University of York (5). This methodology uses
empirical data from national surveys of poverty and exclusion to determine prevailing patterns of
consumption in society and to arrive at a consensus on what the essential necessities of modern living are.
Input from focus groups was also used to:
Gain information on the shopping patterns of low-income households
Draw up a framework for the food menus and shopping lists
Assist in the validation process of the budgets
Learn about the realities of life on a low income
This methodology was used in a study of a low-cost but acceptable standard living for three household types
(6).
The cost of a minimum essential standard of living with the primary focus on people
Budget standards based on the actual expenditure choices and judgments of people in real life as they
manage their money to contribute to a final consensus (7, p.63) were developed as a methodology by the
Centre for Research in Social Policy (CRSP) at the University of Loughborough. It avoided expert judgments
and reaching consensus by coincidence. This approach is known as Consensual Budgets Standards (CBS)
methodology (7).

The cost of a healthy food basket
4
Determining the cost of a Minimum Essential Standard of Living according to the people with input
from the experts
Consensual Budgets Standards (CBS) based on the expenditure of people in real life on goods and services
that everyone in Britain should be able to afford, while at the same time drawing on expert knowledge about
basic living requirements and expenditure patterns(8), were developed as a methodology in 2004 by the
Family Budget Unit at University of York in partnership with the Centre for Research in Social Policy at the
University of Loughborough.
In 2006, the VPSJ (9) applied the CBS methodology, but used Irish sources to establish the individual items for
each of the 16 areas of expenditure.
The following are the 16 areas of expenditure in the MESL data
Table 1: 16 Minimum Essential Standard of Living expenditure items in the VPSJ research
Food Household Goods Education Insurance
Clothing Household Services Transport Savings and Contingencies
Personal Care Communications Household Energy Housing
Health-related Costs Social Inclusion and
Participation
Personal Costs Childcare
The CBS approach is being increasingly adopted internationally, and variations of the methodology have
been used in New Zealand, Australia and the US. Budget standards using the CBS approach are currently
being developed in France, Austria and Portugal, as well as in Japan (10, 11).
Since 2006, the VPSJ has extended the use of the CBS approach and has undertaken studies to develop
budget standards for additional household types, as well as households in rural areas. The MESL data is
updated every year, and the website, www.budgeting.ie, presents a wide range of information on the
expenditure and income necessary for a Minimum Essential Standard of Living. The Minimum Income
Standard Calculator, www.misc.ie, allows individuals and households to calculate the expenditure and
income needs for their particular situation. In 2014, the VPSJ in partnership with safefood undertook a pilot
study on the cost of a minimum essential food basket for two household types in Northern Ireland.

The cost of a healthy food basket
5
How is a minimum essential standard of living determined?
An MESL is determined using the Consensual Budget Standards methodology. This methodology, which is
grounded in the experience of people, involves detailed research, with members of the public specifying the
items that need to be included in a minimum household budget. Focus groups are held for each household
type. Each group consists of between eight and 12 people from a mixture of social and economic
backgrounds, and represents the household under consideration. For example, the focus groups of parents
with children determine the minimum requirements of such households. In order to ensure the reliability
and validity of the research, three different focus groups are established for each household type. While the
process is detailed and time consuming, it is thorough and robust. In a series of sessions, the groups arrive at
a negotiated consensus about the goods and services a household requires to have an MESL. Where
necessary, experts are consulted in order to ensure that the negotiated consensus meets basic criteria, such
as nutritional standards and home heating standards. However, “ultimately the people themselves are the
experts”(12, p.63).
What does it include?
While an MESL is concerned with more than survival, its focus is on needs, not wants. It identifies the
minimum goods and services that everyone should be able to afford. There are approximately 2,000 items in
the budget, and these goods and services are subsequently categorised into 16 areas of expenditure. The
goods and services are then priced in shops or outlets identified by the focus groups. The totals of each of
the 16 categories of household budgets show the expenditure required to meet a Minimum Essential
Standard of Living.
While some items are bought every week, others may only be bought every couple of months or even years.
For example, furniture is expected to last a number of years, while a large proportion of food items are
bought on a weekly basis, e.g. fruit and vegetables. However, there are food items which are bought every
couple of weeks or even months, e.g. salt and oil. To calculate the weekly cost of each item, the price of the
item is divided by the number of weeks it is expected to last. For example, salt, which costs €1 and has a
lifespan of 26 weeks, costs €0.04 per week.
Food is one of the 16 categories of expenditure. It is a significant area of household expenditure, and when
housing and childcare are excluded, it is the most expensive component of an MESL. The process of how the
food baskets were established and how they have evolved is outlined in detail below.
Establishment and evolution of the minimum essential food baskets
The current tranche of research began in 2006 with the publication of minimum essential budgets for six
households (urban) (9). The current study, focusing on households living in urban areas, uses Consensual
Budget Standards methodology to determine the cost of an MESL for six household types. The six household
types are:

The cost of a healthy food basket
6
Two parents and two children, with one child in pre-school (age 3) and one in primary school
(age 10)
Two parents and two children, with one child in primary school (age 10) and one in secondary
school (age 15)
One parent and two children, with one child in pre-school (age 3) and one in primary school
(age 10)
Single adult male of working age, living alone
Pensioner couple
Female pensioner, living alone
This study established the minimum requirements for each household type in order to have a standard of
living that meets their physical, psychological and social needs at a minimum but acceptable level. Focus
groups representing the different household types constructed the food baskets. The focus groups
completed an inventory of their food cupboards and fridges and were asked to keep a weekly food diary. The
focus groups constructed food menus for each day of the week, and in the course of the work, the focus
group members were directed to keep in mind the requirements of the Food Pyramid.
The seven-day menus developed by the first focus groups were studied and, where necessary, amended by
the two subsequent focus groups before being sent to experts for evaluation regarding their nutritional
adequacy. The menus were sent to the Family Budget Unit at the University of York in the UK and were
analysed using Tinuviel Software (9, p.72). The feedback from the nutritional experts “showed that for the
most part the menus and food items were adequate”(9, p.37). Some of the changes recommended by the
nutritionists included exchanging white bread for brown bread for the adults in the household, and replacing
full-fat milk with skimmed milk for older people. The menus, which were examined by nutritionists, were
then brought back to the focus groups for their approval. The final menus provide the basis for the food
shopping baskets. The menu drawn up in 2006 by the two parents and two children (one child in primary
school (age 10) and one in secondary school (age 15)) household type, is detailed below. The items were then
priced in stores identified by the focus groups.
In the 2006 study, the majority of food items was bought in Tesco, while meat was purchased in a butcher’s.
This reflects the stores identified by the focus groups and the predominance of Tesco in the Irish retail
market at that time.
Since 2006, the MESL dataset has been extended to include rural households and other household types. The
entire MESL dataset, including the food baskets, was also subject to a review in 2012. The outcome of the
2012 review indicated that the menus drawn up in 2006 were still applicable in 2012. These developments and
how they have affected the minimum essential food baskets are outlined below. A sample menu is provided
in Table 2 and a full set of menus is available at www.budgeting.ie.

The cost of a healthy food basket
7
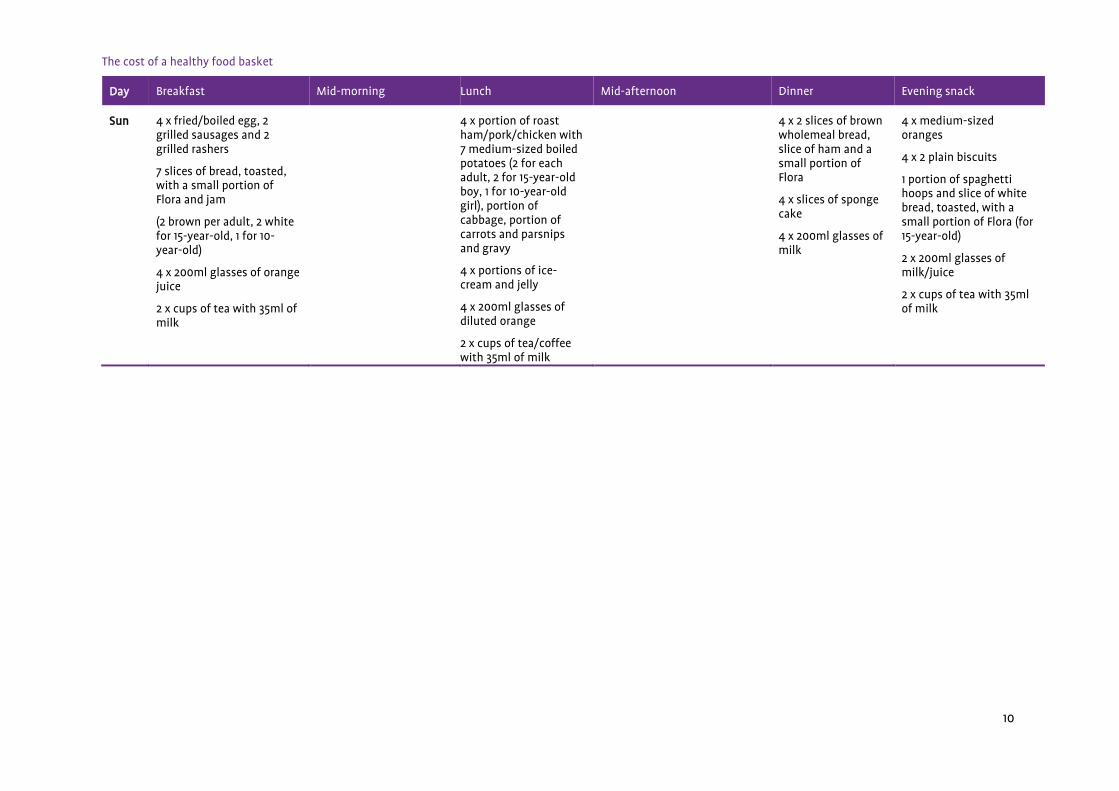
Table 2: Sample menu – two parents and two children, one at primary and one at second level
Day Breakfast Mid-morning Lunch Mid-afternoon Dinner Evening snack
Mon 7 Weetabix (2 for each adult, 2 for 15-year-old boy, 1 for 10 year-old-girl) with 4 x portions of dried apricots and 200ml of milk
7 slices of bread, toasted, with a small portion of Flora and marmalade (2 wholemeal per adult, 2 white for 15- year-old, 1 for 10-year-old)
4 x 200ml glasses orange juice
2 x cups of tea and 35ml of milk
4 x medium- sized bananas
2 x cups of tea/coffee with 35ml of milk
4 x 2 slices of brown wholemeal bread (2 per household member) with a slice of ham and a small portion of Flora
4 x strawberry yoghurts (125g pot)
2 x 200ml glasses of diluted orange
2 x cups of tea/coffee and 35ml of milk
4 x medium-sized apples
Portion of beans and 1 slice of white bread, toasted, with a small portion of Flora (15-year-old).
2 x glasses of milk/juice/water
2 x cups of tea/coffee with 35ml of milk
4 x chicken curry with rice and salad (includes portion of chicken fillet, curry sauce with onions, portion of salad with tomato, portion of lettuce, cucumber and mixed peppers)
4 x 200ml glasses of milk
4 x small bars of chocolate
30g bowl of cornflakes with 200ml of milk (15-year-old)
2 x glasses of milk/juice
2 x cups of tea with 35ml of milk
Tue 4 x 30g bowl of Rice Krispies with 4 x 200ml of milk
7 slices of brown wholemeal bread, toasted, with a small portion of Flora (2 per adult, 2 per for 15-year-old, 1 for 10-year-old)
4 x 200ml glasses of orange juice
2 x cups of tea with 35ml of milk
4 x medium-sized pears
2 x cups of tea/coffee with 35ml of milk
4 x 2 slices of brown wholemeal bread (2 per household member) with cheese, turkey, portion of coleslaw and a small portion of Flora
2 x 200ml glasses of diluted orange
2 x cups of tea/coffee and 35ml of milk
4 x 2 plain biscuits
Portion of noodles
(15-year-old)
4 x medium-sized oranges
2 x 200ml glasses of diluted orange
2 x cups of tea/coffee with 35ml of milk
4 x beef stew with portion of carrots, portion of onions, portion of broccoli and 7 medium-sized boiled potatoes (two each for parents and 15-year-old, 1 for 10-year-old)
4 x 200ml glasses of milk
4 x white scones with a small portion of Flora and jam
2 slices of white bread, toasted, with a slice of ham and a small portion of Flora (15-year-old)
2 x 200ml of warm milk with cocoa
2 x cups of tea with 35ml of milk

The cost of a healthy food basket
8
Table 2: Sample menu – two parents and two children, one at primary and one at second level Continued
Day Breakfast Mid-morning Lunch Mid-afternoon Dinner Evening snack
Wed 2 x 30g bowl of Rice Krispies with 2 x 200ml of milk 2 x 30g bowl of cornflakes with 2 x 200ml of milk 7 slices of bread, toasted, with a small portion of Flora and marmalade (2 brown per adult, 2 white for 15-year-old, 1 white for 10-year-old) 4 x 200ml glasses of orange juice
2 x cups of tea with 35ml of milk
4 x bananas 2 x cups of tea with 35ml of milk
4 x 2 slices of brown wholemeal bread with cheese, turkey, 2 slices of tomato and and a small portion of Flora 4 x yoghurts (125g pot) 2 x 200ml glasses of diluted orange 2 x cups of tea/coffee with 35ml of milk
4 x medium oranges 2 slices of white bread, toasted, with a slice of cheese and a small portion of Flora (15-year-old) 2 x 200ml glasses of diluted orange 2 x cups of tea/coffee with 35ml of milk
4 x medium pork chops, 7 medium-sized baked potatoes (2 for each adult, 2 for 15-year-old boy, 1 for 10-year-old girl), portion of turnip and cauliflower with a small portion of gravy 4 x 200ml glasses of milk
4 x 2 plain biscuits 30g bowl of cornflakes with 200 ml of milk (15- year-old) 2 x 200ml glasses of milk 2 x cups of tea with 35ml of milk
Thu 7 weetabix (2 for each adult, 2 for 15 yr old boy, 1 for 10 year old girl) with 4 x portion of dried apricot and 200ml of milk
7 slices of brown wholemeal bread, toasted with small portion of flora and marmalade (2 per adult, 2 for 15 yr old, 1 for 10 yr old)
4 x 200ml glass orange juice
2 x cup of tea with 35ml of milk
4 x low fat strawberry yoghurts (125g pot)
2 x cups of tea/coffee with 35ml of milk
8 slices of bread with portion of tinned salmon, portion of lettuce and coleslaw and small portion of mayonnaise (2 brown per adult, 2 white per child)
2 x 200ml glass of diluted orange
2 x cup of tea/coffee with 35ml of milk
4 x medium size apples
4 x bowls of homemade soup (includes turnip, cauliflower, carrot and potato
4 x brown bread roll with small portion of flora
2 x 200ml glass of diluted orange
2 x cup of tea/coffee with 35ml of milk
4 x chicken fillets, 7 medium size baked potatoes (2 for each adult, 2 for 15 year old boy, 1 for 10 yr old girl), portion of frozen peas and portion of carrots
4 x 200ml glass of milk
4 x small bar of chocolate
portion of noodles and slice of brown wholemeal toasted bread with small portion of flora (15year old)
2 x 200ml glass of milk
2 x cup of tea with 35ml of milk
Table 2: Sample menu – two parents and two children, one at primary and one at second level Continued

The cost of a healthy food basket
9
Day Breakfast Mid-morning Lunch Mid-afternoon Dinner Evening snack
Fri 4 x 30g bowl of Rice Krispies with 4 x 200ml of milk
7 slices of bread, toasted, with a small portion of Flora and jam (2 brown per adult, 2 white for 15-year-old, 1 for 10-year-old)
4 x 200ml glasses of orange juice
2 x cups of tea with 35ml of milk
4 x medium-sized bananas
2 x cups of tea/coffee and 35ml of milk
3 x 2 slices of brown wholemeal bread with portion of tuna, sweet corn and a small portion of Flora
1 x white bread roll with portion of warm chicken, mayonnaise, sweet corn and mixed peppers (15-year-old)
2 x 200ml glasses of diluted orange
2 x cups of tea/coffee with 35ml of milk
4 x packets of crisps (Friday treat)
2 cream crackers with slice of cheese (15-year-old)
2 x 200ml glasses of diluted orange
2 x cups of tea/coffee with 35ml of milk
3 x portions of frozen cod (adults and teenager)
2 fish fingers (10- year-old)
4 x portions of beans and portion of oven chips
4 x 200ml glasses of milk
4 x 2 plain biscuits
30g bowl of cornflakes with 200ml of milk (15- year-old)
2 x 200ml of warm milk with cocoa
2 x cups of tea with 35ml of milk
Sat 7 Weetabix (2 for each adult, 2 for 15-year-old boy, 1 for 10-year-old girl) with 4 x portions of dried apricots and 200ml of milk
7 slices of brown wholemeal bread, toasted, with a small portion of Flora and marmalade (2 per adult, 2 for 15-year-old, 1 for 10-year-old)
4 x 200ml glasses orange juice
2 x cups of tea with 35ml of milk
4 x medium- sized apples
2 x tea/coffee with 35ml milk
2 x 200ml of glasses of milk
4 x 2 potato waffles and portion of scrambled eggs
2 x 200ml glasses of diluted orange
2 x cups of tea/coffee with 35ml of milk
4 x low-fat strawberry yoghurts
2 x cream crackers and slice of cheese (15-year-old)
2 x 200ml glasses of orange juice
2 x cups of tea/coffee with 35ml of milk
4 x spaghetti bolognese and salad (portion of pasta, portion of mincemeat, portion of bolognese sauce, including chopped tomatoes, onions, peppers and mushrooms
4 x 200ml glasses of milk
2x 2 plain biscuits (adults)
2 x small bar of chocolate (children)
4 packets of crisps (weekend treat)
2 x 200ml of warm milk with cocoa
2 x cups of tea with 35ml of milk
Table 2: Sample menu – two parents and two children, one at primary and one at second level Continued
The cost of a healthy food basket
10
Day Breakfast Mid-morning Lunch Mid-afternoon Dinner Evening snack
Sun 4 x fried/boiled egg, 2 grilled sausages and 2 grilled rashers
7 slices of bread, toasted, with a small portion of Flora and jam
(2 brown per adult, 2 white for 15-year-old, 1 for 10-year-old)
4 x 200ml glasses of orange juice
2 x cups of tea with 35ml of milk
4 x portion of roast ham/pork/chicken with 7 medium-sized boiled potatoes (2 for each adult, 2 for 15-year-old boy, 1 for 10-year-old girl), portion of cabbage, portion of carrots and parsnips and gravy
4 x portions of ice-cream and jelly
4 x 200ml glasses of diluted orange
2 x cups of tea/coffee with 35ml of milk
4 x 2 slices of brown wholemeal bread, slice of ham and a small portion of Flora
4 x slices of sponge cake
4 x 200ml glasses of milk
4 x medium-sized oranges
4 x 2 plain biscuits
1 portion of spaghetti hoops and slice of white bread, toasted, with a small portion of Flora (for 15-year-old)
2 x 200ml glasses of milk/juice
2 x cups of tea with 35ml of milk

The cost of a healthy food basket
11
Rural households
In 2009, research began to ascertain the cost of an MESL for rural households. Using focus groups living in
rural areas, the research sought to establish the additional or different costs for rural households (13). The
menus and basket of goods and services drawn up in the 2006 study for each household type (9) were
brought to focus groups in rural areas. The groups were asked to examine and study the contents of the
baskets and the shops that items were purchased in. The focus groups were then asked to identify the
additional or different costs and the shops in which items should be purchased.
The rural focus groups identified a number of differences between the urban and rural MESL food baskets.
Such differences included the tendency of rural households, in particular pensioner households, to buy
goods locally, and, for that reason, a number of food items were bought in local stores as opposed to large
multiples to reflect rural shopping patterns.
The contents of the food baskets, however, are broadly similar between urban and rural households and
despite some very minor adjustments, “the composition of the food basket is essentially identical for the
rural and urban households” (MacMahon, Weld & Thornton, 2010: 33) (13, p.33).
However, rural focus groups identified a car as a minimum essential requirement. Focus groups strongly
stressed the need to include a car or cars in the MESL data in recognition of the limited, if any, public
transport in rural areas. While a car is necessary for tasks other than food shopping, without one, rural
households have limited choices as to where they shop. This point is important to bear in mind as accessing
food can be a challenge for some due to a lack of, or limited, transport. While households may be aware of
healthier options, physical constraints can limit a household’s ability to purchase healthy food.
A minimum income standard for Ireland
In 2012, the VPSJ in conjunction with the Policy Institute at Trinity College Dublin published A Minimum
Income Standard for Ireland (14). While the main focus of this report was to establish the gross income
households required to afford the expenditure needed for an MESL, the study also extended the MESL
research to include a broader number of household types by individualising the costs for each household
member. To do this, the focus shifted from the MESL needs of aggregate households to the MESL needs of
specific individual types within the context of an entire household1. A result of the individualisation process,
for example, was that the direct costs of children could be extracted from the aggregate household
expenditure. The direct costs of children focuses on costs that can be solely attributed to a child, such as
1 Further information on the individualisation process can be found in Collins, M.L., MacMahon, B., Weld, G and Thornton, R. (2012), A Minimum Income Standard for Ireland – a consensual budget standards study examining household types across the lifecycle – Studies in Public Policy No. 27, Dublin: Policy Institute, Trinity College Dublin, pp. 40–46..

The cost of a healthy food basket
12
their food, clothing, personal care and so forth, and exclude costs shared in common with parents such as
home heating and use of the family car, etc. The outcome of this was a separate piece of research, The Cost
of a Child, which examined in detail the cost of a child at the four different stages of childhood (15). The food
costs for children are explored in detail in section 7 of this report.
Review of the food baskets
In 2012, the VPSJ conducted a review of the minimum essential baskets drawn up in 2006 for urban
households and in 2010 for rural households (16). The review of the baskets involved focus groups examining
changing attitudes of what was considered necessary for an MESL between 2006, when the expenditure
baskets were first drawn up, and 2012. The contents of the existing baskets were reviewed, and, where
necessary, goods and services were added, subtracted or re-priced in new stores identified by the focus
groups. The lifespan of goods was also reviewed. Subsequently, any necessary adjustments were made to the
baskets based on the discussions with focus groups and expert opinion where necessary.
The review of the baskets did not show a seismic shift in the attitudes of members of the public towards
what constitutes an MESL. The outcome of the review indicated that the menus drawn up in 2006 were still
applicable in 2012. A similar finding was also found in the UK budget standards research. In a review of the
budget standards research in the UK, which was conducted by the Centre for Research in Social Policy at the
University of Loughborough, it was found that the content of menus based on items that are essential for an
adequate diet remain relatively consistent over time. They note that “the final menus are very similar to
those originally developed in 2008”, which was when they began their current tranche of research (17, p.12).
The most fundamental change in the food basket relates to the shops in which items are purchased. In the
review, urban and rural focus groups identified different stores for their food shopping, demonstrating the
emergence of low-cost multiples in the Irish retail market. The review resulted in a number of changes to the
food baskets.
Since 2006, when the baskets were first drawn up, Aldi and Lidl have increased their foothold in the Irish
retail market, and this was reflected by the review focus groups’ choices. As a result, a large proportion of
food items in the MESL dataset is now purchased in Aldi and Lidl. However, meat items such as chops and
joints continue to be purchased in local butcher shops in urban and rural areas. These changes necessitated
a re-pricing of the food baskets in their entirety.
Further specific changes were made to the rural food baskets following the review process. When the rural
food baskets were first established, rural-based pensioners in particular bought a large proportion of food
items in local shops. However, the review focus groups felt that while a proportion of shopping items
continue to be purchased locally, such as bread, milk and some fruit and vegetables, other food items and
perishable goods are purchased in Aldi or Lidl. The focus groups reasoned that a car is included in the MESL
budget for rural pensioner households, and highlighted the impact of living through a recession, and this
explains the shift from predominantly local shopping to shopping in multiples, which tend to be cheaper,

The cost of a healthy food basket
13
and is more in keeping with a minimum standard of living. For that reason, while all rural households
continue to do a proportion of their food shopping locally, the majority of food items are now purchased in
low-cost German retailers.
The menus and the subsequent food baskets that are under consideration in this paper were therefore first
established in 2006. Rural households were added to the dataset in 2010. In 2012, the food baskets, along
with the rest of the MESL data, were reviewed, and a number of changes were made, notably the decision to
buy the majority of food items in Aldi and Lidl for both urban and rural households. Fundamentally, the
menus that were first established by focus groups in 2006 still form the basis of the food baskets for each
household type in urban and rural areas.
Methodology for the analysis of the food data
All of the MESL data were reviewed and re-priced where necessary in 2012. The food baskets were re-priced in
their entirety in 2012. The baskets for all categories of expenditure, including food, were subsequently
updated for inflation in 2013 and 2014, based on changes in the Consumer Price Index (CPI). The MESL data
were updated annually on a March-to-March cycle.
For the purposes of this report, and in order to examine the impact of inflation on the cost of the minimum
essential food basket between 2014 and 2006, the cost of an MESL for each household type in 2014 was taken
as the starting point. The appropriate inflation rates for each category of expenditure, e.g. food and clothing,
and for each year from 2014 to 2006 were applied to the MESL data. Using 2014 as the starting point and
adjusting the cost of the basket retrospectively to correct for inflation ensured that an identical basket of
goods was compared year on year. Furthermore, it was necessary to adjust all other categories of core
expenditure to be able to put the food baskets in the context of the overall cost of a Minimum Essential
Standard of Living between 2006 and 2014.
This approach to analysing the trend in the cost of food is necessary as the 2012 review process resulted in
changes to the MESL data, as outlined above. Furthermore, in 2011 it was decided to change the update from
a June-to-June cycle to a March-to-March cycle.2 Using this approach and correcting for inflation
retrospectively from 2014 to 2006, ensured an identical basket of goods was compared year on year.
Section 5 of the report, Breakdown of the food basket by sub-category, examines the food basket in detail. In
order to provide an in-depth analysis of the food basket, the most detailed sub-index rate possible was
applied to each food item. The cost of each food item was corrected for inflation individually and then
categorised under an appropriate CPI heading. For example, sausages were corrected for using the CPI rate
for “dried, salted or smoked meat” and then categorised under “Meat”. A fuller description of the
methodology applied to examine the food basket by sub-category is detailed in section 5 of the report.
2 From 2007‒2010, the MESL data were updated in June of each year. In 2011, a decision was made to update the MESL data in March of each year to allow more time to prepare for the pre-budget process.

The cost of a healthy food basket
14
3 Impact of inflation on the minimum essential food basket 2006‒2014
Introduction
This section analyses the trend in food inflation from 2006 to 2014 and the impact that it has had on the
minimum essential food baskets. The data are based on the cost of food and non-alcoholic beverages in
March of each year.
Figure 1: Overall inflation, food and non-alcoholic beverage inflation 2006‒2014
Figure 1 illustrates the annual percentage change from 2006 to 2014 in the prices of “food and non-alcoholic
beverages”. Also illustrated is the annual percentage change in overall average prices for the same period.
Between 2006 and 2008, food and non-alcoholic prices increased by an average of 10%, as did prices
generally. Prices for food and non-alcoholic beverages spiked in 2008 and prices were 10.2% higher than they
were in 2006. In 2009, average prices fell back and were 7.5% higher than in 2006, but prices for food and
non-alcoholic beverages remained over 9.5% higher than they were in 2006. However, by 2010 prices for food
and non-alcoholic beverages fell sharply and were only 1.1% higher than they were in 2006, while average
prices were 4.2% higher in 2010 than they were in 2006.
The overall year-on-year change from 2006 to 2014 shows that 2014 prices for food and non-alcoholic
beverages were 2.4% higher than they were in 2006, but overall average prices were up by 10.4% in the same
period.
100%
105%
110%
115%
2006 2007 2008 2009 2010 2011 2012 2013 2014
Food and Non-Alcoholic
Beverages
The cost of a healthy food basket
15
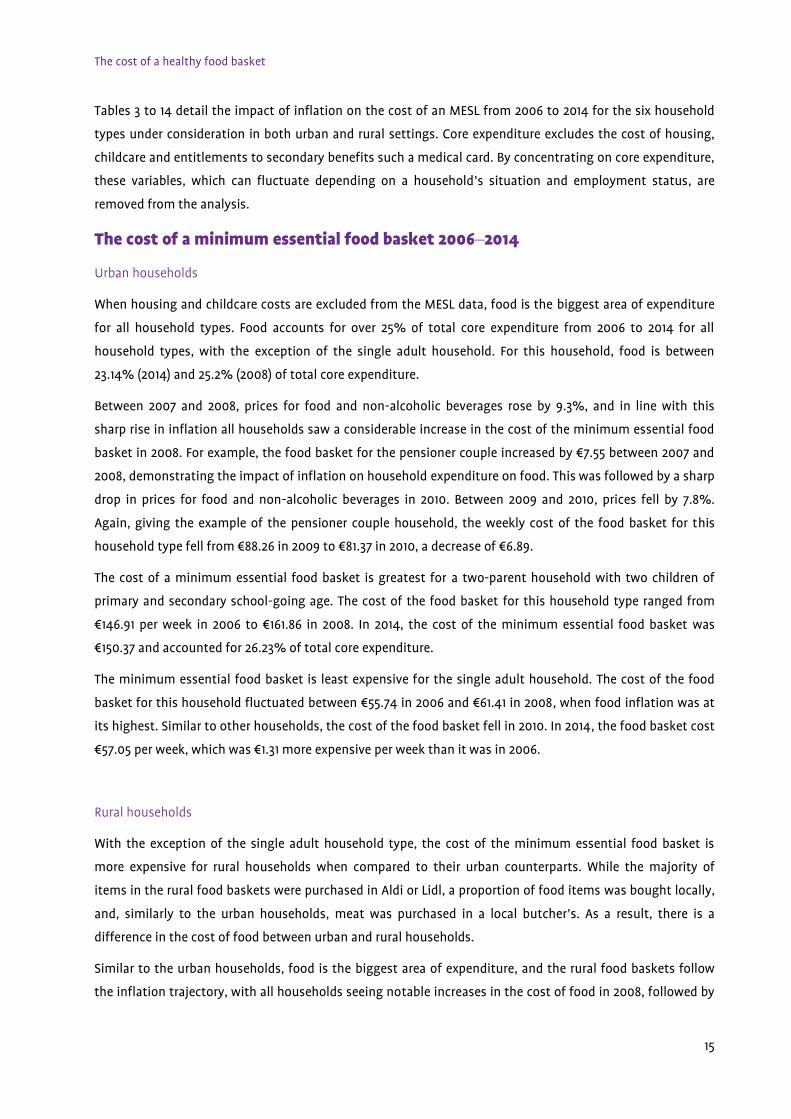
Tables 3 to 14 detail the impact of inflation on the cost of an MESL from 2006 to 2014 for the six household
types under consideration in both urban and rural settings. Core expenditure excludes the cost of housing,
childcare and entitlements to secondary benefits such a medical card. By concentrating on core expenditure,
these variables, which can fluctuate depending on a household’s situation and employment status, are
removed from the analysis.
The cost of a minimum essential food basket 2006‒2014
Urban households
When housing and childcare costs are excluded from the MESL data, food is the biggest area of expenditure
for all household types. Food accounts for over 25% of total core expenditure from 2006 to 2014 for all
household types, with the exception of the single adult household. For this household, food is between
23.14% (2014) and 25.2% (2008) of total core expenditure.
Between 2007 and 2008, prices for food and non-alcoholic beverages rose by 9.3%, and in line with this
sharp rise in inflation all households saw a considerable increase in the cost of the minimum essential food
basket in 2008. For example, the food basket for the pensioner couple increased by €7.55 between 2007 and
2008, demonstrating the impact of inflation on household expenditure on food. This was followed by a sharp
drop in prices for food and non-alcoholic beverages in 2010. Between 2009 and 2010, prices fell by 7.8%.
Again, giving the example of the pensioner couple household, the weekly cost of the food basket for this
household type fell from €88.26 in 2009 to €81.37 in 2010, a decrease of €6.89.
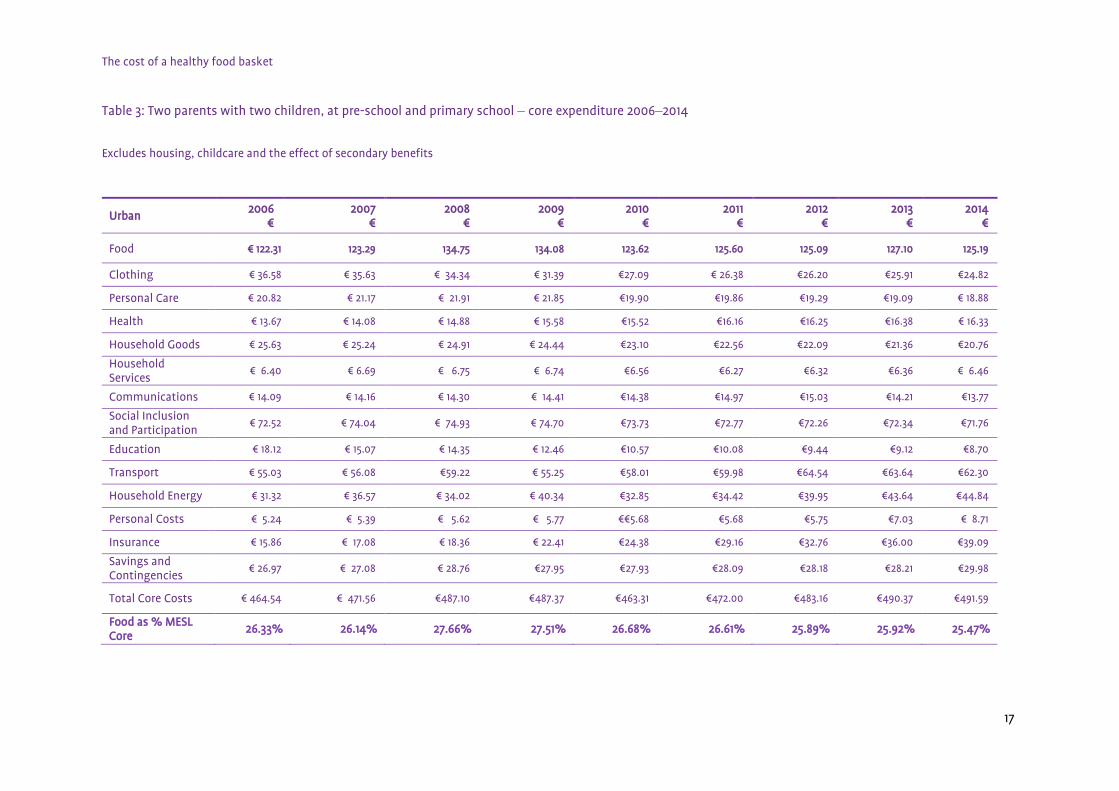
The cost of a minimum essential food basket is greatest for a two-parent household with two children of
primary and secondary school-going age. The cost of the food basket for this household type ranged from
€146.91 per week in 2006 to €161.86 in 2008. In 2014, the cost of the minimum essential food basket was
€150.37 and accounted for 26.23% of total core expenditure.
The minimum essential food basket is least expensive for the single adult household. The cost of the food
basket for this household fluctuated between €55.74 in 2006 and €61.41 in 2008, when food inflation was at
its highest. Similar to other households, the cost of the food basket fell in 2010. In 2014, the food basket cost
€57.05 per week, which was €1.31 more expensive per week than it was in 2006.
Rural households
With the exception of the single adult household type, the cost of the minimum essential food basket is
more expensive for rural households when compared to their urban counterparts. While the majority of
items in the rural food baskets were purchased in Aldi or Lidl, a proportion of food items was bought locally,
and, similarly to the urban households, meat was purchased in a local butcher’s. As a result, there is a
difference in the cost of food between urban and rural households.
Similar to the urban households, food is the biggest area of expenditure, and the rural food baskets follow
the inflation trajectory, with all households seeing notable increases in the cost of food in 2008, followed by

The cost of a healthy food basket
16
a considerable decline in cost in 2010. Again, the household with the highest food costs was the two-parent
household with two children, one attending primary school and one attending secondary school. The cost of
the food basket for this household type ranged from €161 in 2006 to €177.38 in 2008. In 2014, the weekly cost
of the food basket for this household type was €164.79 and amounted to 26.46% of total weekly core
expenditure.
As expected, the one-parent household spent less per week on food than either of the two-parent
households. The cost of the food basket for the one-parent household fluctuated from €102.30 in 2006 to
when it peaked in 2008 at €112.71 per week, demonstrating the impact of inflation on the minimum essential
food basket.
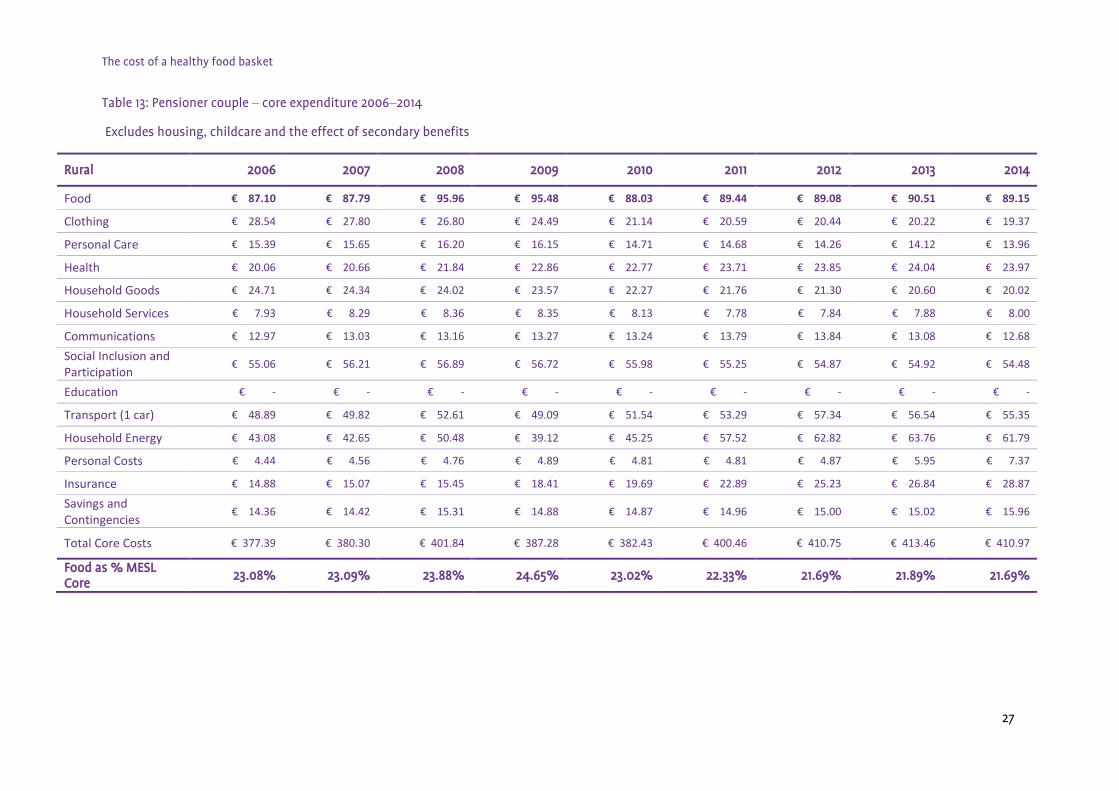
Although the rural pensioner households spent more per week on food than their urban counterparts, food
accounted for a lesser proportion of total core expenditure. This is because a car was included in the rural
basket, plus all associated expenses, such as tax and insurance. The baskets for urban-based pensioners did
not include any transport costs as it was assumed in the MESL research that public transport was available in
urban areas and that pensioners living there were able to make full use of the Free Travel Pass. As a
consequence, food was a smaller percentage of expenditure for rural dwellers as transport costs were also
included in the core expenditure.
The cost of a healthy food basket
17
Table 3: Two parents with two children, at pre-school and primary school ‒ core expenditure 2006‒2014
Excludes housing, childcare and the effect of secondary benefits
Urban 2006
€ 2007
€ 2008
€ 2009
€ 2010
€ 2011
€ 2012
€ 2013
€ 2014
€
Food € 122.31 123.29 134.75 134.08 123.62 125.60 125.09 127.10 125.19
Clothing € 36.58 € 35.63 € 34.34 € 31.39 €27.09 € 26.38 €26.20 €25.91 €24.82
Personal Care € 20.82 € 21.17 € 21.91 € 21.85 €19.90 €19.86 €19.29 €19.09 € 18.88
Health € 13.67 € 14.08 € 14.88 € 15.58 €15.52 €16.16 €16.25 €16.38 € 16.33
Household Goods € 25.63 € 25.24 € 24.91 € 24.44 €23.10 €22.56 €22.09 €21.36 €20.76
Household Services
€ 6.40 € 6.69 € 6.75 € 6.74 €6.56 €6.27 €6.32 €6.36 € 6.46
Communications € 14.09 € 14.16 € 14.30 € 14.41 €14.38 €14.97 €15.03 €14.21 €13.77
Social Inclusion and Participation
€ 72.52 € 74.04 € 74.93 € 74.70 €73.73 €72.77 €72.26 €72.34 €71.76
Education € 18.12 € 15.07 € 14.35 € 12.46 €10.57 €10.08 €9.44 €9.12 €8.70
Transport € 55.03 € 56.08 €59.22 € 55.25 €58.01 €59.98 €64.54 €63.64 €62.30
Household Energy € 31.32 € 36.57 € 34.02 € 40.34 €32.85 €34.42 €39.95 €43.64 €44.84
Personal Costs € 5.24 € 5.39 € 5.62 € 5.77 €€5.68 €5.68 €5.75 €7.03 € 8.71
Insurance € 15.86 € 17.08 € 18.36 € 22.41 €24.38 €29.16 €32.76 €36.00 €39.09
Savings and Contingencies
€ 26.97 € 27.08 € 28.76 €27.95 €27.93 €28.09 €28.18 €28.21 €29.98
Total Core Costs € 464.54 € 471.56 €487.10 €487.37 €463.31 €472.00 €483.16 €490.37 €491.59
Food as % MESL Core
26.33% 26.14% 27.66% 27.51% 26.68% 26.61% 25.89% 25.92% 25.47%

The cost of a healthy food basket
18
Table 4: Two parents with two children, at primary school and in second level ‒ core expenditure 2006‒2014
Excludes housing, childcare and the effect of secondary benefits
Urban 2006 2007 2008 2009 2010 2011 2012 2013 2014
Food € 146.91 € 148.08 € 161.86 € 161.05 € 148.49 € 150.86 € 150.26 € 152.66 € 150.37
Clothing € 47.16 € 45.93 € 44.28 € 40.47 € 34.93 € 34.02 € 33.78 € 33.41 € 32.01
Personal Care € 28.45 € 28.93 € 29.95 € 29.86 € 27.20 € 27.14 € 26.36 € 26.09 € 25.81
Health € 14.13 € 14.55 € 15.38 € 16.10 € 16.04 € 16.70 € 16.80 € 16.93 € 16.88
Household Goods € 26.81 € 26.41 € 26.06 € 25.57 € 24.16 € 23.60 € 23.11 € 22.35 € 21.72
Household Services € 6.40 € 6.69 € 6.75 € 6.74 € 6.56 € 6.27 € 6.32 € 6.36 € 6.46
Communications € 18.77 € 18.86 € 19.05 € 19.21 € 19.17 € 19.95 € 20.03 € 18.93 € 18.34
Social Inclusion and Participation
€ 93.70 € 95.66 € 96.81 € 96.52 € 95.27 € 94.03 € 93.37 € 93.46 € 92.72
Education € 32.12 € 29.29 € 28.92 € 27.03 € 25.07 € 24.57 € 24.41 € 24.41 € 24.25
Transport € 55.03 € 56.08 € 59.22 € 55.25 € 58.01 € 59.98 € 64.54 € 63.64 € 62.30
Household Energy € 31.32 € 36.57 € 34.02 € 40.34 € 32.85 € 34.42 € 39.95 € 43.64 € 44.84
Personal Costs € 5.24 € 5.39 € 5.62 € 5.77 € 5.68 € 5.68 € 5.75 € 7.03 € 8.71
Insurance € 15.76 € 16.98 € 18.25 € 22.28 € 24.24 € 28.98 € 32.56 € 35.79 € 38.85
Savings and Contingencies
€26.97 € 27.08 € 28.76 € 27.95 € 27.93 € 28.09 € 28.18 € 28.21 € 29.98
Total Core Costs € 548.77 € 556.52 574.93 574.14 € 545.58 € 554.32 € 565.43 € 572.90 € 573.23
Food as % MESL Core 26.77% 26.61% 28.15% 28.05% 27.22% 27.22% 26.57% 26.65% 26.23%

The cost of a healthy food basket
19
Table 5: One parent and two children, at pre-school and primary school ‒ core expenditure 2006‒2014
Excludes housing, childcare and the effect of secondary benefits
Urban 2006 2007 2008 2009 2010 2011 2012 2013 2014
Food € 94.00 € 94.75 € 103.57 € 103.05 € 95.01 € 96.53 € 96.14 € 97.68 € 96.22
Clothing € 27.79 € 27.07 € 26.10 € 23.85 € 20.58 € 20.05 € 19.91 € 19.69 € 18.86
Personal Care € 12.39 € 12.60 € 13.04 € 13.00 € 11.84 € 11.82 € 11.48 € 11.36 € 11.24
Health € 11.24 € 11.58 € 12.24 € 12.81 € 12.76 € 13.28 € 13.36 € 13.47 € 13.43
Household Goods € 24.17 € 23.81 € 23.50 € 23.05 € 21.78 € 21.28 € 20.84 € 20.15 € 19.58
Household Services € 6.40 € 6.69 € 6.75 € 6.74 € 6.56 € 6.27 € 6.32 € 6.36 € 6.46
Communications € 9.40 € 9.44 € 9.54 € 9.61 € 9.60 € 9.99 € 10.03 € 9.48 € 9.18
Social Inclusion and Participation
€ 50.09 € 51.15 € 51.76 € 51.61 € 50.93 € 50.27 € 49.92 € 49.97 € 49.57
Education € 18.12 € 15.07 € 14.35 € 12.46 € 10.57 € 10.08 € 9.44 € 9.12 € 8.70
Transport € 29.96 € 30.53 € 32.24 € 30.08 € 31.58 € 32.66 € 35.14 € 34.65 € 33.92
Household Energy € 31.13 € 36.36 € 33.82 € 40.11 € 32.64 € 34.21 € 39.71 € 43.38 € 44.57
Personal Costs € 4.18 € 4.30 € 4.48 € 4.60 € 4.53 € 4.53 € 4.58 € 5.60 € 6.94
Insurance € 10.47 € 11.18 € 11.96 € 14.61 € 15.91 € 18.93 € 21.11 € 23.06 € 24.91
Savings and Contingencies
€ 22.72 € 22.81 € 24.22 € 23.55 € 23.52 € 23.66 € 23.73 € 23.76 € 25.25
Total Core Costs € 352.06 € 357.33 € 367.55 € 369.12 € 347.81 € 353.57 € 361.72 € 367.72 € 368.82
Food as % MESL Core
26.70% 26.52% 28.18% 27.92% 27.32% 27.30% 26.58% 26.56% 26.09%

The cost of a healthy food basket
20
Table 6: Single adult male living alone ‒ core expenditure 2006 to 2014
Excludes housing, childcare and the effect of secondary benefits
Urban 2006 2007 2008 2009 2010 2011 2012 2013 2014
Food € 55.74 € 56.18 € 61.41 € 61.10 € 56.34 € 57.24 € 57.01 € 57.92 € 57.05
Clothing € 15.45 € 15.05 € 14.51 € 13.26 € 11.45 € 11.15 € 11.07 € 10.95 € 10.49
Personal Care € 15.17 € 15.43 € 15.97 € 15.92 € 14.50 € 14.47 € 14.05 € 13.91 € 13.76
Health € 5.18 € 5.34 € 5.64 € 5.91 € 5.88 € 6.12 € 6.16 € 6.21 € 6.19
Household Goods € 7.30 € 7.19 € 7.10 € 6.96 € 6.58 € 6.43 € 6.29 € 6.09 € 5.92
Household Services € 2.85 € 2.98 € 3.01 € 3.01 € 2.92 € 2.80 € 2.82 € 2.83 € 2.88
Communications € 9.43 € 9.48 € 9.57 € 9.65 € 9.63 € 10.02 € 10.06 € 9.51 € 9.21
Social Inclusion and Participation
€ 38.76 € 39.57 € 40.05 € 39.93 € 39.41 € 38.90 € 38.62 € 38.66 € 38.35
Education € 12.16 € 9.54 € 8.99 € 7.61 € 6.47 € 5.99 € 5.65 € 5.47 € 5.26
Transport € 30.37 € 30.95 € 32.68 € 30.49 € 32.02 € 33.10 € 35.62 € 35.12 € 34.38
Household Energy € 20.06 € 23.28 € 21.71 € 25.68 € 21.27 € 22.22 € 25.61 € 27.95 € 28.77
Personal Costs € 4.79 € 4.92 € 5.14 € 5.27 € 5.19 € 5.19 € 5.25 € 6.42 € 7.95
Insurance € 6.83 € 7.22 € 7.69 € 9.41 € 10.25 € 12.14 € 13.44 € 14.59 € 15.67
Savings and Contingencies
€ 9.57 € 9.61 € 10.21 € 9.92 € 9.91 € 9.97 € 10.00 € 10.01 € 10.64
Total Core Costs € 233.67 € 236.75 € 243.68 € 244.12 € 231.81 € 235.75 € 241.67 € 245.65 € 246.53
Food as % MESL Core
23.85% 23.73% 25.20% 25.03% 24.30% 24.28% 23.59% 23.58% 23.14%

The cost of a healthy food basket
21
Table 7: Pensioner couple ‒ core expenditure 2006‒2014
Excludes housing, childcare and the effect of secondary benefits
Urban 2006 2007 2008 2009 2010 2011 2012 2013 2014
Food € 80.51 € 81.15 € 88.70 € 88.26 € 81.37 € 82.67 € 82.34 € 83.66 € 82.41
Clothing € 24.85 € 24.20 € 23.33 € 21.32 € 18.40 € 17.92 € 17.80 € 17.60 € 16.86
Personal Care € 15.51 € 15.77 € 16.33 € 16.28 € 14.83 € 14.80 € 14.37 € 14.23 € 14.07
Health € 20.33 € 20.93 € 22.13 € 23.17 € 23.08 € 24.02 € 24.17 € 24.36 € 24.29
Household Goods € 22.88 € 22.54 € 22.24 € 21.82 € 20.62 € 20.15 € 19.72 € 19.07 € 18.54
Household Services € 6.03 € 6.31 € 6.36 € 6.35 € 6.18 € 5.91 € 5.96 € 5.99 € 6.09
Communications € 12.97 € 13.03 € 13.16 € 13.27 € 13.24 € 13.79 € 13.84 € 13.08 € 12.68
Social Inclusion and Participation
€ 55.06 € 56.21 € 56.89 € 56.72 € 55.98 € 55.25 € 54.87 € 54.92 € 54.48
Education € - € - € - € - € - € - € - € - € -
Transport € - € - € - € - € - € - € - € - € -
Household Energy € 37.13 € 43.64 € 40.47 € 48.12 € 38.50 € 40.47 € 47.32 € 51.73 € 53.06
Personal Costs € 3.98 € 4.09 € 4.27 € 4.38 € 4.31 € 4.31 € 4.37 € 5.33 € 6.61
Insurance € 9.92 € 10.63 € 11.40 € 13.92 € 15.15 € 18.07 € 20.22 € 22.14 € 23.97
Savings and Contingencies
€ 14.36 € 14.42 € 15.31 € 14.88 € 14.87 € 14.96 € 15.00 € 15.02 € 15.96
Total Core Costs € 303.52 € 312.94 € 320.59 € 328.49 € 306.53 € 312.32 € 319.97 € 327.13 € 329.00
Food as % MESL Core
26.52% 25.93% 27.67% 26.87% 26.55% 26.47% 25.73% 25.57% 25.05%

The cost of a healthy food basket
22
Table 8: Female pensioner living alone ‒ core expenditure 2006‒2014
Excludes housing, childcare and the effect of secondary benefits
Urban 2006 2007 2008 2009 2010 2011 2012 2013 2014
Food € 61.15 € 61.64 € 67.37 € 67.03 € 61.80 € 62.79 € 62.54 € 63.54 € 62.59
Clothing € 14.90 € 14.52 € 13.99 € 12.79 € 11.04 € 10.75 € 10.68 € 10.56 € 10.12
Personal Care € 10.68 € 10.87 € 11.25 € 11.21 € 10.22 € 10.19 € 9.90 € 9.80 € 9.69
Health € 10.19 € 10.50 € 11.10 € 11.62 € 11.57 € 12.05 € 12.12 € 12.22 € 12.18
Household Goods € 21.20 € 20.88 € 20.61 € 20.21 € 19.10 € 18.66 € 18.27 € 17.67 € 17.17
Household Services € 5.84 € 6.11 € 6.16 € 6.15 € 5.99 € 5.73 € 5.78 € 5.81 € 5.90
Communications € 13.08 € 13.15 € 13.28 € 13.39 € 13.36 € 13.91 € 13.96 € 13.20 € 12.79
Social Inclusion and Participation
€ 41.31 € 42.17 € 42.68 € 42.55 € 42.00 € 41.45 € 41.16 € 41.20 € 40.87
Education € - € - € - € - € - € - € - € - € -
Transport € - € - € - € - € - € - € - € - € -
Household Energy € 35.82 € 42.17 € 39.08 € 46.49 € 37.04 € 38.96 € 45.64 € 49.90 € 51.17
Personal Costs € 3.82 € 3.92 € 4.09 € 4.20 € 4.13 € 4.13 € 4.18 € 5.11 € 6.33
Insurance € 5.73 € 6.03 € 6.41 € 7.84 € 8.54 € 10.10 € 11.14 € 12.06 € 12.91
Savings and Contingencies
€ 9.57 € 9.61 € 10.21 € 9.92 € 9.91 € 9.97 € 10.00 € 10.01 € 10.64
Total Core Costs € 233.29 € 241.56 € 246.22 € 253.41 € 234.71 € 238.70 € 245.37 € 251.07 € 252.36
Food as % MESL Core
26.21% 25.52% 27.36% 26.45% 26.33% 26.31% 25.49% 25.31% 24.80%

The cost of a healthy food basket
23
Table 9: Two parents and two children, at pre-school and primary school ‒ core expenditure 2006‒2014
Excludes housing, childcare and the effect of secondary benefits
Rural 2006 2007 2008 2009 2010 2011 2012 2013 2014
Food € 134.70 € 135.77 € 148.40 € 147.66 € 136.14 € 138.32 € 137.77 € 139.97 € 137.87
Clothing € 38.60 € 37.59 € 36.24 € 33.12 € 28.58 € 27.84 € 27.65 € 27.34 € 26.19
Personal Care € 20.16 € 20.50 € 21.22 € 21.15 € 19.27 € 19.23 € 18.67 € 18.49 € 18.28
Health € 12.61 € 12.98 € 13.72 € 14.37 € 14.31 € 14.90 € 14.99 € 15.11 € 15.06
Household Goods € 26.77 € 26.36 € 26.02 € 25.53 € 24.12 € 23.57 € 23.07 € 22.31 € 21.69
Household Services € 10.41 € 10.89 € 10.98 € 10.97 € 10.67 € 10.21 € 10.29 € 10.35 € 10.51
Communications € 14.09 € 14.16 € 14.30 € 14.41 € 14.38 € 14.97 € 15.03 € 14.21 € 13.77
Social Inclusion and Participation
€ 75.40 € 76.98 € 77.91 € 77.67 € 76.66 € 75.67 € 75.14 € 75.21 € 74.61
Education € 18.47 € 15.45 € 14.76 € 12.91 € 11.11 € 10.59 € 10.07 € 9.81 € 9.44
Transport (1 car) € 62.13 € 63.31 € 66.86 € 62.38 € 65.50 € 67.72 € 72.87 € 71.85 € 70.34
Household Energy € 42.14 € 42.03 € 49.15 € 39.03 € 44.42 € 55.86 € 61.06 € 62.18 € 60.48
Personal Costs € 5.70 € 5.86 € 6.11 € 6.28 € 6.18 € 6.18 € 6.25 € 7.64 € 9.46
Insurance € 22.04 € 22.61 € 23.42 € 28.02 € 30.05 € 35.17 € 39.02 € 41.87 € 45.21
Savings and Contingencies
€ 26.97 € 27.08 € 28.76 € 27.95 € 27.93 € 28.09 € 28.18 € 28.21 € 29.98
Total Core Costs € 510.17 € 511.59 € 537.84 € 521.45 € 509.32 € 528.32 € 540.07 € 544.54 € 542.90
Food as % MESL Core
26.40% 26.54% 27.59% 28.32% 26.73% 26.18% 25.51% 25.70% 25.40%

The cost of a healthy food basket
24
Table 10: Two parents and two children, at primary school and in second level ‒ core expenditure 2006‒2014
Excludes housing, childcare and the effect of secondary benefits
Rural 2006 2007 2008 2009 2010 2011 2012 2013 2014
Food € 161.00 € 162.29 € 177.38 € 176.49 € 162.73 € 165.33 € 164.67 € 167.30 € 164.79
Clothing € 49.21 € 47.93 € 46.20 € 42.23 € 36.45 € 35.50 € 35.25 € 34.86 € 33.40
Personal Care € 27.29 € 27.75 € 28.72 € 28.64 € 26.09 € 26.04 € 25.28 € 25.03 € 24.75
Health € 13.15 € 13.55 € 14.32 € 14.99 € 14.93 € 15.55 € 15.64 € 15.76 € 15.72
Household Goods € 27.88 € 27.46 € 27.11 € 26.59 € 25.13 € 24.55 € 24.03 € 23.24 € 22.59
Household Services € 10.41 € 10.89 € 10.98 € 10.97 € 10.67 € 10.21 € 10.29 € 10.35 € 10.51
Communications € 18.77 € 18.87 € 19.05 € 19.21 € 19.17 € 19.95 € 20.03 € 18.93 € 18.35
Social Inclusion and Participation
€ 95.48 € 97.49 € 98.66 € 98.36 € 97.08 € 95.82 € 95.15 € 95.24 € 94.48
Education € 31.07 € 28.22 € 27.80 € 25.90 € 23.95 € 23.42 € 23.27 € 23.25 € 23.08
Transport (1 car) € 62.13 € 63.31 € 66.86 € 62.38 € 65.50 € 67.72 € 72.87 € 71.85 € 70.34
Household Energy € 42.14 € 42.03 € 49.15 € 39.03 € 44.42 € 55.86 € 61.06 € 62.18 € 60.48
Personal Costs € 5.70 € 5.86 € 6.11 € 6.28 € 6.18 € 6.18 € 6.25 € 7.64 € 9.46
Insurance € 21.95 € 22.51 € 23.31 € 27.89 € 29.90 € 35.00 € 38.82 € 41.65 € 44.97
Savings and Contingencies
€ 26.97 € 27.08 € 28.76 € 27.95 € 27.93 € 28.09 € 28.18 € 28.21 € 29.98
Total Core Costs € 593.15 € 595.23 € 624.41 € 606.90 € 590.10 € 609.21 € 620.80 € 625.49 € 622.90
Food as % MESL Core
27.14% 27.26% 28.41% 29.08% 27.58% 27.14% 26.53% 26.75% 26.46%

The cost of a healthy food basket
25
Table 11: One parent and two children, pre-school and primary school ‒ core expenditure 2006‒2014
Excludes housing, childcare and the effect of secondary benefits
Rural 2006 2007 2008 2009 2010 2011 2012 2013 2014
Food € 102.30 € 103.12 € 112.71 € 112.15 € 103.40 € 105.05 € 104.63 € 106.31 € 104.71
Clothing € 28.37 € 27.63 € 26.64 € 24.34 € 21.01 € 20.46 € 20.32 € 20.10 € 19.25
Personal Care € 12.36 € 12.57 € 13.01 € 12.97 € 11.82 € 11.79 € 11.45 € 11.34 € 11.21
Health € 10.33 € 10.64 € 11.25 € 11.78 € 11.73 € 12.21 € 12.28 € 12.38 € 12.34
Household Goods € 25.39 € 25.01 € 24.69 € 24.22 € 22.89 € 22.36 € 21.89 € 21.17 € 20.58
Household Services € 9.99 € 10.45 € 10.54 € 10.53 € 10.24 € 9.80 € 9.88 € 9.93 € 10.09
Communications € 9.40 € 9.44 € 9.54 € 9.61 € 9.59 € 9.99 € 10.03 € 9.48 € 9.18
Social Inclusion and Participation
€ 52.66 € 53.77 € 54.41 € 54.25 € 53.54 € 52.85 € 52.48 € 52.53 € 52.11
Education € 18.47 € 15.45 € 14.76 € 12.91 € 11.11 € 10.59 € 10.07 € 9.81 € 9.44
Transport € 62.03 € 63.21 € 66.75 € 62.28 € 65.39 € 67.61 € 72.75 € 71.73 € 70.23
Household Energy € 41.96 € 41.83 € 48.96 € 38.81 € 44.22 € 55.65 € 60.83 € 61.93 € 60.22
Personal Costs € 4.63 € 4.76 € 4.97 € 5.10 € 5.02 € 5.02 € 5.08 € 6.21 € 7.69
Insurance € 16.90 € 16.94 € 17.22 € 20.45 € 21.80 € 25.19 € 27.63 € 29.17 € 31.28
Savings and Contingencies
€ 22.72 € 22.81 € 24.22 € 23.55 € 23.52 € 23.66 € 23.73 € 23.76 € 25.25
Total Core Costs € 417.53 € 417.64 € 439.66 € 422.94 € 415.28 € 432.25 € 443.07 € 445.83 € 443.59
Food as % MESL Core
24.50% 24.69% 25.64% 26.52% 24.90% 24.30% 23.62% 23.84% 23.61%

The cost of a healthy food basket
26
Table 12: Single adult male living alone ‒ core expenditure 2006‒2014
Excludes housing, childcare and the effect of secondary benefits
Rural 2006 2007 2008 2009 2010 2011 2012 2013 2014
Food € 51.65 € 52.07 € 56.91 € 56.62 € 52.21 € 53.04 € 52.83 € 53.68 € 52.87
Clothing € 11.51 € 11.21 € 10.81 € 9.88 € 8.53 € 8.30 € 8.25 € 8.16 € 7.81
Personal Care € 8.32 € 8.46 € 8.76 € 8.73 € 7.95 € 7.94 € 7.71 € 7.63 € 7.55
Health € 4.96 € 5.11 € 5.40 € 5.66 € 5.63 € 5.86 € 5.90 € 5.95 € 5.93
Household Goods € 20.20 € 19.89 € 19.63 € 19.26 € 18.20 € 17.78 € 17.41 € 16.84 € 16.36
Household Services € 9.86 € 10.31 € 10.39 € 10.38 € 10.10 € 9.67 € 9.75 € 9.79 € 9.95
Communications € 9.43 € 9.48 € 9.57 € 9.65 € 9.63 € 10.02 € 10.06 € 9.51 € 9.21
Social Inclusion and Participation
€ 46.86 € 47.85 € 48.42 € 48.28 € 47.65 € 47.03 € 46.70 € 46.75 € 46.37
Education € 12.01 € 9.38 € 8.82 € 7.43 € 6.27 € 5.79 € 5.44 € 5.25 € 5.03
Transport € 38.05 € 38.78 € 40.95 € 38.21 € 40.12 € 41.48 € 44.63 € 44.01 € 43.08
Household Energy € 33.62 € 33.33 € 39.36 € 30.66 € 35.34 € 44.82 € 48.96 € 49.73 € 48.23
Personal Costs € 5.25 € 5.39 € 5.63 € 5.78 € 5.68 € 5.68 € 5.75 € 7.03 € 8.71
Insurance € 12.59 € 12.37 € 12.39 € 14.60 € 15.47 € 17.69 € 19.23 € 20.01 € 21.35
Savings and Contingencies
€ 9.57 € 9.61 € 10.21 € 9.92 € 9.91 € 9.97 € 10.00 € 10.01 € 10.64
Total Core Costs € 273.88 € 273.25 € 287.25 € 275.05 € 272.69 € 285.09 € 292.62 € 294.33 € 293.10
Food as % MESL Core
18.86% 19.05% 19.81% 20.59% 19.15% 18.61% 18.05% 18.24% 18.04%
The cost of a healthy food basket
27
Table 13: Pensioner couple ‒ core expenditure 2006‒2014
Excludes housing, childcare and the effect of secondary benefits
Rural 2006 2007 2008 2009 2010 2011 2012 2013 2014
Food € 87.10 € 87.79 € 95.96 € 95.48 € 88.03 € 89.44 € 89.08 € 90.51 € 89.15
Clothing € 28.54 € 27.80 € 26.80 € 24.49 € 21.14 € 20.59 € 20.44 € 20.22 € 19.37
Personal Care € 15.39 € 15.65 € 16.20 € 16.15 € 14.71 € 14.68 € 14.26 € 14.12 € 13.96
Health € 20.06 € 20.66 € 21.84 € 22.86 € 22.77 € 23.71 € 23.85 € 24.04 € 23.97
Household Goods € 24.71 € 24.34 € 24.02 € 23.57 € 22.27 € 21.76 € 21.30 € 20.60 € 20.02
Household Services € 7.93 € 8.29 € 8.36 € 8.35 € 8.13 € 7.78 € 7.84 € 7.88 € 8.00
Communications € 12.97 € 13.03 € 13.16 € 13.27 € 13.24 € 13.79 € 13.84 € 13.08 € 12.68
Social Inclusion and Participation
€ 55.06 € 56.21 € 56.89 € 56.72 € 55.98 € 55.25 € 54.87 € 54.92 € 54.48
Education € - € - € - € - € - € - € - € - € -
Transport (1 car) € 48.89 € 49.82 € 52.61 € 49.09 € 51.54 € 53.29 € 57.34 € 56.54 € 55.35
Household Energy € 43.08 € 42.65 € 50.48 € 39.12 € 45.25 € 57.52 € 62.82 € 63.76 € 61.79
Personal Costs € 4.44 € 4.56 € 4.76 € 4.89 € 4.81 € 4.81 € 4.87 € 5.95 € 7.37
Insurance € 14.88 € 15.07 € 15.45 € 18.41 € 19.69 € 22.89 € 25.23 € 26.84 € 28.87
Savings and Contingencies
€ 14.36 € 14.42 € 15.31 € 14.88 € 14.87 € 14.96 € 15.00 € 15.02 € 15.96
Total Core Costs € 377.39 € 380.30 € 401.84 € 387.28 € 382.43 € 400.46 € 410.75 € 413.46 € 410.97
Food as % MESL Core
23.08% 23.09% 23.88% 24.65% 23.02% 22.33% 21.69% 21.89% 21.69%

The cost of a healthy food basket
28
Table 14: Female pensioner, living alone ‒ core expenditure 2006‒2014
Excludes Housing, childcare and the effect of secondary benefits
Rural 2006 2007 2008 2009 2010 2011 2012 2013 2014
Food € 64.86 € 65.38 € 71.46 € 71.11 € 65.56 € 66.61 € 66.34 € 67.40 € 66.39
Clothing € 17.04 € 16.60 € 16.00 € 14.63 € 12.62 € 12.29 € 12.21 € 12.07 € 11.57
Personal Care € 11.05 € 11.23 € 11.63 € 11.59 € 10.56 € 10.54 € 10.23 € 10.13 € 10.02
Health € 10.09 € 10.39 € 10.99 € 11.50 € 11.46 € 11.93 € 12.00 € 12.09 € 12.06
Household Goods € 22.05 € 21.72 € 21.44 € 21.03 € 19.87 € 19.41 € 19.01 € 18.38 € 17.87
Household Services € 7.93 € 8.29 € 8.36 € 8.35 € 8.13 € 7.78 € 7.84 € 7.88 € 8.00
Communications € 13.08 € 13.15 € 13.28 € 13.39 € 13.36 € 13.91 € 13.96 € 13.20 € 12.79
Social Inclusion and Participation
€ 41.31 € 42.17 € 42.68 € 42.55 € 42.00 € 41.45 € 41.16 € 41.20 € 40.87
Education € - € - € - € - € - € - € - € - € -
Transport € 48.80 € 49.72 € 52.51 € 48.99 € 51.44 € 53.19 € 57.23 € 56.43 € 55.25
Household Energy € 41.78 € 41.19 € 49.11 € 37.51 € 43.81 € 56.03 € 61.17 € 61.96 € 59.92
Personal Costs € 4.27 € 4.39 € 4.57 € 4.70 € 4.62 € 4.62 € 4.68 € 5.72 € 7.08
Insurance € 11.13 € 10.87 € 10.83 € 12.74 € 13.49 € 15.36 € 16.61 € 17.18 € 18.27
Savings and Contingencies
€ 9.57 € 9.61 € 10.21 € 9.92 € 9.91 € 9.97 € 10.00 € 10.01 € 10.64
Total Core Costs € 302.96 € 304.73 € 323.06 € 308.01 € 306.83 € 323.10 € 332.44 € 333.66 € 330.72
Food as % MESL Core
21.41% 21.46% 22.12% 23.09% 21.37% 20.62% 19.96% 20.20% 20.08%

The cost of a healthy food basket
29
4 Breakdown of the food basket by sub-category
Methodology applied to examine food by sub-category
Section 4 details the cost of the minimum essential food basket for the overall food and non-alcoholic
beverage inflation rate from 2006‒2014. However, it was necessary to use the appropriate sub-index rate for
each food item to examine expenditure on food in more detail. While each method is correct, using the sub-
index rates allowed for a more thorough analysis of the food basket. However, it resulted in the total weekly
cost of the basket being slightly different from that reported in the previous section.
This section provides an in-depth analysis of the food basket by applying the most detailed sub-index rate
possible, correcting each item for inflation individually and then categorising each item under an
appropriate heading. For example, the cost of sausages was corrected for inflation using the CPI rate for
“dried, salted or smoked meat” and categorised under “Meat”, ice-cream was adjusted using the rate for
“edible ices and ice-creams” and categorised under “Snacks and treats”, and margarine was corrected using
the “margarine and other vegetable fats” inflation rate and categorised under “Oils and fats”. The items are
categorised into 12 CPI sub-categories (an additional category of “snacks and treats”, which is not a category
used by the CPI, was created for the purpose of the report for items such as crisps and chocolate). There are a
total of 13 sub-categories detailed in Table 15. Overall, 43 different rates were applied to the food baskets and
recompiled into 13 subtotals, which effectively correspond to the CPI sub-categories.
Table 15: Consumer Price Index food sub-categories
Bread and cereals Sugar, jam and honey
Meat Food products n.e.c.3
Fish Coffee, tea and cocoa
Milk, cheese and eggs Mineral waters, soft drinks, fruit and vegetable juices
Oils and fats Snacks and treats
Fruit Restaurants, cafes, fast food and takeaway food
Vegetables
3 n.e.c. refers to not elsewhere classified and are miscellaneous items. Included in this category are spices, herbs, sauces and condiments.
The cost of a healthy food basket
30
Table 16: Two parents and two children, at pre-school and primary school ‒ food sub-categories 2006‒2014
Urban 2006 2007 2008 2009 2010 2011 2012 2013 2014
Bread and cereals € 15.59 € 15.67 € 17.98 € 17.60 € 16.65 € 17.22 € 16.85 € 17.19 € 16.84
Meat € 35.35 € 35.00 € 36.85 € 36.01 € 32.53 € 31.52 € 31.40 € 32.37 € 31.80
Fish € 7.04 € 6.91 € 7.42 € 7.57 € 7.14 € 7.28 € 7.42 € 7.58 € 7.28
Milk, cheese and eggs € 15.22 € 15.64 € 19.24 € 19.15 € 18.03 € 18.06 € 18.07 € 18.09 € 18.19
Oils and fats € 1.92 € 1.92 € 2.23 € 2.39 € 2.16 € 2.32 € 2.53 € 2.49 € 2.60
Fruit € 13.08 € 13.57 € 14.01 € 13.97 € 12.34 € 13.48 € 12.93 € 13.01 € 12.80
Vegetables € 21.55 € 21.82 € 22.81 € 22.59 € 20.72 € 20.36 € 19.83 € 21.24 € 19.68
Sugar, jam and honey € 0.45 € 0.44 € 0.51 € 0.51 € 0.49 € 0.49 € 0.53 € 0.56 € 0.56
Food products n.e.c. € 2.28 € 2.24 € 2.36 € 2.40 € 2.28 € 2.34 € 2.39 € 2.44 € 2.38
Coffee, tea and cocoa € 2.07 € 2.09 € 2.17 € 2.16 € 2.04 € 2.18 € 2.23 € 2.24 € 2.19
Mineral waters, soft drinks, fruit and vegetable juices
€ 3.86 € 3.90 € 4.09 € 4.00 € 3.52 € 3.73 € 3.80 € 3.86 € 3.79
Snacks and treats € 3.62 € 3.57 € 3.93 € 3.94 € 3.58 € 3.60 € 3.53 € 3.52 € 3.53
Restaurants, cafes, fast food and takeaway food
€ 3.36 € 3.49 € 3.63 € 3.69 € 3.64 € 3.61 € 3.56 € 3.55 € 3.60
Total € 125.39 € 126.26 € 137.23 € 135.98 € 125.12 € 126.19 € 125.07 € 128.14 € 125.24

The cost of a healthy food basket
31
Table 17: Two parents and two children, at pre-school and primary school ‒ food sub-categories 2006‒2014
Rural 2006 2007 2008 2009 2010 2011 2012 2013 2014
Bread and cereals € 19.05 € 19.19 € 22.17 € 21.81 € 20.64 € 21.41 € 20.94 € 21.31 € 20.88
Meat € 39.49 € 39.68 € 41.82 € 41.33 € 37.20 € 36.34 € 36.69 € 37.66 € 37.33
Fish € 7.04 € 6.91 € 7.42 € 7.57 € 7.14 € 7.28 € 7.42 € 7.58 € 7.28
Milk, cheese and eggs € 17.08 € 17.57 € 21.77 € 21.67 € 20.42 € 20.46 € 20.50 € 20.51 € 20.67
Oils and fats € 1.92 € 1.92 € 2.23 € 2.39 € 2.16 € 2.32 € 2.53 € 2.49 € 2.60
Fruit € 13.08 € 13.57 € 14.01 € 13.97 € 12.34 € 13.48 € 12.93 € 13.01 € 12.80
Vegetables € 21.55 € 21.82 € 22.81 € 22.59 € 20.72 € 20.36 € 19.83 € 21.24 € 19.68
Sugar, jam and honey € 0.45 € 0.44 € 0.51 € 0.51 € 0.49 € 0.49 € 0.53 € 0.56 € 0.56
Food products n.e.c. € 2.28 € 2.24 € 2.36 € 2.40 € 2.28 € 2.34 € 2.39 € 2.44 € 2.38
Coffee, tea and cocoa € 2.90 € 2.93 € 3.04 € 3.04 € 2.90 € 3.06 € 3.11 € 3.13 € 3.04
Mineral waters, soft drinks, fruit and vegetable juices
€ 3.86 € 3.90 € 4.09 € 4.00 € 3.52 € 3.73 € 3.80 € 3.86 € 3.79
Snacks and treats € 3.62 € 3.57 € 3.93 € 3.94 € 3.58 € 3.60 € 3.53 € 3.52 € 3.53
Restaurants, cafes, fast food and takeaway food
€ 3.36 € 3.49 € 3.62 € 3.68 € 3.64 € 3.60 € 3.55 € 3.54 € 3.59
Total € 135.68 € 137.23 € 149.78 € 148.9 € 137.03 € 138.47 € 137.75 € 140.85 € 138.13

The cost of a healthy food basket
32
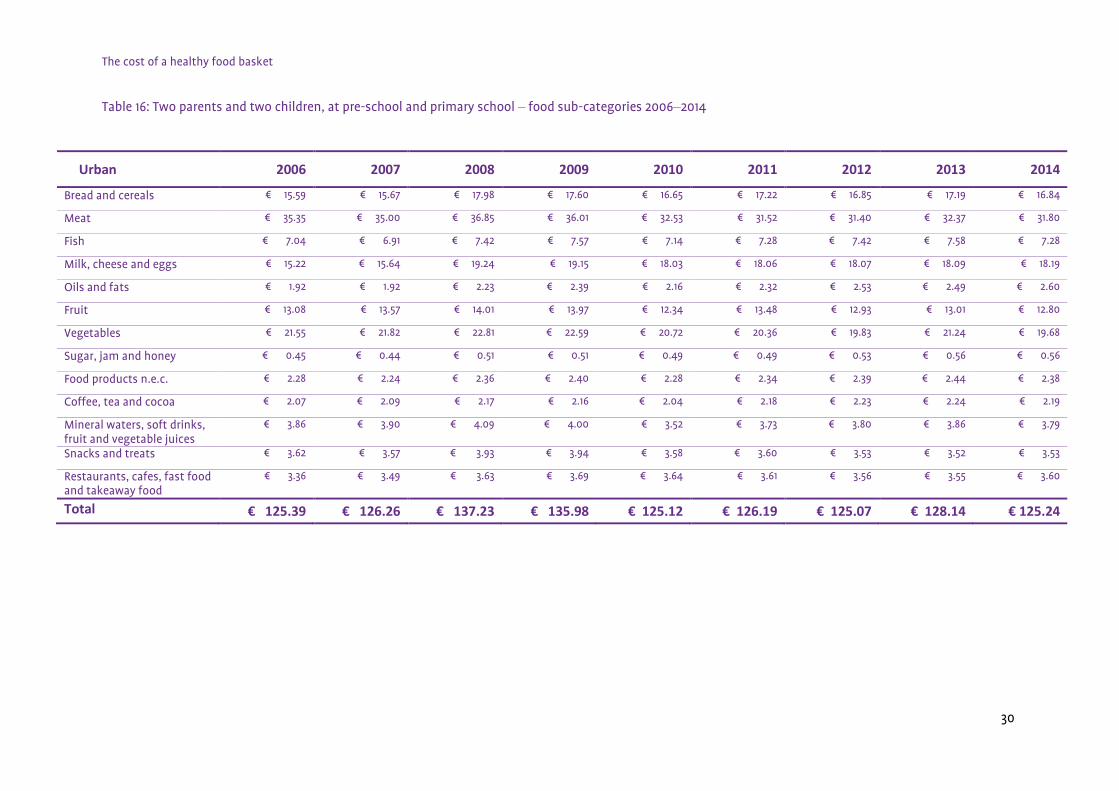
Two Parents and two children, at pre-school and primary school
Tables 16 and 17 detail the cost of each sub-category of food from 2006 to 2014 for the two–parent, two–child
household type. A selection of the sub-categories are analysed below.
The category of “Meat” was by far the largest one of expenditure, yet spending on “Meat” fell between 2006
and 2014. In 2014, this sub-category accounted for 25.39% of the total basket, whereas in 2006, it was
28.19%. For this household type, the cost of “Meat” in the urban minimum essential food basket was 10.04%
less in 2014 than it was in 2006. As the sub-category of “Meat” includes meat products purchased in local
butcher shops, there was a difference in the cost of meat products in the urban and rural food basket. In
2014, “Meat” accounted for 27.02% of the total rural food basket, while in 2006 it was higher again, at
29.10%. Despite meat remaining the biggest area of food expenditure for this rural household, it was 5.47%
less expensive in 2014 than it was in 2006.
In both the urban and rural basket, all “Fruit” and “Vegetables”, were bought in Aldi and Lidl. When these
two categories are combined, they form a very significant proportion of the basket. In 2014, “Fruit” and
“Vegetables” came to €32.48 per week and accounted for 25.93% of the urban food basket and 23.38% of the
rural food basket. However, these two sub-categories were less expensive in 2014 than they were in 2006.
The sub-category of “Fruit” was 2.4% cheaper in 2014 than it was in 2006, while “Vegetables” were 8.67%
cheaper in 2014 than they were in 2006.
“Bread and cereals” and “Milk, cheese and eggs” are two other significant categories of food expenditure.
Following the views of the focus groups, the rural food basket contains milk and bread products purchased in
local stores rather than in a multiple store, and hence there is a difference in cost between the urban and
rural basket for these two sub-categories of expenditure. Both of these categories recorded increases in the
2006‒2014 period, peaking in 2008 when the overall inflation rate for food was at its highest in the period
being analysed. In the urban minimum essential food basket, “Bread and cereals” were 8.01% more
expensive in 2014 than they were in 2006, while “Milk, cheese and eggs” were 19.51% more expensive in 2014
than they were in 2006. For the rural household, “Bread and cereals” were 9.6% more expensive in 2014 than
they were in 2006, while “Milk, cheese and eggs” were 21.02% more expensive in 2014 than they were in
2006.

The cost of a healthy food basket
33
Table 18: Two parents and two children, at primary school and in second level ‒ food sub-categories 2006‒2014
Urban 2006 2007 2008 2009 2010 2011 2012 2013 2014
Bread and cereals € 18.37 € 18.47 € 21.19 € 20.73 € 19.61 € 20.29 € 19.87 € 20.26 € 19.86
Meat € 41.48 € 41.06 € 43.25 € 42.24 € 38.13 € 36.94 € 36.80 € 37.93 € 37.25
Fish € 8.16 € 8.01 € 8.61 € 8.77 € 8.28 € 8.43 € 8.60 € 8.76 € 8.41
Milk, cheese and eggs € 17.36 € 17.85 € 21.95 € 21.84 € 20.57 € 20.59 € 20.61 € 20.63 € 20.74
Oils and fats € 2.21 € 2.20 € 2.56 € 2.75 € 2.48 € 2.67 € 2.91 € 2.87 € 2.99
Fruit € 15.69 € 16.27 € 16.82 € 16.77 € 14.87 € 16.21 € 15.60 € 15.71 € 15.48
Vegetables € 25.38 € 25.68 € 26.86 € 26.60 € 24.40 € 23.99 € 23.38 € 25.01 € 23.20
Sugar, jam and honey € 0.53 € 0.52 € 0.59 € 0.59 € 0.57 € 0.57 € 0.62 € 0.65 € 0.65
Food products n.e.c. € 2.66 € 2.62 € 2.77 € 2.81 € 2.67 € 2.74 € 2.80 € 2.86 € 2.79
Coffee, tea and cocoa € 2.24 € 2.26 € 2.35 € 2.34 € 2.21 € 2.37 € 2.41 € 2.43 € 2.37
Mineral waters, soft drinks, fruit and vegetable juices
€ 4.54 € 4.60 € 4.81 € 4.71 € 4.15 € 4.39 € 4.48 € 4.54 € 4.46
Snacks and treats € 4.30 € 4.24 € 4.67 € 4.67 € 4.25 € 4.28 € 4.22 € 4.20 € 4.21
Restaurants, cafes, fast food and takeaway food
€ 7.52 € 7.81 € 8.12 € 8.26 € 8.14 € 8.07 € 7.95 € 7.94 € 8.06
Total € 150.44 € 151.59 € 164.55 € 163.08 € 150.33 € 151.54 € 150.25 € 153.79 € 150.47
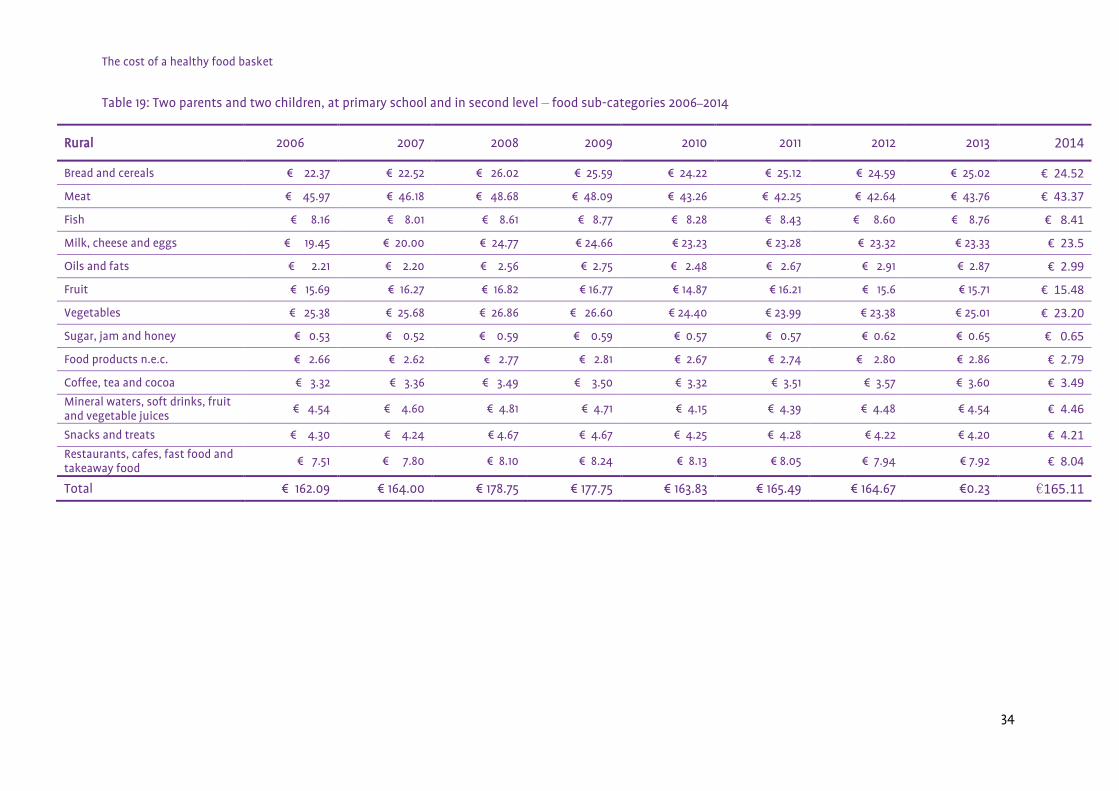
The cost of a healthy food basket
34
Table 19: Two parents and two children, at primary school and in second level ‒ food sub-categories 2006‒2014
Rural 2006 2007 2008 2009 2010 2011 2012 2013 2014
Bread and cereals € 22.37 € 22.52 € 26.02 € 25.59 € 24.22 € 25.12 € 24.59 € 25.02 € 24.52
Meat € 45.97 € 46.18 € 48.68 € 48.09 € 43.26 € 42.25 € 42.64 € 43.76 € 43.37
Fish € 8.16 € 8.01 € 8.61 € 8.77 € 8.28 € 8.43 € 8.60 € 8.76 € 8.41
Milk, cheese and eggs € 19.45 € 20.00 € 24.77 € 24.66 € 23.23 € 23.28 € 23.32 € 23.33 € 23.5
Oils and fats € 2.21 € 2.20 € 2.56 € 2.75 € 2.48 € 2.67 € 2.91 € 2.87 € 2.99
Fruit € 15.69 € 16.27 € 16.82 € 16.77 € 14.87 € 16.21 € 15.6 € 15.71 € 15.48
Vegetables € 25.38 € 25.68 € 26.86 € 26.60 € 24.40 € 23.99 € 23.38 € 25.01 € 23.20
Sugar, jam and honey € 0.53 € 0.52 € 0.59 € 0.59 € 0.57 € 0.57 € 0.62 € 0.65 € 0.65
Food products n.e.c. € 2.66 € 2.62 € 2.77 € 2.81 € 2.67 € 2.74 € 2.80 € 2.86 € 2.79
Coffee, tea and cocoa € 3.32 € 3.36 € 3.49 € 3.50 € 3.32 € 3.51 € 3.57 € 3.60 € 3.49
Mineral waters, soft drinks, fruit and vegetable juices
€ 4.54 € 4.60 € 4.81 € 4.71 € 4.15 € 4.39 € 4.48 € 4.54 € 4.46
Snacks and treats € 4.30 € 4.24 € 4.67 € 4.67 € 4.25 € 4.28 € 4.22 € 4.20 € 4.21
Restaurants, cafes, fast food and takeaway food
€ 7.51 € 7.80 € 8.10 € 8.24 € 8.13 € 8.05 € 7.94 € 7.92 € 8.04
Total € 162.09 € 164.00 € 178.75 € 177.75 € 163.83 € 165.49 € 164.67 €0.23 €165.11
The cost of a healthy food basket
35
Two Parents and Two Children, at Primary and in Second Level
The minimum essential food basket is more expensive for the two-parent, two-child household where one is
at primary school and one in second level, than it is for any of the other household types analysed in this
paper (Tables 18 and 19). Having an adolescent in the household has a marked effect on the cost of the
minimum essential food basket. In 2014, for example, the urban two-parent household with two children,
one of which was an adolescent, needed to spend €5.45 more per week on “Meat” and €3.52 more per week
on “Vegetables” than the equivalent household with a pre-school and primary school-aged child.
“Meat” purchased in a local butcher’s was the largest sub-category of expenditure and has consistently been
so from 2006 to 2014, peaking in 2008 when overall food inflation increased by 9.3% between 2007 and
2008. In 2014, expenditure on “Meat” amounted to 24.75% of the total urban food basket and 26.27% of the
rural food basket. However, “Meat” was less expensive in 2014 than it was in 2006.
While “Meat” cost less in 2014 than it did in 2006, other food products recorded increases. “Bread and
cereals”, and “Milk, cheese and eggs” were more expensive in 2014 than they were in 2006, but so were other
less notable sub-categories of expenditure. For example, although expenditure on “Oils and fats”, which
includes margarine and oil, was relatively low, this sub-category of expenditure was 35.29% more expensive
in 2014 than it was in 2006. Similarly, the sub-category of “Sugar, jam and honey” also recorded a substantial
increase, and this category was 22.64% more expensive in 2014 than it was in 2006.
Expenditure on “Restaurants, cafes, fast food and takeaway food” was higher for this household than any of
the other households with children. In 2014, this sub-category came to approximately 5% of the total weekly
food expenditure. Included in this sub-category is a sandwich from a deli once a week for the adolescent.
Focus groups included this item as they regarded being able to purchase a sandwich once a week, rather
than having homemade sandwiches, a necessary part of social inclusion and participation for adolescent
children, enabling them to participate in activities that are considered the norm by society in general.
Overall, for this household type, the largest categories of expenditure were “Meat”, “Bread and cereals”,
“Milk, cheese and eggs”, and “Fruit” and “Vegetables”. “Sugar, jam and honey” and “Coffee, tea and cocoa”
were the least expensive components of this household’s food basket.

The cost of a healthy food basket
36
Table 20: One parent and two children, at pre-school and primary school ‒ food sub-categories 2006‒2014
Urban 2006 2007 2008 2009 2010 2011 2012 2013 2014
Bread and cereals € 11.88 € 11.94 € 13.68 € 13.38 € 12.65 € 13.08 € 12.79 € 13.05 € 12.79
Meat € 29.71 € 29.40 € 31.01 € 30.23 € 27.16 € 26.28 € 26.18 € 26.94 € 26.44
Fish € 5.41 € 5.32 € 5.72 € 5.82 € 5.49 € 5.58 € 5.68 € 5.74 € 5.48
Milk, cheese and eggs € 10.42 € 10.70 € 13.13 € 13.08 € 12.30 € 12.31 € 12.30 € 12.31 € 12.36
Oils and fats € 1.40 € 1.40 € 1.62 € 1.75 € 1.58 € 1.70 € 1.86 € 1.83 € 1.91
Fruit € 10.20 € 10.60 € 10.91 € 10.88 € 9.56 € 10.44 € 10.00 € 10.06 € 9.88
Vegetables € 17.43 € 17.64 € 18.48 € 18.31 € 16.77 € 16.53 € 16.11 € 17.16 € 15.97
Sugar, jam and honey € 0.36 € 0.35 € 0.40 € 0.41 € 0.39 € 0.39 € 0.43 € 0.45 € 0.45
Food products n.e.c. € 1.89 € 1.86 € 1.96 € 1.99 € 1.89 € 1.94 € 1.99 € 2.02 € 1.97
Coffee, tea and cocoa € 0.81 € 0.81 € 0.85 € 0.85 € 0.80 € 0.88 € 0.90 € 0.91 € 0.90
Mineral waters, soft drinks, fruit and vegetable juices
€ 3.33 € 3.36 € 3.53 € 3.45 € 3.04 € 3.22 € 3.27 € 3.33 € 3.27
Snacks and treats € 2.54 € 2.51 € 2.79 € 2.80 € 2.54 € 2.56 € 2.49 € 2.50 € 2.52
Restaurants, cafes, fast food and takeaway food
€ 2.00 € 2.08 € 2.16 € 2.20 € 2.17 € 2.15 € 2.12 € 2.11 € 2.14
Total € 97.38 € 97.97 € 106.24 € 105.15 € 96.34 € 97.06 € 96.12 € 98.41 € 96.08

The cost of a healthy food basket
37
Table 21: One parent and two children, at pre-school and primary school ‒ food sub-categories 2006‒2014
Rural 2006 2007 2008 2009 2010 2011 2012 2013 2014
Bread and cereals € 14.47 € 14.58 € 16.83 € 16.54 € 15.65 € 16.22 € 15.86 € 16.15 € 15.82
Meat € 31.45 € 31.54 € 33.28 € 32.79 € 29.40 € 28.68 € 28.90 € 29.63 € 29.32
Fish € 5.41 € 5.32 € 5.72 € 5.82 € 5.49 € 5.58 € 5.68 € 5.74 € 5.48
Milk, cheese and eggs € 11.46 € 11.79 € 14.56 € 14.49 € 13.64 € 13.66 € 13.66 € 13.67 € 13.75
Oils and fats € 1.40 € 1.40 € 1.62 € 1.75 € 1.58 € 1.70 € 1.86 € 1.83 € 1.91
Fruit € 10.20 € 10.60 € 10.91 € 10.88 € 9.56 € 10.44 € 10.00 € 10.06 € 9.88
Vegetables € 17.43 € 17.64 € 18.48 € 18.31 € 16.77 € 16.53 € 16.11 € 17.16 € 15.97
Sugar, jam and honey € 0.36 € 0.35 € 0.40 € 0.41 € 0.39 € 0.39 € 0.43 € 0.45 € 0.45
Food products n.e.c. € 1.89 € 1.86 € 1.96 € 1.99 € 1.89 € 1.94 € 1.99 € 2.02 € 1.97
Coffee, tea and cocoa € 2.08 € 2.10 € 2.17 € 2.18 € 2.08 € 2.20 € 2.24 € 2.25 € 2.19
Mineral waters, soft drinks,
fruit and vegetable juices
€ 3.33 € 3.36 € 3.53 € 3.45 € 3.04 € 3.22 € 3.27 € 3.33 € 3.27
Snacks and treats € 2.54 € 2.51 € 2.79 € 2.80 € 2.54 € 2.56 € 2.49 € 2.50 € 2.52
Restaurants, cafes, fast
food and takeaway food
€ 2.02 € 2.10 € 2.18 € 2.22 € 2.19 € 2.17 € 2.13 € 2.13 € 2.16
Total € 104.04 € 105.15 € 114.43 € 113.63 € 104.22 € 105.29 € 104.62 € 106.92 € 104.69

The cost of a healthy food basket
38
One parent and two children, at pre-school and primary school
Similarly to the other households with children, “Meat” was the largest sub-category of expenditure for the
one parent and two children, one at pre-school and one at primary school, household type, and in 2014, it
accounted for 27.52% of the urban food basket and 28.01% of the rural food basket (Tables 20 and 21). “Fish”
was a much smaller proportion of the food basket, accounting for approximately 5% of the food basket in
2014.
The rural one-parent household, similar to the other rural households, spent more on “Bread and cereals”
and “Milk, cheese and eggs” when compared to their urban counterparts as they bought a proportion of
these items locally. Nevertheless, these two categories of expenditure were each a significant proportion of
the minimum essential food basket, and these items were more expensive in 2014 than they were in 2006.
For example, in the rural basket, “Breads and cereals” were 9.33% more expensive in 2014 than in 2006, while
the corresponding figure for the urban basket was 7.66%.
“Fruit” and “Vegetables”, all of which were bought in Aldi and Lidl, accounted for a significant proportion of
the minimum essential food basket for this household type. The combined cost of these two sub-categories
of expenditure in 2014 was €25.85. This accounted for 26.9% of the urban food basket and 24.69% of the
rural basket. However, these two categories of expenditure cost less in 2014 than they did in 2006. “Fruit” for
this household type cost approximately 3% less in 2014 than they did in 2006, while “Vegetables” cost
approximately 8% less in 2014 than they did in 2006.
The least expensive component of the minimum essential food basket for this household type was “Sugar,
jam and honey”. In 2014, the total cost of this sub-category was €0.45 per week, which is approximately
0.4% of the urban and rural food baskets. Similarly, expenditure on “Snacks and treats” was also relatively
low, at €2.52 per week, in 2014 and accounted for just over 2% of the urban and rural minimum essential
food basket.

The cost of a healthy food basket
39
Table 22: Single adult male of working age ‒ food sub-categories 2006‒2014
Urban 2006 2007 2008 2009 2010 2011 2012 2013 2014
Bread and cereals € 4.47 € 4.50 € 5.22 € 5.16 € 4.89 € 5.10 € 5.03 € 5.13 € 5.04
Meat € 14.34 € 14.58 € 15.59 € 15.38 € 13.75 € 13.64 € 13.59 € 13.62 € 13.60
Fish € 3.56 € 3.53 € 3.82 € 3.84 € 3.63 € 3.63 € 3.68 € 3.52 € 3.27
Milk, cheese and eggs € 3.64 € 3.73 € 4.50 € 4.47 € 4.21 € 4.20 € 4.20 € 4.20 € 4.18
Oils and fats € 1.10 € 1.10 € 1.27 € 1.38 € 1.25 € 1.35 € 1.47 € 1.46 € 1.51
Fruit € 7.19 € 7.50 € 7.70 € 7.67 € 6.60 € 7.25 € 6.86 € 6.85 € 6.67
Vegetables € 5.22 € 5.30 € 5.60 € 5.56 € 5.18 € 5.21 € 5.15 € 5.30 € 5.12
Sugar, jam and honey € 0.17 € 0.17 € 0.19 € 0.19 € 0.19 € 0.19 € 0.21 € 0.21 € 0.21
Food products n.e.c. € 2.07 € 2.03 € 2.14 € 2.18 € 2.08 € 2.14 € 2.17 € 2.23 € 2.17
Coffee, tea and cocoa € 2.02 € 2.04 € 2.11 € 2.11 € 1.98 € 2.07 € 2.10 € 2.11 € 2.05
Mineral waters, soft drinks, fruit and vegetable juices
€ 1.64 € 1.66 € 1.74 € 1.70 € 1.50 € 1.58 € 1.62 € 1.64 € 1.61
Snacks and treats € 0.83 € 0.82 € 0.92 € 0.93 € 0.85 € 0.87 € 0.87 € 0.89 € 0.91
Restaurants, cafes, fast food and takeaway food
€ 9.53 € 9.89 € 10.28 € 10.46 € 10.30 € 10.21 € 10.07 € 10.05 € 10.21
Total € 55.78 € 56.85 € 61.10 € 61.04 € 56.40 € 57.44 € 57.01 € 57.20 € 56.55

The cost of a healthy food basket
40
Table 23: Single adult male of working age ‒ food sub-categories 2006‒2014
Rural 2006 2007 2008 2009 2010 2011 2012 2013 2014
Bread and cereals € 4.49 € 4.51 € 5.24 € 5.18 € 4.90 € 5.12 € 5.04 € 5.15 € 5.06
Meat € 10.53 € 10.81 € 11.31 € 11.32 € 10.31 € 10.22 € 10.24 € 10.46 € 10.48
Fish € 2.24 € 2.21 € 2.38 € 2.41 € 2.27 € 2.30 € 2.34 € 2.31 € 2.19
Milk, cheese and eggs € 3.97 € 4.06 € 4.94 € 4.91 € 4.62 € 4.62 € 4.62 € 4.62 € 4.60
Oils and fats € 1.10 € 1.10 € 1.27 € 1.38 € 1.25 € 1.35 € 1.47 € 1.46 € 1.51
Fruit € 7.19 € 7.50 € 7.70 € 7.67 € 6.60 € 7.25 € 6.86 € 6.85 € 6.67
Vegetables € 5.22 € 5.30 € 5.60 € 5.56 € 5.18 € 5.21 € 5.15 € 5.30 € 5.12
Sugar, jam and honey € 0.17 € 0.17 € 0.19 € 0.19 € 0.19 € 0.19 € 0.21 € 0.21 € 0.21
Food products n.e.c. € 2.07 € 2.03 € 2.14 € 2.18 € 2.08 € 2.14 € 2.17 € 2.23 € 2.17
Coffee, tea and cocoa € 2.51 € 2.52 € 2.62 € 2.59 € 2.41 € 2.54 € 2.57 € 2.59 € 2.52
Mineral waters, soft drinks,
fruit and vegetable juices
€ 1.64 € 1.66 € 1.74 € 1.70 € 1.50 € 1.58 € 1.62 € 1.64 € 1.61
Snacks and treats € 0.83 € 0.82 € 0.92 € 0.93 € 0.85 € 0.87 € 0.87 € 0.89 € 0.91
Restaurants, cafes, fast
food and takeaway food
€ 4.91 € 5.09 € 5.30 € 5.39 € 5.31 € 5.26 € 5.19 € 5.17 € 5.26
Extra for visitors € 1.63 € 1.64 € 1.80 € 1.79 € 1.65 € 1.67 € 1.67 € 1.69 € 1.67
Total € 48.48 € 49.43 € 53.15 € 53.20 € 49.10 € 50.30 € 50.00 € 50.56 € 49.97

The cost of a healthy food basket
41
Single adult male of working age
The single adult male of working age spent the least on food per week when compared to the other
household types under consideration (Tables 22 and 23). The sub-categories for this household type followed
the same trend as the other households, with costs rising in 2008 and the sub-category of “Meat”
accounting for the largest share of expenditure. In 2014, the sub-category of “Meat” accounted for 24.05% of
the urban basket and 21% of the rural basket. However, while expenditure on “Meat” was still the largest
category of expenditure, it cost less in 2014 than in 2006.
“Vegetables” and “Fruit” also accounted for a large proportion of the total cost of the food basket. The
combined spend on these two categories was €11.79 per week, which accounted for 20.81% of the urban
basket and 23.59% of the rural basket. Again, similarly to other household types, these two sub-categories of
expenditure were less expensive in 2014 than they were in 2006. “Fruit” cost approximately 7% less in 2014
than in 2006, while “Vegetables” cost approximately 2% less in 2014 than in 2006.
One of the most notable sub-categories for a single adult male living in an urban area is “Restaurants, Cafes,
fast food and takeaway food”. Expenditure for this sub-category was €10.21 per week, which was 18.05% of
the total food basket. This category is made up of a sandwich from a deli once a week, a takeaway meal once
every six weeks and a small sum of money to have Sunday lunch out once every six weeks. This reflects the
views of focus groups. The focus groups regarded these items as a normal part of the spending pattern on
food for a single adult living alone and also viewed them as necessary from a social inclusion and
participation perspective.
The rural household spends less on “Restaurants, cafes, fast food and takeaway food” in comparison to its
urban counterpart. There are a number of reasons for this. Firstly, unlike single adult households in urban
areas, rural focus groups did not specify money for an occasional Sunday lunch out and instead opted to
include additional money for visitors, which has been classified under the sub-category “Extra for visitors”.
Secondly, while the rural minimum essential food basket contains a sandwich from a deli once a week and a
takeaway once every six weeks, in line with the urban basket, these items cost less in rural areas.

The cost of a healthy food basket
42
Table 24: Pensioner couple ‒ food sub-categories 2006‒2014
Urban 2006 2007 2008 2009 2010 2011 2012 2013 2014
Bread and cereals € 8.05 € 8.08 € 9.18 € 8.95 € 8.44 € 8.59 € 8.29 € 8.38 € 8.19
Meat € 24.97 € 25.66 € 27.04 € 27.06 € 24.33 € 23.99 € 24.48 € 24.91 € 24.95
Fish € 4.10 € 4.05 € 4.38 € 4.43 € 4.18 € 4.20 € 4.27 € 4.18 € 3.93
Milk, cheese and eggs € 5.91 € 6.03 € 7.34 € 7.29 € 6.88 € 6.89 € 6.91 € 6.92 € 6.92
Oils and fats € 1.38 € 1.37 € 1.60 € 1.72 € 1.56 € 1.68 € 1.83 € 1.81 € 1.87
Fruit € 5.97 € 6.21 € 6.40 € 6.38 € 5.54 € 6.09 € 5.78 € 5.77 € 5.64
Vegetables € 12.75 € 12.96 € 13.60 € 13.48 € 12.34 € 12.19 € 11.85 € 12.67 € 11.76
Sugar, jam and honey € 0.18 € 0.18 € 0.20 € 0.20 € 0.19 € 0.19 € 0.22 € 0.22 € 0.22
Food products n.e.c. € 1.06 € 1.04 € 1.11 € 1.12 € 1.06 € 1.09 € 1.11 € 1.12 € 1.13
Coffee, tea and cocoa € 3.03 € 3.06 € 3.17 € 3.17 € 2.98 € 3.10 € 3.16 € 3.17 € 3.08
Mineral waters, soft drinks,
fruit and vegetable juices
€ 1.81 € 1.82 € 1.91 € 1.87 € 1.65 € 1.75 € 1.78 € 1.81 € 1.77
Snacks and treats € 2.61 € 2.59 € 2.83 € 2.82 € 2.58 € 2.58 € 2.51 € 2.45 € 2.42
Restaurants, cafes, fast
food and takeaway food
...
... ... ... ... ... ... ...
Extra for visitors € 9.94 € 10.01 € 10.95 € 10.89 € 10.04 € 10.20 € 10.16 € 10.32 € 10.17
Total € 81.75 € 83.08 € 89.71 € 89.37 € 81.76 € 82.55 € 82.34 € 83.72 € 82.06
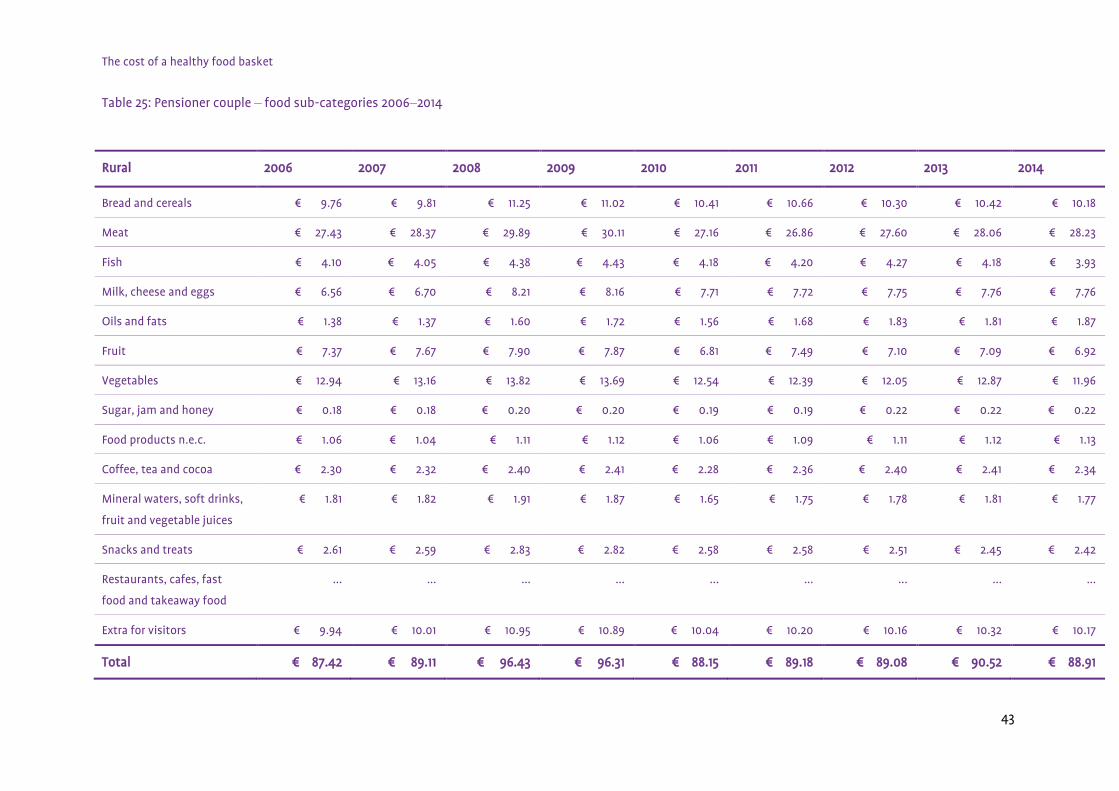
The cost of a healthy food basket
43
Table 25: Pensioner couple ‒ food sub-categories 2006‒2014
Rural 2006 2007 2008 2009 2010 2011 2012 2013 2014
Bread and cereals € 9.76 € 9.81 € 11.25 € 11.02 € 10.41 € 10.66 € 10.30 € 10.42 € 10.18
Meat € 27.43 € 28.37 € 29.89 € 30.11 € 27.16 € 26.86 € 27.60 € 28.06 € 28.23
Fish € 4.10 € 4.05 € 4.38 € 4.43 € 4.18 € 4.20 € 4.27 € 4.18 € 3.93
Milk, cheese and eggs € 6.56 € 6.70 € 8.21 € 8.16 € 7.71 € 7.72 € 7.75 € 7.76 € 7.76
Oils and fats € 1.38 € 1.37 € 1.60 € 1.72 € 1.56 € 1.68 € 1.83 € 1.81 € 1.87
Fruit € 7.37 € 7.67 € 7.90 € 7.87 € 6.81 € 7.49 € 7.10 € 7.09 € 6.92
Vegetables € 12.94 € 13.16 € 13.82 € 13.69 € 12.54 € 12.39 € 12.05 € 12.87 € 11.96
Sugar, jam and honey € 0.18 € 0.18 € 0.20 € 0.20 € 0.19 € 0.19 € 0.22 € 0.22 € 0.22
Food products n.e.c. € 1.06 € 1.04 € 1.11 € 1.12 € 1.06 € 1.09 € 1.11 € 1.12 € 1.13
Coffee, tea and cocoa € 2.30 € 2.32 € 2.40 € 2.41 € 2.28 € 2.36 € 2.40 € 2.41 € 2.34
Mineral waters, soft drinks,
fruit and vegetable juices
€ 1.81 € 1.82 € 1.91 € 1.87 € 1.65 € 1.75 € 1.78 € 1.81 € 1.77
Snacks and treats € 2.61 € 2.59 € 2.83 € 2.82 € 2.58 € 2.58 € 2.51 € 2.45 € 2.42
Restaurants, cafes, fast
food and takeaway food
... ... ... ... ... ... ... ... ...
Extra for visitors € 9.94 € 10.01 € 10.95 € 10.89 € 10.04 € 10.20 € 10.16 € 10.32 € 10.17
Total € 87.42 € 89.11 € 96.43 € 96.31 € 88.15 € 89.18 € 89.08 € 90.52 € 88.91

The cost of a healthy food basket
44
Pensioner couple
“Meat” was the largest sub-category of expenditure for the pensioner couple household type (Tables 24 and
25). However, unlike all of the other households under consideration, this sub-category was marginally more
expensive for the rural household in 2014 than it was in 2006. Rural focus groups indicated a preference for
beef over other types of meat, and so included in the food basket for the rural pensioner couple are a
number of beef products, such as roast beef and stewing steak, that are not included in the other food
baskets. Beef, unlike some other meat products, such as chicken, has increased in cost and, as a result, the
cost of the overall sub-category of “Meat” was more expensive for rural households in 2014 than it was in
2006.
Again, similarly to other households, “Fruit” and “Vegetables” accounted for a notable proportion of the
total food basket. In 2014, the combined weekly total of these two sub-categories of expenditure in the
urban basket was €17.40, while the cost for the rural basket was slightly higher at €18.88. The rural pensioner
households continued to buy a small proportion of their fruit and vegetables locally, reflecting the shopping
patterns of rural pensioners, and hence the difference in cost between the two baskets. Both of these sub-
categories were less expensive in 2014 compared to 2006.
While spending on “Oils and fats” was relatively small at €1.87 per week in 2014, it is interesting to note that
this category of expenditure was 35% more expensive in 2014 than it was in 2006, while “Sugar, jam and
honey” was 22% more expensive in 2014 than it was in 2006.
Finally, also included in the basket for this household type is approximately €10 per week to buy additional
food for visitors. This falls under the “Extra for visitors” category. Focus groups spoke of the importance of
being able to afford to have friends or relatives visit and saw this as important for social and psychological
wellbeing. This sub-category of expenditure accounted for 12% of the urban food basket and 11% of the rural
food basket.
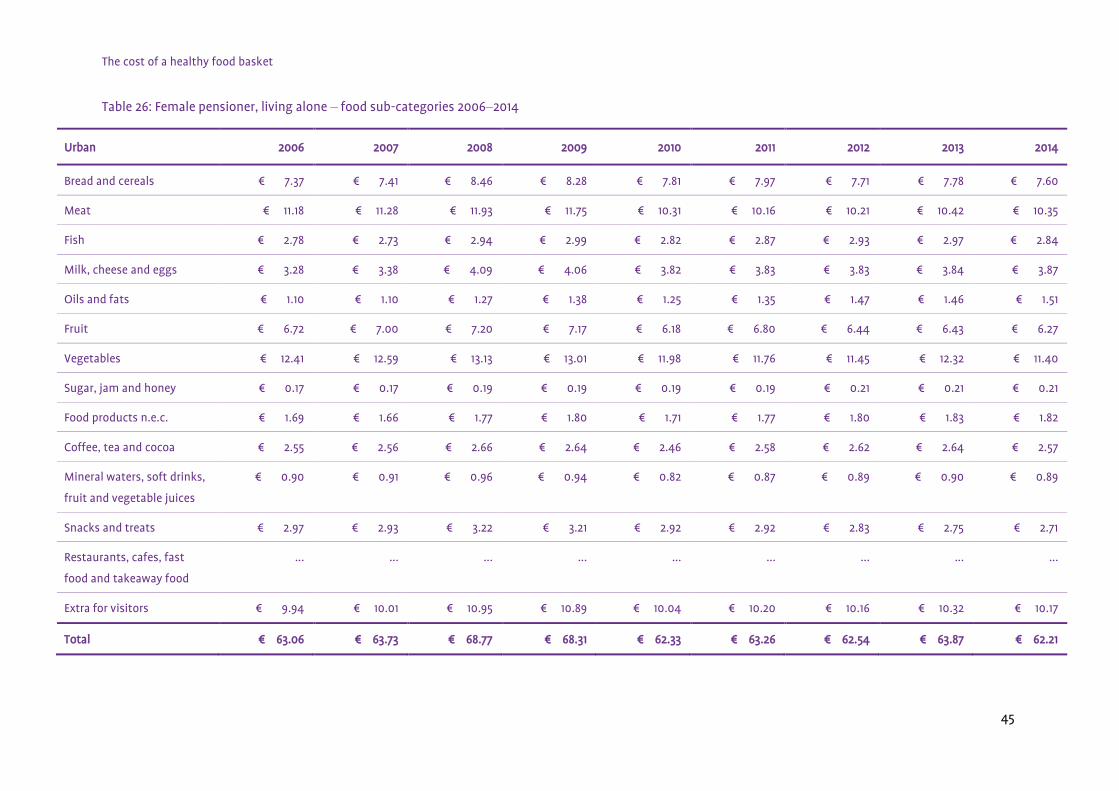
The cost of a healthy food basket
45
Table 26: Female pensioner, living alone ‒ food sub-categories 2006‒2014
Urban 2006 2007 2008 2009 2010 2011 2012 2013 2014
Bread and cereals € 7.37 € 7.41 € 8.46 € 8.28 € 7.81 € 7.97 € 7.71 € 7.78 € 7.60
Meat € 11.18 € 11.28 € 11.93 € 11.75 € 10.31 € 10.16 € 10.21 € 10.42 € 10.35
Fish € 2.78 € 2.73 € 2.94 € 2.99 € 2.82 € 2.87 € 2.93 € 2.97 € 2.84
Milk, cheese and eggs € 3.28 € 3.38 € 4.09 € 4.06 € 3.82 € 3.83 € 3.83 € 3.84 € 3.87
Oils and fats € 1.10 € 1.10 € 1.27 € 1.38 € 1.25 € 1.35 € 1.47 € 1.46 € 1.51
Fruit € 6.72 € 7.00 € 7.20 € 7.17 € 6.18 € 6.80 € 6.44 € 6.43 € 6.27
Vegetables € 12.41 € 12.59 € 13.13 € 13.01 € 11.98 € 11.76 € 11.45 € 12.32 € 11.40
Sugar, jam and honey € 0.17 € 0.17 € 0.19 € 0.19 € 0.19 € 0.19 € 0.21 € 0.21 € 0.21
Food products n.e.c. € 1.69 € 1.66 € 1.77 € 1.80 € 1.71 € 1.77 € 1.80 € 1.83 € 1.82
Coffee, tea and cocoa € 2.55 € 2.56 € 2.66 € 2.64 € 2.46 € 2.58 € 2.62 € 2.64 € 2.57
Mineral waters, soft drinks,
fruit and vegetable juices
€ 0.90 € 0.91 € 0.96 € 0.94 € 0.82 € 0.87 € 0.89 € 0.90 € 0.89
Snacks and treats € 2.97 € 2.93 € 3.22 € 3.21 € 2.92 € 2.92 € 2.83 € 2.75 € 2.71
Restaurants, cafes, fast
food and takeaway food
... ... ... ... ... ... ... ... ...
Extra for visitors € 9.94 € 10.01 € 10.95 € 10.89 € 10.04 € 10.20 € 10.16 € 10.32 € 10.17
Total € 63.06 € 63.73 € 68.77 € 68.31 € 62.33 € 63.26 € 62.54 € 63.87 € 62.21

The cost of a healthy food basket
46
Table 27: Female pensioner living alone ‒ food sub-categories 2006‒2014
Rural 2006 2007 2008 2009 2010 2011 2012 2013 2014
Bread and cereals € 8.23 € 8.27 € 9.49 € 9.31 € 8.80 € 9.00 € 8.71 € 8.80 € 8.60
Meat € 11.63 € 12.08 € 12.70 € 12.93 € 11.69 € 11.64 € 12.06 € 12.32 € 12.45
Fish € 2.78 € 2.73 € 2.94 € 2.99 € 2.82 € 2.87 € 2.93 € 2.97 € 2.84
Milk, cheese and eggs € 3.60 € 3.71 € 4.53 € 4.50 € 4.24 € 4.24 € 4.25 € 4.26 € 4.30
Oils and fats € 1.10 € 1.10 € 1.27 € 1.38 € 1.25 € 1.35 € 1.47 € 1.46 € 1.51
Fruit € 6.92 € 7.21 € 7.41 € 7.38 € 6.37 € 7.00 € 6.63 € 6.62 € 6.46
Vegetables € 12.60 € 12.79 € 13.34 € 13.22 € 12.18 € 11.96 € 11.65 € 12.52 € 11.59
Sugar, jam and honey € 0.17 € 0.17 € 0.19 € 0.19 € 0.19 € 0.19 € 0.21 € 0.21 € 0.21
Food products n.e.c. € 1.69 € 1.66 € 1.77 € 1.80 € 1.71 € 1.77 € 1.80 € 1.83 € 1.82
Coffee, tea and cocoa € 2.64 € 2.65 € 2.76 € 2.74 € 2.55 € 2.68 € 2.72 € 2.73 € 2.66
Mineral waters, soft drinks,
fruit and vegetable juices
€ 0.90 € 0.91 € 0.96 € 0.94 € 0.82 € 0.87 € 0.89 € 0.90 € 0.89
Snacks and treats € 2.97 € 2.93 € 3.22 € 3.21 € 2.92 € 2.92 € 2.83 € 2.75 € 2.71
Restaurants, cafes, fast
food and takeaway food
... ... ... ... ... ... ... ... ...
Extra for visitors € 9.97 € 10.05 € 10.99 € 10.93 € 10.08 € 10.24 € 10.20 € 10.37 € 10.21
Total € 65.21 € 66.27 € 71.58 € 71.53 € 65.61 € 66.73 € 66.34 € 67.74 € 66.26

The cost of a healthy food basket
47
Female pensioner living alone
The in-depth analysis of the food basket for the female pensioner living alone household type shows that all
of the sub-categories of food were at their most expensive in 2008 when overall food inflation increased by
9.3% from 2007 (Tables 26 and 27). The sub-categories for this household type follow the same trend as the
other households, with “Bread and cereals”, “Meat”, “Fruit” and “Vegetables” making up the majority share
of the food basket. Following the views of the rural focus groups, the “rural pensioner living alone” carries
out a proportion of shopping locally and therefore spends slightly more on “Bread and cereals”, “Milk,
cheese and eggs” and “Fruit” and “Vegetables” than their urban counterpart.
In 2014, the sub-category of “Meat” accounted for 16.64% of the urban basket and 18.79% of the rural food
basket. “Vegetables” also accounted for a significant proportion of total food expenditure, amounting to
18.33% of the urban food basket and 17.49% of the rural food basket in 2014. “Bread and Cereals” were also a
notable proportion of the total food basket. In 2014, these items amounted to 12.22% of the urban basket
and almost 13% of the rural basket. This was in contrast to spending on “Sugar, jam and honey”, which came
to €0.21 per week and was only approximately 0.3% of the total food basket.
The food basket for this household type also includes additional money to spend on food for visitors,
classified as “Extra for Visitors”, which came to approximately €10 per week. In 2014, this was 16% of the
urban food basket and 15% of the rural food basket. While this is a significant sub-category of expenditure,
the focus groups regarded it as a necessary component of a Minimum Essential Standard of Living. An MESL,
which is grounded in Consensual Budget Standards methodology, is not based on what people can afford; it
is based on what people need to have in order to have a standard of living that meets their physical,
psychological and social needs at a minimum but acceptable level. Moreover, being unable to afford to have
family or friends for a drink or meal once a month is one of the 11 deprivation indicators in the Republic of
Ireland, and so the inclusion of this item in the basket is necessary not only from a social inclusion and
participation perspective, but also from a deprivation perspective.
Key findings in the price of the food basket by sub-category 2006‒2014
The detailed breakdown of the food basket into sub-categories of expenditure reveals that for all household
types, the sub-category of “Meat” takes up the largest share of the food basket. “Meat” was at its most
expensive in 2008 when inflation for food rose sharply, but was less expensive in 2014 than it was in 2006 for
all household types, with the exception of the rural pensioner couple.
“Fruit” and “Vegetables” accounted for a large share of the food basket for all household types, and while
these two sub-categories of expenditure were at their most expensive in 2008, in line with a sharp increase
in overall food inflation in that year, these items were less expensive in 2014 than they were in 2006.
The sub-categories of “Bread and cereals”, and “Milk, cheese and eggs” also make up a large part of the total
food expenditure. However, these items were more expensive in the rural food baskets as a proportion of
these goods are bought in local stores, which tend to be more expensive than multiples. Overall, both of

The cost of a healthy food basket
48
these sub-categories of food were more expensive in 2014 than they were in 2006. The analyses of the
baskets reveal that other sub-categories of expenditure were also more expensive in 2014 than they were in
2006. For example, although the sub-categories of “Sugar, jam and honey” and “Oils and fats” made up a
very small proportion of total food expenditure for all household types, these two categories were more
expensive for all household types in 2014 than they were in 2006.
Finally, the two categories “Restaurants, cafes, fast food and takeaway food” and “Extra for visitors” are an
important part of the minimum essential food basket for all household types and their inclusion highlights
the social and cultural aspect of food. These items enable households to have a standard of living that meets
not only a household’s physical needs, but also its social and psychological needs. The inclusion of these
items ensures that the minimum essential food baskets reflect the behaviour and shopping patterns of
members of the public and that households are able to participate in activities and practices that are
considered a normal part of everyday life. The latest Survey on Income and Living Conditions (SILC) data
shows that in 2013, 18.7% of the population was unable to afford to have family or friends over for a meal or
a drink once a month (18). This demonstrates that a large cohort of people are experiencing this particular
form of deprivation and that while the category “Extra for visitors” is included in the MESL food baskets, in
reality many people are unable to afford this cost.

The cost of a healthy food basket
49
5 Food and household income
Introduction
Having established the cost of a minimum essential food basket and analysed spending on sub-categories of
food, this section examines the cost of the minimum essential food basket as a proportion of household
income from 2006 to 20144. Tables 28‒40 demonstrate the proportion of household income that households
would need to spend in order to be able to afford the minimum essential food basket from 2006 to 2014.
For working age households, two income scenarios are examined:
Households in receipt of social welfare transfers;
Households earning the national minimum wage. This is based on fulltime work, working 37.5
hours per week. In the two-parent scenario, it is assumed that one parent is engaged in fulltime
work while the other parent is engaged in stay-at-home duties. For the one-parent household,
fulltime work is assumed. For the single adult male household, fulltime work is assumed.
For pensioner households, the following scenario is examined:
Households in receipt of the state pension and any additional entitlements, such as the
Household Benefits Package. A number of state pension scenarios are examined, e.g. the
Contributory Pension and the Non-contributory Pension. It is assumed that the pensioner
households are solely reliant on the state pension and have no other source of income.
4 A detailed breakdown of income from 2006‒2014 is contained in the appendices on each household type and each income scenario.

The cost of a healthy food basket
50
Table 28: Two parents and two children, at pre-school and primary school, dependent on social welfare
2006 2007 2008 2009 2010 2011 2012 2013 2014
Total social
welfare income € 382.45 € 453.10 € 482.56 € 485.79 € 462.62 € 444.71 € 439.90 € 434.32 € 434.32
Urban food € 122.31 € 123.29 € 134.75 € 134.08 € 123.62 € 125.60 € 125.09 € 127.10 € 125.19
% of income 31.98% 27.21% 27.92% 27.60% 26.72% 28.24% 28.44% 29.26% 28.82%
Rural food € 134.70 € 135.77 € 148.40 € 147.66 € 136.14 € 138.32 € 137.77 € 139.97 € 137.87
% of Income 35.22% 29.96% 30.75% 30.40% 29.43% 31.10% 31.32% 32.23% 31.74%
Table 29: One parent working and earning the national minimum wage (NMW), the other parent at home
2006 2007 2008 2009 2010 2011 2012 2013 2014
NMW and SW
Entitlements (net) € 494.60 € 559.75 € 577.21 € 577.64 € 567.87 € 560.57 € 555.76 € 550.18 € 550.18
Urban food € 122.31 € 123.29 € 134.75 € 134.08 € 123.62 € 125.60 € 125.09 € 127.10 € 125.19
% of income 24.73% 22.03% 23.35% 23.21% 21.77% 22.41% 22.51% 23.10% 22.75%
Rural food € 134.70 € 135.77 € 148.40 € 147.66 € 136.14 € 138.32 € 137.77 € 139.97 € 137.87
% of income 27.23% 24.26% 25.71% 25.56% 23.97% 24.67% 24.79% 25.44% 25.06%

The cost of a healthy food basket
51
Two parents and two children, at pre-school and primary school
Scenario: Dependent on social welfare
In this welfare-dependent scenario, the food basket alone consumes over a quarter of household income
in all years from 2006 to 2014 (Table 28). For this household type in an urban area, the percentage of
household income that needed to be spent on the food basket ranged from 26.72% in 2010 to 31.98% in
2006. The percentage of income that needed to be spent on the food basket in a rural area was higher still,
reflecting the higher cost of the minimum essential food basket in rural areas. The percentage ranged
from 29.43% in 2010 to 35.22% in 2006.
In 2007, the percentage of household income that needed to be spent on the food basket fell significantly.
This is because primary social welfare rates were increased by €20, and this household also benefited from
the introduction of the Early Childcare Supplement5. In 2010, despite a significant drop in income, the
proportion of income absorbed by the minimum essential food basket was at its lowest due to the sharp
decrease in the cost of food in that year. In 2014, this household needed to spend 28.82% (urban) or 31.74%
(rural) of their social welfare income on the minimum essential food basket.
This particular scenario highlights not only the impact of inflation on the cost of food, but also the impact
that increases or decreases in social welfare rates can have on a household’s capacity to afford a minimum
essential food basket.
Scenario: One parent working fulltime on the national minimum wage
The scenario in Table 29 is based on one parent working fulltime (37.5 hours per week) while the other
parent is engaged in stay-at-home duties. Income is based on net income from the national minimum
wage (NMW) and any other additional social welfare entitlements. such as Family Income Supplement (FIS)
and Child Benefit (CB). While food costs remained largely static between 2006 and 2007, the NMW was
increased from €7.65 to €8.65 per hour in 2007. This resulted in this household needing to spend a lesser
proportion of its income on food. In 2008, while there was a sharp rise in the cost of food, this was
coupled with an increase in FIS and CB. In 2014, food absorbed 22.75% and 25.06% of this household total
net income in urban and rural areas respectively. Therefore, while this household needed to spend a
smaller proportion of their income on food compared to a household in receipt of social welfare, the food
basket was still a significant expense for a minimum wage household.
5 This direct payment ceased in 2010 and was replaced by the Early Childhood Care and Education Scheme (ECCE), which is an indirect, non-cash benefit that provides a free year of early childhood care and education for children of pre-school age.

The cost of a healthy food basket
52
Two parents and two children, at primary school and in second level
Table 30: Dependent on social welfare
2006 2007 2008 2009 2010 2011 2012 2013 2014
Total social welfare income
€ 383.79 € 435.89 € 463.43 € 478.23 € 464.64 € 446.73 € 444.71 € 438.17 € 438.17
Urban food € 146.91 € 148.08 € 161.86 € 161.05 € 148.49 € 150.86 € 150.26 € 152.66 € 150.37
% of income 38.28% 33.97% 34.93% 33.68% 31.96% 33.77% 33.79% 34.84% 34.32%
Rural food € 161.00 € 162.99 € 177.38 € 176.49 € 162.73 € 165.33 € 164.67 € 167.30 € 164.79
% of income 41.95% 37.39% 38.28% 36.90% 35.02% 37.01% 37.03% 38.18% 37.61%
Table 31: One parent working and earning the national minimum wage, the other a stay-at-home parent
2006 2007 2008 2009 2010 2011 2012 2013 2014
NMW and SW entitlements (net)
€ 495.94 € 542.54 € 558.08 € 570.08 € 569.89 € 562.59 € 560.57 € 554.03 € 554.03
Urban food € 146.91 € 148.08 € 161.86 € 161.05 € 148.49 € 150.86 € 150.26 € 152.66 € 150.37
% of income 29.62% 27.29% 29.00% 28.25% 26.06% 26.82% 26.80% 27.55% 27.14%
Rural food € 161.00 € 162.99 € 177.38 € 176.49 € 162.73 € 165.33 € 164.67 € 167.30 € 164.79
% of income 32.46% 30.04% 31.78% 30.96% 28.55% 29.39% 29.38% 30.20% 29.74%

The cost of a healthy food basket
53
Two parents and two children, at primary school and in second level
Scenario: Dependent on social welfare
Food costs are higher for this household compared to any other household type analysed (Table 30). Food
costs increase significantly when there is an adolescent in the household, yet the only child income
support that differentiates by age is the Back to School Clothing and Footwear Allowance. The data
illustrate that in 2014, this household received €3.85 more per week in social welfare transfers than a two-
parent household with a pre-school and a primary school-going child, yet for this household type living in
an urban area, the household’s food basket was €25 more expensive than a two-parent household with a
pre-school and a primary school-going child. Moreover, when the overall cost of an MESL is analysed for
this household type in an urban area and in social housing, the data show that it has a shortfall of
approximately €123 per week6. Such a large shortfall may therefore constrain a household’s ability to
afford goods and services that members of the public believe are necessary for a standard of living that
meets their physical, psychological and social needs.
Scenario: One parent working fulltime on the national minimum wage
While income from work and any additional social welfare entitlements increase this household’s net
income, it nevertheless needs to spend a very significant proportion of its income on the minimum
essential food basket (Table 31). In 2010, in line with a sharp decrease in food costs, the share of income
absorbed by the food basket was at its lowest, at 26.06%, in urban areas and, at 28.55%, in rural areas. In
2006, when the national minimum wage was €7.65 per hour, the share of income that needed to be spent
on the food basket was at its highest, at 29.62%, in urban areas and, at 32.46%, in rural areas. Since 2011,
the cost of the minimum essential food basket has not significantly changed and the proportion of
income that needs to be spent on the food basket has remained relatively stable, yet it still has a very
significant impact on household expenditure and income. Indeed, if the focus was on weekly-earned net
income alone, which in this instance is €315.26, the minimum essential food basket amounts to 47.69% of
earned net income in urban areas and 52.27% in rural areas in 2014. This underscores the considerable
burden that the minimum essential food basket places on low-wage families7. The two income scenarios
illustrate that costs increase when there is an adolescent in the household, and they underline the
challenge faced by those on a low income to meet those additional costs.
6 VPSJ 2014 data available online: http://budgeting.ie/images/stories/Publications/MESL_Update_Paper/VPSJ_2014_Minimum_Essential_Standard_of_Living_Update_2014.pdf 7 After tax and USC net income for this household type is €315.26. This is based on working fulltime (37.5 hour week) and earning the national minimum wage of €8.65 per hour.

The cost of a healthy food basket
54
One parent and two children, at pre-school and primary school
Table 32: Dependent on social welfare
2006 2007 2008 2009 2010 2011 2012 2013 2014
Total social welfare income
€ 280.26 € 339.84 € 361.64 € 362.50 € 344.83 € 332.22 € 325.10 € 319.52 € 319.52
Urban food € 94.00 € 94.75 € 103.57 € 103.05 € 95.01 € 96.53 € 96.14 € 97.68 € 96.22
% of income 33.54% 27.88% 28.64% 28.43% 27.55% 29.06% 29.57% 30.57% 30.11%
Rural food € 102.30 € 103.12 € 112.71 € 112.15 € 103.40 € 105.05 € 104.63 € 106.31 € 104.71
% of income 36.50% 30.34% 31.17% 30.94% 29.99% 31.62% 32.18% 33.27% 32.77%
Table 33: One parent working and earning the national minimum wage
2006 2007 2008 2009 2010 2011 2012 2013 2014
NMW and SW entitlements (net)
€ 553.55 € 621.80 € 645.22 € 651.78 € 641.73 € 631.05 € 625.29 € 616.86 € 612.86
Urban food € 94.00 € 94.75 € 103.57 € 103.05 € 95.01 € 96.53 € 96.14 € 97.68 € 96.22
% of income 16.98% 15.24% 16.05% 15.81% 14.81% 15.30% 15.38% 15.84% 15.70%
Rural food € 102.30 € 103.12 € 112.71 € 112.15 € 103.40 € 105.05 € 104.63 € 106.31 € 104.71
% of income 18.48% 16.58% 17.47% 17.21% 16.11% 16.65% 16.73% 17.23% 17.09%

The cost of a healthy food basket
55
One parent and two children, at pre-school and primary school
Scenario: Dependent on social welfare
In all years, and for both urban and rural households, the minimum essential food basket absorbs more
than a quarter of this household’s income when it is dependent on social welfare (Table 32). One-parent
households are the household type most at risk of poverty, and in 2013, 31.7% of one-parent households
with children were at risk of poverty, while 63.2% experienced deprivation (18). Similarly to the two other
households with children, food as a percentage of household income was at its lowest in 2010 and at its
highest in 2006. In 2007, income rose considerably due to increases in social welfare and the introduction
of the Early Childcare Supplement. As a result, the proportion of income absorbed by the food basket fell
considerably in that year. Since 2011, the proportion of income that needed to be spent on the food basket
has begun to rise slightly due to decreasing social welfare rates.
In 2014, the share of income that needed to be spent on the food basket was 30.11% for an urban one-
parent household and 32.77% for its rural counterpart. It is apparent that when such a significant amount
of income is consumed by just one area of expenditure, as is the case with food, that many households in
this position are unable to afford to spend such a considerable proportion of their income on the food
basket alone. As a consequence, limited financial resources may put a nutritionally adequate diet beyond
the reach of low-income families.
Scenario: One parent working fulltime on the national minimum wage
More so than for other households with children, there is a substantial difference between the proportions
of income that need to be spent on the food basket by a household in receipt of social welfare compared
to one engaged in fulltime work (Table 33). This is because in this scenario, one parent working fulltime on
the NMW also qualifies for a partial One Parent Family Payment, which substantially increases their
income, and therefore lowers the proportion of household income that needs to be spent on food. This
household also benefits from the Fuel Allowance. In 2014, a one-parent household living in an urban area
and working full-time spent 15.7% of its income on the food basket compared to 30.11% for a household in
receipt of social welfare.
This particular scenario emphasises the contribution of in-work benefits for low-wage households and the
impact that they can have on a household’s weekly income and, consequently, its ability to meet the cost
of a minimum standard of living.

The cost of a healthy food basket
56
Single adult male of working age
Table 34: Single adult male of working age dependent on social welfare
2006 2007 2008 2009 2010 2011 2012 2013 2014
Total social welfare income
€ 165.80 € 185.00 € 197.80 € 204.30 € 196.00 € 188.00 € 188.00 € 188.00 € 188.00
Urban food € 55.74 € 56.18 € 61.41 € 61.10 € 56.34 € 57.24 € 57.01 € 57.92 € 57.05
% of income 33.62% 30.37% 31.05% 29.91% 28.74% 30.45% 30.32% 30.81% 30.35%
Rural food € 51.65 € 52.07 € 56.91 € 56.62 € 52.21 € 53.04 € 52.83 € 53.68 € 52.87
% of income 31.15% 28.14% 28.77% 27.71% 26.63% 28.21% 28.10% 28.55% 28.12%
Table 35: Single adult male working fulltime and earning the national minimum wage
2006 2007 2008 2009 2010 2011 2012 2013 2014
NMW and SW entitlements (net)
€ 286.88 € 324.38 € 324.48 € 324.38 € 324.38 € 313.85 € 313.85 € 313.87 € 313.89
Urban food € 55.74 € 56.18 € 61.41 € 61.10 € 56.34 € 57.24 € 57.01 € 57.92 € 57.05
% of income 19.43% 17.32% 18.93% 18.84% 17.37% 18.24% 18.16% 18.45% 18.18%
Rural food € 51.65 € 52.07 € 56.91 € 56.62 € 52.21 € 53.04 € 52.83 € 53.68 € 52.87
% of income 18.00% 16.05% 17.54% 17.45% 16.10% 16.90% 16.83% 17.10% 16.84%

The cost of a healthy food basket
57
Single adult male of working age
Scenario: Dependent on social welfare
Unlike the other households under consideration in this paper, the single adult household does not
ordinarily qualify for any additional cash payments such as Fuel Allowance, and therefore, for the purposes
of this paper, the focus is on the primary Jobseeker’s Benefit payment.8 Both the urban and rural minimum
essential food basket consumed more than a quarter of this household’s primary social welfare payment
from 2006 to 2014 (Table 34).
This household’s social welfare payment increased by €20 in 2007, which resulted in a fall in the
proportion of income that needed to be spent on the food basket. However, since 2011, this payment has
remained static at €188, and food as a proportion of household income has hovered around the 30% mark
for the urban food basket and 28% for the rural food basket.
Food, however, is only one area of expenditure, and when, as in this scenario, such a considerable
proportion of household income is absorbed by the food basket alone, it highlights the difference between
social welfare rates and the actual cost of a minimum essential standard of living, as established in the
VPSJ’s research. Households in this situation are vulnerable to poverty and social exclusion and are
unlikely to have a standard of living that meets their needs at a minimum but acceptable level.
Scenario: Working fulltime on the national minimum wage
In this scenario, the proportion of income that needs to be spent on the food basket drops considerably
when this household moves from welfare to work. Between 2006 and 2014, the amount of household
income that needed to be spent on the urban food basket ranged from 17.37% in 2010 to 19.43% in 2006,
while the corresponding figures for the rural basket were 16.1% in 2010 and 18% in 2006 (Table 35).
Fulltime minimum wage workers were brought into the tax net in 2011 and have seen a decrease in net
income of approximately €10, and so the proportion of income that needed to be spent on the food basket
increased marginally in 2011, but has remained relatively static ever since. Nevertheless, the minimum
essential food basket is still a significant area of expenditure and absorbs a large share of household
income.
The latest data from the SILC, which is for 2013, highlight that 27.2% of adults aged 65 and under who live
alone are at risk of poverty (18). The SILC data underscore how this household type is particularly exposed
to being at risk of poverty. It is apparent from this research that the cost of a minimum essential food
basket is beyond the financial capabilities for many low-income single adults living alone.
8 It is assumed that the single adult male is over the age of 26 and in receipt of the full Jobseeker’s Payment.

The cost of a healthy food basket
58
Pensioner couple9
Table 36: One contributory pension and qualified adult payment
2006 2007 2008 2009 2010 2011 2012 2013 2014
Total social welfare
income € 373.07 € 420.43 € 461.17 € 475.46 € 476.90 € 476.56 € 472.66 € 468.01 € 465.84
Urban food € 80.51 € 81.15 € 88.70 € 88.26 € 81.37 € 82.67 € 82.34 € 83.66 € 82.41
% of income 21.58% 19.30% 19.23% 18.56% 17.06% 17.35% 17.42% 17.88% 17.69%
Rural food € 87.10 € 87.79 € 95.96 € 95.48 € 88.03 € 89.44 € 89.08 € 90.51 € 89.15
% of income 23.35% 20.88% 20.81% 20.08% 18.46% 18.77% 18.85% 19.34% 19.14%
Table 37: One contributory pension and one non-contributory pension
2006 2007 2008 2009 2010 2011 2012 2013 2014
Total social welfare
income € 405.77 € 447.43 € 473.17 € 488.16 € 489.60 € 489.26 € 485.36 € 480.71 € 478.54
Urban food € 80.51 € 81.15 € 88.70 € 88.26 € 81.37 € 82.67 € 82.34 € 83.66 € 82.41
% of income 19.84% 18.14% 18.75% 18.08% 16.62% 16.90% 16.96% 17.40% 17.22%
Rural food € 87.10 € 87.79 € 95.96 € 95.48 € 88.03 € 89.44 € 89.08 € 90.51 € 89.15
% of income 21.47% 19.62% 20.28% 19.56% 17.98% 18.28% 18.35% 18.83% 18.63%
9 The income for pensioner households is based on their primary social welfare payment and any additional entitlements, including the Household Benefits Package.

The cost of a healthy food basket
59
Table 38: Both in receipt of a Non-contributory Pension
2006 2007 2008 2009 2010 2011 2012 2013 2014
Total Social
Welfare Income € 394.47 € 438.13 € 461.87 € 476.86 € 478.30 € 477.96 € 474.06 € 469.41 € 467.24
Urban food € 80.51 € 81.15 € 88.70 € 88.26 € 81.37 € 82.67 € 82.34 € 83.66 € 82.41
% of income
20.41%
18.52%
19.20%
18.51%
17.01%
17.30%
17.37%
17.82%
17.64%
Rural food € 87.10 € 87.79 € 95.96 € 95.48 € 88.03 € 89.44 € 89.08 € 90.51 € 89.15
% of income
22.08%
20.04%
20.78%
20.02%
18.40%
18.71%
18.79%
19.28%
19.08%
The cost of a healthy food basket
60
Pensioner Couple
Tables 36, 37 and 38 detail three different income situations for a pensioner couple in receipt of the state
pension. In all scenarios, the proportion of income that needed to be spent on the minimum essential food
basket was at its highest in 2006 and at its lowest in 2010. However, of the six household types analysed, this
household is one of the households that needs to spend a lesser proportion of its income on food.
The household that needs to spend the largest proportion of its income on food is the household with the
lowest income, which in this case is the household in receipt of the Contributory Pension and Qualified Adult
payment (Table 36). The household that needs to spend the least amount of its income on food is the one in
receipt of one Contributory Pension and one Non-contributory Pension (Table 37). This household has the
largest income of the three households.
While the recession has resulted in reductions in and changes to the eligibility criteria to qualify for secondary
benefits10, the rate at which the state pension is paid has not been reduced. In the context of the overall cost
of a minimum essential standard of living, the research shows that this household type has an adequate
income and has consistently been able to afford a minimum standard of living from 2006 to 201411.
10 Secondary benefits refer to additional payments or benefits that a household may be entitled to, such as a medical card and fuel allowance.
11The 2014 VPSJ update data are available online at:
http://budgeting.ie/images/stories/Publications/MESL_Update_Paper/VPSJ_2014_Minimum_Essential_Standard_of_Living_Update_2014.pdf

The cost of a healthy food basket
61
Female pensioner living alone
Table 39: Contributory pension
2006 2007 2008 2009 2010 2011 2012 2013 2014
Total Social
Welfare Income € 231.47 € 255.13 € 268.87 € 276.86 € 278.30 € 277.96 € 274.06 € 269.41 € 267.24
Urban food € 61.15 € 61.64 € 67.37 € 67.03 € 61.80 € 62.79 € 62.54 € 63.54 € 62.59
% of income 26.42% 24.16% 25.06% 24.21% 22.21% 22.59% 22.82% 23.58% 23.42%
Rural € 64.86 € 65.38 € 71.46 € 71.11 € 65.56 € 66.61 € 66.34 € 67.40 € 66.39
% of income 28.02% 25.63% 26.58% 25.68% 23.56% 23.96% 24.21% 25.02% 24.84%
Table 40: Non-contributory pension
2006 2007 2008 2009 2010 2011 2012 2013 2014
Total Social
Welfare Income € 220.17 € 245.83 € 257.57 € 265.56 € 267.00 € 266.66 € 262.76 € 258.11 € 255.94
Urban food € 61.15 € 61.64 € 67.37 € 67.03 € 61.80 € 62.79 € 62.54 € 63.54 € 62.59
% of income 27.77% 25.07% 26.16% 25.24% 23.15% 23.55% 23.80% 24.62% 24.45%
Rural food € 64.86 € 65.38 € 71.46 € 71.11 € 65.56 € 66.61 € 66.34 € 67.40 € 66.39
% of income 29.46% 26.60% 27.74% 26.78% 24.55% 24.98% 25.25% 26.11% 25.94%

The cost of a healthy food basket
62
Female pensioner living alone
A female pensioner living alone household needs to spend a much greater proportion of income on the food
basket when compared to a pensioner couple (Tables 38‒39). The urban female pensioner spends two thirds of
the amount a pensioner couple spends on food. In 2014, for example, the weekly cost of the urban food basket
for a pensioner couple was €82.41, compared to €62.52 for a female pensioner living alone. However, the
pensioner living alone had only one income to meet all of their costs, and while they did receive an additional
€7.70 Living Alone Increase, this was not enough to offset the additional costs faced by living alone.
This household’s spending on food follows the same pattern as the other household types, with the
proportion of income absorbed by the minimum essential food basket at its highest in 2006 and at its lowest
in 2010. For the household in receipt of the Contributory Pension, the proportion of income that needed to be
spent on the urban food basket ranged from 22.21% in 2010 to 26.42% in 2006 (Table 38). The corresponding
range for the rural food basket was from 23.56% in 2010 to 28.02% in 2006.
For the household in receipt of the Non-contributory state pension, the proportion of income required was
marginally higher, reflecting the lower income for this household type (Table 40). The proportion of income
that needed to be spent on the food basket ranged from 23.15% in 2010 to 27.77% in 2006 for the urban food
basket, while the range for the rural food basket was from 24.55% in 2010 to 29.46% in 2006.
It is clear from the data that the minimum essential food basket is a significant area of expenditure for this
household type and absorbs a large share of this household’s income. The high proportion of income that
needed to be spent on food alone highlights the cost of a minimum standard of living in Ireland and
underscores the ability of and the extent to which social welfare payments meet the cost of living. Pensioners
have very little, if any, scope to increase their income in retirement, and the MESL data show that pensioners
living alone and solely reliant on the state pension are particularly vulnerable to poverty and social exclusion.
Overall trends in food and household income 2006‒2014
This section has demonstrated that the minimum essential food basket absorbs a significant proportion of
household income for all household types and in all hypothetical scenarios considered in this study. Food as a
percentage of household income was at its highest in 2006 when social welfare payments were at their lowest
and the national minimum wage was €7.65 per hour. In 2007, there was a €20 increase in primary social
welfare payments and a €1 increase in the national minimum wage, and so the percentage of household
income absorbed by the minimum essential food basket fell in that year.
In 2010, when there was a notable drop in food prices and the food baskets were only 1.1% more expensive
than they were in 2006, the proportion of income consumed by the food baskets was at its lowest for all
household types. Since 2011, there has been no real change in the proportion of income needed to be spent on

The cost of a healthy food basket
63
food, but food continues to be a significant area of household expenditure and absorbs a sizeable share of
household income for welfare-dependent and low-income working households.
The analysis of the cost of the minimum essential food basket and the relationship to household income
highlights the impact that just one area of expenditure can have on a household’s income. The food basket is
only one area of expenditure and the data show that a considerable proportion of income is required if
households are to afford a minimum food basket. This underscores the point that for certain household types,
the minimum essential food basket may be financially out of reach.
In their research, Dobson et al. (19) highlighted how financially constrained households regard food as a
flexible item within the controllable household budget, and when other necessary household expenditure is
taken into consideration, the food budget is reduced. Limited economic resources and the cost of a
nutritionally adequate diet can act as barriers to sustaining a healthy diet and subsequent good health. On the
basis of the findings in this report and the level of income required to afford the minimum essential food
basket, it appears that low-income households struggle to allocate the high expenditure necessary for healthy
eating.
The cost of food and household income are two important factors that can shape the priorities and decisions
of households. For those households operating within a finite and limited budget, financial constraints can
play a large role in determining food choices. Studies have repeatedly shown that those people on the lowest
incomes tend to have poorer diets and are more likely to experience food poverty. Research by Carney and
Maitre (3) on food poverty in Ireland shows that income quintile is a significant predictor of food poverty12. The
odds of experiencing food poverty are two times higher for households in the lowest income quintile in
comparison to all other income quintiles.
12 The income quintile ratio compares the percentage of the total disposable income received by individuals in the bottom 20% (quintile) of the income distribution to that received by the top 20%.

The cost of a healthy food basket
64
6 Minimum essential food costs for children
Introduction
This section examines the minimum essential food costs for children as part of a household. The latest SILC
data show that 17.9% of children were at risk of poverty in 2013 (18). Moreover, the Health Behaviour in School
Aged Children (HBSC) Survey 2010, which describes the health behaviour in children aged between nine and 18
found that 13% of children surveyed reported never having breakfast on a weekday, while a further 21% of
children surveyed reported going to school or bed hungry because there was not enough food at home. The
survey found that boys, younger children and children from lower social classes were all more likely to report
going to school or to bed hungry (20, p.7).
The Growing up in Ireland study examined the prevalence of overweight or obesity among nine-year-olds. A
total of 75% of nine-year-olds in the study were defined as having a healthy weight, 19% were overweight and
7% were obese (21, p.14). Furthermore, the study also found that children, particularly girls, from less socio-
economically advantaged households were more likely to be overweight.
Poor diet can have a detrimental effect on children. Friel and Conlon (22) note that research has demonstrated
that poor nutrition in childhood is causally linked to health-related problems later in life such as chronic
illnesses and can impair a child’s development and capacity to learn. Layte and McCrory also note that “excess
non-lean body mass, known as adiposity, at a young age is associated with both immediate and long-term
health risks”(21, p.8). These findings demonstrate that the cost of a minimum, essential but nutritionally
adequate food basket for children is a particularly pertinent issue.
This section presents food costs for children from the MESL aggregate household data based on the
methodology described in Collins et al. (14). Food costs for children as part of a household between 2006 and
2014 are examined at three distinct ages:
Pre-school
Primary
Second level
This approach shifts the focus from the MESL needs of whole households to the MESL needs of individuals. The
result is a set of minimum essential standard budgets for each person in the household. However, it should be
noted that these individual budgets demonstrate the minimum requirements for individuals who are part of a
larger household and do not correspond to the minimum requirements of such an individual living alone.

The cost of a healthy food basket
65
Individualised component budgets are derived for the adults as parents in a household with children, and for
the children as members of the family household (19, p.41)13.
The 2014 MESL baskets have been corrected for inflation retrospectively to examine how food costs have
changed from 2006 to 2014. The data are based on the direct cost of a child, i.e. costs that can be directly
attributed to a child, and exclude costs shared in common with parents, such as home heating, furniture (with
the exception of the child’s bedroom furniture) and use of the family car. Tables 41‒46 detail the food costs for
the three child ages under consideration from 2006 to 2014 and food as a percentage of direct overall
expenditure14.
13 For a full description of the individualisation process, see pp. 41‒46 of Collins, M.L. MacMahon, B. Weld, G. and Thornton, R. 2012. A Minimum Income Standard for Ireland A consensual budget standards study examining household types across the lifecycle. Dublin: The Policy Institute
14 A more detailed breakdown of expenditure for each child age group is contained in the appendices

The cost of a healthy food basket
66
Pre-school child
Table 41: Urban ‒ direct cost of a child Excludes housing, childcare and the effect of secondary benefits
2006 2007 2008 2009 2010 2011 2012 2013 2014
Food € 23.34 € 23.53 € 25.72 € 25.59 € 23.59 € 23.97 € 23.88 € 24.26 € 23.89
MESL other costs € 28.20 € 28.42 € 29.03 € 28.68 € 27.80 € 28.36 € 28.88 € 29.16 € 29.51
Total core costs € 51.55 € 51.95 € 54.74 € 54.27 € 51.39 € 52.33 € 52.76 € 53.42 € 53.40
Food as % MESL
core 45.29% 45.30% 46.98% 47.16% 45.91% 45.81% 45.26% 45.41% 44.74%
Table 42: Rural ‒ direct cost of a child
Excludes housing, childcare and the effect of secondary benefits
2006 2007 2008 2009 2010 2011 2012 2013 2014
Food € 25.52 € 25.72 € 28.12 € 27.98 € 25.79 € 26.21 € 26.10 € 26.52 € 26.12
MESL other costs € 24.85 € 24.98 € 25.42 € 25.22 € 24.23 € 24.69 € 25.02 € 25.34 € 25.75
Total core costs € 50.37 € 50.71 € 53.54 € 53.19 € 50.03 € 50.90 € 51.12 € 51.86 € 51.87
Food as % MESL
core 50.67% 50.73% 52.52% 52.59% 51.56% 51.49% 51.06% 51.14% 50.36%

The cost of a healthy food basket
67
Pre-school Child
When childcare is excluded from the MESL data, food is the largest area of expenditure for a child of pre-school
age (Tables 41 and 42). This age group has the lowest food costs of the three child ages considered, yet food as
a percentage of overall expenditure is at its highest for this age group of all the age groups. This is because
expenditure on other areas, such as clothes and education, is relatively low. As a result, food costs for a pre-
school child in the urban basket are between 45.29% (2006) and 47.16% (2009) of total core expenditure. For
the rural basket, the figures are 50.67% (2006) and 52.59% (2009). Interestingly, expenditure on food in the
rural food basket is greater than on all of the other core MESL costs combined.
The cost of the minimum essential food basket follows the inflation trajectory with costs being at their lowest
in 2006 and at their highest in 2008. While the minimum essential food basket is the least expensive for a
child of this age when compared to other child age groups, it still is in excess of €20 per week. In 2014,
expenditure on food in urban areas was €23.89, while the corresponding cost for rural areas was €26.12.

The cost of a healthy food basket
68
Primary School Child
Table 43: Urban ‒ direct cost of a child
Excludes housing, childcare and the effect of secondary benefits
2006 2007 2008 2009 2010 2011 2012 2013 2014
Food € 36.07 € 36.36 € 39.74 € 39.54 € 36.46 € 37.04 € 36.89 € 37.48 € 36.92
MESL other costs € 49.69 € 50.06 € 50.80 € 50.01 € 48.19 € 48.57 € 48.99 € 49.28 € 49.44
Total core costs € 85.76 € 86.42 € 90.54 € 89.55 € 84.65 € 85.61 € 85.89 € 86.77 € 86.37
Food as % MESL
core 42.06% 42.07% 43.89% 44.15% 43.07% 43.27% 42.96% 43.20% 42.75%
Table 44: Rural ‒ direct cost of a child Excludes housing, childcare and the effect of secondary benefits
2006 2007 2008 2009 2010 2011 2012 2013 2014
Food € 39.20 € 39.51 € 43.18 € 42.97 € 39.62 € 40.25 € 40.09 € 40.73 € 40.12
MESL other costs € 47.96 € 48.32 € 48.92 € 48.31 € 46.42 € 46.65 € 46.99 € 47.37 € 47.63
Total core costs € 87.16 € 87.83 € 92.11 € 91.28 € 86.04 € 86.90 € 87.08 € 88.10 € 87.76
Food as % MESL
core 44.97% 44.99% 46.89% 47.07% 46.04% 46.32% 46.04% 46.23% 45.72%

The cost of a healthy food basket
69
Primary School Child
When childcare is excluded from the MESL data, food is the largest area of expenditure for a primary school-
going child, and it is a significant proportion of overall expenditure (Tables 43 and 44). As expected, food costs
rise for this age group when compared to a child of pre-school age. In 2014, the cost of the urban minimum
essential food basket was €39.92, which was €13.03 more expensive than for a child of pre-school age.
Between 2006 and 2014, the cost of the urban food basket ranged from a low of €36.07 per week in 2006 to a
high of €39.74 in 2008. The cost of the rural food basket was higher, and between 2006 and 2014, expenditure
on food ranged from €39.20 in 2006 to €43.18 in 2008, a difference of €3.98.
As Tables 43 and 44 illustrate, food accounted for a notable proportion of total expenditure, and in all years
under consideration, food accounted for more than 40% of total core expenditure. Food as a percentage of
total expenditure peaked in 2009 at 44.15% in urban areas and at 47.07% in rural areas. In 2014, food
accounted for 42.75% of the urban MESL basket and 45.72% of the rural MESL basket.

The cost of a healthy food basket
Secondary school child
Table 45: Urban ‒ direct cost of a child
Excludes housing, childcare and the effect of secondary benefits
2006 2007 2008 2009 2010 2011 2012 2013 2014
Food € 47.95 € 48.33 € 52.82 € 52.56 € 48.46 € 49.24 € 49.04 € 49.82 € 49.08
MESL other costs € 87.84 € 88.58 € 89.75 € 88.47 € 85.20 € 85.41 € 85.98 € 86.12 € 85.97
Total core costs € 135.78 € 136.90 € 142.57 € 141.03 € 133.66 € 134.65 € 135.02 € 135.94 € 135.05
Food as % MESL
core 35.31% 35.30% 37.05% 37.27% 36.26% 36.57% 36.32% 36.65% 36.34%
Table 46: Rural ‒ direct cost of a child
Excludes housing, childcare and the effect of secondary benefits
2006 2007 2008 2009 2010 2011 2012 2013 2014
Food € 51.82 € 52.24 € 57.09 € 56.81 € 52.38 € 53.22 € 53.00 € 53.85 € 53.04
MESL other costs € 81.53 € 82.11 € 83.01 € 81.84 € 78.43 € 78.57 € 78.85 € 78.97 € 78.83
Total core costs € 133.35 € 134.35 € 140.10 € 138.65 € 130.81 € 131.79 € 131.86 € 132.82 € 131.87
Food as % MESL
core 38.86% 38.88% 40.75% 40.97% 40.04% 40.38% 40.20% 40.54% 40.22%

The cost of a healthy food basket
Secondary school child
When a child enters adolescence, costs rise considerably in a number of categories of expenditure,
including clothes, education, social inclusion and participation, and, of course, food. The cost of the
minimum essential food basket increases significantly, and food costs for this age group are substantially
higher than for any of the other child age groups examined. In 2014, the cost of the urban food basket for
this age group was €49.08. This is €12.16 more than for a child at primary school and €25.19 more than for a
child of pre-school age (Table 45).
The high cost of food for this age group was highlighted by the focus groups. In the 2006 study, focus
group participants spoke of the expense of feeding an adolescent: “We’re really dealing with three adults;
the teenager will eat what the adults are eating (9, p.73).
Between 2006 and 2014, the cost of the urban food basket ranged from a low of €47.95 per week in 2006 to
a high of €52.82 in 2008. This is a difference of €4.87 (Table 45). This demonstrates the impact of inflation
on the minimum essential food basket. In terms of the percentage of overall expenditure, the food basket
amounted to between 35.31% (2006) and 37.27% (2009) of total core expenditure. The corresponding cost
for the rural basket was from €51.82 in 2006 to €57.09 in 2008, while food as a percentage of core
expenditure ranged from 38.86% in 2006 to 40.97% in 2009 (Table 46).
Expenditure on food and the contribution of child income supports
Tables 47 and 48 illustrate the weekly cost of food for three child ages in 2014 and the weekly value of
child income supports for households dependent on social welfare. The tables also detail the cost of the
food basket as a proportion of these supports.
The MESL data clearly indicate that the minimum essential food basket is a significant cost for all
households with children, particularly for those with an adolescent. For low-income or welfare-dependent
households, the cost of food accounts for a significant proportion of household expenditure and absorbs a
large share of household income. Moreover, with the exception of the Back to School Clothing and
Footwear Allowance (BSCFA), child income supports do not take account of the fact that costs for children
vary over the course of childhood and increase substantially in adolescence. Therefore, the contribution
they make to a household is dependent on the age of the child.

The cost of a healthy food basket
Table 47: Urban food costs and the weekly value of child income supports in 2014
Urban Pre-school Primary school Secondary school
Food costs 2014 €23.89 €36.92 €49.08
Qualified child increase €29.80 €29.80 €29.80
Child benefit €30.00 €30.00 €30.00
Back to school clothing and
footwear allowance
€00.00 €1.92 €3.85
Total child income supports €59.80 €61.72 €63.65
Food basket as a % of child
income supports
39.94% 59.82% 77.11%
Table 48: Rural food costs and the weekly value of child income supports in 2014
Rural Pre-school Primary school Secondary school
Food costs 2014 €26.12 €40.12 €53.04
Qualified child increase €29.80 €29.80 €29.80
Child benefit €30.00 €30.00 €30.00
Back to school clothing and
footwear allowance
€00.00 €1.92 €3.85
Total child income supports €59.80 €61.72 €63.65
Food basket as a % of child
income supports
43.68% 65.00% 83.33%
As demonstrated in the tables above, food as a proportion of child income supports varies by the age of
the child and by location. The cost of the rural adolescent food basket comes to 83.33% of the child
income supports, while the corresponding figure for the urban basket is 77.11%.
While the combined weekly value of child income supports exceeds the cost of the minimum essential
food basket for the three child ages examined, food is only one area of expenditure, and households with
children also face other costs, such as clothing, personal care, social inclusion and participation and
education. Taking these other costs into account in 2014, child income supports for children in welfare-

The cost of a healthy food basket
dependent households met the direct minimum essential costs for a pre-school child but were inadequate
for primary and, in particular, secondary school-going children. Child income supports met 50.1% of the
total direct expenditure for an adolescent in an urban area and 51.3% for an adolescent in a rural area.15
A total of 17.9% of children were at risk of poverty in 2013 (18). Furthermore, 31.7% of one-parent
households with children under the age of 18 were at risk of poverty in 2013, while 11.1% of two-parent
households with 1‒3 children were at risk of poverty in the same year (18). These statistics, coupled with
the analysis of the cost of providing a minimum essential food basket for children, demonstrates the
considerable challenge facing low-income households to afford a minimum essential, but nutritionally
adequate, diet for their children.
15 Further information on the contribution of child income supports to the cost of a child in 2014 can be found at pages 7 and 8 of the 2014 MESL update paper. The paper can be accessed at: budgeting.ie/images/stories/Publications/MESL_Update_Paper/VPSJ_2014_Minimum_Essential_Standard_of_Living_Update_2014.pdf

The cost of a healthy food basket
7 Conclusions
The research demonstrates what the cost of a minimum essential food basket for six household types was
from 2006 to 2014. This report highlights the challenge faced by welfare-dependent, low-income
households to provide a healthy diet and all the other components of an acceptable lifestyle to their
members. Given that one in ten people are experiencing food poverty in Ireland, which can also affect
social behaviour and can cause or exacerbate social exclusion, this research provides further evidence of
the need to address the inter-related issues of food poverty, income adequacy and living costs in Ireland.
The key conclusions to be drawn from this research are outlined below.
Key conclusions
Methodology
This research, which is grounded in focus group-led Consensual Budget Standards
methodology, has provided an analysis of the cost of a minimum, essential, but nutritionally
adequate, food basket for six household types in Ireland.
Food and household expenditure
A minimum essential food basket is a significant area of expenditure for all household types.
When childcare and housing are excluded from expenditure, food is the most expensive
category of expenditure.
Food costs are more expensive for the majority of household types in rural areas than in
urban areas.
The cost of the minimum essential food basket fluctuated between 2006 and 2014. The food
basket was 2.4% more expensive in 2014 compared to 2006.
The sub-category “Meat” accounts for the largest share of the food basket. “Fruit” and
“Vegetables” are the second and third largest share of the food basket.
Spending on “Restaurants, cafes, fast food and takeaway food”, and “Extra for visitors” are
an important part of the food baskets for all household types. These categories highlight the
social and cultural aspects of food and enable households to have a standard of living that
meets not only their physical needs, but also their social and psychological needs. This
ensures that the minimum essential food baskets reflect the behaviour and shopping
patterns of members of the public and that households are able to participate in activities
and practices considered to be a normal part of everyday life.

The cost of a healthy food basket
Food and Household Income
Food as a percentage of household income was at its highest in 2006, when social welfare
payments were at their lowest and the national minimum wage was €7.65 per hour. In 2007,
there was a €20 increase in primary social welfare payments and a €1 increase in the national
minimum wage, and so the percentage of household income absorbed by the minimum
essential food basket fell in that year.
The proportion of income taken by the food baskets was at its lowest for all household types
in 2010.
Between 2011 and 2014, there was no significant change in the proportion of income that
households needed to spend on a minimum food basket.
Households with children and dependent on social welfare need to spend a very considerable
proportion of their income be able to afford a minimum food basket.
Many welfare-dependent households were unable to afford a minimum essential standard of
living in 2014 and in all likelihood struggled to allocate a significant proportion of their
income to the food basket alone when there were other costs that had to be met.
The findings in this report demonstrate the need to examine the cost of a nutritionally-
adequate diet in the ROI and the extent to which social welfare transfers and the national
minimum wage allow households to have a standard of living that meets their physical,
psychological and social needs.
Food Costs for Children
Food costs rise as children grow older, and are, in particular, a significant cost for households
with an adolescent. However, with the exception of the Back to School Clothing and
Footwear Allowance, child income support rates remain static regardless of the age of the
child and do not take account of the fact that costs for children vary over the course of
childhood and increase substantially in adolescence.
The examination of the contribution of child income supports and the high proportion of
income that needs to be spent on the food basket alone demonstrates the challenge facing
low-income households to provide their children with a minimum, but acceptable, standard
of living.
Food Poverty
This research has added to the evidence on the role of cost in food poverty. Financial
resources affect the dietary choices that people make. The research will help to inform
policymakers about the cost of a healthy food basket and the need for households to have
the financial resources to be able to afford a food basket that meets their physical,
psychological and social needs at a minimum but acceptable level.

The cost of a healthy food basket
8 References 1. OCED. Society at a Glance 2014: OCED Social Indicators. OCED Publishing, 2014.
2. Eurostat. News release 09/07/2014. European Commission; 2014 [19/06/2014]; Available from: http://epp.eurostat.ec.europa.eu/cache/ITY_PUBLIC/2-19062014-AP/EN/2-19062014-AP-EN.PDF.
3. Carney C, Maitre B. Constructing a Food Poverty Indicator for Ireland using the Survey on Income and Living Conditions. Dublin: 2012.
4. Vincentian Partnership for Social Justice. One Long Struggle: A Study of Low Income Families. Dublin: Vincentian Partnership for Social Justice, 2001.
5. Bradshaw J. Budget Standards for the United Kingdom. London: Aldershot, 1993.
6. MacMahon B, Delaney M, Feely N. Low Cost But Acceptable Budgets for Three Households. Dublin: Vincentian Partnership for Social Justice; 2004; Available from: http://www.budgeting.ie/images/stories/Publications/Low%20Cost%20but%20Acceptable%20Budgets%20for%20Three%20Housholds.pdf.
7. Middleton S. Agreeing Poverty Line: The Diversity of Consensual Budget Standards Methodology’ in Bradshaw, J. and Sainsbury, R. (eds.) Researching Poverty. Aldershot: Abigail, 2000.
8. Bradshaw J, Middleton, S., Kellard, K. Proposal: A Minimum Income Standard for Britain. London: Universities of York and Loughborough, 2006.
9. Mac Mahon B, Carey J, Stokes A. Minimum Essential Budgets for Six Households. Dublin: Vincentian Partnership for Social Justice, 2006.
10. Uzuki Y. Comparing Minimum Income Standards between Japan and the UK: MIS Budgets and Their Implications. Social Policy and Labor Studies. 2012;4(1):85 - 96.
11. Branco F, Pereirinha J, Pereira E, Costa D, Amaro MI, Nunes F. What does it mean to have a minimum acceptable standard of living in Portugal today? Methodological perspectives. ESPAnet Anniversary Conference; Edinburgh2012.
12. Middleton S. Agreeing Poverty Line: The Diversity of Consensual Budget Standards Methodology’ in Bradshaw, J. and Sainsbury, R. (eds.) Researching Poverty. Aldershot: Abigail, 2000.
13. MacMahon B, Weld G, Thornton R. Minimum Essential Budgets for Households in Rural Areas. Dublin: Vincentian Partnership for Social Justice, 2010.
14. Collins ML, MacMahon B, Weld G, Thornton R. A minimum standard of income for Ireland; a consensual budget standards study examining household
types across the lifecycle. Dublin: The Policy Institute at Trinity College Dublin, 2012.
15. MacMahon B, Weld G, Thornton R, Collins ML. The Cost of a Child - a consensual budget standards study examining the direct cost of a child across childhood. Dublin: Vincentian Partnership for Social Justice, 2012.
16. MacMahon B, Weld G, Thornton R. 2012 Review of the Minimum Essential Standard of Living Baskets and the Addition of the 3rd & 4th child to the Dataset. Dublin: Vincentian Partnership for Social Justice, 2012.
17. Davis A, Hirsch D, Beckhelling J, Padley M. A minimum income standard for the UK in 2012: Keeping up in hard times. Loughborough University: Joseph Rowntree Foundation, 2012.
18. Central Statistics Office. Survey on Income and Living Conditions 2013. Dublin: Central Statistics Office; 2015; Available from: http://www.cso.ie/en/releasesandpublications/er/silc/surveyonincomeandlivingconditions2013/#.VS50c010x9B.

The cost of a healthy food basket
19. Dobson B, Beardsworth A, Keil T. Diet, choice and poverty: social, cultural and nutritional aspects of food consumption among low-income families. London: Family Policy Studies Centre, 1994.
20. Kelly C, Gavin A, Molcho M, Nic Gabhainn S. The Irish Health Behaviour in School-aged Children (HBSC) Study 2010. Health Promotion Research Centre National University of Ireland, Galway, 2012.
21. Layte R, McCrory C. Growing up in Ireland. National longitudinal study of children: Overweight and obesity among 9-year-olds Dublin: Department of Children and Youth Affairs, 2011.
22. Friel S, Conlon C. Food poverty and policy. Dublin: Combat Poverty Agency, 2004

Do you have a kids menu? A report into kids meals when eating out
Summary Report
safefood:7 Eastgate Avenue, Eastgate, Little Island, Co. Cork7 Ascaill an Gheata Thoir, An tOiléan Beag, Co. Chorcaí7 Aistyett Avenue, Aistyett, Wee Isle, Co. CorkTel: +353 (0)21 230 4100 Fax: +353 (0)21 230 4111Email: [email protected] Web: www.safefood.eu
www.safefood.eu
HELPLINENI 0800 085 1683ROI 1850 40 4567