Embed Size (px)
Citation preview
Part of the PatientView series of reports:
‘The Corporate Reputation of Pharma
—the Patient Perspective for 2014’
Published in 2015
Feedback from 1,150 patient groups worldwidePUBLISHED FEBRUARY 2015
THE CORPORATEREPUTATION OF PHARMA
—THE PATIENTPERSPECTIVE IN 2014
GLOBAL EDITION
“I was torn betweenethical,transparency, andpatient safety.But, ultimately,patient safety is themost important to meand to ourorganization”
—Global, US-basedpatient groupfocusing on cancerand palliative care
CONTENTS
������������ ���� 1
������������� ��� ������� ���� 5
����������� ���� 13
����������:���������� �� ������ �� 2014
�������� �� 37 ��������� �������� �� 37 ���������������� �� �����������
���� 14
Information analysisAndrew Banner
EditorsClive NeadAlexandra Wyke
PatientView Brussels OfficeDee O’Sullivan
PatientView Netherlands OfficeRob Halkes
Contact information for [email protected]://www.patient-view.com
February 2015
FEBRUARY 2015: CORPORATE REPUTATION OF PHARMA—GLOBAL EDITION
© PatientView 2015 page 1
Introduction
‘The Corporate Reputation of Pharma—from a
Patient Perspective’ is now in its fourth edition. This
report contains the latest version (2014 results;
published early 2015). For each annual Corporate
Reputation report, PatientView surveys a large
number of patient groups worldwide—international,
national, and regional, from across many different
disease and healthcare specialties. 1,150 patient
groups from 58 countries participated in the
Corporate Reputation’s 4th edition.
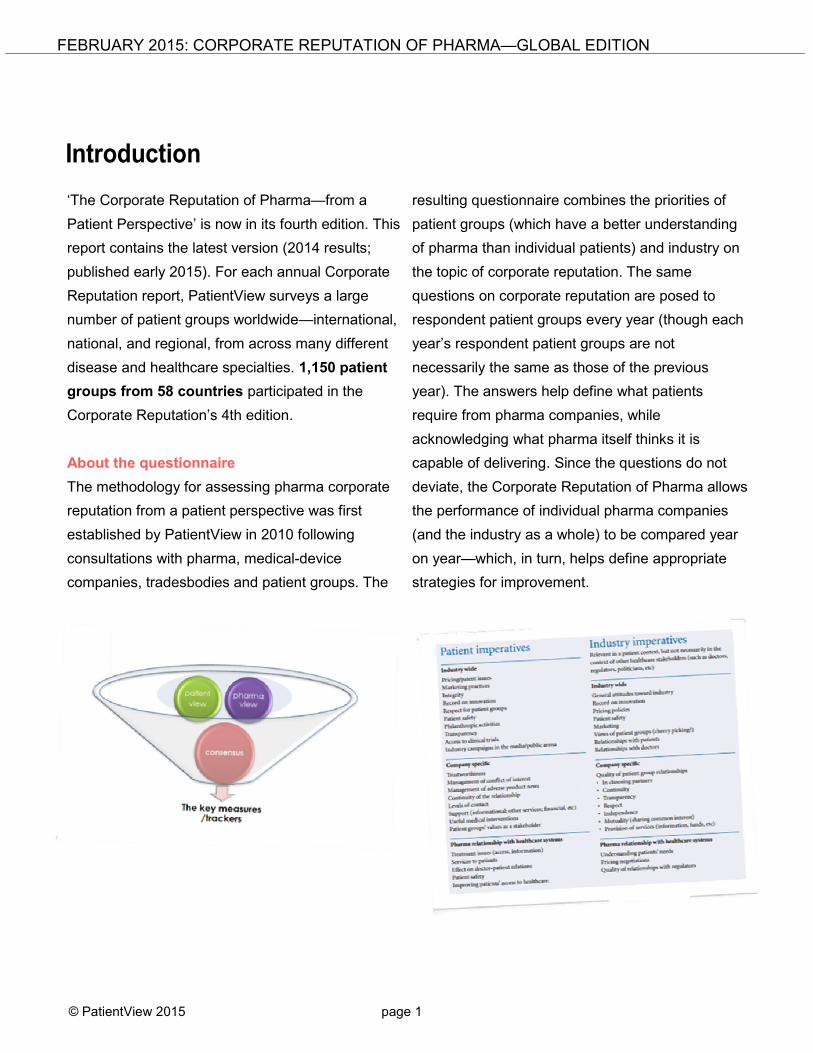
About the questionnaire
The methodology for assessing pharma corporate
reputation from a patient perspective was first
established by PatientView in 2010 following
consultations with pharma, medical-device
companies, tradesbodies and patient groups. The
resulting questionnaire combines the priorities of
patient groups (which have a better understanding
of pharma than individual patients) and industry on
the topic of corporate reputation. The same
questions on corporate reputation are posed to
respondent patient groups every year (though each
year’s respondent patient groups are not
necessarily the same as those of the previous
year). The answers help define what patients
require from pharma companies, while
acknowledging what pharma itself thinks it is
capable of delivering. Since the questions do not
deviate, the Corporate Reputation of Pharma allows
the performance of individual pharma companies
(and the industry as a whole) to be compared year
on year—which, in turn, helps define appropriate
strategies for improvement.
FEBRUARY 2015: CORPORATE REPUTATION OF PHARMA—GLOBAL EDITION
© PatientView 2015 page 2
The methodology behind the process of selecting
questions for The Corporate Reputation of Pharma
survey is outlined on page 13.
To reiterate, The Corporate Reputation of Pharma
‘league tables’ provide feedback on the patient
perceptions of each individual pharma company
during one particular year (in this instance, during
2014). Note that patient groups are providing their
perceptions only. Factors such as the transparency
of a company, or its integrity, may be interpreted
differently by the various respondent patient groups.
For the purposes of this survey, though, such
differences of opinion do not matter, since The
Corporate Reputation study only measures
perceptions.
PatientView has been asked over the years to
explain how the results from the Corporate
Reputation of Pharma survey are calculated.
Significant effort has been made to remove bias
from from the procedure (though some level of
distortion can never be completely ruled out).
Conducted anonymously
To ensure that respondent patient groups feel able
to offer truthful opinions, the survey is carried out
with the assurance of respondent anonymity. No
individual patient group response is ever made
public. The identity of respondent patient groups is
known only to PatientView.
Coping with variety among companies
The intention is that companies of different size,
medical interest, and geographic reach are all
judged by common criteria. This is done by having
companies assessed only by patient groups that
claim familiarity with them. Of course, many patient
groups may claim familiarity with big multinational
companies. That is why the final percentages used
to measure corporate reputation are determined by
a further requirement—they are based only on those
patient groups which provide a response to a
particular question.
Levelling the playing field
Attempts are made to ensure all companies
included in the analyses are assessed by a roughly
similar percentage of respondent patient groups
which have worked them, to attain level playing
field, PatientView invited all pharma companies
included in the questionnaire to send details of the
FEBRUARY 2015: CORPORATE REPUTATION OF PHARMA—GLOBAL EDITION
© PatientView 2015 page 3
survey to the patient groups with which they have
partnered. To avoid bias, the invitation was made
only after the survey was two thirds of the way
towards its deadline (by which time, a considerable
number of patient groups had already responded
without any prompting from pharma companies).
Anomalies, though, still remain. Just 8% of 2014’s
respondent patient groups stating familiarity with
Stada Arzneimittel also say that they have worked
with the company—a low percentage. Only 12%
familiar with Allergan have worked with it; 14% with
Mylan; 15% with Actavis; and 20% with Baxter
International. The small percentages may be partly
because these particular companies do not have
extensive reach among patient groups, and/or
(more likely) PatientView is unware of many of the
patient groups with which these companies do work.
The problem is the opposite in the case of four
companies—AbbVie, Eisai, UCB and ViiV
Healthcare. More than half of 2014’s respondent
patient groups familiar with these companies claim
to have worked with them—a high percentage that
could lead to bias when comparing the results of the
four with those of their corporate peers. Fortunately
for the integrity of the results, PatientView has found
in previous editions of The Corporate Reputation
survey that patient groups which have worked with
companies do not necessarily vote them favourite.
Moreover, patient groups typically work with multiple
companies.
Expanding the global reach of the survey to
avoid a geographic bias
Until 2014, PatientView conducted its annual
Corporate Reputation surveys in five languages:
English, French, German, Italian and Spanish. A
high proportion of the respondent patient groups
(around 20-25%) came from the UK in those three
years. For the 2014 survey, the number of
languages was extended to 12, and include: Danish,
Dutch, Finnish, Greek, Polish, Portuguese and
Swedish. The proportion of respondents from the
UK has dropped in 2014 (to 9.8%).
Inevitably, some level of bias cannot be avoided
PatientView identifies four possible ways in which
The Corporate Reputation results could be biased:
1. Companies which have only a small number of
patient groups claiming familiarity with them
each year might see dramatic shifts in their
results, year on year.
2. Companies which have hundreds of patient
groups claiming familiarity with them each year
might find improvement more difficult to achieve
than those of their peers which have a smaller
number of patient groups claiming familiarity.
3. A number of the Danish patient groups
responding to the Danish-language element of
the survey claim familiarity with Novo Nordisk
and Lundbeck—even though (in all likelihood)
they probably know little about the two
companies, since these particular respondent
patient groups specialise in disease areas
outside the scope of the two companies.
4. Patient groups of different therapy areas and
geographic remits take differing views of
pharma. The results from a 2014 PatientView
benchmarking exercise among 1,000 patient
FEBRUARY 2015: CORPORATE REPUTATION OF PHARMA—GLOBAL EDITION
© PatientView 2015 page 4
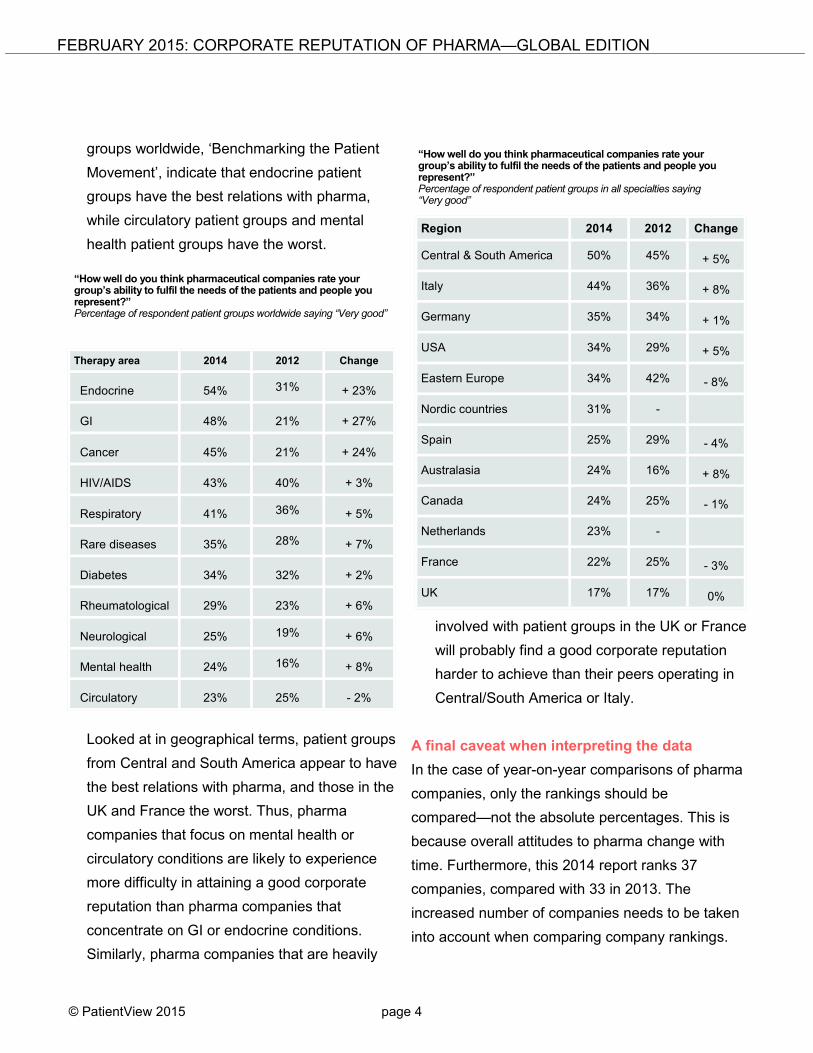
groups worldwide, ‘Benchmarking the Patient
Movement’, indicate that endocrine patient
groups have the best relations with pharma,
while circulatory patient groups and mental
health patient groups have the worst.
Looked at in geographical terms, patient groups
from Central and South America appear to have
the best relations with pharma, and those in the
UK and France the worst. Thus, pharma
companies that focus on mental health or
circulatory conditions are likely to experience
more difficulty in attaining a good corporate
reputation than pharma companies that
concentrate on GI or endocrine conditions.
Similarly, pharma companies that are heavily
involved with patient groups in the UK or France
will probably find a good corporate reputation
harder to achieve than their peers operating in
Central/South America or Italy.
A final caveat when interpreting the data
In the case of year-on-year comparisons of pharma
companies, only the rankings should be
compared—not the absolute percentages. This is
because overall attitudes to pharma change with
time. Furthermore, this 2014 report ranks 37
companies, compared with 33 in 2013. The
increased number of companies needs to be taken
into account when comparing company rankings.
“How well do you think pharmaceutical companies rate yourgroup’s ability to fulfil the needs of the patients and people yourepresent?”Percentage of respondent patient groups worldwide saying “Very good”
Therapy area 2014 2012 Change
Endocrine 54% 31% + 23%
GI 48% 21% + 27%
Cancer 45% 21% + 24%
HIV/AIDS 43% 40% + 3%
Respiratory 41% 36% + 5%
Rare diseases 35% 28% + 7%
Diabetes 34% 32% + 2%
Rheumatological 29% 23% + 6%
Neurological 25% 19% + 6%
Mental health 24% 16% + 8%
Circulatory 23% 25% - 2%
“How well do you think pharmaceutical companies rate yourgroup’s ability to fulfil the needs of the patients and people yourepresent?”Percentage of respondent patient groups in all specialties saying“Very good”
Region 2014 2012 Change
Central & South America 50% 45% + 5%
Italy 44% 36% + 8%
Germany 35% 34% + 1%
USA 34% 29% + 5%
Eastern Europe 34% 42% - 8%
Nordic countries 31% -
Spain 25% 29% - 4%
Australasia 24% 16% + 8%
Canada 24% 25% - 1%
Netherlands 23% -
France 22% 25% - 3%
UK 17% 17% 0%
FEBRUARY 2015: CORPORATE REPUTATION OF PHARMA—GLOBAL EDITION
© PatientView 2015 page 13
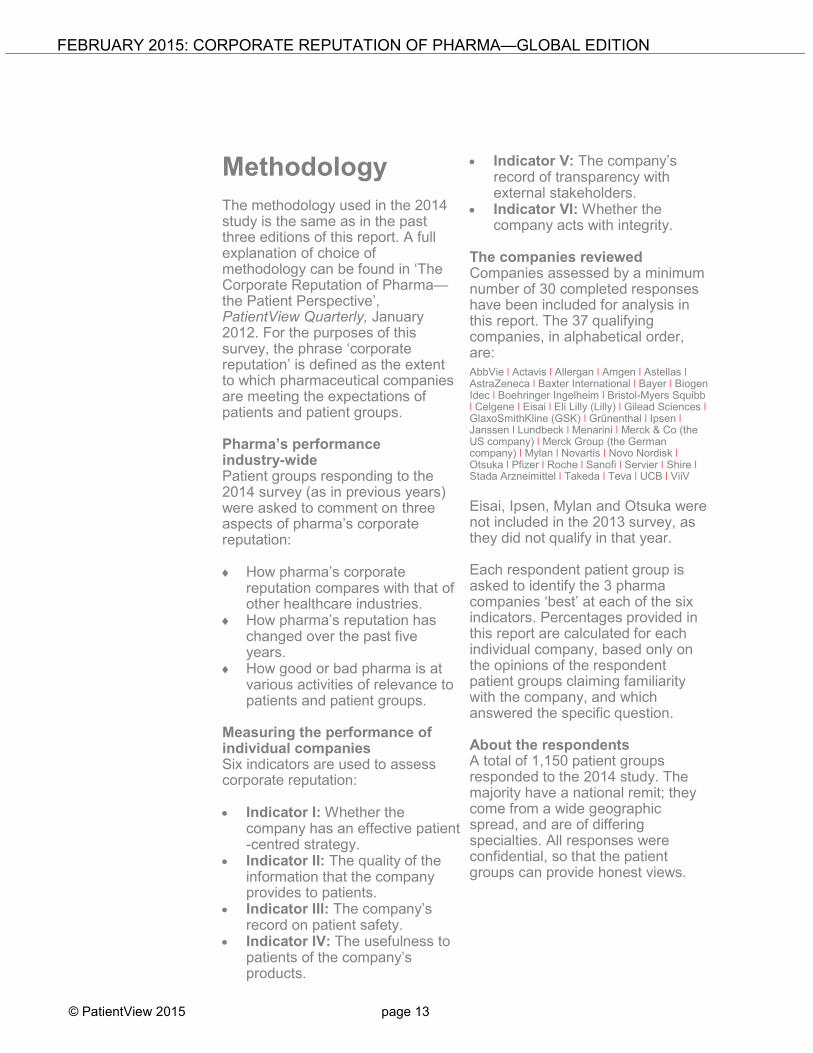
Methodology
The methodology used in the 2014study is the same as in the pastthree editions of this report. A fullexplanation of choice ofmethodology can be found in ‘TheCorporate Reputation of Pharma—the Patient Perspective’,PatientView Quarterly, January2012. For the purposes of thissurvey, the phrase ‘corporatereputation’ is defined as the extentto which pharmaceutical companiesare meeting the expectations ofpatients and patient groups.
Pharma’s performanceindustry-widePatient groups responding to the2014 survey (as in previous years)were asked to comment on threeaspects of pharma’s corporatereputation:
How pharma’s corporatereputation compares with that ofother healthcare industries.
How pharma’s reputation haschanged over the past fiveyears.
How good or bad pharma is atvarious activities of relevance topatients and patient groups.
Measuring the performance ofindividual companiesSix indicators are used to assesscorporate reputation:
Indicator I: Whether thecompany has an effective patient-centred strategy.
Indicator II: The quality of theinformation that the companyprovides to patients.
Indicator III: The company’srecord on patient safety.
Indicator IV: The usefulness topatients of the company’sproducts.
Indicator V: The company’srecord of transparency withexternal stakeholders.
Indicator VI: Whether thecompany acts with integrity.
The companies reviewedCompanies assessed by a minimumnumber of 30 completed responseshave been included for analysis inthis report. The 37 qualifyingcompanies, in alphabetical order,are:AbbVie l Actavis l Allergan l Amgen l Astellas lAstraZeneca l Baxter International l Bayer l BiogenIdec l Boehringer Ingelheim l Bristol-Myers Squibbl Celgene l Eisai l Eli Lilly (Lilly) l Gilead Sciences lGlaxoSmithKline (GSK) l Grũnenthal l Ipsen lJanssen l Lundbeck l Menarini l Merck & Co (theUS company) l Merck Group (the Germancompany) l Mylan l Novartis l Novo Nordisk lOtsuka l Pfizer l Roche l Sanofi l Servier l Shire lStada Arzneimittel l Takeda l Teva l UCB l ViiV
Eisai, Ipsen, Mylan and Otsuka werenot included in the 2013 survey, asthey did not qualify in that year.
Each respondent patient group isasked to identify the 3 pharmacompanies ‘best’ at each of the sixindicators. Percentages provided inthis report are calculated for eachindividual company, based only onthe opinions of the respondentpatient groups claiming familiaritywith the company, and whichanswered the specific question.
About the respondentsA total of 1,150 patient groupsresponded to the 2014 study. Themajority have a national remit; theycome from a wide geographicspread, and are of differingspecialties. All responses wereconfidential, so that the patientgroups can provide honest views.
FEBRUARY 2015: CORPORATE REPUTATION OF PHARMA—GLOBAL EDITION
© PatientView 2015 page 14
Appendix 1
Corporate reputation ofthe pharma industryin 2014
Reputation of the pharma industry in 2014—compared with other healthcare sectors
Performance of the pharma industry in 2014at activities important to patient groups
Reputation of the pharma industry in 2014—versus in 2013, 2012 and in 2011
Performance of the pharma industry in 2014 at activitiesimportant to patient groups—versus in 2013, 2012 and in 2011
�������� 1
FEBRUARY 2015: CORPORATE REPUTATION OF PHARMA—GLOBAL EDITION
© PatientView 2015 page 19
Appendix 2
Rankings of individualpharma companies
Rankings of the 37 pharmaceutical companies in 2014—for each of the six indicators in turn
Overall rankings of the 37 pharmaceutical companies in 2014—across all six indicators (companies listed in alphabetical order)
Final rankings of the 37 pharmaceutical companies in 2014—versus 2013
�������� 1
FEBRUARY 2015: CORPORATE REPUTATION OF PHARMA—GLOBAL EDITION
© PatientView 2015 page 28
Appendix 3
Profiles of the 37pharma companies
AbbVie
Actavis
Allergan
Amgen
Astellas
AstraZeneca
Baxter International
Bayer
Biogen Idec
Boehringer- Ingelheim
Bristol-Myers Squibb
Celgene
Eli Lilly
Gilead
GSK
Grünenthal
Janssen
Lundbeck
Menarini
Merck & Co (USA)
Merck KGaA (EMD Group)
Novartis
Novo Nordisk
Pfizer
Roche
Sanofi
Servier
Shire
Stada Arzneimittel
Takeda
Teva
UCB
ViiV Healthcare
Eisai
Mylan
Ipsen
Otsuka
FEBRUARY 2015: CORPORATE REPUTATION OF PHARMA—GLOBAL EDITION
© PatientView 2015 page 67
Appendix 4
Profile of the 1,150respondent patientgroups in 2014
Main specialisations of the 1,150 respondent patient groups in 2014
Geographic headquarters of 2014’s 1,150 respondent patient groups—by country
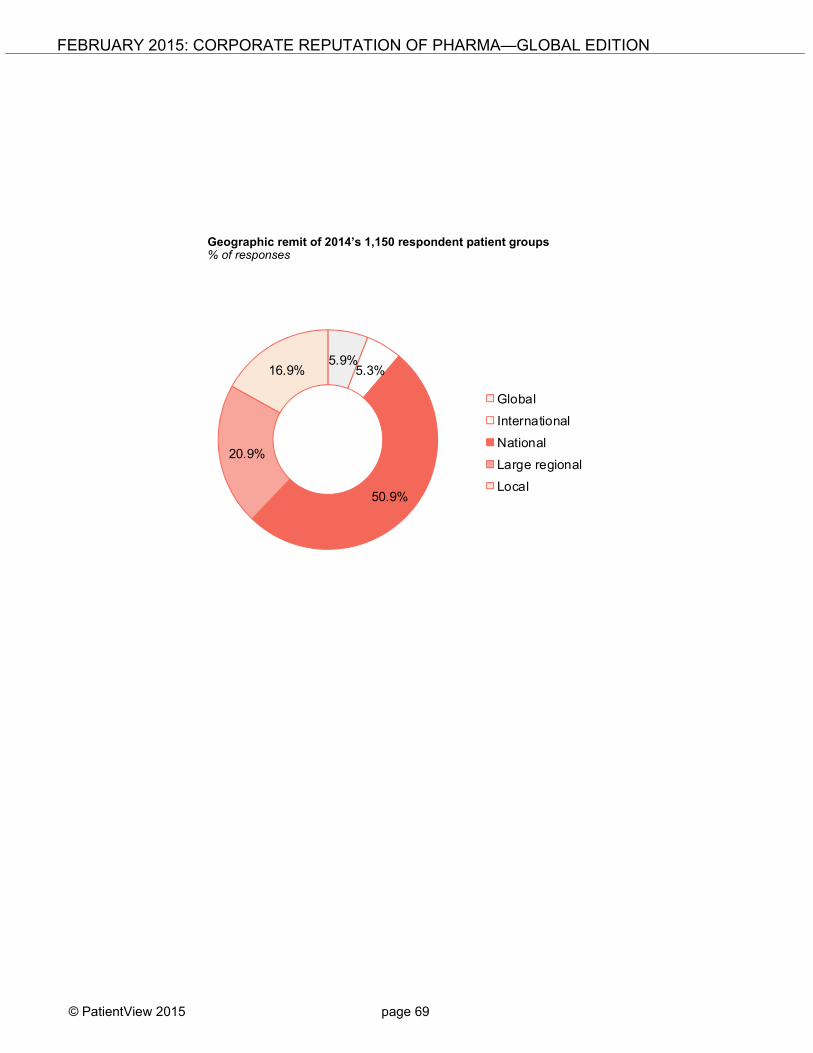
Geographic remit of 2014’s 1,150 respondent patient groups
FEBRUARY 2015: CORPORATE REPUTATION OF PHARMA—GLOBAL EDITION
© PatientView 2015 page 68
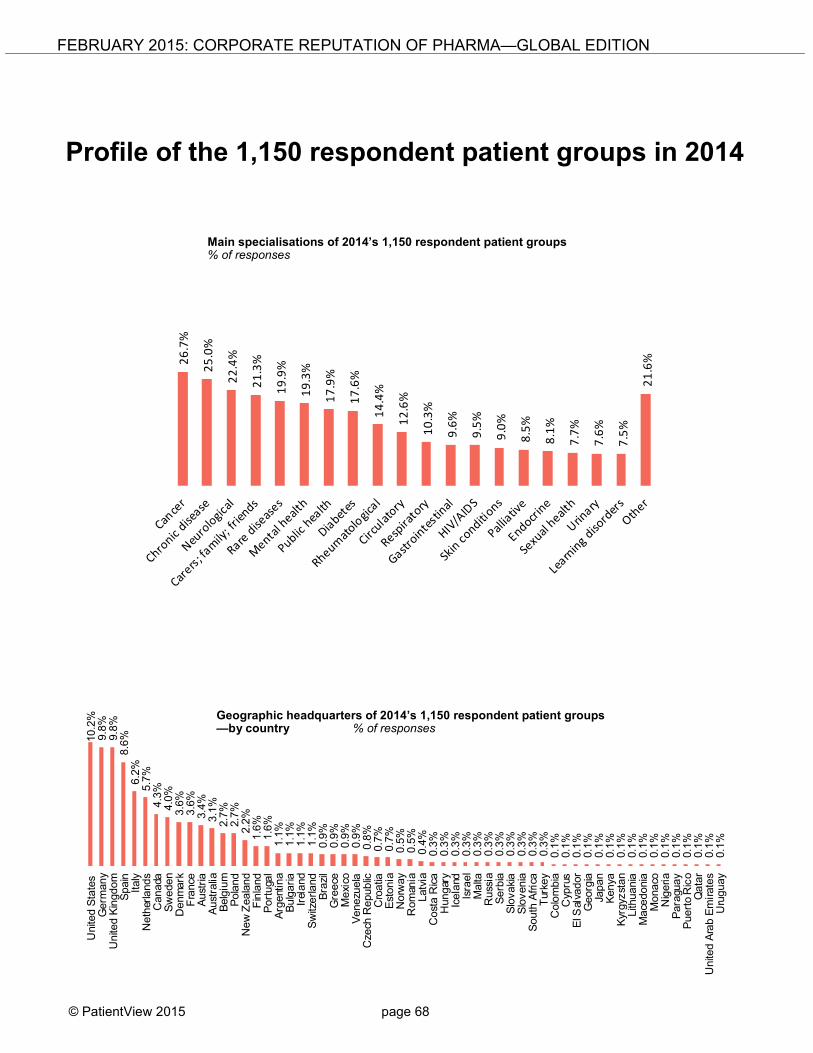
Profile of the 1,150 respondent patient groups in 2014
Main specialisations of 2014’s 1,150 respondent patient groups% of responses
26
.7%
25
.0%
22
.4%
21
.3%
19
.9%
19
.3%
17
.9%
17
.6%
14
.4%
12
.6%
10
.3%
9.6
%
9.5
%
9.0
%
8.5
%
8.1
%
7.7
%
7.6
%
7.5
%
21
.6%
10.2
%9.8
%9.8
%8.6
%6.2
%5.7
%4.3
%4.0
%3.6
%3.6
%3.4
%3.1
%2.7
%2.7
%2.2
%1.6
%1.6
%1.1
%1.1
%1.1
%1.1
%0.9
%0.9
%0.9
%0.9
%0.8
%0.7
%0.7
%0.5
%0.5
%0.4
%0.3
%0.3
%0.3
%0.3
%0.3
%0.3
%0.3
%0.3
%0.3
%0.3
%0.3
%0.1
%0.1
%0.1
%0.1
%0.1
%0.1
%0.1
%0.1
%0.1
%0.1
%0.1
%0.1
%0.1
%0.1
%0.1
%0.1
%
Unite
dS
tate
sG
erm
any
Unite
dK
ingdom
Spain
Italy
Neth
erla
nds
Canada
Sw
eden
Denm
ark
Fra
nce
Aust
ria
Aust
ralia
Belg
ium
Pola
nd
New
Zeala
nd
Fin
land
Port
uga
lA
rgent
ina
Bulg
aria
Irel
and
Sw
itzerland
Bra
zil
Gre
ece
Mexi
coV
enezu
ela
Cze
chR
epublic
Cro
atia
Est
onia
Norw
ay
Rom
ania
Latv
iaC
ost
aR
ica
Hungar
yIc
ela
ndIs
rael
Malta
Russ
iaS
erb
iaS
lovaki
aS
lovenia
South
Afric
aT
urke
yC
olo
mbia
Cyp
rus
ElS
alva
dor
Georg
iaJa
pan
Kenya
Kyr
gyz
stan
Lith
uania
Mace
donia
Monaco
Nig
eria
Para
guay
Puert
oR
ico
Qata
rU
nite
dA
rab
Em
irate
sU
ruguay
Geographic headquarters of 2014’s 1,150 respondent patient groups—by country % of responses
FEBRUARY 2015: CORPORATE REPUTATION OF PHARMA—GLOBAL EDITION
© PatientView 2015 page 69
Geographic remit of 2014’s 1,150 respondent patient groups% of responses
5.9%5.3%
50.9%
20.9%
16.9%
Global
International
National
Large regional
Local
Contact detailsPatientViewRegistered office:One Fleet Place, London, EC4M 7WS, UKTel: +44-(0)1547-520-965E-mail: [email protected] in England, number: 3944382Data protection registration number: Z7133076VAT registration number: GB-760-985-885
Copyright © 2015 PatientView Ltd.All rights reserved.
This booklet is the property of PatientView, and nopart may be reproduced without permission, orpassed on to any third party without the permissionof PatientView.