Embed Size (px)
Citation preview
RESEARCH ARTICLE
The contributions of executive functions to
mathematical learning difficulties and
mathematical talent during adolescence
Roberto A. Abreu-MendozaID1,2, Yaira Chamorro1, Mauricio A. Garcia-Barrera3,
Esmeralda MatuteID1*
1 Instituto de Neurociencias, CUCBA, Universidad de Guadalajara, Guadalajara, Jalisco, Mexico, 2 Rutgers
University, Newark, New Jersey, United States of America, 3 Department of Psychology, University of
Victoria, Victoria, British Columbia, Canada
Abstract
Are mathematical learning difficulties caused by impairment of the abilities that underlie
mathematical talent? Or are mathematical difficulties and talent qualitatively different? The
main goal of this study was to determine whether mathematical learning difficulties are
explained by the same executive functions as mathematical talent. We screened a pool of
2,682 first-year high school students and selected 48 for evaluation, dividing them into three
groups: those with mathematical learning difficulties (n = 16), those with typical performance
(n = 16), and those with mathematical talent (n = 16). Adolescents from the learning difficul-
ties and talented groups had age, reading skills, and verbal and non-verbal intelligence that
were similar to those of the typical performance group. Participants were administered a
suite of tasks to evaluate verbal and visual short-term memory and executive functions of
inhibition, shifting, and updating. Different executive functions showed different contribu-
tions at the two ends of the math ability continuum: lower levels of performance in updating
visual information were related to mathematical learning difficulties, while greater shifting
abilities were related to mathematical talent. Effect sizes for the differences in performance
between groups were large (Hedges’ g > 0.8). These results suggest that different executive
functions are associated with mathematical learning difficulties and mathematical talent. We
discuss how these differences in executive functions could be related to the different types
of mathematical abilities that distinguish the three groups.
Introduction
During adolescence, students are expected to acquire competency in a range of mathematical
subjects, such as algebra, trigonometry, and calculus. To do so, they must build their knowl-
edge of new concepts on a previously learned foundation of arithmetic with natural and ratio-
nal numbers. Mathematical attainment will have an impact on various aspects of their adult
lives, including employment opportunities [1,2], health [3], and socioeconomic status [4]. At
the beginning of high school, however, there are large individual differences in mathematical
PLOS ONE | https://doi.org/10.1371/journal.pone.0209267 December 13, 2018 1 / 21
a1111111111
a1111111111
a1111111111
a1111111111
a1111111111
OPEN ACCESS
Citation: Abreu-Mendoza RA, Chamorro Y, Garcia-
Barrera MA, Matute E (2018) The contributions of
executive functions to mathematical learning
difficulties and mathematical talent during
adolescence. PLoS ONE 13(12): e0209267. https://
doi.org/10.1371/journal.pone.0209267
Editor: Jerome Prado, French National Center for
Scientific Research (CNRS) & University of Lyon,
FRANCE
Received: May 21, 2018
Accepted: December 3, 2018
Published: December 13, 2018
Copyright: © 2018 Abreu-Mendoza et al. This is an
open access article distributed under the terms of
the Creative Commons Attribution License, which
permits unrestricted use, distribution, and
reproduction in any medium, provided the original
author and source are credited.
Data Availability Statement: Data are available
from https://osf.io/ag4er/?view_only=
dec8558ed1d54707b032510a6677a8df.
Funding: This work was supported by two grants
from the Consejo Nacional de Ciencia y Tecnologıa
(CONACyT): Programa Nacional de Posgrado de
Calidad Fellowship No. 576221 (awarded to the
first author) and Investigacion en Fronteras de la
Ciencia Grant No. 783 (awarded to the third
author). The funder had no role in study design,
skills. Some adolescents struggle still with basic arithmetic, while others are prepared to build
the mathematical knowledge needed to pursue a science, technology, engineering, and math
(STEM) career.
What are the cognitive abilities associated with these individual differences in mathematical
skills? Executive functions, the abilities to form, plan, and carry out goal-directed behaviors
[5], have been identified as playing a key role in explaining such differences throughout devel-
opment [6–8]. Impaired executive functions, especially working memory, have also been pro-
posed as a core deficit in individuals with mathematical learning difficulties (MLD). However,
only recently have studies begun to report the contribution of different executive functions to
mathematical talent. The current study aimed to investigate whether the same executive func-
tions contribute to the whole continuum of mathematical aptitude, or whether specific func-
tions contribute to MLD or mathematical talent.
Mathematical aptitude in adolescence
By the end of middle school, adolescents in Mexico should have developed a solid knowledge
of the arithmetic of natural and rational numbers and should have started to develop their
understanding of basic concepts of algebra and statistics [9]. However, first-year high school
students still appear to lag behind these expectations [10,11]. Recently, Abreu-Mendoza, Cha-
morro, and Matute [10] reported that first-year Mexican high school students still have diffi-
culties in solving arithmetic problems that involve fractions and decimals. Using a large
sample (N = 1236), they performed an exploratory factor analysis on the 40 items of the Math
Computation subtest of the Wide Range Achievement Test-4 (WRAT-4) [12]. A solution was
identified with three factors: the first was the addition, subtraction, multiplication, and divi-
sion of multi-digit numbers with and without decimals (arithmetic); the second was the solu-
tion of arithmetic problems of like fractions and simple equations (fractions and basic
algebra); and the third was the conversion of decimals to percentages or fractions, and the
solution of arithmetic problems involving fractions with different denominators (rational
numbers). Although these abilities should have been consolidated at this stage of education,
none of these factors showed a percentage of correct responses above 62%. Such difficulties are
not exclusive to Mexican students. At roughly the same age, only a small percentage (27%) of
U.S. eighth graders correctly estimate the sum of 12/13 + 7/8 [13]. Taken together, these stud-
ies suggest that individual differences in mathematical abilities during adolescence are found
mostly in arithmetic problems that involve fractions and decimals.
Executive functions in adolescence
The executive functions are general purpose mechanisms that modulate the operation of vari-
ous cognitive subprocesses [14] and allow an organized, purposeful, and goal-directed behav-
ior [15]. Various models have described the abilities that fall under the executive function
umbrella term. Miyake et al. [14] proposed "shifting," "inhibition," and "updating" as three
basic, separated, yet related executive components that can be accurately operationalized and
that are implicated in the performance of more complex executive behaviors. Shifting concerns
the ability to switch from one mindset to another, often according to rules that would be
incompatible with the other [16]. Updating involves monitoring and coding incoming infor-
mation for relevance to a given task [17] and is closely related to the concept of working mem-
ory. Inhibition is the ability to deliberately suppress dominant, automatic, or prepotent
responses when necessary [14].
Many studies have adopted this multifactorial framework. However, this model of executive
functions is based on adult data, and it is not clear if it also describes developmental stages
The contributions of executive functions to mathematical learning difficulties and mathematical talent
PLOS ONE | https://doi.org/10.1371/journal.pone.0209267 December 13, 2018 2 / 21
data collection and analysis, decision to publish, or
preparation of the manuscript.
Competing interests: The authors have declared
that no competing interests exist.
[18], especially when executive functions follow a protracted developmental path from child-
hood to adulthood [19]. In this regard, Lee et al. [18] reported that a two-factor model (combin-
ing inhibitory control and switching measures) provides a better fit during childhood (six to ten
years of age) than the three-factor structure. The former is feasible until 11 years of age, and the
three executive components became more differentiated around 15 years of age. A recent sys-
tematic review and re-analysis of confirmatory factor analysis-based models demonstrated a
higher acceptance of parsimonious models (1 or 2 factors) in childhood and early adolescence
[20]. Thus, late adolescence seems to be a good developmental stage to assess the three compo-
nents proposed by Miyake and colleagues [14,21] in relation to academic achievement.
Mathematical aptitude and executive functions
Numerous studies have shown the importance of executive functions to the acquisition of
mathematical skills. Performance in executive function tasks is associated with individual dif-
ferences in numerical abilities from early childhood [7,8,22], and through childhood [23–25],
adolescence, and adulthood [26–28].
Executive functions have also been linked to difficulties in acquiring such abilities. Individ-
uals with "weak mathematical performance of developmental origin" [29] have impairments in
verbal and visual working memory [30–33], inhibition [33], and shifting [24]. Following the
traditional model of working memory [34], some studies have focused on comparing whether
individuals with dyscalculia have impaired verbal or visual working memory that leads to dif-
ferent results. For instance, Ashkenazi, Rosenberg-Lee, Metcalfe, Swigart, and Menon [35]
reported that children with mathematical disabilities have preserved verbal working memory
skills, but also have deficits in visuospatial working memory that can be observed at both the
cognitive and functional neuroanatomical levels. Moreover, some authors have suggested that
visual working memory is a predictor for math abilities, but not for reading skills [36]. More
recent studies have begun to investigate the full domain of executive functions. For instance,
difficulties in performing arithmetic operations have been associated with impaired working
memory and inhibition: working memory serves as a mental workspace for the manipulation
of operators, operands, and numerical facts, and inhibition could suppress irrelevant informa-
tion [33]. Working memory has also been linked with fact retrieval, another major impairment
in children with MLD, which determines how much information is rehearsed and could also
influence how much of this information is consolidated as long-term memory representation
[37].
However, there is a need for further study of the link between executive functions and
mathematical talent. For instance, indirect evidence suggests that high performance in math is
related to an ability to alternate efficiently between strategies. By comparing the brain activity
patterns of an expert calculator and six non-expert adults performing multi-digit multiplica-
tions, Pesenti and colleagues [38] found that experts switched between brain areas involved in
computing and those involved in fact retrieval. More recently, Swanson [39] compared the
performance of children scoring 1.5 SD above the mean on two standardized mathematical
tests and those with average scores on a series of tests including measures of short-term mem-
ory, working memory, and inhibition. In his study, mathematical talent was associated with a
latent variable representing working memory, which included the digit/sentence, backward
digit, listening/sentence, and updating tasks. In a review of current literature on the cognitive
correlates of mathematical talent, Myers, Carey, and Szucs [40] concluded that mathematical
talent is associated with spatial processing, working memory, efficient strategy switching, and
inhibition. Overall, working memory has been the component of executive function consis-
tently found to contribute to both ends of the distribution of mathematical abilities [18,40].
The contributions of executive functions to mathematical learning difficulties and mathematical talent
PLOS ONE | https://doi.org/10.1371/journal.pone.0209267 December 13, 2018 3 / 21
The study
Are mathematical learning difficulties and mathematical talent related to the same underlying
abilities? That is, are these two categories the lower and upper ends of the normal distribution
of mathematical aptitude? Or are they discontinuous, qualitatively different cases? To study
mathematical learning difficulties, researchers have traditionally taken the disability/ability
approach, where difficulty is understood as the result of an impaired cognitive ability (e.g.,
number sense, working memory) or the malfunction of a specific brain region or regions [41–
43]. Recent approaches have suggested that different levels of the same abilities whose deficits
are responsible for learning disabilities may also explain the normal variation [30,44]. Here, we
take a step further and suggest that a heightened degree of these same abilities could also be
responsible for exceptional mathematical aptitude.
To obtain empirical support for this idea, we evaluated three groups of adolescents with dis-
tinct mathematical achievement levels: a mathematical learning difficulties (MLD) group, a typical
performance (TP) group, and a mathematical talent (MT) group. Participants in the three groups
had similar reading speeds, verbal and non-verbal intelligence, and processing speeds. They were
evaluated with a suite of executive function tasks (verbal and visuospatial working memory, inhi-
bition, and shifting) and with verbal and visuospatial short-term memory tasks. Given the associa-
tions found between mathematical aptitude or learning difficulties and individual differences in
verbal and visual working memory, we predicted that working memory would contribute to both
ends of the distribution: that is, that adolescents in the MT group would outperform those in the
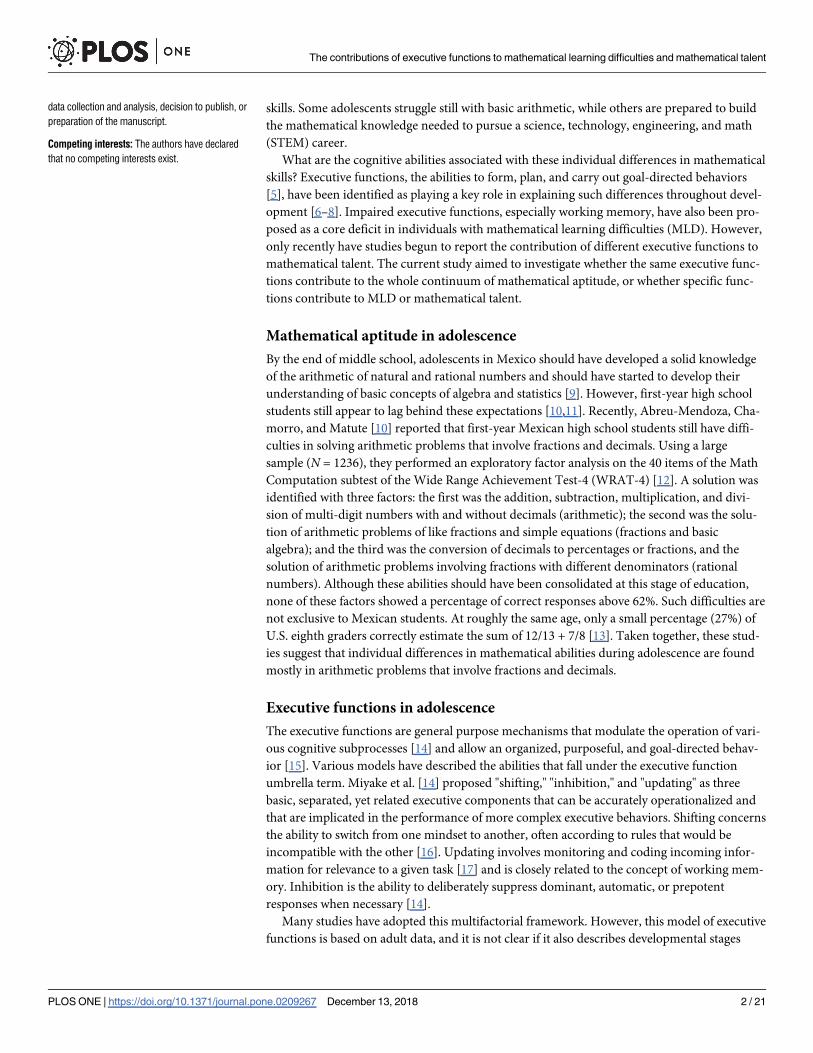
TP group, who would in turn outperform those in the MLD group. Fig 1 shows the hypothetical
patterns for the contributions of different executive functions to mathematical performance. Fig
1C provides a visual representation of our predicted pattern for the measures of working memory:
effect sizes for both pairwise comparisons (MLD vs. TP and TP vs. MT) will be significant.
Methods
Participants
A total of 2,682 first year high school students aged 14 years to 16 years 11 months, from three
public schools in Guadalajara, Mexico, were screened for mathematical abilities using the
WRAT Math Computation subtest [12]. A subsample of 74 students and their parents gave
written informed consent for an expanded assessment. This evaluation included the Vocabu-
lary (verbal intelligence), Matrix Reasoning (non-verbal intelligence), and Arithmetic subtests
from the Mexican version of the WISC-IV [45]; the Written Math and the Reading a Text
Aloud subtests from the Evaluación Neuropsicológica Infantil (ENI) [Neuropsychological
Assessment for Children] [46]; and a suite of executive function and short-term memory tasks.
Forty-eight adolescents met criteria for one of three groups of interest that formed the final
sample: MLD (n = 16, mean age = 16.38 [SD = 0.69], 56% girls), TP (n = 16, mean age = 16.28
[SD = 0.99], 56% girls), and MT (n = 16, mean age = 16.28 [SD = 0.92], 50% girls). The groups
were similar in their mean age: F(2, 45) = 0.75, p = .92, η2 = .003.
For the MLD group, the criteria included: (a) a score at least 1.5 SD below the mean for
Mexican first-year high school students [10] on the WRAT Math Computation subtest, and
(b) a score below the 10th percentile on the ENI Written Math subtest. For the TP group, the
criteria included (a) a score within the range of ± 1 SD of the Mexican standard mean on the
WRAT Math Computation subtest, and (b) a score above the 10th percentile on the ENI Writ-
ten Math subtest. Finally, for the MT group, the criteria included (a) a score� 1.5 SD above
the Mexican standard mean on the WRAT Math Computation subtest, and (b) a scaled score
above the 90th percentile on the ENI Written Math subtest. Participants from all groups were
The contributions of executive functions to mathematical learning difficulties and mathematical talent
PLOS ONE | https://doi.org/10.1371/journal.pone.0209267 December 13, 2018 4 / 21

required to have (c) a scaled score� 7 on the WISC Vocabulary subtest, (d) a scaled score
above the 10th percentile on the ENI Reading a Text Aloud subtest, and they were required (e)
not to meet the diagnostic criteria for ADHD based on a parent questionnaire [47].
The TP group was used as the comparison group: adolescents from MLD and MT groups
had similar age, reading skills, and verbal and non-verbal intelligence as those in this group.
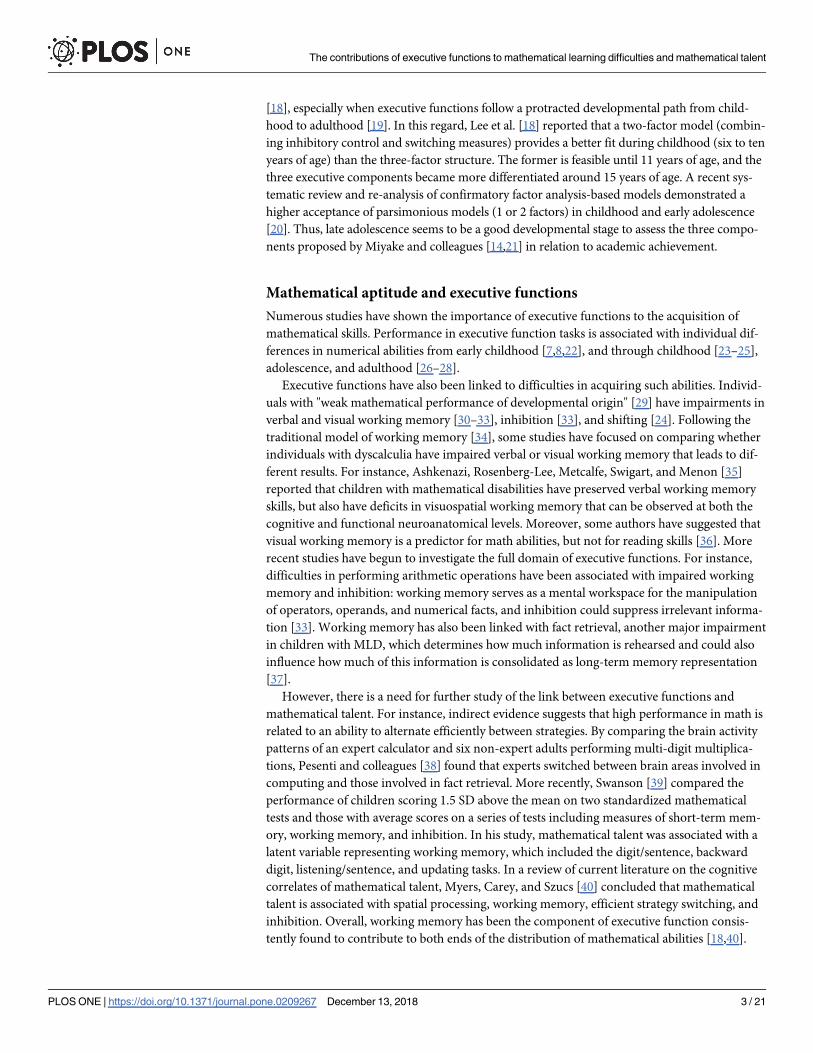
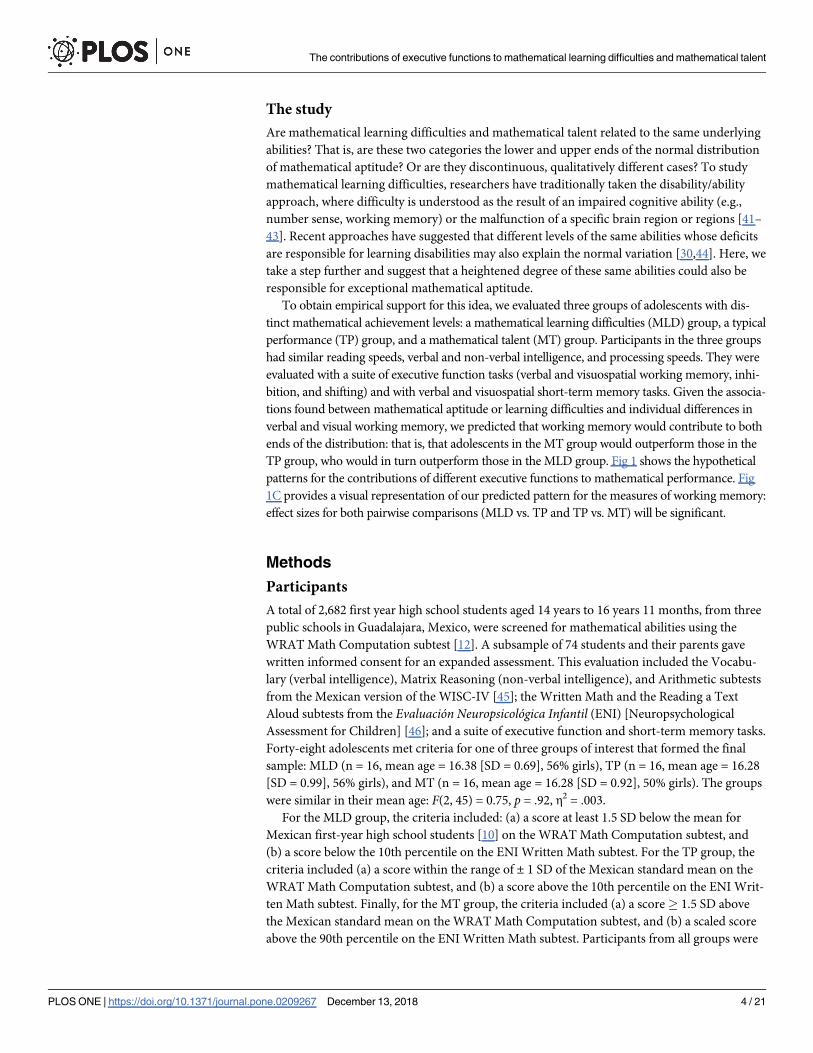
Fig 2 summarizes performance of each group for the standardized subtests. To further describe
their math abilities, Table 1 shows the mean correct responses of each group on the WRAT
Math Computation subtest and the mean proportion of correct responses for each of the three
factors of this subtest described in Abreu-Mendoza et al. [10]. Across these factors, the largest
TPvs
. MT
MLD
vs. T
P
-0.7 -0.3 0.1 0.5 0.9Effect Size
EFta
sk
TPvs
.MT
MLD
vs.T
P
-0.7 -0.3 0.1 0.5 0.9Effect Size
EFta
sk
TPvs
.MT
MLD
vs. T
P
-0.7 -0.3 0.1 0.5 0.9Effect Size
EFta
sk
TPvs
.MT
MLD
vs. T
P
-0.7 -0.3 0.1 0.5 0.9Effect Size
EFta
sk
A.
D.C.
B.
Fig 1. Patterns of hypothetical contributions of executive functions (EF) to the whole continuum of the mathematical abilities. (A) Contribution to Mathematical
Talent (MT), (B) contribution to Mathematical Learning Difficulties (MLD), (C) contributions to both ends of math performance, and (D) no contributions.
https://doi.org/10.1371/journal.pone.0209267.g001
The contributions of executive functions to mathematical learning difficulties and mathematical talent
PLOS ONE | https://doi.org/10.1371/journal.pone.0209267 December 13, 2018 5 / 21
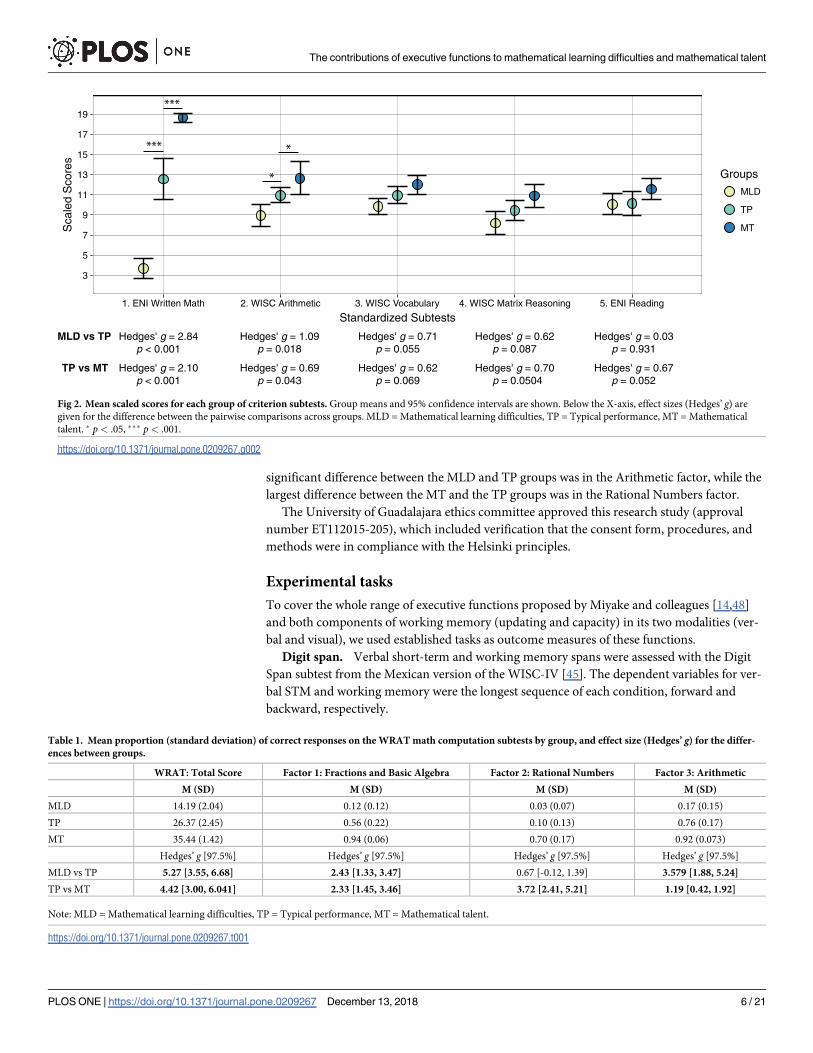
significant difference between the MLD and TP groups was in the Arithmetic factor, while the
largest difference between the MT and the TP groups was in the Rational Numbers factor.
The University of Guadalajara ethics committee approved this research study (approval
number ET112015-205), which included verification that the consent form, procedures, and
methods were in compliance with the Helsinki principles.
Experimental tasks
To cover the whole range of executive functions proposed by Miyake and colleagues [14,48]
and both components of working memory (updating and capacity) in its two modalities (ver-
bal and visual), we used established tasks as outcome measures of these functions.
Digit span. Verbal short-term and working memory spans were assessed with the Digit
Span subtest from the Mexican version of the WISC-IV [45]. The dependent variables for ver-
bal STM and working memory were the longest sequence of each condition, forward and
backward, respectively.
Hedges' g = 2.84 p < 0.001
3
5
7
9
11
13
15
17
19
1. ENI Written Math 2. WISC Arithmetic 3. WISC Vocabulary 4. WISC Matrix Reasoning 5. ENI Reading
Standardized Subtests
Sca
led
Sco
res
Groups
MLD
TP
MT
MLD vs TP
TP vs MT
Hedges' g = 1.09 p = 0.018
Hedges' g = 0.71 p = 0.055
Hedges' g = 0.62 p = 0.087
Hedges' g = 0.03 p = 0.931
Hedges' g = 0.69 p = 0.043
Hedges' g = 0.62 p = 0.069
Hedges' g = 0.70 p = 0.0504
Hedges' g = 0.67 p = 0.052
Hedges' g = 2.10 p < 0.001
***
***
*
*
Fig 2. Mean scaled scores for each group of criterion subtests. Group means and 95% confidence intervals are shown. Below the X-axis, effect sizes (Hedges’ g) are
given for the difference between the pairwise comparisons across groups. MLD = Mathematical learning difficulties, TP = Typical performance, MT = Mathematical
talent. � p< .05, ��� p< .001.
https://doi.org/10.1371/journal.pone.0209267.g002
Table 1. Mean proportion (standard deviation) of correct responses on the WRAT math computation subtests by group, and effect size (Hedges’ g) for the differ-
ences between groups.
WRAT: Total Score Factor 1: Fractions and Basic Algebra Factor 2: Rational Numbers Factor 3: Arithmetic
M (SD) M (SD) M (SD) M (SD)
MLD 14.19 (2.04) 0.12 (0.12) 0.03 (0.07) 0.17 (0.15)
TP 26.37 (2.45) 0.56 (0.22) 0.10 (0.13) 0.76 (0.17)
MT 35.44 (1.42) 0.94 (0.06) 0.70 (0.17) 0.92 (0.073)
Hedges’ g [97.5%] Hedges’ g [97.5%] Hedges’ g [97.5%] Hedges’ g [97.5%]
MLD vs TP 5.27 [3.55, 6.68] 2.43 [1.33, 3.47] 0.67 [-0.12, 1.39] 3.579 [1.88, 5.24]
TP vs MT 4.42 [3.00, 6.041] 2.33 [1.45, 3.46] 3.72 [2.41, 5.21] 1.19 [0.42, 1.92]
Note: MLD = Mathematical learning difficulties, TP = Typical performance, MT = Mathematical talent.
https://doi.org/10.1371/journal.pone.0209267.t001
The contributions of executive functions to mathematical learning difficulties and mathematical talent
PLOS ONE | https://doi.org/10.1371/journal.pone.0209267 December 13, 2018 6 / 21

Simple reaction time task. To evaluate speed processing, adolescents were asked to per-
form a simple reaction time (RT) task, in which they had to press a spacebar as soon as they
saw the letter "A" appear on a screen. The letter was shown with a random interstimulus inter-
val (ISI) of 500–2000 milliseconds over 30 trials. The dependent variable was the mean reac-
tion time of the 30 trials.
Corsi block-tapping task. The span of visual short-term and working memory were mea-
sured with the computerized version of the Corsi block-tapping task [49] from the Psychology
Experiment Building Language (PEBL) test battery [50]. The dependent variables for visual
STM and working memory were the longest sequence of each condition, forward and back-
ward, respectively.
Letter n-back task. The updating component of verbal working memory was evaluated
with two memory load (1- and 2-back) conditions of the letter n-back task [51]. The 1-back
condition consisted of 50 trials and the 2-back of 90 trials. Participants had to press the space
bar as soon as they saw the same letter as the one just shown (1-back) or the one preceding it
(2-back). The stimulus duration was 700 milliseconds and the ISI was 500 milliseconds in both
conditions, and the proportion of targets was 0.3. The dependent variable was the Matthews
correlation coefficient [52]. This accuracy measure uses all four response types—true positives
(TP), true negatives (TN), false positives (FP), and false negatives (FN)—and thus takes into
account trade-offs between these responses:
Mathews coefficient ¼TP � TN � FP � FN
ffiffiffiffiffiffiffiffiffiffiffiffiffiffiffiffiffiffiffiffiffiffiffiffiffiffiffiffiffiffiffiffiffiffiffiffiffiffiffiffiffiffiffiffiffiffiffiffiffiffiffiffiffiffiffiffiffiffiffiffiffiffiffiffiffiffiffiffiffiffiffiffiffiffiffiffiffiffiffiffiffiffiffiffiffiffiðTP þ FNÞðTPþ FPÞðTN þ FPÞðTN þ FNÞ
p
Visual n-back task. The updating component of visual working memory was evaluated
with a task similar to the letter n-back task, but instead of seeing a sequence of letters, partici-
pants saw a sequence of asterisks on a screen that could appear in one of four positions (upper
right, upper left, lower right, and lower left). Participants had to press the space bar as soon as
they saw the asterisk in the same position as the one just shown (1-back) or the one preceding
it (2-back). In both the 1-back and 2-back conditions the stimulus duration was 700 millisec-
onds, the ISI was 500 milliseconds, and the proportion of targets was 0.3. The dependent vari-
able was the Matthews correlation coefficient.
Go/no-go task. To measure adolescents’ inhibition of preponderant responses, we used a
go/no-go task, which consisted of two parts. In the go part, participants had to press a spacebar
as soon as they saw a letter on a screen; in the no-go part, they had to press the spacebar when
they saw any letter except the letter "J." The first part consisted of 50 trials and the second 150
trials. The proportion of no-go trials was 0.3. In both parts, the stimulus duration was 700 mil-
liseconds and the ISI was 500 milliseconds. The dependent variable was the Matthews correla-
tion coefficient.
Local-global task. Adolescents’ ability to shift between task instructions was assessed with
a local-global task consisting of three conditions. In the first, participants saw a sequence of
blue Navon figures ("global" figures, for example squares, whose lines are composed of smaller,
"local" figures, for example triangles). They were asked to indicate the number of sides of the
global figure. In the second condition, participants saw red Navon figures and were asked to
indicate the number of sides of the local figure. In the third condition, the shifting condition,
participants saw both blue and red Navon figures and were asked to indicate the number of
sides of the global or local figure, according to the rules learned in the two previous conditions
(blue = number of sides of the global figure, red = number of sides of the local figure). The
number of trials per condition was 31, 31, and 105, respectively, and the dependent variable
was the proportion of correct responses in the shifting condition.
The contributions of executive functions to mathematical learning difficulties and mathematical talent
PLOS ONE | https://doi.org/10.1371/journal.pone.0209267 December 13, 2018 7 / 21
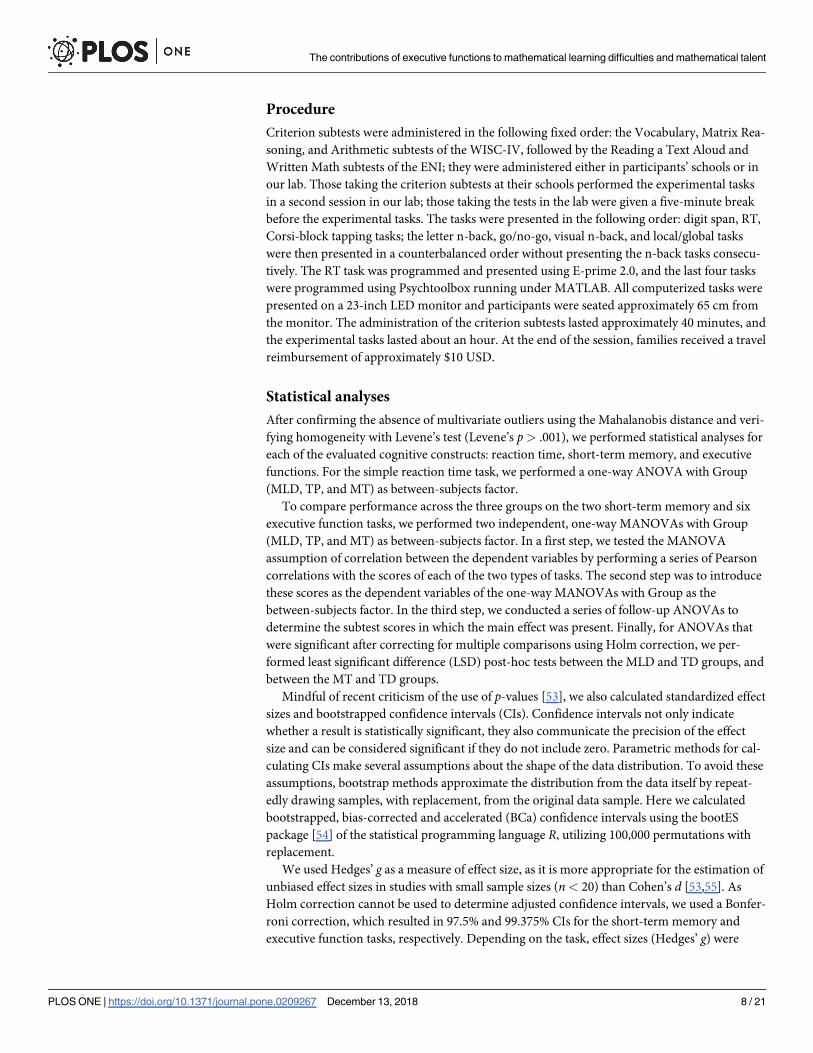
Procedure
Criterion subtests were administered in the following fixed order: the Vocabulary, Matrix Rea-
soning, and Arithmetic subtests of the WISC-IV, followed by the Reading a Text Aloud and
Written Math subtests of the ENI; they were administered either in participants’ schools or in
our lab. Those taking the criterion subtests at their schools performed the experimental tasks
in a second session in our lab; those taking the tests in the lab were given a five-minute break
before the experimental tasks. The tasks were presented in the following order: digit span, RT,
Corsi-block tapping tasks; the letter n-back, go/no-go, visual n-back, and local/global tasks
were then presented in a counterbalanced order without presenting the n-back tasks consecu-
tively. The RT task was programmed and presented using E-prime 2.0, and the last four tasks
were programmed using Psychtoolbox running under MATLAB. All computerized tasks were
presented on a 23-inch LED monitor and participants were seated approximately 65 cm from
the monitor. The administration of the criterion subtests lasted approximately 40 minutes, and
the experimental tasks lasted about an hour. At the end of the session, families received a travel
reimbursement of approximately $10 USD.
Statistical analyses
After confirming the absence of multivariate outliers using the Mahalanobis distance and veri-
fying homogeneity with Levene’s test (Levene’s p> .001), we performed statistical analyses for
each of the evaluated cognitive constructs: reaction time, short-term memory, and executive
functions. For the simple reaction time task, we performed a one-way ANOVA with Group
(MLD, TP, and MT) as between-subjects factor.
To compare performance across the three groups on the two short-term memory and six
executive function tasks, we performed two independent, one-way MANOVAs with Group
(MLD, TP, and MT) as between-subjects factor. In a first step, we tested the MANOVA
assumption of correlation between the dependent variables by performing a series of Pearson
correlations with the scores of each of the two types of tasks. The second step was to introduce
these scores as the dependent variables of the one-way MANOVAs with Group as the
between-subjects factor. In the third step, we conducted a series of follow-up ANOVAs to
determine the subtest scores in which the main effect was present. Finally, for ANOVAs that
were significant after correcting for multiple comparisons using Holm correction, we per-
formed least significant difference (LSD) post-hoc tests between the MLD and TD groups, and
between the MT and TD groups.
Mindful of recent criticism of the use of p-values [53], we also calculated standardized effect
sizes and bootstrapped confidence intervals (CIs). Confidence intervals not only indicate
whether a result is statistically significant, they also communicate the precision of the effect
size and can be considered significant if they do not include zero. Parametric methods for cal-
culating CIs make several assumptions about the shape of the data distribution. To avoid these
assumptions, bootstrap methods approximate the distribution from the data itself by repeat-
edly drawing samples, with replacement, from the original data sample. Here we calculated
bootstrapped, bias-corrected and accelerated (BCa) confidence intervals using the bootES
package [54] of the statistical programming language R, utilizing 100,000 permutations with
replacement.
We used Hedges’ g as a measure of effect size, as it is more appropriate for the estimation of
unbiased effect sizes in studies with small sample sizes (n< 20) than Cohen’s d [53,55]. As
Holm correction cannot be used to determine adjusted confidence intervals, we used a Bonfer-
roni correction, which resulted in 97.5% and 99.375% CIs for the short-term memory and
executive function tasks, respectively. Depending on the task, effect sizes (Hedges’ g) were
The contributions of executive functions to mathematical learning difficulties and mathematical talent
PLOS ONE | https://doi.org/10.1371/journal.pone.0209267 December 13, 2018 8 / 21
interpreted as being significant if the 97.5% or the 99.375% bootstrap CIs excluded zero. Using
similar guidelines as those for Cohen’s d [56], Hedges’ g values of 0.2, 0.5, and 0.8 can be con-
sidered small, medium, and large effects, respectively.
A post hoc sensitivity power analysis showed that our sample had sufficient power (β = .80)
at a significance level of α = .05 to detect medium to large effect sizes (f� .463) in a one-way
ANOVA, and to detect large effect sizes (Cohen’s d� 1.02) in an independent sample t-test.
Power analysis was done with G-Power [57]; all statistical analyses were performed using R [58].
Results
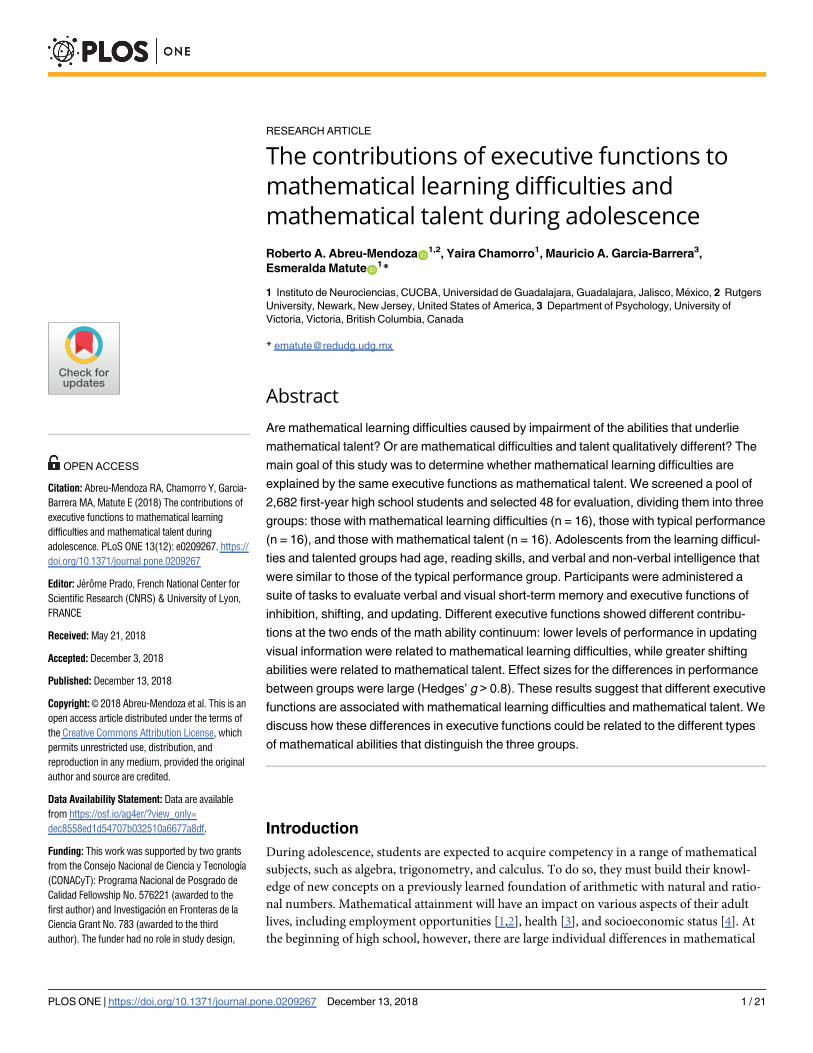
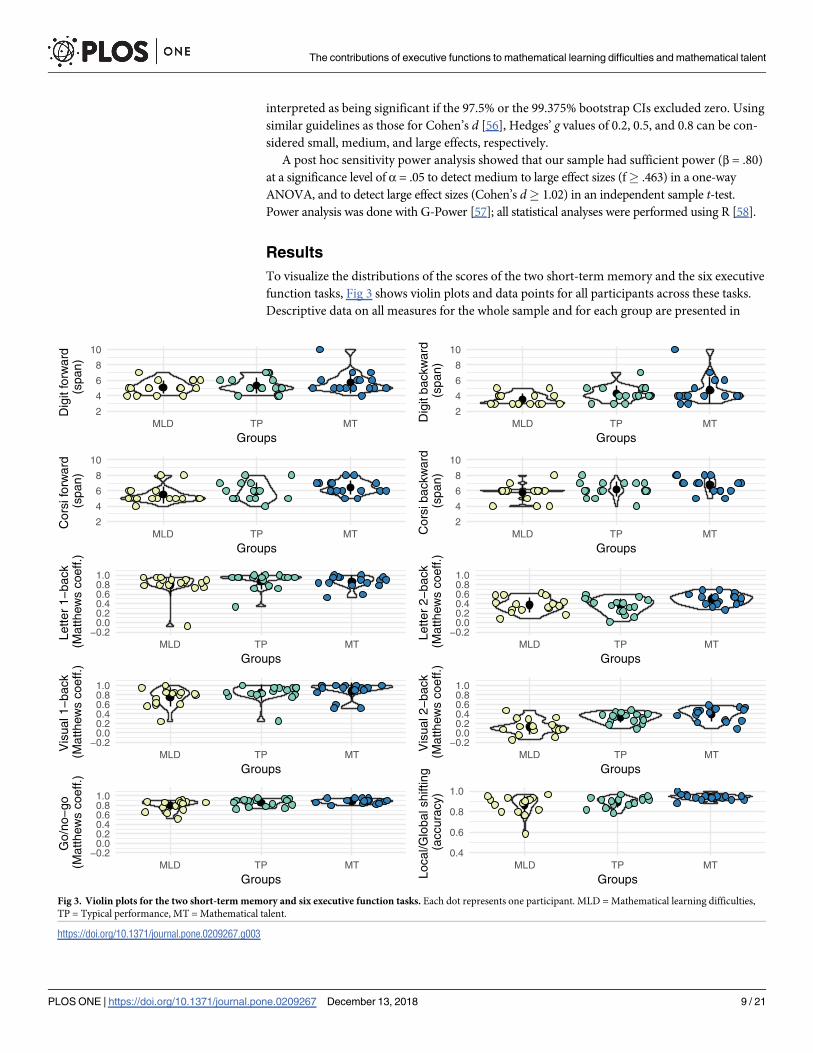
To visualize the distributions of the scores of the two short-term memory and the six executive
function tasks, Fig 3 shows violin plots and data points for all participants across these tasks.
Descriptive data on all measures for the whole sample and for each group are presented in
2
4
6
8
10
MLD TP MT
Groups
Dig
it fo
rwar
d (
span
)
2
4
6
8
10
MLD TP MT
Groups
Cor
si fo
rwar
d (s
pan)
−0.20.00.20.40.60.81.0
MLD TP MT
Groups
Lette
r 1−
back
(M
atth
ews
coef
f.)
−0.20.00.20.40.60.81.0
MLD TP MT
Groups
Vis
ual 1
−ba
ck
(Mat
thew
s co
eff.)
−0.20.00.20.40.60.81.0
MLD TP MT
Groups
Go/
no−
go
(Mat
thew
s co
eff.)
2
4
6
8
10
MLD TP MT
GroupsD
igit
back
war
d (s
pan)
2
4
6
8
10
MLD TP MT
Groups
Cor
si b
ackw
ard
(spa
n)
−0.20.00.20.40.60.81.0
MLD TP MT
Groups
Lette
r 2−
back
(M
atth
ews
coef
f.)
−0.20.00.20.40.60.81.0
MLD TP MT
Groups
Vis
ual 2
−ba
ck
(Mat
thew
s co
eff.)
0.4
0.6
0.8
1.0
MLD TP MT
GroupsLoca
l/Glo
bal s
hifti
ng
(acc
urac
y)
Fig 3. Violin plots for the two short-term memory and six executive function tasks. Each dot represents one participant. MLD = Mathematical learning difficulties,
TP = Typical performance, MT = Mathematical talent.
https://doi.org/10.1371/journal.pone.0209267.g003
The contributions of executive functions to mathematical learning difficulties and mathematical talent
PLOS ONE | https://doi.org/10.1371/journal.pone.0209267 December 13, 2018 9 / 21
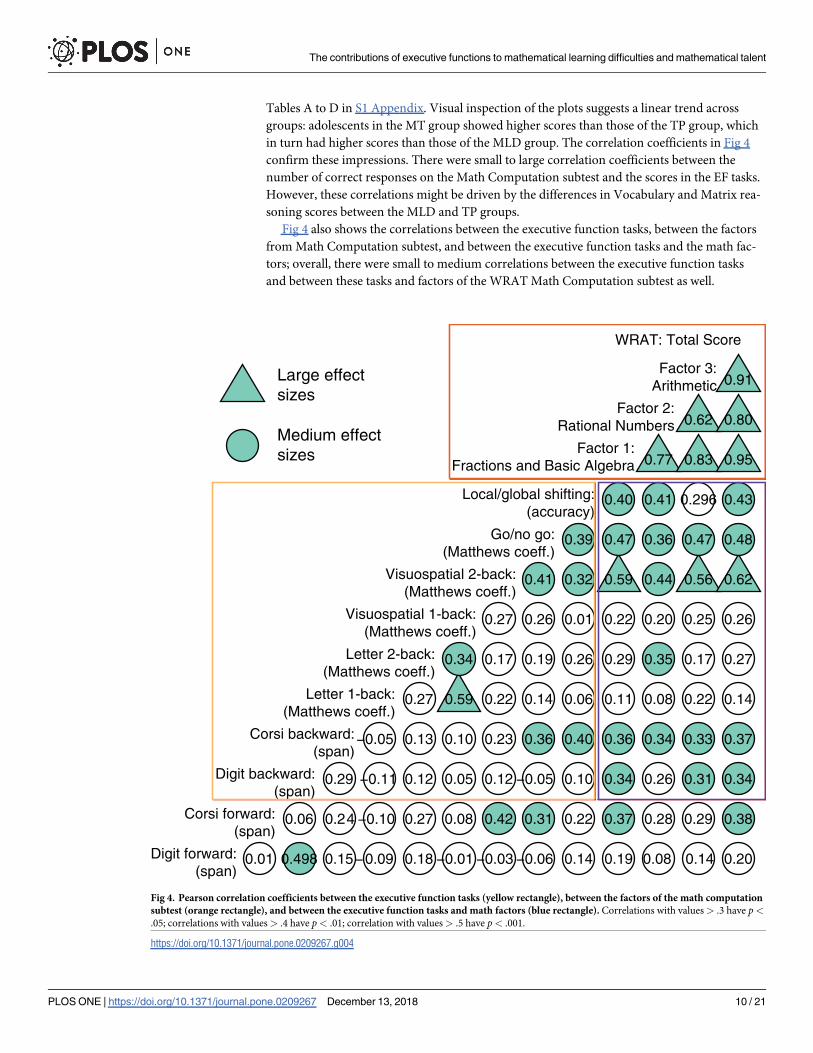
Tables A to D in S1 Appendix. Visual inspection of the plots suggests a linear trend across
groups: adolescents in the MT group showed higher scores than those of the TP group, which
in turn had higher scores than those of the MLD group. The correlation coefficients in Fig 4
confirm these impressions. There were small to large correlation coefficients between the
number of correct responses on the Math Computation subtest and the scores in the EF tasks.
However, these correlations might be driven by the differences in Vocabulary and Matrix rea-
soning scores between the MLD and TP groups.
Fig 4 also shows the correlations between the executive function tasks, between the factors
from Math Computation subtest, and between the executive function tasks and the math fac-
tors; overall, there were small to medium correlations between the executive function tasks
and between these tasks and factors of the WRAT Math Computation subtest as well.
0.01 0.498 0.15−0.09 0.18 −0.01 −0.03 −0.06 0.14 0.19 0.08 0.14 0.20
0.06 0.24 −0.10 0.27 0.08 0.42 0.31 0.22 0.37 0.28 0.29 0.38
0.29 −0.11 0.12 0.05 0.12 −0.05 0.10 0.34 0.26 0.31 0.34
−0.05 0.13 0.10 0.23 0.36 0.40 0.36 0.34 0.33 0.37
0.27 0.59 0.22 0.14 0.06 0.11 0.08 0.22 0.14
0.34 0.17 0.19 0.26 0.29 0.35 0.17 0.27
0.27 0.26 0.01 0.22 0.20 0.25 0.26
0.41 0.32 0.59 0.44 0.56 0.62
0.39 0.47 0.36 0.47 0.48
0.40 0.41 0.296 0.43
0.77 0.83 0.95
0.62 0.80
0.91
Digit forward:(span)
Corsi forward:(span)
Digit backward:(span)
Corsi backward:(span)
Letter 1-back:(Matthews coeff.)
Letter 2-back:(Matthews coeff.)
Visuospatial 1-back:(Matthews coeff.)
Visuospatial 2-back:(Matthews coeff.)
Go/no go:(Matthews coeff.)
Local/global shifting:(accuracy)
Factor 1:Fractions and Basic Algebra
Factor 2:Rational Numbers
Factor 3:Arithmetic
WRAT: Total Score
Large effectsizes
Medium effectsizes
Fig 4. Pearson correlation coefficients between the executive function tasks (yellow rectangle), between the factors of the math computation
subtest (orange rectangle), and between the executive function tasks and math factors (blue rectangle). Correlations with values> .3 have p<.05; correlations with values> .4 have p< .01; correlation with values> .5 have p< .001.
https://doi.org/10.1371/journal.pone.0209267.g004
The contributions of executive functions to mathematical learning difficulties and mathematical talent
PLOS ONE | https://doi.org/10.1371/journal.pone.0209267 December 13, 2018 10 / 21
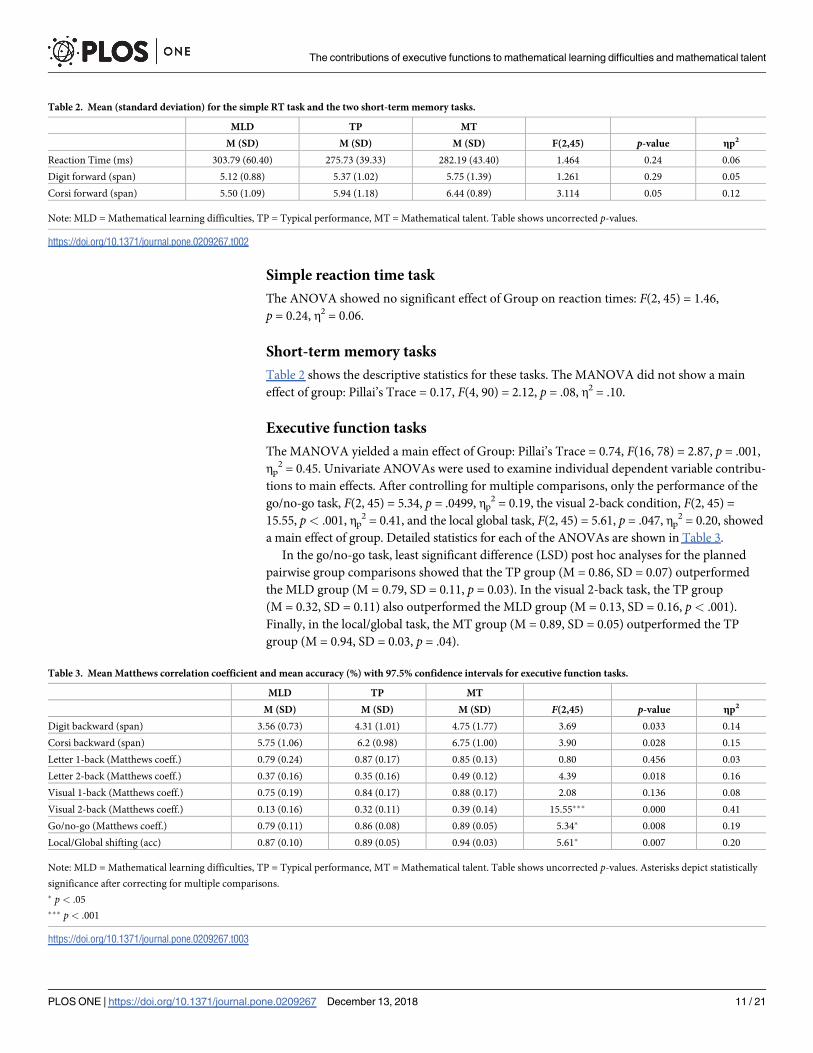
Simple reaction time task
The ANOVA showed no significant effect of Group on reaction times: F(2, 45) = 1.46,
p = 0.24, η2 = 0.06.
Short-term memory tasks
Table 2 shows the descriptive statistics for these tasks. The MANOVA did not show a main
effect of group: Pillai’s Trace = 0.17, F(4, 90) = 2.12, p = .08, η2 = .10.
Executive function tasks
The MANOVA yielded a main effect of Group: Pillai’s Trace = 0.74, F(16, 78) = 2.87, p = .001,
ηp2 = 0.45. Univariate ANOVAs were used to examine individual dependent variable contribu-
tions to main effects. After controlling for multiple comparisons, only the performance of the
go/no-go task, F(2, 45) = 5.34, p = .0499, ηp2 = 0.19, the visual 2-back condition, F(2, 45) =
15.55, p< .001, ηp2 = 0.41, and the local global task, F(2, 45) = 5.61, p = .047, ηp
2 = 0.20, showed
a main effect of group. Detailed statistics for each of the ANOVAs are shown in Table 3.
In the go/no-go task, least significant difference (LSD) post hoc analyses for the planned
pairwise group comparisons showed that the TP group (M = 0.86, SD = 0.07) outperformed
the MLD group (M = 0.79, SD = 0.11, p = 0.03). In the visual 2-back task, the TP group
(M = 0.32, SD = 0.11) also outperformed the MLD group (M = 0.13, SD = 0.16, p< .001).
Finally, in the local/global task, the MT group (M = 0.89, SD = 0.05) outperformed the TP
group (M = 0.94, SD = 0.03, p = .04).
Table 2. Mean (standard deviation) for the simple RT task and the two short-term memory tasks.
MLD TP MT
M (SD) M (SD) M (SD) F(2,45) p-value ηp2
Reaction Time (ms) 303.79 (60.40) 275.73 (39.33) 282.19 (43.40) 1.464 0.24 0.06
Digit forward (span) 5.12 (0.88) 5.37 (1.02) 5.75 (1.39) 1.261 0.29 0.05
Corsi forward (span) 5.50 (1.09) 5.94 (1.18) 6.44 (0.89) 3.114 0.05 0.12
Note: MLD = Mathematical learning difficulties, TP = Typical performance, MT = Mathematical talent. Table shows uncorrected p-values.
https://doi.org/10.1371/journal.pone.0209267.t002
Table 3. Mean Matthews correlation coefficient and mean accuracy (%) with 97.5% confidence intervals for executive function tasks.
MLD TP MT
M (SD) M (SD) M (SD) F(2,45) p-value ηp2
Digit backward (span) 3.56 (0.73) 4.31 (1.01) 4.75 (1.77) 3.69 0.033 0.14
Corsi backward (span) 5.75 (1.06) 6.2 (0.98) 6.75 (1.00) 3.90 0.028 0.15
Letter 1-back (Matthews coeff.) 0.79 (0.24) 0.87 (0.17) 0.85 (0.13) 0.80 0.456 0.03
Letter 2-back (Matthews coeff.) 0.37 (0.16) 0.35 (0.16) 0.49 (0.12) 4.39 0.018 0.16
Visual 1-back (Matthews coeff.) 0.75 (0.19) 0.84 (0.17) 0.88 (0.17) 2.08 0.136 0.08
Visual 2-back (Matthews coeff.) 0.13 (0.16) 0.32 (0.11) 0.39 (0.14) 15.55��� 0.000 0.41
Go/no-go (Matthews coeff.) 0.79 (0.11) 0.86 (0.08) 0.89 (0.05) 5.34� 0.008 0.19
Local/Global shifting (acc) 0.87 (0.10) 0.89 (0.05) 0.94 (0.03) 5.61� 0.007 0.20
Note: MLD = Mathematical learning difficulties, TP = Typical performance, MT = Mathematical talent. Table shows uncorrected p-values. Asterisks depict statistically
significance after correcting for multiple comparisons.
� p < .05
��� p< .001
https://doi.org/10.1371/journal.pone.0209267.t003
The contributions of executive functions to mathematical learning difficulties and mathematical talent
PLOS ONE | https://doi.org/10.1371/journal.pone.0209267 December 13, 2018 11 / 21
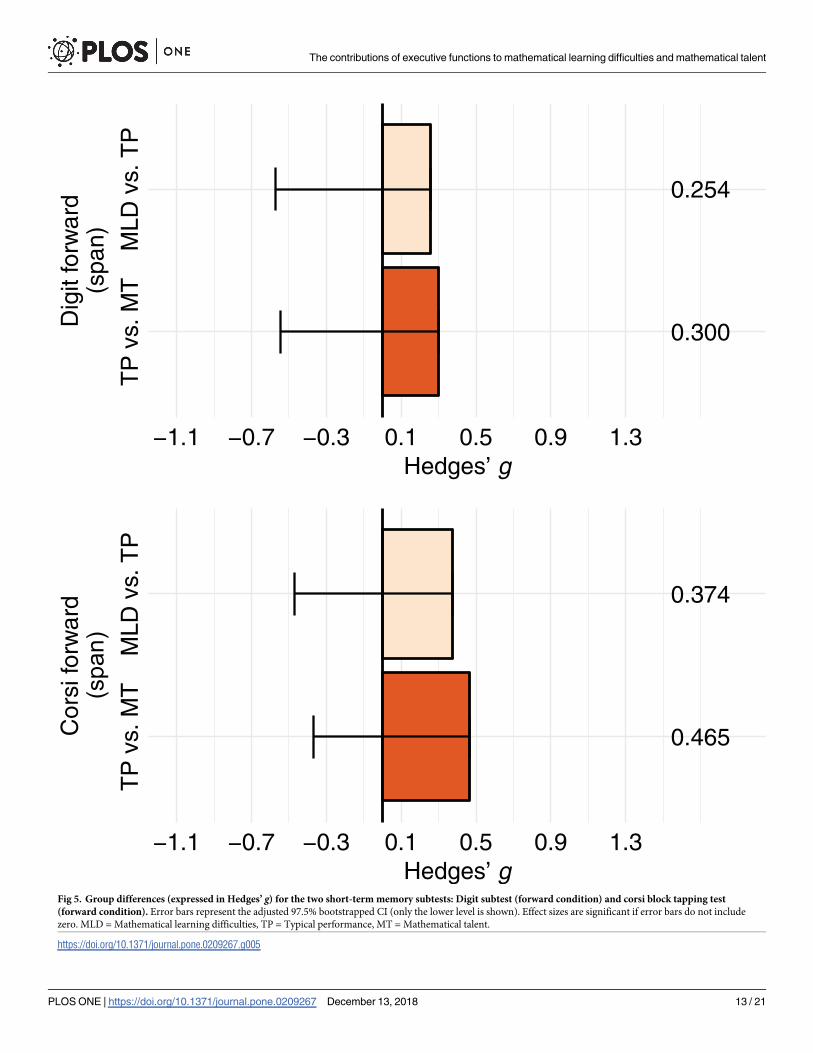
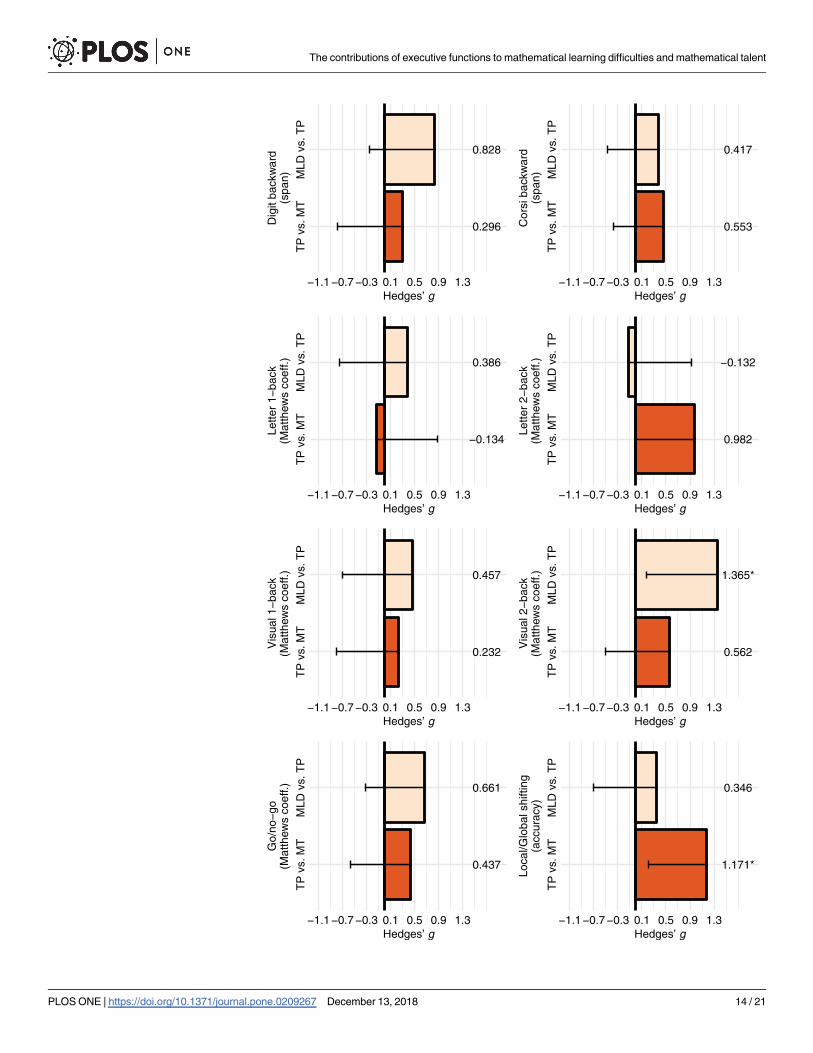
Effect sizes and bootstrapped confidence intervals
Figs 5 and 6 summarize the effect sizes (Hedges’ g) and their bootstrapped confidence intervals
of the group differences (TP minus MLD and MT minus TP) in each of the short-term mem-
ory and executive function tasks. Consistent with the parametric tests, confidence intervals did
not include zero for the effect sizes for the differences between the TP and MT groups in the
local/global task or the differences between the MLD and TP groups in the visual 2-back task.
According to Cohen’s criteria [56], these effect sizes can be considered large. These effect sizes
remained significant when outliers (> 2 SD from the groups’ mean) were removed from the
analyses: visual 2-back task, MLD (n = 15) vs. TP (n = 15) Hedges’ g = 1.22 [0.16, 2.18]; local/
global task, TP (n = 15) vs. MT (n = 15) Hedges’ g = 1.17 [0.23, 2.05]. Furthermore, regression
line analyses, using the Math Computation scores as a continuous variable, showed a similar
pattern: the slope for the visual 2-back task scores was significant only for the Math Computa-
tion scores within the range of the MLD and TP groups (see Fig A, upper panel, in S1 Appen-
dix), while the slope for the local/global task scores was significant only for the Math
Computation scores within the range of the TP and MT groups (see Fig A, lower panel, in S1
Appendix).
It is noteworthy that even though the p-value for the differences between the TP and MT
groups in the local global task was relatively large (p = .04), the effect size for this difference
can be considered large (Hedges’ g = 1.17). As p-values are more vulnerable to sample size
than effect sizes, we believe the group differences are best interpreted based on the latter, as
well as on confidence intervals. Finally, even though the effect size for the outperformance of
the TP group relative to the MLD group in the go/no-go task was medium (Hedges’ g = 0.661
[-0.32, 1.54]), its confidence interval included zero, suggesting that this result has low
precision.
Discussion
This study aimed to ascertain whether the same executive functions contribute to individual
differences in math ability, ranging from impairment (MLD group) to talent (MT group).
Researchers have suggested that individuals with learning disabilities can be seen either as
qualitatively different (having a specific impairment in a cognitive ability) or as quantitatively
different (the ability associated with normal variation is associated with a learning difficulty).
Contrary to our predictions, our results suggest that different executive functions contribute to
mathematical learning difficulties and mathematical talent. Our group of adolescents with
MLD had a lower level of updating visuospatial abilities than the control (TP) group. In con-
trast, those with mathematical talent were distinguished from the typical performance group
for their greater ability to shift between instructions. Consistent with some theoretical propos-
als that distinguish the contribution of executive functions to behavioral performance from
that of intelligence and processing speed, e.g., [59], these differences are not the result of varia-
tions in other cognitive abilities—verbal and non-verbal intelligence, reading speed, or pro-
cessing speed. There were no differences across groups in these domains, and their effect sizes
were smaller than those reported for the differences between groups in the executive function
tasks.
Another important finding of our study is that adolescents’ differences in mathematical
performance are not reflected in all types of mathematical abilities. Those in the MLD group
were mostly distinguished from their peers by difficulty in performing arithmetic problems
with whole numbers and decimals (Factor 3: Arithmetic), while those in the MT group stood
out for their ability to solve arithmetic problems with fractions (Factor 2: Rational Numbers).
Surprisingly, there were no differences between the MLD and typical performance groups in
The contributions of executive functions to mathematical learning difficulties and mathematical talent
PLOS ONE | https://doi.org/10.1371/journal.pone.0209267 December 13, 2018 12 / 21
0.254
0.300
TP
vs.
MT
MLD
vs.
TP
−1.1 −0.7 −0.3 0.1 0.5 0.9 1.3Hedges’ g
Dig
it fo
rwar
d(s
pan)
0.374
0.465
TP
vs.
MT
MLD
vs.
TP
−1.1 −0.7 −0.3 0.1 0.5 0.9 1.3Hedges’ g
Cor
si fo
rwar
d(span)
Fig 5. Group differences (expressed in Hedges’ g) for the two short-term memory subtests: Digit subtest (forward condition) and corsi block tapping test
(forward condition). Error bars represent the adjusted 97.5% bootstrapped CI (only the lower level is shown). Effect sizes are significant if error bars do not include
zero. MLD = Mathematical learning difficulties, TP = Typical performance, MT = Mathematical talent.
https://doi.org/10.1371/journal.pone.0209267.g005
The contributions of executive functions to mathematical learning difficulties and mathematical talent
PLOS ONE | https://doi.org/10.1371/journal.pone.0209267 December 13, 2018 13 / 21
0.828
0.296
TP
vs.
MT
MLD
vs.
TP
−1.1 −0.7 −0.3 0.1 0.5 0.9 1.3Hedges’ g
Dig
it ba
ckw
ard
(spa
n)
−0.134
0.386
TP
vs.
MT
MLD
vs.
TP
−1.1 −0.7 −0.3 0.1 0.5 0.9 1.3Hedges’ g
Lette
r 1−
back
(Mat
thew
s co
eff.)
0.232
0.457
TP
vs.
MT
MLD
vs.
TP
−1.1 −0.7 −0.3 0.1 0.5 0.9 1.3Hedges’ g
Vis
ual 1
−ba
ck(M
atth
ews
coef
f.)
0.661
0.437
TP
vs.
MT
MLD
vs.
TP
−1.1 −0.7 −0.3 0.1 0.5 0.9 1.3Hedges’ g
Go/
no−
go(M
atth
ews
coef
f.)
0.417
0.553
TP
vs.
MT
MLD
vs.
TP
−1.1 −0.7 −0.3 0.1 0.5 0.9 1.3Hedges’ g
Cor
si b
ackw
ard
(spa
n)
0.982
−0.132
TP
vs.
MT
MLD
vs.
TP
−1.1 −0.7 −0.3 0.1 0.5 0.9 1.3Hedges’ g
Lette
r 2−
back
(Mat
thew
s co
eff.)
0.562
1.365*
TP
vs.
MT
MLD
vs.
TP
−1.1 −0.7 −0.3 0.1 0.5 0.9 1.3Hedges’ g
Vis
ual 2
−ba
ck(M
atth
ews
coef
f.)
0.346
1.171*
TP
vs.
MT
MLD
vs.
TP
−1.1 −0.7 −0.3 0.1 0.5 0.9 1.3Hedges’ g
Loca
l/Glo
bal s
hifti
ng(a
ccur
acy)
The contributions of executive functions to mathematical learning difficulties and mathematical talent
PLOS ONE | https://doi.org/10.1371/journal.pone.0209267 December 13, 2018 14 / 21
this last factor, suggesting that adolescents at this academic stage may be misclassified if evalu-
ated only on the basis of their ability to perform arithmetic with fractions.
Studies have shown that the strength of the relationship between executive function tasks
varies across development. While there is a strong association between its different compo-
nents in early developmental stages, these functions are more differentiated during adoles-
cence, and their correlation coefficients are not as high as in childhood [18]. Similarly, the
correlation coefficients observed in our data show only small to moderate associations between
the different measures (r = 0.32–0.40), suggesting that working memory, inhibition, and
switching are well differentiated at the ages of 16 and 17, and that it is feasible to assess the con-
tribution of each domain in mathematical achievement.
Consistent with previous studies [31,60], our results suggest that there is an interplay
between different cognitive skills and executive functions and the level achieved in solving
specific types of mathematical problems. Research has shown that working memory and
inhibition, but not switching, are associated with individual differences in solving problems
with whole numbers [26]. Working memory, especially visuospatial memory, may play a cru-
cial role in maintaining information when performing multi-digit arithmetic problems: in
such problems, not only the intrinsic value of the digit, but also its position convey informa-
tion of its magnitude. Other authors have also suggested that maintaining information is a
crucial step in forming long-term representations of arithmetical facts [37]. Therefore, the
impaired visuospatial working memory that characterized our MLD group, an impairment
that has been noted in several studies, see [32] for a review, may explain why the largest differ-
ence relative to their typically performing peers was in their ability to perform multi-digit
arithmetic.
The links between the superior performance of the MT group on the local/global task and
their greater ability to solve problems involving fractions with unlike denominators are less
clear. How is the ability to alternate between different instructions or mindsets related to a
greater ability to manipulate fractions? One possible link is the representational flexibility of
fractions. Rational numbers can be represented in infinite ways, some more convenient than
others, while performing a specific operation. Consider the sum of the fractions 5/15 + 4/12.
For students who have learned that the first step in solving these problems is to obtain a com-
mon denominator, typically the product of the two denominators, this problem may seem
overwhelming. However, students with more flexible strategies may realize that this operation
is just another form of the simple sum of 1/3 + 1/3. Indirect evidence for this explanation
comes from a recent study [61] showing that college students with high mathematical profi-
ciency used a large variety of strategies to compare the magnitude of two fractions. Most
importantly, asked to choose the best strategy from among three possibilities, students with
high mathematical proficiency changed their original incorrect response to the correct one
more often than those with less mathematical knowledge.
Another link between shifting and fractional arithmetic may be related to the partial overlap
between the procedures for solving problems involving whole numbers and fractions. As
whole number procedures allow solutions only in specific cases (e.g., addition and subtraction
of fractions with like denominators), students have to learn when to switch from these proce-
dures to those that apply to fraction arithmetic. Applying whole number procedures is a fre-
quent error in fraction arithmetic [62]. This requirement to switch strategies may explain why
Fig 6. Group differences (expressed in Hedges’ g) for the six executive functions tasks. Error bars represent the
adjusted the 99.375% bootstrapped CI (only the lower level is shown). Effect sizes are significant if error bars do not
include zero. MLD = Mathematical learning difficulties, TP = Typical performance, MT = Mathematical talent. � p<.05.
https://doi.org/10.1371/journal.pone.0209267.g006
The contributions of executive functions to mathematical learning difficulties and mathematical talent
PLOS ONE | https://doi.org/10.1371/journal.pone.0209267 December 13, 2018 15 / 21
adolescents with greater mathematical abilities also had greater shifting abilities than those
with typical performance.
All of these links between executive functions and mathematical abilities refer to the online
contribution of these functions in solving mathematical problems. However, executive func-
tions could be contributing to mathematical learning in more extensive ways, by supporting
the conceptual changes that occur in children’s and adolescents’ mathematical knowledge.
Mathematical knowledge is learned not only by enriching prior knowledge, but also through
qualitative changes [63,64]; that is, individuals not only become more proficient in certain abil-
ities, but also need to develop new concepts. One of these changes relates to one of the most
fundamental concepts in mathematics: the concept of number. According to some authors,
the concept of natural number builds on the core systems for number [65,66], while that for
rational numbers builds on some of the intuitions that children have about natural numbers
[67]. Importantly, the early concepts continue to exist throughout development and are faster
and easier to activate than recently acquired, unstable concepts [68]. To successfully go
through these changes, individuals will thus have to inhibit previous concepts and be able to
switch to the newer set of rules.
Only a small number of studies have looked at the relationship between executive functions
and conceptual change in other domains, especially during childhood. For instance, measures
of inhibition have been shown to predict false-belief understanding, a component of theory of
mind [69], and a composite of executive functions tasks have been associated with children’s
understanding of vitalist biology (understanding of life, death, and body functions) [70]. Using
assessments that tap into conceptual understandings [71,72], future studies could explore
more comprehensively the role of executive functions in mathematical knowledge, not only in
childhood but in adolescence as well.
These conclusions should be considered in light of the limitations of this study, one of
which is its low statistical power to detect medium and small effect sizes. According to the
power analysis, our statistical power to detect medium effect sizes (Cohen’s d = 0.5) was 0.19,
while the power to detect small effect sizes (Cohen’s d = 0.2) was 0.05. As highlighted by Szucs
and Ioannidis [73], underpowered studies not only lead to false negatives (i.e., failing to detect
an existing effect), but also to exaggeration of measured effect sizes. For these reasons, it is
important to keep confidence intervals in mind when looking at “significant” results, as they
provide less biased information than p-values [53]. Among the multiple concerns with assess-
ing executive functions is the so-called task impurity problem: it is difficult to isolate an index
of a single component, given that tasks also trigger additional executive and non-executive
processes [74]. To minimize this problem, researchers have used a latent variable approach,
extracting the common variance among tasks that measure the same function. This approach
also prevents the specific requirements of the tasks from driving the association with the pre-
dicted variable. However, the disadvantage of this approach is that it requires large samples
(n> 100).
In our study, it is uncertain whether the association between executive function tasks and
mathematical scores is due to their underlying executive components or to the complexity or
specificity of their demands. We addressed this problem in part by measuring the different
components (span and updating) and modalities (verbal and visuospatial) of working mem-
ory, but could not do so for inhibition and shifting. In order to address the task impurity prob-
lem in these latter executive components, we isolated a specific executive function using
simple tasks, such as the go/no-go task, but some individuals in each of the three groups
reached a performance ceiling. This limitation, along with the inability to detect medium effect
sizes, could have contributed to the lack of differences between groups in our inhibition mea-
sure (go/no-go task). Previous studies have shown that inhibition scores using larger sample
The contributions of executive functions to mathematical learning difficulties and mathematical talent
PLOS ONE | https://doi.org/10.1371/journal.pone.0209267 December 13, 2018 16 / 21
sizes (N = 127) [39] or more complex measures (e.g., Stroop task) [33] can distinguish individ-
uals with typical performance from those at either end of the math ability continuum. How-
ever, complex measures have higher levels of task impurity, making it difficult to isolate EF
components. The Stroop task, for example, has loaded on factors involving set-shifting [75].
Conclusions
This study aimed to investigate whether the same executive functions contribute to the contin-
uum of mathematical abilities in adolescence or whether they make specific contributions to
mathematical learning difficulties and mathematical talent. Against our expectations, there
were executive functions that had a larger contribution at one end of the continuum than the
other. There were differences in the updating component of visual working memory between
the group of adolescents with MLD and those with typical performance, but not between those
with typical performance and mathematical talent. However, the ability to shift between
instructions contributes to the distinction between those adolescents with mathematical talent
and those with typical performance. Our results also suggest that there is an interplay between
these ability levels, shown in the different components of executive function and specific types
of mathematical problems.
Supporting information
S1 Appendix. This appendix contains Tables A-D and Fig A.
(DOCX)
Acknowledgments
The authors wish to thank Diana Avalos and Daniel Romero for their help in evaluation and
data collection, and Hillary Contreras for their assistance in database collection. We also thank
all participants and their families, and the high schools, principals, and teachers who assisted
with this project.
Author Contributions
Conceptualization: Roberto A. Abreu-Mendoza, Yaira Chamorro, Esmeralda Matute.
Data curation: Roberto A. Abreu-Mendoza, Yaira Chamorro.
Formal analysis: Roberto A. Abreu-Mendoza, Mauricio A. Garcia-Barrera.
Funding acquisition: Roberto A. Abreu-Mendoza, Yaira Chamorro, Esmeralda Matute.
Investigation: Roberto A. Abreu-Mendoza, Yaira Chamorro, Esmeralda Matute.
Methodology: Roberto A. Abreu-Mendoza, Mauricio A. Garcia-Barrera, Esmeralda Matute.
Project administration: Roberto A. Abreu-Mendoza, Yaira Chamorro, Esmeralda Matute.
Resources: Yaira Chamorro, Mauricio A. Garcia-Barrera, Esmeralda Matute.
Supervision: Esmeralda Matute.
Writing – original draft: Roberto A. Abreu-Mendoza, Yaira Chamorro, Esmeralda Matute.
Writing – review & editing: Roberto A. Abreu-Mendoza, Yaira Chamorro, Mauricio A. Gar-
cia-Barrera, Esmeralda Matute.
The contributions of executive functions to mathematical learning difficulties and mathematical talent
PLOS ONE | https://doi.org/10.1371/journal.pone.0209267 December 13, 2018 17 / 21
References1. Parsons S, Bynner J. Numeracy and employment. Educ + Train. 1997; 54:419–34.
2. Parsons S, Bynner J. Does numeracy matter more? London: National Research and Development
Centre for Adult Literacy and Numeracy; 2005.
3. Reyna VF, Nelson WL, Han PK, Dieckmann NF. How Numeracy Influences Risk Comprehension and
Medical Decision Making. Psychol Bull. 2009; 135(6):943–73. https://doi.org/10.1037/a0017327 PMID:
19883143
4. Ritchie SJ, Bates TC. Enduring Links From Childhood Mathematics and Reading Achievement to Adult
Socioeconomic Status. Psychol Sci. 2013; 24(7):1301–8. https://doi.org/10.1177/0956797612466268
PMID: 23640065
5. Jurado MB, Rosselli M. The elusive nature of executive functions: A review of our current understanding.
Neuropsychol Rev. 2007; 17(3):213–33. https://doi.org/10.1007/s11065-007-9040-z PMID: 17786559
6. Best J, Miller PH, Naglieri JA. Relations between executive function and academic achievement from
ages 5 to 17 in a large, representative national sample. Learn Individ Differ. 2011; 21:327–36. https://
doi.org/10.1016/j.lindif.2011.01.007 PMID: 21845021
7. Clark CAC, Sheffield TD, Wiebe SA, Espy KA. Longitudinal Associations Between Executive Control
and Developing Mathematical Competence in Preschool Boys and Girls. Child Dev. 2013; 84(2):662–
77. https://doi.org/10.1111/j.1467-8624.2012.01854.x PMID: 23006040
8. Mou Y, Berteletti I, Hyde D. What counts in preschool number knowledge? A Bayes factor analytic
approach toward theoretical model development. J Exp Child Psychol. 2018; 166:116–33. https://doi.
org/10.1016/j.jecp.2017.07.016 PMID: 28888192
9. Secretarıa de Educacion Publica. Programas de estudio 2011. Guıa para el maestro. Educacion Basica
Primaria. Mexico: Secretarıa de Educacion Publica; 2011.
10. Abreu-Mendoza RA, Chamorro Y, Matute E. Psychometric Properties of the WRAT Math Computation
Subtest in Mexican Adolescents. J Psychoeduc Assess. 2018;
11. INEE. Panorama Educativo de Mexico 2014. Indicadores del Sistema Educativo Nacional. Educacion
Basica y Media Superior. Mexico: INEE; 2015.
12. Wilkinson GS, Robertson GJ. WRAT 4 Wide Range Achievement Test. Lutz, FL: Psychological
Assessment Resources; 2006.
13. Lortie-Forgues H, Tian J, Siegler RS. Why is learning fraction and decimal arithmetic so difficult? Dev
Rev. 2015; 38:201–21.
14. Miyake A, Friedman NP, Emerson MJ, Witzki AH, Howerter A. The Unity and Diversity of Executive
Functions and Their Contributions to Complex ‘“Frontal Lobe”‘ Tasks: A Latent Variable Analysis. Cogn
Psychol. 2000; 41:49–100. https://doi.org/10.1006/cogp.1999.0734 PMID: 10945922
15. Anderson V, Spencer-Smith M, Coleman L, Anderson P, Williams J, Greenham M, et al. Children’s
executive functions: Are they poorer after very early brain insult. Neuropsychologia. 2010; 4:2041–50.
16. Davidson MC, Amso D, Anderson LC, Diamond A. Development of cognitive control and executive func-
tions from 4 to 13 years: Evidence from manipulations of memory, inhibition, and task switching. Neuropsy-
chologia. 2006; 44:2037–78. https://doi.org/10.1016/j.neuropsychologia.2006.02.006 PMID: 16580701
17. Morris M, Jones DM. Memory updating in working memory:The role of the central executive. J Psychol.
1990; 81:111–21.
18. Lee K, Bull R, Ho RM. Developmental Changes in Executive Functioning. Child Dev. 2013; 84(6):1933–
53. https://doi.org/10.1111/cdev.12096 PMID: 23550969
19. De Luca C, Wood J, Anderson V, Buchanan J, Proffitt TM, Mahony K, et al. Normative Data From the
Cantab. I: Development of Executive Function Over the Lifespan. J Clin Exp Neuropsychol. 2003; 25
(2):242–54. https://doi.org/10.1076/jcen.25.2.242.13639 PMID: 12754681
20. Karr JE, Areshenkoff CN, Rast P., Hofer SM, Iverson GL, Garcia-Barrera MA. The Unity and Diversity
of Executive Functions: A Systematic Review and Re-Analysis of Latent Variable Studies. Psychol Bull.
2018; 144(11):1147–85. https://doi.org/10.1037/bul0000160 PMID: 30080055
21. Miyake A, Friedman NP. The Nature and Organization of Individual Differences in Executive Functions:
Four General Conclusions. Curr Dir Psychol Sci. 2012; 21(1):8–14. https://doi.org/10.1177/
0963721411429458 PMID: 22773897
22. Bull R, Espy KA, Wiebe SA. Short-Term Memory, Working Memory, and Executive Functioning in Pre-
schoolers: Longitudinal Predictors of Mathematical Achievement at Age 7 Years. Dev Neuropsychol.
2008; 33(3):205–28. https://doi.org/10.1080/87565640801982312 PMID: 18473197
23. Bull R, Scerif G. Executive Functioning as a Predictor of Children’s Mathematics Ability: Inhibition,
Switching, and Working Memory. Dev Neuropsychol. 2001; 19(3):273–93. https://doi.org/10.1207/
S15326942DN1903_3 PMID: 11758669
The contributions of executive functions to mathematical learning difficulties and mathematical talent
PLOS ONE | https://doi.org/10.1371/journal.pone.0209267 December 13, 2018 18 / 21
24. van der Sluis S, de Jong P, van der Leij A. Executive functioning in children, and its relations with rea-
soning, reading, and arithmetic. Intelligence. 2007; 35:427–49.
25. Szucs D, Devine A, Soltesz F, Nobes A, Gabriel F. Cognitive components of a mathematical processing
network in 9-year-old children. Dev Sci. 2014; 17(4):506–24. https://doi.org/10.1111/desc.12144 PMID:
25089322
26. Cragg L, Keeble S, Richardson S, Roome HE, Gilmore C. Direct and indirect influences of executive
functions on mathematics achievement. Cognition. 2017; 162:12–26. https://doi.org/10.1016/j.
cognition.2017.01.014 PMID: 28189034
27. Li Y, Geary DC. Children’s visuospatial memory predicts mathematics achievement through early ado-
lescence. PLoS One. 2017; 12(2):e0172046. https://doi.org/10.1371/journal.pone.0172046 PMID:
28192484
28. Coulanges L, Varma S, Rosenberg-Lee M. Contributions of inhibitory control to decimal processing and
mathematics achievement. poster presented at 1st The Mathematical Cognition and Learning Society
Conference. 2018.
29. Szucs D, Goswami U. Developmental dyscalculia: Fresh perspectives. Trends Neurosci Educ. 2013;
2:33–7.
30. Mammarella IC, Caviola S, Giofre D, Szucs D. The underlying structure of visuospatial working memory
in children with mathematical learning disability. Br J Dev Psychol. 2017;
31. Peng P, Namkung J, Barnes M, Congying S. A Meta-Analysis of Mathematics and Working Memory:
Moderating Effects of Working Memory Domain, Type of Mathematics Skill, and Simple Characteristics.
J Educ Psychol. 2016; 108(4):455–73.
32. Szucs D. Subtypes and comorbidity in mathematical learning disabilities: Multidimensional study of ver-
bal and visual memory processes is key to understanding. In: Progress in brain research. Elsevier;
2016. p. 277–304. https://doi.org/10.1016/bs.pbr.2016.04.027 PMID: 27339016
33. Szucs D, Devine A, Soltesz F, Nobes A, Gabriel F. Developmental dyscalculia is related to visuo-spatial
memory and inhibition impairment. Cortex. 2013; 49:2674–88. https://doi.org/10.1016/j.cortex.2013.06.
007 PMID: 23890692
34. Baddeley A. The episodic buffer: A new component of working memory? Trends Cogn Sci. 2000; 4
(11):417–23. PMID: 11058819
35. Ashkenazi S, Rosenberg-lee M, Metcalfe AWS, Swigart AG, Menon V. Visuo–spatial working memory
is an important source of domain-general vulnerability in the development of arithmetic cognition. Neu-
ropsychologia. Elsevier; 2013; 51(11):2305–17. https://doi.org/10.1016/j.neuropsychologia.2013.06.
031 PMID: 23896444
36. Peterson RL, Boada R, Mcgrath LM, Willcutt EG, Olson RK, Pennington BF. Cognitive Prediction of
Reading, Math, and Attention: Shared and Unique Influences. J Learn Disabil. 2017; 50(4):408–421.
https://doi.org/10.1177/0022219415618500 PMID: 26825667
37. Geary DC. Mathematical Disabilities: Cognitive, Neuropsychological, and Genetic Components. Psy-
chol Bull. 1993; 114(2):345–63. PMID: 8416036
38. Pesenti M, Zago L, Crivello F, Mellet E, Samson D, Duroux B, et al. Mental calculation in a prodigy is
sustained by right prefrontal and medial temporal areas. Nat Neurosci. 2001; 4(1):103–7. https://doi.
org/10.1038/82831 PMID: 11135652
39. Swanson L. Cognitive processes that underlie mathematical precociousness in young children. J Exp
Child Psychol. 2006; 93:239–64. https://doi.org/10.1016/j.jecp.2005.09.006 PMID: 16330043
40. Myers T, Carey E, Szűcs D. Cognitive and Neural Correlates of Mathematical Giftedness in Adults and
Children: A Review. Front Psychol. 2017;8(1646). https://doi.org/10.3389/fpsyg.2017.00008
41. Mazzocco MM, Feigenson L, Halberda J. Impaired Acuity of the Approximate Number System Under-
lies Mathematical Learning Disability (Dyscalculia). Child Dev. 2011; 82(4):1224–37. https://doi.org/10.
1111/j.1467-8624.2011.01608.x PMID: 21679173
42. Murphy M, Mazzocco MM, Hanich LB, Early MC. Cognitive Characteristics of Children With Mathemat-
ics Learning Disabilty (MLD) Vary as a Function of the Cutoff Criterion Used to Define MLD. J Learn Dis-
abil. 2007; 40(5):458–78. https://doi.org/10.1177/00222194070400050901 PMID: 17915500
43. Price GR, Holloway I, Rasanen P, Vesterinen M, Ansari D. Impaired parietal magnitude processing in
developmental dyscalculia. Curr Biol. 2007; 17(24):R1042–3. https://doi.org/10.1016/j.cub.2007.10.013
PMID: 18088583
44. Cirino P, Tolar T, Fuchs L, Huston-Warren E. Cognitive and numerosity predictos of mathematical skills
in middle school. J Exp Child Psychol. 2016; 145:95–119. https://doi.org/10.1016/j.jecp.2015.12.010
PMID: 26826940
45. Wechsler D. Escala Wechsler de Inteligencia para Niños-IV. Mexico: Manual Moderno; 2007.
The contributions of executive functions to mathematical learning difficulties and mathematical talent
PLOS ONE | https://doi.org/10.1371/journal.pone.0209267 December 13, 2018 19 / 21
46. Matute E, Rosselli M, Ardila A, Ostrosky F. Evaluacion Neuropsicologica Infantil. Mexico: Manual Mod-
erno; 2007.
47. Barrios O, Matute E, Ramırez-Dueñas ML, Chamorro Y, Trejo S, Bolaños L. Caracterısticas del trastor-
nos por deficit de atencion e hiperactividad en escolares mexicanos de acuerdo con la percepcion de
los padres. Suma Psicologica. 2016; 23(2):101–8.
48. Friedman NP, Miyake A, Corley RP, Young S, DeFries JC, Hewitt JK. Not All Executive Functions Are
Related to Intelligence. Psychol Sci. 2006; 17(2):172–9. https://doi.org/10.1111/j.1467-9280.2006.
01681.x PMID: 16466426
49. Corsi PM. Human memory and the medial temporal region of the brain. Diss Abstr Int. 1972; 34(819B).
50. Mueller ST, Piper BJ. The Psychology Experiment Building Language (PEBL) and PEBL Test Battery. J
Neurosci Methods. 2014; 222:250–9. https://doi.org/10.1016/j.jneumeth.2013.10.024 PMID: 24269254
51. Kirchner W. Age Differences in Short-Term Retention of Rapidly Changing Information. J Exp Psychol.
1958; 55(44):352–8.
52. Baldi P, Brunak S, Chauvin Y, Andersen CAF, Nielsen H. Assessing the accuracy of prediction algo-
rithms for classification: an overview. Bioinforma Rev. 2000; 16(5):412–24.
53. Cumming G. The new statistics: Why and how. Psychol Sci. 2014; 12:1–23.
54. Kirby KN, Gerlanc D. BootES: An R package for bootstrap confidence intervals on effect sizes. Behav
Res Methods. 2013;905–27. https://doi.org/10.3758/s13428-013-0330-5 PMID: 23519455
55. Lakens D. Calculating and reporting effect sizes to facilitate cumulative science: a practical primer for t-
tests and ANOVAs. Front Psychol. 2013; 4(863).
56. Cohen J. Statistical power analysis for the behavioral sciences. Hillsdale, NJ: Lawrence Earlbaum
Associates; 1988.
57. Faul F, Erdfelder E, Lang A, Buchner A. G*Power 3: A flexible statistical power analysis program for the
social, behavioral, and biomedical sciences. Behav Res Methods. 2007; 39(2):175–91. PMID:
17695343
58. R Development Core Team. R: A language and environment for statistical computing, reference index
version 3.4.1. 2016.
59. Duggan EC, Garcia-Barrera MA. Executive functioning and intelligence. In: Goldstein S, Naglieri JA,
Princiotta D, editors. Handbook of intelligence: Evolutionary theory, historical perspective, and current
concepts. New York: Springer; 2015. p. 435–58.
60. Ashkenazi S, Silverman S. Multiple Skills Underlie Arithmetic Performance: A Large-Scale Structural
Equation Modeling Analysis. J Numer Cogn. 2017; 3(2):496–515.
61. Fazio L, DeWolf M, Siegler RS. Strategy Use and Strategy Choice in Fraction Magnitude Comparison. J
Exp Psychol Learn Mem Cogn. 2016; 42(1):1–16. https://doi.org/10.1037/xlm0000153 PMID:
26147669
62. Siegler RS, Lortie-Forgues H. Hard Lessons: Why Rational Number Arithmetic Is So Difficult for So
Many People. Curr Dir Psychol Sci [Internet]. 2017; 26(4):346–51. Available from: http://journals.
sagepub.com/doi/10.1177/0963721417700129
63. Carey S. The origin of concepts. New York: Oxford University Press; 2009.
64. Vosniadou S. Examining cognitive development from a conceptual change point of view: The frame-
work theory approach. Eur J Dev Psychol. 2014; 11(6):645–661.
65. Le Corre M, Carey S. One, two, three, four, nothing more: An investigation of the conceptual sources of
the verbal counting principles. Cognition. 2007; 105:395–438. https://doi.org/10.1016/j.cognition.2006.
10.005 PMID: 17208214
66. Hyde D, Simon CE, Berteletti I, Mou Y. The relationship between non-verbal systems of number and
counting development: a neural signatures approach. Dev Sci. 2016; 1–13.
67. Siegler RS, Pyke AA. Developmental and Individual Differences in Understanding of Fractions. Dev
Psychol. 2013; 49(10):1994–2004. https://doi.org/10.1037/a0031200 PMID: 23244401
68. Halberda J, Ly R, Wilmer J, Naiman D, Germine L. Number sense across the lifespan as revealed by a
massive Internet-based sample. Proc Natl Acad Sci. 2012;1–5.
69. Doenyas C, Yavuz HM, Selcuk B. Not just a sum of its parts: How tasks of the theory of mind scale
relate to executive function across time. J Exp Child Psychol. 2018; 166:485–501. https://doi.org/10.
1016/j.jecp.2017.09.014 PMID: 29078144
70. Zaitchik D, Iqbal Y, Carey S. The Effect of Executive Function on Biological Reasoning in Young Chil-
dren: An Individual Differences Study. Child Dev. 2014; 85(1):160–75. https://doi.org/10.1111/cdev.
12145 PMID: 23889035
The contributions of executive functions to mathematical learning difficulties and mathematical talent
PLOS ONE | https://doi.org/10.1371/journal.pone.0209267 December 13, 2018 20 / 21
71. Vamvakoussi X, Vosniadou S. Understanding the structure of the set of rational numbers: a conceptual
change approach. Learn Instr. 2004; 14:453–467.
72. van Hoof J, Degrande T, Ceulemans E, Verschaffel L, van Dooren W. Towards a mathematically more
correct understanding of rational numbers: A longitudinal study with upper elementary school learners.
Learn Individ Differ. 2018; 61:99–108.
73. Szucs D, Ioannidis JPA. Empirical assessment of published effect sizes and power in the recent cogni-
tive neuroscience and psychology literature. PloS Biol. 2017; 15(3):e2000797. https://doi.org/10.1371/
journal.pbio.2000797 PMID: 28253258
74. Hughes C, Graham A. Measuring Executive Functions in Childhood: Problems and Solutions? Child
Adolesc Ment Health. 2002; 7(3):131–42.
75. Testa R, Bennett P, Ponsford J. Factor Analysis of Nineteen Executive Function Tests in a Healthy
Adult. Arch Clin Neuropsychol. 2012; 27:213–24. https://doi.org/10.1093/arclin/acr112 PMID:
22314610
The contributions of executive functions to mathematical learning difficulties and mathematical talent
PLOS ONE | https://doi.org/10.1371/journal.pone.0209267 December 13, 2018 21 / 21