Embed Size (px)
Citation preview

Technische Universität München
Fakultät Wissenschaftszentrum Weihenstephan für Ernährung, Landnutzung und Umwelt
Lehrstuhl für Systembiologie der Pflanzen
The contribution of the
GATA transcription factors GNC and GNL
in the greening of
Arabidopsis thaliana
Emmanouil Bastakis Vollständiger Abdruck der von der Fakultät Wissenschaftszentrum Weihenstephan für Ernährung, Landnutzung und Umwelt der Technischen Universität München zur Erlangung des akademischen Grades eines
Doktors der Naturwissenschaften
genehmigten Dissertation.
Vorsitzender: Prof. Dr. W. Schwab Prüfer der Dissertation: 1. Prof. Dr. C. Schwechheimer 2. Prof. Dr. B. Poppenberger-Sieberer Die Dissertation wurde am 31.05.2017 bei der Technischen Universität München eingereicht und durch die Fakultät Wissenschaftszentrum Weihenstephan für Ernährung, Landnutzung und Umwelt am 31.07.2017 angenommen.

i
Abstract
Photosynthesis helps the assimilation of the atmospheric CO2, which is later used
for the production of sugars and ATP in plants. The synthesis and accumulation of
the chlorophylls, which eventually lead to the greening of the plants, is one of the
first and maybe the most essential steps in photosynthesis. Therefore, greening is
a process, which is tightly regulated at multiple levels. Studies of the chlorophyll
biosynthesis pathway have as yet been mainly focused on the biochemical and
functional characterization of its metabolic enzymes. However, very little is known
about the regulation and fine-tuning of chlorophyll biosynthesis in the
transcriptional level. The major goal of my thesis was to study the transcriptional
regulation in the chlorophyll biosynthesis pathway by the LLM-domain B-GATAs
transcription factors GNC and GNL. To this end, I analyzed pre-existing gene
expression data and then combined the results from this analysis with newly
produced RNA-seq and chromatin immunoprecipitation (ChIP) coupled with NGS
data, to discover direct targets of LLM-domain B-GATAs with a role in greening.
These efforts were combined with molecular, genetic and physiological studies,
which led to the conclusion that the transcriptional control of greening by GNC
and GNL occurred at multiple levels. Specifically, GNC and GNL are able to
regulate the greening in Arabidopsis through the (1) control of genes encoding for
enzymes in the chlorophyll pathway (GUN5, GUN4, CHLI1/2, CHLD, DVR), (2)
regulation of the heme pathway (GUN2), (3) control of the expression POR
genes, (4) transcriptional regulation of transcription factors with prominent roles in
greening (GLK1, GLK2), (5) direct transcriptional control of SIG factors (SIG2,
SIG6), which control transcription in the chloroplasts. Finally, they also function as
positive regulators of the retrograde signaling pathway.

ii
Zusammenfassung
Der Vorgang der Photosynthese hilft bei der Assimilierung des atmosphärischen
CO2, welches später wiederum für die Produktion von Zuckern und ATP in
Pflanzen verwendet wird. Die Synthese und die folgende Akkumulierung der
Chlorophylle, die letztendlich zum Ergrünen der Pflanzen führen, sind die ersten
und womöglich die essentiellsten Schritte der Photosynthese, weshalb dieser
Prozess auf etlichen Ebenen streng reguliert wird. Studien zur
Chlorophyllbiosynthese haben sich bisher hauptsächlich auf die biochemische
und funktionelle Charakterisierung der daran beteiligten metabolischen Enzyme
fokussiert. Allerdings ist über die Regulierung und Feinjustierung der
Chlorophyllbiosynthese auf transkriptioneller Ebene nur sehr wenig bekannt. Das
Hauptziel meiner Dissertation war die Untersuchung der transkriptionellen
Regulation der Chlorophyllbiosynthese durch die LLM-Domain B-GATA
Transkriptionsfaktoren GNC und GNL. Zu diesem Zweck untersuchte ich schon
vorhandene Genexpressionsdaten und kombinierte die Resultate dieser Analysen
mit neu geschaffenen RNA-Seq und Chromatin-Immunpräzipitation (ChIP)
Experimenten, welche mit NGS Daten gekoppelt wurden, um direkte Ziele der in
der Ergrünung involvierten LLM-Domain B-GATAs zu entdecken. Diese Versuche
wurden des Weiteren mit molekularen, genetischen und physiologischen Studien
kombiniert, die zur Schlussfolgerung führten, dass die transkriptionelle Kontrolle
der Ergrünung durch GNC und GNL auf multiplen Ebenen stattfindet. Im
Speziellen sind GNC und GNL fähig, die Ergrünung in Arabidopsis zu regulieren
(1) durch die Kontrolle der Gene, die für Enzyme im Chlorphyllbiosyntheseweg
(GUN5, GUN4, CHLI1/2, CHLD, DVR) kodieren, (2) durch die Regulierung der
Hämbiosynthese (GUN2), (3) durch Kontrolle der Expression der POR-Gene, (4)
durch transkriptionelle Regulierung von Transkriptionsfaktoren mit wichtigen
Rollen in der Ergrünung (GLK1, GLK2), (5) sowie durch direkte transkriptionelle
Kontrolle der SIG-Faktoren (SIG2, SIG6), welche die Transkription in den
Choroplasten kontrolliere. Schlussendlich funktionieren sie auch über die positive
Regulierung des retrograden Signalwegs.

iii
Acknowledgements
From this point, I would like to thank my supervisor Prof. Dr. Claus
Schwechheimer, for all of his assistance and support through the journey of my
PhD all these years. Many thanks to the groups, with which I collaborated in order
to enhance and broad the perspective of my work for this thesis, specifically: the
group of Prof. Dr. Klaus Mayer with Dr. Manuel Spannagl and Dr. Sapna Sharma,
the group of Prof. Dr. Bernhard Grimm and Dr. Boris Hedtke, the group of Prof.
Dr. Christoph Peterhänsel and Dr. Christian Blume and the group of Dr. Markus
Schmid and Dr. David Posé. I am also thankful to the committee of my PhD, Prof.
Dr. Brigitte Poppenberger and Prof. Dr. Wilfried Schwab.
I would also like to thank Rene for all of his help in the beginning of my PhD and
my GA-colleagues Uli, Quirin and Carina for all the fruitful discussions and
support through all of these years of my PhD. Many thanks to my colleges from
the lab with which we were in different teams, but they were always very helpful
and supportive, specifically: Melina, Ines, Benny, Björn, Anthi, Franzi, Maike,
Erika, Stephan, Lilly, Angela and Pascal. Thanks to Valentin for his help with the
translation of the abstract in Deutsch.
I also want to thank Jutta for her great technical assistance and Petra for her help
regarding administrative stuff.
I would also like to convey my sincere thanks to my family in Greece, for all of
their support and believe.
Finally, I would like to express my heartful thanks to my wife Evgenia, which was
always there for me, to listen, to support and to encourage me, no matter what.
Manolis

iv
To
Alkyoni and Evgenia

v
Table of contents
Abstract ............................................................................................................... i
Zusammenfassung ............................................................................................. ii
Acknowledgements ............................................................................................ iii
1. Introduction ................................................................................... 1
1.1 B-GATA transcription factors ........................................................................ 1
1.2 The role of GNC and GNL in greening .......................................................... 3
1.3 Greening and photosynthesis ....................................................................... 4
1.4. The role of the tetrapyrrole biosynthesis pathway in greening ..................... 6
1.5 The chlorophyll biosynthesis branch ............................................................. 6
1.6 The heme pathway and chlorophyll biosynthesis .......................................... 9
1.7 Transcriptional control of greening .............................................................. 10
1.8 Phytochromes and PHYTOCHROME INTERACTING FACTORS ............. 10
1.9 GOLDEN2-LIKE (GLK) transcription factors ............................................... 12
1.10 Sigma factors (SIGs)................................................................................. 13
1.11 Aim of this thesis ....................................................................................... 15
2. Material and methods ................................................................. 16
2.1 Material ....................................................................................................... 16
2.2 Methods ...................................................................................................... 22
2.2.1 Seed sterilization and growth conditions .................................................. 22
2.2.2 Transformation of Arabidopsis plants ...................................................... 22
2.2.3 DNA extraction from Arabidopsis tissues ................................................. 22
2.2.4 Genotyping PCR ...................................................................................... 23
2.2.5 RNA extraction ......................................................................................... 23
2.2.6 Real time qRT-PCR ................................................................................. 24
2.2.7 Cloning of pGNL:GNL:HA gnc gnl ........................................................... 24
2.2.8 Cloning of overexpression lines of GUN2, GUN4, GUN5, DVR, SIG2,
SIG6, GLK1 ...................................................................................................... 24
2.2.9 Cloning of 35S:GNC:YFP:HA:GR and 35S:GNL:YFP:HA:GR ................. 25
2.2.10 Chromatin immunoprecipitation (ChIP) .................................................. 25
2.2.11 Next generation sequencing library preparation .................................... 26
2.2.12 ChIP-seq analysis .................................................................................. 26

vi
2.2.13 Dex (Dexamethasone) and CHX (cycloheximide) treatments for RNA-seq
experiments ...................................................................................................... 27
2.2.14 RNA-seq analysis .................................................................................. 28
2.2.15 HPLC for tetrapyrroles and carotenoids ................................................. 28
2.2.16 Chlorophyll quantification ....................................................................... 28
2.2.17 Dipyridyl treatment ................................................................................. 29
2.2.18 Cytokinin treatment ................................................................................ 29
2.2.19 Photobleaching experiment ................................................................... 29
2.2.20 Quantification of protochlorophyllide ...................................................... 29
2.2.21 Norflurazon treatment ............................................................................ 30
2.2.22 Quantification of the assimilation of CO2 ................................................ 30
2.2.23 Chlorophyll fluorescence measurements in the Imaging-PAM ............... 30
3. Results - Systems biology approaches for the identification of
GNC and GNL targets ..................................................................... 31
3.1 Identification of the direct target genes of GNC and GNL with an important
role in greening ................................................................................................. 31
3.1.1 Expression analysis of existing microarray datasets suggests the
implication of B-GATAs in chlorophyll biosynthesis and chloroplast development
.......................................................................................................................... 31
3.1.2 The B-GATAs GNC and GNL are essential for the synthesis of chlorophyll
intermediates .................................................................................................... 33
3.1.3 Identification of the GNC and GNL target genes with a role in greening .. 34
3.1.4 ChIP-seq with pGNL:GNL:HA gnc gnl from light-grown seedlings ........... 34
3.1.5 GNL binds not only to promoters but also to exonic and intronic regions of
genes ................................................................................................................ 35
3.1.6 De novo motif discovery supports the previous finding of the preference of
GNL to bind to GATA-boxes ............................................................................. 36
3.1.7 Cross-regulation between the B-GATAs GNC, GNL and GATA17 .......... 38
3.1.8 Generation of inducible translational fusion variants of GNC and GNL
for RNA-seq experiments.................................................................................. 39
3.1.9 Identification of the differentially expressed genes after induction of Dex
and CHX of 35S:GNC:YFP:HA:GR gnc gnl and 35S:GNL:YFP:HA:GR gnc gnl
seedlings........................................................................................................... 40

vii
3.1.10 Genes related to chlorophyll biosynthesis, regulation of greening,
chloroplast import machinery, photosynthesis and the chloroplast division
apparatus are strongly upregulated in the RNA-seq experiments..................... 42
3.1.11 The overlap between ChIP-seq and RNA-seq shows that GNC and GNL
directly regulate the expression of genes with a prominent role in greening ..... 44
3.1.12 The combination of the results from the high-throughput experiments
points to five major and distinct areas where later research for the role of B-
GATAs in greening should be focus on ............................................................ 45
4. Results - Physiological and genetic studies for the validation
of GNC and GNL targets ................................................................. 46
4.1 GNL and GNC promote chlorophyll biosynthesis through the upregulation of
Mg-chelatase subunits ...................................................................................... 46
4.1.1 GUN5/CHLH expression is regulated by B-GATAs ................................. 46
4.1.2 CHLD expression is regulated by B-GATAs ............................................ 50
4.1.3 CHLI expression is regulated by B-GATAs .............................................. 51
4.1.4 GUN4 is transcriptionally controlled by GNC and GNL ............................ 52
4.1.5 DVR is a downstream target of B-GATAs in the chlorophyll biosynthesis
pathway ............................................................................................................ 54
4.2 Control of the heme pathway ...................................................................... 56
4.2.1 The heme pathway .................................................................................. 56
4.2.2 GUN2/HO1 is transcriptionally controlled mostly by B-GATAs ................ 56
4.2.3 Heme pathway can influence the expression of GNC and GNL .............. 59
4.3 PHYTOCHROME INTERACTING FACTORS (PIFs) ................................. 61
4.3.1 B-GATAs GNC and GNL induce the expression of PIF1 and PIF3 .......... 61
4.3.2 GNL regulates greening downstream of PIFs .......................................... 62
4.3.3 The B-GATA GNL protects etiolated seedlings from the photooxidative
effects of the light exposure by decreasing the levels of protochlorophyllide .... 63
4.3.4 The B-GATAs may reduce protochlorophyllide by the transcriptional
control of the POR genes ................................................................................. 65
4.3.5 The B-GATAs GNC and GNL may protect de-etiolated seedlings from
photooxidation through transcriptional upregulation of the carotenoid
biosynthesis pathway ........................................................................................ 66
4.4 GOLDEN2-LIKE (GLK) transcription factors ............................................... 67
4.4.1 GNC and GNL induce the expression of GLK1 and GLK2....................... 67
4.4.2 GLKs are downstream of GNC and GNL regarding greening .................. 69

viii
4.4.3 B-GATAs and GLKs have common but also distinct target genes with
regard to greening ............................................................................................ 70
4.5 Sigma factors (SIGs), the regulators of the chloroplast transcription .......... 71
4.5.1 GNC and GNL control the expression of SIG2 ........................................ 72
4.5.2 GNL induces greening independently from SIG2 ..................................... 72
4.5.3 The B-GATAs GNC and GNL control the expression of SIG6 ................. 75
4.5.4 GNL promotes greening independently from SIG6 .................................. 76
4.5.5 GNC and GNL regulate the expression of SIG2 and SIG6 in a cytokinin-
dependent manner ............................................................................................ 78
4.5.6 GNL dynamically readjusts the expression of SIG2 and SIG6 in order to
promote greening .............................................................................................. 79
4.5.7 SIG2 and SIG6 promote a signal, which suppresses the expression of
GNC and GNL .................................................................................................. 79
4.6 Retrograde signaling, the communication between chloroplasts and the
nucleus ............................................................................................................. 80
4.6.1 GNC and GNL can influence the communication between chloroplasts
and the nucleus ................................................................................................ 81
4.7 B-GATAs GNC and GNL can affect overall photosynthesis........................ 82
5. Discussion ................................................................................... 84
5.1 The transcriptional regulation of greening before and after the research
conducted in this thesis .................................................................................... 84
5.2 Combinatorial analysis of metabolomics together with ChIP-seq and RNA-
seq reveals the major role of GATAs to the transcriptional control of many
greening related genes ..................................................................................... 86
5.3 B-GATAs control the transcription of key enzymes in the chlorophyll
biosynthesis pathway ........................................................................................ 88
5.4 The chlorophyll and the heme pathway are converging on B-GATAs ......... 89
5.5 B-GATAs function downstream of PIFs regarding greening ....................... 90
5.6 The interplay between B-GATAs and GLK transcription factors promotes
greening ............................................................................................................ 91
5.7 The B-GATAs GNC and GNL induce greening by controlling the chloroplast
transcription via the upregulation of SIG2 and SIG6 chloroplast proteins ......... 91
5.8 B-GATAs are positive regulators of the retrograde signaling ...................... 92
5.9 Model of the proposed contribution of B-GATAs in greening of Arabidopsis
.......................................................................................................................... 93

ix
6. Literature ..................................................................................... 95
Appendix ......................................................................................... 104

1
1. Introduction
Sunlight is the driving power of life on earth. In photosynthetic organisms, such as
plants, chlorophyll molecules capture the energy from sunlight. Photosynthesis
helps with the assimilation of the atmospheric CO2, which is used for the
production of sugars, ATP and O2. The synthesis and accumulation of
chlorophyll, which eventually leads to the greening of plants, is the most essential
step of photosynthesis. The knowledge gained over the last decades has
enriched our understanding of the biochemical aspects of photosynthesis as well
as chlorophyll biosynthesis. However, as yet little is known about the
transcriptional regulation of the genes, which encode for either enzymes or
regulators involved in the chlorophyll biosynthesis pathway. Previous studies have
shown that so-called LLM-domain B-GATA transcription factors can strongly
promote the greening of plants (Behringer & Schwechheimer 2015).
1.1 B-GATA transcription factors
GATA transcription factors are present in many organisms such as fungi,
echinoderms, nematodes, insects, vertebrates and plants. GATAs are zinc finger
proteins, which carry one or more zinc ions (Lowry & Atchley 2000). The zinc
finger family is divided into six classes with regard to the amino acid sequence of
the zinc domain (Krishna et al. 2003). GATAs belong to the class IV of zinc finger
proteins, and this class is further divided into the subclasses IVa and IVb. The
difference between these two classes is the amino acid sequence of the zinc
finger domain. Class IVa has the consensus sequence C-X2-C-X17-C-X2-C
where C is cysteine and X any amino acid, and includes GATAs from fungi and
animals but not from plants. Class IVb has the consensus sequence C-X2-C-X18-
C-X2-C and is comprised of GATAs from plants and many fungi.
GATA factors recognize and bind to the conserved DNA motif W-G-A-T-A-R
where W is a thymidine (T) or an adenosine (A) and R is a guanidine (G) or
adenosine (A) (Reyes et al. 2004). GATA factor DNA-binding can cause the
regulation of the transcription of genes located in proximity to this motif (Evans et
al. 1988). The domain of the GATA proteins responsible for the interaction with
the DNA is the type IV zinc-finger domain. Structurally, this domain consists of

2
one zinc ion surrounded by four cysteins, together with two anti-parallel β-sheets,
one α-helix and one carboxyl-terminal tail (Omichinski et al. 1993). The interaction
of the GATA-domain with the DNA takes place mostly between the thymines and
the phosphate atoms of the DNA (Omichinski et al. 1993).
In Arabidopsis (Arabidopsis thaliana), the GATA family consists of 30 members,
which can be further categorized into four distinct groups A, B, C and D
(Behringer and Schwechheimer, 2015). Each of these groups preserve certain
characteristics, for example, exon-intron structure, the position of the zinc finger
domain, the presence or absence of CCT and acidic domain, and the number of
residues of the zinc finger domain (Reyes et al. 2004). Additionally, the group of
B-GATAs can be sub-divided into two sub-groups, B-GATAs with a HAN-
(HANABA TARANU-) domain, and B-GATAs with an LLM- (leucine-leucine-
methionine-) domain (Behringer and Schwechheimer 2015) (Figure 1).
Figure 1: Schematic illustration of B-GATAs with an LLM-domain or a HAN-domain. The part of the protein, which interacts with DNA is assigned as B-class GATA-domain. Modified figure based on (Behringer and Schwechheimer 2015).
GNC (GATA21) and GNL (GATA22) are paralogous LLM-domain B-GATA
transcription factors, which regulate different aspects of plant life, such as
germination, flower development, flowering time and greening (Behringer and
Schwechheimer 2015; Kiba et al. 2005). GNC is induced by nitrate and can
increase the expression of genes related to carbon metabolism. Therefore, GNC
is designated as GATA, NITRATE INDUCIBLE CARBON METABOLISM
INVOLVED (Bi et al. 2005). GNL (GNC-LIKE) expression is upregulated by light
and cytokinin and the gene was therefore originally designated CGA1
(CYTOKININ INDUCED GATA1) (Naito et al. 2007). GNL is more strongly

3
cytokinin-regulated and red light-induced than GNC (Naito et al. 2007; Ranftl et al.
2016).
1.2 The role of GNC and GNL in greening
Single mutants of GNC and GNL show reduced chlorophyll levels compared to
the wt (wild type), and chlorophyll levels are further reduced in a gnc gnl double
mutant compared to the single mutants (Bi et al. 2005; Richter et al. 2010). On the
other side, plants that overexpress GNC or GNL show increased levels of
chlorophyll compared to wt (Richter et al. 2010; Hudson et al. 2011). Currently, it
is believed that GNC and GNL influence greening through the upregulation of the
expression of genes encoding for enzymes in the chlorophyll biosynthesis
pathway, such as PORs (PROTOCHLOROPHYLLIDE OXIDOREDUCTASE),
GUN4 (GENOMES UNCOUPLED 4) and HEMA1/GLUTR (GLUTAMYL-tRNA
REDUCTASE) (Richter et al. 2010; Hudson et al. 2011).
GNC and GNL appear to not only affect chlorophyll biosynthesis but also
chloroplast development. In particular, the number of chloroplasts is reduced in
plants with reduced expression of GNC and GNL and increased in plants that
overexpress GNC or GNL (Hudson et al. 2011). The influence of GNC and GNL
on chloroplast number takes place downstream of cytokinin and can also occur
ectopically in roots when GNC is overexpressed; this underlines the important role
of B-GATAs in chloroplast development (Chiang et al. 2012). Moreover, the
contribution of B-GATAs to chloroplast development is conserved in other plant
species, such as rice (Oryza sativa) and poplar (Populus tremula) (Hudson et al.
2013; An et al. 2014).
The significance of GNC and GNL in greening is further shown by a micrografting
experiment between wt and GNC overexpressing seedlings, which shows that
greening is regulated in a cell autonomous manner by GNC (Figure 2) (Klermund
et al. 2016). The role of B-GATAs in greening is not restricted to GNC and GNL
but also the other Arabidopsis LLM-domain B-GATAs GATA16, GATA17, and
GATA17L have a redundant function during greening of Arabidopsis.

4
Figure 2: LLM-domain B-GATA are required for chlorophyll biosynthesis. (A and B) Photos of a micro-grafting experiment between GNCox and wt show that GNCox controls greening in Arabidopsis in a cell-autonomous manner; red arrowheads point to the part of seedlings from either wt GNCox; scale bar = 500 μm. Modified from (Klermund et al. 2016). (C) Photo of 14-d-old light-grown B-GATA mutant seedlings. Modified from (Ranftl et al. 2016).
A quintuple mutant, defective in GNC, GNL, GATA16, GATA17 and GATA17L,
accumulates less chlorophyll than any other mutant combination (Figure 2C)
(Ranftl et al. 2016).
1.3 Greening and photosynthesis
Plants are autotrophic organisms that produce their food from inorganic matter.
Atmospheric CO2 is assimilated through the Calvin cycle into triose phosphate,
which later gives rise to sucrose, a fundamental sugar used as a source of carbon
and as an energy molecule. The assimilation of CO2 takes place in the stroma of
the chloroplasts and the energy required for this process is provided by light and
photosynthesis. In particular, for each fixed molecule of CO2, nine molecules of
adenosine triphosphate (ATP) and six molecules of nicotinamide adenine
dinucleotide phosphate (NADPH) are required, which are provided by
photosynthesis.
The synthesis and accumulation of chlorophyll a and b in the chloroplasts of the
plant cells result in greening. Chlorophylls are derivatives from the tetrapyrrole
biosynthesis pathway, which takes place in chloroplasts (Tanaka & Tanaka 2007).

5
Chlorophylls can interact with light harvesting proteins (LHPs) and carotenoids in
order to form light harvesting complexes (LHC), which are embedded in the
thylakoid membranes of the chloroplasts (Cheng & Fleming 2009). Many LHCs
together form structures known as photosystems (PS), and all higher plants have
two PS types, PSI and PSII (Nelson & Yocum 2006). Every PS is essentially
divided into two parts, the antenna and the reaction center. Chlorophyll is
distributed in the antenna as such; the inner part of the antenna is rich in
chlorophyll a, which absorbs mostly low energy light with longer wavelengths,
while the outer part is rich in chlorophyll b and absorbs mostly high energy light
with shorter wavelengths (Hirashima et al. 2006). The reaction center of the PS is
where the conversion of physical energy to chemical energy occurs and it
consists predominantly of chlorophyll a. Photons from light excite chlorophyll
molecules in the antenna creating energy, which is delivered via other chlorophyll
molecules to the reaction center of the PS (Cheng & Fleming 2009). There,
chlorophyll a can donate an electron to NADP+ and convert it to NADPH, a
reducing agent, which is then released in the stroma and used in the reduction
step of the Calvin cycle for CO2 assimilation (Berry et al. 2013). PSII and PSI
function in series and are connected to each other by the electron transport chain,
electron protein carriers that are derived from chlorophyll oxidation (Nelson &
Yocum 2006). Finally, a chlorophyll molecule in the PSI loses an electron and
reduces one molecule of NADP+ to NADPH.
Figure 3: Schematic representation of the photosynthesis machinery.

6
The flow of electrons through the electron chain, from the PSII to the PSI, causes
the import of protons from the stroma of the chloroplast to the lumen of the
thylakoids. Therefore, the approximate pH inside thylakoids is 4 and outside about
8 (Jagendorf & Uribe 1966). The protons, which are imported from the stroma,
can be exported outside of the thylakoids through the ATP-synthase complex.
The flow of the protons through the channel of this complex, which is also
embedded in the thylakoid membranes, starts the conversion of ADP to ATP
(Eberhard et al. 2013).
Chlorophyll can absorb light in the range of 400 - 480 nm (blue light) and 550 -
700 nm (red light), but it cannot absorb mid-range visible light between 480 - 550
nm (green light). Green light is reflected by the plants and because of this, plants
have the visible green color. Although it is well studied and understood how
chlorophyll contributes to photosynthesis, it is not yet clear how chlorophyll
synthesis is transcriptionally controlled. The goal of this thesis was to reveal the
mode of chlorophyll biosynthesis regulation through the B-GATA transcription
factors GNC and GNL.
1.4. The role of the tetrapyrrole biosynthesis pathway in greening
Chlorophyll biosynthesis, a branch of the tetrapyrrole biosynthesis pathway takes
place in chloroplasts (Figure 4). This metabolic cascade starts with the adjunction
of glutamyl-tRNA (Glu-tRNA) to 5-aminolevulinic acid (ALA) and eventually leads
to the synthesis of three metabolic products, heme, siroheme and chlorophyll a
and b. The enzymes, which contribute to the synthesis of the chlorophylls, are all
well characterized. It is, however, not well understood how the chlorophyll
pathway is regulated at the transcriptional level.
1.5 The chlorophyll biosynthesis branch
The first step in the chlorophyll pathway is the addition of an Mg2+ ion to the proto-
IX (protoporphyrin-IX), which gives rise to Mg-proto-IX (Mg-protoporphyrin-IX).
This particular reaction is catalyzed by the multi-subunit enzyme MgCh (Mg-
chelatase) that consists of the subunits GUN5 (GENOMES UNCOUPLED 5),
CHLD (CHELATASE D) and CHLI (CHELATASE I) (Tanaka & Tanaka 2007).

7
Additionally, GUN4 activates the complex and places it in its proper position in the
chloroplast membranes. GUN4 and GUN5 also have a role in chloroplast to
nucleus communication in a process referred to as retrograde signaling
(Mochizuki et al. 2001; Larkin 2003). Since the communication between the
chloroplast and nuclear genomes is disturbed in gun2 (gun2-1), gun4 (gun4-1),
and gun5 (gun5-1) mutants, the corresponding genes were designated as GUN

8
Figure 4: Schematic representation of the tetrapyrrole biosynthesis pathway. Arrows represent enzymatic steps; enzymatic products are indicated by black regular letters; proteins implicated in each step of the pathway are in grey color; colored frames mark the main 4 products of the tetrapyrrole pathway. ( ): indicates presence of additional steps not presented in this figure.
(GENOMES UNCOUPLED) genes (Susek et al. 1993).
GUN5 catalyzes the insertion of Mg2+ into proto-IX. This process needs MgCh to
be activated by ATP and is dependent on the concentration of free Mg2+ in the
stroma of the chloroplast (Gibson et al. 1999; Tanaka & Tanaka 2007). Regarding
greening, mutants of the GUN5 gene (gun5-1; cch1, conditional chlorina; rtl1,
rapid transpiration in detached leaves 1) and RNAi suppression lines of GUN5
show impaired chlorophyll biosynthesis (Mochizuki et al. 2001; Tsuzuki et al.
2011).
In the Arabidopsis genome, the CHLI subunit of the MgCh complex is encoded by
two homologous genes, CHLI1 and CHLI2. The CHLI1 is expressed at much
higher levels than CHLI2, indicating that the CHLI1 protein has the major function
in the MgCh complex. However, CHLI2 expressed from the CHLI1 promoter can
rescue the pale green phenotype of the chli1 chli2 double mutant (Huang & Li
2009). CHLI may interact with the CHLD subunit of MgCh and MgCh activity is
dependent on CHLI (Rissler et al. 2002)(Huang & Li 2009). The most likely reason
for this is that ATPase activity is necessary for the insertion of Mg2+ into the proto-
IX substrate (Kobayashi et al. 2008). Additionally, chli1 chli2 double mutant show
a gun phenotype after the application of NF (norfluorazon) to young seedlings,
which blocks retrograde signaling through inhibition of carotenoid biosynthesis.
The chli1 chli2 double mutant shows severe defects in chlorophyll biosynthesis
but the chli1 and chli2 single mutants show only a very mild reduction in
chlorophyll levels compared to the wt (Huang & Li 2009).
GUN4 is not an essential subunit of MgCh. Instead, it works as an assistant
protein to the MgCh enzymatic complex. The role of GUN4 on the function of the
MgCh complex is crucial for the proper placement of the complex on the
chloroplast membranes and the enhancement of MgCh activity (Tanaka &
Tanaka; Adhikari et al. 2009). GUN4 may function as a Mg2+-dependent molecular

9
switch for the activation of MgCh. When the concentration of Mg2+ is at normal
levels, the MgCh complex is activated by GUN4. Alternatively, when the
concentration of Mg2+ is very low, GUN4 may inactivate the MgCh complex
(Davison et al. 2005). Furthermore, GUN4 has a role in retrograde signaling
(Larkin et al. 2003). gun4-1 (gun4) seedlings subjected to NF treatment show
disrupted communication between the chloroplasts and the nucleus (Mochizuki et
al. 2001). Moreover, gun4 mutant shows severe defects in greening with reduced
chlorophyll levels (Mochizuki et al. 2001; Larkin et al. 2003). It has been proposed
that GNC and GNL affect the expression of GUN4, although it is unclear whether
this regulation is direct or indirect (Hudson et al. 2011). It is also unknown whether
the expression of the three MgCh subunits is regulated by the GATAs. Elucidating
the role of GNC and GNL in MgCh gene expression is a goal of the present
thesis.
1.6 The heme pathway and chlorophyll biosynthesis
At the stage of proto-IX, the tetrapyrrole pathway bifurcates into two branches, the
chlorophyll biosynthesis and the phytochromobilin or heme branch (Figure 4). The
heme branch gives rise to phytochromobilin, the chromophore of the PHY
(PHYTOCHROME) proteins, through which plants can perceive light (Parks &
Quail 1991). GUN2/HO1 encodes for a heme oxygenase in the heme branch
where it catalyses the opening of the ring of protoheme (heme B or heme) to
produce biliverdin IXa (Ishijima et al. 2003). Plants are able to synthesize other
types of heme, such as heme A and C, but the ways through which these forms
are produced have yet to be explored. The light-grown gun2 mutant is pale green
and shows defects in chlorophyll biosynthesis (Mochizuki, Brusslan, Larkin, A.
Nagatani, et al. 2001). Moreover, when grown under normal light conditions, gun2
displays an elongated hypocotyl compared to the wt. Presumably, both
phenotypes are results of the reduced phytochrome function due to the reduction
in phytochromobilin in gun2.

10
1.7 Transcriptional control of greening
As of now, only a small number of transcription factors has been associated with
the regulation of greening in plants (Figure 5). Some known transcription factors
such as PIFs (PHYTOCHROME INTERACTING FACTORS), GLKs (GOLDEN2-
LIKES), HY5 (ELONGATED HYPOCOTYL5) and EIN3 (ETHYLENE
INSENSITIVE 3), that are implicated in many different developmental processes
and hormonal pathways, play also an important role in the transcriptional
regulation of greening (Kobayashi & Masuda 2016). It can be postulated that
there must be multiple levels of regulation and control for a complex pathway
such as chlorophyll biosynthesis. Therefore, one goal of this thesis was to
investigate the existence of potential interactions between B-GATAs with some of
the known regulators of greening.
1.8 Phytochromes and PHYTOCHROME INTERACTING FACTORS
PIFs are transcription factors of the basic helix-loop-helix (bHLH) family (Bailey et
al. 2003). PIFs promote skotomorphogenesis and they are degraded rapidly
following light exposure after their phyA- and phyB-dependent phosphorylation
(Al-Sady et al. 2006). PIFs are also implicated in other processes, such as the
repression of seed germination, shade avoidance and high temperature
responses (Leivar & Quail 2011). PIF1 and PIF3 repress chlorophyll biosynthesis
and chloroplast development in the dark-grown seedlings (Huq et al. 2004; Liu et
al. 2013). In particular, PIF1 reduces the levels of Pchlide (protochlorophyllide),
an intermediate of the chlorophyll biosynthesis pathway, through the induction of
FeCHLII, PORA, PORB, PORC and HEMAC expression (Moon et al. 2008).
PORs convert Pchlide to Chlide (chlorophyllide). Overaccumulation of Pchlide in
etiolated seedlings, followed by light exposure, leads to photooxidative damage in
seedlings, which can be lethal when dark-grown seedlings are shifted to the light
(Huq et al. 2004). Thus, PIF1 can differentially regulate the expression of
chlorophyll biosynthesis genes, probably to increase the adaptation of young
seedlings during the transition from skotomorphogenesis to photomorphogenesis
(Moon et al. 2008). PIF3 is also implicated in the regulation of chlorophyll
biosynthesis in dark-grown seedlings.

11
Figure 5: The tetrapyrrole biosynthesis pathway and its known transcriptional regulators. Schematic representation of the tetrapyrrole pathway from plants; ( ): indicates presence of additional steps not presented in this figure; small colored circles represent known regulators of the pathway; horizontal arrows, linked with circles, depict a direct regulation supported by chromatin immunoprecipitation (ChIP); arrows with dashed lines represent transcriptional regulation not supported by ChIP. Horizontal arrows, which end with arrow-heads ( ) imply activation of gene expression; horizontal arrows, which end in a vertical line ( ), imply repression of gene expression; horizontal arrows.
Specifically, PIF3 binds to certain promoters of some chlorophyll biosynthesis
genes, such as GUN5 and CHLD, and then attracts the HDA15 (HISTONE
DEACETYLASE15) enzyme. HDA15 reduces histone acetylation and thereby

12
represses gene expression (Liu et al. 2013). Following light exposure, PIF3 is
degraded and the recruitment of HDA15 to gene promoters is lost (Liu et al.
2013). Due to the protective role, which PIF1 and PIF3 show agsinst the
photooxidation of etiolated seedlings, by the downregulation of chlorophyll
biosynthesis genes in the dark, It was hypothesized that GNC and GNL could
also participate to this protective mechanism, to eventually promote the normal
greening process of the plant after the light exposure.
1.9 GOLDEN2-LIKE (GLK) transcription factors
The G2 (GOLDEN2) transcription factor was initially discovered in maize (Zea
mays) and characterized as a gene with a pivotal role in the development of the
chloroplasts of photosynthetic tissues. The maize G2 mutant is very pale green
when compared to the wt (Hall et al. 1998). Characterization of the G2
homologous ZmGLK1 (G2-LIKE1) from maize or OsGLK1 and OsGLK2 from rice
revealed that also these genes play an important role in the development of
chloroplast and photosynthesis (Rossini et al. 2001). GLK genes are expressed
predominately in all photosynthetic tissues (rosette and cauline leaves and
cotyledons) (Fitter et al. 2002), and they are able to function in a cell-autonomous
manner (Waters et al. 2008). Two GLK genes have been identified in all higher
plants such as maize, rice, tomato (Solanum lycopersicum) and Arabidopsis,
where the GLK genes have been studied so far (Fitter et al. 2002).
Arabidopsis GLK1 and GLK2 have partially redundant functions and glk1 glk2
double mutant is pale green (Waters et al. 2008; Waters et al. 2009). In
Arabidopsis, GLK transcription factors can influence the expression of genes, with
a role in the light harvesting complexes, the electron transport chain, and the
chlorophyll biosynthesis pathway (Waters et al. 2009). Additionally, GLK2,
together with HY5 (ELONGATED HYPOCOTYL5), can induce greening in
Arabidopsis roots in a cytokinin-dependent manner (Kobayashi et al. 2012). This
induction of greening in the root can be suppressed by the auxin hormone. This
result underlines the important role of GLK2 in promoting chlorophyll biosynthesis,
even in non-photosynthetic tissues such as the root.

13
The contribution of GLKs to greening is not restricted to basic photosynthetic plant
tissues, such as the leaves, but it extends also to fruits. In tomato, overexpression
of SlGLK leads to enhanced photosynthesis and subsequently elevated levels of
carotenoids and carbohydrates of the tomato fruit, beneficial features for the
overall fruit quality (Powell et al. 2012).
GLKs and B-GATAs play an important role in the greening of the plants. It has so
far not been investigated to what extend these two classes of genes interact,
whether they cross-regulate each other or co-regulate common target genes.
Therefore, this thesis investigates a potential relationship between B-GATA GNC
and GNL with GLK transcription factors in the control of greening.
1.10 Sigma factors (SIGs)
Chloroplasts maintain their own genome, and they have their own transcription
apparatus. Chloroplasts have two types of RNA-polymerase enzymes, nucleus-
encoded polymerase (NEP) and plastid-encoded polymerase (PEP) (Allison
2000). NEP is responsible mostly for the transcription of chloroplast housekeeping
Table 1: Tissue-specific expression pattern of the six Arabidopsis SIG genes.
genes, and only for few genes related to photosynthesis (Börner et al. 2015). PEP
is responsible for the transcription of the majority of photosynthetic genes
encoded by the chloroplast genome as well as for genes with a role in chloroplast
development (Fujiwara et al. 2000; Börner et al. 2015). NEP is nucleus-encoded
and a single subunit enzyme. PEP is a multi-subunit enzyme consisting of two
parts, the core catalytic domain built entirely of plastid-encoded proteins (rpoA,
rpoB, rpoC1 and rpoC2) and the nucleus-encoded sigma factor proteins (SIGs).

14
These factors incorporate into the core domain PEP and provide promoter
specificity to the enzyme (Kanamaru & Tanaka 2004). The nucleus can control
the expression of chloroplast-specific genes by controlling the expression of SIG
factors (Allison 2000).
The Arabidopsis genome encodes for six SIG genes, SIG1 - SIG6 (Böner et al.
2015). The expression pattern of SIG genes is restricted predominantly to green-
photosynthetic tissue (Table 1). Nevertheless, SIG3 is also expressed in seeds
and SIG5 in the roots of young seedlings (Table 1) (Lysenko 2007). Furthermore,
the expression of SIG genes is light-regulated (Allison 2000).
SIG2 and SIG6 contribute to chloroplast development and photosynthesis in
seedlings and the sig2 (sig2-1) and sig6 (sig6-2) single mutants show severe
defects in greening. Young sig6 mutant seedlings have a pale green color, which
is completely restored as the plants become older (Ishizaki et al. 2005). SIG2
seems to play a role in the formation of chloroplasts but has no role in etioplasts
development. Additionally, the expression levels of chloroplast-encoded
photosynthetic genes remain unchanged in the sig2 mutant, as well as that of the
nuclear encoded CAB (CHLOROPHYLL A/B BINDING PROTEIN) and RBCS
(RIBULOSE BISPHOSPHATE CARBOXYLASE) photosynthetic genes. At the
same time, the levels of proteins related to photosynthesis are markedly reduced
in sig2.
SIG6 also plays a role in the greening of Arabidopsis but its role is restricted to
the cotyledons early in development, and older plants appear to be normal with
regard to greening. In contrast to sig2 mutants, sig6 mutants show changes in the
transcript levels of genes, which are known to be regulated by the PEP (Ishizaki
et al. 2005). The hypothesis is that SIG6 has overlapping function with another
SIG factor or related proteins.
Until now, the promotion of greening through the induction of nuclear genes
encoding for SIG factors has remained unexplored. Here, it is being examined
how the B-GATAs GNC and GNL cross-talk with the SIG factors at the
transcriptional and genetic level.
15
1.11 Aim of this thesis
Studies of the chlorophyll biosynthesis pathway have as yet been mainly focused
on the biochemical and functional characterization of its metabolic enzymes.
However, very little is known about the regulation and fine-tuning of chlorophyll
biosynthesis at the transcriptional levels. The major aim of my thesis was to shed
light on the regulation of chlorophyll biosynthesis by the LLM-domain B-GATAs
transcription factors. Initially, I analyzed pre-existing gene expression data in
combination with RNA-seq data and chromatin immunoprecipitation (ChIP)
coupled with NGS (next generation sequencing) to identify direct targets of LLM-
domain B-GATAs. This was combined with molecular, physiological and genetic
studies, which showed that the transcriptional control of greening by GNC and
GNL occurred at multiple levels. GNC and GNL were able to regulate the
greening in Arabidopsis through the (1) control of genes encoding for enzymes in
the chlorophyll pathway (GUN5, GUN4, CHLI1/2, CHLD, DVR), (2) transcriptional
regulation of transcription factors with prominent roles in greening (GLK1, GLK2),
(3) direct transcriptional control of SIG factors (SIG2, SIG6), (4) regulation of the
heme pathway (GUN2) and, finally, (5) retrograde signaling.

16
2. Material and methods
2.1 Material
All the experiments presented in this thesis were conducted with the accession
Columbia-0 (Col-0) of Arabidopsis thaliana as genetic background, except of the
sig2-1 (abc1) mutant, which had as background accession Wassilewskija.
Nevertheless, the sig2-1 mutant was chosen because of its strong phenotype
regarding greening, compared to other mutants of SIG2.
Table 2: List of mutant lines used in this thesis.

17
Table 3: List of transgenic lines.
Genotype Reference
pGNL:GNL:HA gnc gnl
Transgenic lines and genetic crosses generated for this study
35S:GNC:YFP:HA:GR gnc gnl
35S:GNL:YFP:HA:GR gnc gnl
gnc gnl gun2-1
gnc gnl 35S:GUN2
35S:GUN2 Col-0
gun2-1 35S:YFP:GNL
gun4-1 gnc gnl
gnc gnl 35S:GUN4
35S:GUN4 Col-0
gun4-1 35S:YFP:GNL
gun5-1 gnc gnl
cch1 gnc gnl
gnc gnl 35S:GUN5
35S:GUN5 Col-0
gun5-1 35S:YFP:GNL
cch1 35S:YFP:GNL
gnc gnl 35S:SIG2
sig2-1 35S:YFP:GNL
35S:SIG2 Col-0
sig6-2 gnc gnl
gnc gnl 35S:SIG6
35S:SIG6 Col-0
sig6-2 35S:YFP:GNL
cs gnc gnl
cs 35S:YFP:GNL
gnc gnl glk1-1 glk2-1
glk1-1 glk2-1 35S:YFP:GNL
pif1-1 gnc gnl
pif1-1 35S:YFP:GNL
pi3-3 gnc gnl
pif3-3 35S:YFP:GNL
pifq 35S:YFP:GNL René Richter (unpublished)
35S:YFP:GNL Col-0 René Richter et al., 2010
35S:GNC:GFP Col-0 René Richter et al., 2010

18
Table 4: List of primers used for cloning.
Name Sequence 5' - 3' Construct
pGNL:GNL:HA attB1 Fw
GGGGACAAGTTTGTACAAAAAAGCAGGCTCATAAAAATTTGAACATGTGGT pGNL:GNL:
HA pGNL:GNL:HA attB2 Rv
GGGGACCACTTTGTACAAGAAAGCTGGGTTACACCCGTGAACCATTCCGT
GR Fw AAAAGGCGCGCCATACGACCCAACCGATGCCCTTGGAATTGAC
35S:GNC:YFP:HA:GR
GR Rv AAAAGGCGCGCCTCATTTTTGATGAAACAGAAGCTTTTTG
pEarleyGate 101 mutation PCR to introduce GR
GATTACGCTTATGGCGCGCCATTAAGACCCGGG
35S:GUN2 attB1 Fw
GGGGACAAGTTTGTACAAAAAAGCAGGCTCAATGGCGTATTTAGCTCCGATT
35S:GUN2 35S:GUN2 attB2 Rv
GGGGACCACTTTGTACAAGAAAGCTGGGTCTCAGGACAATATGAGACGAAGTATC
35S:GUN4 attB1 Fw
GGGGACAAGTTTGTACAAAAAAGCAGGCTCAATGGCGACCACAAACTCT
35S:GUN4 35S:GUN4 attB2 Rv
GGGGACCACTTTGTACAAGAAAGCTGGGTCTCAGAAGCTGTAATTTGTTTTAAAC
35S:GUN5 attB1 Fw
GGGGACAAGTTTGTACAAAAAAGCAGGCTCAATGGCTTCGCTTGTGTATTCTC
35S:GUN5 35S:GUN5 attB2 Rv
GGGGACCACTTTGTACAAGAAAGCTGGGTCTTATCGATCGATCCCTTCGATC
35S:SIG2 attB1 Fw
GGGGACAAGTTTGTACAAAAAAGCAGGCTCAATGTCTTCTTGTCTTCTTCCTCAGT
35S:SIG2 35S:SIG2 attB2 Rv
GGGGACCACTTTGTACAAGAAAGCTGGGTCTTATGATTGTGCAACCAAGTATTG
35S:SIG6 attB1 Fw
GGGGACAAGTTTGTACAAAAAAGCAGGCTCAATGGAAGCTACGAGGAACTTGGT
35S:SIG6 35S:SIG6 attB2 Rv
GGGGACCACTTTGTACAAGAAAGCTGGGTCCTAGACAAGCAAATCAGCATAAGCA
35S:DVR attB1 Fw
GGGGACAAGTTTGTACAAAAAAGCAGGCTCAATGTCACTTTGCTCTTCCTTCAA
35S:DVR 35S:DVR attB2 Rv
GGGGACCACTTTGTACAAGAAAGCTGGGTCCTAGAAGAACTGTTCACCGAGTTCT

19
Table 5: List of primers used for genotyping.
Name Sequence 5' - 3' T-DNA Allele
LBb1.3 ATTTTGCCGATTTCGGAAC SALK
GABI (08409)
ATATTGACCATCATACTCATTGC GABI
gnc LP TTTGATCTTGCACTTTTTGGC gnc
gnc RP GCCAAGATGTTTGTGGCTAAC LBb1.3
gnl LP TATCTGATGGTGGTTCATCATCAAG gnl
gnl RP ATGCTAGATCATCGAAATAGATATTG LBb1.3
gun2-1 dCAPS Fw
CGAGATTCCAGAACCAACAG gun2-1
gun2-1 dCAPS Rv
GATGTTGTAGAAGTGACAAATGAATGCTC
gun4-1 Fw ACTCTCTCCACCACCACCAC gun4-1
gun4-1 Rv AGATCTTCGGGGGAGATTGT
gun5-1 Fw ACCAACCGGTAAAAACATGCATG gun5-1
gun5-1 Rv CTCACACCAATCATCCAAAGAAC
cch-1 Fw GAGGCTGCTTTTCTCCAAGTCAGCAAGTCTTC
cch-1
cch-1 Rv CAAAATGAAGAACAGC
cs Fw ACCGAGCAGGACAAGC cs
cs Rv GTCTATGATTTGAAGTTTG
sig6-2 Fw TGTCACATGCGTTAAGAGACG sig6-2
sig6-2 Rv CTTATCCCCATAGCTTCAGCC GABI
glk1-1 wt Fw GAAGAAAGAGACTTAC
glk1-1
glk1-1 wt Rv GCTCTGGTGTCCAATC
glk1-1 mutant Fw
CGGGATCCGACACTCTTTAATTAACTGACACTC
glk1-1 mutant Rv
AACTGCAGGTTACTGATCCGATTGTTCTT
glk2-1 wt Fw CGATTACTACGACGATC
glk2-1
glk2-1 wt Rv CGTGGCATGTCTCCGG
glk2-1 mutant Fw
GTTTTGGCCGACACTCCTTACC
glk2-1 mutant Rv
TCCGATGTGACCTATATTTC
pif1-1 LP CTCTTTTGGATCTTTCTGGGG pif1-1
pif1-1 RP GACTTGCGCACGATAGCTAAC LBb1.3
pif3-3 wt Fw AGAAGCAATTTGGTCACCATGCTC
pif3-3 pif3-3 wt Rv TGCATACAAATAGTCGATCGTATG
pif3-3 del Fw GGTGTGTATGTGAGAAGGTACATCCATCG
pif3-3 del Rv AAGCTTAGCTTTGGTGAGCCTGAAAAGCTC

20
Table 6: List of primers used for qRT-PCR.
Name Sequence 5' - 3'
qRT GNC Fw GCGTGATTAGGGTTTGTTCG
qRT GNC Rv CTTTGCCGTATACCACATGC
qRT GNL Fw CCATATCTCCCAACCTCTCG
qRT GNL Rv TGGGCACCATTTGATCACT
qRT GUN2 Fw TCCTGGAGAATCAAAGGGTTT
qRT GUN2 Rv GTGTTCTTGAACTCGGCAT
qRT GUN4 Fw ACTTCTCTTTCCCTCAAACAACC
qRT GUN4 Rv GCTGTATCCGAATCTACCATCAC
qRT GUN5 Fw CAACCAAACCAGCCAAATCT
qRT GUN5 Rv AGAGATTGCACGGCTTCACT
qRT CHLI1 Fw CCGGCGAGGTTTATCT
qRT CHLI1 Rv TTTGTAAGTGTCACGGAAAT
qRT CHLI2 Fw TCTTGACCTGCCCTCG
qRT CHLI2 Rv GCAGCAAACGGATAAACA
qRT CHLD Fw CTATGGCCGACAGTTTTTCC
qRT CHLD Rv GCGCCAAGTAAAAGAGCAGT
qRT GLK1 Fw CCGGTAGACTTACATCCGTCA
qRT GLK1 Rv CATGGCCTCGTCAATACATCT
qRT GLK2 Fw AACGTTGCTAGCCATCTTCAG
qRT GLK2 Rv CTCCTACTCCGGGCACTG
qRT DVR Fw AGCAGCGTTTATAGCGGATT
qRT DVR Rv CTCCTTGCTCTAATGGCGTT
qRT SIG2 Fw CGATGGTCCTTCCACTGAG
qRT SIG2 Rv CTGCTTCATCGCTTGTGAGA
qRT SIG6 Fw AATCGTGGACTCAACTTTCAGG
qRT SIG6 Rv ACTTTTCATTAGCCCCATGC
qRT PIF1 Fw AGAAGCCACCACTACTGATGA
qRT PIF1 Rv TGAAGGAAGGAGGAGGAATAG
qRT PIF3 Fw GACGACTATGGTGGACGAGAT
qRT PIF3 Rv CGTAGCAGAAGCAACAGACTC
qRT CAO Fw AACTCAAGAACTCTGCAGCTGAT
qRT CAO Rv CAAGCTTCTCACGCATCTCA
qRT CRD1 Fw AACTCAAGAACTCTGCAGCTGAT
qRT CRD1 Rv CAAGCTTCTCACGCATCTCA
qRT HEMA1 Fw AACTCAAGAACTCTGCAGCTGAT
qRT HEMA1 Rv CAAGCTTCTCACGCATCTCA
qRT LHCB1.3 Fw ATGGCCGCCTCAACAATGG
qRT LHCB1.3 Rv CGGTAAGGTAGCTGGGTGAC
qRT 25R1 Fw GAACTTTGAAGGCCGAAGAG
qRT 25R1 Rv ATCGACTAACCCATGTGCAA

21
qRT ACT8 Fw GCAGCATGAAGATTAAGGTCGTG
qRT ACT8 Rv TGTGGACAATGCCTGGACCTGCT
Table 7: List of primers used for ChIP qRT-PCRs.
Name Sequence 5' - 3'
ChIP GNC N17 Fw GGGTTGTTGTTCGTGATGGTTTT
ChIP GNC N18 Rv TTGGACTCTTTTTGCCGTCT
ChIP GNL N43 Fw ACTTGTGTTTTGGGGTCGTC
ChIP GNL N44 Rv CCTTGTCAAACTGTGGAGGA
ChIP GUN2 set-1 Fw TTCATTCACCCTCTCATCGTT
ChIP GUN2 set-1 Rv GCAATGTAGTTTTAGTTGGCTTGA
ChIP GUN2 set-2 Fw GCAACACTCAACGCACTGTC
ChIP GUN2 set-2 Rv TTGAATTTTTAAATAGGCGAAAA
ChIP GUN4 set-1 Fw CCTGAGCCATAAGTGACCAA
ChIP GUN4 set-1 Rv GTGGTGGTGGTGGAGAGAGT
ChIP GUN4 set-2 Fw GGGCCTATTTATACGCCAATG
ChIP GUN4 set-2 Rv CGTCATTTCTCTCGTTATCGTT
ChIP GUN4 set-3 Fw CGATAACGAGAGAAATGACGTAGA
ChIP GUN4 set-3 Rv TGGCTCAGGTTTGATTTTCTC
ChIP GUN4 set-3 Fw CGATAACGAGAGAAATGACGTAGA
ChIP GUN4 set-3 Rv TGGCTCAGGTTTGATTTTCTC
ChIP GUN5 set-1 Fw ATGGGATGCAGACCAAGTGT
ChIP GUN5 set-1 Rv TGGTTTTGCTCTTGTTGGTG
ChIP GUN5 set-3 Fw CATCTCATTGTCCCAAGC
ChIP GUN5 set-3 Rv ACTCCAAGCCTTCATCTGGA
ChIP GUN5 set-6 Fw CTCCCACTTGGAGCTCAAAAAGT
ChIP GUN5 set-6 Rv CGGAGGAAAGAATGTTTGGT
ChIP GUN5 set-7 Fw TTGAAACATGATAAGTTTTTACATCCA
ChIP GUN5 set-7 Rv TTTTGGTTCAGCTAGGTCTGG
ChIP CHLD set-2 Fw TGTGGATAGTGCTGCAATCA
ChIP CHLD set-2 Rv CGAAAGAGTCTGCAGGTTGA
ChIP GLK1 set-4 Fw GGGTACACCCGCCTCAATAG
ChIP GLK1 set-4 Rv TAACATCGATCAATCTTCACTT
ChIP GLK1 set-5 Fw CGACAAGAGATGGTTGCGACG
ChIP GLK1 set-5 Rv TCGTTGAAGAAGCGTTCATG
ChIP GLK2 set-1 Fw CATGTCAGTATCCACCAACACA
ChIP GLK2 set-1 Rv ATGAGTACTGGAGCCGGAGA
ChIP SIG2 set-1 Fw AGGCCCAAAAGAAGTGGAAA
ChIP SIG2 set-1 Rv GCGGATGATGAAGACGAAGA
ChIP SIG2 set-2 Fw AGCCATTTTAAGATGTACAACAGCA
ChIP SIG2 set-2 Rv TTTGCAAAGTCAACCCATATGTAA

22
ChIP SIG6 set-1 Fw GGAGGGAGAAGAAGATGATTCG
ChIP SIG6 set-1 Rv GTGGATCATGTTGGGCCTTA
ChIP SIG6 set-2 Fw TTCCATGGCAACAAACAAGT
ChIP SIG6 set-2 Rv TGACGAACAGATAAGGCGACA
ChIP DVR set-2 Fw CGCCGTACATCTGTTCGTTA
ChIP DVR set-2 Rv GGTGAAATTCGGTGGGAGTT
ChIP DVR set-3 Fw CGGTACAGGTTTTTGTCTTCTT
ChIP DVR set-3 Rv CCCCAATACTTTATCAATGGTG
ChIP GATA17 set-2 Fw CTGTTGCTACTAACCGC
ChIP GATA17 set-2 Rv CGCTGCTACTGCAGTTCTCG
2.2 Methods
2.2.1 Seed sterilization and growth conditions
For all experiments presented in this thesis, the sterilization of the seeds was
performed by rotating the seeds for 12 min in 1 ml solution of calcium
hypochloride followed by four washes with autoclaved H2O. Sterilized seeds were
placed on GM plates (growth medium plates) consisting of 4.3 g/l Murashige and
Skoog Medium, 10 g/l Saccharose, 0.5 g/l MES, 5.5 g/l Plant-agar, pH 5.8).
Seeds were stratified for 3-d in the dark and at 4°C. Young seedlings and adult
plants were grown under constant white light (120 μmol m-2 s-1), unless stated
otherwise.
2.2.2 Transformation of Arabidopsis plants
To introduce transgenes to Arabidopsis, Agrobacterium tumefaciens was used
with the floral dip method as described (Clough and Bent, 1998).
2.2.3 DNA extraction from Arabidopsis tissues
Plant tissue was isolated and ground in extraction buffer (250 mM NaCl, 200 mM
Tris/HCl [pH 7.5], 25 mM EDTA [pH 8.0], 0.5% SDS). Then the homogenized
material was incubated for 25 min at 65°C and subsequently mixed with 300 µl
phenol/chloroform (1:1) and centrifuged at 16,000 g for 10 min at 21°C in order to
separate hydrophobic and hydrophilic phases. Approximately 350 μl from the
upper phase was taken, mixed with 700 μl isopropanol, and centrifuged at 16,000
g for 10 min at 4°C. Next, the supernatant was discarded and the nucleic acid

23
pellet mixed with 500 μl 70% ethanol and centrifuged at 16,000 g for 5 min at 4°C.
After that, the supernatant was discarded and the nucleic acid pellet dried in a
speed-vac at 30°C for 10 min. Finally, the pellet was dissolved in ultrapure
autoclaved water.
2.2.4 Genotyping PCR
The identification of mutant lines was performed by PCR using specific primers as
listed in Table 5. The PCR mix used for the genotyping consisted of 2.5 μl
10xPCR reaction buffer (200mM Tris/HCl [pH 8.4], 25mM MgCl2 and 500mM
KCl), 2.5 μl mix of dNTPs (100mM dATP, 100mM dTTP, 100mM dGTP and
100mM dCTP), 1.0 μl mix of forward and reverse primer (final concentration 10
μM each), 0.2 μl DNA Taq-polymerase, 16.8 μl ultrapure autoclaved water, and
2.0 μl genomic DNA. The conditions used in the thermo cycler for the genotyping
PCR were: Step 1: 94°C for 4 min, Step 2: 94°C for 1 min, Step 3: 58°C for 0:30
min, Step 4: 72°C for 1 min/1000 bp PCR product, repeat step 2 to 4 for 32 times,
Step 5: 72°C for 6 min. The PCR products were visualized afterwards in agarose
gels using staining by ethidium bromide.
2.2.5 RNA extraction
For RNA extraction from Arabidopsis tissue, the NucleiSpin RNA kit (Macherey-
Nagel, Düren, Germany) was used. The extraction was performed as indicated in
the manual of the kit, with a minor modification at the elution step: Instead of 60 μl
RNAase-free H2O, RNA was eluted with 25 μl RNAse-free H2O. Subsequently,
the concentration of each sample was measured with the Nanodrop
spectrophotometer (ThermoScientific, Waltham, MA). 2 μg RNA was reverse-
transcribed using 0.5 μl oligo-dT-primer (20 μM, sequence:
TTTTTTTTTTTTTTTTTTTTVN), 4 μl RT-buffer, 2 μl mix of dNTPs (100 mM
dATP, 100 mM dTTP, 100 mM dGTP and 100 mM dCTP), 2 μl (40 U) M-MuLV
reverse transcriptase (ThermoScientific, Waltham, MA) and filled up to 20 μl with
ultrapure autoclaved water. The conditions used in the thermo cycler for the cDNA
synthesis were: Step 1: 37°C for 60 min and 10 min, Step 2: 70°C for 10 min.

24
2.2.6 Real time qRT-PCR
The quantification, either of transcript abundance or of DNA bound in the ChIP
experiments was performed by quantitative real time PCR (qRT-PCR) in a CFX96
thermocycler (BioRad, Freiburg, Germany). The total volume of the reaction was
10 μl and all gradients were used according to the protocol of the SsoAdvanced™
Universal SYBR® Green Supermix (BioRad, Freiburg, Germany). The conditions
for the qRT-PCR for gene expression were: step 1: 50°C for 2:00 min, step 2:
95°C for 3:00 min, step 3: 95°C for 0:15 min, step 4: 60°C for 0:40 min. Steps 3 to
4 were repeated 32 times followed by 95°C for 0:10 min. The expression of all
genes tested in this thesis was normalized to ACT8 except the experiment with
norflurazon treated seedlings, where 25R1 was used for the normalization. The
conditions for the qRT-PCR to quantify ChIP binding events were: (1) 50°C for
2:00 min, (2) 95°C for 3:00 min, (3) 95°C for 0:15 min, (4) 60°C for 1 min. Steps 3
to 4 were repeated 35 to 40 times followed by 95°C for 0:10 min. The primers
used for the Real time qRT-PCR are listed in Table 6.
2.2.7 Cloning of pGNL:GNL:HA gnc gnl
To generate pGNL:GNL:HA, a 2.3 kb GNL promoter fragment, and the GNL
genomic sequence was amplified as one fragment by PCR. Subsequently, the
PCR product was inserted in pDONR207 with a BP reaction, followed by an LR
reaction using the destination vector pEarleyGate-301 (Earley et al. 2006). The
final clone was transformed into the Agrobacterium tumefaciens strain GV3101
pMP90 and subsequently transformed to the gnc gnl double mutant plants using
the floral dip method (Clough and Bent, 1998). The primers used for this cloning
are listed in Table 4.
2.2.8 Cloning of overexpression lines of GUN2, GUN4, GUN5, DVR, SIG2,
SIG6, GLK1
For the cloning of the overexpression lines, the corresponding gene fragments
were amplified with PCR using cDNA as template. Next, they were cloned by a
BP-reaction to the pDONR201 vector and subsequently via LR-reaction to the
pAligator-N2 destination vector (Bensmihen et al. 2004). The final destination

25
clone was transformed to Agrobacterium tumefaciens strain GV3101 pMP90 and,
using the floral dip method, into the gnc gnl double mutant and wt plants (Clough
and Bent, 1998). The primers used for this cloning are listed in Table 4.
2.2.9 Cloning of 35S:GNC:YFP:HA:GR and 35S:GNL:YFP:HA:GR
To obtain 35S:GNC:YFP:HA:GR and 35S:GNL:YFP:HA:GR, an AscI restriction
site was introduced after the HA sequence of the vectors 35S:GNC:YFP:HA and
35S:GNL:YFP:HA. AscI is a non-cutter enzyme for these particular vectors. Next,
the ligand binding domain of the GR (GLUCOCORTICOID RECEPTOR) was
amplified from the vector pTA7002 (Aoyama and Chua 1997) using primers
including the AscI restriction site. The GR fragment was then introduced as an
AscI site into the modified 35S:GNC:YFP and 35S:GNL:YFP:HA vectors to obtain
35S:GNC:YFP:HA:GR and 35S:GNL:YFP:HA:GR. The final vector was
transformed to Agrobacterium tumefaciens strain GV3101 pMP90 followed by
transformation into the gnc gnl double mutant with the floral dip method (Clough
and Bent, 1998). The primers used for this cloning are listed in Table 4.
2.2.10 Chromatin immunoprecipitation (ChIP)
For ChIP experiments with pGNL:GNL:HA gnc gnl, seedlings were grown on GM
plates for 10-d under long-day conditions (16 h light (120 μmol m-2 s-1) / 8 h dark).
Subsequently, plant tissue from pGNL:GNL:HA gnc gnl and gnc gnl seedlings
was fixed in 1% formaldehyde for 20 min. The rest of the ChIP experiment was
performed as previously described (Kaufmann et al., 2010). A ChIP-grade anti-HA
tag (Abcam, Cambridge, UK) was used for the immunoprecipitation of chromatin.
Three independent biological replicates were used for the pGNL:GNL:HA gnc gnl
seedlings and two independent biological replicates were used for the gnc gnl
double mutant seedlings (negative controls). Each biological replicate consisted of
approximately 2 g seedling tissue.
The ChIP experiment with 35S:GNL:YFP:HA:GR gnc gnl seedlings was
conducted with 10-d-old seedlings, grown on GM plates under constant white
light. At day 10, a 4 h treatment with 10 μM Dex (dexamethasone) and mock was
applied, followed by fixation in 1% formaldehyde for 20 min. The rest of the ChIP

26
experiment was performed as previously described (Kaufmann et al., 2010). A
GFP-TRAP®A (Chromotek, Planegg-Martinsried, Germany) antibody conjugated
to agarose beads was used for ChIP. Three independent biological replicates
were used for the Dex-treated and the mock (negative control) samples. Each
biological replicate consisted of 2 g seedlings. The primers used for the ChIP
qRT-PCR are listed in Table 7.
2.2.11 Next generation sequencing library preparation
The DNA derived from the pGNL:GNL:HA gnc gnl and 35S:GNL:YFP:HA:GR gnc
gnl ChIP samples was used to produce libraries compatible with the Illumina
GAIIx and MiSeq (San Diego, CA) platform, respectively. The standard Illumina
protocol was followed for that purpose. The preparation of the library for the
pGNL:GNL:HA gnc gnl ChIP was performed in the Department of Molecular
Biology at the Max Planck Institute for Developmental Biology, Tübingen,
Germany by Dr. David Posé from the group of Dr. Markus Schmid.
2.2.12 ChIP-seq analysis
The reads derived from each of the ChIP experiments were mapped to
Arabidopsis genome (TAIR10) using SOAPv1 with the settings: 3 mismatches,
mapping to unique positions only, no gaps allowed and iterative trimming set from
41 to 50 (Li et al. 2008). The further downstream analysis of peak identification
was conducted with CSAR, which calculates the false discovery rate (FDR)
threshold for the read-enriched regions (Muiño et al. 2011). Only those with FDR
< 0.05 and score > 7 were retained as statistically significant peaks. Association
of the peaks to the gene models was performed by using the function
‘genesWithPeaks’ of the CSAR software. For the de novo motif discovery, a de
novo regulatory motif search was used based on a Gibbs sampling method from
1000 bp upstream and downstream regions from the genes (Thijs et al. 2001;
Thijs et al. 2002). This method identifies over-represented motifs. The motifs were
sampled to the Arabidopsis background model, which was created from the input
set of sequences from the Arabidopsis thaliana genome. The sampler was set to

27
run over 100 iterations using default settings for all other parameters (Claeys et
al. 2012). The motifs were ranked using the consensus score [2+plog(p)].
The total number of statistically significant annotated peaks (n = 3615) was used
as an input for the de novo motif detection. To this end, sequences around the
summit of each peak were extracted and subsequently grouped according to the
annotations of the summit of the peak (e.g., 5'-UTR, exon, intron, 3'-UTR and
intragenic regions). The total number of sequences which were used in this
analysis, according to their annotation category were 172 (5'-UTR), 99 (3'-UTR),
409 (exon), 263 (intron) and 1519 (intragenic). Next, the identified motifs were
sorted according to their log likelihood (L.L) and subsequently for each annotated
category (genetic element). Finally, the top 10 overrepresented motifs were
selected (Table 8). All of these selected motifs were used as a query to search for
closely related motifs in the JASPAR database for transcription factor binding
sites (Table 8).
2.2.13 Dex (Dexamethasone) and CHX (cycloheximide) treatments for RNA-
seq experiments
Seedlings were grown under constant white light on GM plates for 10-d. On day
10, half of them were transferred to liquid GM with 10 μM CHX (mock) and the
other half to liquid GM with 10 μM Dex and 10 μM CHX. The treatments were
continued for three more hours and then the samples were frozen in liquid
nitrogen and subsequently ground with a TissueLyser II (Qiagen, Hilden,
Germany). Total RNA extraction was performed using the NucleoSpin RNA-kit
(Macherey-Nagel, Düren, Germany). Three independent biological replicates
were used for each of the experimental groups. Next, the samples from both
groups were further used in order to create libraries for the sequencing followed
the standard Illumina protocol for the Illumina HiSeq 1000 sequencing platform at
the Kompetenzzentrum Fluoreszente Bioanalytik, Regensburg, Germany by Dr.
Thomas Stempfl.

28
2.2.14 RNA-seq analysis
The reads produced from the sequencing were mapped to the Arabidopsis
genome (TAIR10) using the Genomic Workbench software (CLC bioinformatics)
with allowance of two miss-matches for the reads during the mapping. The
differentially expressed genes were identified using the same software with the
thresholds for the differentially expressed genes set to FDR < 0.01 and fold
changes ≥ 1.2 for the 35S:GNL:YFP:HA:GR gnc gnl experiment and FDR < 0.01
and fold changes ≥ 2.45 for the 35S:GNC:YFP:HA:GR gnc gnl experiment and ≥
1.5 for the 35S:GNL:YFP:HA:GR gnc gnl experiment. The reason for using
different thresholds for the two RNA-seq experiments was that the experiment
with 35S:GNL:YFP:HA:GR showed large variation among the different biological
replicates of each group. This led to the increased p-values and subsequently
fewer differentially expressed genes.
2.2.15 HPLC for tetrapyrroles and carotenoids
Tetrapyrroles and carotenoids were extracted from approximately 60 mg aerial
part of 10-d-old light-grown seedlings. The frozen tissue was homogenized in a
Retsch mill using steal beads and porphyrins were extracted with acetone:0.2M
NH4OH (9:1, v/v) at −20°C for 1 h. It followed centrifugation (16,000 g for 10 min
at 4°C) and subsequently the supernatant was used to determine tetrapyrroles
and carotenoids. Heme was extracted from the pellet using acetone:HCl:dimethyl
sulfoxide (10:0.5:2, v/v/v). The HPLC analysis for the tetrapyrroles and the
carotenoids was performed as described in Schlicke et al. 2014 and Kim et al.
2013.
2.2.16 Chlorophyll quantification
Chlorophyll measurements were conducted as described previously by using 7-d-
old seedlings grown under constant white light, unless stated otherwise (Moran
1982).

29
2.2.17 Dipyridyl treatment
Seedlings were grown under constant white light for 6-d and then placed in liquid
GM with 1 mM DP (dipyridyl) (Sigma-Aldrich, Taufkirchen, Germany), which
inhibits the first step of the heme pathway. The relative transcript levels of GNC
and GNL were quantified 24 h after the treatment with DP. RNA extraction, cDNA
synthesis, and qRT-PCR were performed as described above.
2.2.18 Cytokinin treatment
Seedlings were grown on GM plates for 10-d under constant white light. At day
10, half of the seedlings were transferred to liquid GM with 10 μM 6-BA and the
other half to liquid GM (mock). Seedlings were frozen in liquid nitrogen and
ground with a TissueLyser II (Qiagen, Hilden, Germany). RNA extraction, cDNA
synthesis, and qRT-PCR were performed as described above.
2.2.19 Photobleaching experiment
To assess the greening rate of seedlings growing for various days in the dark,
prior to 2-d exposure to constant white light, seedlings were initially grown in the
dark for 0, 5 and 7-d and each of these groups was then exposed to constant
white light for 2-d. The greening rate was determined as the fraction of seedlings
with green cotyledons after the 2-d period growing under the light.
2.2.20 Quantification of protochlorophyllide
Germination of the seeds was promoted by exposure to light for 6 h and seedlings
were then left growing on GM plates for 6 more days in the dark. Extraction of the
pigments was performed from frozen tissue ground with the TissueLyser II
(Qiagen, Hilden, Germany). The powder was dissolved in 1 ml ice-cold 80%
acetone followed by agitation for 1 h at 4°C in the dark. Following centrifugation at
14,000 g for 10 min, fluorescence emission spectra were measured with a
fluorescence spectrophotometer (TECAN-infinite 200 PRO, Crailsheim, Germany)
after excitation at 440 nm and 5 nm band width between 600 nm and 800 nm.

30
2.2.21 Norflurazon treatment
Seedlings were grown for 7-d on GM medium with 5 μM NF (Norflurazon) (Sigma-
Aldrich, Taufkirchen, Germany) and mock, under constant white light (300 μmol
m-2 s-1). RNA extraction, cDNA synthesis and qRT-PCR were performed as
described above.
2.2.22 Quantification of the assimilation of CO2
Plants were grown under long day conditions (16 h light / 8 h dark) for 7 weeks.
Then, the assimilation of CO2 was measured by the LiCor 6400XT under the
conditions of 500 µE light intensity, 22°C and 400 ppm CO2 or 100 ppm CO2,
respectively. Plants were allowed to adapt to the conditions, before the
measurement was started.
2.2.23 Chlorophyll fluorescence measurements in the Imaging-PAM
Seedlings were grown for 7-d under long day conditions (8h/16h). Measurements
were made in an Imaging PAM M-series Maxi version, (Walz, Effeltrich,
Germany), at each seedling, two distinct parts of the hypocotyls were measured,
the first one right below the cotyledons (apical), the second one right above the
root-hypocotyl junction (distal). Intensity of chlorophyll fluorescence of the lower
hypocotyl part was often below the detection limit. The effective photochemical
quantum yield of photosystem II (Y(II)) was determined after adaptation to
150 µE, which was reached after 7 min.

31
3. Results - Systems biology approaches for the identification of GNC and GNL targets
3.1 Identification of the direct target genes of GNC and GNL with an
important role in greening
3.1.1 Expression analysis of existing microarray datasets suggests the
implication of B-GATAs in chlorophyll biosynthesis and chloroplast
development
To have a look at the genes, which play an important role in chlorophyll
biosynthesis and chloroplast development that may be regulated by the B-GATAs,
a gene expression analysis was performed with existing microarray data of
GNCox (35S:GNC:GFP) and GNLox (35S:YFP:GNL) Arabidopsis seedlings, all
compared to the Col-0 (wild-type) (Richter et al. 2010).
In regard to the tetrapyrrole pathway, 25 genes were found to be differentially
regulated in GNCox seedlings (22 upregulated, 3 downregulated) and 26 genes in
GNLox (23 upregulated, 3 downregulated) (Figure 6A). Specifically, in the
chlorophyll biosynthesis branch of the tetrapyrrole pathway, 9 genes were
differentially expressed in GNCox seedlings (8 upregulated, 1 downregulated),
and 8 in GNLox all upregulated (Figure 6A). Then the expression of genes was
examined encoding for proteins of the chloroplast protein import machinery. 19
genes in GNCox as well as 19 genes in GNLox were found to be upregulated
(Figure 6B). Genes with a role in chloroplast division were also upregulated in the
overexpression lines of GNC (6 genes) and GNL (7 genes) (Figure 6C). In
conclusion, the overexpression of the B-GATAs GNC and GNL affected the
expression of genes with roles in the tetrapyrrole and specifically the chlorophyll
pathway, the protein import machinery of the chloroplasts and the mechanism of
the chloroplast division.

32
Figure 6: Transcriptome analysis with existing microarray data of GNCox (35S:GNC:GFP versus wt) and GNLox (35S:YFP:GNL versus wt). (A) Model of the tetrapyrrole pathway. (B) Model of the chloroplast import apparatus. (C) Model of the chloroplast division mechanism. Genes with a role in each step of each pathway are depicted with italics and grey letters. Blue arrowheads show genes differentially expressed in the GNCox microarrays, green arrowheads show genes differentially expressed in the GNLox microarrays; upregulation of a gene is depicted by an upward pointing arrowhead, while an arrowhead facing downward depicts downregulation of a gene. Fold change expression values are presented in Appendix Table 9.
33
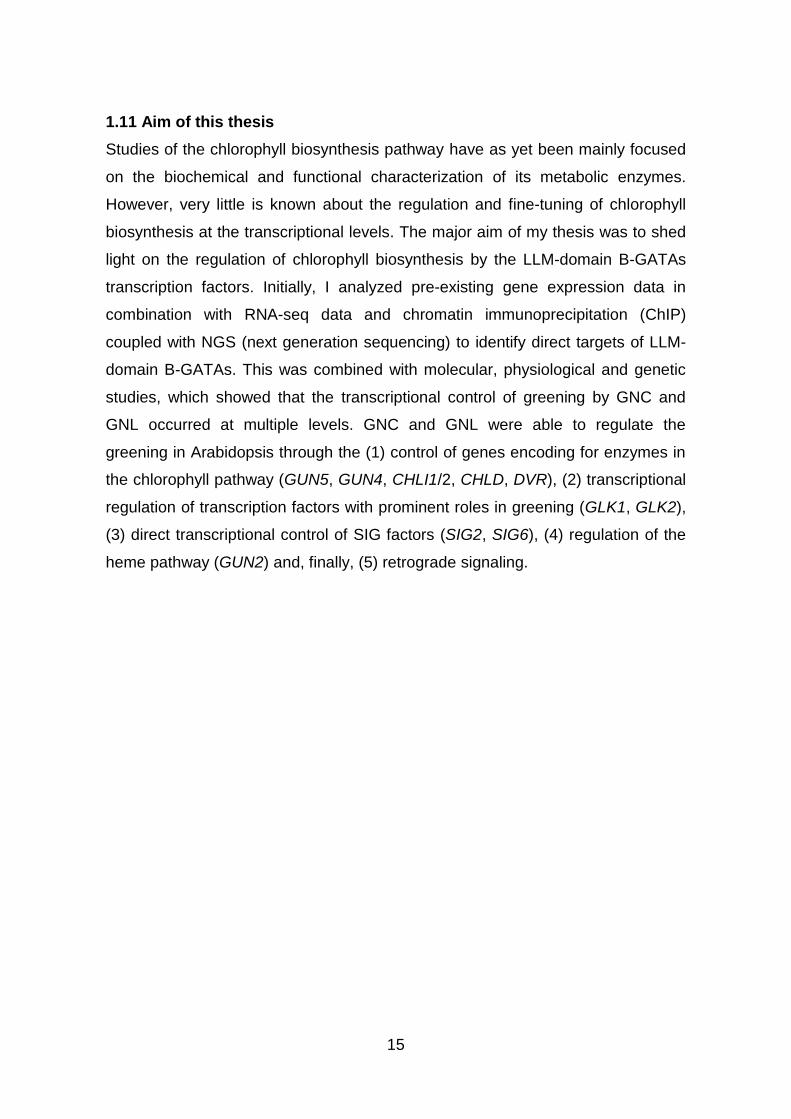
3.1.2 The B-GATAs GNC and GNL are essential for the synthesis of
chlorophyll intermediates
To better understand if the transcriptional regulation of chlorophyll biosynthesis
pathway genes has an effect on the synthesis of chlorophyll intermediates, a high-
performance liquid chromatography (HPLC) was performed with 10-d-old light-
grown wt and gnc gnl double mutant seedlings by Dr. Boris Hedtke from the lab of
Prof. Dr. Bernhard Grimm. The chlorophyll intermediates quantified by HPLC were
Mg-protoIX (Mg-protoporphyrin IX), MME (Mg-protoporphyrin IX 13-monomethyl
ester), Pchlide (protochlorophyllide) and Chlide (chlorophyllide), Chl a (chlorophyll
a) and Chl b (chlorophyll b). All of the measured chlorophyll intermediates were
reduced in gnc gnl double mutant compared to wt (Figure 7). These results
showed that B-GATAs GNC and GNL strongly contributed to the production of the
proper levels of some chlorophyll intermediates.
Figure 7: The levels of chlorophyll intermediates are reduced in the gnc gnl double mutant as determined by HPLC. Schematic representation of the chlorophyll biosynthesis pathway. Intermediates with red color were quantified by HPLC analysis in 10-d-old light-grown seedlings. Bar diagrams display the levels of chlorophyll intermediates. Genes with a role in each step of the pathway are depicted with italics and grey letters. Student’s t-test: *P< 0.05, **P <
0.01, ***P < 0.001; n.s., not significant.
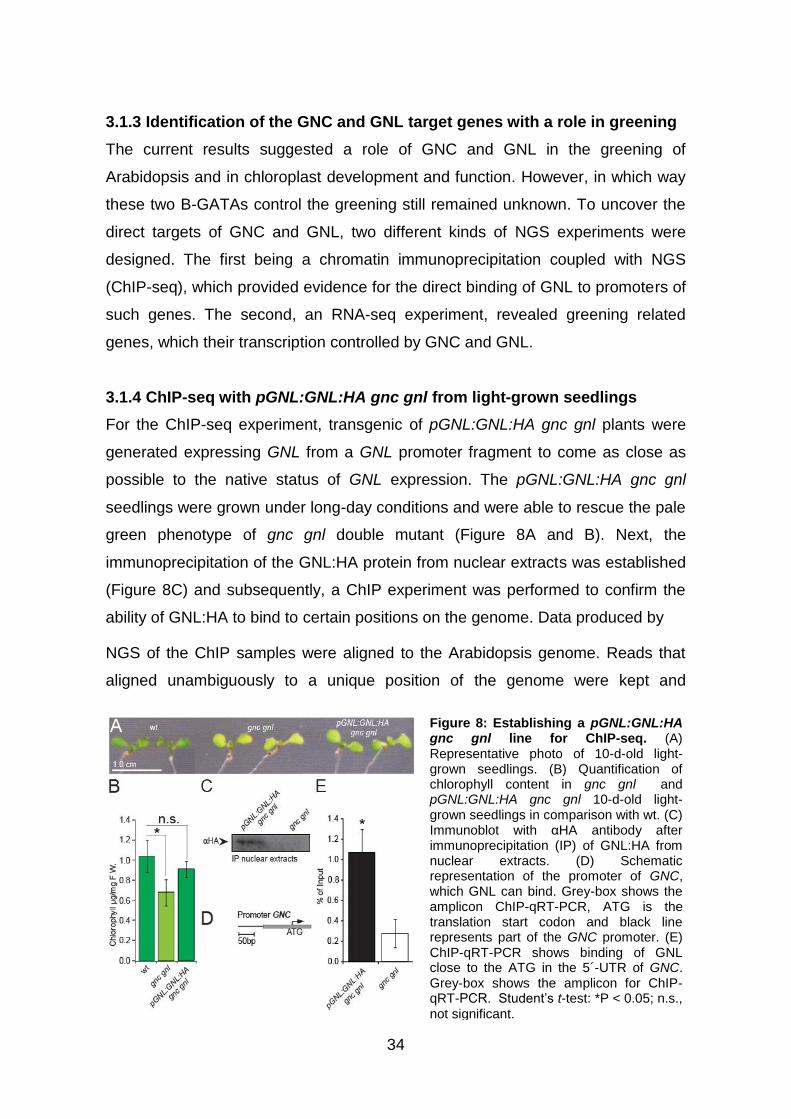
34
3.1.3 Identification of the GNC and GNL target genes with a role in greening
The current results suggested a role of GNC and GNL in the greening of
Arabidopsis and in chloroplast development and function. However, in which way
these two B-GATAs control the greening still remained unknown. To uncover the
direct targets of GNC and GNL, two different kinds of NGS experiments were
designed. The first being a chromatin immunoprecipitation coupled with NGS
(ChIP-seq), which provided evidence for the direct binding of GNL to promoters of
such genes. The second, an RNA-seq experiment, revealed greening related
genes, which their transcription controlled by GNC and GNL.
3.1.4 ChIP-seq with pGNL:GNL:HA gnc gnl from light-grown seedlings
For the ChIP-seq experiment, transgenic of pGNL:GNL:HA gnc gnl plants were
generated expressing GNL from a GNL promoter fragment to come as close as
possible to the native status of GNL expression. The pGNL:GNL:HA gnc gnl
seedlings were grown under long-day conditions and were able to rescue the pale
green phenotype of gnc gnl double mutant (Figure 8A and B). Next, the
immunoprecipitation of the GNL:HA protein from nuclear extracts was established
(Figure 8C) and subsequently, a ChIP experiment was performed to confirm the
ability of GNL:HA to bind to certain positions on the genome. Data produced by
NGS of the ChIP samples were aligned to the Arabidopsis genome. Reads that
aligned unambiguously to a unique position of the genome were kept and
Figure 8: Establishing a pGNL:GNL:HA gnc gnl line for ChIP-seq. (A) Representative photo of 10-d-old light-grown seedlings. (B) Quantification of chlorophyll content in gnc gnl and pGNL:GNL:HA gnc gnl 10-d-old light-grown seedlings in comparison with wt. (C) Immunoblot with αHA antibody after immunoprecipitation (IP) of GNL:HA from nuclear extracts. (D) Schematic representation of the promoter of GNC, which GNL can bind. Grey-box shows the amplicon ChIP-qRT-PCR, ATG is the translation start codon and black line represents part of the GNC promoter. (E) ChIP-qRT-PCR shows binding of GNL close to the ATG in the 5´-UTR of GNC. Grey-box shows the amplicon for ChIP-qRT-PCR. Student’s t-test: *P < 0.05; n.s.,
not significant.

35
subjected to further analysis.
Subsequently, regions with a statistically significant accumulation of reads
obtained with pGNL:GNL:HA gnc gnl compared to gnc gnl were identified. In
total, 3598 peaks with different annotations were found (p < 0.005 and FDR <
0.05). The total number of unique peaks was 1969 (this number referred to peaks
with no annotation assigned to them), derived from all different sets of analysis (6
sets in total).
3.1.5 GNL binds not only to promoters but also to exonic and intronic
regions of genes
To investigate the preferred binding sites of GNL in regard to the corresponding
gene models, the distribution of the strong peaks was further examined. This
particular part of the ChIP-seq analysis was performed by Dr. Manuel Spannagl in
collaboration with the group of Prof. Dr. Klaus Mayer using a custom-made Java
script.
Figure 9: GNL:HA mostly binds to promoter and exonic regions. Distribution of peaks summits (A) with unique annotations or (B) multiple annotations (C) in different version of
GATA-boxes among the gene elements.

36
Since GNL is a GATA transcription factor, a subsequent step in the ChIP-seq
analysis was the quantification of GATA-boxes (W-GATA-R with W as A/T and R
as A/G) in the different genetic elements. For all 1969 unique peak-summits, a
sequence equal to the length of the peaks was extracted and analyzed for W-
GATA-R motifs. Among all of the examined GATA boxes, the prevailing GATA-
boxes were A-GATA-A and T-GATA-A. These GATA-boxes were strongly
overrepresented in the promoter regions, found moderately in exons, introns and
downstream regions and less frequently in 5´-UTRs and 3´-UTRs (Figure 9). In
summary, this analysis revealed that GNL has a strong preference for binding
mostly to promoter and exonic regions of genes. Furthermore, the typical GATA-
boxes were found to be overrepresented in these regions.
3.1.6 De novo motif discovery supports the previous finding of the
preference of GNL to bind to GATA-boxes
To further investigate the binding preference of GNL to certain motifs, a de-novo
motif discovery was conducted with the data from the ChIP-seq experiment.
Analysis was done with the web-based-tools MEME (http://meme-
suite.org/tools/meme-chip) and RSAT (http://floresta.eead.csic. es/rsat/).
Unfortunately, these efforts did not yield any reasonable result, probably due to
the overrepresentation of GATA-motifs in the Arabidopsis genome. To solve this
problem, a different method was performed by Dr. Manuel Spannagl and Dr.
Sapna Sharma from the group of Prof. Dr. Klaus Mayer using a custom-made
analysis pipeline as described in Materials and Methods section. Derivatives of
the GATA-boxes belonging to the family of GATA proteins, of either
Saccharomyces cerevisiae or Mus musculus, in the intronic, exonic and intragenic
regions showed some of the most highly ranked over-represented motifs.
Additionally, some versions of binding motifs of Arabidopsis MADS, MYB and
LEAFY transcription factors were among the top ranked overrepresented motifs
(Table 8).
From the results of the de novo motif discovery, two basic conclusions could be
derived. First, no hints of the family of GATA proteins were seen, neither from

37
Table 8: De novo motif discovery for the ChIP-seq of GNL:HA.
Arabidopsis nor from the plant kingdom in general. This was probably because of
the lack of the respective data (e.g., from ChIP-seq experiments) with this
particular protein family in the JASPAR database. Second, the discovery of
binding boxes for MADS, MYB and LEAFY transcription factors, which may be an
indication that GNL can potentially interact with transcription factors from these
families to co-regulate gene expression.

38
3.1.7 Cross-regulation between the B-GATAs GNC, GNL and GATA17
Some of the strongest peaks identified by ChIP-seq were linked to the GNC, GNL
and GATA17 genes (Figure 10). It was noticeable that there were also strong
peaks not only on the promoters of these genes but also in the regions inside the
genes. The fact that these binding events were true binding positions and not a
result of a putative DNA contamination were supported by the fact that: there
were no reads mapped to the corresponding regions of the negative control
sample gnc gnl (Figure 10) and a varying number of GATA-box (W-GATA-R)
motifs was found in almost all of these peaks (Figure 10).
To further verify the authenticity of these peaks from the ChIP-seq, independent
ChIP experiments were conducted. For all three genes, GNL:HA was shown to
bind to their promoters, particularly to regions in close proximity to the
transcription start site (TSS) (Figure 10). In conclusion, the ChIP-seq experiment
and additional independent ChIPs showed that GNL was not only able to directly
bind its own promoter but also to the promoters of the two other B-GATAs GNC
Figure 10: ChIP-seq reveals a cross-regulation between B-GATAs. (A, C, E) ChIP-seq peaks for GNC, GNL and GATA17 genes. Different colored arrowheads represent various GATA boxes. Punctuated lines underneath the peaks represent the amplicon amplified by ChIP-qRT-PCR. (B, D, F) Independent verification of the binding of GNL:HA to the promoters of GNC, GNL and GATA17 genes. Student’s t-test: *P <
0.05; **P < 0.01.

39
and GATA17. Peak-binding positions of GNL were also detected inside the GNL,
GNC and GATA17 genes. These peaks would need to be further verified by
independent ChIPs, but this was not one of the goals of this thesis.
3.1.8 Generation of inducible translational fusion variants of GNC and GNL
for RNA-seq experiments
The ChIP-seq gave a good overview of the binding sites of GNL:HA in the
genome of Arabidopsis. The binding of a transcription factor to a certain position
in a gene can lead to at least three different scenarios: (1) direct regulation of the
nearby gene, (2) regulation of the gene only in the presence of additional partner-
protein(s), and (3) no transcriptional regulation at all. To find out, which of the
binding events of GNL:HA (found in the ChIP-seq) led to direct differential
expression of genes, RNA-seq experiments were performed.
To this end, transgenic plants of 35S:GNC:YFP:HA:GR gnc gnl and
35S:GNL:YFP:HA:GR gnc gnl were generated and used for the RNA-seq
experiment (Figure 11). The advantage of using the glucocorticoid receptor-
domain (GR) fused with GNC and GNL proteins was that the GR-fused proteins
could be sent to the nucleus in a controllable manner after Dex application (Huq
et al. 2003).
Figure 11: 35S:GNC:YFP:HA:GR gnc gnl and 35S:GNL:YFP:HA:GR gnc gnl lines for RNA-seq. (A-B) Representative confocal microscopy images of the root of 35S:GNC:YFP:HA:GR gnc gnl and 35S:GNL:YFP:HA:GR gnc gnl 7-d-old light-grown seedlings localizing the GNC:YFP:HA:GR and the GNL:YFP:HA:GR proteins to the nucleus after a 45 min application of Dex. Red arrowheads indicate the position of a single nucleus. (C-D) Representative photos of 10-d-old light-grown seedlings growing on Dex and mock medium. Black arrowheads show greening of the hypocotyl in Dex-treated seedlings.

40
To test the functionality of these Dex-inducible transgenic lines, 7-d-old light-
grown seedlings were treated with Dex for 45 min. After but not before the Dex
application, YFP signal was detected in the nucleus (Figure 11A and B). In line
with this, 7-d-old 35:GNC:HA:YFP:GR gnc gnl and 35S:GNL:HA:YFP:GR gnc gnl
seedlings grown on 10 μM Dex medium showed enhanced greening of the
hypocotyl, which is an established phenotype for GNCox and GNLox lines (Figure
11C and D). Taken together, these results showed that the transgenic plants
successfully translocated the GR translational fusion to the nucleus and that the
movement of the proteins was able to induce one of the known GNCox and
GNLox phenotypes, rendering these plants suitable for the subsequent RNA-seq
experiments.
3.1.9 Identification of the differentially expressed genes after induction of
Dex and CHX of 35S:GNC:YFP:HA:GR gnc gnl and 35S:GNL:YFP:HA:GR gnc
gnl seedlings.
Since the transgenic 35:GNC:YFP:HA:GR gnc gnl and 35:GNL:YFP:HA:GR gnc
gnl plants were functional, RNA-seq experiments were performed in order to
initially identify the differentially expressed genes. For the purpose of the RNA-
seq, in addition to Dex, CHX (cycloheximide) was also used. CHX is an inhibitor of
protein synthesis and the simultaneous application with Dex should result in the
identification of direct targets of the GATAs, without the interference of newly
synthesized proteins. Therefore, 10-d-old light-grown 35:GNC:YFP:HA:GR gnc
gnl and 35:GNL:YFP:HA:GR gnc gnl seedlings were treated at the end of day 10
for 3 h with 10 μM Dex and 10 μM CHX, followed by RNA extraction and NGS
sequencing and analysis of the samples. The RNA-seq analysis showed that
Figure 12: GLU1, a known target of B-GATAs, is upregulated in the RNA-seq experiments with GNC and GNL. Expression values in RPKM (reads per kilobase of transcript per million mapped reads) for GLU1 from the RNA-seq of GNC (A) and GNL (B) after 3 h treatment with Dex and CHX. Student’s t-test: *P < 0.05, **P < 0.01, ***P < 0.001.

41
4323 genes (3288 upregulated and 1035 downregulated) were differentially
expressed for the experiment with 35:GNC:YFP:HA:GR gnc gnl (data were filtered
using 2.45 fold change threshold and false discovery rate < 0.01), and only 60
genes (38 upregulated and 22 downregulated) were found for the experiment with
35S:GNL:YFP:HA:GR gnc gnl (data were filtered using 1.2 fold change threshold
and false discovery rate < 0.1). In both experiments, the GLU1 (GLUTAMATE
SYNTHASE 1) gene was upregulated (Figure 12). This was a good indication that
both experiments were successful since GLU1 had been reported to be directly
regulated by GNC and GNL in a previous study (Hudson et al. 2011).
Since, GNC and GNL have redundant functions, observing a discrepancy in the
total number of differentially expressed genes was unexpected.
Figure 13: PCA (principal component analysis) between the different biological replicates of
the RNA-seq experiments with 35S:GNC:YFP:HA:GR gnc gnl (A) and 35S:GNL:YFP:HA:GR
gnc gnl (B).
To understand this, a PCA (principal component analysis) was performed for both
RNA-seq experiments. In the case of 35S:GNC:YFP:HA:GR gnc gnl, the different
biological replicates between the two different experimental groups (dots with
green and red color) clustered well together (Figure 13A), indicating very low
variance between each one of these groups. In the case of 35S:GNL:YFP:HA:GR

42
gnc gnl, the different biological replicates for the two different experimental groups
clustered together, but not in a uniform way (Figure 13B). In conclusion, on the
one hand, the RNA-seq for 35S:GNC:YFP:HA:GR gnc gnl seedlings revealed that
GNC was able to directly control the transcription of 4323 genes. On the other
hand, the RNA-seq for 35S:GNL:YFP:HA:GR gnc gnl showed that the variation
among the different biological replicates was very high. This made the expression
values for the majority of the genes to have p-values and false discovery rate
values above acceptable thresholds (false discovery rate < 0.1) and, therefore,
only 60 genes were found to be differentially expressed in the experiment with
35S:GNL:YFP:HA:GR gnc gnl under the acceptable thresholds.
3.1.10 Genes related to chlorophyll biosynthesis, regulation of greening,
chloroplast import machinery, photosynthesis and the chloroplast division
apparatus are strongly upregulated in the RNA-seq experiments
To shed more light on the influence of B-GATAs GNC and GNL on greening, the
rest of the RNA-seq analysis focused particularly on genes related to greening
and chloroplast biology (Figure 14A). Four genes of the tetrapyrrole pathway were
found to be differentially regulated by GNC (3 upregulated and 1 downregulated)
but none after GNL induction (Figure 14A). In the chlorophyll biosynthesis
pathway, 13 genes were differentially expressed (all upregulated) after GNC and
only one, GUN5, was upregulated by GNL (Figure 14A). Two genes were found to
be differentially expressed after the GNC induction in heme branch, FC2 and
GUN2 but none after GNL induction (Figure 14A). Genes encoding for known
regulators of the chlorophyll biosynthesis pathway such as GLK2, SIG2, SIG6,
PIF1 and PIF3 were also strongly induced by GNC (Figure 14B). The mechanism
controlling the import of proteins from the cytosol to the chloroplast was found to
be transcriptionally controlled by GNC. In particular, nine genes encoding for
proteins of this mechanism were differentially expressed in GNC after the
treatment with Dex and CHX (8 upregulated and 1 downregulated) but not by
GNL (Figure 14C). It was also investigated how genes related to the chloroplast
division machinery were affected transcriptionally by GNC and GNL after
treatment with Dex and CHX.

43

44
Figure 14: Contribution of the B-GATAs GNC and GNL to the transcriptional regulation of genes related to the tetrapyrrole pathway, greening regulators, chloroplast import apparatus, chloroplast division machinery and photosynthesis. Combined results from the RNA-seq and ChIP-seq analysis. (A) Schematic representation of the tetrapyrrole pathway. (B) Greening regulators. (C) Schematic representation of the chloroplast protein import apparatus. (D) Schematic representation of the chloroplast division machinery. (E) Schematic representation of the photosynthesis machinery. Red arrowheads show genes differentially expressed in the RNA-seq with the 35S:GNC:YFP:HA:GR gnc gnl, blue arrowheads show genes differentially expressed in the RNA-seq with the 35S:GNL:YFP:HA:GR gnc gnl. Upregulation is depicted by upward pointing arrowheads, arrowheads facing downward depict downregulation. Green asterisks depict genes that were found in the ChIP-seq with pGNL:GNL:HA gnc gnl. Fold change expression values are presented in Appendix Table 9.
Three genes were found to be differentially regulated by GNC (2 upregulated and
1 downregulated) and none by GNL (Figure 14D). Lastly, focusing on the genes
with a role in photosynthesis, 47 were found to be differentially expressed (46
upregulated and 1 downregulated) by GNC, and just one by GNL (Figure 14E).
The 47 genes controlled by GNC contributed to different compound of the
photosynthetic mechanism such as photosystems, the electron chain and the
Calvin cycle, and were not restricted preferentially to one or the other
compartment (Figure 14E). Taken together, these findings suggested that the B-
GATAs GNC and GNL were able to promote greening at many different levels
such as chlorophyll biosynthesis, chloroplast development and photosynthesis. It
was very striking that the transcriptional regulation of chlorophyll biosynthesis
enzymes was strongly linked to GNC. From a total of 16 genes, encoding for
chlorophyll biosynthesis enzymes, 13 were strongly induced by GNC (Figure
14A).
3.1.11 The overlap between ChIP-seq and RNA-seq shows that GNC and
GNL directly regulate the expression of genes with a prominent role in
greening
On the one hand, the ChIP-seq experiment provided information about genes that
GNL can bind. On the other hand, the RNA-seq experiment showed, which genes
can be regulated directly by GNC and GNL. To examine if the ChIP-seq and the
RNA-seq experiments have genes in common, the list of the 3615 peaks (from
the ChIP-seq) was compared to the list of differential expressed genes from the
RNA-seq experiments. From 4323 GNC- dependent differentially expressed
genes, 674 were at the same time targets of GNL in the ChIP-seq

45
Figure 15: Overlaps between the ChIP-seq with pGNL:GNL:HA gnc gnl and the RNA-seq with (A) 35S:GNC:YFP:HA gnc gnl and (B) 35S:GNL:YFP:HA gnc gnl reveal putative target genes of GNL:HA, which at the same time are differentially expressed by the B-GATAs GNC and GNL.
(Figure 15A and Appendix Table 10). Similarly, 13 out of the 61 differentially
expressed GNL-dependent genes were at the same time targets of GNL in ChIP-
seq (Figure 15B and Appendix Table 11).
The next question was how many genes, from the previous comparisons, were
related to greening. The overlap of the RNA-seq for GNC with ChIP-seq for GNL
showed six genes, which were directly related to greening (Appendix Table 12).
Additionally, the overlap of the RNA-seq for GNL with ChIP-seq for GNL, showed
that only one gene, GUN5, was in common (Appendix Table 13).
In summary, the overlap between the ChIP-seq and the RNA-seq revealed direct
targets of the B-GATAs GNC and GNL. Some of these genes were related to
greening. Noteworthy to mention is the fact that GUN5 appeared as a common
gene in both overlaps of GNC and GNL. GUN5 potentially one out of many
common targets, which GNC and GNL can regulate in order to promote greening.
3.1.12 The combination of the results from the high-throughput experiments
points to five major and distinct areas where later research for the role of B-
GATAs in greening should be focus on
The analysis of the pre-existing microarray data sets of GNCox and GNLox,
together with the recent NGS experiments, ChIP-seq and RNA-seq, showed that
B-GATAs GNC and GNL had pivotal roles in the greening of Arabidopsis. Taken

46
into account the overall results, it was decided and planned to further investigate
the contribution of B-GATAs in greening into five different levels: (1) the
chlorophyll biosynthesis pathway, (2) the heme pathway, (3) transcription factors
known to control greening, (4) regulators of transcription in the chloroplasts and
(5) retrograde signaling. To better understand the ways, in which the B-GATAs
control greening through these five different levels, additional experimental
approaches were needed. For this reason, were designed and performed genetic,
physiological and molecular experiments.
4. Results - Physiological and genetic studies for the validation of GNC and GNL targets
4.1 GNL and GNC promote chlorophyll biosynthesis through the
upregulation of Mg-chelatase subunits
GNC and GNL seem to control the chlorophyll pathway in a redundant manner.
MgCh (Mg-chelatase) is a multi-complex enzyme, which plays a role in the first
step of chlorophyll biosynthesis. It consists of three different subunits,
GUN5/CHLH, CHLD and CHLI and each one of these plays a specific role in the
insertion of Mg2+ into the Proto-IX substrate (Tanaka & Tanaka 2007). To
understand the relationship between B-GATAs and MgCh, experiments with
genes encoding for each subunit of the MgCh complex were conducted.
4.1.1 GUN5/CHLH expression is regulated by B-GATAs
GUN5 is the catalytic subunit of the MgCh, which adjuncts Mg2+ to Proto-IX
(protoporphyrin–IX) (Adhikari et al. 2009). In the NGS experiments, GUN5 was
found to be a target of GNL in the ChIP-seq and was upregulated in the RNA-seq
(Figure 16A and Appendix Table 9). To test if GNL was able to bind to GUN5,
independent ChIP experiments were performed with light-grown seedlings of
pGNL:GNL:HA gnc gnl. It verified not only that GNL binds in the position identified
by ChIP-seq (Figure16A, B and F) but also that there were at least two additional
binding sites for GNL in the GUN5 promoter (Figure 16C and E). Since the
binding site of GNL, as predicted by ChIP-seq, was located in the first exon of
GUN5, further tests were performed to determine if this was a true binding. Thus,

47
an additional ChIP with light-grown 35S:GNL:YFP:HA:GR gnc gnl seedlings after
4 h Dex treatment was conducted. The results of this experiment verified the
binding of GNL to the particular position in the first exon of GUN5 (Figure 16G).

48
Figure 16: The expression of GUN5 is directly regulated by the B-GATAs GNC and GNL. (A) Identified peaks from the ChIP-seq with the pGNL:GNL:HA gnc gnl transgenic line and gnc gnl double mutant associated with the GUN5 gene. The blue line corresponds to the ChIP of GNL:HA, and the red line corresponds to the ChIP of the gnc gnl double mutant. Colored arrowheads depict different variants of GATA motifs where GNL:HA potentially can bind. (B) Gene model of GUN5. Red stars show locations of GATA boxes; grey boxes represent regions tested by qRT-PCR through independent ChIP experiments, testing the binding of the GNL:HA. Yellow boxes depict the first intron of the GUN5 gene and punctuated lines mark the first and the second exon of GUN5. (C-F) Results from the ChIP-qRT-PCRs of independent ChIP experiment with the pGNL:GNL:HA gnc gnl transgenic line and gnc gnl double mutant. The amplicons of each qRT-PCR correspond to the regions on the GUN5 gene designated as set 1, 3, 6 and 7. (G) Results from the ChIP-qRT-PCRs of the independent ChIP experiment with the 35S:GNL:YFP:HA:GR gnc gnl transgenic line with Dex treatment. The amplicon amplified by the qRT-PCR corresponds to the region on the GUN5, designated as set-1. (H) Relative transcript levels of the GUN5 gene in 6-d-old dark-grown seedlings, followed by light exposures for 0, 6 and 12 h. The data shown are the averages and standard errors of one biological replicate with three technical replicates. (I) Results from Mg-proto-IX HPLC analysis of 10-d-old light-grown seedlings. The black asterisks represent a statistically significant difference between wt, gun5, GNLox and gun5 GNLox seedlings; red asterisks represent a statistically significant difference between the gun5 and gun5 GNLox seedlings. Mg-proto-IX levels of gnc gnl and gun5 gnc gnl seedlings were not detectable. Student’s t-test: *P < 0.05, **P < 0.01, ***P < 0.001; n.s., not significant.
The direct binding of GNL to GUN5 should lead to the transcriptional regulation of
GUN5. This was tested next with independent qRT-PCR experiments. Since
GNC, GNL and GUN5 are light-regulated genes, it was decided to grow seedlings
in the dark for 6-d and then expose them to light for 6 and 12 h. In the gnc gnl
double mutant, the expression of GUN5 was reduced compared to the wt (Figure
16H). In the GNCox seedlings, a strong upregulation of GUN5 was observed after
6 and 12 h of light exposure (Figure 16H). The GNLox seedlings showed a strong
increase in GUN5 expression only after 12 h of light exposure (Figure 16H).
To further investigate the impact of the transcriptional regulation of GUN5 by GNL
and GNC, an HPLC experiment was performed to assess the levels of the Mg-
proto-IX, the product of the MgCh enzymatic activity, by Dr. Boris Hedtke from the
laboratory of Prof. Dr. Bernhard Grimm. Mg-proto-IX was severely reduced in the
gnc gnl and gun5 gnc gnl seedlings compared to wt, but was increased in GNLox
and even further in gun5 GNLox seedlings (Figure 16I).
To examine the genetic relationship between GNL and GUN5, several genetic
crosses were performed. The triple mutant of gun5 gnc gnl did not show any
difference in greening compared to gnc gnl (Fig. 17A and D). On the other side,
gun5 GNLox seedlings displayed a significant increase in chlorophyll compared to

49
the gun5 mutant (Figure 17B and D). Further, overexpression of GUN5 in the gnc
gnl background was not able to increase chlorophyll (Figure 17C and 17E).
Figure 17: GNL is able to at least partially induce greening in the gun5 mutant. (A-C, F-G) Representative photographs of 7-d-old light-grown seedlings. (D-E, I-J) Chlorophyll quantification in 7-d-old light-grown seedlings. (H) Representative photographs of 20-d-old adult plants. (K) Chlorophyll quantification of adult plants. Student’s t-test: *P < 0.05, **P < 0.01, ***P < 0.001; n.s., not significant.
gun5 is a weak allele of GUN5. Therefore, the experiments were repeated with
cch1, which is a stronger allele regarding the greening phenotype. cch1 is paler
than the gnc gnl double mutant and the triple mutant of cch1 gnc gnl had far less
chlorophyll than the gnc gnl mutant, but slightly higher levels than cch1 (Figure
17F and I). The cch1 GNLox seedlings showed an increase in chlorophyll levels
compared to the cch1 mutant, but they were not equal to the levels detected in
GNLox seedlings (Figure 17G and J).
To investigate if the chlorophyll levels changed as the plants became older,
chlorophyll levels from rosette leaves of 20-d-old and 38-d-old adult plants were
quantified. cch1 GNLox adult plants showed rescue of the greening phenotype of
the cch1 mutant (Figure 17H and K). That meant that the pattern shown in 7-d-old

50
seedlings was maintained also in adult plants. Taken together, these findings
suggested that the results from the NGS experiments were, indeed, true. GNL
binds to the promoter of GUN5 and can regulate its expression. Additionally,
genetic experiments showed that GNLox was able to compensate, at least
partially, the chlorophyll reduction, which was caused by the cch1 mutation in the
GUN5 protein. This could mean that the upregulation of the mutant GUN5 gene,
which carries a proline to leuchine substitution mutation, may suppress the
greening defect in the cch1 GNLox seedlings.
4.1.2 CHLD expression is regulated by B-GATAs
CHLD subunit together with the CHLI subunit facilitate the ATP-dependent
metalation of the Proto-IX substrate (Adhikari et al. 2009). CHLD was found to be
targeted by GNL in the ChIP-seq experiment (Figure 18A) but CHLD was not
differentially regulated in the RNA-seq, neither of 35S:GNC:YFP:HA:GR gnc gnl
nor of 35S:GNL:YFP:HA:GR gnc gnl (Figure 14 and Appendix Table 9). An
independent ChIP with pGNL:GNL:HA gnc gnl seedlings verified the results from
the ChIP-seq (Figure 18B and C). A qRT-PCR experiment with 6-d-old dark-
grown seedlings showed that CHLD was less strongly induced after light
treatment in gnc gnl compared to the wt (Figure 18D). Additionally, GNCox and
GNLox showed stronger induction following illumination (Figure 18D).
Figure 18: CHLD expression is regulated by GNL. (A) Identified peaks from the ChIP-seq with the pGNL:GNL:HA gnc gnl transgenic line and gnc gnl double mutant associated in the CHLD gene. The blue line corresponds to the ChIP of GNL:HA and the red line corresponds to the ChIP

51
of the gnc gnl double mutant. Colored arrowheads depict different variants of GATA motifs where GNL:HA can potentially bind. (B) Schematic representation of the CHLD promoter. Red stars show locations of GATA boxes; grey boxes represent regions tested by qRT-PCR through ChIP. (C) Results from the ChIP-qRT-PCR analysis of the ChIP experiment with the pGNL:GNL:HA gnc gnl transgenic line and the gnc gnl double mutant. The amplicons of each ChIP-qRT-PCR correspond to the regions with the grey boxes on the CHLD promoter designated as set-1, -2, -3. (D) Relative transcript levels of the CHLD gene in 6-d-old dark-grown seedlings, followed by light exposure for 0, 6 and 12 h. The data shown are the averages and standard errors one biological replicate with three technical replicates. Student's t-test: *P < 0.05.
No viable mutants for the CHLD gene were available when this research was
performed. Thus, it was not possible to plan and conduct any kind of genetic
experiments with CHLD. In conclusion, CHLD, may be directly transcriptionally
regulated by the B-GATAs GNC and GNL.
4.1.3 CHLI expression is regulated by B-GATAs
CHLI, has an AAA-type ATPase activity and catalyzes the ATP-dependent
hydrolysis, which is required for the insertion of Mg2+ into Proto-IX (Kobayashi et
al. 2008). In Arabidopsis, CHLI is encoded by two isoforms, CHLI1 and CHLI2,
which share similar ATPase activity and expression profiles but CHLI1 protein
seems to have a more prominent role in the MgCh complex (Kobayashi et al.
2008). The ChIP-seq with GNL did not reveal any binding to the promoter of
CHLI1 or CHLI2. Though, the RNA-seq of GNC showed that both isoforms were
strongly upregulated after GATA induction (Figure 14 and Appendix Table 9). An
additional qRT-PCR experiment showed that CHLI1 and CHLI2 were strongly
upregulated after the exposure to light in GNCox and GNLox seedlings, although
the induction of these genes was not compromised in the gnc gnl mutant (Figure
19A and B). Crosses were made to further study the genetic interaction between
a mutant of CHLI1 (cs or ch-42) with B-GATAs. The triple mutant of cs gnc gnl
showed chlorophyll levels similar to cs (Figure 19C and F). Several efforts were
made to generate cs GNLox, but the respective crosses did not succeed. Instead,
cs GNCox was successfully obtained and revealed increased chlorophyll levels
compared to cs supporting the notion that the GATAs may regulate CHLI1,
through upregulation of the mutated CHLI1 gene in the cs T-DNA insertion
mutant, or, more likely, through the compensatory upregulation of CHLI2 (Figure
19G).

52
Figure 19: GNC and GNL induce the expression of CHLI1 and CHLI2 and promote greening partially independently from CHLI. (A-B) Relative transcript levels of CHLI1 and CHLI2 in 6-d-old dark-grown seedlings following light exposures for 6 and 12 h. The data shown are the averages and standard errors of two ≥ biological replicates each one with four technical replicates. (C-D) Representative photographs of 7-d-old light-grown seedlings. (E) Representative photos of 20-d-old adult plants. (F-G) Results of the quantification of chlorophyll a and b of 7-d-old seedlings. Student’s t-test: **P < 0.01, ***P < 0.001; n.s., not significant.
4.1.4 GUN4 is transcriptionally controlled by GNC and GNL
GUN4 does not belong to the enzymatic complex of MgCh but plays a role in the
association of the enzymatic complex to the chloroplast membranes (Adhikari et
al. 2011). Additionally, GUN4 can activate MgCh by its interaction with the
GUN5/CHLH subunit (Larkin et al. 2003). GUN4 was found to be strongly
upregulated in the RNA-seq with GNC (Figure 14 and Appendix 9). Nevertheless,
no binding by GNL to the GUN4 promoter was observed by ChIP-seq. A qRT-
PCR experiment with dark-grown seedlings after light exposure verified the
results from the RNA-seq, where GUN4 was shown to be markedly upregulated
following illumination (Figure 20A). This particular induction of GUN4 in GNLox
and GNCox seedlings led to further investigations with an independent ChIP

53
experiment in order to determine if GNL had any binding sites in the GUN4
promoter. Indeed, GNL bound to the GUN4 promoter at a position close to the
ATG start codon (Figure 20B and D). To further examine the relationship between
GNL and GUN4, crosses and overexpression lines of GUN4 in the wt and the gnc
gnl background were generated. The gun4 gnc gnl triple mutant showed
chlorophyll levels equal to the gun4 mutant, which had lower levels of chlorophyll
compared to the gnc gnl double mutant (Figure 21A and E). GNLox in the gun4
background slightly decreased chlorophyll levels compared to gun4 (Figure 21B,
D and F). Lastly, though gnc gnl GUN4ox showed similar chlorophyll levels
compared to the wt, chlorophyll levels were reduced in gnc gnl GUN4ox when
compared to GUN4ox in the wt background (Figure 21C and G).
Figure 20: GNL and GNC induce the expression of GUN4. (A) Relative transcript levels of GUN4 in 6-d-old dark-grown seedlings followed by light exposure for 0, 6 and 12 h. The data shown are the averages and standard errors one biological replicate with four technical replicates. (B) Schematic representation of the GUN4 promoter. The red stars show locations of GATA boxes; the grey boxes represent regions tested by qRT-PCR through a ChIP experiment to determine binding sites of the GNL:HA protein. (C-E) Results from the qRT-PCR analysis following a ChIP experiment with the pGNL:GNL:HA gnc gnl transgenic line and the gnc gnl double mutant. The amplicons of each ChIP-qRT-PCR correspond to the regions with the grey boxes on the GUN4 promoter, designated as set-1, -2, -3. Student’s t-test: *P < 0.05; n.s., not significant.

54
Figure 21: GNL functions upstream in the same pathway with GUN4. (A-C) Representative photographs of 7-d-old light-grown seedlings. (D) Representative photographs of 20-d-old adult plants. (E-G) Results of the quantification of chlorophyll a and b from 7-d-old seedlings. Student’s t-test: **P < 0.01, ***P < 0.001; n.s., not significant.
In conclusion, GUN4 expression is controlled by GNL, and GNL can directly bind
to the GUN4 promoter. Moreover, GNL is not even partially able to induce the
greening of seedlings in the absence of GUN4. This underlines the essential role
of GUN4 in the activation and further function of the MgCh enzymatic complex
and moreover places GUN4 downstream from GNC and GNL regarding greening.
4.1.5 DVR is a downstream target of B-GATAs in the chlorophyll
biosynthesis pathway
DVR reduces divinyl protochlorophyllide a or divinyl chlorophyllide to monovinyl
protochlorophyllide a or monovinyl chlorophyllide, upstream of the PORs
(PROTOCHLOROPHYLLIDE OXIDOREDUCTASES) (Figure 4) (Nagata et al.
2005). No binding of GNL to the promoter of DVR was detected by ChIP-seq. The
RNA-seq with GNC revealed that DVR expression was strongly upregulated after
GATA induction (Figure 14 and Appendix Table 9). Moreover, an independent
ChIP experiment with pGNL:GNL:HA gnc gnl seedlings revealed binding of GNL
to two different positions in the DVR promoter (Figure 22A - C). To test if these
binding events correlated with DVR gene regulation, a qRT-PCR was performed.
There, DVR induction, after light exposure, was compromised in gnc gnl seedlings
and enhanced in overexpression lines, at least in GNCox (Figure 22D).

55
Figure 22: DVR is a target downstream from GNC and GNL in the chlorophyll biosynthesis pathway. (A) Model of the DVR promoter. The red stars show locations of GATA boxes; the grey boxes represent regions tested by qRT-PCR after a ChIP experiment to determine binding sites of the GNL:HA protein. (B-C) Results from the qRT-PCR analysis of a ChIP experiment with the pGNL:GNL:HA gnc gnl transgenic line and the gnc gnl double mutant. The amplicons of each ChIP-qRT-PCR correspond to the regions with grey boxes on the promoter of the DVR gene, designated as set-1, -2, -3. (D) Relative DVR transcript levels in 6-d-old dark-grown seedlings followed by light exposure for 6 and 12 h. Data shown are the averages and standard errors of one biological replicate with four technical replicates. (E) Representative photographs of 7-d-old light-grown seedlings. (F) Results of the quantification of chlorophyll a and b of 7-d-old seedlings. (G) Relative transcript levels of GNL and GNC in 14-d-old light-grown wt and dvr mutant seedlings. Data shown are the averages and standard errors of 2 ≥ biological replicates. Student’s t-test: *P < 0.05, **P < 0.01; n.s., not significant.
To examine the genetic interaction between DVR with B-GATAs, it was
repeatedly but unsuccessfully attempted to perform genetic crosses between dvr
and gnc gnl or GNLox. In turn, a DVR overexpression transgene (DVRox) was
introduced in the wt and in the gnc gnl background. The overexpression of DVR in
wt seedlings displayed the same levels of chlorophyll as the wt (Figure 22E and
F). However, when DVR was overexpressed in the gnc gnl background, the
chlorophyll biosynthesis defect of the mutant was suppressed (Figure 22E and F).

56
These results showed that GNC and GNL function upstream of DVR in the
chlorophyll biosynthesis pathway and are able to control DVR expression and
bind to its promoter. Lastly, it was hypothesized that DVR can also potentially
influence the expression of GNC and GNL. A qRT-PCR experiment with dvr
mutant seedlings showed that the expression of GNC and GNL was markedly
elevated in the dvr mutant (Figure 22G). This could mean that DVR, possibly
indirectly, represses the expression of GNC and GNL as part of a negative
feedback loop, which controls the proper production of chlorophyll intermediates.
4.2 Control of the heme pathway
4.2.1 The heme pathway
When the tetrapyrrole pathway reaches the point of Proto-IX, it diverges to the
chlorophyll and to the heme biosynthesis branch (Figure 4). The heme branch
eventually leads to the synthesis of phytochromobilin, which together with the
PHY apoproteins, PHYA-PHYE in Arabidopsis, form the functional holo-
phytochromes. These phytochrome photoreceptors move to the nucleus after light
perception where they mediate the downstream light signal transduction through
the interaction with other nuclear localized proteins such as PIFs (Kohchi et al.
2001).
4.2.2 GUN2/HO1 is transcriptionally controlled mostly by B-GATAs
The synthesis of biliverdin-IXa through the oxidization of protoheme (heme) is the
second step in the heme pathway and catalyzed by the heme oxygenase
GUN2/HO1 (GENOMES UNCOUPLED 2/HEME OXYGENASE1) (Tanaka &
Tanaka 2007). Light-grown gun2 mutant seedlings have low levels of chlorophyll
and much longer hypocotyls compared to wt (Figure 24A and L). The ChIP-seq
with pGNL:GNL:HA gnc gnl seedlings did not reveal any binding of GNL to the
promoter of GUN2, but the RNA-seq for GNC showed strong induction of GUN2
after GATA induction (Figure 14 and Appendix Table 9). To determine if GNL is
able to bind to the GUN2 promoter, additional ChIP experiments were performed.

57
Figure 23: GNC and GNL strongly upregulate the expression of GUN2. (A) A model of the GUN2 promoter. The red stars show locations of GATA boxes; the grey boxes represent regions tested by qRT-PCR after ChIP, for the binding of GNL:HA. (B-C) Results from qRT-PCR analysis of the ChIP experiment with a pGNL:GNL:HA gnc gnl transgenic line and the gnc gnl double mutant. The amplicons of each ChIP-qRT-PCR correspond to the regions with grey boxes on the promoter of the GUN2 gene, designated as set-1, -2, -3. (D) Relative transcript levels of GUN2 in 6-d-old dark-grown seedlings exposed to the white light for 0, 6 and 12 h. Data shown are averages and standard errors of one biological replicate with three technical replicates. Student’s t-test: *P < 0.05, ***P < 0.001; n.s., not significant.
The ChIP with pGNL::GNL:HA gnc gnl seedlings showed that GNL was able to
bind to 2 different positions, in close proximity to the start codon in the GUN2
promoter (Figure 23A - C). A qRT-PCR with 6-d-old dark-grown seedlings
exposed for 0, 6 and 12 h to light, showed that GUN2 expression was slightly
lower in the gnc gnl seedlings but markedly higher in GNCox and GNLox
seedlings (Figure 23D).
To examine the genetic relationship between GUN2 and the B-GATAs, genetic
crosses were performed. The gun2 gnc gnl triple mutant showed slightly lower
levels of chlorophyll compared to the gun2 mutant (Figure 24A and E), indicating
that GUN2 and B-GATAs are in the same pathway with regard to chlorophyll
biosynthesis. Since this slight decrease in chlorophyll levels was seen in the triple
mutant, the possibility that B-GATAs can also affect the chlorophyll biosynthesis
independently from GUN2 cannot be excluded. To test this hypothesis, a genetic
cross between gun2 and GNLox was performed. The gun2 GNLox seedlings
showed a small but statistically significant increase in the chlorophyll content, and

58
Figure 24: GNL functions upstream in the same pathway with GUN2. (A-C) Representative photographs of 7-d-old light-grown seedlings. (D) Representative photographs of 20-d-old adult plants. (E-G) Results of the quantification of chlorophyll a and b in 7-d-old seedlings. (H) Results of the quantification of chlorophyll a and b in 20-d-old and 38-d-old adult plants. (I-K) Relative transcript levels of HO2, HO3 and HO4 in 7-d-old light grown seedlings. Data shown are averages and standard errors of ≥2 biological replicates. (L-M) Hypocotyl length in 7-d-old seedlings grown under constant white light (CWL) and under the dark. Student’s t-test: *P < 0.05, **P < 0.01, ***P < 0.001; n.s., not significant.
displayed prominent greening of their long hypocotyls, a feature completely
absents in the gun2 mutant (Figure 24B and F). That led to the hypothesis that
either GNL can induce greening through the heme pathway, by upregulating the
expression of other heme oxygenases (HO2, HO3 and HO4) participating in the
same step as GUN2 or the rescue of greening is actually the result of the
induction, which is caused by GNL in the chlorophyll branch. To test this, the
expression of HO2, HO3 and HO4 was measured in the gun2 GNLox seedlings.
The mRNAs levels of HO2 and HO3, but not HO4 were found strongly increased
in gun2 GNLox seedlings (Figure 24I-K), which can be interpreted as the cause of
the partially suppression of the greening defects of gun2. However, when
hypocotyl measurements were performed with gun2 GNLox light and dark grown
seedlings, the long hypocotyl phenotype of gun2 was not suppressed, as it would
59
be expected if GNL was able to induce the phytochrome pathway by the
upregulation of the heme oxygenases HO2 and HO3 (Figure 24L-M). In fact, the
hypocotyl length of the gun2 GNLox was longer compared to gun2 mutant, which
underlines further that the induction of greening in gun2 GNLox seedlings caused
by GNLox in phytochrome-independent manner. From these results was
concluded that the partial suppression of the greening defect in the gun2 GNLox
seedlings is because of the upregulation of chlorophyll pathway solely, which is
induced by GNLox.
When chlorophyll from adult plants was quantified, it was found that 20-d-old gun2
GNLox plants had chlorophyll levels identical to those of the gun2 mutant (Figure
24D and H). In even older plants, 38-d-old, chlorophyll levels were slightly
reduced compared to gun2 mutants (Figure 24D and H). Therefore, these results
suggested that GNL and GUN2 function in the same pathway regarding greening.
GNL is also able to promote greening in a GUN2-independent manner,
particularly in the hypocotyl.
To investigate further the genetic relationship between GUN2 and B-GATAs,
transgenic plants were generated overexpressing GUN2 in the wt and the gnc gnl
background. GUN2ox in the wt background showed chlorophyll levels slightly
higher than gnc gnl, but lower than wt (Figure 24G). GUN2ox in the gnc gnl
background showed chlorophyll content lower than the gnc gnl double mutant
(Figure 24G). In summary, it can be concluded that metabolites from the
chlorophyll branch can be diverted from the chlorophyll to heme branch when
GUN2 is in access, therefore reduce the overall chlorophyll levels.
4.2.3 Heme pathway can influence the expression of GNC and GNL
The heme pathway and its end product phytochromobilin are essential for the
proper function of phytochromes, which can affect the expression of many light-
regulated genes, including chlorophyll biosynthesis genes. GUN2ox in the gnc gnl
background displayed lower chlorophyll levels compared to gnc gnl (Figure 24C
and G). It was thus hypothesized that GUN2 might induce the expression of the
B-GATAs GNC and GNL and by doing so, promotes greening in the wt. To test
this, a qRT-PCR was performed with 7-d-old light-grown gun2 seedlings.

60
Figure 25: Heme pathway can influence the expression of B-GATAs GNC and GNL. (A-B) Relative transcript levels of GNC and GNL in 10-d-old light-grown seedlings. (C) Relative transcript levels of the GUN2 in GUN2ox transgenic line. (D-E) Relative transcript levels of GNC and GNL in 10-d-old light-grown seedlings. (F) Schematic representation of the heme pathway; the grey letters depict the enzymes in each step of the heme pathway. The DP (dipyridyl) is an inhibitor of the first step of the heme pathway. (G-H) Relative transcript levels of GNC and GNL in 7-d-old light-grown seedlings after a 24 h treatment with DP. For all qRT experiments, the data shown are the averages and standard errors of 2 ≥ biological replicates. Student’s t-test: *P < 0.05, **P < 0.01, ***P < 0.001; n.s., not significant.
GNC and GNL expression were found to be downregulated in gun2 mutant
seedlings (Figure 25A-B). To further verify these results, the expression of GNC
and GNL was measured in 10-d-old light-grown GUN2ox seedlings. It was found
that GNL but not GNC was significantly upregulated in GUN2ox seedlings (Figure
25C-E).
Furthermore, since GUN2 plays a role in the beginning of the heme pathway
(Figure 25F), it was hypothesized that any of the intermediates of this pathway
(heme, biliverdin IXa and phytochromobilin,) may affect the expression of GNC
and GNL. To this end, the expression of GNC and GNL was examined after a
treatment with DP (dipyridyl), an inhibitor of the first step of the heme pathway
(Figure 25F). A qRT-PCR was performed with 7-d-old seedlings, treated for 24 h
with DP. Both, GNC and GNL expression was found to be strongly reduced after
DP treatment (Figure 25G and H). These findings suggested that either one of the
heme intermediates indeed affected the expression of GNC and GNL or that any
change in the synthesis of functional phytochrome, which heme pathway
61
contributes, affects the expression of B-GATAs, which is light-regulated and
therefore depended from the phytochromes function.
4.3 PHYTOCHROME INTERACTING FACTORS (PIFs)
Apart from the essential role of PIFs in skotomorphogenesis, they also have a role
in the control of greening. The basic role of PIFs in chlorophyll biosynthesis is to
repress genes related to the chlorophyll branch in the dark (Liu et al. 2013). In this
way PIFs help plants to avoid the deleterious effects of photobleaching, which are
caused by the overaccumulation of chlorophyll intermediates in etiolated
seedlings followed by light exposure. Among the seven members of the PIF
protein family, only PIF1 and PIF3 have a direct role in chlorophyll biosynthesis
regulation (Moon et al. 2008; Monte et al. 2004; Huq et al. 2004).
4.3.1 B-GATAs GNC and GNL induce the expression of PIF1 and PIF3
To investigate the molecular relationship between B-GATAs and PIFs, the
expression of PIFs was initially examined in the RNA-seq experiments. Both PIF1
and PIF3 were strongly upregulated in the RNA-seq experiment for GNC after the
3 h treatment with Dex and CHX (Figure 14B and Appendix Table 9). To further
confirm this transcriptional regulation, additional qRT-PCR experiments were
performed. Because PIFs are light-unstable and mainly function in the dark, their
expression was initially tested in etiolated seedlings. GNCox but not GNLox was
found to induce the expression of PIF1 and PIF3 in dark-grown seedlings (Figure
26A). Though, the gnc gnl double mutant showed strong downregulation of PIF3
(Figure 26A). When seedlings were grown under constant white light, GNCox was
able to strongly induce the expression of PIF1 and PIF3 and GNLox slightly
increased the expression of PIF3 (Figure 26B). Moreover, gnc gnl seedlings
showed reduced expression levels of PIF3, compared to wt (Figure 26B). It was
thus concluded that B-GATAs are able to control the expression of PIF1 and PIF3
in dark-grown as well as in light-grown seedlings.

62
4.3.2 GNL regulates greening downstream of PIFs
The next step was to check the genetic relationship between GNL and PIFs.
Therefore, genetic crosses between pif1 (pif1-1), pif3 (pif3-1) and GNLox, were
performed. To further test the hypothesis that other PIF members, also function
Figure 26: GNC and GNL control the expression of PIF1 and PIF3 and function downstream of PIFs in the control of greening. (A) Relative transcript levels of PIF1 and PIF3 in 10-d-old etiolated seedlings. Data shown are averages and standard errors of ≥ three biological replicates with each one ≥ three technical replicates. (B) Relative transcript levels of PIF1 and PIF3 genes in 10-d-old light-grown seedlings. Data shown are averages and standard errors of ≥ three biological replicates with each one ≥ three technical replicates. (C-E) Representative photographs of 7-d-old light-grown seedlings. (F) Results of the quantification of chlorophyll a and b of 7-d-old seedlings; The black asterisks depict statistically significant differences between wt and the rest of the genotypes. The red asterisks depict statistically significant differences between mutants and corresponding genetic combinations. The blue asterisks depict statistically significant differences between GNLox and the other GNLox genotypes. Student’s t-test: *P < 0.05, **P < 0.01, ***P < 0.001; n.s., not significant.
downstream of GNL in the greening pathway, the chlorophyll levels of pifq (pif1
pif3 pif4 pif5) GNLox seedlings were quantified. This specific genotype had been
generated in our lab by Dr. Rene Richter for the needs of a previous study

63
(Klermund et al. 2016). Importantly, GNLox was able to strongly induce greening
in pif1, pif3 and pifq mutant backgrounds (Figure 26C-F). These results proposed
that GNL is able to regulate greening downstream of PIFs.
4.3.3 The B-GATA GNL protects etiolated seedlings from the photooxidative
effects of the light exposure by decreasing the levels of protochlorophyllide
In the dark, PIFs attenuate the expression of genes encoding for enzymes of the
chlorophyll biosynthesis pathway. Hence, after light exposure, the seedlings are
able to overcome the photobleaching effect, associated with the over-
accumulation of chlorophyll intermediates. To assess if B-GATAs contribute to the
survival of etiolated seedlings after light exposure, seedlings were grown in the
dark for 5 and 7-d and then exposed to light for an additional 2-d. When wt
seedlings were grown in the dark for 5 and 7-d, ~60% of them were bleached
after exposure to light (Figure 27A). Seedlings of pifq mutant bleached at 100%,
already after 5-d in the dark and following light exposure, as previously reported
(Huq et. al., 2004) (Figure 27A). The gnc gnl and wt seedlings showed a similar
percentage of bleaching after 5-d in the dark, but after 7-d in the dark, gnc gnl
they displayed ~90% bleaching compared to ~60% in the wt (Figure 27A). In
contrast, GNLox seedlings grown either for 5-d or for 7-d in the dark followed by
light exposure, were bleached in only ~10% and 20% of the cases, respectively
(Figure 27A). However, pifq GNLox bleached at 100% to the same extent as pifq
mutant after 5-d in the dark following illumination (Figure 27A). Taken together,
these findings suggested that GNL contributes to the protection of seedlings
against the photooxidative effects, which are caused by prolonged growth in the
dark followed by light exposure. Furthermore, this positive regulation of the
photooxidative effect most likely relies on the transcriptional regulation of PIFs by
the B-GATAs since pifq GNLox seedlings completely failed to survive
photooxidative stress.

64
Figure 27: GNL increases the resistance of de-etiolated seedlings to photooxidative stress. (A) Greening rate (% of green seedlings) of seedlings grown in the dark for 0, 5 and 7-d following additional exposure to light for 2-d additionally. The data represents the average with standard errors of two independent experiments. (B) Accumulation of protochlorophyllide in 7-d-old dark-grown seedlings. The data represents the average with standard errors of three biological replicates. (C) Relative transcript levels of PORA, PORB and PORC genes in 10-d-old etiolated seedlings. The data shown are the averages and standard errors of ≥ two biological replicates with each one ≥ three technical replicates. Student’s t-test: **P < 0.01, ***P < 0.001; n.s., not significant.
Next, it was hypothesized that GNLox seedlings are able to cope better with
photooxidative stress because they are able to accumulate fewer chlorophyll
intermediates during the etiolated period. To test this, the levels of Pchlide were
quantified in 7-d-old etiolated seedlings. The pifq seedlings showed the highest
levels of Pchlide, which was in line with the previous results of 100% bleached
pifq seedlings after photooxidation (Figure 27A and B). Similarly, high levels of
Pchlide of pifq were displayed in the gnc gnl mutant, which also agrees with the
high percentage of bleached 7-d-old etiolated seedlings after illumination (Figure

65
27A and B). In contrast, GNLox seedlings showed the lowest levels of Pchlide,
indicating that the reduced levels of this particular chlorophyll intermediate made
GNLox seedlings to have a better chance against the deleterious effect of
photooxidation than the others genotypes (Figure 27A and B). Finally, the pifq
GNLox seedlings had intermediate levels of Pchlide, between pifq and GNLox
(Figure 27A and B). In summary, these data suggested that GNL reduces the
overaccumulation of Pchlide in the dark and thus helps the etiolated seedlings to
overcome the lethal effects of photooxidation after light exposure. However, there
must be compounds other than Pchlide, whose reduction in the dark is also
dependent on the function of PIFs and GNL.
4.3.4 The B-GATAs may reduce protochlorophyllide by the transcriptional
control of the POR genes
Angiosperms can reduce Pchlide to Chlide (chlorophyllide) through the POR
proteins (PORA, PORB and PORC), which are light-dependent enzymes (Frick et
al. 2003). It was therefore hypothesized that GNL may reduce the levels of
Pchlide through the upregulation of POR genes. To this end, the expression of the
POR genes in 10-d-old etiolated seedlings was examined. The expression of
PORA, PORB and PORC was found to be decreased in the gnc gnl seedlings
(Figure 27C). On the contrary, GNLox seedlings showed upregulation of the
expression of PORA and PORB, but not for the PORC gene that was
downregulated when compared to pifq mutant (Figure 27C). Lastly, when the
expression of PORs was examined in pifq GNLox seedlings, all POR genes were
strongly upregulated (Figure 27C). From these results, it was concluded that B-
GATAs are able to induce the expression of POR genes in etiolated seedlings.
Furthermore, at least for PORB and PORC, it seems that the PIF proteins function
antagonistically with GNL in the regulation of PORs, PORA and PORC expression
was even higher than in pifq GNLox seedlings than in pifq (Figure 27C).

66
4.3.5 The B-GATAs GNC and GNL may protect de-etiolated seedlings from
photooxidation through transcriptional upregulation of the carotenoid
biosynthesis pathway
Carotenoids have multiple functions in plants as accessory proteins for the LHCs,
as precursors for plant hormones such as abscisic acid and strigolactones, and as
protectors against photooxidation (Ruiz-Sola & Rodríguez-Concepción 2012).
Interestingly, the carotenoid pathway is markedly upregulated during the de-
etiolation process (Welsch et al. 2000). Therefore, it was hypothesized that B-
GATAs may also contribute to the protection against photooxidation of etiolated
seedlings through the carotenoid pathway. To this end, the expression of all
genes encoding for enzymes in the carotenoid biosynthesis pathway was
examined in the RNA-seq experiments with B-GATAs GNC and GNL. Strikingly,
13 of the 21 genes of the carotenoid pathway had been found to be upregulated
after GNC induction by Dex.
Figure 28: The levels of intermediates in the carotenoid pathway are reduced in the gnc gnl double mutant as determined by HPLC. Schematic representation of the carotenoid biosynthesis pathway. Intermediates colored red are those, which were quantified by HPLC analysis of 10-d-old light-grown seedlings. The bar-diagrams display the difference in carotenoid intermediates between wt and the gnc gnl double mutant. Genes with a role in each step of the pathway are depicted with grey italic letters. Student’s t-test: **P < 0.01, ***P < 0.001. Red arrowheads show differentially expressed genes in the RNA-seq experiment with 35S:GNC:YFP:HA:GR gnc gnl.

67
(Figure 28 and Appendix Table 9). This suggested that GNL is able to help in the
protection against photooxdation after light exposure through upregulation of
genes, which play a role in carotenoids biosynthesis.
To explain further the role of B-GATAs in carotenoid production, the levels of
some basic carotenoids in the gnc gnl double mutant seedlings were quantified by
Dr. Boris Hedtke from the group of Prof. Dr. Bernhard Grimm. The amounts of
lutein, antheraxanthin, neoxanthin violaxanthin and β-caroten were quantified by
HPLC as part of our collaboration in 10-d-old light-grown seedlings. All five
carotenoids quantified in this study, were statistically significantly reduced in gnc
gnl seedlings compared to wt (Figure 28). These results underline the positive
contribution of GNC and GNL in carotenoid biosynthesis.
4.4 GOLDEN2-LIKE (GLK) transcription factors
4.4.1 GNC and GNL induce the expression of GLK1 and GLK2
GLK transcription factors are important regulators of photosynthesis, chlorophyll
biosynthesis, chloroplast development and retrograde signaling (Waters et al.
2008). Their pivotal role in chlorophyll biosynthesis is visible from the very pale
green color of the glk1 glk2 double mutant, not only in seedlings but also in adult
plants (Figure 30A). It was postulated, from the NGS results, that GNC and GNL,
could possibly influence the regulation of GLKs. The ChIP-seq experiment
suggested that GLK1 but not GLK2 was a target of GNL (Figure 29). Moreover,
the RNA-seq for GNC showed that GLK2, but not GLK1, was strongly induced
after the application of Dex and CHX (Figure 14 and Appendix Table 9). To further
clarify the binding of B-GATAs to GLK promoters, independent ChIP experiments
with GNL were performed. It was revealed that GNL binds to the promoter of
GLK1 on a position close to the start codon (Figure 29B and D). Though, when
the position of the peak identified based on the analysis of the NGS data of ChIP-
seq was examined (Figure 29A), no binding of GNL was detected (Figure 29B
and E). The ChIP-seq data also suggested that GNL did not bind to the promoter
of the GLK2 gene, a result also verified by independent ChIP (Figure 29C and F).
Nevertheless, when 35S:GNL:YFP:HA:GR gnc gnl seedlings were used for the

68
ChIP, GNL bound to the promoter of GLK2 in a region in close proximity to the
start codon after 4 h treatment with Dex (Figure 29C and G). In summary, these
results suggest that both of B-GATAs may bind to the promoters of GLK1 and
GLK2.
Figure 29: The B-GATAs GNC and GNL may regulate the expression of the GLK1 and GLK2 transcription factors. (A) Identified peak from the ChIP-seq with pGNL:GNL:HA gnc gnl transgenic line and the gnc gnl double mutant, associated to GLK1 gene. The blue line corresponds to the chromatin immunoprecipitation of GNL:HA, and the red line corresponds to the ChIP of the gnc gnl double mutant (negative control). Colored arrowheads depict different variants of GATA motifs where GNL:HA can potentially bind. (B-C) Schematic representation of the GLK1 and GLK2 promoters. The red stars show locations of GATA boxes; the grey boxes represent regions tested by qRT-PCR after ChIP, for the binding of GNL:HA. (D, E) Results from qRT-PCRs

69
analysis of ChIP with pGNL:GNL:HA gnc gnl transgenic line and the gnc gnl double mutant to detect binding sites of GNL:HA on the promoter of GLK1. (F) Results from qRT-PCRs analysis after ChIP with the pGNL:GNL:HA gnc gnl transgenic line and the gnc gnl double mutant to detect binding sites of GNL:HA on the promoter of GLK2. (G) Results from qRT-PCRs analysis after ChIP with the 35S:GNL:YFP:HA:GR gnc gnl transgenic line after 4 h treatment with Dex, to detect binding sites of GNL:YFP:HA:GR on the promoter of GLK2. The amplicons of each ChIP-qRT-PCR correspond to the regions with the grey boxes on the promoter of the GLK genes, designated as set-1, 4, 5. (H, I) Relative transcript levels of GLK1 and GLK2 in 6-d-old dark-grown seedlings, followed by light exposure for 0, 6 and 12 h. Data shown are averages and standard errors of one biological replicate with four technical replicates. (J, K) Relative transcript levels of GLK1 and GLK2 in 10-d-old light-grown seedlings. Data shown are averages and standard errors of three biological replicates each one with three technical replicates. Student’s t-test: *P < 0.05, **P < 0.01, ***P < 0.001; n.s., not significant.
The next question was whether these respective binding events can lead to a
transcriptional regulation of the GLK1 and GLK2 genes. Therefore, a qRT-PCR
experiment with dark-grown seedlings after light exposure was performed. Both
GLK1 and GLK2 were strongly induced in GNCox and GNLox seedling after light
exposure (Figure 29H and I). Additionally, qRT-PCR experiments performed with
seedlings grown under constant white light, confirmed the upregulation of both
GLKs by GNC and GNL (Figure 29J and K). The overall conclusion from the
previous data was that GNC and GNL could control the transcription of GLKs by
binding to their promoters.
4.4.2 GLKs are downstream of GNC and GNL regarding greening
Since there is a relationship between B-GATAs and GLKs at the molecular level,
the genetic relationship between them was investigated. For that reason, genetic
crosses were conducted among different genotypes of B-GATAs and GLKs.
Figure 30: The GLK transcription factors function downstream or in parallel with B-GATAs GNC and GNL in the chlorophyll biosynthesis pathway. (A-B) Representative photographs of 7-d-old light-grown seedlings. (C-D) Results of the quantification of chlorophyll a and b in 7-d-old light-grown seedlings. Student’s t-test: ***P < 0.001; n.s., not significant.
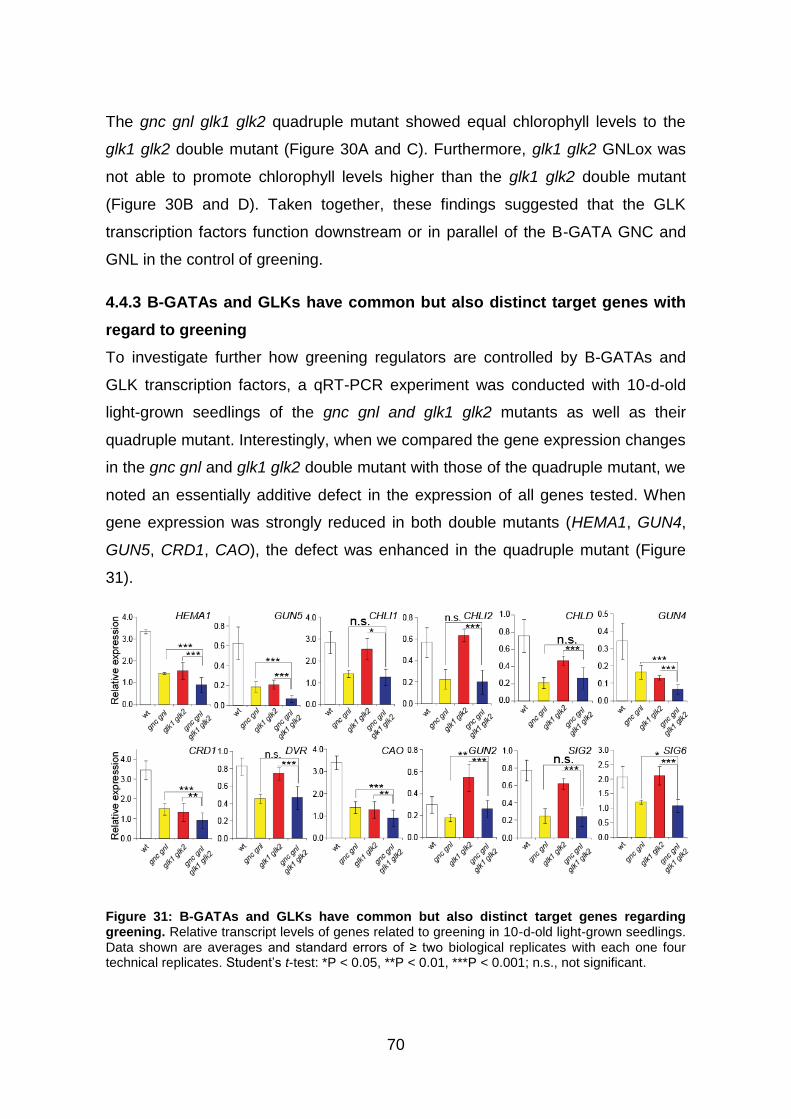
70
The gnc gnl glk1 glk2 quadruple mutant showed equal chlorophyll levels to the
glk1 glk2 double mutant (Figure 30A and C). Furthermore, glk1 glk2 GNLox was
not able to promote chlorophyll levels higher than the glk1 glk2 double mutant
(Figure 30B and D). Taken together, these findings suggested that the GLK
transcription factors function downstream or in parallel of the B-GATA GNC and
GNL in the control of greening.
4.4.3 B-GATAs and GLKs have common but also distinct target genes with
regard to greening
To investigate further how greening regulators are controlled by B-GATAs and
GLK transcription factors, a qRT-PCR experiment was conducted with 10-d-old
light-grown seedlings of the gnc gnl and glk1 glk2 mutants as well as their
quadruple mutant. Interestingly, when we compared the gene expression changes
in the gnc gnl and glk1 glk2 double mutant with those of the quadruple mutant, we
noted an essentially additive defect in the expression of all genes tested. When
gene expression was strongly reduced in both double mutants (HEMA1, GUN4,
GUN5, CRD1, CAO), the defect was enhanced in the quadruple mutant (Figure
31).
Figure 31: B-GATAs and GLKs have common but also distinct target genes regarding greening. Relative transcript levels of genes related to greening in 10-d-old light-grown seedlings. Data shown are averages and standard errors of ≥ two biological replicates with each one four technical replicates. Student’s t-test: *P < 0.05, **P < 0.01, ***P < 0.001; n.s., not significant.

71
When the expression defect was strong in the gnc gnl mutant but not or only
weakly impaired in the glk1 glk2 mutant (CHLI1, CHLI2, DVR, GUN2, SIG2 and
SIG6), the expression changes in the quadruple mutant were very similar to those
observed in gnc gnl (Figure 31). Among the twelve genes tested, CHLD was the
only one exception from this rule, since its expression was strongly reduced in
both mutants but as strongly impaired in the quadruple as in the gnc gnl double
mutant (Figure 31).
In summary, it can be concluded that the GATA and the GLK factors regulate
partially overlapping and partially distinct gene sets but that their combined defect
cannot exacerbate the chlorophyll formation defects observed in the glk1 glk2
mutant. Furthermore, the strong reduction of several of these genes specifically in
the gnc gnl double mutant supports our conclusion that the effects of the GATAs
on greening may be explained by the direct regulation of a specific gene set by
the GATAs.
4.5 Sigma factors (SIGs), the regulators of the chloroplast transcription
Chlorophyll biosynthesis is regulated not only by nuclear-encoded but also by
chloroplast-encoded genes. The transcription in the chloroplasts is controlled by
two different types of polymerases, the plastid-encoded polymerase (PEP) and
the nuclear-encoded polymerase (NEP). The binding specificity of PEP to the
chloroplast gene-promoters is given by a set of nuclear-encoded proteins named
sigma factors (SIGs). The Arabidopsis genome encodes six different sigma
factors (Börner et al. 2015) but only sig2 (sig2-1) and sig6 (sig6-2) mutants show
severe defects in chlorophyll biosynthesis, being very pale green compared to wt
(Kanamaru & Tanaka 2004; Loschelder et al. 2006). Therefore, it was decided to
study these mutants, alongside with B-GATA mutants, to elucidate possible
interactions between them in the context of greening. The potential transcriptional
regulation of SIG2 and SIG6 by GNC and GNL would reveal signals that are able
to be transduced from the nucleus to the chloroplasts through B-GATAs and
SIGs.

72
4.5.1 GNC and GNL control the expression of SIG2
SIG2 was not found to be a target of GNL in the ChIP-seq, though it was strongly
induced in the RNA-seq for GNC (Figure 14B and Appendix Table 9).
Independent, ChIP experiments revealed, however, a binding of GNL to the
promoter of SIG2 (Figure 32A-C). Additionally, a qRT-PCR experiment with 6-d-
old dark-grown seedlings followed by 0, 6 12 h light exposure showed that the gnc
gnl double mutant displayed significantly reduced levels of the SIG2 expression
(Figure 32D). Moreover, it was found that expression of SIG2 was strongly
induced in GNCox, and to a lesser degree in GNLox seedlings (Figure 32D). In
sum, it seems that the B-GATA GNL binds to the SIG2 promoter and that GNL as
well as GNC are able to upregulate the expression of SIG2.
Figure 32: GNL directly controls the expression of SIG2. (A) Schematic representation of the SIG2 promoter. The red stars show locations of GATA boxes; the grey boxes represent regions tested by qRT-PCR of ChIP experiment, for the binding of GNL:HA. (B - C) Results from the ChIP-qRT-PCRs analysis with the pGNL:GNL:HA gnc gnl transgenic line and the gnc gnl double mutant. (D) Relative transcript levels of SIG2 in 6-d-old dark-grown seedlings followed by 0, 6 and 12 h light exposure. The data shown are the averages and standard errors of one biological replicate with four technical replicates. Student’s t-test: *P < 0.05; n.s., not significant.
4.5.2 GNL induces greening independently from SIG2
sig2 GNLox was obtained through a genetic cross and was used to investigate
the genetic relationship between SIG2 and GNL. Initially, the development of sig2
GNLox plants was followed, with particular focus on greening, from the stage of
73
young seedlings until the stage of adult plants. The sig2 mutant displayed a very
pale green color over its entire lifespan, indicating a severe defect in the
chlorophyll biosynthesis (Figure 33A to H). The first 6-d following germination, the
sig2 GNLox seedlings appeared to be similar to sig2 mutants but as the
development of the plants progressed, the greening of the sig2 GNLox was closer
to that of the wt, in the cotyledons and the hypocotyl but not the emerging true
leaves (Figure 33D-J).
When the chlorophyll levels of 7-d-old seedlings were quantified, sig2 GNLox had
slightly but statistically significantly increased chlorophyll content (Figure 33K).
Furthermore, when the chlorophyll of 20 and 38-d-old plants was measured, sig2
GNLox had higher chlorophyll levels than the sig2 mutant (Figure 33L).
Additionally, to test whether SIG2 was able to induce greening in wt and gnc gnl
background, transgenic lines of SIG2ox and gnc gnl SIG2ox were generated
(Figure 33N). The quantification of chlorophyll in 7-d old seedlings showed that
neither SIG2ox nor gnc gnl SIG2ox was able to increase the chlorophyll levels
higher than the gnc gnl double mutant (Figure 33O). Taken together, these results
suggested that B-GATAs can control the expression of SIG2. Moreover, GNL is
able to induce greening in the absence of SIG2, in a tissue-specific manner. Thus,
GNL either induces greening through the upregulation of SIG6, another sigma
factor with a prominent role in greening, when SIG2 is not present or GNL is able
to induce greening through an independent pathway.

74
Figure 33: GNL partially induces greening independently from SIG2 in a tissue-specific manner. (A-E) Representative photographs of 4, 6, 8 and 10-d-old light grown seedlings. All the insets show an enlargement of the hypocotyl region in the corresponding seedlings. (F-J) Representative photographs of 14, 22 and 29-d-old adult plants. (K) Results of the quantification

75
of chlorophyll a and b of 7-d-old light-grown seedlings. (L) Results of the quantification of chlorophyll a and b in 20-d-old and 38-d-old adult plants. (M) Representative photographs of 7-d-old light-grown seedlings. (N) Relative transcript levels of SIG2 in 7-d-old light-grown seedlings of the transgenic SIG2ox and gnc gnl SIG2ox lines. The data shown are the averages and standard errors of four technical replicates. (O) Results of the quantification of chlorophyll a and b in 7-d-old light-grown seedlings. Student’s t-test: *P < 0.05, **P < 0.01, ***P < 0.001; n.s., not significant.
4.5.3 The B-GATAs GNC and GNL control the expression of SIG6
Another member of the sigma factor family that contributes to chlorophyll
biosynthesis is SIG6. Similar to SIG2, SIG6 did not appear to be a target of GNL
in the ChIP-seq but was found strongly upregulated in the RNA-seq for GNC
(Figure 14 and Appendix Table 9).
Independent ChIP experiments revealed that GNL bound to two different positions
in the SIG6 promoter (Figure 34A-C). A qRT-PCR with 6-d-old dark-grown
seedlings followed by exposure to light showed similar results as in the case of
SIG2. The gnc gnl seedlings showed downregulation of the SIG6, but the GNCox
and GNLox seedlings displayed strong upregulation of SIG6 (Figure 34D). Much
more prevalent was the induction of SIG6 in GNCox seedlings. It was thus
concluded, that the expression of SIG6 could be directly controlled by the B-
GATAs GNC and GNL.
Figure 34: GNL controls the expression of SIG6. (A) Model of the SIG6 promoter. The red stars show locations of GATA boxes; grey boxes represent regions tested by qRT-PCR of ChIP experiment for the binding of GNL:HA. (B-C) Results from qRT-PCR analysis of a ChIP with a pGNL:GNL:HA gnc gnl transgenic line and the gnc gnl double mutant. The amplicons of each ChIP-qRT-PCR correspond to the regions with the grey boxes on the promoter of the SIG6 gene,

76
designated as set-1, -2. (D) Relative transcript levels of SIG6 in 6-d-old dark-grown seedlings, followed by short 0, 6 and 12 h light exposure for. Data shown are averages and standard errors of one biological replicate with four technical replicates. Student’s t-test: *P < 0.05; n.s., not significant.
4.5.4 GNL promotes greening independently from SIG6
To further investigate the genetic interaction between GNC and GNL with SIG6,
genetic crosses were performed. The triple mutant sig6 gnc gnl displayed similar
chlorophyll levels as the sig6 single mutant (Figure 35A and H), indicating that
SIG6 functions downstream of GNC and GNL. Already early in their development,
the sig6 GNLox seedlings were greener than the sig6 mutant (Figure 35B and C).
When chlorophyll levels were measured, 7-d-old sig6 GNLox seedlings showed a
chlorophyll content higher than the sig6 mutant and similar to wt (Figure 35D and
I). This was a different result as observed in sig2 GNL seedlings, which when at
the same age, had chlorophyll levels just slightly higher than the sig2 mutant
(Figure 33). As development continued, it became obvious that the sig6 mutant as
well as sig6 GNLox recovered from the pale green phenotype (Figure 35D, F, G
and J).
The chlorophyll levels of adult plants were quantified, and it was found that 20-d-
old and 38-d-old sig6 GNLox plants displayed higher levels of chlorophyll than the
sig6 mutant (Figure 35J). In conclusion, all the previous results proposed that
GNL is able to induce greening independent from SIG6, as it had been observed
for sig2 GNLox. The difference with sig6 GNLox seedlings was that this could
occur even earlier during the development than sig2 GNLox seedlings. Next, it
was tested whether SIG6 was able to induce greening in the wt and the gnc gnl
background. Therefore, transgenic lines of SIG6ox and gnc gnl SIG6ox were
generated (Figure 35K).
The quantification of chlorophyll in 7-d old seedlings showed that SIG2ox had
slightly higher levels of chlorophyll compared to wt, but gnc gnl SIG2ox shown
similar levels with gnc gnl (Figure 35L). The emerging hypothesis from these
results could be similar to that phrased for SIG2. Either GNL could induce
greening by the upregulation of SIG2 or SIG6 when either of these SIG genes is
absent. Or GNL could act through an independent pathway.

77
Figure 35: GNL can induce, at least partially, greening independently from SIG6. (A-F) Representative photographs of 6, 7, 10-d-old light grown seedlings. All the insets show enlargement of the hypocotyl region of the corresponding seedlings. (G) Representative photographs of 20-d-old adult plants. (H-I) Results of the quantification of chlorophyll a and b of 7-d-old light-grown seedlings. (J) Results of the quantification of chlorophyll a and b of 20-d-old and 38-d-old adult plants. (K) Relative transcript levels of SIG6 in 7-d-old light-grown seedlings of transgenic line of SIG6ox wt and gnc gnl SIG6ox. Data shown are averages and standard errors of four technical replicates. (L) Results of the quantification of chlorophyll a and b of 7-d-old light-grown seedlings. Student’s t-test: *P < 0.05, **P < 0.01, ***P < 0.001; n.s., not significant.

78
4.5.5 GNC and GNL regulate the expression of SIG2 and SIG6 in a cytokinin-
dependent manner
GNC and GNL are cytokinin-induced genes (Ranftl et al. 2016). Therefore, it was
hypothesized that the regulation of the SIG2 and SIG6 genes by GNC and GNL
could be cytokinin-dependent. To test this, light-grown seedlings of wt and gnc gnl
were treated for 8 h with the cytokinin 6-BA. Then, a qRT-PCR was performed to
check the expression of SIG2 and SIG6, which were both found to be strongly
upregulated after the treatment with 6-BA in the wt, indicating that SIG2 and SIG6
are cytokinin-induced genes (Figure 36A, B). Furthermore, this induction was
strongly compromised, independently from the application of 6-BA, in the gnc gnl
seedlings (Figure 36A, B). Nevertheless, the expression of SIG2 and SIG6 in the
gnc gnl seedlings treated with 6-BA was not abolished completely (Figure 36A,
B). These results indicate that SIG2 and SIG6 are controlled by the GNC and
GNL in a cytokinin-dependent manner. However, the fact that the gnc gnl
seedlings showed a small increase in their expression after 6-BA treatment
suggests that there might be other factors, possibly other GATA transcription
factors, which contribute to the cytokinin-dependent upregulation of SIG2 and
SIG6.
Figure 36: Cytokinin-dependent regulation of SIG2 and SIG6 via the B-GATA’s GNC and GNL. Relative transcript levels of (A) SIG2 and (B) SIG6 in 10-d-old light-grown seedlings of wt and the gnc gnl double mutant, followed by 8 hr treatment with 6-BA. Data shown are averages and standard errors of one biological replicate with three technical replicates. Student’s t-test: **P < 0.01, ***P < 0.001;
n.s., not significant.

79
4.5.6 GNL dynamically readjusts the expression of SIG2 and SIG6 in order to
promote greening
A partial rescue of the chlorophyll phenotype was observed in sig2 GNLox and
sig6 GNLox seedlings compared to sig2 and sig6 mutants. Therefore, it was
assumed that GNL may compensate for the loss of one SIG gene through the
upregulation of the respective other. To test this hypothesis, a qRT-PCR was
performed with using light-grown seedlings to check the expression of SIG6 in
sig2 GNLox seedlings, and vice versa, the expression of SIG2 in sig6 GNLox
seedlings. SIG2 was severely downregulated in sig6 indicating that SIG6 is able
to activate, possibly indirectly, the expression of SIG2 (Figure 37A). Moreover, the
expression of SIG2 was upregulated in sig6 GNLox seedlings compared to the
sig6 mutant (Figure 37B). On the other hand, the sig2 mutant showed similar
expression of SIG6 with wt but sig2 GNLox seedlings compared to sig2 showed
an increased expression of SIG6 (Figure 37B). The overall conclusions of these
results are that GNL is able to readjust SIG expression levels through the
upregulation of SIG2 and SIG6 genes in the sig6 and sig2 mutants, respectively.
4.5.7 SIG2 and SIG6 promote a signal, which suppresses the expression of
GNC and GNL
As part of a hypothetical cross regulation among the SIGs and B-GATAs, it was
hypothesized that SIG2 and SIG6 could influence the expression of GNC and
GNL. To this end, the expression of GNC and GNL was tested in sig2 and sig6
Figure 37: Dynamic transcriptional regulation of SIG2 and SIG6 by GNL, in order to promote greening. Relative transcript levels of (A) SIG2 and (B) SIG6 in 10-d-old light-grown seedlings. Data shown are averages and standard errors of three biological replicates with each one four technical replicates. Student’s t-test: ***P < 0.001; n.s., not significant.
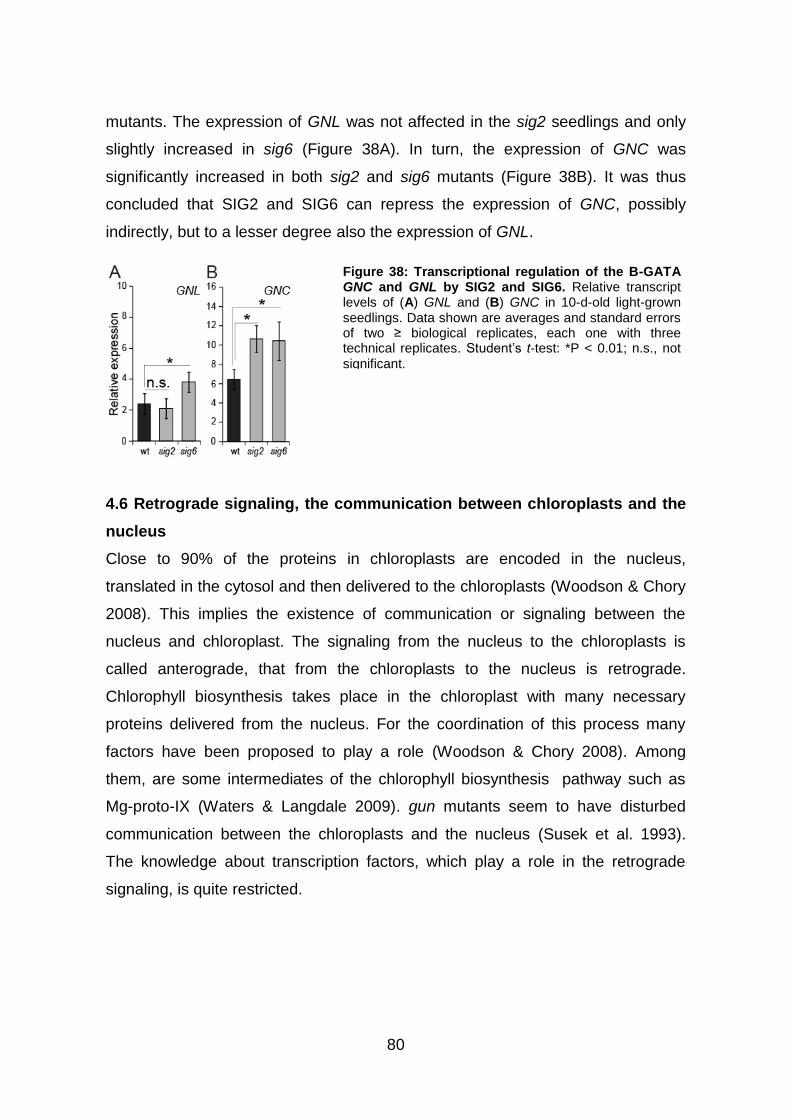
80
mutants. The expression of GNL was not affected in the sig2 seedlings and only
slightly increased in sig6 (Figure 38A). In turn, the expression of GNC was
significantly increased in both sig2 and sig6 mutants (Figure 38B). It was thus
concluded that SIG2 and SIG6 can repress the expression of GNC, possibly
indirectly, but to a lesser degree also the expression of GNL.
4.6 Retrograde signaling, the communication between chloroplasts and the
nucleus
Close to 90% of the proteins in chloroplasts are encoded in the nucleus,
translated in the cytosol and then delivered to the chloroplasts (Woodson & Chory
2008). This implies the existence of communication or signaling between the
nucleus and chloroplast. The signaling from the nucleus to the chloroplasts is
called anterograde, that from the chloroplasts to the nucleus is retrograde.
Chlorophyll biosynthesis takes place in the chloroplast with many necessary
proteins delivered from the nucleus. For the coordination of this process many
factors have been proposed to play a role (Woodson & Chory 2008). Among
them, are some intermediates of the chlorophyll biosynthesis pathway such as
Mg-proto-IX (Waters & Langdale 2009). gun mutants seem to have disturbed
communication between the chloroplasts and the nucleus (Susek et al. 1993).
The knowledge about transcription factors, which play a role in the retrograde
signaling, is quite restricted.
Figure 38: Transcriptional regulation of the B-GATA GNC and GNL by SIG2 and SIG6. Relative transcript levels of (A) GNL and (B) GNC in 10-d-old light-grown seedlings. Data shown are averages and standard errors of two ≥ biological replicates, each one with three technical replicates. Student’s t-test: *P < 0.01; n.s., not
significant.

81
4.6.1 GNC and GNL can influence the communication between chloroplasts
and the nucleus
Carotenoids are essential molecules for photosynthesis. Under normal conditions,
blocking carotenoid biosynthesis in the chloroplasts will stop the synthesis of any
RNA in the nucleus related to photosynthesis. In the case of defective
communication among chloroplasts and the nucleus, the signal from the
chloroplasts, which informs the nucleus to stop the transcription of such
photosynthesis genes will not be delivered. NF (norflurazon) is a chemical that
effectively blocks carotenoid biosynthesis. The fact that GNC and GNL are
regulators of the GUN genes led to the hypothesis that B-GATAs might also play
a role in retrograde signaling. To test this, genetic crosses were performed
between the gnc gnl double mutant and the single mutants of gun2, gun4 and
gun5. The triple mutant progenies of these crosses, gun2 gnc gnl, gun4 gnc gnl
and gun5 gnc gnl, were subjected to a treatment with NF and the status of
chloroplast to nucleus communication was examined by testing the expression of
the nuclear encoded Lhcb genes. The gun2, gun4 and gun5 single mutants
showed strong upregulation of the Lhcb2 gene reflecting their previously reported
genomes uncoupled (gun) defect in retrograde signaling. The gnc gnl double
mutant showed no gun phenotype and even displayed reduced levels of Lhcb2
compared to the wt (Figure 39B). Interestingly, when the expression of Lhcb2 was
followed in the gun2 gnc gnl, gun4 gnc gnl and gun5 gnc gnl triple mutants, all
mutant combinations showed a suppression of the gun phenotype inviting the
conclusion that GNC and GNL are part of the retrograde signaling pathway.
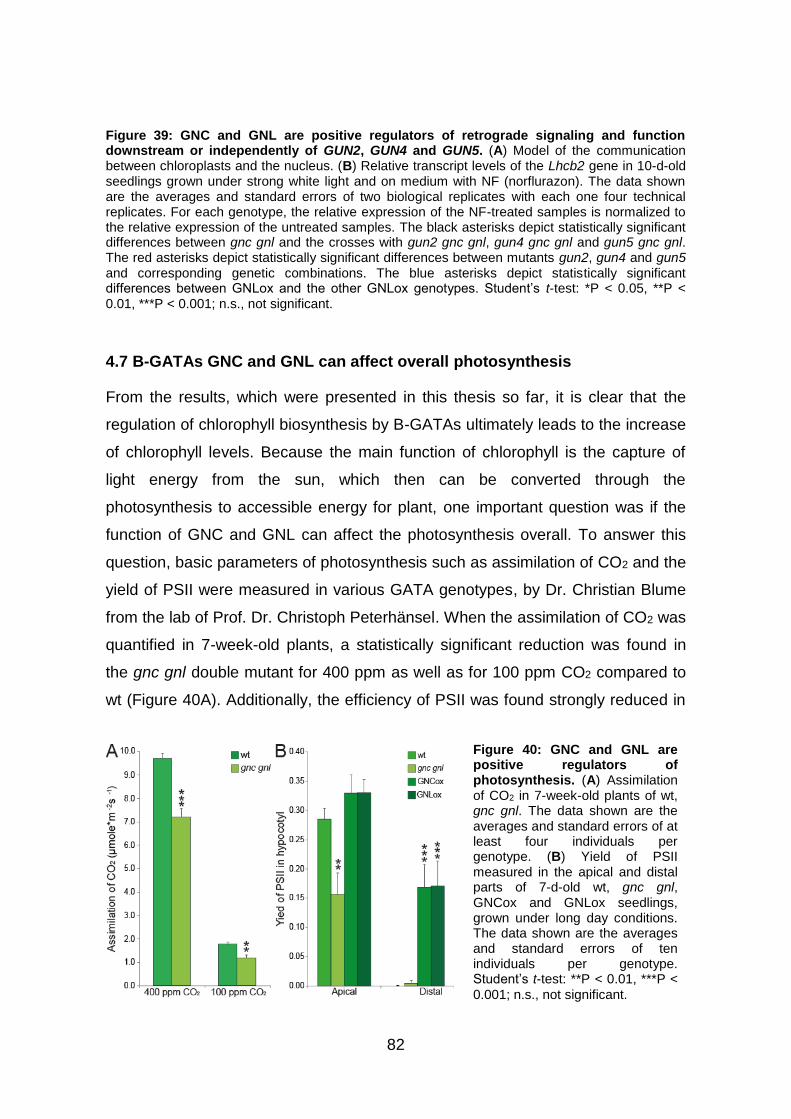
82
Figure 39: GNC and GNL are positive regulators of retrograde signaling and function downstream or independently of GUN2, GUN4 and GUN5. (A) Model of the communication between chloroplasts and the nucleus. (B) Relative transcript levels of the Lhcb2 gene in 10-d-old seedlings grown under strong white light and on medium with NF (norflurazon). The data shown are the averages and standard errors of two biological replicates with each one four technical replicates. For each genotype, the relative expression of the NF-treated samples is normalized to the relative expression of the untreated samples. The black asterisks depict statistically significant differences between gnc gnl and the crosses with gun2 gnc gnl, gun4 gnc gnl and gun5 gnc gnl. The red asterisks depict statistically significant differences between mutants gun2, gun4 and gun5 and corresponding genetic combinations. The blue asterisks depict statistically significant differences between GNLox and the other GNLox genotypes. Student’s t-test: *P < 0.05, **P < 0.01, ***P < 0.001; n.s., not significant.
4.7 B-GATAs GNC and GNL can affect overall photosynthesis
From the results, which were presented in this thesis so far, it is clear that the
regulation of chlorophyll biosynthesis by B-GATAs ultimately leads to the increase
of chlorophyll levels. Because the main function of chlorophyll is the capture of
light energy from the sun, which then can be converted through the
photosynthesis to accessible energy for plant, one important question was if the
function of GNC and GNL can affect the photosynthesis overall. To answer this
question, basic parameters of photosynthesis such as assimilation of CO2 and the
yield of PSII were measured in various GATA genotypes, by Dr. Christian Blume
from the lab of Prof. Dr. Christoph Peterhänsel. When the assimilation of CO2 was
quantified in 7-week-old plants, a statistically significant reduction was found in
the gnc gnl double mutant for 400 ppm as well as for 100 ppm CO2 compared to
wt (Figure 40A). Additionally, the efficiency of PSII was found strongly reduced in
Figure 40: GNC and GNL are positive regulators of photosynthesis. (A) Assimilation of CO2 in 7-week-old plants of wt, gnc gnl. The data shown are the averages and standard errors of at least four individuals per genotype. (B) Yield of PSII measured in the apical and distal parts of 7-d-old wt, gnc gnl, GNCox and GNLox seedlings, grown under long day conditions. The data shown are the averages and standard errors of ten individuals per genotype. Student’s t-test: **P < 0.01, ***P <
0.001; n.s., not significant.

83
the gnc gnl double mutant compared to wt, but not significantly different in the
GNCox and GNLox, for the apical part of the hypocotyl of 7-d-old seedlings
(Figure 40B).
In contrast, the efficiency of PSII measured for the distal part of the hypocotyl,
was found to be markedly increased in GNCox and GNLox seedlings compared to
wt (Figure 40B). From these results it can be concluded that the B-GATAs GNC
and GNL can positively affect the overall status of photosynthesis, in mature adult
plants but in young seedlings too.

84
5. Discussion
Greening is regulated and fine-tuned in a complex way. Many pathways are
interlinked in order to control greening in plants. The major goal of this study was
to elucidate the contribution of the B-GATA transcription factors GNC and GNL in
the greening of Arabidopsis. To reach this goal, different approaches were
combined such as the analysis of pre-existing microarray data, NGS experiments
(ChIP-seq and RNA-seq), genetic, molecular and physiological experiments. The
main outcome of this effort was that GNC and GNL are able to promote greening
by controlling the transcription of important players with various roles in the
regulation of greening. The overall conclusion of this study is that GNC and GNL
can regulate greening at least six distinct levels: through regulation of the
chlorophyll biosynthesis pathway, the heme/phytochrome pathway, transcription
factors with roles in greening like PIFs and GLKs, chloroplast transcription via the
regulation of SIG factors and finally through their participation in retrograde
signaling.
5.1 The transcriptional regulation of greening before and after the research
conducted in this thesis
The landscape of the transcriptional regulation of greening, before and after the
work performed for this thesis is depicted in Figure 41. This scheme includes the
known transcription factors/regulators and their contribution to the various steps of
the chlorophyll biosynthesis pathway as blurred colored circles. Bright blue circles
illustrate the contribution, which GNC and GNL discovered to have in greening,
from the results of this thesis solely. Moreover, Figure 41 shows the regulatory
role, which GNC and GNL have in the regulation known regulators of greening
such as the GLKs, PIFs, SIGs. The following discussion, attempts to discuss the
most important conclusions for each step in the regulation of greening by the B-
GATAs GNC and GNL.

85
Figure 41: Contribution of B-GATAs GNC and GNL to the transcriptional regulation of greening, before and after, the research conducted in this thesis. (A) Schematic representation of the tetrapyrrole pathway with known transcriptional regulators (blurred colored circles) before the research performed for this thesis and with depicting the regulatory role of GNC and GNL contributed solely from the research performed in this thesis (bright blue circles). Horizontial arrow such: ( ) indicates induction of gene expression , ( ) : indicates repression of gene expression and ( ): indicates presence of additional steps not presented in this figure, horizontal arrows with dashed lines represent transcriptional regulation not supported by chromatin immunoprecipitation. (B) Schematic representation of the transcriptional regulation of known greening regulators by the B-GATAs GNC and GNL after the research conducted in this thesis.

86
5.2 Combinatorial analysis of metabolomics together with ChIP-seq and
RNA-seq reveals the major role of GATAs to the transcriptional control of
many greening related genes
Despite the obvious implication of GNC and GNL in chlorophyll biosynthesis,
there were no metabolic data (metabolomics) available (e.g., HPLCs) in the
literature to describe the direct implication of B-GATAs in the synthesis of
intermediate metabolites of the chlorophyll pathway. Therefore, the quantification
of such intermediate metabolites in the wt and the gnc gnl double mutant was
performed (Figure 7). As the results from the HPLC analysis show, all the
chlorophyll metabolites were found to be significantly reduced in the gnc gnl
double mutant compared to wt. This underlines the significance of the
transcriptional regulation of the genes encoding enzymes in chlorophyll
biosynthesis pathway by the B-GATAs.
In an effort to find genes with a prominent role in greening, which could directly be
regulated by GNC and GNL, a RNA-seq experiment was performed by Dex-
inducible translational fusion variants of GNC and GNL. This experiment was
conducted with simultaneous application of Dex and CHX, an inhibitor of protein
synthesis in order to minimize any effects, which might have the synthesis of new
proteins. The results of the RNA-seq experiment with GNC are in line with the
results found in the analyzed microarray data performed with the GNC and GNL
overexpression lines and additionally underlines the direct implication of B-GATAs
in the control of the expression of the chlorophyll biosynthesis genes (Appendix
Table 9). The genes encoding for enzymes in chlorophyll branch found to be
directly upregulated by GNC were: CAO, CHLD, CHLG, CHLI1, CHLI2, CHLM,
CRD1, DVR, GUN4, GUN5, NYC1, PORB and PORC (Appendix Table 9).
Additionally, in the same RNA-seq experiment were found genes, which encode
for proteins with known regulatory functions in greening, such as GLK1, GLK2,
PIF1, PIF3, SIG2 and SIG6 (Appendix Table 9). Overall the results from the RNA-
seqs in combination with the ChIP-seq and the HPLC, helped to structure the
initial hypothesis through which B-GATAs can contribute to the greening of
Arabidopsis. The knowledge gained from these omics studies provided, in other
words, the base of further molecular, physiological and genetic experiments,

87
which were performed afterwards in this thesis in order to study in depth the
contribution of B-GATAs in greening. The most prominent results of these
experiments are addressed later in the discussion.
Since, at least to my knowledge, there were no data available so far for the
binding of Arabidopsis B-GATAs factors in genome wide scale, an effort was
made to identify target genes of GNL at the genome-wide level through a ChIP-
seq experiment. This effort identified some interesting targets regarding genes,
which contribute to greening such as HEME2, CHLD, CHLM, GUN5, FC1, GLK1
and PIF3 (Appendix Table 9). However, it had been expected that the number of
GNL target genes provided by the ChIP-seq with a role in greening would be
much bigger. This, because the number of genes related to greening, which were
found to be differentially expressed in the microarray analysis of 35S:GNC:GFP
(GNCox) and 35S:YFP:GNL (GNLox) impressively covered the majority of genes
implicated in the tetrapyrrole and chlorophyll pathway (Appendix Table 9). A
possible cause of these unexpected results of the ChIP-seq can be the relative
low expression of GNL whose expression was driven by a native GNL promoter
fragment. However, it had been decided to use the native promoter to eliminate
any possible off-target effects, which could be obtained if use a strong promoter
such as the cauliflower mosaic virus promoter (CaMV 35S) had been used. Due
to financial limitation, the ChIP-seq experiment could not be repeated, but
definitely a repetition ChIP-seq with GNL with a much more elegant system, such
as 35S:GNL:YFP:HA:GR gnc gnl Dex inducible plants (described in this thesis),
would potentially shed more light in the direct targets of GNL. Lastly it must not be
overlooked an interesting result, which came from the ChIP-seq analysis, which
was the binding of the GNL to genes of the B-GATAs GNC, GNL and GATA17
(Figure 10). Taken in to account that the overexpressors of GNC, GNL and
GATA17 show dark green phenotype, and that gnc gnl gata17 gata17l quadruple
mutant has lower chlorophyll levels than wt, this results may be interpreted as a
cross regulation between GATAs, which promote greening in Arabidopsis
(Behringer et al. 2014; Ranftl et al. 2016).

88
5.3 B-GATAs control the transcription of key enzymes in the chlorophyll
biosynthesis pathway
Transcription factors such as GLKs, which control the expression of genes in the
chlorophyll biosynthesis pathway, seem to do so by upregulating the transcription
of genes in various steps of the pathway simultaneously, potentially in a
coordinated manner (Figure 5) (Lee et al. 2007; Waters et al. 2009). It seems that
B-GATAs follow the same way of regulation as the other greening related
transcription factors, more specifically in the transcription of MgCh subunits and
DVR regarding the chlorophyll branch.
The first step of chlorophyll biosynthesis, the metalation of Proto-IX with the Mg2+
ion, is crucial for the synthesis of chlorophyll. This step is catalyzed by the MgCh
enzymatic complex, which is formed by three different subunits, GUN5, CHLI,
CHLD, and one regulatory protein, GUN4. Previous studies have shown that
genes that encode proteins in the MgCh enzyme are light-regulated (Stephenson
et al., 2008). GUN5 had been shown to be repressed by PIF3 and that this
repression is mediated by HDA15 (Liu et al. 2013). The research conducted for
this thesis shows the implication of B-GATA GNC and GNL in the direct regulation
of all genes encoding MgCh subunits. All four genes are upregulated by GNC and
GNL, and in most of the cases, this transcriptional regulation is linked with the
direct binding of GNL to the promoters of these genes (Figure 41). Additionally,
GUN4 was found to be a direct target of GNL and strongly induced by GNC and
GNL as well (Figure 20). This result is in line with a previous study that found
GNC and GNL upregulating GUN4 expression, though it was not able to conclude
if the B-GATAs can bind to the promoter of the GUN4 gene directly (Hudson et al.
2011).
Furthermore, when GNL is overexpressed in the mutants of GUN5 (gun5 or cch1)
and GNC overexpressed in the mutant of CHLI1 (cs), are able to suppress, at
least partially, the greening defects of these mutants (Figure 17 and 19). This is
probably either because of the upregulation of the only partially compromised
GUN5 in the gun5 mutant or due to the more global promoting function of GNL
and GNC in other steps of the pathway.

89
DVR is responsible for converting divinyl protochlorophyllide a or divinyl
chlorophyllide to monovinyl protochlorophyllide a or monovinyl chlorophyllide, a
reaction, which occurs downstream of the Mg-protoIX metalation and upstream
from the conversion of protochlorophyllide a to chlorophyllide a in the chlorophyll
pathway (Figure 41). The dvr/pcb2 mutant shows severe defects in greening, a
fact which underlines the importance of this enzyme in the chlorophyll
biosynthesis (Nakanishi et al. 2005). The research in this thesis shows that GNC
and GNL are able to regulate the expression of DVR and moreover that GNL, in
particular, can bind directly to two different positions of the DVR promoter (Figure
22). These results, together with the fact that overexpression of DVR in the gnc
gnl double mutant background can suppress the pale green phenotype of gnc gnl
(Figure 22), reveal the crucial role of DVR regulation by the B-GATAs.
5.4 The chlorophyll and the heme pathway are converging on B-GATAs
Prior to this study, the information about the transcriptional regulation of the heme
pathway, which leads to the synthesis of the phytochromobilins, the
chromophores of the phytochromes, was quite restricted. One known important
aspect was the regulation of GUN2 by the HY5 transcription factor (Figure 5) (Lee
et al. 2007). GUN2 encodes for an oxygenase, which catalyzes the second step
of the heme pathway, which is the conversion of heme to biliverdin IXa, and has
also an implication in the retrograde signaling (Figure 5) (Davis et al. 1999; Susek
et al. 1993). The results of this thesis show that B-GATAs are able to control the
expression of GUN2 (Figure 23). It was also shown that GNLox could, at last
partially, induce greening in gun2 GNLox seedlings, mainly in the hypocotyls, thus
overriding the defects in phytochrome function due to the gun2 mutation (Figure
24).
Moreover, the expression of GNC and GNL was reduced in the gun2 mutant and
when DP, an inhibitor of heme pathway was applied to young seedlings (Figure
25). These lines of evidence are in agreement with the previously noted
transcriptional regulation of B-GATAs, and GNL in particular, by phytochromes
(Ranftl et al. 2016). Nevertheless, the possibility that heme and/or biliverdin IXa
metabolites could influence the expression of B-GATAs independently from the

90
phytochrome pathway cannot be excluded either. Moreover, it is already
mentioned that heme can be exported from chloroplasts and change the
expression of genes, which are related to photosynthesis, and encoded by the
nuclear genome (Thomas & Weinstein 1990; Woodson et al. 2011). Therefore, it
could also be hypothesized that GNC and GNL are such candidate genes.
Nevertheless, the precise mechanism under which this regulation takes place it is
not yet known, and it could be a subject of future research.
5.5 B-GATAs function downstream of PIFs regarding greening
This study shows that GNLox can induce greening in pif1, pif3 and pifq mutants
(Figure 26). This indicates that B-GATAs can function downstream of PIFs.
Interestingly, a previous study from our lab had shown that PIFs act also
upstream of B-GATAs (Richter et al. 2010).
PIF3 is involved in the suppression of the chlorophyll biosynthesis gene GUN5 in
dark-grown seedlings (Liu et al. 2013). Thus, it has been proposed that PIF3
plays a role in the downregulation of the chlorophyll biosynthesis pathway in the
dark, in order to protect seedlings from the effects of photooxidation caused by
light exposure. These effects occur as a result of the over accumulation of some
chlorophyll intermediates, such as protochlorophyllide (Cheminant et al. 2011). In
line with these findings, this study reveals that GNLox etiolated seedlings show
40% more surviving plants compared to wt after two additional days of light
exposure (Figure 27). This correlates with the markedly lower levels of
protochlorophyllide in GNLox seedlings during their etiolated growth (Figure 27).
The way through which this low accumulation of protochlorophyllide can be
achieved in GNLox seedlings by the influence of B-GATAs is probably through the
upregulation of POR genes, which are encoding for enzymes responsible for the
catabolism of protochlorophyllide to chlorophyllide (Figure 27). Carotenoids have
also been proposed to confer protection against photooxidation to etiolated
seedlings (Cheminant et al. 2011). This study additionally shows that B-GATAs
are not only able to induce expression of the majority of carotenoid biosynthesis
genes but also that most of the carotenoids show a severe reduction in the gnc
gnl double mutant seedlings (Figure 28). Overall, these results suggest that B-

91
GATAs are able to control the chlorophyll biosynthesis pathway by acting
downstream of PIF in the dark. Moreover, B-GATAs have a protective role against
the harmful effects of photooxidation by the upregulation of the POR genes and
the carotenoid biosynthesis pathway (Figure 28).
5.6 The interplay between B-GATAs and GLK transcription factors promotes
greening
Until now, there were no transcription factors discussed in the literature that are
able to directly control the expression of GLK1 and GLK2 genes, which encode
for transcription factors with a pivotal role in greening. This study shows that B-
GATA GNL can bind to the promoters of GLK1 and GLK2 and that may induce
their expression (Figure 29). The absence of additive phenotype regarding
greening in the gnc gnl glk1 glk2 quadruple mutant when compared to glk1 glk2
indicates that GNC, GNL and GLKs function in the same pathway (Figure 30).
Moreover, GNLox seedlings are not able to induce greening in the glk1 glk2
double mutant background, indicating that GNL operates upstream of or in
parallel to GLKs (Figure 30). Further experiments in this study showed that
chlorophyll biosynthesis genes such as HEMA1, GUN5, GUN4, CRD1 and CAO
are regulated in an additive manner by B-GATAs and GLKs. On the other hand,
other genes related to greening such as CHLI1, CHLI2, CHLD, DVR, GUN2, SIG2
and SIG6, are controlled exclusively by GNC and GNL but not by GLKs (Figure
31).
5.7 The B-GATAs GNC and GNL induce greening by controlling the
chloroplast transcription via the upregulation of SIG2 and SIG6 chloroplast
proteins
SIGs control the expression of chloroplast genes by their association with the
PEP enzyme (Börner et al. 2015). Until now, there was no information about the
transcriptional regulation of SIG genes. Here, it was hypothesized that SIG2 and
SIG6 might be targets GNL. This scenario was, indeed, true since GNL is able to
associate with the promoters of both SIGs and therefore, can induce their
expression (Figures 32 and 34). Further genetic experiments revealed that there

92
is an interplay between B-GATAs and SIGs regarding greening, which underlines
for the first time the role of SIG2 and SIG6 as mediators of signals related to
greening through the B-GATAs (Figures 33 and 36). Moreover, it was also shown
that SIG2 and SIG6 are upregulated by GNC and GNL in a cytokinin-dependent
manner (Figure 37). This study establishes a novel association between the
hormone cytokinin and the transcriptional regulation of SIGs. Finally, it was also
shown that a negative feedback loop might exist through which SIG2 and SIG6
can repress the expression of GNC and GNL (Figure 38). This negative feedback
regulation can be explained as part of a control mechanism through which
greening can be potentially fine-tuned.
5.8 B-GATAs are positive regulators of the retrograde signaling
The communication between chloroplasts and the nucleus (retrograde signaling),
which can eventually lead to the regulation of some nuclear encoded genes, is
important for the proper development of plants. So far very few transcription
factors have been suggested to participate in retrograde signaling. The co-
ordination of the genome of the chloroplast and the nucleus play an important role
in the chlorophyll biosynthesis and photosynthesis. Therefore, after the discovery
of the relationship between GUN2, GUN4 and GUN5 genes with GNC and GNL it
was hypothesized that this link can potentially affect retrograde signaling, since all
of the GUN genes, studied in this thesis, have a role in the retrograde signaling
(Sussek et al. 2003). Genetic analysis of GUN mutants in the gnc gnl double
mutant revealed the role of GNC and GNL as positive regulators of retrograde
signaling, a fact, which so far was completely unknown (Figure 39). The direct
implication of B-GATAs in retrograde signaling open a whole new level in the
regulatory roles, of B-GATAs, which can be extended far beyond the chlorophyll
biosynthesis, since this communication could mediate signals related to stress,
hormones synthesis etc. Further experiments will be needed to fully explain the
specific role(s) that these two B-GATAs potentially have in retrograde signaling.

93
5.9 Model of the proposed contribution of B-GATAs in greening of
Arabidopsis
The major question and the core of the research conducted in this thesis was how
the B-GATA GNC and GNL can promote greening in Arabidopsis. It can be
concluded that GNC and GNL are able to control greening not only in a just linear
way, such as by regulate genes related to chlorophyll biosynthesis pathway.
Instead, they do so by being able to coordinate, synchronize and promote the
expression of genes, which can induce greening in many different ways (Figure
42). Such complex regulation of greening is in line with the importance of
chlorophyll production for the survival of the plants that do not solely rely on the
upregulation of a single pathway. Moreover, the results, which are presented in
this thesis, could shape a model that can be used, either partially or as a whole, to
expand our knowledge in regulation of the chlorophyll biosynthesis also in other
photosynthetic organisms. This can be a subject of future research, and could
shed more light on the evolutionary conservation of the regulation of the
chlorophyll biosynthesis mechanism.
Different colored letters represent proteins with an implication in different
pathways which contribute to greening in Arabidopsis. The light-blue letters refer
to the transcription factors with a positive role in greening. The purple letters refer
to proteins, which regulate transcription in the chloroplast. The green letters refer
to enzymes, which catalyze steps in the chlorophyll biosynthesis pathway. The
red letters refer to GUN2, an enzyme which play a role in the heme/phytochromes
pathway. The brown letters refer to PIF transcription factors, which play a role in
greening. ( ): indicates induction of gene expression and ( ) : indicates
repression of gene expression.

94
Figure 42: Proposed model of the mechanism through which GNC and GNL contribute to greening in Arabidopsis.

95
6. Literature
Adhikari, N.D. et al., 2011. GUN4-porphyrin complexes bind the ChlH/GUN5
subunit of Mg-Chelatase and promote chlorophyll biosynthesis in
Arabidopsis. The Plant cell, 23(4), pp.1449–1467.
Adhikari, N.D. et al., 2009. Prophyrins promote the association of GENOMES
UNCOUPLED 4 and a Mg-chelatase subunit with chloroplast membranes.
Journal of Biological Chemistry, 284(37), pp.24783–24796.
Al-Sady, B. et al., 2006. Photoactivated Phytochrome Induces Rapid PIF3
Phosphorylation Prior to Proteasome-Mediated Degradation. Molecular Cell,
23(3), pp.439–446.
Allison, L. a, 2000. The role of sigma factors in plastid transcription. Biochimie,
82(6–7), pp.537–548.
An, Y. et al., 2014. Poplar GATA transcription factor PdGNC is capable of
regulating chloroplast ultrastructure, photosynthesis, and vegetative growth in
Arabidopsis under varying nitrogen levels. Plant Cell, Tissue and Organ
Culture (PCTOC), 119(2), pp.313–327.
Bailey, P.C. et al., 2003. Update on the basic helix-loop-helix transcription factor
gene family in Arabidopsis thaliana. The Plant Cell, 15(11), pp.2497–502.
Behringer, C. et al., 2014. Functional diversification within the family of B-GATA
transcription factors through the LLM-domain. Plant Physiology,
166(September), pp.293–305.
Behringer, C. & Schwechheimer, C., 2015. B-GATA transcription factors –
insights into their structure, regulation, and role in plant development.
Frontiers in Plant Science, 6(February), pp.1–12.
Bensmihen, S. et al., 2004. Analysis of an activated ABI5 allele using a new
selection method for transgenic Arabidopsis seeds. FEBS Letters, 561(1–3),
pp.127–131.

96
Berry, J.O. et al., 2013. Photosynthetic gene expression in higher plants.
Photosynthesis Research, 117(1–3), pp.91–120.
Bi, Y.M. et al., 2005. Genetic analysis of Arabidopsis GATA transcription factor
gene family reveals a nitrate-inducible member important for chlorophyll
synthesis and glucose sensitivity. Plant Journal, 44(4), pp.680–692.
Börner, T. et al., 2015. Chloroplast RNA polymerases: Role in chloroplast
biogenesis. Biochimica et Biophysica Acta, 1847(9), pp.761–769.
Cheminant, S. et al., 2011. DELLAs regulate chlorophyll and carotenoid
biosynthesis to prevent photooxidative damage during seedling deetiolation
in Arabidopsis. The Plant Cell, 23(5), pp.1849–1860.
Cheng, Y.-C. & Fleming, G.R., 2009. Dynamics of Light Harvesting in
Photosynthesis. Annual Review of Physical Chemistry, 60(1), pp.241–262.
Claeys, M. et al., 2012. Motifsuite: Workflow for probabilistic motif detection and
assessment. Bioinformatics, 28(14), pp.1931–1932.
Davis, S.J., Kurepa, J. & Vierstra, R.D., 1999. The Arabidopsis thaliana HY1
locus, required for phytochrome-chromophore biosynthesis, encodes a
protein related to heme oxygenases. Proceedings of the National Academy of
Sciences of the United States of America, 96(11), pp.6541–6546.
Davison, P. a. et al., 2005. Structural and biochemical characterization of Gun4
suggests a mechanism for its role in chlorophyll biosynthesis. Biochemistry,
44(21), pp.7603–7612.
Earley, K.W. et al., 2006. Gateway-compatible vectors for plant functional
genomics and proteomics. Plant Journal, 45(4), pp.616–629.
Evans, T., Reitman, M. & Felsenfeld, G., 1988. An erythrocyte-specific DNA-
binding factor recognizes a regulatory sequence common to all chicken
globin genes. Proceedings of the National Academy of Sciences of the
United States of America, 85(16), pp.5976–5980.

97
Fitter, D.W. et al., 2002. GLK gene pairs regulate chloroplast development in
diverse plant species. Plant Journal, 31(6), pp.713–727.
Frick, G. et al., 2003. An Arabidopsis porB porC double mutant lacking light-
dependent NADPH:protochlorophyllide oxidoreductases B and C is highly
chlorophyll-deficient and developmentally arrested. Plant Journal, 35(2),
pp.141–153.
Fujiwara, M. et al., 2000. Three new nuclear genes, sigD, sigE and sigF, encoding
putative plastid RNA polymerase factors in Arabidopsis thaliana. FEBS
Letters, 481(1), pp.47–52.
Hall, L.N. et al., 1998. GOLDEN 2: a novel transcriptional regulator of cellular
differentiation in the maize leaf. The Plant Cell, 10(6), pp.925–36.
Hirashima, M. et al., 2006. Pigment shuffling in antenna systems achieved by
expressing prokaryotic chlorophyllide a oxygenase in Arabidopsis. Journal of
Biological Chemistry, 281(22), pp.15385–15393.
Huang, Y.-S. & Li, H.-M., 2009. Arabidopsis CHLI2 can substitute for CHLI1. Plant
Physiology, 150(2), pp.636–645.
Hudson, D. et al., 2011. GNC and CGA1 modulate chlorophyll biosynthesis and
glutamate synthase (GLU1/FD-GOGAT) expression in Arabidopsis. PLoS
ONE, 6(11).
Hudson, D. et al., 2013. Rice cytokinin GATA transcription Factor1 regulates
chloroplast development and plant architecture. Plant Physiology, 162(1),
pp.132–44.
Huq, E. et al., 2004. Phytochrome-interacting factor 1 is a critical bHLH regulator
of chlorophyll biosynthesis. Science (New York, N.Y.), 305(5692), pp.1937–
1941.
Huq, E., Al-Sady, B. & Quail, P.H., 2003. Nuclear translocation of the
photoreceptor phytochrome B is necessary for its biological function in
seedling photomorphogenesis. Plant Journal, 35(5), pp.660–664.

98
Ishizaki, Y. et al., 2005. A nuclear-encoded sigma factor, Arabidopsis SIG6,
recognizes sigma-70 type chloroplast promoters and regulates early
chloroplast development in cotyledons. Plant Journal, 42(2), pp.133–144.
Jagendorf, A. & Uribe, E., 1966. ATP formation caused by acid-base transition of
spinach chloroplasts. Proceedings of the National Academy of Sciences of
the United States of America, 55, pp.170–177.
Kanamaru, K. & Tanaka, K., 2004. Roles of Chloroplast RNA Polymerase Sigma
Factors in Chloroplast Development and Stress Response in Higher Plants.
Bioscience, Biotechnology, and Biochemistry, 68(11), pp.2215–2223.
Kaufmann, K. et al., 2010. Chromatin immunoprecipitation (ChIP) of plant
transcription factors followed by sequencing (ChIP-SEQ) or hybridization to
whole genome arrays (ChIP-CHIP). Nature Protocols, 5(3), pp.457–472.
Kiba, T. et al., 2005. Combinatorial microarray analysis revealing Arabidopsis
genes implicated in cytokinin responses through the His Asp
phosphorelay circuitry. Plant and Cell Physiology, 46(2), pp.339–355.
Klermund, C. et al., 2016. LLM-Domain B-GATA Transcription Factors Promote
Stomatal Development Downstream of Light Signaling Pathways in
Arabidopsis thaliana Hypocotyls. The Plant Cell, 28(3), pp.646–660.
Kobayashi, K. et al., 2008. Functional analysis of Arabidopsis thaliana isoforms of
the Mg-chelatase CHLI subunit. Photochemical & photobiological sciences :
Official journal of the European Photochemistry Association and the
European Society for Photobiology, 7(10), pp.1188–1195.
Kobayashi, K. et al., 2012. Regulation of Root Greening by Light and
Auxin/Cytokinin Signaling in Arabidopsis. The Plant Cell, 24(3), pp.1081–
1095.
Kobayashi, K. & Masuda, T., 2016. Transcriptional Regulation of Tetrapyrrole
Biosynthesis in Arabidopsis thaliana. Frontiers in Plant Science,
7(December), pp.1–17.

99
Kohchi, T. et al., 2001. The Arabidopsis HY2 gene encodes phytochromobilin
synthase, a ferredoxin-dependent biliverdin reductase. The Plant Cell, 13(2),
pp.425–436.
Krishna, S.S., Majumdar, I. & Grishin, N. V., 2003. Structural classification of zinc
fingers. Nucleic Acids Research, 31(2), pp.532–550.
Larkin, R.M. et al., 2003. GUN4, a regulator of chlorophyll synthesis and
intracellular signaling. Science (New York, N.Y.), 299(5608), pp.902–906.
Lee, J. et al., 2007. Analysis of transcription factor HY5 genomic binding sites
revealed its hierarchical role in light regulation of development. The Plant
Cell, 19(3), pp.731–49.
Leivar, P. & Quail, P.H., 2011. PIFs: Pivotal components in a cellular signaling
hub. Trends in Plant Science, 16(1), pp.19–28.
Li, R. et al., 2008. SOAP: Short oligonucleotide alignment program.
Bioinformatics, 24(5), pp.713–714.
Liu, X. et al., 2013. PHYTOCHROME INTERACTING FACTOR3 associates with
the histone deacetylase HDA15 in repression of chlorophyll biosynthesis and
photosynthesis in etiolated Arabidopsis seedlings. The Plant Cell, 25(4),
pp.1258–73.
Loschelder, H. et al., 2006. Dual temporal role of plastid sigma factor 6 in
Arabidopsis development. Plant Physiology, 142(2), pp.642–650.
Lowry, J. a & Atchley, W.R., 2000. Molecular evolution of the GATA family of
transcription factors: conservation within the DNA-binding domain. Journal of
Molecular Evolution, 50(2), pp.103–115.
Lysenko, E. a., 2007. Plant sigma factors and their role in plastid transcription.
Plant Cell Reports, 26(7), pp.845–859.
Mara, C.D. & Irish, V.F., 2008. Two GATA transcription factors are downstream
effectors of floral homeotic gene action in Arabidopsis. Plant Physiology, 147,

100
pp.707–718.
Mochizuki, N., Brusslan, J. a, Larkin, R., Nagatani, a, et al., 2001. Arabidopsis
genomes uncoupled 5 (GUN5) mutant reveals the involvement of Mg-
chelatase H subunit in plastid-to-nucleus signal transduction. Proceedings of
the National Academy of Sciences of the United States of America, 98(4),
pp.2053–2058.
Mochizuki, N., Brusslan, J. a, Larkin, R., Nagatani, A., et al., 2001. Arabidopsis
genomes uncoupled 5 (GUN5) mutant reveals the involvement of Mg-
chelatase H subunit in plastid-to-nucleus signal transduction. Proceedings of
the National Academy of Sciences of the United States of America, 98(4),
pp.2053–2058.
Monte, E. et al., 2004. The phytochrome-interacting transcription factor, PIF3,
acts early, selectively, and positively in light-induced chloroplast
development. Proceedings of the National Academy of Sciences of the
United States of America, 101(46), pp.16091–16098.
Moon, J. et al., 2008. PIF1 directly and indirectly regulates chlorophyll
biosynthesis to optimize the greening process in Arabidopsis. Proceedings of
the National Academy of Sciences of the United States of America, 105(27),
pp.9433–9438.
Moran, R., 1982. Formulae for determination of chlorophyllous pigments extracted
with n,n-dimethylformamide. Plant Physiology, 69(6), pp.1376–1381.
Muiño, J.M. et al., 2011. ChIP-seq Analysis in R (CSAR): An R package for the
statistical detection of protein-bound genomic regions. Plant Methods, 7(1),
p.11.
Nagata, N. et al., 2005. Identification of a vinyl reductase gene for chlorophyll
synthesis in Arabidopsis thaliana and implications for the evolution of
Prochlorococcus species. The Plant Cell, 17(1), pp.233–240.
Naito, T. et al., 2007. Characterization of a unique GATA family gene that

101
responds to both light and cytokinin in Arabidopsis thaliana. Bioscience,
Biotechnology, and Biochemistry, 71(6), pp.1557–1560.
Nakanishi, H. et al., 2005. Characterization of the Arabidopsis thaliana mutant
pcb2 which accumulates divinyl chlorophylls. Plant and Cell Physiology,
46(3), pp.467–473.
Nelson, N. & Yocum, C.F., 2006. Structure and Function of Photosystems I and Ii.
Annual Review of Plant Biology, 57(1), pp.521–565.
Omichinski, J.G. et al., 1993. NMR structure of a specific DNA complex of Zn-
containing DNA binding domain of GATA-1. Science (New York, N.Y.),
261(5120), pp.438–446.
Parks, B.M. & Quail, P.H., 1991. Mutants of Arabidopsis Are Defective in
Phytochrome Chromophore Biosynt hesis. Plant Cell, 3(November),
pp.1177–86.
Powell, Ann l. t. et al., 2012. Uniform ripening Encodes a Golden. Science,
336(June), pp.1711–1715.
Ranftl, Q.L. et al., 2016. LLM-Domain Containing B-GATA Factors Control
Different Aspects of Cytokinin-Regulated Development in Arabidopsis
thaliana 1. 170(April), pp.2295–2311.
Reyes, J.C., Muro-Pastor, M.I. & Florencio, F.J., 2004. The GATA family of
transcription factors in Arabidopsis and rice. Plant Physiology, 134(4),
pp.1718–1732.
Richter, R. et al., 2010. The GATA-type transcription factors GNC and GNL/CGA1
repress gibberellin signaling downstream from DELLA proteins and
phytochrome-interacting factors. Genes and Development, 24(18), pp.2093–
2104.
Rossini, L. et al., 2001. The maize golden2 gene defines a novel class of
transcriptional regulators in plants. The Plant cell, 13(5), pp.1231–44.

102
Ruiz-Sola, M.Á. & Rodríguez-Concepción, M., 2012. Carotenoid biosynthesis in
Arabidopsis: a colorful pathway. Arabidopsis Book, 10, p.e0158.
Susek, R.E., Ausubel, F.M. & Chory, J., 1993. Signal transduction mutants of
Arabidopsis uncouple nuclear CAB and RBCS gene expression from
chloroplast development. Cell, 74(5), pp.787–799.
Tanaka, R. & Tanaka, A., 2007. Tetrapyrrole biosynthesis in higher plants. Annual
Review of Plant Biology, 58, pp.321–346.
Thijs, G. et al., 2002. A Gibbs sampling method to detect overrepresented motifs
in the upstream regions of coexpressed genes. Journal of computational
biology : A Journal of Computational Molecular Cell Biology, 9(2), pp.447–
464.
Thijs, G. et al., 2001. A higher-order background model improves the detection of
promoter regulatory elements by Gibbs sampling. Bioinformatics (Oxford,
England), 17(12), pp.1113–1122.
Tsuzuki, T. et al., 2011. Mg-chelatase H subunit affects ABA signaling in stomatal
guard cells, but is not an ABA receptor in Arabidopsis thaliana. Journal of
Plant Research, 124(4), pp.527–538.
Waters, M.T. et al., 2009. GLK transcription factors coordinate expression of the
photosynthetic apparatus in Arabidopsis. The Plant Cell, 21(4), pp.1109–
1128.
Waters, M.T. & Langdale, J. a, 2009. The making of a chloroplast. The EMBO
journal, 28(19), pp.2861–2873.
Waters, M.T., Moylan, E.C. & Langdale, J. a., 2008. GLK transcription factors
regulate chloroplast development in a cell-autonomous manner. Plant
Journal, 56(3), pp.432–444.
Welsch, R. et al., 2000. Regulation and activation of phytoene synthase, a key
enzyme in carotenoid biosynthesis, during photomorphogenesis. Planta,
211(6), pp.846–54.

103
Woodson, J.D. & Chory, J., 2008. Coordination of gene expression between
organellar and nuclear genomes. Nature reviews. Genetics, 9(5), pp.383–
395.
Woodson, J.D., Perez-Ruiz, J.M. & Chory, J., 2011. Heme synthesis by plastid
ferrochelatase i regulates nuclear gene expression in plants. Current Biology,
21(10), pp.897–903.
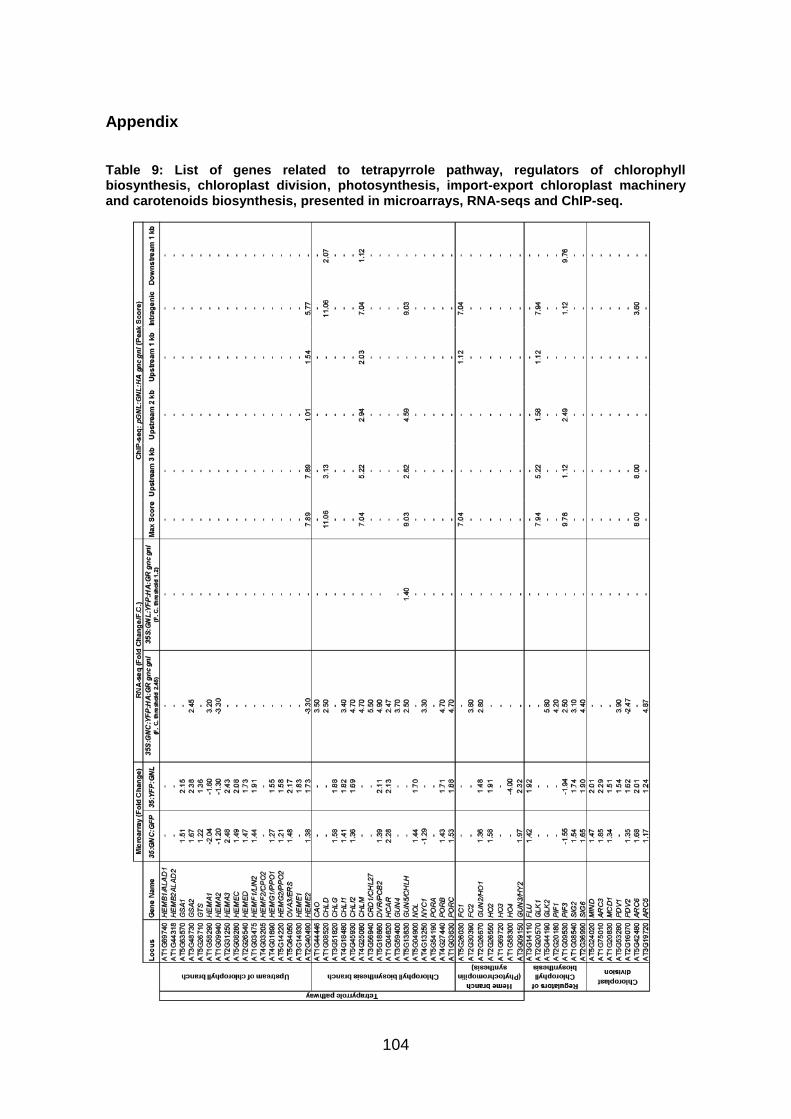
104
Appendix
Table 9: List of genes related to tetrapyrrole pathway, regulators of chlorophyll biosynthesis, chloroplast division, photosynthesis, import-export chloroplast machinery and carotenoids biosynthesis, presented in microarrays, RNA-seqs and ChIP-seq.

105
Table 9: continue

106
Table 9: continue

107
Table 10: List of genes from the overlap of ChIP-seq with pGNL:GNL:HA gnc gnl and the RNA-seq with 35S:GNC:YFP:HA:GR gnc gnl for 3 h Dex and CHX (filtered with fold change threshold/F.C. 2.45 and FDR < 0.01).

108

109

110

111

112

113

114

115

116

117

118
Table 11: List of genes from the overlap of ChIP-seq with pGNL:GNL:HA gnc gnl and the RNA-seq with 35S:GNL:YFP:HA:GR gnc gnl for 3 h Dex and CHX (filtered with fold change threshold/F.C. 1.2 and FDR < 0.1).
Table 12: List of genes from the overlap between the common genes from the ChIP-seq with pGNL:GNL:HA gnc gnl and the RNA-seq with 35S:GNC:YFP:HA gnc gnl with a list of genes with a role in chlorophyll biosynthesis.
Table 13: List of genes with overlap between the common genes from the ChIP-seq with pGNL:GNL:HA gnc gnl and the RNA-seq with 35S:GNL:YFP:HA gnc gnl with a list of genes with a role in chlorophyll biosynthesis.