Embed Size (px)
Citation preview

Food Structure Food Structure
Volume 10 Number 4 Article 9
1-1-1991
The Contribution of Milk Serum Proteins to the Development of The Contribution of Milk Serum Proteins to the Development of
Whipped Cream Structure Whipped Cream Structure
Eric C. Needs AFRC Institute of Food Research
Alan Huitson AFRC Institute of Food Research
Follow this and additional works at: https://digitalcommons.usu.edu/foodmicrostructure
Recommended Citation Recommended Citation Needs, Eric C. and Huitson, Alan (1991) "The Contribution of Milk Serum Proteins to the Development of Whipped Cream Structure," Food Structure: Vol. 10 : No. 4 , Article 9. Available at: https://digitalcommons.usu.edu/foodmicrostructure/vol10/iss4/9
This Article is brought to you for free and open access by the Western Dairy Center at DigitalCommons@USU. It has been accepted for inclusion in Food Structure by an authorized administrator of DigitalCommons@USU. For more information, please contact [email protected].

FOOD STRUCTURE, Vol. 10 (1991), pp. 353-360 1046-705X/91$3.00+ .00 Scanning Microscopy International, Chicago (AMF O'Hare), IL 60666 USA
THE CONTRIBUTION OF MILK SERUM PROTEINS TO THE
DEVEWPMENT OF WHIPPED CREAM STRUCTURE
Eric C. Needs and Alan Huitson
AFRC Institute of Food Research, Reading Laboratory, Shinfield, Reading, Berks., RG2 9AT, UK
Abstract
The role of milk serum proteins in the development of foam structure during the whipping of 38% fat cream was investigated. Proteins were removed from the aqueous phase by washing the cream with simulated milk ultrafiltrate. The natural protein complement was replaced with either casein or whey protein preparations. When creams with different protein compositions were whipped to a defined end point the structural properties of the foams were similar but removal of protein caused a 50% reduction in whipping time. Other creams were whipped for fixed times of between 30 and 180 seconds to investigate the development and formation of the foam structure. This was greatly influenced by the protein composition. The presence of whey protein resulted in an initial lag phase in structure development, which was not so apparent when the added protein was casein. The lag phase was attributed to differences in structure of globular and disordered proteins and their behaviour at interfaces.
Key words: Whipped cream, milk protein, casein, whey protein, whipping properties, whipping time, cream stiffness, bubble size.
Initial paper received July 3, 1991 Manuscript received October 15, 1991 Direct inquiries to E.C. Needs Telephone number: 44 734 883103 FAX number: 44 734 884763
353
Introduction
Pasteurized, unhomogenized whipping cream normally contains between 35 and 40% (by weight) fat, of which a high proportion must be solid ( 40% suggested by Darling, 1982) at the time of whipping. The protein content is approximately 2% (w) and has a composition similar to the original milk with an enrichment in milk fat globule membrane (MFGM) protein. This protein accounts for less than 1 % of the total protein in milk. However, in whipping cream it accounts for around 12% of the total protein due to the high fat content (M. Anderson et al., private communication).
During whipping, the cream is converted from a two-phase fat(liquid and crystalline)-in-water emulsion to a three-phase system as air is incorporated and eventually trapped by a network of fat globules. Initially, a high-volume foam, containing large air cells, is formed. The air-serum interface of newly formed air bubbles is stabilized by proteins which are rapidly adsorbed from the milk serum (Walstra and Jenness, 1984). By analogy with skim-milk foams, Anderson et al. (1987) have suggested that, although casein micelles are associated with the air-serum interface, they are not primary components of the interface. However, /3-casein, which dissociates from the micelles at low temperature (Creamer et al., 1977), is adsorbed at the air-serum interface.
As whipping proceeds, the air bubble size distribution narrows (Noda and Shinoki, 1986) and the average bubble size is reduced (Schmidt and van Hooydonk, 1980). During this process, fat globules become adsorbed at the air surface. Buchheim (1978) and Brooker et al. (1986) have both shown, by electron microscopy, that MFGM is removed from the globule where it is in contact with the interface. Fat crystals at the surface of the globule penetrate into the air cell. Areas of proteinstabilized air-serum interface remain interspersed between adsorbed fat globules (Brooker et al., 1986; Anderson and Brooker, 1988).
In the fmal stage of whipping, a network of partially coalesced fat globules is built up which serves to hold the air bubbles in place, trap the serum phase in pockets
E. C. Needs and A. Huitson
and to form the stiff structure of whipped cream. The aim of the present work was to investigate the
role of the different classes of milk proteins in the development of whipped cream structure.
Experimental
Simulated milk ultrafiltrate and protein preparations
Simulated milk ultrafiltrate (SMUF), pH 6.6, was prepared according to the method of Jenness and Koops (1962). Lactose was dissolved in the SMUF used for standardizing the washed cream. The amount was adjusted to give a concentration of 2% lactose in the finished cream.
Whey proteins were prepared from skim milk as described by Skudder (1985) and their purity was examined by fast protein liquid chromatography (FPLC) (Andrews et al., 1985). Casein micelles were isolated by centrifuging skim milk at 12x1o4 g for 60 minutes and resuspending the pellet in SMUF. The whey protein content was estimated by gel electrophoresis and densitometry (Hillier, 197 6). Alternative! y commercial casein (Hammarsten, BDH Chemicals, Poole, U.K.) was used.
Processing of milk and cream
Raw milk from the Institute herd was preheated to 45 o C and cream was separated through a small centrifugal separator (Alpha Excell 18, Alfa Laval Ltd., Brentford, Middlesex, U.K.). A portion of cream was standardized to 3 8 % , pasteurized and cooled to 4 o C (unwashed control cream).
Remaining cream was washed either with skim milk (skim-washed control cream), saved from the initial separation, or with SMUF. While still at 45 °C, the cream was diluted 1:2 (w/w) with either the skim milk or SMUF (heated to 45 o C) and reseparated. The process was repeated till the cream had been washed 3 times. Washed creams were standardized to 3 8 % fat. Where specified, either whey protein or casein was included. Lyophilized whey protein or casein powder, or a suspension of casein micelles were dispersed in the washed cream. The amount of protein added was adjusted to give a fmal concentration in the standardized cream of 2%, approximating to the level in 38% fat whipping cream. Creams were pasteurized at 7 4 o C for 15 seconds in a small heat exchanger.
Cream whipping and whipped characteristics
All creams were held overnight at 4 o C before whipping. Whipping was performed in a Kenwood Chef (Model type A901, Thorn EMI Ltd., Havant, U.K.) at maximum speed (approx 450 rpm). Creams were whipped to a defined observable end point which was the time at which the cream in contact with the beaters broke away from the remainder of the cream in the
354
bowl. Other creams were whipped for a fixed time. Duplicate aliquots of each cream were whipped and
whipping time and overrun were measured as described previously (Needs et al., 1988).
Cream stiffness was measured with a Lloyd M5K Universal Testing Machine fitted with a 5 Newton load cell (Lloyd Instruments, Southampton, U.K.). An eightspoked spider with a circumference of 32 mm was inserted into the whipped cream to a maximum depth of 25 mm at a speed of 10 mm/min. The probe was constructed of steel bar 0.8 mm wide and 2.6 mm deep. Load increased steadily with deformation for between 4.5 and 6 mm, after which deformation was continuous at the same load. The equilibrium load value was taken as the measure of cream stiffness due to the presence of the fat globule matrix.
The value obtained does not take into account variation in density of the whipped cream due to variable levels of air incorporation. Smith (1989) has suggested that equation (1) defines a relationship between a general mechanical property of the foam ( o) and the appropriate bubble wall mechanical property Caw):
a (1)
where V is the volume of the foam and V w is the volume of the foam wall material. In the case of whipped cream, if V w is assumed to be constant, then equation (1) can be reduced to equation (2).
(J vn = kcr w (2)
Data indicates that n approximates to 1. 5 which agrees with the value of n for rigid foam systems presented by Smith (1989). In the present study, a measure of the rigidity of the fat globule network was obtained from the product of stiffness and overrun for each cream sample. This figure we have termed structure assessment value (SA V).
Chemical and physical analyses
Fat, protein and lactose percentages in milk samples were measured on a Foss Milko-Scan (Foss Electric, Hillen~d, Denmark). Fat content of the creams was measured by the Gerber method (British Standards Inst. , 1969).
Kjeldahl digestion (British Standards Inst., 1988) and auto-analysis (Florence and Milner, 1979) were used for total nitrogen determination. Measurement of a-lactalbumin concentration was by specific double antibody radio-immunoassay (Mackenzie et al., 1985).
Air bubble size distribution in the whipped cream
Development of whipped cream structure
was examined using a light microscope by a method similar to that used for ice-cream (Berger and White, 1979). Cover slips were placed at either end of a slide creating a central trough of uniform size. A small spot of cream was placed on the slide and gently spread by bridging a third cover slip across the gap. It is possible that this technique could disrupt some large bubbles but it is the small bubbles which have the greater influence on air volume to surface area ratio. Random fields of view were photographed at a magnification of 25x. Diameter of at least 1000 air bubbles in the photograph were recorded using MOP-1.2.3 Modular System for Quantitative Digital Image Analysis (Kontron Messgerate, Miinchen, Germany).
Samples of whipped cream were examined by transmission electron microscopy as described by Brooker et al. (1986).
Statistical analysis
The hypothesis that all the creams were identical, with respect to overrun, stiffness, whipping time, and structure assessment value, was tested using the KruskalWallis (K-W) analysis of variance ranks (Kruskal and Wallis, 1952). When the hypothesis was rejected, use was made of the analysis of variance of the ranks which indicates how the mean rank of each cream differs from the mean rank of all the observed data. The cream which was the most extreme was then omitted and the subsequent reduced hypothesis tested again. By repeated use of the K-W test, the creams were divided into groups within which they could not be differentiated statistically. When only two creams were involved in the hypothesis, the K-W test was replaced by the MannWhitney U test (Mann and Whitney, 1947). The use of these two tests avoids making assumptions about the nature of the distributions of the data.
Results
Washing cream with skimmed milk
Skim-washed control cream was not significantly different from unwashed control cream with respect to protein and fat content and whipping time, overrun and stiffness (Table 1). Values for control cream are therefore averages of these two treatments. Washing cream with water is a technique which has been used to determine fat globule composition and there are a number of objections to the method, mainly concerning loss of membrane material and globule coalescence (Mulder and Walstra, 1974). However, it does appear that the physical processes of repeated separation and dilution of the cream did not result in differences between the whipping properties of skim-washed and unwashed creams. We have assumed that the same was true when the creams were SMUF -washed.
355
Whipping characteristics Five sets of creams were whipped to the defined end
point. Whipping time, overrun, and stiffness values are shown in Table 1. Differences between medians were assessed by K-W tests for whipping time, overrun and stiffness. The differences in whipping times of the 4 types of cream were highly significant (p = 0.0002). The median value for control creams was 116 seconds while washed creams required nearly 50% less whipping with a median time of 64 seconds. Washed cream with either added caseinate or whey protein had intermediate whipping times. There was no significant difference in either overrun or stiffness of the 4 cream types whipped to the defined end point.
The results of whipping the different cream types for a fixed time are shown in Table 2. The fixed time was 90 seconds which was the average value for the 4 cream types whipped to the defined end point. Applying K-W tests to the median values obtained from 10 replicas showed that overrun and stiffness values were significantly different (p < 0.00001 and p = 0.00004, respectively). Further tests showed that cream could be divided into 2 groups. Washed cream and washed cream plus casein were indistinguishable in overrun (p = 0.48) and stiffness (p = 0.83) after whipping for 90 seconds. Control cream and washed cream plus whey protein formed the second group, though there is an indication of a difference in stiffness between these two creams (overrun p = 0.14 and stiffness p = 0.08).
Four sets of creams were whipped for a range of times from 30 to 180 seconds to determine the development of overrun and stiffness. Mean values are shown in Table 3. In this case, 2 sources of casein were used; Hammarsten sodium caseinate powder and casein micelle suspension prepared by ultracentrifugation of skim milk.
In all cases, overrun fell steadily as whipping time was increased. It was initially highest in control cream and washed cream plus whey protein (Table 3).
Both the control and washed cream plus whey protein showed no significant increase in stiffness during the first 60 seconds of whipping. Subsequently, stiffness gradually increased in control cream reaching the lowest maximum value of all the cream types. In washed cream plus whey protein, stiffness rapidly increased between 60 and 120 seconds; further increase was only slight. Washed creams, to which either caseinate or casein micelles had been added, showed modest stiffness development in the initial 60 seconds. The presence of sodium caseinate caused stiffness to increase steeply to form the most stiff cream at 120 seconds whereas theresuspended micelles resulted in gradual increase similar to control cream. Stiffness developed rapidly in washed cream up to 90 seconds then increase in stiffness became more gradual.
E.C. Needs and A. Huitson
Table 1: Whipping characteristics of creams whipped to a defmed end point with a Kenwood Chef. Median
values from 5 separate cream preparations.
Creame Whipping over- Stiff- SAV2
Type time (s) run (%) ness (N)
A1 1258 130 0.81 98
A2 1078 124 0.85 108
B 64b 142 0.74 108
c soh 127 0.69 88
D 97c 132 0.71 89
K-W3 p < 0.001 p = 0.22 p = 0.18 p = 0.8
1 Cream types: A1, Control; A2, skim-washed control; B, Washed with simulated milk ultrafiltrate (SMUF); C, SMUF washed +whey protein; D, SMUF washed + caseinate.
2 SA V, structure assessment value 3 Kruskal-Wallis test for significance of differences
between medians. Medians within a column not followed by a common letter were significantly different.
140
120 Cl> ::J co 100 > c Cl> E
80 VI VI Cl> VI VI <: 60 Cl> .... ::J 0 ::J 40 .... -CJ)
20
30 60 90 120 180
Whipping Time (s)
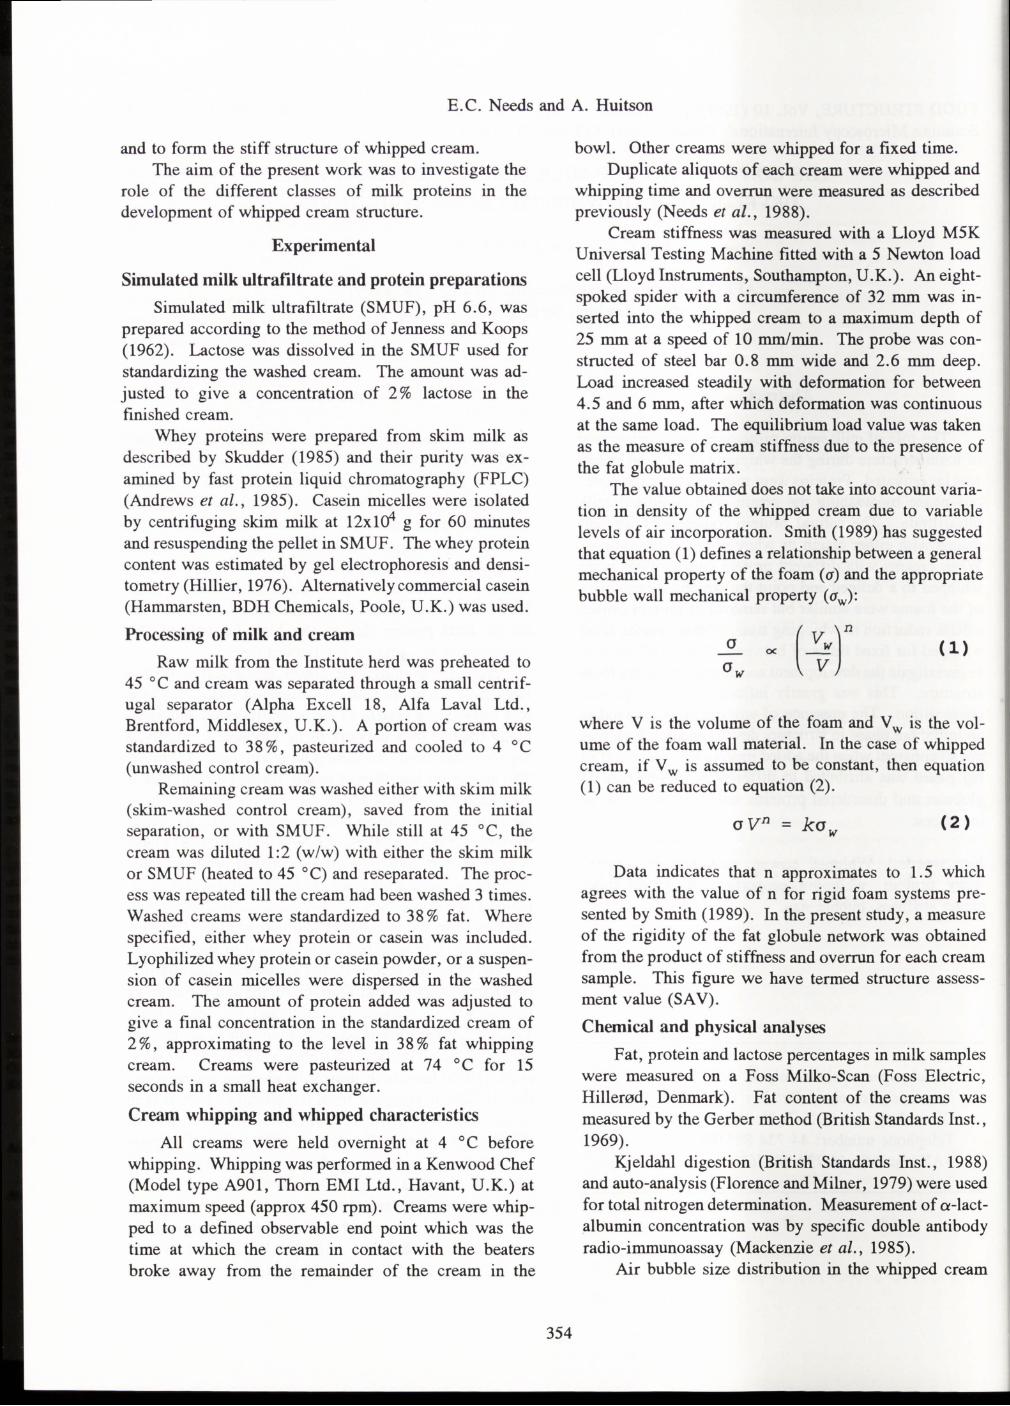
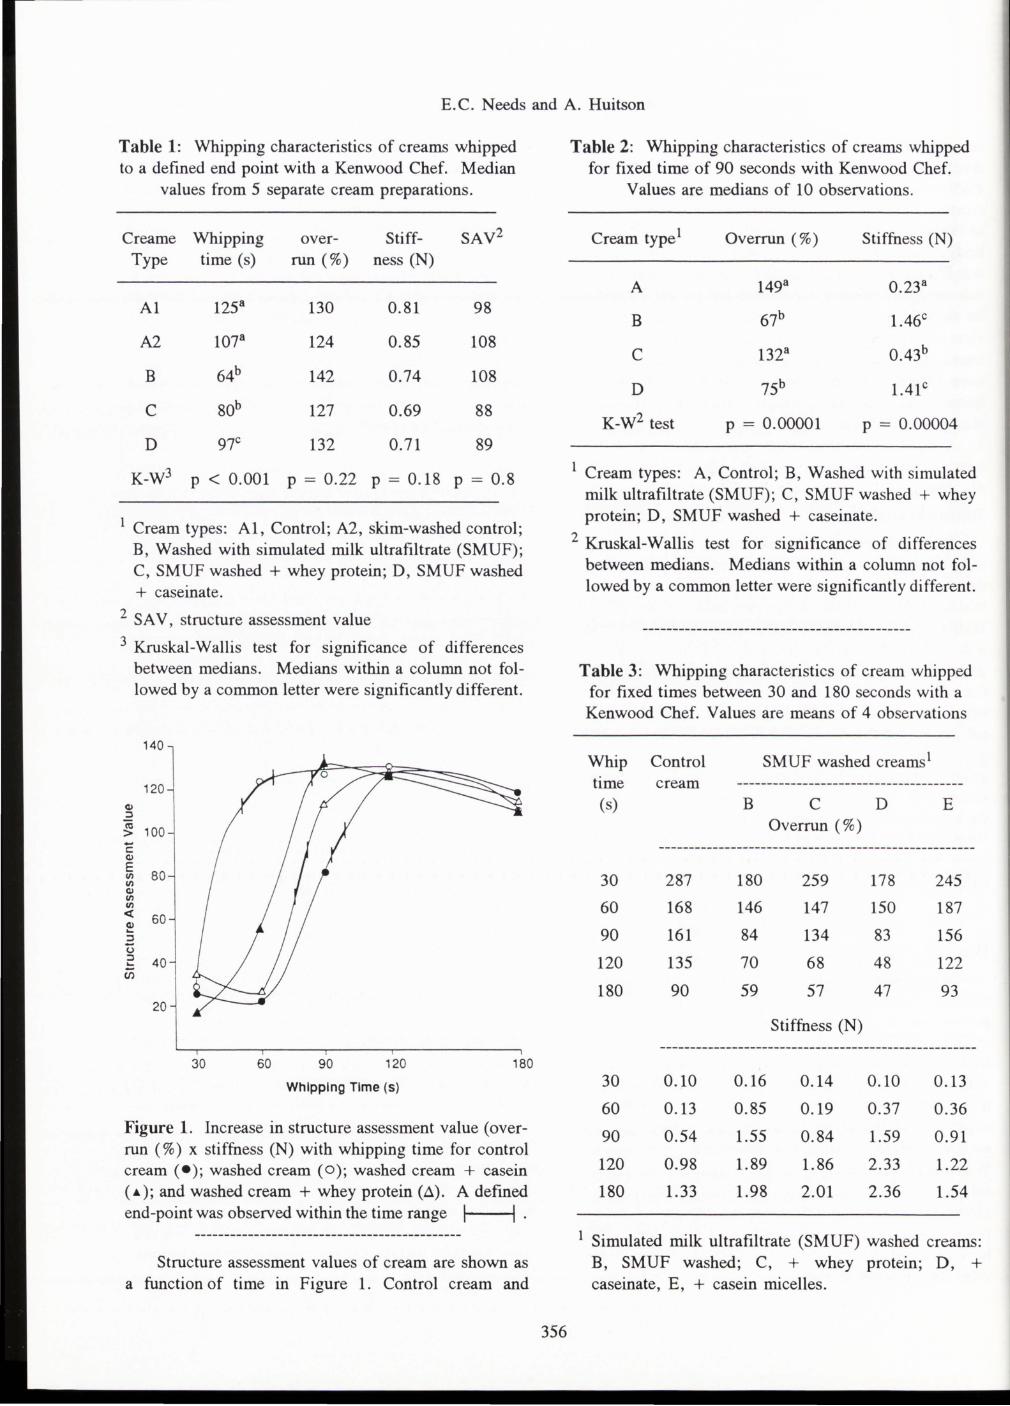
Figure 1. Increase in structure assessment value (overrun (%) x stiffness (N) with whipping time for control cream (• ); washed cream (O); washed cream + casein ( • ); and washed cream + whey protein (.1). A defmed end-point was observed within the time range I I .
Structure assessment values of cream are shown as a function of time in Figure 1. Control cream and
356
Table 2: Whipping characteristics of creams whipped for fixed time of 90 seconds with Kenwood Chef.
Values are medians of 10 observations.
Cream type1 Overrun(%) Stiffness (N)
A 1498 0.238
B 67b 1.46c
c 132a 0.43b
D 75b 1.41c
K-W2 test p = 0.00001 p = 0.00004
1 Cream types: A, Control; B, Washed with simulated milk ultrafiltrate (SMUF); C, SMUF washed + whey protein; D, SMUF washed + caseinate.
2 Kruskal-Wallis test for significance of differences between medians. Medians within a column not followed by a common letter were significantly different.
Table 3: Whipping characteristics of cream whipped for fixed times between 30 and 180 seconds with a Kenwood Chef. Values are means of 4 observations
Whip Control SMUF washed creams 1
time cream --------------------------------------(s) B c D E
Overrun(%)
-----------------------------------------------------
30 287 180 259 178 245
60 168 146 147 150 187
90 161 84 134 83 156
120 135 70 68 48 122
180 90 59 57 47 93
Stiffness (N) -----------------------------------------------------
30 0.10 0.16 0.14 0.10 0.13
60 0.13 0.85 0.19 0.37 0.36
90 0.54 1.55 0.84 1.59 0.91
120 0.98 1.89 1.86 2.33 1.22
180 1.33 1.98 2.01 2.36 1.54
1 Simulated milk ultrafiltrate (SMUF) washed creams: B, SMUF washed; C, + whey protein; D, + caseinate, E, + casein micelles.
Development of whipped cream structure
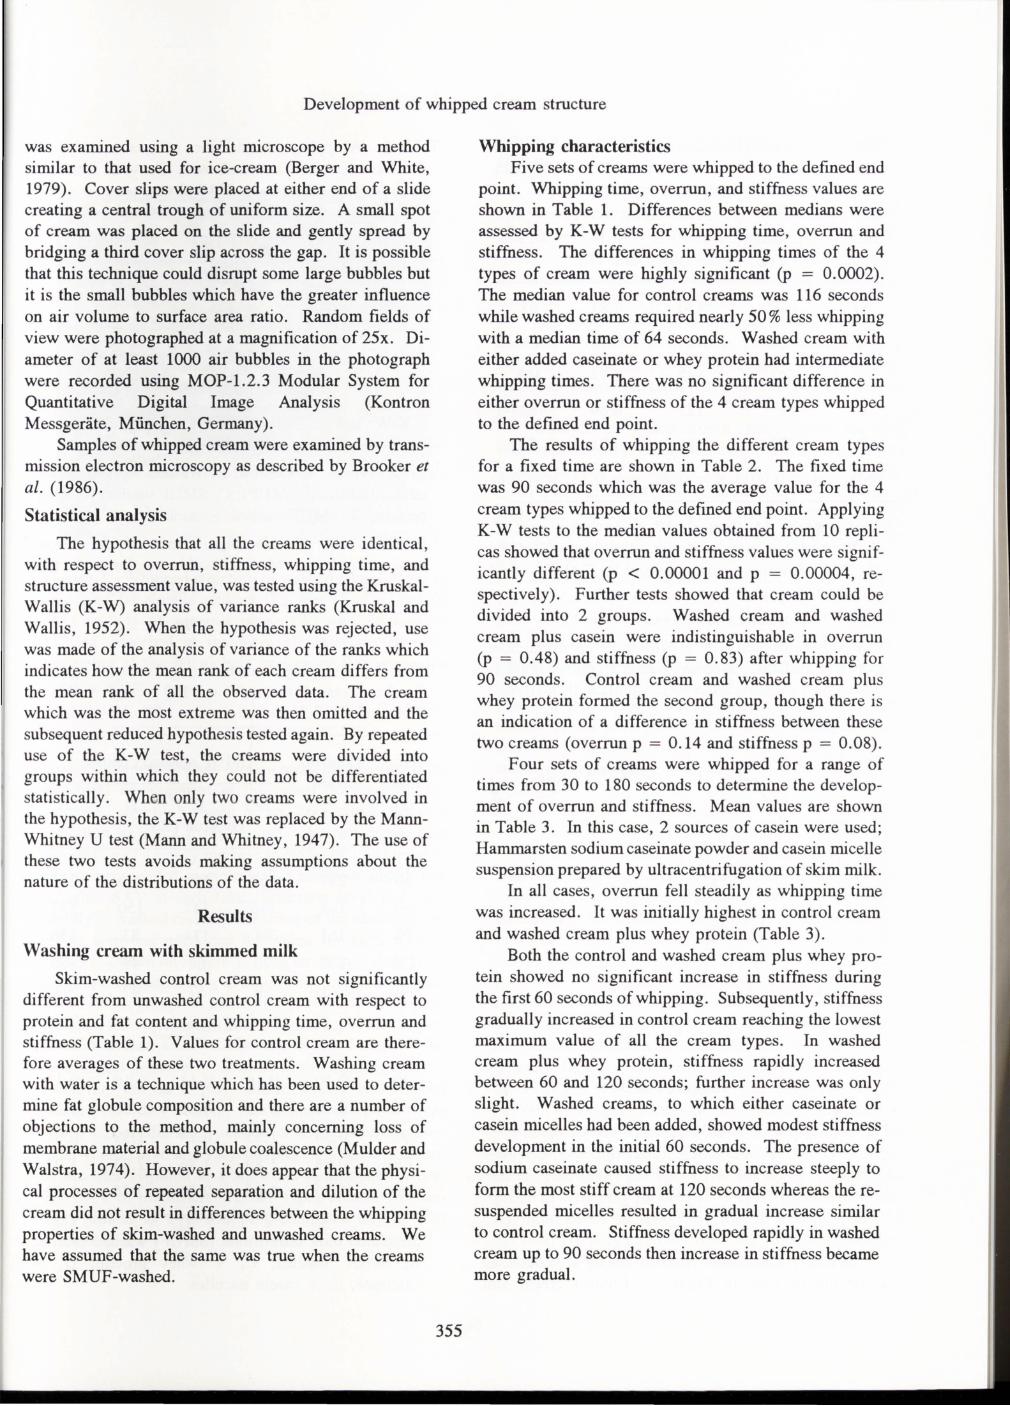
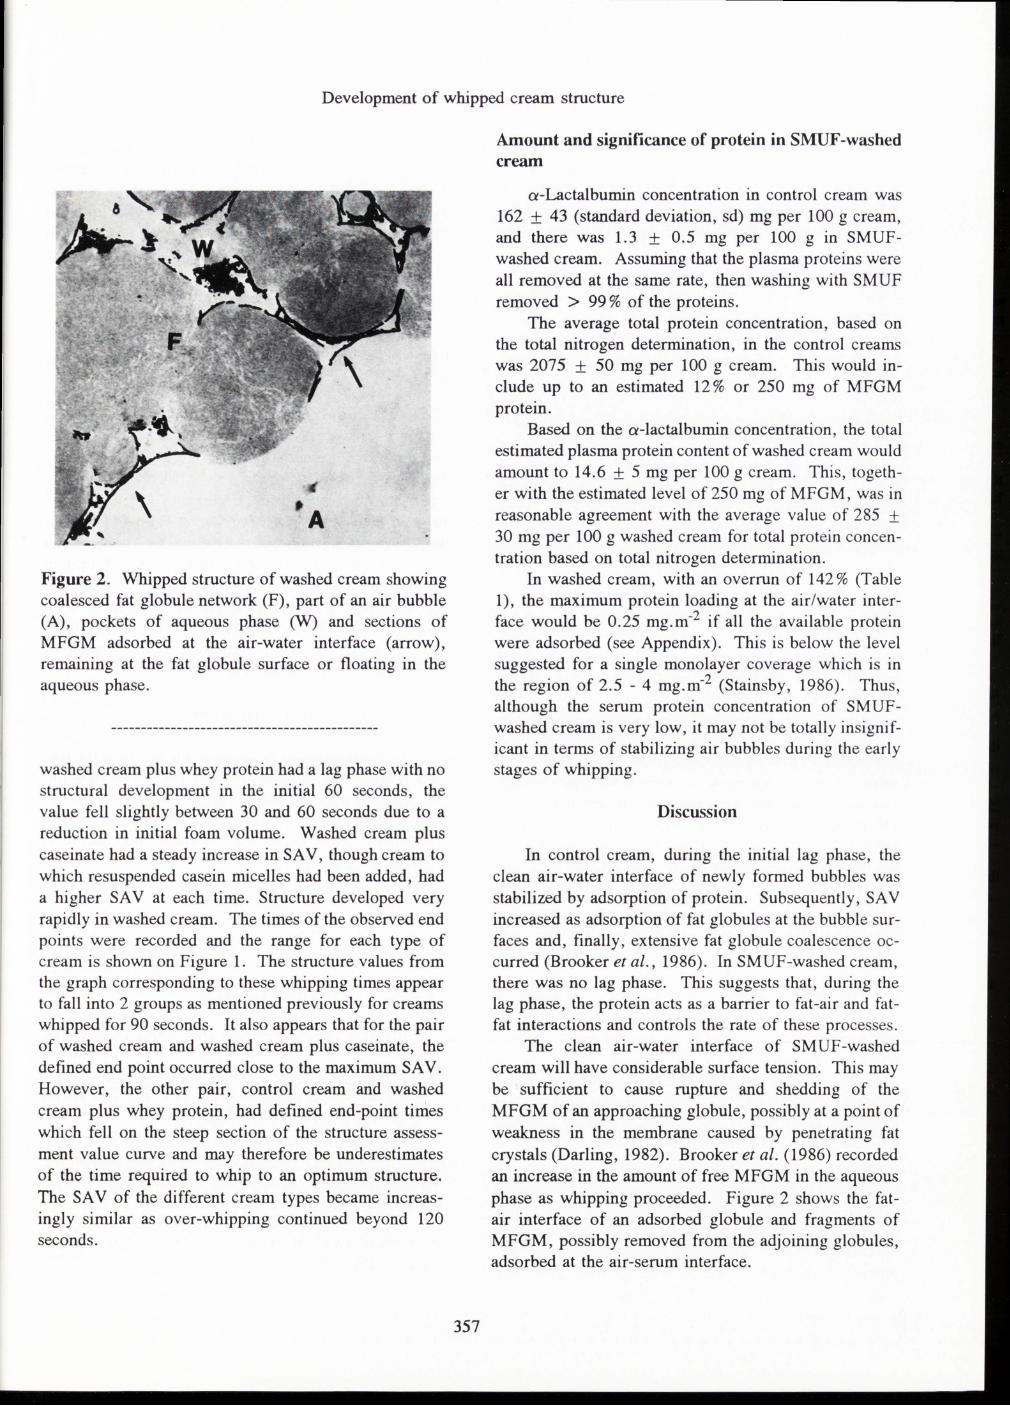
Figure 2. Whipped structure of washed cream showing coalesced fat globule network (F), part of an air bubble (A), pockets of aqueous phase CW) and sections of MFGM adsorbed at the air-water interface (arrow), remaining at the fat globule surface or floating in the aqueous phase.
washed cream plus whey protein had a lag phase with no structural development in the initial 60 seconds, the value fell slightly between 30 and 60 seconds due to a reduction in initial foam volume. Washed cream plus caseinate had a steady increase in SA V, though cream to which resuspended casein micelles had been added, had a higher SA V at each time. Structure developed very rapidly in washed cream. The times of the observed end points were recorded and the range for each type of cream is shown on Figure 1. The structure values from the graph corresponding to these whipping times appear to fall into 2 groups as mentioned previously for creams whipped for 90 seconds. It also appears that for the pair of washed cream and washed cream plus caseinate, the defined end point occurred close to the maximum SA V. However, the other pair, control cream and washed cream plus whey protein, had defmed end-point times which fell on the steep section of the structure assessment value curve and may therefore be underestimates of the time required to whip to an optimum structure. The SA V of the different cream types became increasingly similar as over-whipping continued beyond 120 seconds.
357
Amount and significance of protein in SMUF -washed cream
a-Lactalbumin concentration in control cream was 162 + 43 (standard deviation, sd) mg per 100 g cream, and there was 1.3 ± 0.5 mg per 100 g in SMUFwashed cream. Assuming that the plasma proteins were all removed at the same rate, then washing with SMUF removed > 99% of the proteins.
The average total protein concentration, based on the total nitrogen determination, in the control creams was 2075 ± 50 mg per 100 g cream. This would include up to an estimated 12% or 250 mg of MFGM protein.
Based on the a-lactalbumin concentration, the total estimated plasma protein content of washed cream would amount to 14.6 ± 5 mg per 100 g cream. This, together with the estimated level of 250 mg of MFGM, was in reasonable agreement with the average value of 285 ± 30 mg per 100 g washed cream for total protein concentration based on total nitrogen determination.
In washed cream, with an overrun of 142% (Table 1), the maximum protein loading at the air/water interface would be 0.25 mg.m-2 if all the available protein were adsorbed (see Appendix). This is below the level suggested for a single monolayer coverage which is in the region of 2.5 - 4 mg.m-2 (Stainsby, 1986). Thus, although the serum protein concentration of SMUFwashed cream is very low, it may not be totally insignificant in terms of stabilizing air bubbles during the early stages of whipping.
Discussion
In control cream, during the initial lag phase, the clean air-water interface of newly formed bubbles was stabilized by adsorption of protein. Subsequently, SA V increased as adsorption of fat globules at the bubble surfaces and, finally, extensive fat globule coalescence occurred (Brooker et al., 1986). In SMUF-washed cream, there was no lag phase. This suggests that, during the lag phase, the protein acts as a barrier to fat-air and fatfat interactions and controls the rate of these processes.
The clean air-water interface of SMUF-washed cream will have considerable surface tension. This may be sufficient to cause rupture and shedding of the MFGM of an approaching globule, possibly at a point of weakness in the membrane caused by penetrating fat crystals (Darling, 1982). Brooker et al. (1986) recorded an increase in the amount of free MFGM in the aqueous phase as whipping proceeded. Figure 2 shows the fatair interface of an adsorbed globule and fragments of MFGM, possibly removed from the adjoining globules, adsorbed at the air-serum interface.

E.C. Needs and A. Huitson
In control cream, the frequency with which approaching fat globules adsorb, would be reduced due to competition with the adsorbing proteins. This reduction in the rate of fat globule adsorption may account for the lag phase observed during the whipping of creams containing protein. As a globule approaches an air bubble, the thin liquid film between the two surfaces drains until collapse occurs with the formation of a fat-air interface. The protein molecules are cleared from the point of contact and compressed in the surrounding air-water interface. The chance of collapse of a draining film is related to the mechanical properties of the adsorbed protein film (Fisher and Mitchell, 1989). The lag phase was most pronounced in creams containing whey proteins. This implies a crucial role for these proteins, even in the presence of the more hydrophobic tJ-casein.
Casein films have very low surface viscosity with limited protein:protein interaction (Dickinson 1986
' ' 1989). The frequency with which an approaching glob-ule may adsorb to such a film may be higher than to the whey protein-stabilized film where molecular cohesion may result in a greater resistance to film rupture (Clark et al., 1990).
The above argument that structural differences between protein films may account for the observed differences in the development of whipped cream structure presents some difficulties.
It may be that the initial 60 seconds of whipping is too short a time scale for the necessary reorganization and interaction of adsorbed whey protein molecules to occur. The rheology of protein films has been mainly studied at planar interfaces involving adsorption of protein from dilute solutions (e.g., Kinsella and Philips, 1989). Under these general conditions, surface concentration of protein increases rapidly and adsorption is diffusion controlled. However, the surface pressure may increase more slowly, especially for globular proteins where molecular unfolding, reorientation and association occur. Kinsella and Philips (1989) have given a time of 20 minutes to reach surface pressure equilibrium for {3-lactoglobulin. However, the above processes probably occur much more rapidly at the higher bulk phase protein concentration and due to the greater mixing which occurs during whipping.
Once the lag phase in structure development had been overcome, then the SA V for the four cream types increased at similar rates to reach similar maxima (Figure 1). If this phase of structure development represents formation of the fat globule network, then this suggests that the fat-fat interactions were not affected by protein composition. Van Boekel (1980) showed that emulsions containing crystalline fat were extremely sensitive to shear. The shear forces of the whipping process may remove the MFGM as the semi-solid
358
globules pass over one another leaving fat crystals exposed at the oil-water interface. Alternatively exposed fat surfaces will result from the collapse of air bubbles and the release of adsorbed fat globules back into the aqueous phase. The existence of exposed fat crystals may result in partial coalescence of adjacent fat globules (Boode and Walstra, 1989).
Appendix
Residual serum protein content of SMUF -washed cream
Examination of the whipped cream using a light microscope revealed that 80% of the air bubbles were between 6. 7 and 3 3 J.tm in diameter and 50% had a diameter of 15 J.tm or less. An average bubble (with a diameter of 15 J.tm) would have a volume of 1.8 x Io-15 m3 and a surface area of 7.1 x 10⁻¹⁰ m2. With 142% overrun, 1 m3 cream would contain 3.26 x 10¹⁴ bubbles and the total air surface would be 2.38 x 10S m2. A protein concentration of 14.6 mg per 100 g cream is equi alent to 6. 03 x 104 mg of protein in the serum phase of 1 m3 whipped cream (143% overrun); if all the protein were adsorbed at the air/serum interface, a protein loading of 0.25 mg m-2 would be achieved.
Acknowledgements
We thank Mr. B. E. Brooker for electron microscopy and useful discussion, Mr. A. Turvey for light microscopy, Mrs. S. Iley for radioimmunoassay, Dr. D. T. Coxon for useful comments during preparation of this manuscript, and Miss A. Goulden for technical assistance.
References
Anderson M, Brooker BE. (1988). Dairy foams. In: Advances in Food Emulsions and Foams, Dickinson E, Stainsby E, (eds.), Elsevier Applied Science Publishers, London, 221-255.
Anderson M, Brooker BE, Needs EC. (1987). The role of proteins in the stabilization/destabilization of dairy foams. In: Food Emulsions and Foams, Dickinson E (ed.), RSC Special Publication No. 58, The Royal Society of Chemistry, Cambridge, 100-109.
Andrews AT, Taylor MD, Owen AJ. (1985). Rapid analysis of bovine milk and proteins by fast protein liquid chromatography. Journal of Chromatography, 342, 177-185.
Berger KG, White GW. (1979). Ice cream. In: Food Microscopy, Vaughan JG (ed.), Academic Press, London, 499-530.

Development of whipped cream structure
Boode K, Walstra P. (1989) . Kinetics of partial coalescence process in oil-in-water emulsions. In: Food Colloids, Bee RD, Richmond P, Mingins J (eds.), RSC Special Publication No. 75, The Royal Society of Chemistry, Cambridge, 360-363.
British Standards Institution. (1969). British Standard No. 696, Part II, 1969, British Standards Institution, London, 7.
British Standards Institution. (1988). Determination of the Nitrogen Content of Liquid Milk, Standard No. 1741, op. cit., section 5.1.
Brooker BE, Anderson M, Andrews AT. (1986). The development of structure in whipped cream. Food Microstructure 5, 277-285.
Buchheim W. (1978). Mikrostruktur von geschlagenem Rahm [Microstructure of whipped cream]. Gordian, 78, 184-188
Clark DC, Coke M, Mackie AR, Pinder AC, Wilson DR. (1990). Molecular diffusion and thickness measurements of protein-stabilized thin liquid film. Journal of Colloid and Interface Science, 138, 207-219.
Creamer LK, Berry GP, Mills OE. (1977). A study of the dissociation of {3-casein from the bovine casein micelle at low temperature. New Zealand Journal of Dairy Science and Technology, 12, 58-66.
Darling DF. (1982) . Recent advances in the destabilization of dairy emulsions. Journal of Dairy Research 49, 695-712.
Dickinson E. (1986). Mixed proteinaceous emulsifiers: A view of competitive protein adsorption and the relationship to food colloid stabilisation. Food Hydrocolloids, 1, pp.3-23.
Dickinson E. (1989). Surface and emulsifying properties of caseins. Journal of Dairy Research 56, 471-477 .
Fisher LR, Mitchell EE. (1989). Effect of adsorbed protein on interactions between emulsion droplets. In: Food Colloids, Bee RD, Richmond P, Minging J (eds.), RSC Special Publication No. 75, Royal Society of Chemistry, Cambridge, 123-137.
Florence E, Milner DS. (1979). Routine determination of nitrogen by Kjeldahl digestion without use of a catalyst. Analyst, 104, 378-381.
Hillier RM. (1976). The quantitative measurement of whey proteins using polyacrylamide-gel electrophoresis. Journal of Dairy Research 43, 259-265.
Jenness R, Koops J. (1962) . Preparation and properties of a salt solution which simulates milk ultrafiltrate. Nederlands Melk en Zuiveltijdschrift 16, 153-164.
Kinsella JE, Philips LC. (1989). Structure: function relationships in food proteins, film and foaming behavior. In: Food Proteins, Kinsella JE, Soucie WG (eds.), American Oil Chemists' Society, Champaign, 52-77.
Kruskal WH, Wallis WA. (1952). Use of ranks in
359
one-criterion variance analysis. Journal of the American Statistical Association, 47, 583-621.
Mackenzie DDS, Brooker BE, Forsyth I. (1985). Ultrastructural features of bovine mammary epithelial cells grown on collagen cells. Tissue and Cell 17, 39-51.
Mann HB, Whitney DR. (1947). On a test whether one of two random variables is stochastically larger than the other. Annals of Mathematical Statistics 18, 50-60.
Mulder H, Walstra P. (1974). The milk fat globule, Commonwealth Agricultural Bureau of Dairy Science and Technology, Farnham Royal, U.K., Chapter 5, 72-76.
Needs EC, Anderson M, Kirby S. (1988). The influence of somatic cell count on the whipping properties of cream. Journal of Dairy Research 55, 89-95.
Noda M, Shinoki Y. (1986) . Microstructure and rheological behaviour of whipping cream. Journal of Texture studies 17, 189-204.
Schmidt DG, van Hooydonk ACM. (1980). A scanning electron microscopical investigation of the whipping of cream. Scanning Electron Microscopy 1980;ill, 653-658.
Skudder PJ. (1985). Evaluation of a porous silicabased ion-exchange medium for the production of protein fractions from rennet- and acid-whey. Journal of Dairy Research 52, 167-181.
Smith AC. (1989). Solid foams. In: Food Colloids, Bee RD, Richmond P, Mingins J (eds.), RSC Special Publication No. 75, Royal Society of Chemistry, Cambridge, 56-73 .
Stainsby G. (1986). Functional Properties of Food Macromolecules. Mitchell JR, Ledward DA (eds.), Elsevier Applied Science Publishers, London, 315-353.
van Boeke! MAJS. (1980). Influence of fat crystals in the oil phase on stability of oil-in-water emulsions. PhD Thesis, Univ. Wageningen, The Netherlands.
Walstra P, Jenness R. (1984). Dairy Chemistry and Physics, John Wiley and Sons, New York, 5-6.
Discussion with Reviewers
Reviewer IV: Equation 1 is relevant for a rigid cellular material and relates to bending moduli or buckling properties of the cell walls. Here, we have a completely different situation: at large deformation, the gas cells start sliding along each other. In fact, the theory of Princen (1989), given on page 14 of the same volume, as that by Smith (1989), would be more relevant, although neither really applicable. Please comment. Authors: We believe that the coalesced network of solid fat globules gives whipped cream mechanical properties similar to rigid cellular material. As indicated, the value obtained from our data for the power law
E.C. Needs and A. Huitson
index (n) was approximately 1.5 (Smith's value for rigid foam systems; Smith 1989, text reference). Princen (1989) gives a value of 0.5 for the power law index in his equation and he was concerned with fluid-fluid (airin-liquid) dispersion foams.
The fat globules form bridges between adjacent air cells which would prevent any sliding of gas cells along each other, rather large deformation would result in cell wall fracture.
Reviewer IV: Could air cells have been flattened in the whipped cream placed between the glass slide and the cover slip for microscopy? Authors: The largest air cells observed in fully whipped cream were around 30 JJ.m in diameter. The well created between two cover slips was over 100 JJ.m. The air cells in fully whipped cream were spherical and showed no sign of flattening. Creams from earlier stages of whipping were also examined by this method. The air cells were much larger and had been deformed into irregular shapes due to flattening.
Additional Reference
Princen HM. (1989) . The mechanical and flow properties of foams and highly concentrated emulsions. In: Food Colloids, Bee RD, Richmond P, Mingins J (eds.), RSC Special Publication No. 75, Royal Society of Chemistry, Cambridge, 14-24.
360