Embed Size (px)
Citation preview

The contribution of international business investment to the Sustainable Development Goals Key actors and recent trends

This work is published under the responsibility of the Secretary-General of the OECD. The opinions expressed and arguments employed herein do not necessarily reflect the official views of OECD member countries.
This document and any map included herein are without prejudice to the status of or sovereignty over any territory, to the delimitation of international frontiers and boundaries and to the name of any territory, city or area.
© OECD 2019
Please cite this publication as:
Gestrin, Michael V. (2019), The contribution of international business investment to the Sustainable Development Goals: Key actors and recent trends, OECD, Paris
www.oecd.org/investment/The-contribution-of-international-business-investment-to-the-sustainable-development-goals.pdf

│ 3
BUSINESS INVESTMENT AND THE SUSTAINABLE DEVELOPMENT GOALS: KEY ACTORS AND RECENT TRENDS © OECD 2019
Introduction
Over the past 30 years, the nature of international business investment in developing countries has evolved beyond a relatively narrow focus on the extractive industries (UNCTAD, 2007) to become one of the cornerstones, along with trade, of global value chains (GVCs).1 Many developing countries are now involved in the production of increasingly sophisticated goods and services that feed into the integrated international production networks of multinational enterprises (MNEs), and a growing middle class, especially in the upper middle-income countries, has underpinned increases in market seeking investments.2 In 2010, developing countries came to account for over 50 per cent of global FDI inflows for the first time.3
In addition, some developing countries, in particular among the upper middle income group, are becoming increasingly important outward investors and now account for a quarter of global FDI outflows (up from around 12-13 per cent before the financial crisis in 2008), thus blurring the longstanding historical distinction between developing economies as capital importers and developed economies as capital exporters. From a development perspective, FDI outflows can hold as much importance as inflows insofar as these allow firms based in developing countries to access new markets, acquire new technologies, and achieve efficiency gains through exposure to international competition. Multinational enterprises transmit many of these and other benefits associated with outward FDI back to the home country.
This paper surveys the main types of financing behind business investment in developing countries, recent trends, an evaluation of the contribution of these flows to the sustainable development goals (SDGs), and prospects going forward.
Who are the key actors?
Multinational enterprises (MNEs) have become one of the most important actors for channelling investment to the developing countries. These firms use foreign direct investment (FDI), the largest type of cross-border financial flow to developing countries, to establish a presence in foreign markets. Multinationals base their decisions to invest on a broad range of factors including market size, labour force skills, macroeconomic and institutional stability, physical infrastructure, and natural resources in the case of extractive industries.
Multinationals and the FDI they generate are particularly relevant for the SDGs for a variety of reasons, including (but not limited to):
Their use as a channel for the transmission of new technologies;
1 The focus of this paper is on different types of financing that support business activity and involve the investor directly in this activity. The expression ‘business investment’ captures these different types of financing. The three main types considers foreign direct investment (FDI), mergers and acquisitions (M&A), and project finance. While there are overlaps and technical differences between these data that make comparisons difficult, they nonetheless provide different perspectives on three of the most important sources of business investment in the developing countries. 2 For overviews of the inter-relationships between FDI and development, see OECD 2014 and OECD 2016a. 3 Calculations based upon the OECD’s FDI database: http://www.oecd.org/investment/statistics.htm

4 │
BUSINESS INVESTMENT AND THE SUSTAINABLE DEVELOPMENT GOALS: KEY ACTORS AND RECENT TRENDS © OECD 2019
Their use as a channel for access to new international markets;
Their ability to overcome market failures and fill gaps that domestic investors and other
investors or sources of financing can’t reach;
Their tendency to adopt modern production techniques and accelerate productivity growth;
Their ability to pay higher wages;
Their capacity for financing and managing large-scale infrastructure projects; and
Their tendency to create business linkages in the economy that support domestic enterprises.
In addition to FDI, MNEs also often engage in portfolio investments within the context of strategic partnerships (Allen and Phillips, 2000; Fee et. al., 2006). Whereas FDI is usually defined as the acquisition of at least a 10 per cent equity stake in a firm, portfolio investment is defined as the acquisition of less than 10 per cent. Other sources of portfolio investments include institutional investors, such as pension funds, sovereign wealth funds, mutual funds, private equity, and hedge funds.
A relatively new actor providing financing for development is the state-owned enterprise (SOE). Although not a private-sector actor, SOEs often contribute in ways that are similar to their private sector MNE counterparts. Data on FDI do not allow for a distinction between international investments by SOEs and privately owned MNEs, but data on cross-border mergers and acquisitions (M&A) conservatively suggest that the former account for around 10-20 per cent of global investment flows, and much more in some countries.
Finally, a multitude of private actors is often involved in project finance, one of the most important forms of investment from a development perspective and a primary method for financing so-called greenfield investments.4 Project finance usually involves a combination of MNEs and commercial lenders, as well as public-sector partners, such as bilateral and multilateral donors, regional development banks, and export credit agencies. Although project finance is smaller in volume terms than other private flows, it is important from an SDG perspective insofar as it often directly supports specific SDGs, such as water and sanitation (SDG 6), the development of renewable sources of energy (SDG 7), and infrastructure (SDG 9).
In the next section examines recent trends in terms of volumes and some of the drivers of these trends.
4 A distinction is often made in the globalisation literature between mergers and acquisitions (M&A), which involve the transfer of ownership of existing business assets, and greenfield investments, which involve the creation of new business assets. Mergers and acquisitions are sometimes characterized as being less beneficial from a development perspective than greenfield investment because they don’t involve the creation of something new. In reality, M&A usually involves new capital investments, investments to expand production capacity, investments in new production technologies, and access to new markets. Another important benefit of inward M&A that is often overlooked is that it liberates the capital that was tied up in the acquired asset, which can subsequently be reinvested in new ventures. Finally, new owners are usually motivated by the expectation of improving the management and performance of the target company.

│ 5
BUSINESS INVESTMENT AND THE SUSTAINABLE DEVELOPMENT GOALS: KEY ACTORS AND RECENT TRENDS © OECD 2019
Volumes and drivers
Is the era of FDI prosperity for developing countries ending?
The global financial crisis in 2008 triggered a sharp decline in global FDI flows, which fell by 40 per cent to USD 1.2 trillion in 2009 from USD 2 trillion in 2007. Developing economies fared relatively better than developed countries, but still experienced a one-year decline of around 30%, with volumes dropping to around USD 500 billion in 2009. Foreign direct investment flows recovered strongly in 2010. This was largely due to a 60 per cent increase in flows to the developing economies. Over the following five years, flows to the developing countries were relatively stable, growing to around USD 900 billion in 2015, an historical record (figure 1).
Figure 1. FDI inflows globally and in developing countries
Source: OECD FDI in Figures, April 2018. Secretariat calculations.
This period of ‘FDI prosperity’ ended in 2016 when FDI flows reversed course at the global level. Over the period 2016-17, global inflows declined by just over 30 per cent while flows to developing countries fell by USD 218 billion, or 24 per cent. The reasons behind these declines included a mix of broad cyclical and more country-specific factors. The former have included improving economic conditions in the developed economies, which has attracted international investors, and the reversal of the commodities super cycle, which has put downward pressure on international investments in the extractive industries (OECD, 2016b). More country-specific factors include various sources of geopolitical instability, concerns over rising protectionism, and record levels of corporate debt in the emerging markets (IIF, 2018; IMF, 2016). Foreign direct investment outflows have followed a similarly broad reversal affecting both developed and developing countries.
0
250
500
750
1000
1250
1500
1750
2000
2250
USD
bill
ion
s
World inflows Developing country inflows

6 │
BUSINESS INVESTMENT AND THE SUSTAINABLE DEVELOPMENT GOALS: KEY ACTORS AND RECENT TRENDS © OECD 2019
Cross-border M&A provided an early warning signal
Mergers and acquisitions are one of the primary vehicles that MNEs use to invest in foreign markets and a major component of FDI. Data on M&A cover a variety of financial transactions, which can range from the full merger of two previously independent firms to the acquisition of a minority stake in a strategic partner. Mergers and acquisitions can play an important role in supporting development objectives for a number of reasons, including those listed above regarding the benefits of FDI more generally and allow for a more granular analysis of business investment trends. In addition, M&A often goes beyond the transfer of ownership of an asset from one business to another to include fresh investments to increase or upgrade property, plant, and equipment.5
In contrast with FDI inflows, M&A inflows in developing countries started declining already in 2012 (figure 2). Overall, M&A volumes in developing countries were down USD 72 billion in 2017 from the high of USD 234 billion reached in 2011. Mergers and acquisitions are a much more important form of investment for the middle-income developing countries than they are for the least-developed countries (LDCs) and the former group accounted for all of the declines in cross-border M&A volumes. The biggest declines were in the upper middle-income developing countries, with China seeing annual M&A inflows decline by USD 19 billion between 2011 and 2017, Chile by USD 14 billion, Turkey by USD 10 billion, and Brazil by USD 9 billion.
Figure 2. Inward M&A: middle income and least developed countries
Source: Dealogic M&A Analytics database, Secretariat calculations.
Although starting at a much lower absolute level, the trend for the LDCs has been upward, with volumes reaching a record high of USD 11 billion in 2017. This would generally suggest improvements in the business climates in the LDCs since two of the most important limiting
5 See also footnote 4.
0
50
100
150
200
250
2005 2006 2007 2008 2009 2010 2011 2012 2013 2014 2015 2016 2017
USD
bill
ion
s
Middle-income developing countries Least-developed countries

│ 7
BUSINESS INVESTMENT AND THE SUSTAINABLE DEVELOPMENT GOALS: KEY ACTORS AND RECENT TRENDS © OECD 2019
factors for cross-border M&A are the availability of attractive corporate assets in the domestic economy and sound overall economic governance and political stability.
China becomes the top investor in developing countries for first time
An increasingly important source of international investment into the developing countries is China. In 2017 China doubled its M&A in developing countries to USD 25 billion, making it their top source of international M&A (ahead of Japan and the United States). Chinese M&A accounted for 20 per cent of all cross-border M&A received by developing countries (figure 3).6 Chinese investment in the developing countries has continued to grow even as the government has reigned in outward investment more generally. Overall outward M&A from China declined by USD 115 billion, or 53 per cent, between 2016 and 2017, even as M&A to the developing countries doubled. Fully owned Chinese SOEs undertake around 60 per cent of China’s M&A in developing countries. By way of comparison, fully owned SOEs only account for 38 per cent of China’s overall outward M&A.
Figure 3. China’s growing importance as a source of investment in developing countries
Source: Dealogic M&A Analytics database, Secretariat calculations.
Double trouble as domestic M&A follows the cross-border downward trend
In and of itself, the decline in cross-border M&A need not be seen as a negative development if it has been offset by a rise in domestic M&A, since this is a trend generally associated with economic development. Over the past decade, developed countries received 29 per cent of their M&A investment from foreign sources and 71 per cent was generated domestically. In contrast, developing countries received 44 per cent of their M&A investment from foreign sources and generated 56 per cent domestically. A main reason for this difference relates to domestic market imperfections and failures, such as a weak domestic financial sector, that can hold back
6 Cross-border M&A is usually one of the largest components of FDI flows. The data on cross-border M&A measures the importance of China as an investor in developing countries because bilateral FDI data does not provide sufficient coverage.
0
5
10
15
20
25
0
5
10
15
20
25
30
2005200620072008200920102011201220132014201520162017
Pe
r ce
nt
USD
bill
ion
s
China's M&A inflows into DCs (USD billions, RH axis)
China's share of M&A in developing countries (%, RH axis)

8 │
BUSINESS INVESTMENT AND THE SUSTAINABLE DEVELOPMENT GOALS: KEY ACTORS AND RECENT TRENDS © OECD 2019
domestic investors but that foreign investors are able to overcome given their significant resources, and ability to ‘internalize’ markets that don’t function well in host economies (see box 1).
Unfortunately, this sort of substitution of cross-border M&A with domestic M&A did not take place in most developing countries, with one notable exception. In China, a domestic M&A boom has offset the decline in cross-border inward M&A by more than ten-fold. Between 2011 and 2017 domestic M&A in China averaged USD 322 billion as compared to USD 37 billion in cross-border M&A over the same period. The trend for other developing economies has been in the opposite direction, with domestic M&A falling even faster than cross-border M&A (figure 4).
Box 1. ‘Internalisation’ as an explanation for the existence of MNEs
The ability to ‘internalise’ markets is a defining feature of the multinational enterprise. The following examples illustrate how MNEs use internalisation in practice:
If a country has a weak financial sector an MNE can act as its own bank by using its significant internal financial resources, i.e. it internalises financial services;
If a market is lacking in reliable upstream suppliers of an intermediate input, the MNE can engage in vertical FDI and become its own supplier, i.e. it internalises upstream supply chains;
If a market is lacking in sufficiently strong intellectual property protections, the MNE can choose FDI over licencing in order to protect its intellectual property, i.e. it internalises part of the regulatory framework;
If a market is inaccessible due to trade restrictions, the MNE can establish a presence through FDI, i.e. it internalises market access.
All of these examples could also work in reverse. For example, improvements in upstream suppliers will reduce the need for internalising FDI and could lead to ‘externalisation’ (i.e. foreign divestment) followed by arms-length contracting. Likewise, the lifting of trade restrictions could lead an MNE to replace FDI with exports to the market in question. Internalisation theory derives from the work of Williamson (1981) and Coase (1937, 1960) on how transaction costs play a crucial role in determining the boundary of the firm. The application of transaction cost economics specifically to explain the existence and organisation of MNEs originates in the writings of Hymer (1960), Dunning (1973), Buckley and Casson (1976), and Rugman (1981).

│ 9
BUSINESS INVESTMENT AND THE SUSTAINABLE DEVELOPMENT GOALS: KEY ACTORS AND RECENT TRENDS © OECD 2019
Figure 4. Domestic M&A volumes in the developing countries
Source: Dealogic M&A Analytics database, Secretariat calculations.
As mentioned above, between 2011 and 2017 cross-border M&A in the developing countries (mainly the upper middle-income countries) declined by USD 72 billion, or 30 per cent. In contrast, domestic M&A in the developing countries (excluding China) declined by over 60 per cent, from USD 237 billion in 2010 to USD 95 billion in 2017. Figure 4 highlights wo periods of sharp decline, the first in 2011 and the second beginning in 2016 and continuing in 2017. The latter corresponds closely to the broader downward investment trend observed in the FDI data and suggests that some of the same factors that have reversed the FDI trajectory, such as economic recovery in the developed countries and record levels of corporate debt in the developing countries, are also dampening domestic M&A. Despite the sharp decline in the total domestic M&A series in 2016 and 2017, resulting in part due to efforts by the Chinese government to put the brakes on the domestic M&A boom, China’s domestic M&A volumes remained three-times the size of those for all other developing countries combined.
This doubling effect, in which foreign and domestic investment decline in lock step, contrasts with the case of China (and a very few other developing countries, like Malaysia, Jordan, and Namibia) where the expansion of domestic investment has compensated for declines in foreign investment. It suggests that for many developing countries the development implications of declining foreign volumes of business investment will be magnified to the extent that the same factors pushing down cross-border flows are also pushing down domestic business investment. Domestic M&A in developing countries in 2017, excluding China, is at its lowest levels going back to 2005.
After showing resilience, project finance joins the downward trend in 2017
Despite showing resilience to the overall downward investment trends in 2016, volumes in developing countries started weakening in 2017, and in 2018 project finance experienced its worst first half (H1) in ten years, with volumes down 30 per cent year-on-year (figure 5). The number of new deals declined by 50 per cent from 725 deals in H1 of 2017 to 377 deals in H1 of 2018. Developing countries in all regions experienced declines. In addition, around 38 per cent of project finance was for refinancing purposes, up from 24 per cent in H1 of 2017. In
0
100
200
300
400
500
600
700
800
900
2005 2006 2007 2008 2009 2010 2011 2012 2013 2014 2015 2016 2017
USD
bill
ion
s
Total domestic M&A Domestic M&A excl. China

10 │
BUSINESS INVESTMENT AND THE SUSTAINABLE DEVELOPMENT GOALS: KEY ACTORS AND RECENT TRENDS © OECD 2019
other words, just as the volume of project finance is going down, a shrinking share is going towards new projects.
Figure 5. Project financing in developing countries
Source: Dealogic Projectware database. Secretariat calculations.
One of the factors behind the overall fall in project finance has been a sharp decline in public-private partnership (PPP) deals in infrastructure (56 in H1 of 2018 versus 80 in H1 of 2017), a particularly disturbing trend from an SDG perspective since PPPs are one of the primary vehicles for leveraging public financing to increase private financing. India was one of the hardest hit markets, with a 65 per cent decline in infrastructure PPPs. Underlying this overall trend has been a re-drawing of the geography of global project finance in infrastructure, with the Asia Pacific region emerging as the leader in project finance and Europe, the Middle-East, and Africa (EMEA) going from first in 2015 to last in 2018.
The rise of the Asia Pacific region as a magnet for project finance investment has been largely driven by China’s OBOR investment initiative. In the first half of 2018, USD 13.2 billion of new OBOR-related projects had already closed and a number of new projects were launched, including two USD 13.4 billion projects for a railway line and new ports in Malaysia7. Projects related to the OBOR initiative accounted for approximately 20 per cent of all project finance in H1 of 2018 (calculations based upon Dealogic’s Projectware database).
Oil and gas and energy remain the two leading sectors globally, accounting together for over half of total volumes, despite declines over H1 of 2017 of 34 per cent and 45 per cent, respectively. Project finance in oil and gas doubled year-on-year to USD 17.9 billion in the developing countries, but investment in renewables has consistently exceeded oil and gas volumes overall since 2014, with India and Brazil underpinning much of this growth.
7 At time of writing, the new Malaysian government had announced a freeze on OBOR projects pending a review of these in terms of their implications for the national interest and against the backdrop of a financial scandal surrounding Malaysia’s investment fund, 1MDB.
0
50
100
150
200
250
300
USD
bill
ion
s
│ 11
BUSINESS INVESTMENT AND THE SUSTAINABLE DEVELOPMENT GOALS: KEY ACTORS AND RECENT TRENDS © OECD 2019
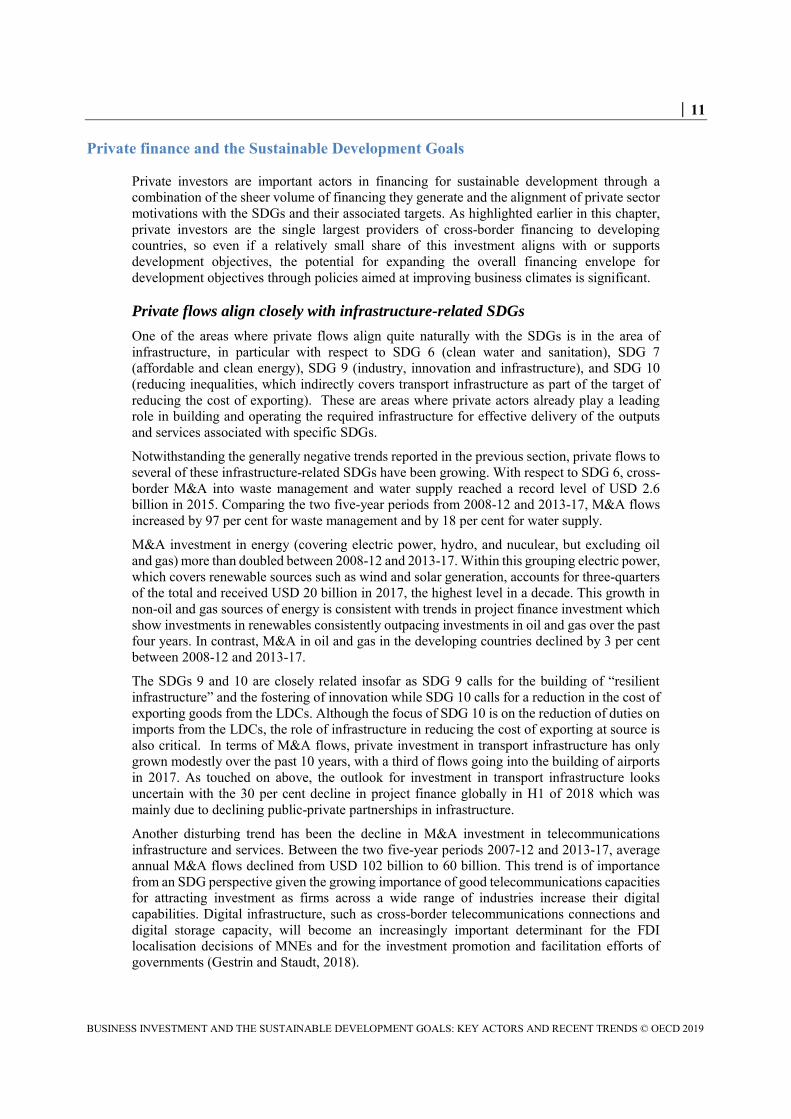
Private finance and the Sustainable Development Goals
Private investors are important actors in financing for sustainable development through a combination of the sheer volume of financing they generate and the alignment of private sector motivations with the SDGs and their associated targets. As highlighted earlier in this chapter, private investors are the single largest providers of cross-border financing to developing countries, so even if a relatively small share of this investment aligns with or supports development objectives, the potential for expanding the overall financing envelope for development objectives through policies aimed at improving business climates is significant.
Private flows align closely with infrastructure-related SDGs
One of the areas where private flows align quite naturally with the SDGs is in the area of infrastructure, in particular with respect to SDG 6 (clean water and sanitation), SDG 7 (affordable and clean energy), SDG 9 (industry, innovation and infrastructure), and SDG 10 (reducing inequalities, which indirectly covers transport infrastructure as part of the target of reducing the cost of exporting). These are areas where private actors already play a leading role in building and operating the required infrastructure for effective delivery of the outputs and services associated with specific SDGs.
Notwithstanding the generally negative trends reported in the previous section, private flows to several of these infrastructure-related SDGs have been growing. With respect to SDG 6, cross-border M&A into waste management and water supply reached a record level of USD 2.6 billion in 2015. Comparing the two five-year periods from 2008-12 and 2013-17, M&A flows increased by 97 per cent for waste management and by 18 per cent for water supply.
M&A investment in energy (covering electric power, hydro, and nuculear, but excluding oil and gas) more than doubled between 2008-12 and 2013-17. Within this grouping electric power, which covers renewable sources such as wind and solar generation, accounts for three-quarters of the total and received USD 20 billion in 2017, the highest level in a decade. This growth in non-oil and gas sources of energy is consistent with trends in project finance investment which show investments in renewables consistently outpacing investments in oil and gas over the past four years. In contrast, M&A in oil and gas in the developing countries declined by 3 per cent between 2008-12 and 2013-17.
The SDGs 9 and 10 are closely related insofar as SDG 9 calls for the building of “resilient infrastructure” and the fostering of innovation while SDG 10 calls for a reduction in the cost of exporting goods from the LDCs. Although the focus of SDG 10 is on the reduction of duties on imports from the LDCs, the role of infrastructure in reducing the cost of exporting at source is also critical. In terms of M&A flows, private investment in transport infrastructure has only grown modestly over the past 10 years, with a third of flows going into the building of airports in 2017. As touched on above, the outlook for investment in transport infrastructure looks uncertain with the 30 per cent decline in project finance globally in H1 of 2018 which was mainly due to declining public-private partnerships in infrastructure.
Another disturbing trend has been the decline in M&A investment in telecommunications infrastructure and services. Between the two five-year periods 2007-12 and 2013-17, average annual M&A flows declined from USD 102 billion to 60 billion. This trend is of importance from an SDG perspective given the growing importance of good telecommunications capacities for attracting investment as firms across a wide range of industries increase their digital capabilities. Digital infrastructure, such as cross-border telecommunications connections and digital storage capacity, will become an increasingly important determinant for the FDI localisation decisions of MNEs and for the investment promotion and facilitation efforts of governments (Gestrin and Staudt, 2018).

12 │
BUSINESS INVESTMENT AND THE SUSTAINABLE DEVELOPMENT GOALS: KEY ACTORS AND RECENT TRENDS © OECD 2019
Beyond infrastructure the contribution of business investment to the SDGs is
more difficult to evaluate
In addition to the contribution of private flows to various types of infrastructure explicitly or implicitly identified in the SDGs, private flows can also align, or in some cases run counter to, other goals and targets. For example, in the case of SDG 2 on ending hunger and achieving food security, the 45 per cent average annual growth rate of M&A in agri-business should probably be cautiously interpreted as a positive trend, but a more detailed analysis would be required to determine more precisely the net contribution of foreign investment in this area, especially with respect to local food security and obesity epidemics.
Similarly for SDGs 3 (good health and well-being for people) and 12 (responsible consumption and production), a mixed contribution of private investment is clearly identifiable. On the one hand, M&A investments in healthcare grew by an average of 19 per cent per annum over the ten years 2008-17 to reach a cumulative USD 64 billion. On the other hand, M&A investment in alcoholic beverages and tobacco also increased by an average of 77 per cent per annum over the same period to reach a cumulative USD 69 billion of business investment.
As these examples illustrate, the contribution (or potential contribution) of business investment to the SDGs can vary significantly depending upon which SDG to consider, and in some cases the net benefits are unclear as when private investment is seen to be making a positive and negative contribution simultaneously. Adding to the complexity of determining what sort of contribution private investors are making is the fact that different sectors might be making positive contributions on one SDG and a negative contribution on another.
Given the orders of magnitude importance of private flows in the overall financing envelope available to the developing countries, developing a better understanding of the complex relationships between private flows and the SDGs clearly needs to be given priority as an important part of the SDG policy agenda going forward, not least to help governments better identify and understand the levers at their disposal for supporting a closer alignment of business motivations and the SGDs.
Going forward: A challenging outlook
Business investment in the developing countries is currently like a river whose feeder streams are drying up, one after another. This process started with domestic and cross-border M&A around 2010-11, followed by project finance around 2014, and FDI in 2016. Adding to this scenario is the prospect that portfolio investment, another important source of private investment in the developing countries, could also see large declines as interest rates begin to rise in the developed countries, tax reform in the United States motivates significant investment repatriation, and record high levels of corporate debt in the developing countries raise concerns among investors over potential financial turbulence (OECD 2018c).
Whether this situation worsens depends on many variables but the current trend is clearly not encouraging. While putting a precise number on the extent to which private business investments in the developing countries have shrunk is difficult given data limitations, an orders of magnitude sense of how much investment the developing countries have ‘lost’ can be gained by comparing the cumulative difference between actual private investment flows received via FDI, M&A (domestic and foreign), and project finance against alternative scenarios.
For example, if business investment had stagnated (i.e. experienced zero nominal growth) starting in 2010, the year that marked a clear recovery in investment flows to the developing countries following the financial crisis, these would have received USD 552 billion more business investment than they actually did (figure 6). Conversely, if flows from each of these four sources had stayed fixed after reaching their respective high points (2010 for domestic

│ 13
BUSINESS INVESTMENT AND THE SUSTAINABLE DEVELOPMENT GOALS: KEY ACTORS AND RECENT TRENDS © OECD 2019
M&A, 2011 for cross-border M&A, 2014 for project finance, and 2016 for FDI) instead of declining, developing countries would have received USD 1.6 trillion more investment that is private between 2010 and 2017 than they actually did.8
Source: Dealogic M&A Analytics database, Secretariat calculations.
These counter-factual scenarios provide a rough sense of the magnitude of the contraction in business investment in the developing countries over the past eight years by showing how much better off the developing countries would have been even if investment flows had stagnated. To the extent that these declines have been the result of policies, they remind us that policies matter, and policy mistakes can have important implications.
The recent trends in private flows to the developing countries described in this paper suggest that our current course is taking us from “billions to millions” rather than from “billions to trillions”. This situation represents an urgent policy challenge. Elements of a global policy response might be expected to include some of the following:
The global rules for trade and investment need to be improved and made to work better in support of level playing fields and an open, rules-based global economy. One of the greatest threats for developing countries would be the widespread outbreak of protectionist trade and investment wars which could accelerate what to date has been a significant but measured retreat of the private sector from the developing countries;
As private sources of financing that align with and can support achievement of the SDGs retreat, public sources will become relatively more important and will need to play a counter-cyclical role. They cannot fill the gap left by the private sector but they can soften the blow. This will be difficult in the developing countries themselves given the knock-on negative impact of declining business investment on the ability of governments to maintain adequate levels of tax receipts, which could feed negative spirals as public spending on critical business infrastructure is cut back, further undermining business climates. Coordination among donors
8 While there will be double counting in these calculations, especially between FDI and cross-border M&A, the zero nominal growth counterfactual comparison nonetheless provides a good orders of magnitude sense of the combined scale of the declines in private investment in developing countries across these four channels over the period 2010-17, in particular after 2015.
-600
-500
-400
-300
-200
-100
0
100
2010 2011 2012 2013 2014 2015 2016 2017
USD
bill
ion
s
Figure 6. Cumulative difference between zero nominal growth from 2010 and actual private flows

14 │
BUSINESS INVESTMENT AND THE SUSTAINABLE DEVELOPMENT GOALS: KEY ACTORS AND RECENT TRENDS © OECD 2019
to maximize the development impact of ODA and other forms of public financing will be critical;
Considerable scope remains for pursuing domestic policy reform agendas to improve business climates and to put in place investment promotion and facilitation strategies. Private investment has been declining but continues to play a critical role in helping countries to develop critical infrastructure, to generate employment, and to foster innovation. Since different types of business investment will support the SDGs in different ways (even without having this as an objective), governments should integrate policy initiatives to improve business climates into their broader efforts to achieve the SDGs. In addition, governments also have an important role to play to help better align business interests and the SDGs, thus generating more development impact from less investment. Fostering such closer alignment can also be achieved through the promotion of responsible business conduct;
Governments need to address new areas of regulatory co-operation where fragmentation is threatening potentially important new sources of private investment flows. This is particularly the case with respect to the digital economy, which will increasingly require digital infrastructure. In order to avoid a widening digital divide between countries, governments need to ensure sufficient investment in digital infrastructure, especially telecommunications infrastructure. Reviving PPP activity could play an important role in this respect.
Looking beyond recent trends that raise the spectre of a development crisis if private flows stay on their current course, it is clear that there is much to understand about business investment, the largest single source of foreign financing going to the developing countries. This is an important gap in our knowledge that needs to be addressed with a view to informing an empirical policy-oriented agenda for maximizing the contribution of private investment to the achievement of the SDGs.

│ 15
BUSINESS INVESTMENT AND THE SUSTAINABLE DEVELOPMENT GOALS: KEY ACTORS AND RECENT TRENDS © OECD 2019
Bibliography
Allen, J., and G Phillips. (2000). “Corporate equity ownership, strategic alliances, and product market relationships”, Journal of Finance 55:2791-81
Buckley, Peter and Mark Casson (1976). The Future of the Multinational Enterprise (Basingstoke and London: Macmillan).
Coase, Ronald H. ‘The nature of the firm’, Economica (1937).
Dunning, John H. ‘The determinants of international production’, Oxford Economic Papers 25 (November 1973).
Fee, C., C. Hadlock, and S. Thomas. (2006). “Corporate equity ownership and the governance of product market relationships”, Journal of Finance 61:1217-51
Gestrin, Michael V. and Julia Staudt (2018), The digital economy, multinational enterprises and international investment policy, OECD, Paris, www.oecd.org/investment/the-digital-economy-mnesand-international-investment-policy.htm
OECD (2018), OECD Business and Finance Outlook 2018 (OECD: Paris).
OECD (2016a). “Trends in foreign direct investment and their implications for development”, chapter 2 in Development Co-operation Report 2016 (OECD: Paris).
OECD (2016b). OECD Business and Finance Outlook 2016 (OECD: Paris).
OECD (2014). “Putting foreign direct investment to work for development”, chapter 5 in Development Co-
operation Report 2014 (OECD: Paris).
Rugman, Alan M. (1981). Inside the Multinationals: The Economics of Internal Markets (New York: Columbia University Press).
UNCTAD, (2007). World Investment Report 2007: Transnational Corporations, Extractive Industries, and Development (Geneva and New York: United Nations).
Williamson, Oliver E. (1975). Markets and Hierarchies: Analysis and Antitrust Implications: A Study in the
Economics of Internal Orgnaizations (New York: Free-Press, Macmillan).

www.oecd.org/investment