Embed Size (px)
Citation preview
5
Measuring International
Investment by Multinational
Enterprises
Implementation of the OECD’s Benchmark
Definition of Foreign Direct Investment, 4th edition
This work is published on the responsibility of the Secretary-General of the OECD. The opinions expressed
and arguments employed herein do not necessarily reflect the official views of the OECD or of the
governments of its member countries.
This document and any map included herein are without prejudice to the status of or sovereignty over any
territory, to the delimitation of international frontiers and boundaries and to the name of any territory, city or area.
© OECD 2015
OECD freely authorises the use of this material for non-commercial purposes. Requests for commercial use
or translation of this material should be submitted to [email protected].
The 4th edition of the OECD’s Benchmark Definition of Foreign Direct Investment
(FDI) provides the most complete and detailed guidance on the coverage, collection,
compilation, and dissemination of FDI statistics. Its widespread implementation in
2014 has greatly improved the usefulness of FDI statistics by providing more
meaningful measures of investment by multinational enterprises. It has also
improved the quality and comparability of FDI statistics across countries.
This publication explains the major changes introduced in the 4th edition of the
Benchmark Definition and assesses their impacts on the statistics. It also discusses
what we have learned about the international investment of MNEs from the new
statistics and provides general guidance on using the new statistical series. Finally, it
describes research priorities for further improving FDI statistics.
More information on international investment statistics can be found at:
www.oecd.org/investment/statistics.htm
Measuring International Investment by Multinational Enterprises
3
Table of Contents
Implementation of the OECD’s Benchmark Definition of Foreign Direct
Investment, 4th edition ............................................................................................ 5
FDI statistics according to BMD4 .............................................................................. 7
What’s included in FDI statistics? ......................................................................... 7
Improvements to aggregate FDI statistics .......................................................... 10
Improvements to detailed FDI statistics by partner country and by industry .... 13
Separately compiling FDI statistics for resident SPEs ..................................... 14
Flows and positions between fellow enterprises ........................................... 16
Specific recommendations for valuing FDI statistics ...................................... 19
FDI statistics collected by the OECD ....................................................................... 21
Financial flows, income, and positions by country and by industry ................... 21
Positions by ultimate investing country .............................................................. 24
Examples of how to use and interpret FDI statistics .............................................. 27
Asset/liability versus directional principle .......................................................... 27
Flows and stocks ................................................................................................. 28
Indicators ............................................................................................................ 30
Related data sets ..................................................................................................... 33
Activity of multinational enterprises statistics ................................................... 33
International mergers and acquisitions data ...................................................... 34
OECD research to further improve the measurement of foreign investment ....... 35
Capital in transit .................................................................................................. 35
Ultimate host country ......................................................................................... 35
Links between FDI statistics and other statistics on MNEs ................................. 35

5
Measuring International Investment
by Multinational Enterprises
Implementation of the OECD’s Benchmark
Definition of Foreign Direct Investment, 4th edition
Multinational enterprises (MNEs) are a key channel of globalisation. They serve as
the backbone of many global value chains by linking and organizing production
across countries and are an important channel for exchanging capital, goods and
services, and knowledge across countries. Foreign direct investment (FDI) is
necessary for the creation of an MNE. Therefore, reliable and high quality FDI
statistics are necessary for policy-making and for tracking globalisation. In 2008,
the OECD published the 4th edition of its Benchmark Definition of Foreign Direct
Investment (BMD4). The implementation of the BMD4 guidelines greatly improves
the quality of foreign direct investment (FDI) statistics by providing more
meaningful measures of FDI. Although FDI statistics include some transactions
that might not meet the definition of an MNE, such as investments in real estate,
investments by MNEs dominate FDI statistics. Thus, the BMD4 statistics will
inform the analyses of global value chains and of globalisation more generally.
This is why the full implementation of BMD4 is such an important event, not just
for the statistics community but also for policy makers.
FDI is defined as the establishment of a lasting interest in and significant degree
of influence over the operations of an enterprise in one economy by an investor
in another economy. Ownership of 10% or more of the voting power in an
enterprise in one economy by an investor in another economy is evidence of
such a relationship. FDI statistics cover all cross-border transactions and positions
between entities in a foreign direct investment relationship. There are three main
components to FDI statistics: 1) financial flows, which capture debt and equity
investments between related parties in a specific period; 2) income, which
represents the return on equity and debt investment to the direct investor in a
specific period; and 3) positions, which are the value of the accumulated direct
investment at a specific point in time—it is also referred to as the stock of FDI.
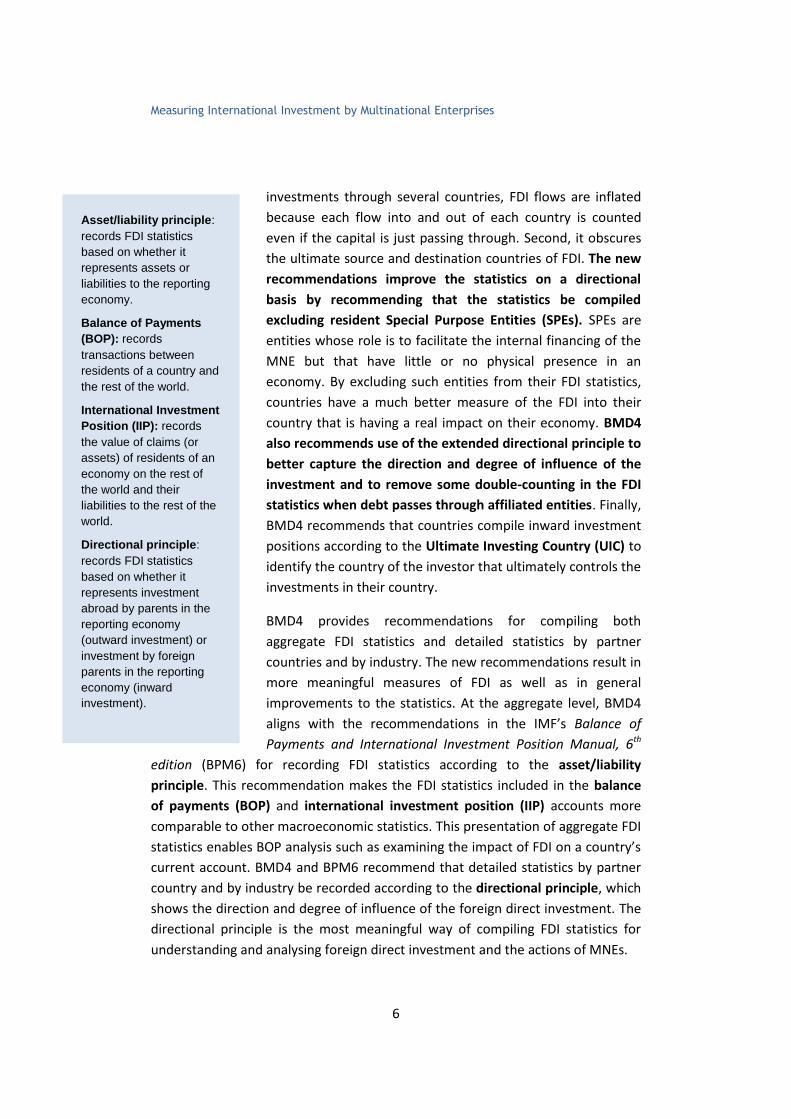
The financing structures of MNEs have gotten more complex over time in
response to several factors, including the need to manage global production
networks and the desire to minimize tax and regulatory burdens. This complexity
can distort FDI statistics in a couple of ways. First, when MNEs channel
Measuring International Investment by Multinational Enterprises
6
investments through several countries, FDI flows are inflated
because each flow into and out of each country is counted
even if the capital is just passing through. Second, it obscures
the ultimate source and destination countries of FDI. The new
recommendations improve the statistics on a directional
basis by recommending that the statistics be compiled
excluding resident Special Purpose Entities (SPEs). SPEs are
entities whose role is to facilitate the internal financing of the
MNE but that have little or no physical presence in an
economy. By excluding such entities from their FDI statistics,
countries have a much better measure of the FDI into their
country that is having a real impact on their economy. BMD4
also recommends use of the extended directional principle to
better capture the direction and degree of influence of the
investment and to remove some double-counting in the FDI
statistics when debt passes through affiliated entities. Finally,
BMD4 recommends that countries compile inward investment
positions according to the Ultimate Investing Country (UIC) to
identify the country of the investor that ultimately controls the
investments in their country.
BMD4 provides recommendations for compiling both
aggregate FDI statistics and detailed statistics by partner
countries and by industry. The new recommendations result in
more meaningful measures of FDI as well as in general
improvements to the statistics. At the aggregate level, BMD4
aligns with the recommendations in the IMF’s Balance of
Payments and International Investment Position Manual, 6th
edition (BPM6) for recording FDI statistics according to the asset/liability
principle. This recommendation makes the FDI statistics included in the balance
of payments (BOP) and international investment position (IIP) accounts more
comparable to other macroeconomic statistics. This presentation of aggregate FDI
statistics enables BOP analysis such as examining the impact of FDI on a country’s
current account. BMD4 and BPM6 recommend that detailed statistics by partner
country and by industry be recorded according to the directional principle, which
shows the direction and degree of influence of the foreign direct investment. The
directional principle is the most meaningful way of compiling FDI statistics for
understanding and analysing foreign direct investment and the actions of MNEs.
Asset/liability principle:
records FDI statistics
based on whether it
represents assets or
liabilities to the reporting
economy.
Balance of Payments
(BOP): records
transactions between
residents of a country and
the rest of the world.
International Investment
Position (IIP): records
the value of claims (or
assets) of residents of an
economy on the rest of
the world and their
liabilities to the rest of the
world.
Directional principle:
records FDI statistics
based on whether it
represents investment
abroad by parents in the
reporting economy
(outward investment) or
investment by foreign
parents in the reporting
economy (inward
investment).
Measuring International Investment by Multinational Enterprises
7
FDI statistics are compiled by countries and represent the investments of direct
investors resident in their economies to foreign countries and investment by foreign
residents in their economy. Therefore, the concept of residency is very important
to compiling and understanding FDI statistics. The residence of an entity is the
economic territory where it has its center of predominant economic interest; that
is, where it has the strongest connection. For an enterprise, this is where it is
engaged in a significant amount of production of goods or services. While an entity
may have connections to more than one economy, its residency is attributed to only
one economy. SPEs are entities without a significant physical presence, and their
residence is assigned to the jurisdiction in which they are incorporated.
Unincorporated entities are assigned residence where they have the most
significant economic presence, either in terms of employment or assets.
This document will provide an explanation of the improvements to the statistics
introduced in BMD4 and an assessment of their impact on the statistics. It will
also describe the new statistical series to be compiled and provide general
guidance on using the new statistical series. It also briefly discusses other
statistics on MNEs and future research to further improve FDI statistics.
FDI statistics according to BMD4
BMD4 provides new recommendations for defining the universe of entities
covered by FDI statistics, for measuring aggregate—that is, total or world-wide—
FDI statistics, and for measuring detailed FDI statistics by partner country and by
industry.
What’s included in FDI statistics?
BMD4 recommends a new method for determining the entities that are included
in FDI statistics. This method, called the Framework for Direct Investment
Relationships (FDIR), identifies all of the enterprises over which an investor has
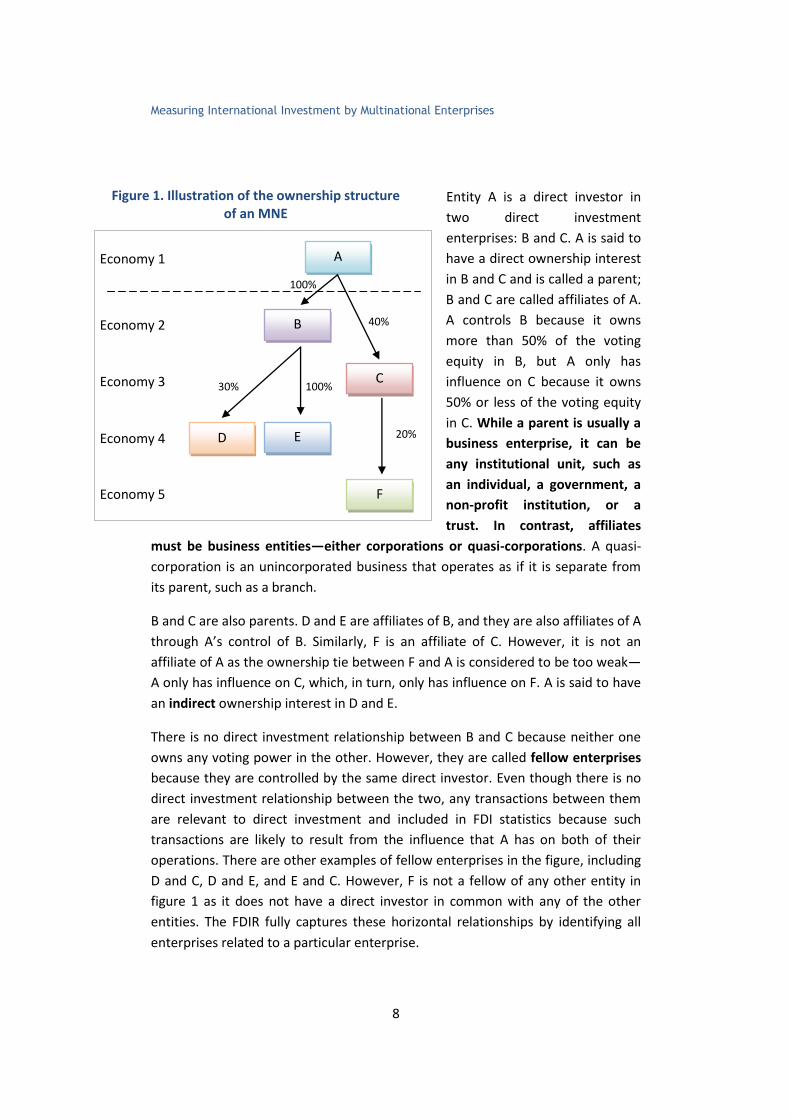
significant influence under the 10% voting criterion. Figure 1 is an example of the
structure of an MNE and will be used to illustrate the different relationships and
entities included in a direct investment relationship. It also defines some terms
that will be used throughout this report. Each of the boxes represents a different
entity, the arrows indicate the direction of ownership, and the accompanying
percentages show the share of voting equity owned by the direct investor.
Measuring International Investment by Multinational Enterprises
8
A
B
C
E D
F
Economy 1
Economy 2
Economy 3
Economy 4
Economy 5
100%
100% 30%
40%
20%
Entity A is a direct investor in
two direct investment
enterprises: B and C. A is said to
have a direct ownership interest
in B and C and is called a parent;
B and C are called affiliates of A.
A controls B because it owns
more than 50% of the voting
equity in B, but A only has
influence on C because it owns
50% or less of the voting equity
in C. While a parent is usually a
business enterprise, it can be
any institutional unit, such as
an individual, a government, a
non-profit institution, or a
trust. In contrast, affiliates
must be business entities—either corporations or quasi-corporations. A quasi-
corporation is an unincorporated business that operates as if it is separate from
its parent, such as a branch.
B and C are also parents. D and E are affiliates of B, and they are also affiliates of A
through A’s control of B. Similarly, F is an affiliate of C. However, it is not an
affiliate of A as the ownership tie between F and A is considered to be too weak—
A only has influence on C, which, in turn, only has influence on F. A is said to have
an indirect ownership interest in D and E.
There is no direct investment relationship between B and C because neither one
owns any voting power in the other. However, they are called fellow enterprises
because they are controlled by the same direct investor. Even though there is no
direct investment relationship between the two, any transactions between them
are relevant to direct investment and included in FDI statistics because such
transactions are likely to result from the influence that A has on both of their
operations. There are other examples of fellow enterprises in the figure, including
D and C, D and E, and E and C. However, F is not a fellow of any other entity in
figure 1 as it does not have a direct investor in common with any of the other
entities. The FDIR fully captures these horizontal relationships by identifying all
enterprises related to a particular enterprise.
Figure 1. Illustration of the ownership structure of an MNE
Measuring International Investment by Multinational Enterprises
9
Entity A is the ultimate controlling parent (UCP) of affiliates B, D, and E; A is also
the UCP of C if no other single entity owns a majority share of C. The UCP is found
by moving up the ownership chain from the immediate investor until an entity
that is not controlled—that is, owned more than 50%—by any other entity is
reached. Entity C is the UCP of F assuming that no other direct investor owns a
majority share of F because C is not controlled by A. Economy 1, the country of
residence for entity A, is the ultimate investing country (UIC) for affiliates B, C, D,
and E. Economy 3 is the UIC of affiliate F.
Box 1 provides a description of other changes and clarifications to the
transactions and entities covered by FDI statistics in BMD4.
Box 1. Other changes and clarifications to the coverage of FDI statistics
BMD4 made additional recommendations to clarify the transactions and entities included in
direct investment. The first of these was to exclude all debt between financial intermediaries,
such as banks, from direct investment. Previously, permanent debt, defined as debt that
represented a lasting interest, was included in direct investment while all other debt was
excluded because this debt was more strongly linked to the role of parents and affiliates as
financial intermediaries than to their direct investment relationship. This change recognised
the practical difficulties of assessing the permanence of debt.
The next change was to expand coverage to include investments in and by collective
investment institutions (CIIs). CIIs include such entities as mutual funds, private equity funds,
and hedge funds. A CII can be either a direct investment enterprise, if an investor in one
economy acquires at least 10% of the voting power in a CII, or it can be a direct investor if it
acquires at least 10% of the voting power in a non-resident enterprise. Investments by and into
CIIs are included in direct investment if the FDI criteria are met, but this phenomenon bears
further watching as the nature of and motivations for direct investments of CIIs may differ from
MNEs.
Finally, BMD4 clarifies that non-profit institutions can be direct investors. They cannot,
however, be direct investment enterprises because their non-profit status does not allow them
to be a source of income, profit, or other financial gain from the units that establish, control, or
finance them. Examples of non-profit institutions that could be considered as direct investors
include non-profit colleges, universities, or hospitals that acquire voting power in a non-
resident business enterprise.
Impact on statistics. The exclusion of permanent debt between financial intermediaries will
reduce FDI statistics while the inclusion of CIIs and non-profit institutions as direct investors will
increase FDI statistics.
Measuring International Investment by Multinational Enterprises
10
Improvements to aggregate FDI statistics
BPM6 and BMD4 recommend that aggregate FDI statistics,
which are included in BOP and IIP accounts, be presented
according to the asset/liability principle rather than the
directional principle as has been the recommendation in
previous editions of these international guidelines. On an
asset/liability basis, direct investment statistics are organised
according to whether the investment relates to an asset or a
liability for the reporting country. For example, a country’s
assets include equity investments by parent companies
resident in that country in their foreign affiliates because
those investments are claims that they have on assets in
foreign countries. Similarly, a country’s liabilities include
foreign parents’ equity investments in affiliates resident in
that country because those investments represent claims
that foreigners have on assets in the reporting country. The
asset/liability presentation does not show the direction of
influence as the directional presentation does.
Under the directional presentation, the direct investment
flows and positions are organised according to the direction
of the investment for the reporting economy—either
outward or inward. So, for a particular country, all flows and
positions of parents resident in that economy are shown
under outward investment, and all flows and positions for
affiliates resident in that economy are shown under inward
investment. Figure 2 shows the building blocks used to
construct the asset/liability and directional presentation of
the FDI positions; the presentations of flows would follow
the same pattern. The figure shows that the building blocks
used are the same—both presentations cover the same flows and positions—but
they are organised and combined differently.1
1 This discussion focuses on flows and positions between affiliates and parents. The
treatment of flows and positions between fellow enterprises is discussed below in the section “Flows and Positions between Fellow Enterprises”.
Asset/liability principle:
records FDI statistics based
on whether it represents
assets or liabilities to the
reporting economy.
Balance of payments
(BOP): records transactions
between residents of a
country and the rest of the
world.
International investment
position (IIP): records the
value of claims (or assets)
of residents of an economy
on the rest of the world and
their liabilities to the rest of
the world.
Directional principle:
records FDI statistics based
on whether it represents
investment abroad by
parents in the reporting
economy (outward
investment) or investment
by foreign parents in the
reporting economy (inward
investment).
Fellow enterprises:
enterprises that have no
direct investment
relationship themselves but
have a direct investor in
common.
Measuring International Investment by Multinational Enterprises
11
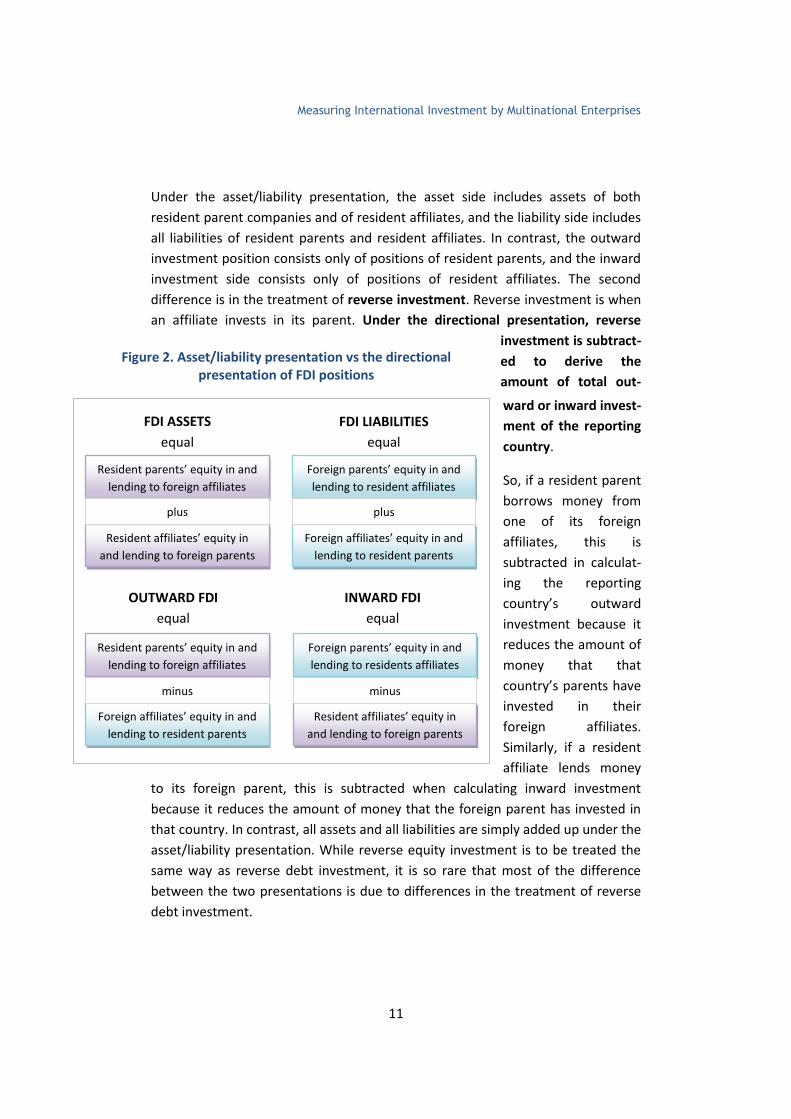
Under the asset/liability presentation, the asset side includes assets of both
resident parent companies and of resident affiliates, and the liability side includes
all liabilities of resident parents and resident affiliates. In contrast, the outward
investment position consists only of positions of resident parents, and the inward
investment side consists only of positions of resident affiliates. The second
difference is in the treatment of reverse investment. Reverse investment is when
an affiliate invests in its parent. Under the directional presentation, reverse
investment is subtract-
ed to derive the
amount of total out-
ward or inward invest-
ment of the reporting
country.
So, if a resident parent
borrows money from
one of its foreign
affiliates, this is
subtracted in calculat-
ing the reporting
country’s outward
investment because it
reduces the amount of
money that that
country’s parents have
invested in their
foreign affiliates.
Similarly, if a resident
affiliate lends money
to its foreign parent, this is subtracted when calculating inward investment
because it reduces the amount of money that the foreign parent has invested in
that country. In contrast, all assets and all liabilities are simply added up under the
asset/liability presentation. While reverse equity investment is to be treated the
same way as reverse debt investment, it is so rare that most of the difference
between the two presentations is due to differences in the treatment of reverse
debt investment.
Figure 2. Asset/liability presentation vs the directional presentation of FDI positions
FDI ASSETS
equal
FDI LIABILITIES
equal
INWARD FDI
equal
OUTWARD FDI
equal
Resident parents’ equity in and
lending to foreign affiliates
Resident affiliates’ equity in
and lending to foreign parents
plus
Foreign parents’ equity in and
lending to resident affiliates
Foreign affiliates’ equity in and
lending to resident parents
plus
Resident parents’ equity in and
lending to foreign affiliates
Foreign affiliates’ equity in and
lending to resident parents
minus
Foreign parents’ equity in and
lending to residents affiliates
Resident affiliates’ equity in
and lending to foreign parents
minus
Measuring International Investment by Multinational Enterprises
12
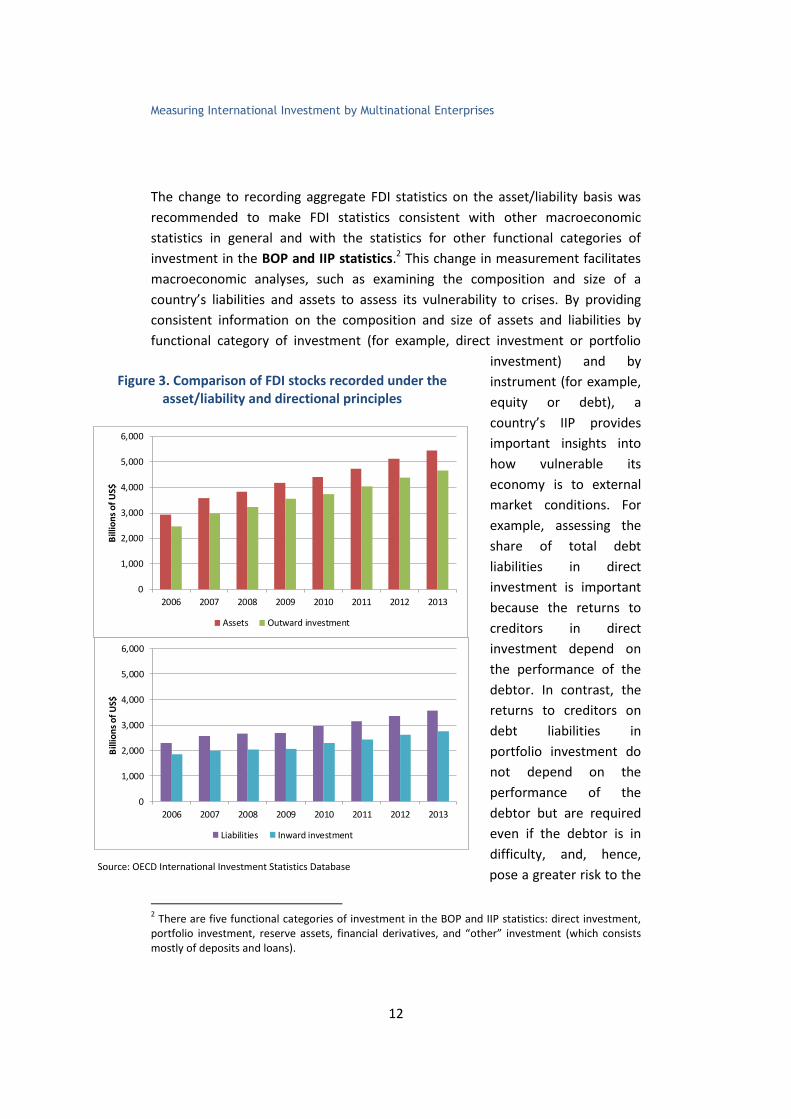
The change to recording aggregate FDI statistics on the asset/liability basis was
recommended to make FDI statistics consistent with other macroeconomic
statistics in general and with the statistics for other functional categories of
investment in the BOP and IIP statistics.2 This change in measurement facilitates
macroeconomic analyses, such as examining the composition and size of a
country’s liabilities and assets to assess its vulnerability to crises. By providing
consistent information on the composition and size of assets and liabilities by
functional category of investment (for example, direct investment or portfolio
investment) and by
instrument (for example,
equity or debt), a
country’s IIP provides
important insights into
how vulnerable its
economy is to external
market conditions. For
example, assessing the
share of total debt
liabilities in direct
investment is important
because the returns to
creditors in direct
investment depend on
the performance of the
debtor. In contrast, the
returns to creditors on
debt liabilities in
portfolio investment do
not depend on the
performance of the
debtor but are required
even if the debtor is in
difficulty, and, hence,
pose a greater risk to the
2 There are five functional categories of investment in the BOP and IIP statistics: direct investment,
portfolio investment, reserve assets, financial derivatives, and “other” investment (which consists mostly of deposits and loans).
Figure 3: Comparison of FDI Stocks Recorded under the Asset/Liability and Directional Principles
0
1,000
2,000
3,000
4,000
5,000
6,000
2006 2007 2008 2009 2010 2011 2012 2013
Bill
ion
s o
f U
S$
Assets Outward investment
0
1,000
2,000
3,000
4,000
5,000
6,000
2006 2007 2008 2009 2010 2011 2012 2013
Bill
ion
s o
f U
S$
Liabilities Inward investment
Figure 3. Comparison of FDI stocks recorded under the asset/liability and directional principles
Source: OECD International Investment Statistics Database
Measuring International Investment by Multinational Enterprises
13
economy. That is, the creditor in a direct investment
relationship is likely to be more patient because of their
relationship with the debtor.
Impact on statistics. Aggregate FDI statistics on an
asset/liability basis will generally be higher than those under
the directional principle because reverse investment is not
subtracted as it is in the statistics on a directional basis
(Figure 3). The size of the difference between the two sets of
statistics will depend on the amount of reverse investment.
Aggregate FDI statistics on the asset/liability basis are
available from the OECD and the IMF. The extension of the
directional principle to fellow enterprises introduced in
BMD4 (and described in the next section) may lead to even
more significant differences between the two principles.
Improvements to detailed FDI statistics by
partner country and by industry
While the presentation on an asset/liability basis is
appropriate for macroeconomic analyses, it is not
appropriate for studying the nature and motivations of
foreign direct investment. For example, it is not useful for
identifying the source countries of direct investment in a
particular country or for assessing the access to specific foreign markets by direct
investors in that country. The directional principle is most appropriate for these
types of analyses and, thus, both BPM6 and BMD4 recommend that statistics by
industry and by partner be shown on a directional basis. The statistics classify the
direct investment as either outward—a direct investor in the reporting economy
has an investment abroad—or inward—a foreign direct investor has an
investment in an affiliate located in the reporting economy.
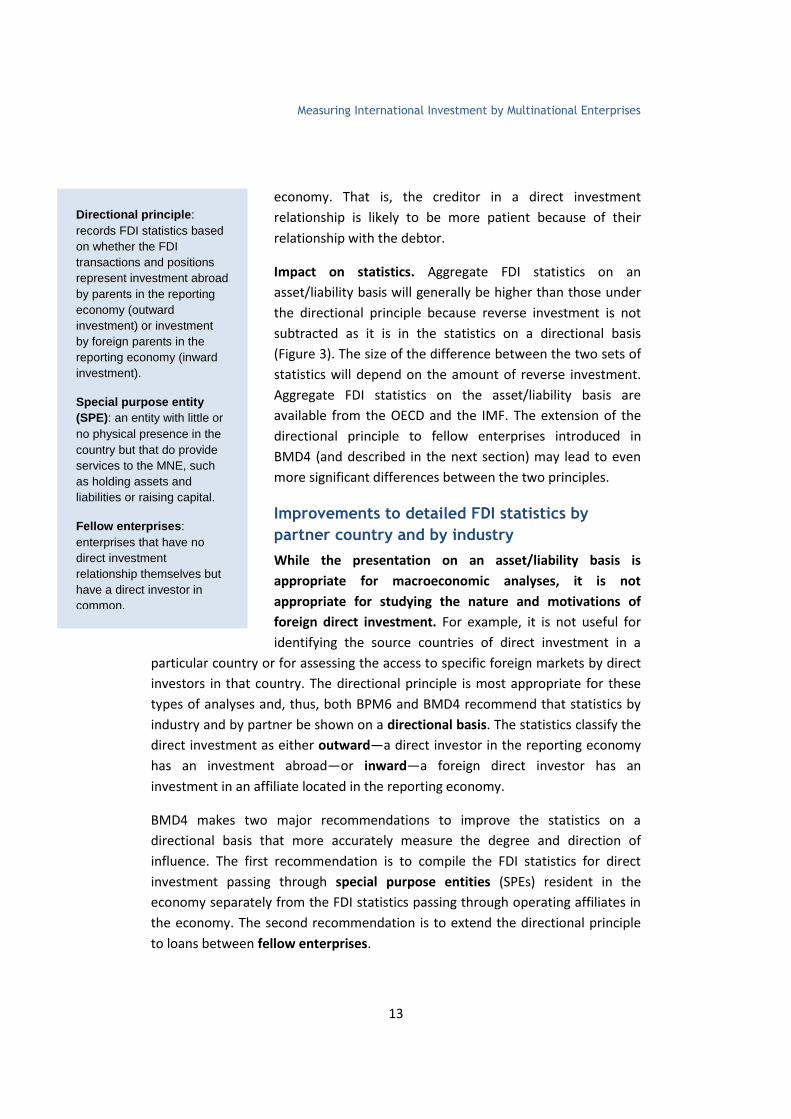
BMD4 makes two major recommendations to improve the statistics on a
directional basis that more accurately measure the degree and direction of
influence. The first recommendation is to compile the FDI statistics for direct
investment passing through special purpose entities (SPEs) resident in the
economy separately from the FDI statistics passing through operating affiliates in
the economy. The second recommendation is to extend the directional principle
to loans between fellow enterprises.
Directional principle:
records FDI statistics based
on whether the FDI
transactions and positions
represent investment abroad
by parents in the reporting
economy (outward
investment) or investment
by foreign parents in the
reporting economy (inward
investment).
Special purpose entity
(SPE): an entity with little or
no physical presence in the
country but that do provide
services to the MNE, such
as holding assets and
liabilities or raising capital.
Fellow enterprises:
enterprises that have no
direct investment
relationship themselves but
have a direct investor in
common.
Measuring International Investment by Multinational Enterprises
14
Box 2 provides a description of other changes to the directional basis.
Separately compiling FDI statistics for resident SPEs
MNEs often use SPEs in their ownership structures. SPEs are entities that have
little or no employment, physical presence, or operations in a country but do
provide services to the MNE, such as holding assets and liabilities or raising
capital. While there is no strict definition of an SPE, an enterprise is usually
considered to be an SPE if it has the following characteristics:
The enterprise is a legal entity, formally registered with a national authority and subject to fiscal and other legal obligations in the economy in which it is resident;
The enterprise is ultimately controlled by a non-resident parent, either directly or indirectly;
The enterprise has few or no employees, little or no production in the host economy, and little or no physical presence in the host economy;
Almost all the assets and liabilities of the enterprise represent investments in or from other countries; and
The core business of the enterprise is group-financing and holding activities while managing and directing play only a minor role.
Examples of SPEs include brass plate companies, financing subsidiaries, conduits,
holding companies, shelf companies, and shell companies.
Box 2. Other changes to the directional basis
BMD4 makes two clarifications that improve the statistics on a directional basis.
It clarifies that the debtor/creditor principle should be used as the basis for the geographical
allocation of FDI statistics rather than the transactor principle. Under the debtor/creditor
principle, claims and liabilities are recorded according to the country of the party that actually
has the financial claim or liability. In contrast, under the transactor principle, the claims or
liabilities are allocated to the country of the entity involved in settling the transaction, which
could differ from the country of the parents or affiliates undertaking the transaction.
It recommends that FDI statistics be allocated to the industry of the affiliate rather than the
industry of the parent. This recommendation provides information on the industries that are
attracting FDI.
Measuring International Investment by Multinational Enterprises
15
Figure 4: Impact of Resident SPEs on Inward Stocks for Selected Countries, 2014 or most recent year available
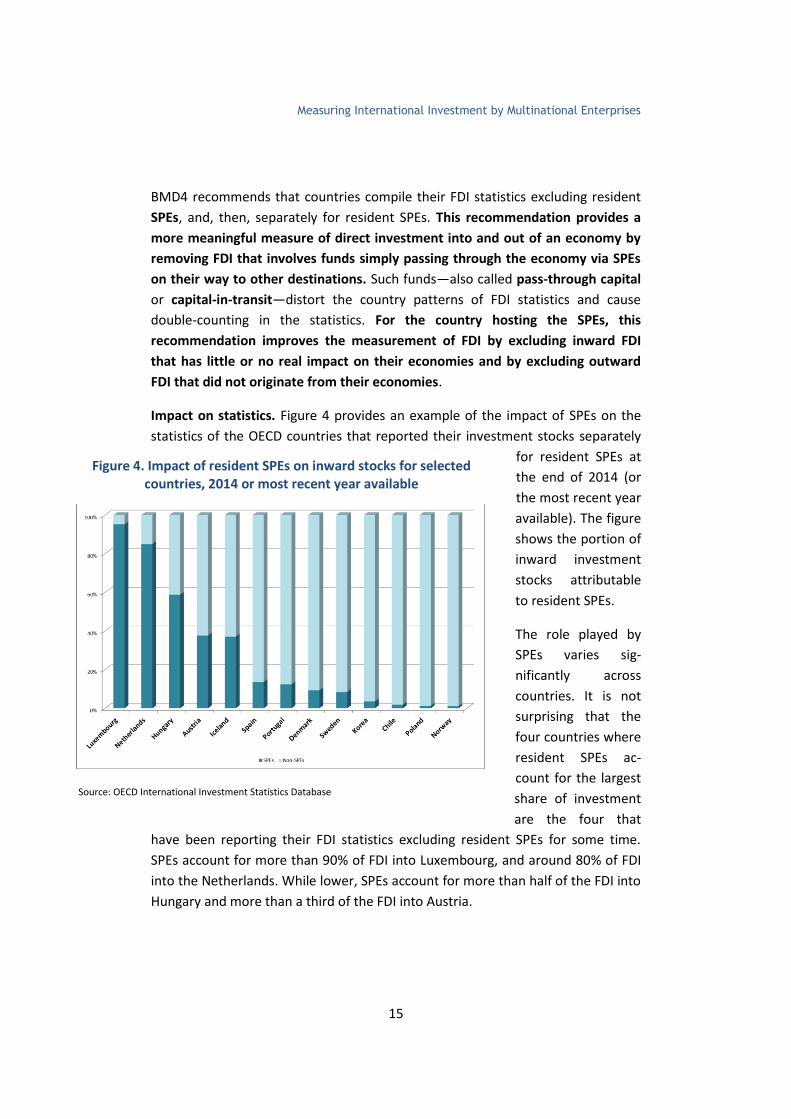
BMD4 recommends that countries compile their FDI statistics excluding resident
SPEs, and, then, separately for resident SPEs. This recommendation provides a
more meaningful measure of direct investment into and out of an economy by
removing FDI that involves funds simply passing through the economy via SPEs
on their way to other destinations. Such funds—also called pass-through capital
or capital-in-transit—distort the country patterns of FDI statistics and cause
double-counting in the statistics. For the country hosting the SPEs, this
recommendation improves the measurement of FDI by excluding inward FDI
that has little or no real impact on their economies and by excluding outward
FDI that did not originate from their economies.
Impact on statistics. Figure 4 provides an example of the impact of SPEs on the
statistics of the OECD countries that reported their investment stocks separately
for resident SPEs at
the end of 2014 (or
the most recent year
available). The figure
shows the portion of
inward investment
stocks attributable
to resident SPEs.
The role played by
SPEs varies sig-
nificantly across
countries. It is not
surprising that the
four countries where
resident SPEs ac-
count for the largest
share of investment
are the four that
have been reporting their FDI statistics excluding resident SPEs for some time.
SPEs account for more than 90% of FDI into Luxembourg, and around 80% of FDI
into the Netherlands. While lower, SPEs account for more than half of the FDI into
Hungary and more than a third of the FDI into Austria.
Figure 4. Impact of resident SPEs on inward stocks for selected countries, 2014 or most recent year available
Source: OECD International Investment Statistics Database
Measuring International Investment by Multinational Enterprises
16
Of the countries with new reporting excluding resident SPEs, resident SPEs
account for more than a third of investment in Iceland, and, so, are very
important in explaining FDI in that country. SPEs play
smaller, but still significant, roles in investment for Spain,
Portugal, Denmark, and Sweden, accounting for 14% to 8%
of investment. On the other hand, SPEs resident in Korea,
Chile, Norway, and Poland account for 5% or less of
investment.
Even in countries where SPEs do not play a significant role in
FDI currently, it is useful to be able to identify resident SPEs
in the statistics so that their role in FDI can be monitored. By
their nature, SPEs can be formed easily and can grow
rapidly. In addition, SPEs can have large transactions in a
specific period that can distort FDI flows due to their role
within the MNE of providing financing or holding assets and
liabilities. By compiling FDI statistics that exclude resident
SPEs, FDI statistics are not overstated by including funds
that are simply being channeled through the SPEs, are easier
to interpret for policy-making and other purposes, and
provide a better measure of FDI that is likely to have an economic impact in the
host economy. Finally, it can be useful to separately identify FDI statistics for
resident SPEs even if they do not play a significant role in overall investment
because investment into resident SPEs might not follow the patterns of
investment into non-SPEs (also called operating affiliates). For example, if there is
disinvestment from SPEs, inward FDI will be lower than if they are excluded. In
this case, inward investment into operating affiliates would be higher than the
statistics indicate.
Flows and positions between fellow enterprises
Even though there is no direct investment relationship between fellow
enterprises, transactions and positions between fellows are relevant to FDI
statistics because such transactions likely resulted from the influence of their
common direct investor. BMD4 recommends extending the directional principle
to flows and positions between fellow enterprises to better reflect the direction
of influence. BMD3 called for recording lending by a resident fellow enterprise to
a foreign fellow under outward investment and borrowing by a resident fellow
enterprise from a foreign fellow under inward investment. However, this
Fellow enterprises:
enterprises that have no
direct investment
relationship themselves but
have a direct investor in
common.
Directional principle:
records FDI statistics based
on whether the FDI
transactions and positions
represent investment
abroad by parents in the
reporting economy (outward
investment) or investment
by foreign parents in the
reporting economy (inward
investment).
Measuring International Investment by Multinational Enterprises
17
treatment did not accurately reflect the direction and degree of influence exerted
by resident and non-resident direct investors in the reporting economy. For
example, a resident fellow did not achieve any influence over a foreign fellow if it
made a loan to that foreign fellow—the influence remained with the direct
investor common to both fellows. So, if the direct investor is not resident in the
economy, such loans should not be recorded as outward investment. Similarly, a
foreign fellow did not achieve any influence over a resident fellow by extending a
loan to it—the influence remained with the direct investor common to the
fellows.
In practice, some countries did not follow the recommended treatment in BMD3
but instead recorded flows and positions between fellow enterprises according to
the residence of the direct investor common to the fellows. So, if the direct
investor was resident in the reporting economy, lending and borrowing by
resident fellows was treated as outward investment, and, if the direct investor
common to both fellows was a non-resident, lending and borrowing by the
resident fellow was treated as inward investment. Other countries covered fellow
enterprises in their direct investment statistics only partially or not at all.
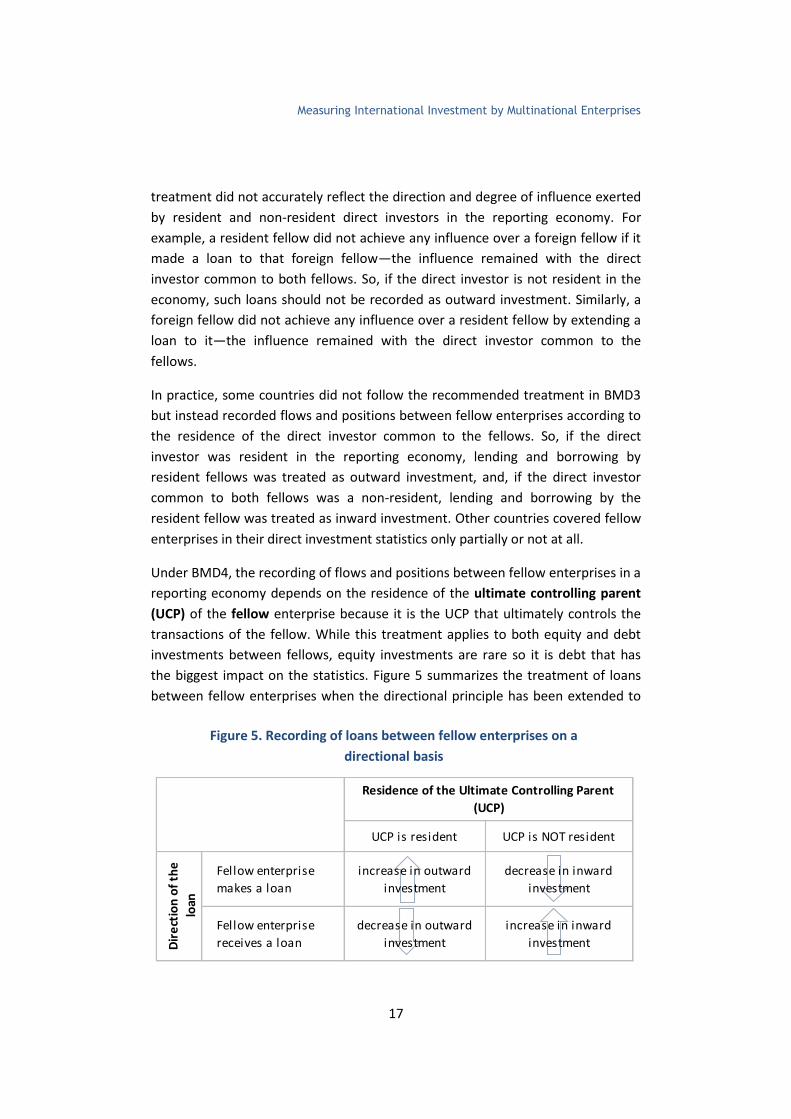
Under BMD4, the recording of flows and positions between fellow enterprises in a
reporting economy depends on the residence of the ultimate controlling parent
(UCP) of the fellow enterprise because it is the UCP that ultimately controls the
transactions of the fellow. While this treatment applies to both equity and debt
investments between fellows, equity investments are rare so it is debt that has
the biggest impact on the statistics. Figure 5 summarizes the treatment of loans
between fellow enterprises when the directional principle has been extended to
Figure 5. Recording of loans between fellow enterprises on a
directional basis
UCP is resident UCP is NOT resident
Fellow enterprise
makes a loan
increase in outward
investment
decrease in inward
investment
Fellow enterprise
receives a loan
decrease in outward
investment
increase in inward
investment
Residence of the Ultimate Controlling Parent
(UCP)
Dir
ect
ion
of
the
loan
Measuring International Investment by Multinational Enterprises
18
them. If the UCP of the fellow enterprise is resident in
the economy, then loans by and to the fellow enterprise
are treated as outward investment. Any loan from a
fellow enterprise to a fellow enterprise resident in
another economy is treated as an increase in outward
investment by the reporting economy because it
represents an increase in the influence that a resident
direct investor (the UCP) has on the direct investment
enterprise in another economy. Similarly, if the fellow enterprise receives a loan,
it reduces outward direct investment just as it would if the UCP had received a
loan because such investment reduces the total amount the resident direct
investor—the UCP—has invested abroad.
If the UCP is not resident in the economy, then flows and positions are treated
as inward investment. If the fellow enterprise makes a loan to a fellow in another
country, that is treated as a reduction in inward investment to the reporting
economy as funds that flowed into the reporting economy from the foreign UCP
have now flowed to another country, reducing the amount of foreign investment
in the reporting economy. It should not be treated as outward investment as
making a loan to a fellow enterprise in another country does not give the resident
fellow any influence over the operations of the fellow in the other country;
instead, it is the UCP that still has the influence. If the fellow resident in the
reporting economy receives a loan from a fellow in another country, it increases
inward investment as the non-resident UCP’s influence in the reporting economy
has increased.
The recording of transactions of fellow enterprises differs between the
asset/liability and directional presentations. Under the asset/liability
presentation, all equity and debt investments made by resident fellows are
recorded as assets, and all equity and debt investments received by resident
fellows are recorded as liabilities. The direction of influence does not matter. In
contrast, under the directional presentation, the direction of influence does
matter. It is determined by the residency of the UCP of the resident fellow
enterprise because that is the entity that ultimately controls the transactions of
the fellow enterprise. If the UCP is resident in the reporting economy, all
transactions and positions of resident fellow enterprises are treated as outward
investment, and reverse investment is subtracted in calculating total outward
investment. Similarly, if the UCP is non-resident in the reporting economy, all
Ultimate controlling parent
(UCP): the entity proceeding
up the affiliate’s ownership
chain that is not controlled
by another entity (that is,
owned more than 50%).
Measuring International Investment by Multinational Enterprises
19
transactions and positions of resident fellow enterprises are treated as inward
investment, and reverse investment is subtracted in calculating total inward
investment.
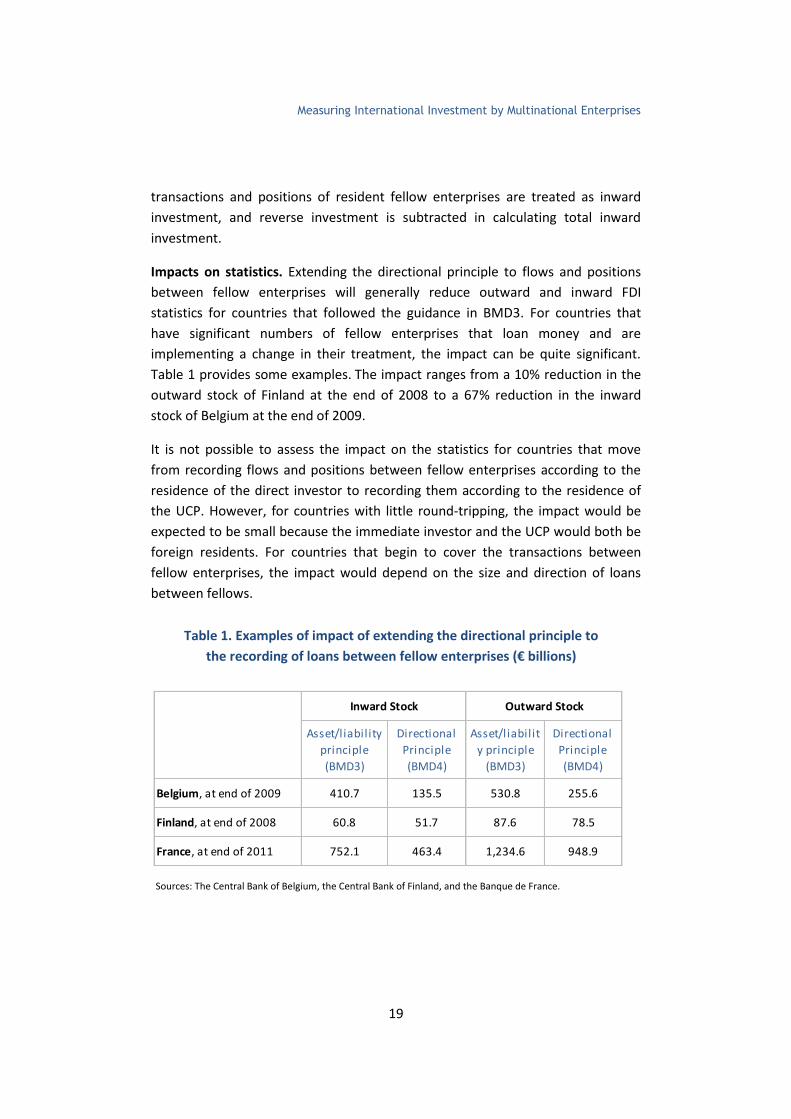
Impacts on statistics. Extending the directional principle to flows and positions
between fellow enterprises will generally reduce outward and inward FDI
statistics for countries that followed the guidance in BMD3. For countries that
have significant numbers of fellow enterprises that loan money and are
implementing a change in their treatment, the impact can be quite significant.
Table 1 provides some examples. The impact ranges from a 10% reduction in the
outward stock of Finland at the end of 2008 to a 67% reduction in the inward
stock of Belgium at the end of 2009.
It is not possible to assess the impact on the statistics for countries that move
from recording flows and positions between fellow enterprises according to the
residence of the direct investor to recording them according to the residence of
the UCP. However, for countries with little round-tripping, the impact would be
expected to be small because the immediate investor and the UCP would both be
foreign residents. For countries that begin to cover the transactions between
fellow enterprises, the impact would depend on the size and direction of loans
between fellows.
Table 1. Examples of impact of extending the directional principle to
the recording of loans between fellow enterprises (€ billions)
Asset/liability
principle
(BMD3)
Directional
Principle
(BMD4)
Asset/liabilit
y principle
(BMD3)
Directional
Principle
(BMD4)
Belgium, at end of 2009 410.7 135.5 530.8 255.6
Finland, at end of 2008 60.8 51.7 87.6 78.5
France, at end of 2011 752.1 463.4 1,234.6 948.9
Inward Stock Outward Stock
Sources: The Central Bank of Belgium, the Central Bank of Finland, and the Banque de France.
Measuring International Investment by Multinational Enterprises
20
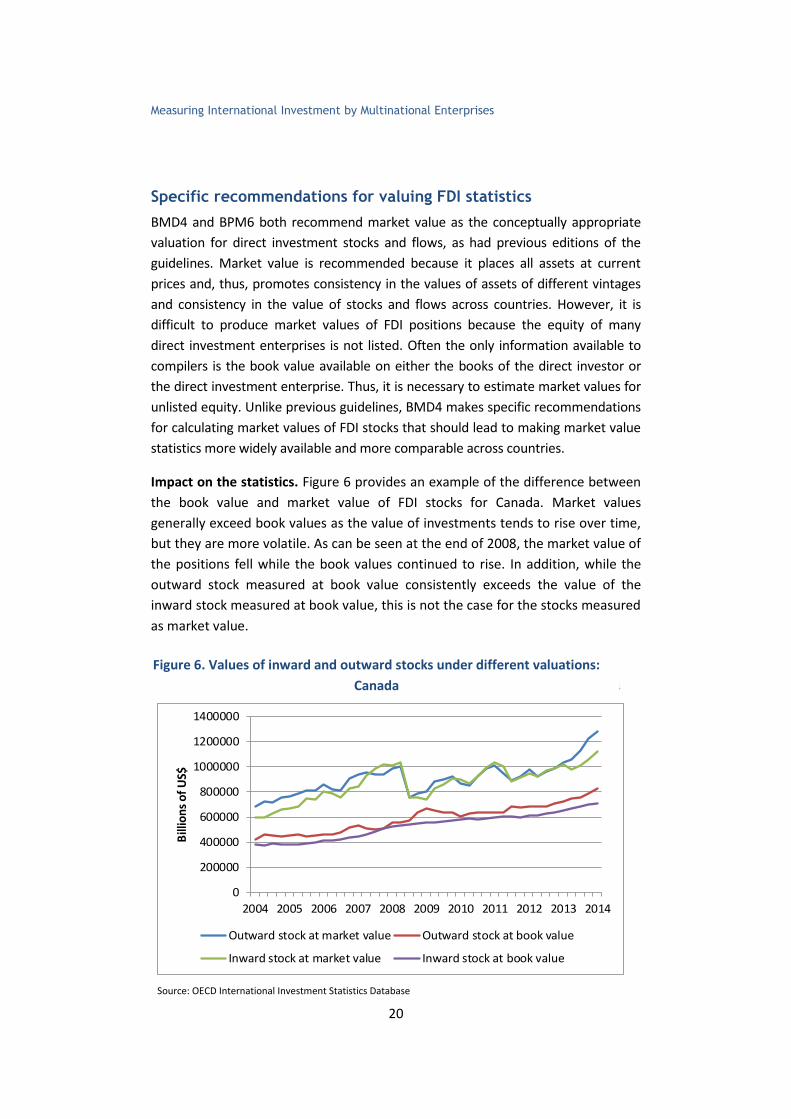
Specific recommendations for valuing FDI statistics
BMD4 and BPM6 both recommend market value as the conceptually appropriate
valuation for direct investment stocks and flows, as had previous editions of the
guidelines. Market value is recommended because it places all assets at current
prices and, thus, promotes consistency in the values of assets of different vintages
and consistency in the value of stocks and flows across countries. However, it is
difficult to produce market values of FDI positions because the equity of many
direct investment enterprises is not listed. Often the only information available to
compilers is the book value available on either the books of the direct investor or
the direct investment enterprise. Thus, it is necessary to estimate market values for
unlisted equity. Unlike previous guidelines, BMD4 makes specific recommendations
for calculating market values of FDI stocks that should lead to making market value
statistics more widely available and more comparable across countries.
Impact on the statistics. Figure 6 provides an example of the difference between
the book value and market value of FDI stocks for Canada. Market values
generally exceed book values as the value of investments tends to rise over time,
but they are more volatile. As can be seen at the end of 2008, the market value of
the positions fell while the book values continued to rise. In addition, while the
outward stock measured at book value consistently exceeds the value of the
inward stock measured at book value, this is not the case for the stocks measured
as market value.
Figure 6: Values of Inward and Outward Stocks under Different Valuations: Canada
0
200000
400000
600000
800000
1000000
1200000
1400000
2004 2005 2006 2007 2008 2009 2010 2011 2012 2013 2014
Bill
ion
s o
f U
S$
Outward stock at market value Outward stock at book value
Inward stock at market value Inward stock at book value
Figure 6. Values of inward and outward stocks under different valuations:
Canada
Source: OECD International Investment Statistics Database
Measuring International Investment by Multinational Enterprises
21
FDI statistics collected by the OECD
Financial flows, income, and positions by country and by
industry
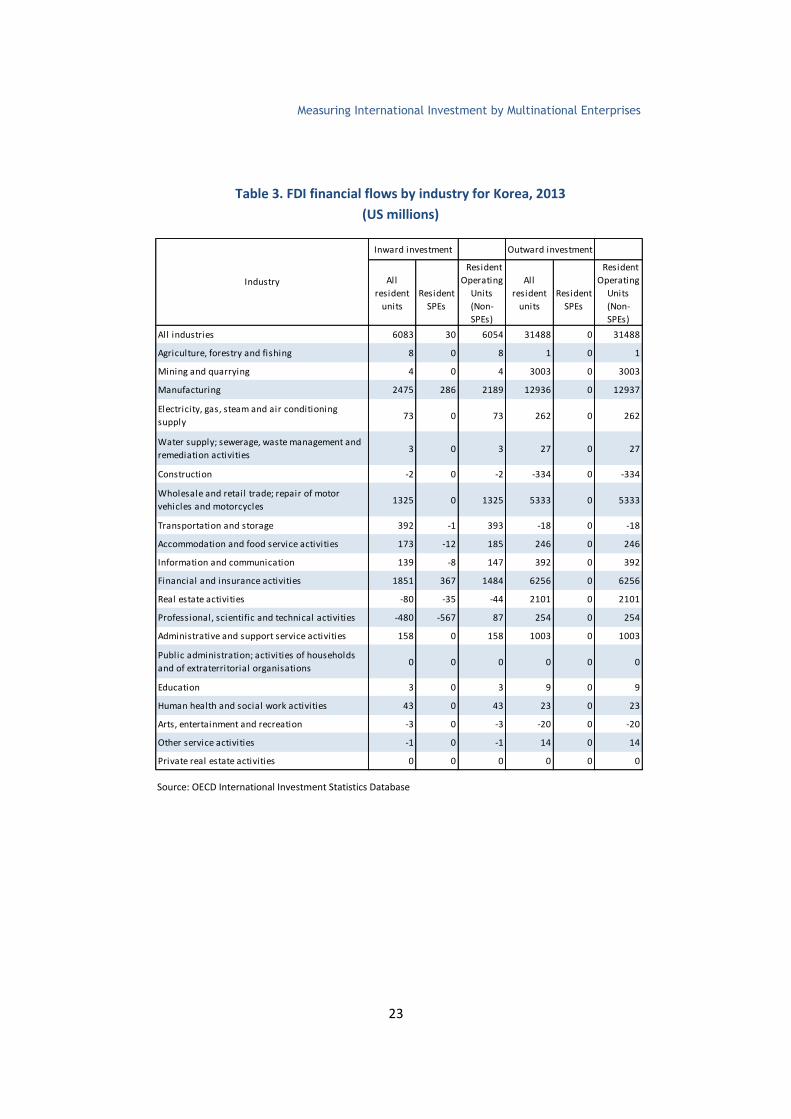
BMD4 recommends that FDI financial and income flows and positions (or stocks)
be presented by partner country and by industry on a directional basis. For each
series, the statistics should be presented for all entities and excluding resident
SPEs if SPEs are relevant to the reporting economy. The statistics excluding SPEs
provide more meaningful measures of investment to and from countries that host
SPEs by eliminating capital passing through these entities. Inward investment
statistics excluding resident SPEs will capture investment that is more likely to
have a meaningful impact on the host economy and to better identify the
countries that are investing in operating affiliates in the host economy. Outward
investment statistics excluding resident SPEs will more accurately capture
investment originating in the reporting economy and its destinations.
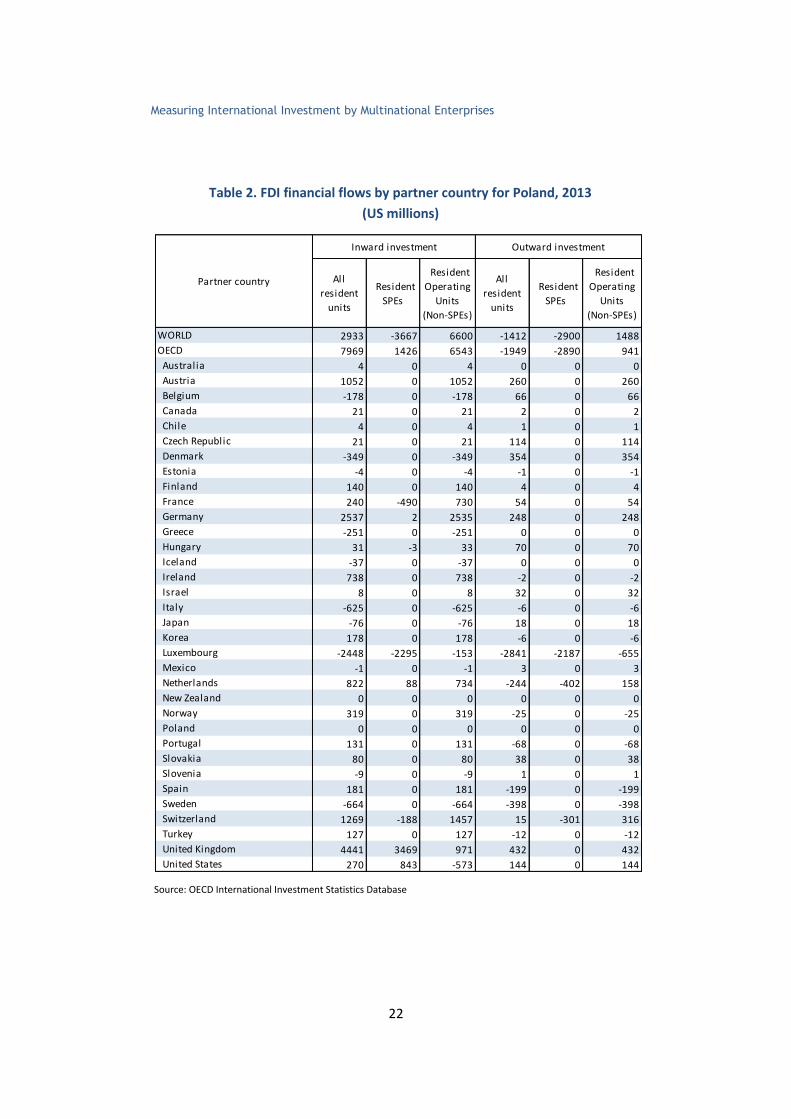
The attribution by partner country should be to the immediate partner country.
The attribution by industry should be according to the industry of the direct
investment enterprise—that is, of the affiliate—and should be based on
International Standard Industrial Classification (ISIC) Revision 4. Table 2 provides
an example of some of the detailed partner country data disseminated by the
OECD. Table 3 provide an example of the detailed statistics by industry
disseminated by the OECD.
The OECD disseminates its FDI statistics through an on-line database and through
bi-annual, annual and periodic publications. A new database to accommodate the
new statistical series available from BMD4 and breaks in series was launched in
March 2015. The on-line database includes all of the standard and supplemental
series collected by the OECD. In addition, it contains public queries that can be
used to generate standard tables. These tables enable comparisons across
countries, highlight important aspects of FDI, and help users access the data. The
OECD publishes FDI in Figures—its newsletter summarizing recent developments
in FDI—in April and October. FDI statistics are also included in many regular and
ad hoc OECD publications.
Measuring International Investment by Multinational Enterprises
22
All
resident
units
Resident
SPEs
Resident
Operating
Units
(Non-SPEs)
All
resident
units
Resident
SPEs
Resident
Operating
Units
(Non-SPEs)
WORLD 2933 -3667 6600 -1412 -2900 1488
OECD 7969 1426 6543 -1949 -2890 941
Australia 4 0 4 0 0 0
Austria 1052 0 1052 260 0 260
Belgium -178 0 -178 66 0 66
Canada 21 0 21 2 0 2
Chile 4 0 4 1 0 1
Czech Republic 21 0 21 114 0 114
Denmark -349 0 -349 354 0 354
Estonia -4 0 -4 -1 0 -1
Finland 140 0 140 4 0 4
France 240 -490 730 54 0 54
Germany 2537 2 2535 248 0 248
Greece -251 0 -251 0 0 0
Hungary 31 -3 33 70 0 70
Iceland -37 0 -37 0 0 0
Ireland 738 0 738 -2 0 -2
Israel 8 0 8 32 0 32
Italy -625 0 -625 -6 0 -6
Japan -76 0 -76 18 0 18
Korea 178 0 178 -6 0 -6
Luxembourg -2448 -2295 -153 -2841 -2187 -655
Mexico -1 0 -1 3 0 3
Netherlands 822 88 734 -244 -402 158
New Zealand 0 0 0 0 0 0
Norway 319 0 319 -25 0 -25
Poland 0 0 0 0 0 0
Portugal 131 0 131 -68 0 -68
Slovakia 80 0 80 38 0 38
Slovenia -9 0 -9 1 0 1
Spain 181 0 181 -199 0 -199
Sweden -664 0 -664 -398 0 -398
Switzerland 1269 -188 1457 15 -301 316
Turkey 127 0 127 -12 0 -12
United Kingdom 4441 3469 971 432 0 432
United States 270 843 -573 144 0 144
Partner country
Inward investment Outward investment
Table 2. FDI financial flows by partner country for Poland, 2013
(US millions)
Source: OECD International Investment Statistics Database
Measuring International Investment by Multinational Enterprises
23
Outward investment
All
resident
units
Resident
SPEs
Resident
Operating
Units
(Non-
SPEs)
All
resident
units
Resident
SPEs
Resident
Operating
Units
(Non-
SPEs)
All industries 6083 30 6054 31488 0 31488
Agriculture, forestry and fishing 8 0 8 1 0 1
Mining and quarrying 4 0 4 3003 0 3003
Manufacturing 2475 286 2189 12936 0 12937
Electricity, gas, steam and air conditioning
supply73 0 73 262 0 262
Water supply; sewerage, waste management and
remediation activities3 0 3 27 0 27
Construction -2 0 -2 -334 0 -334
Wholesale and retail trade; repair of motor
vehicles and motorcycles1325 0 1325 5333 0 5333
Transportation and storage 392 -1 393 -18 0 -18
Accommodation and food service activities 173 -12 185 246 0 246
Information and communication 139 -8 147 392 0 392
Financial and insurance activities 1851 367 1484 6256 0 6256
Real estate activities -80 -35 -44 2101 0 2101
Professional, scientific and technical activities -480 -567 87 254 0 254
Administrative and support service activities 158 0 158 1003 0 1003
Public administration; activities of households
and of extraterritorial organisations0 0 0 0 0 0
Education 3 0 3 9 0 9
Human health and social work activities 43 0 43 23 0 23
Arts, entertainment and recreation -3 0 -3 -20 0 -20
Other service activities -1 0 -1 14 0 14
Private real estate activities 0 0 0 0 0 0
Industry
Inward investment
Table 3. FDI financial flows by industry for Korea, 2013
(US millions)
Source: OECD International Investment Statistics Database
Measuring International Investment by Multinational Enterprises
24
Positions by ultimate investing country
To capture another important aspect of direct investment, BMD4 recommends
reporting inward positions by ultimate investing country (UIC). This presentation
better captures where the investment in a country is coming from. These statistics
show the country of the direct investor who ultimately controls the investment
and, thus, bears the risks and reaps the rewards of the investment. This
presentation can result in substantial changes in the distribution of inward
positions by country and provides information on the countries of the direct
investors that ultimately control the foreign investments in the reporting
economy. Importantly, the presentation by UIC matches the recommended
presentations of other statistics on the activities of MNEs, including Activities of
Multinational Enterprises (AMNE) statistics (these closely related data are
discussed below in the section “Related data sets”).
The ultimate investor is identified by proceeding up the immediate direct
investor’s ownership chain until an enterprise is reached that is not controlled by
another entity (that is, more than 50% of the voting power is not owned by
another entity). If there is no enterprise that controls the immediate direct
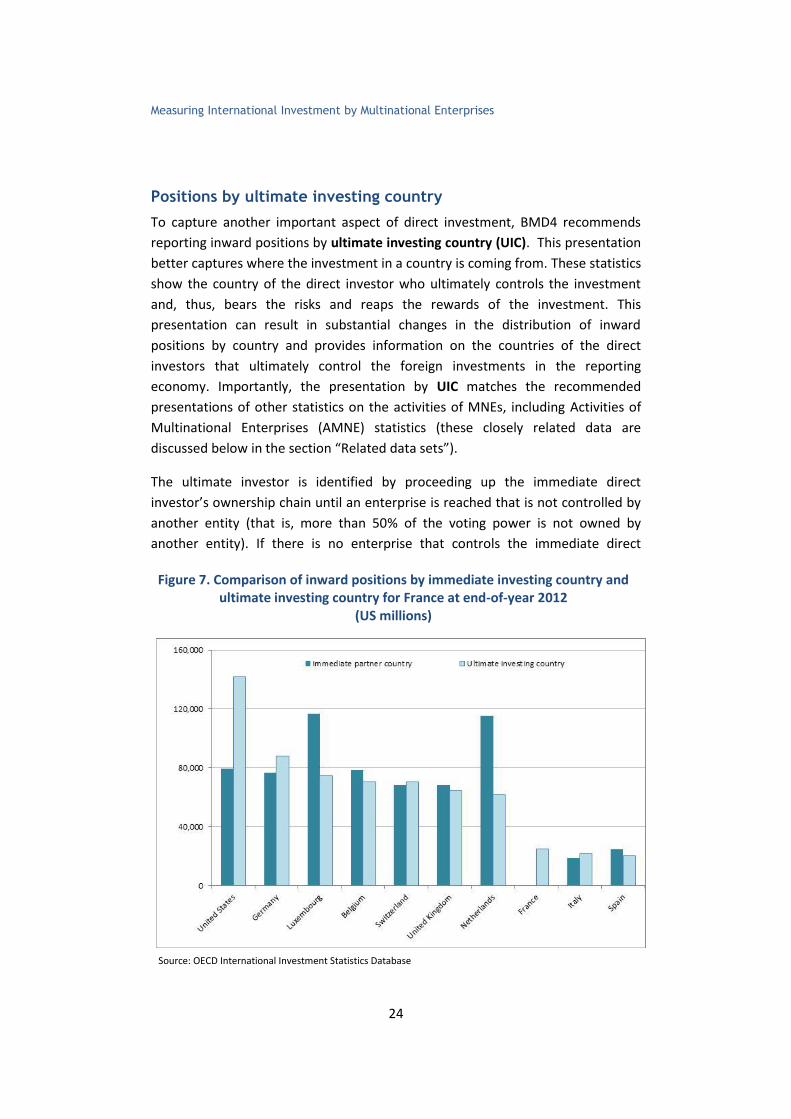
Figure 7. Comparison of inward positions by immediate investing country and ultimate investing country for France at end-of-year 2012
(US millions)
Source: OECD International Investment Statistics Database
Measuring International Investment by Multinational Enterprises
25
investor, then the immediate direct investor is the ultimate investor. To convert
from the standard presentation by immediate investing country, the entire FDI
position attributed to the immediate direct investor is moved from its country to
the country of the ultimate investor.
Unlike the presentation by immediate direct investor, the presentation by UIC can
show inward investment controlled by investors in the reporting economy; this is
inward FDI resulting from round-tripping. Round-tripping is when funds that have
been channelled abroad by resident investors are returned to the domestic
economy in the form of direct investment. It is of interest to know how important
round-tripping is to the total inward FDI in a country because it can be argued that
round-tripping is not genuine FDI into an economy.
Figure 7 gives an example of the changes in the country distribution of inward
investment when presenting statistics by country of UIC instead of the immediate
partner country for France. On the UIC basis, the United States is a much more
important investor in France than it appears when presented by immediate
partner country. Indeed, the inward stock of the United States increases from USD
79.6 billion to USD 142.1 billion. Much of this increase comes from Luxembourg
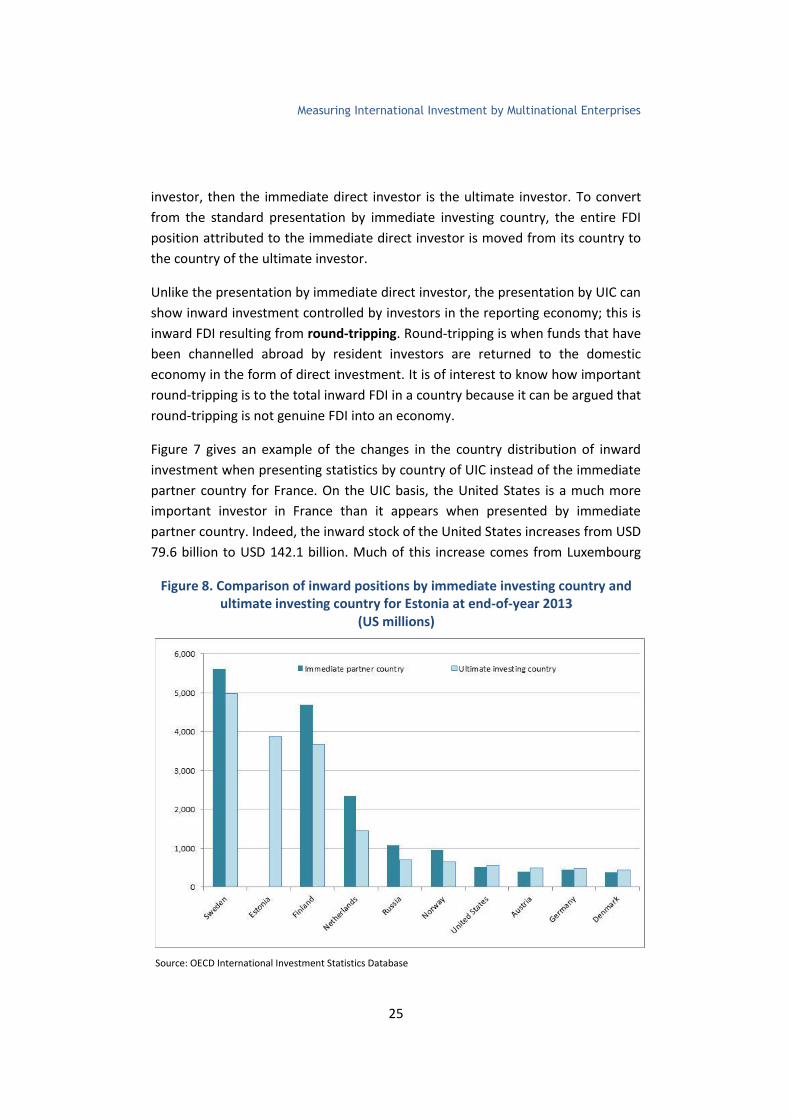
Figure 8. Comparison of inward positions by immediate investing country and ultimate investing country for Estonia at end-of-year 2013
(US millions)
Source: OECD International Investment Statistics Database
Measuring International Investment by Multinational Enterprises
26
and the Netherlands; the inward investment stocks from
these countries drops considerably, indicating that
investors from the United States hold many of their
affiliates in France indirectly, through affiliates in
Luxembourg and the Netherlands. Investors in other
countries also likely hold operations in France indirectly
through affiliates in these countries. According to the UIC
presentation, French investors are the 8th largest source of
FDI into France. As a matter of fact, they replace Japan in
the top ten sources of FDI when the statistics are
presented according to the UIC rather than by immediate
partner country. While this indicates there is some round-
tripping of FDI in France, the French position still accounts
for less than 4% of the total inward investment position in
France.
Figure 8 gives an example of the changes in the country
distribution of inward investment when presenting
statistics by country of UIC instead of the immediate
partner country for Estonia. On the UIC basis, Estonia
becomes the second largest source of investment in
Estonia, indicating that round-tripping is common in
Estonia. Given that Sweden, Finland, the Netherlands,
Russia, and Norway become less important as sources of
investment when measured according to the ultimate
investor, it appears that some of the round-tripping from
Estonia is going through some or all of these countries.
Other countries that become less important as sources of
FDI when measured on the UIC basis include Luxembourg.
In contrast, the United States, Austria, Germany and
Denmark are all more important sources of direct
investment in Estonia than the standard presentation
would indicate.
Asset/liability principle:
records FDI statistics based
on whether it represents
assets or liabilities to the
reporting economy.
Balance of Payments
(BOP): records transactions
between residents of a
country and the rest of the
world.
International Investment
Position (IIP): records the
value of claims (or assets) of
residents of an economy on
the rest of the world and
their liabilities to the rest of
the world.
Special Purpose Entity
(SPE): an entity with little or
no physical presence in the
country but that do provide
services to the MNE, such
as holding assets and
liabilities or raising capital.
Fellow enterprises:
enterprises that have no
direct investment
relationship themselves but
have a direct investor in
common.
Ultimate investing
country: the country of the
investor that ultimately
controls the investment,
bears the risks, and reaps
the rewards.
Measuring International Investment by Multinational Enterprises
27
Examples of how to use and interpret FDI
statistics
The recommendations in BMD4 make FDI statistics more useful for
macroeconomic analyses and for analysing the activities and motivations for FDI.
The presentation of the aggregate statistics on an asset/liability basis makes the
FDI statistics comparable to other items in the BOP and IIP statistics, supporting
macroeconomic analyses. Recommending that countries that host SPEs compile
FDI statistics excluding resident SPEs removes the double-counting that results
from capital-in-transit through these SPEs, providing more accurate statistics on
FDI into these countries and originating from these countries. The statistics better
capture the direction and degree of influence by the direct investor by extending
the directional principle to the treatment of debt between fellow enterprises. The
recommended supplemental series focus on highlighting specific aspects of FDI,
including by the ultimate investing country.
There are several different ways that FDI statistics can be used. The discussion
below begins with the uses for the two different bases for measuring aggregate
FDI statistics: asset/liability and directional. It then discusses the detailed
statistical series on flows and stocks and what can be learned from them,
particularly, for example, by examining equity and debt separately. Finally, it
provides examples of useful indicators that can be created with FDI statistics and
how they can be interpreted. This last discussion is organised around common
questions asked about direct investment.
Asset/liability versus directional principle
Aggregate statistics are available on both the asset/liability and the directional
basis. The asset/liability basis classifies financial and income flows and positions
according to whether the direct investment transaction or position is an asset or a
liability to the reporting economy. This is in contrast to the directional principle
which classifies the financial and income flows and positions as to whether the
direct investment was by a resident of that economy to another economy
(outward) or was an investment by a foreign resident into the economy (inward).
Which of these two measures is best to use depends on the purpose of the
analysis.
The asset/liability presentation puts the FDI statistics on the same basis as other
statistics in the BOP and IIP accounts. As such, these statistics are most
Measuring International Investment by Multinational Enterprises
28
appropriate for macroeconomic analyses. In addition, using the statistics including
resident SPEs is recommended for such macroeconomic analyses because the
transactions of SPEs are an integral part of the MNE’s financial transactions and
positions and excluding them would severely understate direct investment
financial flows and positions at aggregate levels for a given country. The inclusion
of these entities promotes symmetry and consistency across countries. For
example, looking at the impact of direct investment on the current account of a
country, it would be best to use direct investment income receipts and payments
measured on an asset/liability basis including resident SPEs. Similarly, comparing
direct investment stocks and financial flows to portfolio investment can provide
insights into the attractiveness of the economy to direct investors, who are
interested in making long term investments that involve undertaking
management of the company and likely results in technology transfer and other
spill-overs, compared to portfolio investors, who are interested in earning more
passive investment income.3
The aggregate statistics on a directional basis are useful for examining the
motivations and impacts of FDI. It is generally best to use the statistics excluding
SPEs because they better represent the actual investment into and out of a
country and, thus, the FDI that is more likely to have a significant impact on the
economy. The detailed statistics by country and industry on the directional basis
are most useful for examining questions, such as which countries are the most
important sources of direct investment in the reporting economy and which
industries they are investing in.
Flows and stocks
Financial flows capture the amount of direct investment in a specific time
period—usually a quarter or a year. Similarly, income flows capture the return
earned on direct investment during a specific time period. In contrast, stocks
capture the cumulative value of direct investment over time. As such, flows are
useful for assessing recent developments in foreign direct investment. For
example, financial flows give an indication of the amount of investment direct
investors are undertaking at a given point in time, so the direction of change in
these flows can indicate whether the investment climate is improving or not.
3 For more information on BOP analysis, see BPM6.
Measuring International Investment by Multinational Enterprises
29
Financial flows consist of three components: equity capital, reinvestment of
earnings, and intercompany debt. Equity capital is often associated with new
investments, such as greenfield or M&As, even though it can also reflect
extensions of capital or financial restructuring. Nevertheless, equity capital flows
are often taken as a sign of the amount of new investments related to FDI.
Reinvestment of earnings is the portion of earnings that the parent decides to
reinvest in the affiliate rather than receive as a dividend and can be an important
source of financing for affiliates. This component of financial flows tends to be the
least volatile. Changes in the reinvestment of earnings reflect both changes in the
earnings of affiliates and in the amount of earnings that parents choose to
distribute. The reinvestment ratio is the share of earnings that the parent
reinvests. It can be an indication of the parent’s perception of investment
opportunities available to the affiliate: if the parent sees the opportunity to make
profitable investments in its affiliates, the parent might choose to reinvest more
money in them. However, many other factors can influence the share of earnings
reinvested. For example, if the parent is in need of cash, they might pay higher
dividends. The third component of financial flows—intercompany debt–is the
most volatile component of financial flows and is often driven by the short term
financing needs within a company rather than larger overall macroeconomic
phenomena. As such, intercompany debt is often the most difficult aspect of
financial flows to explain. They can switch direction as large loans are received
and then paid off. Examining the components of financial flows is important
because it can provide insights into the nature of FDI. For example, a drop in
inward investment due to repaying an intercompany loan is interpreted
differently from a drop in inward investment due to a drop in equity capital flows.
Income flows include income earnings on equity and debt. Income on equity is the
earnings of the affiliate, and income on debt is interest receipts and payments
associated with intercompany debt. Changes in income, particularly earnings,
reflect changes in the profitability of affiliates. As will be discussed below, when
compared to the size of the investment position, earnings can show the return on
the investments made by the parent in the affiliate.
Positions are the accumulated value of direct investments measured at a specific
point in time, such as the end of a quarter or of a year. The proper valuation is
market value which values all of the investments made over time at current
period prices. If another valuation is used, it misstates the value of the position
and likely misstates the value of older investments more as the value of
Measuring International Investment by Multinational Enterprises
30
investments tend to rise over time. The change in the position from one point in
time to the next is due not only to the financial flows during the period but also to
changes in prices, exchange rates, and other changes in value, such as the write-
down of assets. The inward position indicates the overall value of foreign direct
investors’ investment in the reporting economy, and the outward position
indicates the degree of penetration of resident direct investors in foreign
countries. Positions are often used as a base for calculations of things like return
on investment or in indicators. Looking at how the position has changed over
time, gives an indication of structural changes in the economy, such as opening up
to foreign investment.
Indicators
This section gives some examples of indicators that can be constructed using FDI
statistics. The discussion is organised around common questions about FDI.
How important is FDI to a particular economy? To what extent is an economy globalised through FDI?
These two questions are related because they both ask what role FDI plays in
host and home countries. The statistics on a directional basis excluding resident
SPEs are best to use in answering these questions because they distinguish
between inward and outward investment and because they exclude funds that
are simply passing through the economy on their way to another destination via
SPEs.
A common way to judge the importance of FDI to an economy is to compare the
size of the outward and inward financial and income flows and positions to GDP.
By normalising these measures by GDP, it allows for comparisons across countries.
Such measures show the extent of globalisation through FDI at a given point in
time. For example, the ratio of inward direct investment financial flows to GDP
shows the relative attractiveness of the economy to FDI for that time period, and
the ratio of inward and outward stocks to GDP shows the extent of globalisation
of the economy at a point in time. Looking at how these indicators change over
time can shed light on the role of FDI in globalizing the economy over time and
can provide information on structural changes in direct investment, such as
greater openness to foreign investment. Looking at stocks can give a clearer
picture as flows can be significantly affected by one-time events.
Measuring International Investment by Multinational Enterprises
31
GDP is often used to normalize FDI flows and stocks
because it is widely available on a timely basis.
However, there are other statistics that can provide
meaningful measures of the importance of FDI to an
economy, including inward investment as a share of
gross fixed capital formation. However, care should be
taken in interpreting this ratio as FDI flows may be
related to changes in ownership of existing capital
rather than the formation of new capital, such as with
mergers and acquisitions.
Which countries are the most important sources of direct investment in a country? Which countries are the most important destinations of direct investment for a country?
It is possible to construct an indicator showing inward investment for a particular
country over total inward investment. These can be constructed with either
financial flows or positions, depending on the question; if the question is which
country is the most important source of FDI in a specific period, say the most
recent quarter, then flows can be used. If instead the question is asking for the
most important investing countries on a long term basis, then positions should be
used. For inward investment, there are two possible series that can be used to
answer this question. The first is the standard series by immediate partner
country; it is the most widely available. The second is the supplemental series by
ultimate investing country. The latter series is preferable because it identifies the
country of the investor who ultimately controls the investment, but it is not as
widely available and is available for positions only.
For outward investment, it is also possible to construct an indicator showing
investment in a particular country over total outward investment. Again it is best
to use directional statistics excluding resident SPEs. However, these statistics will
not give a very precise picture when parents in a country channel FDI through
SPEs in other countries. The destination of outward investment would be shown
best by statistics by the ultimate host country, but such statistics are not yet
available. (See the section on “OECD research to further improve the
measurement of foreign investment” for more information on statistics looking
through non-resident SPEs and by ultimate host country.)
Gross fixed capital
formation: a national
economic account concept
that measures the value of
producers’ net acquisition of
fixed assets, which are
assets used in production.
Fixed assets include
structures, equipment, and
intangible assets.
Measuring International Investment by Multinational Enterprises
32
Which industries are most important for direct investment?
This can be answered using the standard series by industry of the affiliate and
constructing indicators as discussed above for identifying the most important
countries for FDI. However, the outward investment statistics may give a distorted
picture of the most important industries if parents are channelling their FDI
through non-resident SPEs.
How do the rates of return on FDI compare to the domestic economy and to other types of investment?
The rate of return is an indication of the profitability of an investment. The
simplest way to calculate the rate of return is as earnings compared to the stock
of investment. It is possible to compare the rates of return on both outward and
inward investment to rates of return in the domestic economy as a whole to see
how they compare to all businesses for a country. This can also be done by
industry. Looking at rates of return over time can indicate whether investments in
resident enterprises are becoming more profitable and whether those enterprises
are becoming more competitive, but it is important to note that cyclical or
structural factors can affect rates of return.
It is also possible to compare rates of return on FDI to other types of investment,
such as portfolio investment. For these comparisons, FDI statistics on an
asset/liability basis rather than the directional basis should be used.
Measuring International Investment by Multinational Enterprises
33
Related data sets
There are two other data sources that capture other aspects of international
investment by MNEs. The first are Activity of Multinational Enterprises (AMNE)
statistics, and the second are international mergers and acquisitions (M&A) data.
Activity of multinational enterprises statistics
AMNE statistics provide information on the financing and
operations of MNEs.4 They consist of variables measuring their
operations, such as turnover (sales), employment, and value
added. Generally, the entities covered in AMNE statistics are
considered to be a subset of those covered by FDI statistics
because they cover only controlled affiliates. However, the
AMNE statistics can be considered as having broader coverage
in a couple of ways. First, they usually include SPEs because
SPEs are important providers of services within the MNE.
However, given the nature of SPEs, their inclusion will have
little impact on many of the variables included in AMNE
statistics, such as employment. Second, AMNE statistics cover the full value of the
variables for the MNE. FDI statistics, on the other hand, just represent the
parent’s claims on the affiliate and, so, are adjusted by the parent’s share of the
equity in the affiliate.
There are certain AMNE variables that capture information on the investments of
MNEs. For example, AMNE statistics may include information on capital
expenditures, which cover investments in new property, plant, and equipment,
and on R&D expenditures, which capture some investments into the creation of
intangible assets.
AMNE statistics are becoming more useful as the number of countries compiling
them increases, and the international standards for compiling AMNE statistics
improve. There are things that could make these statistics even more useful,
including further developing links between FDI and AMNE statistics as is being
done in research conducted by the OECD Working Group on International
4 There is a closely related dataset, Foreign AffiliaTe Statistics or FATS, that also provide information
on the financing and operations of MNEs. While they include similar data, AMNE statistics are generally considered to be more comprehensive because they cover the activities of parent companies as well as affiliates while FATS focuses on the affiliates.
Controlled affiliates:
affiliates owned more
than 50% by the foreign
parent.
Special Purpose Entity
(SPE): an entity with little
or no physical presence
in the country but that do
provide services to the
MNE, such as holding
assets and liabilities or
raising capital.
Measuring International Investment by Multinational Enterprises
34
Investment Statistics (see the section “OECD research to further improve the
measurement of foreign investment”). Linking AMNE data to other data sources,
such as to data on patents and trademarks, on employment, and on trade, would
further enhance the usefulness of these data.
International mergers and acquisitions data
Data on international M&As are available from private sources. They are the most
timely information available on international investments by MNEs, and they are
not subject to many of the confidentiality restrictions of FDI statistics from
countries because they are corporate events, which means more detail on the
transactions are often available. International M&A statistics are not consistent
with FDI concepts because they include the full financing of the merger or
acquisition and not just the portion attributable to the direct investor, and
because they do not capture FDI financial flows not due to M&As, such as the
reinvestment of earnings, capital contributions, and most intercompany loans.
Nor do they cover income flows or positions. There are no standards for compiling
these statistics, so the methodologies may vary from provider to provider.
Nevertheless, the FDI financial flows and international M&A data do tend to track
together at the global level, so these data can give an indication of the direction of
change in FDI flows for a specific period. Finally, they also often provide
information on the ultimate investor and ultimate host of investment that can be
obscured in FDI statistics if the parent chooses to channel its direct investment in
the affiliate through another country.
Measuring International Investment by Multinational Enterprises
35
OECD research to further improve the
measurement of foreign investment
At the time that BMD4 was published, there were several items left on the
research agenda. These were classified into several broad issues affecting FDI
statistics. Below each of these issues is described as well as progress that has
been made in addressing them, if any, since BMD4 was published.
Capital in transit
Capital in transit is financing that flows through multiple entities before reaching
its final destination. It leads to double-counting of FDI financial flows as well as of
income and positions. It affects the geographical and industrial distribution of all
direct investment statistics. The exclusion of resident SPEs is an important step to
removing capital-in-transit from both the inward and outward investment of FDI
statistics for countries that are host to a significant number of SPEs. To remove all
capital-in-transit from FDI statistics, a method to segregate capital-in-transit
flowing through operating affiliates needs to be developed. In addition, the
guidance for compiling FDI statistics will need to be maintained and updated in
light of developments and innovations in international finance.
Ultimate host country
The counterpart to the statistics by UIC would be a presentation by the ultimate
host country. Compiling statistics according to the ultimate host country would
present a more accurate picture of where investors from particular countries are
investing and the industries that they are investing in. BMD4 did not provide any
guidance or methodology for compiling statistics according to the ultimate host
country because substantial conceptual issues remain. These issues include the
difficulties in linking specific sources of funding with specific uses and the fact that
direct investments made by intermediate enterprises in ownership chains may
reflect that not only funding provided by their direct investors, but also funding
that these enterprises may have obtained from other sources, such as local
owners or lenders. Research will focus first on clarifying the concept of ultimate
host country to determine if it is feasible to develop methods to allocate outward
investment positions and transactions to ultimate host countries.
Links between FDI statistics and other statistics on MNEs
While FDI statistics are crucial to understanding the direct investment relationship
and provide important insights into the economic linkages between economies,

Measuring International Investment by Multinational Enterprises
36
additional statistics are necessary to place these statistics into context, to describe
the enterprises in which there is direct investment, measure their activities, and
assess their economic impact. Such complementary statistics are required to
underpin analyses of the globalisation of production through FDI. AMNE statistics
provide such additional statistics.
While both FDI and AMNE statistics cover aspects of the operations of MNEs, they
are not based on compatible statistical concepts and definitions, and, therefore,
cannot be used in tandem. To use them together requires eliminating the
methodological differences which exist between the financial and economic
measures of MNEs and developing a comprehensive analytical framework. The
OECD Working Group on International Investment Statistics has developed a
framework, called the MNE framework, which reconciled the differences in
concepts and definitions to provide a workable way of using the two sets of data
in tandem.
The MNE framework combines information on cross-border financing from the
FDI statistics with information on third party financing, including local financing,
and on total assets from the AMNE statistics to provide a complete picture of the
financial structure and financing of the MNE. The MNE framework is also a
statistical framework that combines financial and economic variables of MNEs so
that the links between their financing and real activities can be examined. The
OECD is exploring the feasibility of collecting data using the MNE Framework.
Measuring International Investment by Multinational Enterprises
37
Why the OECD produces the Benchmark Definition of Foreign Direct Investment
FDI is a key driver of international economic integration. With the right policy
framework, FDI can provide financial stability, promote economic development and
enhance the well-being of societies. Reliable FDI statistics have always been
essential for policy makers faced with the challenges of attracting and making the
most of international investment. In the early 1980s, the OECD recognised that
traditional reporting models could not account for the removal of regulatory
barriers for cross-border investments, the evolution of multinational enterprises,
and the increasing complexity of their financing through offshore tax jurisdictions
and other arrangements. As a result, in 1983, the OECD adopted a new "Benchmark
Definition of Foreign Direct Investment" which provided a comprehensive set of
rules to improve statistical measures of foreign direct investment.
However, the financing structures of multinational enterprises and other business
combinations have continued to evolve in an increasingly globalised market. To
adapt the statistical measures to changing economic and financial realities, the
OECD adopted in 2008 the 4th edition of the Benchmark Definition of Foreign
Direct Investment which sets the world standard for FDI statistics. The 4th edition
of the Benchmark Definition serves as a single point of reference for all that is
related to FDI and its measurement.
The 4th edition of the Benchmark Definition of Foreign Direct Investment was the
result of the work by the Working Group on International Investment Statistics,
representing the international community of FDI statisticians and chaired by Mr.
Roger De Boeck. The work was undertaken at the request of the OECD Investment
Committee and in co-operation with the IMF and other partner international
organisations. It was supported by material prepared by the Secretariat of the
Working Group, Ayse Bertrand, Senior Statistician in the OECD Investment Division
headed by Pierre Poret in the Directorate for Financial and Enterprise Affairs.
Measuring International Investment
by Multinational Enterprises
www.oecd.org/investment/statistics.htm