Embed Size (px)
Citation preview

1
Building a Successful and Integrated Wealth Management Business
© The Asian Banker. All rights reserved
THE BANKING ACADEMYStrategic Business Intelligence For The Financial Services Community
The Consumer BankingCompetitive Benchmarking Series
Building a Successful and Integrated Wealth Management Business

This page has been left intentionally blank

IMPORTANT NOTICE
Although the author and publisher have tried to provide information as accurately as possible, they accept no responsibility for any loss, injury or inconveniences suffered by any person using this document. The author and publisher have taken all reasonable care to ensure the data and information in this report is accurate and presents a fair representation of the subject matter.
Publication: May 2008ISBN No: 978-981-05-9797-9
© 2008 The Asian Banker. All rights reserved.
The Asian Banker, incorporated in Singapore as T.A.B. International Pte Ltd, claims all rights as owner of intellectual property in this report. No part of this document may be reproduced, stored in a retrieval system or transmitted in any form by any means, electronic, mechanical, photocopying, recording or otherwise, without the written permission of the publisher and the copyright owner.

This page has been left intentionally blank

ABOUT THE ASIAN BANKER
Asia’s fi nancial service landscape is undergoing tremendous change and evolution. Liberalisation, consolidation and rapid technological advances have opened up tremendous opportunities for fi nancial institutions and, it is vital for banks to benchmark themselves against their competitors and to keep abreast of global developments.
Decision-makers need accurate, incisive, timely and continuous information to bring their organisation to the next level, meet competitive challenges successfully and manage their own future. The Asian Banker has long recognised the importance of information as a strategic management and decision-making tool and is positioned to provide banks and partner organisations useful, crucial and timely business intelligence.
The Asian Banker achieves this through three synergistic services:
Asian Banker ResearchAsian Banker Research is a leading provider of a wide range of intelligence-based reports and research products for the banking and fi nancial services community. It is designed to provide senior management with critical business intelligence to secure a market leader position in the industry.
The Asian Banker Research is well-recognised for producing incisive, timely and current research which are benchmarked to global best practice issues and directions and positioned to help clients make informed decisions.
Asian Banker EditorialAsian Banker Editorial produces The Asian Banker Journal – the fl agship regional publication covering industry best practices and Asia’s leading strategic business magazine for decision-makers at CEO level. The publication has become the leading commentator on developments in Asia Pacifi c’s fi nancial services industry.
Asian Banker ForumsAsian Banker Forums organises conferences and roundtables for senior executives on key areas of development in the industry. The company’s fl agship event is The Asian banker Summit, inaugurated in 2000 and attended by delegates from around the region.
Head Offi ce: The Asian Banker (T.A.B. International Pte Ltd) 10 Hoe Chiang Road #14-06 Keppel Tower Singapore 089315 Tel: +65 6236 6500 Fax : +65 6236 6530 Email: [email protected] Website: www.theasianbanker.com Representative Offi ces: Malaysia No. 55-6, The Boulevard, Mid Valley City, Lingkaran Syed Putra, 59200 Kuala Lumpur, Malaysia Tel: (6) 03 2284 7110 Fax: (6) 03 2284 5300
Beijing #2805 Tower 12, Jianwei SOHO, 39 Dong San Huan Zhong Road, Chaoyang District, Beijing 100022 Tel: (86) 10 5869 3492 Fax: (86) 10 5869 3491
Shanghai P.O. Box 31-04, Shanghai 200031 People’s Republic of China Tel: (86) 21 6466 3079 Fax: (86) 21 6466 3291

This page has been left intentionally blank

PREFACE
Over the last decade Internet banking propositions have evolved from simple brochures into supermarket stores. Today, Internet Banking itself has become a mainstream offering with all fi rst and second tier banks offering internet banking facilities in the Asia Pacifi c. The channel is no longer a competitive advantage but necessity and the focus has shifted to transforming Internet Banking into highly interactive personal portals. Banks across the region are working on sophis¬ticated navigation systems, interactive tools, integrated processing of account and product applications, segmented offerings and targeted marketing strategies.
Leading banks in the region are also actively pursuing strong revenue performance, customer retention, deposit generation and increasing efforts to integrate the Internet banking platform with call centre and mobile phone banking.
This research report presents the latest developments and initiatives in converting Internet Banking into an effective sales channel and creating a highly interactive portal for better customer retention, usage and satisfaction. It paints an in-depth picture of Asia Pacifi c banks’ Internet banking practice as it stands today from the view points of the banks themselves. The ability to obtain key primary and secondary data, by institution, country and region gives our insights, as presented in the full report, valuable context.
Asian Banker Research also provides tailored services on fi nancial services delivery channels and payment instrument issues that allow you to purchase selected information beyond what is available in Next Generation Internet Banking: Successfully Maximising Revenue and to integrate it into your own research.

This page has been left intentionally blank

TABLE OF CONTENTS
Key Findings 1 Executive Summary 2
1 Introduction 31-1 Defi nitions and Terminologies used in this Programme1-2 The concept of “The Banks We Like”1-3 The use of Six-SIGMA (DMAIC and DAMDV) in Financial Services 1-4 Introduction to Scenario Planning tools used in this programme1-5 Introduction to Strategic Planning tools used in this programme1-6 Introduction to Balanced Scorecard used in this programme
2 Macro Level Fundamentals 112-1 Fundamental beliefs that determine the shape of the wealth management industry2-2 Industry drivers that determine the competitive landscape 2-3 Sign posts and red fl ags 2-4 Industry Scenarios 2-5 Key macro indicators and top priorities2-6 The fi ve evolutionary stages of the wealth management business 2-7 Aligning strategies according to specifi c country developments2-8 International variations in wealth management classifi cation2-9 Diversifying into other wealth management customer segments2-10 Shifts in customer preference across managed asset types2-11 Wealth management income structure in the Asia Pacifi c
3 Market Level Fundamentals 263-1 Strategic performance indicators3-2 Mapping the development of the wealth management industry against the evolution of productisation capabilities3-3 Developing a sustainable product proposition3-4 Winning the talent war through well designed remuneration and training schemes
4 Street Level Fundamentals 344-1 Balanced scorecard indicators to track your business performance4-2 Key elements defi ning success in the wealth management business4-3 Business architecture of a benchmark bank’s wealth management business4-4 Identifying strengths and weaknesses of customer relationship cycle management4-5 Benchmarking the frequency of customer contact across channel types4-6 Models that support low advisor attrition and high customer retention4-7 Operational roadmap towards successful customer segmentation4-8 Rationalising customer segmentation to support relationship centric strategies4-9 Our scorecard for assessing players in this business4-10 The “Banks We Like”4-11 The Questions we ask

This page has been left intentionally blank

Asian Banker Research 1
KEY FINDINGS• Remittance offers signifi cant top line contribution. Leading banks in Asia showing a
growth rate for value of cross border funds transfer and revenue growth of above 40% CAGR between 2004 and 2008.
• Banks are strategically leveraging their payments expertise and network to provide low priced solutions that are relationship driven and in thus seriously challenging the MTO dominion, while MTOs selectively offering more fi nancial services previously offered by commercial banks. To pre-empt the erosion in each other turf MTOs and commercial bank will selectively enter into cooperative fee sharing behaviour.
• Eight out of ten banks fail to strategically target remittance with relationship focus for broader product propositioning, taking an enterprise wide view. Successful banks complement remittance products with targeted cross selling, customer service architecture and a dedicated CRM team to maximize relationship value.
• Successful banks have not only achieved above 99 percent straight through processing in systems but also complemented it with proprietary message standards and end to end control of process.
• Best banks have reduced their processing cost per transaction to less than a dollar. For competitive edge, banks are bypassing the shared payment infrastructure through use of web based systems for better operational effi ciencies.
• Best banks have developed customised proprietary solutions with the real time integration ability facilitating instant transfer across countries, multiple currencies and payment modes (including cash).
• For competitive edge, banks increasingly need to look at real time integration of their centralised processing system not only with the front end but also with treasury system for instant transfer capability and with risk management and back up system for end to end process control and transaction monitoring.
• Best banks have developed customised proprietary solutions with the real time integration ability facilitating instant transfer across countries, multiple currencies and payment modes (including cash).
• Leading banks optimize online remittance through instant funds transfers with personalised features, transaction tracking ability and direct links with contact centres. For future operational effi ciencies, banks need to further harness the power of internet platform and mobile phone banking for remittance.
• Leading banks have effectively utilized bilateral partnership arrangements to extend their global reach and instant transfers. Competitive advantage could further emerge through partnerships with non banking entities like remittance companies and mobile network operators.
Key Findings

This page has been left intentionally blank

Asian Banker Research 2
EXECUTIVE SUMMARY
• In mature markets, such as Hong Kong, Singapore and Taiwan new Internet banking accounts grew by 20 percent in 2006 and 2007, while in emerging markets the growth in signups was even higher, albeit from a low base.
• In 2006, the total number of online transactions increased by more than 30 percent for leading banks in mature markets.
• Leading banks in the Asia Pacifi c region have gained dominant market position in online banking of between 30% and 60%.
• In developed markets in the region, on average, 21 percent of consumer transactions are conducted online, contributing 12 percent of the total value of transactions.
• In emerging Asian economies, a mere 7 percent of transactions are conducted online, contributing 6 percent in terms of value.
• Less than 5 percent of banks are able to conduct more than 25 percent of their retail banking sales online and the channel contributes 15 percent to retail fee income.
• The primary activity on the Internet continues to be relatively low value actions such as account inquiries and transactions, however some banks are successfully using the Internet to sell high value added products and services such as mutual funds.
• Key revenue drivers for Internet banking is fee income from mutual funds and online trading.
• While revenue generation is on the rise, majority of banks have yet to recoup their investment in Internet banking.
• 9 out of 10 banks in the region still look at Internet banking primarily from a cost cutting and effi ciency perspective; however Internet banking also helps to attract and retain profi table customers, build brands and sell products and services.
• The degree of customer stickiness corresponds with the scope and frequency of bill payment functions and transactions. Low attrition rates in the range between 50 and 70 percent correspond with active bill payment user rates between 30 and 35 percent.
• There are six key metrics for developing a successful online business: strong revenue performance, successful remote customer and deposit acquisition, client retention, ease of navigation, simple product and account application processes and customer relationship development.
• Banks add multiple layers of effective and proactive security measures they must balance this against a possible loss of customer convenience.
• Successful banks have invested continuously in enhancing the customer experience, and are using customer segmentation, behavior modeling and targeted online marketing campaigns to achieve this.
• New market entrants are gaining a competitive edge through innovative strategic marketing initiatives such as the use of audio visual media, attractive returns and incentives.
• Internet only banks have shown promising revenue potential with high deposit acquisition and annual revenue potential of almost US$200 per customer per year and this is motivating leading Asian banks to target customers using this niche approach.
Executive Summary

This page has been left intentionally blank
Asian Banker Research 3
Chapter 1 Introduction
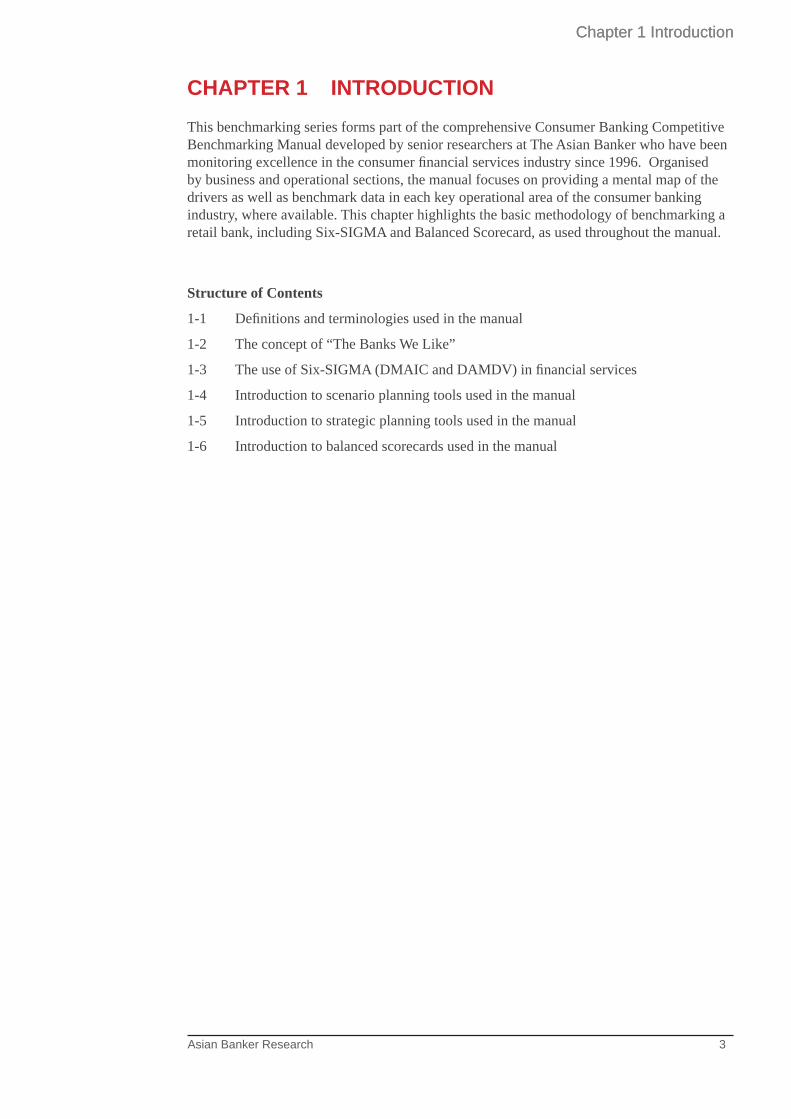
CHAPTER 1 INTRODUCTIONThis benchmarking series forms part of the comprehensive Consumer Banking Competitive Benchmarking Manual developed by senior researchers at The Asian Banker who have been monitoring excellence in the consumer fi nancial services industry since 1996. Organised by business and operational sections, the manual focuses on providing a mental map of the drivers as well as benchmark data in each key operational area of the consumer banking industry, where available. This chapter highlights the basic methodology of benchmarking a retail bank, including Six-SIGMA and Balanced Scorecard, as used throughout the manual.
Structure of Contents
1-1 Defi nitions and terminologies used in the manual
1-2 The concept of “The Banks We Like”
1-3 The use of Six-SIGMA (DMAIC and DAMDV) in fi nancial services
1-4 Introduction to scenario planning tools used in the manual
1-5 Introduction to strategic planning tools used in the manual
1-6 Introduction to balanced scorecards used in the manual
Chapter 1 Introduction

Asian Banker Research 4
Chapter 1 Introduction
1-1 Defi nitions and terminologies used in the manual
1-1-1 What is a Benchmark?• A relevant strategic intent, performance or process indicator in a business that can
provide a reference point for other similar businesses to validate their own performance relative to the same.
• All benchmarks are relative and evolve over time.• There is no one benchmark for any one activity.• Benchmarks are only comparative not determinant.
1-1-2 What is an “(Indicative) Best Practice”?• A technique, method, process, activity, incentive or reward that has been proven to be the
most effective in delivering a particular outcome to achieve a similar business objective.• It is often diffi cult to determine “a single” best practice given the dynamic nature of
business today. Hence, The Consumer Competitive Benchmarking Programme uses the idea of an “indicative best practice”.
• Best practices are constantly modifi ed by competition, technology and new methodologies and need to be updated constantly.
1-1-3 Key terminology used in the manual • Defi nition – The critical success factors that defi ne how the business or activity is run• Measurable Drivers – The drivers used to measure the performance of the business.• Process Analytics – The process maps that describe the business and that are linked to the
measurable drivers.• References – Other reference sites and organisations that can be used to compare or
validate the business, process or activity under study.
1-1-4 The questions we ask
• The questions are designed to help facilitate understanding of the elements and key drivers of that business immediately.
• The “Questions We Ask” for each area are updated regularly based on feedback and development of our own understanding of the important elements.
Figure 1-1-4-1 The questions we ask
For every business, activity or process under scrutiny, we design a standard set of basic questions specifi c to each. The questions are designed to help researchers understand the elements and the key drivers of that business immediately. The “Questions We Ask” for each area are updated regularly based on feedback and a development of our own understanding of the important elements.
The Questions We Ask
How would you describe the architecture of this business?
What are the key drivers of success that distinguishes you from your competitors in this business?
What is the revenue structure of this business and the revenues derived from it currently
What is the cost structure and cost elements of the business?
Describe elements of the IT infrastructure to support that business
Describe what is the marketing ROI for this programme?
Risk management questions: write-offs, delinquencies and recoveries
Process questions such as turnaround times, transaction volumes
Describe your collections and delinquency policies
What is the management profi le of the business?
What is the ROA, ROE, daily booking value, EBITA of this business?
Source: Asian Banker Research

Asian Banker Research 5
Chapter 1 Introduction
1-1-5 Four toolsets used in the rigorous assessment of a bank’s business or process
Figure 1-1-5-1 The toolsets used in the benchmarking manual
• Key elements of Scenario Planning- A fundamental belief that defi nes our assessment of the fi nancial services industry
(e.g. The belief in long-term and sustainable proposition upon which the Excellence Programme is based).
- An assessment of global trends in the fi nancial services and related industries- A rigorously developed evolution map of the consumer banking and related industries
• Key elements of Strategic Benchmarking- A well-drawn business architecture is fundamental to developing an intuitive under-
standing of the industry.- Timelines provide the evolutionary dimension within which all strategic intent is realised.- A rigorous SWOT analysis helps provide an impartial perspective of our own strategic intent.
• Key elements of Performance Benchmarking- A Balanced Scorecard to map strategic intent to key fi nancial objectives, customers,
infrastructure and processes as well as the ability of the organisation to learn and innovate over time.
- Management Dashboards to focus the decision making processes of the bank on meaningfully achievable goals, based on rigorous use of Management Information Systems (MIS) to provide the data for management decision support.
- GAP analysis to track the performance of the bank against peers and best practice.
• Key elements of Process Benchmarking- The DMAIC (Defi ne, Measure, Analyze, Improve, Control) methodology in Six-SIGMA
green belt forms the basis of our benchmarks for operational and business processes.- Process benchmarks developed from best practices of both within and outside the
banking industry.- GAP analysis to benchmark the processes of the bank with peers and best practice
• A systematic way to think about future trends and possibilities and upon which benchmarking models are built on
• The high level design of a business process or activity on which the rest of the evaluation is built on.
• The qualitative measurement of a business based on goals
• An assessment of the processes that support a business objectives
Scenarios
Strategic Benchmarks
Performance Benchmarks
Process Benchmarks
Source: Asian Banker Research

Asian Banker Research 6
Chapter 1 Introduction
1-2 The Concept of “The Banks We Like”
Figure 1-2-1 The bank’s key stakeholders
1-2-1 What is the concept of “The Banks We Like”?• “The Banks We Like” is our proprietary model for identifying and select a cross-section
of banks worldwide that are worth monitoring and benchmarking against.
1-2-2 The criteria for selecting “Banks We Like”• The banks must be responsible to all their stakeholders at all times• The “Banks We Like” are not necessarily the best retail banks; they may be excellent
only in specifi c areas.• Banks that have been affected by current economic circumstances are not necessarily
disqualifi ed from “The Banks We Like” list.
1-2-3 “The Banks We Like” fall into one or several of the following types:• Banks that fulfi ll the basic criteria of a well run institution. These include:
- A strong liabilities base- Strong fee based income- Stable recurrent revenue- Diversifi ed core revenue streamsConsistent ROE- Managed NPLStrong franchise value Banks that demonstrate tactical excellence rather
than in business areas of the industry• Banks that demonstrate excellence in a business line• Banks that are demonstrating the correct institutional response to current business climate
1.4.4 The Banks We Like
The Bank’s Key Stakeholders
Regulators
Shareholders
Employees
Customers
Source: Asian Banker Research

Asian Banker Research 7
Chapter 1 Introduction
1-3 The use of Six-SIGMA (DMAIC and DAMDV) in Financial Services
1-3-1 What is Six-SIGMA (DMAIC and DAMDV) about? • Overall, Six-SIGMA is simply about how far off center and varied a process is from its
intended performance. DMAIC is a methodology for improving an existing process• DMADV is a methodology for creating a new design or product.
1-3-2 What does the DMAIC methodology involve?
Figure 1-3-2-1 Elements of the DMAIC methodology
• DMAIC stands for Defi ne, Measure, Analysis, Improve and Control.• Defi ne aspects of the existing process that needs to be improved.• Measure the indicators related to process improvement requirements.• Analyse the underlying problems in the existing process using indicators collected. • Improve the process by implementing fi ndings from multiple analysis.• Control performance of improved process through monitoring and troubleshooting.
1-3-3 What does the DMADV methodology involve?• DMAIC stands for Defi ne, Measure, Analysis, Design and Verify.• Defi ne aspects of the design or product to be created.• Measure design / product parameters and identify issues crucial to quality.• Analyse the data using indicators collected.• Design product according to key parameters and issues crucial to quality.• Verify integrity and effi cacy of design or product through pilot trials, after which to
implement production.
Copyright The Asian Banker 2008. All rights reserved 1.5.4.Six Sigma Definitions
• Charter• Customer needs, requirements.• High-level process map.
• Data collection plan• Plan implementation
• Data analysis• Process analysis• Root cause analysis
• Solution generation• Solution selection• Solution implementation
• Control methods• Response plan
Define
Measure
AnalysisImprove
Control
Source: Asian Banker Research

Asian Banker Research 8
Chapter 1 Introduction
Figure 1-3-2-1 Elements of the DMAIC methodology
1.5.4
• Design goals• Customer needs, requirements.• High-level process map.
• Data analysis• Process analysis• Root cause analysis
• Solution generation• Solution selection• Solution implementation
• Set up pilots• Implement
production
Define
Measure
AnalysisDesign
VerifyDMADV is also
known as DFSS, an abbreviation of “Design For Six
Sigma”
• Identify CTQs (crucial to quality)• Data collection plan• Plan implementation
Source: Asian Banker Research
1-4 Introduction to scenario planning tools used in this manual
Figure 1-4-1 Key elements of scenario planning
• “What do you believe to be true?” The belief that will form the basis of your value judgment as you craft your various scenarios
A Fundamental Belief
• The drivers that will shape or drive the possible outcomes in your scenariosDrivers for Change
• Developments that will be indicators that you are on the right track
Sign Posts
• Developments or factors that will indicate that the you are moving away from the scenarios that you have crafted
Red Flags
Source: Asian Banker Research

Asian Banker Research 9
Chapter 1 Introduction
1-4-1 What are the key elements of scenario planning used in this manual?• A fundamental belief that defi nes our assessment of the fi nancial services industry (eg.
The Belief in long-term and sustainable proposition upon which The Asian Banker Excellence in Retail Financial Services Programme is based).
• An assessment of global trends and its drivers in the fi nancial services and related industries.
• A rigorously developed evolution map of the consumer banking and related industries• Sign Posts and Red Flags that invalidate or prove your fundamental beliefs.
1-4-2 How is scenario planning used in this manual?• To identify trends and developments that affect the specifi c businesses, processes or
initiatives that are being benchmarked.• To list as many of the drivers that can shape the stated goals of a benchmarking exercise
for better or for worse for the future.• To ensure that benchmarking is grounded in the context of reality.
1-5-1 What are the key elements of strategic planning used in this manual?• Historical timelines that provide the evolutionary dimension within which all strategic
intent is realised, whether intentionally or otherwise. It underscores the importance of evolution in realising strategic intent that has to take its course over a period of time.
• Business architectures wherein a well drawn customer centric business architecture is fundamental to mobilising people and the business processes in an intuitive manner.
• SWOT analysis where a rigorous assessment of the Strengths, Weaknesses, Opportunities and Threats helps provide an impartial perspective of the strategic intent of the organisation.
• Measurable drivers as identifi ed through a Balanced Scorecard Strategy Map.
1-6 Introduction to balanced scorecards used in this manual
Figure 1-6-1 Elements of the balanced scorecard• Objectives
• Measures• Targets
• Initiatives
Financial“To succed financially, how should we appear to our shareholders?”
• Objectives• Measures
• Targets• Initiatives
Internal Business Process“To satisfy our shareholders and customers, what business processes must we excel at?”
• Objectives• Measures
• Targets• Initiatives
Customer“To achieve our vision, how should we appear to our customers?”
• Objectives• Measures
• Targets• Initiatives
Learning and Growth“To achieve our vision, how will we sustain our ability to change and improve?”
Vision and Strategy
Source: Asian Banker Research

Asian Banker Research 10
Chapter 1 Introduction
1-6-1 What is the balanced scorecard?• A process by which the baseline fi nancial measurement of a business or process is
balanced with other aspects to ensure that it achieves the broader objective of being a sustainable business.
• The balanced scorecard suggests that we view, develop metrics, collect data and analyse an organisation from four key perspectives: fi nancials, customer, internal business process as well as learning and growth.
1-6-2 Why is the balanced scorecard used in the manual?• Our methodology uses balanced scorecards to map strategic intent to key fi nancial
objectives, customers, infrastructure and processes. • The balanced scorecard enables us to assess the ability of the organisation to learn and
innovate over time.
1-6-3 What are the rules for developing balanced scorecards?
Figure 1-6-3-1 Building a strategy map through the balanced scorecard approach
• Start building a balanced scorecard by identifying fi rst the key fi nancial performance measures for your business line.
• Identify elements or activities for the layer ‘customers’ that help or promote the type of fi nancial performance and do the same subsequently for the following layers.
• At the end, elements and activities are identifi ed for each of all the four areas (fi nancials, customers, processes and learning), connecting them to elements in the other three areas. Do not leave any area blank.
• Ensure that each element or activity you list can be measured in some way.• It always helps to start with a single strategic intent and to map the rest of the elements
from there.
Source: Balanced Scorecard Institute

Asian Banker Research 11
Chapter 2 Macro Level Fundamentals
CHAPTER 2 MACRO LEVEL FUNDAMENTALSStructure of Contents
2-1 Fundamental beliefs that determine the shape of the wealth management industry
2-2 Industry drivers that determine the competitive landscape
2-3 Sign posts and red fl ags
2-4 Industry Scenarios
2-5 Key macro indicators and top priorities
2-6 The fi ve evolutionary stages of the wealth management business
2-7 Aligning strategies according to specifi c country developments
2-8 International variations in wealth management classifi cation
2-9 Diversifying into other wealth management customer segments
2-10 Shifts in customer preference across managed asset types
2-11 Wealth management income structure in the Asia Pacifi c

Asian Banker Research 12
Chapter 2 Macro Level Fundamentals
2-1 Fundamental beliefs that determine the shape of the wealth management industry
Figure 2-1-1 Fundamental beliefs shaping the industry
The following are some of the fundamental beliefs shaping the industry in different markets
• “Long-term growth trends in household income, the HNWI population and stock market capitalisation drive the WM business.”
• “The proliferation of WM propositions will be followed by a consolidation phase due to the downtum and greater customer eduction.”
• “WM is a proactive strategy to retain our best clients and increase customer wallet share.”
• “Asset allocation in Asia will continue to shift away from cash and deposits to more productive assets.”
• “WM is one of the top priorities, if not the top priority, for revenue growth in consumer banking.”
• “The WM business is so fragmented that you can be a tiny player and still fi nd it very profi table.”
• “There is no getting around the fact that relationship managers will make or break our WM business.”
Source: Asian Banker Research
2-2 Industry drivers that determine the competitive landscape
Figure 2-2-1 Drivers shaping the competitive landscape
The drivers shaping the competitive landscape• Long term growth for the macro-economy and HNWI population
• Impact of capital market cycles on short-mid term prospects of the WM business
• Shifts in customer preference across managed asset types and the development of sustainable product propositions
• Bank’s ability to design WM propositions that fi ts well with their franchise
• Bank’s ability to adopt open architecture cost effectively
• Successful customer segmentation and applying it in relationship centric strategies and channel deploymentSource: Asian Banker Research
2-3 Signposts and red fl ags
Figure 2-3-1 Signposts and red fl ags in the WM business
Sign Posts• CAGR of household investable assets and HNWI population over 3 years
• YoY growth in capital markets
• Growing shift towards more productive household assets
• Proliferation and then consolidation of propositions,
• Growing sophistication in segmentation and channel deployment
• Increasing role of philanthropy
Red Flags• Cannibalisation of existing customers without signifi cant new customer acquisitions
• Poorly designed or unsustainable products
• Spike in complaints about selling practices
• Continued high turnover of relationship managers
• Emergence of a signifi cant trend towards disintermediation
Source: Asian Banker Research

Asian Banker Research 13
Chapter 2 Macro Level Fundamentals
One important red fl ag in play in 2008 is the spike in the number of complaints about selling practices. In Asia, the bankruptcy of Lehman Brothers on September 15 2008, triggered a wave of customer complaints about the selling practices of banks regarding investment products related to Lehman Brothers.
By September 30, two weeks later, the Hong Kong Monetary Authority (HKMA) alone received 2914 complaints about the selling practices of banks. The HKMA was in the midst of investigations at the time this report went into publication, but a spokesman said that if the allegations of misconduct was substantiated, the regulator may take action against banks and bank employees authorised to sell those investment products.
The risk of reputational damage can be exacerbated by the nature of modern communications. In Singapore for example, the failure of Lehman investment products sold by one local bank received signifi cant coverage from blogs and online forums on top of traditional mainstream media.
2-4 Industry Scenarios
The following are three scenarios that span the plausible range of outcomes for the future of wealth management in Asia.
Sustained Global Recession. This is the proverbial worst-case scenario where the Anglo-centric fi nancial crisis spills into an enduring worldwide slump. At the same time that advocates of global fi nancial deregulation fi nally run out of steam after three dominating decades, the once derided Mathusians fi nd redemption as the crunch in commodities proves it is here to stay. Along with the desperate scrabble for resources, we move into a phase of burgeoning regulation and protectionism in all major markets. Wealth creation in Asia stumbles, although it remains amongst the highest in the world. Local wealth management players gain the upper hand as international and off-shore rivals are handicapped by an increasing number of hurdles devised by local regulators.
Global Resilience. The fi nancial crisis, while lasting longer than previous slumps, does not trigger a sustained strident shift towards excessive regulation and protectionism. Industrial innovation signifi cantly mitigates the global strain on resources. However, the crisis of 2008 heralds an age of slower growth as Western markets cut consumption signifi cantly. Export oriented Asia too slows down, despite the downturn setting off a deliberate push towards decoupling from the West and transitioning to a more consumption driven mode. On an uplifting note for wealth management, the downturn proves to be a boon to customer education and aids in the acceleration of customer purchasing behaviour away from transactional towards advisory-oriented investments with longer time horizons. The success of commercial banks in designing new wealth management propositions complementary to their core businesses, thus reinforcing cross-sells, further erodes the once considerable advantages of battered leaders like UBS.
Approaching the Golden Age. The credit crisis impact on Asia is less than expected and nearly forgotten in this region fi ve years later. Advances in technology trump commodity bulls and environmentalists alike and the Asian boom is powered by a virtuous cycle of rising productivity and rising consumption. There will be an ever-increasing number of new wealth management propositions launched by commercial banks and specialist institutions to cater to the new legions of affl uent, with periodic episodes of industry consolidation triggered by events such as the large-scale failure of unsustainable products.
However, we are now fi rmly embarked on the century where Asia has the dominant share of global GDP growth and the Asian consumer, with the benefi ts of pent-up demand and a short memory, always bounces back.

Asian Banker Research 14
Chapter 2 Macro Level Fundamentals
Figure 2-4-1 Asia vs. G7 – Share of world GDP growth
Figure 2-4-2 Signs of a possible limited decoupling between Asia and US
6%
7%
8%
9%
10%
11%
12%
13%
14%
15%
1980
1982
1984
1986
1988
1990
1992
1994
1996
1998
2000
2002
2004
2006
2008E
52%
54%
56%
58%
60%
62%
64%
66%
68%
70%
Asia ex-Japan (LHS) G7 (RHS)
Source: IMF, Morgan Stanley
0
2
4
6
8
10
Jun-97 Dec-98 Jun-00 Dec-01 Jun-03 Dec-04 Jun-06 Dec-07
YoY (%)
0
1
2
3
4
5
YoY (%)
Asia Ex-Japan Real GDP (LHS) US Real GDP (RHS)
0
2
4
6
8
10
Jun-97 Dec-98 Jun-00 Dec-01 Jun-03 Dec-04 Jun-06 Dec-07
YoY (%)
0
1
2
3
4
5
YoY (%)
Asia Ex-Japan Real GDP (LHS) US Real GDP (RHS)
Source: IMF, Morgan Stanley

Asian Banker Research 15
Chapter 2 Macro Level Fundamentals
2-5 Key Macro Indicators and Top PrioritiesFigure 2-5-1 Macroeconomic indicators and wealth management priorities
Macro Indicators WM Priorities
Growth of Asia’s HNWI population for 2007 (min. US$1 mil.)
10.3%
Growth in Asia’s HNWI Wealth for 2007 $1.4 trillionGDP growth for emerging Asian economies in 2007 9%Projected GDP growth in 2009 for emerging Asian economies
7%
Change in MSCI Asia Pacifi c from June 2006 – June 2007
20.5%
Change in MSCI Asia Pacifi c from June 2007 – June 2008
-10.5%
• Customer acquisition and retention
• Towards open architecture and the diversifi cation of assets across risk classes and markets
• Growing the fee-based advisory component of the business through customer education
• Hiring and retaining talented frontline staff
Source: Asian Banker Research
2-6 The fi ve evolutionary stages of the wealth management business
Figure 2-6-1 Development of wealth management business of selected Asian banks
Source: Asian Banker Research
Initial Portfolio Strategic Products
Larger Asset Holding/Processes
Full-Service Relationship
Trusted Advisor
Cost Centre
Long-term Sustainable
Business Value
TIme
Revenue Centre
ICICI Bank
Citigold(HK)Royal Bank of Scotland
Bank Central Asia
Maybank
Chinatrust Commercial Bank
DBS
China Merchants Bank
Hang Seng Bank
China CITIC Bank
Siam Commercial Bank
ICBC
Bank Danamon
Taishin International Bank
OCBC
Citigold SingaporeUOB
Source: Asian Banker Research

Asian Banker Research 16
Chapter 2 Macro Level Fundamentals
To better understand the wealth management business, one can break down the experience of a bank establishing operations from scratch into fi ve distinct stages.
You will fi nd Asian banks in all fi ve stages but they will mostly be clustered in the fi rst two phases. The majority of banks in Indonesia, India and China are in stage one - having recently set wealth management operations to bolster their traditional mass retail business, and tend to be still in the process of completing considerable investment in staffi ng, branch re-engineering, back-offi ce streamlining, IT infrastructure, and business consulting. Stage one activities, such as the migration of low net-worth customers to self-service channels such as ATMs, the internet and call centers, require a substantial investment but is necessary in order to free relationship managers in the branches to focus on wealthy clients. This is necessary in emerging Asia where the number of branches tend to increase at a signifi cantly slower rate than the number of customers. In this fi rst stage of development, it is crucial that banks lay a solid foundation to run the business smoothly in the future. Banks could also offer certain privileges and discounts or use other marketing promotions at this point to draw customer attention and generate leads.
In the second and third stages, productisation will be the main challenge as banks – predominantly from more developed markets like Korea and Taiwan, but also including some banks from Thailand Malaysia, China – are striving to expand their portfolios by providing a wider spectrum of investment products. Initially banks will concentrate on identifying and manufacturing a few key strategic products that are typically principal-guaranteed and have mid-term maturity. These are not only investment vehicles to bring in funds, but also a means to acquire more customer information for segmenting and profi ling purposes. Next, banks will gradually introduce more products through in-house development and external sourcing. With a wider range of products, banks are able to attain a larger asset holding that is sizable enough to cover costs and transform the wealth management business from a cost centre to a profi t centre.
With productisation no longer a main concern, banks can shift their focus towards enhancing customer relationships in the fourth stage of development. With productisation, segmentation and profi ling capabilities honed in earlier stages, banks are better poised to understand customers’ fi nancial needs and can offer more customised offerings. Thus, fi nancial advice becomes a key differentiator, with customers willing to pay a premium for more comprehensive services and a closer relationship. Stage four banks tend to be from Australia, Hong Kong and to a somewhat lesser extent, Singapore. Banks at this stage fi nd retaining staff and preventing poaching by rivals of utmost importance. At the same time, with so many players in the market, customers become more demanding, requiring banks to play a relatively neutral role in providing fi nancial advice to maintain customer loyalty.
Fifth stage banks are already adopting a non-commission based business structure, where the bonus for its employees is mainly based on the performance of the individual, the team and the wealth management business as a whole. By not using a commission-based structure, banks have a chance to show customers that the institution and its employees are working for the benefi t of the customer, rather than themselves. This puts the banks on the path to becoming trusted advisors and deriving long-term sustainable business value. Moreover, in the high-end market, where banks focus more on providing trustworthy fi nancial advice and distributing external products, margins would be smaller if the business model were still driven by commissions rather than fees.

Asian Banker Research
Chapter 2 Macro Level Fundamentals
2-7. Aligning strategies according to specifi c country developmentsFigure 2-7-1 Allocation of household assets in selected Asian markets
Source: Asian Banker Research
Cash and deposits take up a dominant share of total household assets in emerging markets compared with developed markets. For example, China’s savings rate is among the highest in the world at over 40%, with household deposits hitting $3.6 trillion in 2008. Banks need to come up with ways to mobilise these dormant assets.
To understand how banks can align strategies according to different market realities, we can segment countries in several ways. One is to classify them according to the potential for wealth creation and current levels of economic prosperity. Another is to group according to stock market penetration and wealth gap.
Figure 2-7-2 Segmenting by wealth creation and economic prosperity
Source: Asian Banker Research
0%
10%
20%
30%
40%
50%
60%
70%
80%
90%
100%
ID PH CN TL SK TW JP IN SG MA HK UK US
Perc
enta
ge D
istr
ibut
ion
Other/Misc
Mutual Funds
Equities
Fixed IncomeSecurities
Pensions
Life Insurance
Cash/Deposits
Australia
China
Hong Kong
Japan
Singapore
South Korea
Taiwan
India
Malaysia
Thailand
0
5
10
15
20
25
30
35
40
2% 4% 6% 8% 10% 12% 14%
Optimised Market
Progressive Market
Stagnant Market
Stable Market
Total Household InvestableAsset Growth (CAGR 2005-07)
GDP per Capita (PPP) ($ thousand)
Australia
China
Hong Kong
Japan
Singapore
South Korea
Taiwan
India
Malaysia
Thailand
0
5
10
15
20
25
30
35
40
2% 4% 6% 8% 10% 12% 14%
Optimised Market
Progressive Market
Stagnant Market
Stable Market
Total Household InvestableAsset Growth (CAGR 2005-07)
GDP per Capita (PPP) ($ thousand)
Australia
China
Hong Kong
Japan
Singapore
South Korea
Taiwan
India
Malaysia
Thailand
0
5
10
15
20
25
30
35
40
2% 4% 6% 8% 10% 12% 14%
Australia
China
Hong Kong
Japan
Singapore
South Korea
Taiwan
India
Malaysia
Thailand
0
5
10
15
20
25
30
35
40
2% 4% 6% 8% 10% 12% 14%
Optimised Market
Progressive Market
Stagnant Market
Stable Market
Total Household InvestableAsset Growth (CAGR 2005-07)
GDP per Capita (PPP) ($ thousand)
17
Size of bubble indicates total value of investable household wealth

Asian Banker Research 18
Chapter 2 Macro Level Fundamentals
The fi rst way, segmenting the Asian markets by GDP per capita and wealth creation prospects, results in four distinct groups. In the chart above, this is represented as distinct quadrants that defi ne the nature of overall business potential in those markets. Asia’s two strongest markets, Japan and China, are in diagonally opposite quadrants.
Stable Market. The stable market is characterised by high GDP per capita but slow wealth creation. Customers in these countries tend to be conservative investors because of their aversion to risk. Product propositioning should focus on maintaining the value of assets rather than seeking signifi cant returns. However banks should also have some offerings for the more adventurous and make allowances for a potential change in market sentiment and growth in risk appetite. This was happening in Japan in the mid 2000s, when risk aversion diminished as its modestly rising consumer confi dence interacted with growing concern about the state of the national pension system in a graying society.
Optimised Market. Although the optimised markets are highly developed economies with GDP per capita above $20,000, the momentum of wealth creation in these markets is stronger than in the stable markets as customers are more willing to trade high risks for high returns. We call it an optimised market because it has growth potential in almost all customer segments. But banks need to be aware that customers in these markets are probably also the savviest in selecting investment products, so it is crucial for banks operating here to have a broad base of product offerings and customised fi nancial advice. Banks in these markets have to fi ght for their piece of the pie. Most importantly, they must offer differentiation from the competition as much as possible, particularly in terms of marketing, service and customer segmentation.
Progressive Market. The progressive markets include fast-developing economies with generally low levels of fi nancial literacy. Customers lack the habit of investing, hence any understanding of innovative fi nancial products develops gradually. These markets provide signifi cant business opportunities in both the affl uent and the HNWI segments, given the low penetration of wealth management services. Introduction of products should mean double-digit growth for a number of years, but may also result in backlash if insuffi cient education is provided. As such, due caution is advised. Fickle customer behaviour will be diffi cult to understand initially and will be part of early market fl ux. Being an early entrant helps to win customer mindshare in the growth years to come.
Stagnant Market. Although the markets that form this group are characterised by relatively low GDP per capita and weak wealth creation, they still hold signifi cant opportunities. Lacklustre economic performance and the absence of a national social protection scheme make it feasible for banks to offer a simple bancassurance proposition and then expand it to other wealth management products through cross-selling. Thailand is the only major market in this quadrant, as others have high per capita GDP or economic growth driving the wealth management business.
Another way banks can assess market potential and behaviour is represented in Figure 2-7-3 which maps markets according to stock market capitalisation as a percentage of GDP and the household wealth gap between the top and bottom 20th percentiles of the population. We believe that the wider the income gap between rich and poor, the higher the demand for different levels of wealth management offerings, as social stratifi cation creates differentiated needs and values. Conversely, a thin spread between rich and poor results in a more egalitarian society where needs of individuals are relatively similar.

Asian Banker Research 19
Chapter 2 Macro Level Fundamentals
Figure 2-7-3 Segmentation by stock market capitalization and wealth gap
Source: Asian Banker Research
Countries with highly-developed stock markets tend to have better productisation platforms but also customers from all walks of life who are more demanding because they have a good understanding of what is available on the market and have very specifi c needs and goals. This method of analysis creates four market classifi cations: demand-driven, supply-driven, sceptics and automated. Each group of markets has a different set of customer needs and therefore should be serviced in appropriate ways. Presently, no Asian country can be described as an “automated market”.
Demand-driven Market. In markets such as Hong Kong, Singapore and Malaysia, capital markets are already highly developed and play a crucial role in the economy.
Customers from almost all income levels have become familiar with the concept of investment, driving demand for more differentiated product offerings and trustworthy fi nancial planning. Given the greater income gap however, banks need to come up with a wide spectrum of complex business structures to cater to the wealth management needs of different segments.
Many large banks in these markets tend to structure their wealth management business into three units: ‘wealth management’ as a vehicle to cross-sell fi nancial products to the mass market segment; ‘priority banking’ for the mass-affl uent and affl uent segments to enhance the relationship with the customers; and ‘private banking’ for the HNWIs to become ‘global trusted advisors’ in managing their substantial private wealth. These three units are very different in terms of primary service channels, product offerings and privileges. Because customers in these markets are highly demanding and savvy, it is also important for banks to take a neutral role in marketing and selling fi nancial products and in providing fi nancial advice. Their wealth management platform should have an ‘open structure’ that supplies mostly third-party products, so customers will have more options and feel comfortable with the banks’ fi nancial planning.
Australia
China
Hong Kong
Japan
Singapore
South Korea
New Zealand
India
Malaysia
Thailand
0%
50%
100%
150%
200%
0 2 4 6 8 10 12 14
Household Wealth Gap Ratio
Stock Market Capitalisation as a Percentage of GDP
Automated Market
400%
450%
0 2 4 6 8 10 12 14
Sceptics Market
Demand-driven Market
Supply-driven Market
Automated Market

Asian Banker Research 20
Chapter 2 Macro Level Fundamentals
Supply-driven Market. Although China and Thailand have relatively high (and widening) income gaps, customers are still not sophisticated enough to proactively shift deposits to investment products. We call this segment ‘supply-driven’ not only because fi nancial institutions need to educate customers in order to nurture demand for investment products, but also because the markets need to be further liberalised to encourage greater product development in order to advance in any signifi cant way.
Sceptics Market. Customers in this segment are resistant to investment markets and tend to be distrustful of the ultra-rich and wealth generation tactics. Banks in such markets have a diffi cult time creating viable wealth management opportunities, and private banking remains a niche market. Japan is a case in point, with the local banks struggling to fi nd a vehicle for their nascent wealth management offerings despite the gap left by the exits of signifi cant players like Citibank. These markets are slowly changing, as strong yet volatile stock market movements and a changing pension landscape bring with them a greater interest in investment products and in building future fi nancial stability among the population at large. With banks focusing more on retail banking and increasing fee income, the opportunities for other players in the market are increasing and in some cases are actually client-led, which is indicative of the changing mindsets.
2-8 International variations in wealth management classifi cation
While there are many variations between markets, customers can be broadly divided into six segments, whether stable or progressive, demand-driven or supply-driven. Most banks segment their customers this way and the most suitable business structure for a bank would depend on the segment that it is targeting.
Using the amount of investable assets as a measure of wealth, we can classify the customers as ‘mass’, ‘mass affl uent’, ‘affl uent’, ‘high net-worth’, ‘very high net-worth’ or ‘ultra-high net-worth’. The defi nition of the fi rst three segments varies signifi cantly between different economies but less so for the latter three segments, as the main players in this space remain mostly the regional and global private banks.
Mass customers represent the lowest level in customer segmentation. In general, they only have a deposit account.
Mass affl uent customers are very cost-sensitive and quick to change their fi nancial service providers. The mass affl uent are gradually shifting their savings into investment products and in developed Asian markets at least, are seeking professional advice on how to invest. Banks should be aware of the potential of this customer segment and come up with sustainable strategies and solutions to groom and grow this segment.
Affl uent customers are the segment traditionally targeted by commercial banks for wealth management services. They are generally settled in their lives and are typically families with children of school age. Affl uent customers have started to recognise the value of fi nancial advisory services but are still cost-sensitive. Affl uent customers in Asia, especially from the developing markets, tend to be more transactions focused and less interested in investments with a longer time horizon. Effective customer education can strongly boost segment profi tability.

Asian Banker Research 21
Chapter 2 Macro Level Fundamentals
High net-worth individuals (HNWIs) tend to be familiar with fi nancial advice in executing their asset allocation and investment strategy. They are able to freely invest at least $0.11 million to $1.46 million in the money and capital markets depending on the country of residence. Many take time with investing and have the patience to manage their own portfolio. However, like the affl uent, they tend to be hands on and transaction driven customers. Banks will benefi t fi nancially from greater customer education.
Very high net-worth individuals (VHNWIs) are those able to invest at least $0.5 million to $5 million depending on their country of residence. This segment in Asia includes a large number of business owners who may have large chunks of their net worth committed to their enterprises. They are pressed for time when it comes to managing their assets and tend to rely heavily on banks or independent asset management companies to manage their wealth.Ultra-high net-worth individuals (UHNWIs) are the select few who can freely invest more than $10 million in developed Asian economies or more than $1 million in developing economies such as China and India. Almost all the UHNWIs engage family offi ces, private banks or independent asset management companies to manage their wealth. Normally they maintain close personal relationships with investment consultants, asset managers, custodians and tax experts.
An example of a bank that has a recognizable variation of the classifi cation structure described above is ICBC in China. This, is a relative newcomer to wealth management, divides customers into fi ve segments. The private banking segment shares the $1 million threshold common to most banks while the next two segments, high and middle levels, have localized thresholds. The bank aims to be competitive in the high level segment, while maintaining its close engagement with the middle level segment. Its Elite Club proposition, targeted at the upper tier of the middle level segment – between $25,000 and $125,000, is really its entry-level wealth management proposition and will help accelerate the development of its wealth management business by grooming customers in this segment for the next levels.
Figure 2-8-1 Where ICBC is currently playing in the wealth management space
Segment Description Priority
Private banking > 1 million USD New dedicated dept.
High level 1 mil. < , > $125k Competitive player
Middle level $l25k < , > $6250 Competitive player
Potential $6250 < , > $625 or graduates under 28 yrs
Ordinary <$625 or non-graduates or over 28 yrs
Source: Asian Banker Research
2-9 Diversifying into other wealth management customer segments
In the past, the targeted customer segments for wealth management were those classifi ed as HNWIs and above. These customers have traditionally been the domain of independent asset management companies, global banks’ private banking units, private banks and family offi ces. Meanwhile, the other customer segments were managed by the retail banking units of commercial banks or by insurance companies and brokers.

Asian Banker Research 22
Chapter 2 Macro Level Fundamentals
With enhanced information technology, fi nancial institutions that used to target high-end and middle markets found that they could provide cost-effi cient, personalised self-service wealth management services to lower customer segments. However, even as private banks and independent asset managers were eyeing affl uent and even mass affl uent customers, commercial banks fought to keep customers by revamping their consumer banking business to include wealth management or by establishing new business divisions to target higher-value customer segments.
Figure 2-9-1 Prevailing and potential segments for wealth management players
2-10 Financial intermediation trends
Before 2003, Asian banks seemed secure in their dominance of the fi nancial intermediation role, which is in sharp contrast to their Western peers. However, since 2003, the stock markets began to offer stiff competition to banks in terms of attracting investable funds in almost every Asian country. Commercial banks in a few countries have resisted better than in most others. For example, in Malaysia, the intermediation gains made by the stockmarket was largely at the expense of the employee provident fund. In India, private banks suffered less than the state-owned banks.
This trend was especially pronounced in 2006 and 2007, due to the soaring stock markets but could change signifi cantly following the downturn in 2008.
Mass Mass AffluentAffluent
High High Net Net
WorthWorth
Very Very High High Net Net
WorthWorth
AffluentAffluentUltra Ultra High High Net Net
WorthWorth
MassMass
Family Offices
Private Banks
Regional CommercialBanks
Local Commercial Banks
InsuranceCompanies
Brokers
Traditional market proposition
Potential area of business
Independent Asset Management Companies
Source: Asian Banker Research

Asian Banker Research 23
Chapter 2 Macro Level Fundamentals
Figure 2-10-1 Financial intermediation trends in Australia
Figure 2-10-2 Financial intermediation trends in China
0%
10%
20%
30%
40%
50%
60%
2000 2001 2002 2003 2004 2005 2006 2007
Shar
e of
tota
l fun
ds
Authorised banks Stock market Managed funds
Insurance Building societies Credit unions
Source: Asian Banker Research
0%
10%
20%
30%
40%
50%
60%
70%
2003 2004 2005 2006 2007
Shar
e of
tota
l fun
ds (%
)
Mega banks JS commercial banksCity commercial banks Rural banksForeign banks Credit cooperatives/unionsStock market Insurance
Source: Asian Banker Research

Asian Banker Research 24
Chapter 2 Macro Level Fundamentals
Figure 2-11-3 Product margins and sales growth
In recent years, Asian wealth management propositions gradually moved away from basic products towards more sophisticated wealth solutions although the focus has remained very much sales driven rather than advisory-centric. This can be chalked up to the banks’ focus on immediate revenues as well as customer resistance and lack of education.
Figure 2-11-4 Product penetration relative to gross margin
Source: Asian Banker Research
Source: Asian Banker Research
Below Average Sales Growth
Gro
ss M
argi
n (b
ps)
Above Average Sales Growth
Basic Banking Products
Traditional Wealth
Management Products
Alternative Products
Offshore Mutual Funds
Money Market Products
Term Deposits
Demand Deposits
Structured Products
Hedge FundsPrivate Equities
Brokerage Services
Bancassurance
Onshore Mutual Funds100
200
300
0%
1%
2%
3%
4%
5%
0% 10% 20% 30% 40% 50% 60% 70% 80%
Traditional and alternative wealth management products as apercentage of total assets under management
Gro
ss M
argi
n (In
com
e/Sa
les)

Asian Banker Research 25
Chapter 2 Macro Level Fundamentals
Depending on banks’ product mix, the aggregate income derived from a given total sales volume can vary signifi cantly. By mapping out Asian banks’ gross margins against traditional and alternative wealth management products as a percentage of total assets under management, we see a clear correlation between overall profi tability and the penetration of higher-margin products. While having a high overall product penetration has a positive effect on gross margins, the penetration of alternative products have an even greater impact.
The downturn of 2008 will not mean the end of alternative products, but it does mean that banks will have to be much more rigorous in the design and sourcing of such products. Commercial banks should use this opportunity to educate customers on the importance of advisory services that can help them achieve an optimal mix of high yielding and lower risk assets, and in doing so, retake the fi nancial intermediation initiative from the stock markets in order to capitalize on the next upturn.
Figure 2-11-5 Alternative product penetration relative to gross margin
Source: Asian Banker Research
0%
1%
2%
3%
4%
5%
0% 10% 20% 30% 40% 50% 60%
Alternative wealth management products as a percentage of total assets under management
Gro
ss M
argi
n (In
com
e/Sa
les)

This page has been left intentionally blank

Asian Banker Research 26
Chapter 3 Market Level Fundamentals
3 MARKET LEVEL FUNDAMENTALS
Structure of Contents
3-1 Strategic performance indicators
3-2 Mapping the development of the wealth management industry against the
evolution of productisation capabilities
3-3 Developing a sustainable product proposition
3-4 Winning the talent war through well designed remuneration and training schemes

Asian Banker Research 27
Chapter 3 Market Level Fundamentals
3-1 Mapping wealth management developments against the evolution of productisation
Figure 3-1-1 Evolution of Productisation Capabilities
Productisation is such a crucial part of the business that the development of the entire industry can be largely mirrored in the evolution of the productisation process.
Entering 2008, most commercial banks from emerging markets offering wealth management propositions were in early phases of the productisation process. Further along were the Singapore and Hong Kong banks that were offering higher risk - higher yield products and pushing to increase product range and sophistication even further as world-class rivals were ramping up operations in their already competitive backyards. 2008 turned out to be a watershed year in productisation as the global wealth management industry goes into a severe phase of reconfi guration. One result is that the most advanced Asian banks have reduced the gap between themselves and some of the leading Western players in this region, due to setbacks suffered by the latter rather than any advances made by the former.
Liberalisation Liberalisation of Financial of Financial
Service Service IndustryIndustry
Introduction Introduction of High Risk of High Risk
ProductsProducts
Reconfiguration Reconfiguration of the Marketof the Market
Progress of Progress of the Asset the Asset
Management Management MarketMarket
Maturity Maturity of of
MarketMarket
Formulation Formulation of Fundsof Funds
Market
Time
Japan
ChinaIndia Thailand
Indonesia
Malaysia
Taiwan
US
Illustrative road map
Liberalisation Liberalisation Introduction Introduction of High Risk of High Risk
ProductsProducts
Singapore
UK
South KoreaHong Kong
Australia
Source: Asian Banker Research

Asian Banker Research 28
Chapter 3 Market Level Fundamentals
Figure 3-1-2 Open architecture in commercial banks’ wealth management business
Offering only internally manufactured products or only externally sourced products is not advisable for commercial banks. The fi rst lacks the complete range of best-of-breed products necessary to properly service customers while the second means a constant outfl ow of bank deposits. Most commercial banks with wealth management propositions utilise, or plan to move towards utilising, a hybrid model where products are sourced internally and externally, and assembled into fi nal solutions for target customers.
This requires the banks’ wealth management division to work with fi nancial product manufacturers in implementing standards-based technologies that enable a truly open architecture to seamlessly manage the supply chain of fi nancial products and services. Banks become aggregators of wealth management services from across the industry, including insurance companies, fund managers, stockbrokers and estate managers. But the hybrid model per se does not lead to authentic open architecture, as the dual challenges of quality control over externally sourced products and achieving seamless supply chain management driven by information technology can be considerable. The continued reliance of many Asian banks on personal relationships with external suppliers creates unnecessary administrative burden and weaknesses in quality control within banks. The considerable human intervention in this type of simple open architecture causes delays and errors in processing transactions and portfolio monitoring.
• Keep all funds on balance-sheet
• Generating Revenue from asset management
• Hassle-free compared with manufacturing products
• Generating Revenue from fees and commissions
Manufacturer Model Distributor Model
• Higher operational costs• Unattractive to
sophisticated customers
• Threat of deposit attrition• Not cost-efficient to serve
unsophisticated customers
Manufacturers are niche players in the wealth management market, focusing on productisationwithout extensive distribution network. To adopt the manufacturer model requires very strong and specialised productisation capability, which is only found in fund managers and insurance companies.
Distributors are niche players in the wealth management market, focusing on financial advisory without any in-house products. To adopt the distributor model requires very strong financial advisory capability and exclusive relationship with the clients, which is only found in private banks and family offices.
Mix of Internal & External Products
Hybrid Model
Cons
Pros
Business Model
Players
Open
Architecture
Internal Products Only External Products Only
• Keep all funds on balance-sheet
• Generating Revenue from asset management
-
-
Mix of Internal & External Products
Source: Asian Banker Research

Asian Banker Research 29
Chapter 3 Market Level Fundamentals
Figure 3-1-3 Evolution towards standards-driven partnerships
A handful of the more advanced banks have been unifying standards with partnering institutions at the back-offi ce level to provide fi nancial services in a proactive and holistic manner. The increasing integration of the banking supply chain notwithstanding, current developments illustrate the importance of maintaining discipline in internal checks to ensure real robustness in externally sourced products.
With fully integrated process-sharing open architecture, relationship managers can aggregate all information on assets under management or each customer’s portfolio such as pricing, performance and transaction volume, and also send feedback on customer information, requirements and potential market size to help suppliers respond accordingly. As more banks are shifting away from human-based business partnerships to standards-driven ones, we believe the industry is evolving towards establishing industry-wide standards, probably driven by regulators more signifi cantly than has been the case in the past, rather than having only bilateral standards.
Human-based
Business Partnership
Unifying Unifying Communication Communication & Distribution & Distribution
StandardsStandards
Unifying Unifying Back Office Back Office
Process Process StandardsStandards
Unifying Unifying Product & Product &
Service Service StandardsStandards
Cross Cross Industry Industry
Standards on Standards on Wealth Wealth
Management Management OfferingOffering
Bilateral Standards Between Business PartnersBilateral Standards Between Business Partners
Standards-driven Business Partnership
Level of Openness
Open Architecture
Source: Asian Banker Research

Asian Banker Research 30
Chapter 3 Market Level Fundamentals
Figure 3-1-4 The product architecture curve
As a footnote to this section, in the context of our earlier comments about the leakages in deposits in the distributor model and the expected greater role of regulators driving industry standards, the marriage between Merrill Lynch and Bank of America could be a powerful one assuming the complicated task of integrating the two fi nancial behemoths is managed successfully.
MASS AFFLUENT
Manufacturer Hybrid Distributor
AFFLUENT
MASS RETAIL
HNWI
Higher CostTransparencyUnattractive to sophisticated customers
Typical Product Architecture Curve
Deposit AttritionOwnership of customersUnattractive to unsophisticated customers
THREATSOver reliance on manual cooperationOwnership of customers
Standard Chartered
HSBC Premier (HK)Hang Seng Bank, HK
Merrill Lynch
Source: Asian Banker Research

Asian Banker Research 31
Chapter 3 Market Level Fundamentals
3-2 Developing a sustainable product proposition
Figure 3-2-1 Product sophistication relative to ROE
In 2007, most banks were still focusing on simple and easy to communicate products while working out how to develop and manage more sophisticated products. Too many of the more advanced banks were simply trying to push out greater volumes of increasingly sophisticated products.
The focus has since shifted decisively towards the more rigorous testing of products as well as developing a comprehensive suite of products to support all-weather investment strategies under diverse market conditions. There is also a growing understanding about the importance of having product propositions that do not necessarily generate huge fee income but performs well over the long time horizon.
3-3 Winning the talent war through well designed remuneration and training schemes
At the Excellence Convention in May 2007, Christian Kapfer, joint head of Asian Banker Research, said,
‘The biggest concern (in wealth management) is fi nding a suffi ciently skilled pool to satisfy a mature fi nancial market such as Singapore. Private banking is spinning out of control with sky-high salaries and poaching has become the norm. In the war on human resources, UBS has sent chills down the spines of commercial banks.’
Source: Asian Banker Research
ROETraditional Alternative
Degree of Product Sophistication
Treasury&CashManagement
Onshore MFDepositBancassurances
Brokerage ServicesBonds
Guaranteed FundsIndex FundsTrusts
Open Ended F
Derivatives&Struct. Products
Hedge Funds
Inheritance Planning
Family Offices
Private Equity
IPO Advice
Institutional
Individual
18-35% 40% 50% 60%
Estate PlangAdvisory Services
Offshore MF
Retirement Pension
Treasury &CashManagement
Onshore MFDepositBancassurances
Brokerage ServicesBonds
Guaranteed FundsIndex FundsTrusts
Open Ended F
Derivatives &Struct. Products
Hedge Funds
Inheritance Planning
Family Offices
Private Equity
IPO Advice
Estate PlangAdvisory Services
Retirement Pension

Asian Banker Research 32
Chapter 3 Market Level Fundamentals
One silver lining in the current fi nancial crisis is that, conceivably for a period of the next two years at least, infl ated salaries are brought back to ground and staff turnover comes down to saner levels. Banks have struggled with retaining key staff even as salaries reportedly doubled between 2002-2005. High cost-to-income ratios and thinning margins were hitting bottom-lines, especially for banks without a good Asia strategy.
Now that the market has turned, the banks that have gone out on a limb with the most bloated staff incentives are likely to be the fi rst to suffer the consequences of indulging in overly ambitious growth, and some of the most expensive new hires will also be amongst the fi rst to go. In a matter of months, we will have seen the employees’ market transform into an employers one, especially in the choppy middle market. Proven and experienced relationship managers in high-end segments will remain in demand as they are the most likely to keep their customers.
Figure 3-3-1 Experience levels and sources of fi nancial advisors in Asia
In the chart above, counter staff and direct sales staff marketing investment products are counted as fi nancial advisors in the mass market. In the mass affl uent, affl uent and HNW markets, the relationship managers are considered the fi nancial advisors.
Fundamentally sound banks that are in a position to do so are upgrading to better quality and more experienced staff without having to rely as heavily on recruiting from outside the industry or on transferring in staff from other business units. Besides caliber of talent and length of experience, a wealth manager’s tenure with the bank is also critical to the sustainability of the business.
Banks traditionally aim to be cultural champions with a highly experienced team and strong staff loyalty. This situation has become the exception rather than the norm over the last fi ve years but the expected length of the downturn is a good opportunity for banks to rebuild core teams of cultural champions. Studies overwhelmingly show that fi rms that treat staff well during recessions experience increased employee loyalty during the downturn as well as moving on to the upturn (albeit in diminishing quantities).
The industry has moved to a bonus-based renumeration - it is estimated that the number of banks paying bonus at over 40% of fi xed salary has doubled between 2003 and 2005, and crossed the 30% mark for wealth management players globally in 2007.
Source: Asian Banker Research
0%
20%
40%
60%
80%
100%
Mass Market Mass Affluent &Affluent Market
HNWI Market
Ave
rage
Dis
trib
utio
n of
Sou
rces
0
2
4
6
8
10
Ave
rage
Indu
stry
Exp
erie
nce
(yea
rs)
Bank Competitors
Insurance & AssetManagementCompanies
Non-financialInstitutions
Existing Staff
Fresh Graduates
Average industryexperience

Asian Banker Research 33
Chapter 3 Market Level Fundamentals
3-4 The “Banks We Like”
Figure 4-10-1 Two of the banks we like in the wealth management business
Citigold Hang Seng, Hong KongStrong advisory service and free-based income WM model
Strong capabilities for mass, affl uent and private banking segments
Ability to service clients across countries and regions
Very good synergies between SME banking and private banking
Citigold Hong Kong achieved above 15% CAGR in the last 5 years
Strong fee income generation
Accomplished product and brand name internationally
Respected brand in home market
Strong talent management team and coherent team-based client approach
Strong internal product generation capabilities
The standard bearers amongst stage fi ve banks remain Citigold and the Royal Bank of Scotland, despite the turbulence their overall franchises are facing in 2008. To achieve long-term sustainable business value, banks need to evolve into trusted fi nancial advisors – but the majority of the players in Asia are barely halfway there.
The downturn is already reining in some of the global wealth management players back, giving healthy Asian banks a rare opportunity to play catch up. Leading banks that possess of a truly robust advisory capability will have an even greater opportunity to sprint further ahead.
Source: Asian Banker Research

Asian Banker Research 34
Chapter 4 Street Level Fundamentals
CHAPTER 4 STREET LEVEL FUNDAMENTALSStructure of Contents4-1 Balanced scorecard indicators to track your business performance4-2 Key elements defi ning success in the wealth management business4-3 Business architecture of a benchmark bank’s wealth management business4-4 Identifying strengths and weaknesses of customer relationship cycle management4-5 Benchmarking the frequency of customer contact across channel types4-6 Models that support low advisor attrition and high customer retention4-7 Operational roadmap towards successful customer segmentation4-8 Rationalising customer segmentation to support relationship centric strategies4-9 Our scorecard for assessing players in this business4-10 The Questions We Ask

Asian Banker Research 35
Chapter 4 Street Level Fundamentals
4-1 Balanced scorecard indicators to track your business performance
Figure 4-1-1 Indicators to track and feed into the balanced scorecard
Financials Customers
1. Size of AUM2. Profi tability of assets3. Fees4. Wallet share of the customer
1. No. of relationship managers2. Profi le and no. of customers3. Customer to RM ratio 4. Relationship maintenance indicators5. Cross sell ratio
Processes Learnings
1. Sales cycle turnaround time2. Customer analytics and segmentation capability
1. Product innovation2. Sustainability of products
4-2 Key elements defi ning success in the wealth management business
Figure 4-2-1 Elements defi ning the wealth management business
Defi nitions – Elements that defi ne this area1. Needs based selling
2. Client acquisition
3. Client Retention
4. Sustainability of relationships
5. Product propositions for different customer segments and economic cycles
6. Talent Management
7. Investment Management Tools
8. Distinctive channels for communication or communication management
9. Deployment communication/information technologies
Figure 4-2-2 Operationalising the critical success factors
Defi nitions – Critical Success Factors1. A customer-centric business architecture
2. A wealth management brand that is consistent with the rest of the organisation’s brand
3. RM’s ability to follow disciplined protocols in customer engagement by giving clients equal control and choice. Undertaking of regular conversations with a clients wealth creation and wealth management strategies (some banks do so on a quarterly basis for all clients)
4. Shifting current priorities in an RM’s daily workload from preparing for product recommendation to fi nancial needs analysis and extensive planning.
5. Focusing on share of wallet as key performance indicator (>50% of client’s investable assets)
6. Strong linkage to SME and Mass Retail Banking with the upgrading and cross selling strategies
7. A branch experience that is consistent with the wealth management business
8. Strong multi-channel sales capability, especially for RM, branch and online
9. Quality staff and staff incentives scheme centered around service and sales KPIs
10. Creating recurrent earnings over multiple cycles
11. Scalable RM/Advisory Model
Source: Asian Banker Research
Source: Asian Banker Research
Source: Asian Banker Research
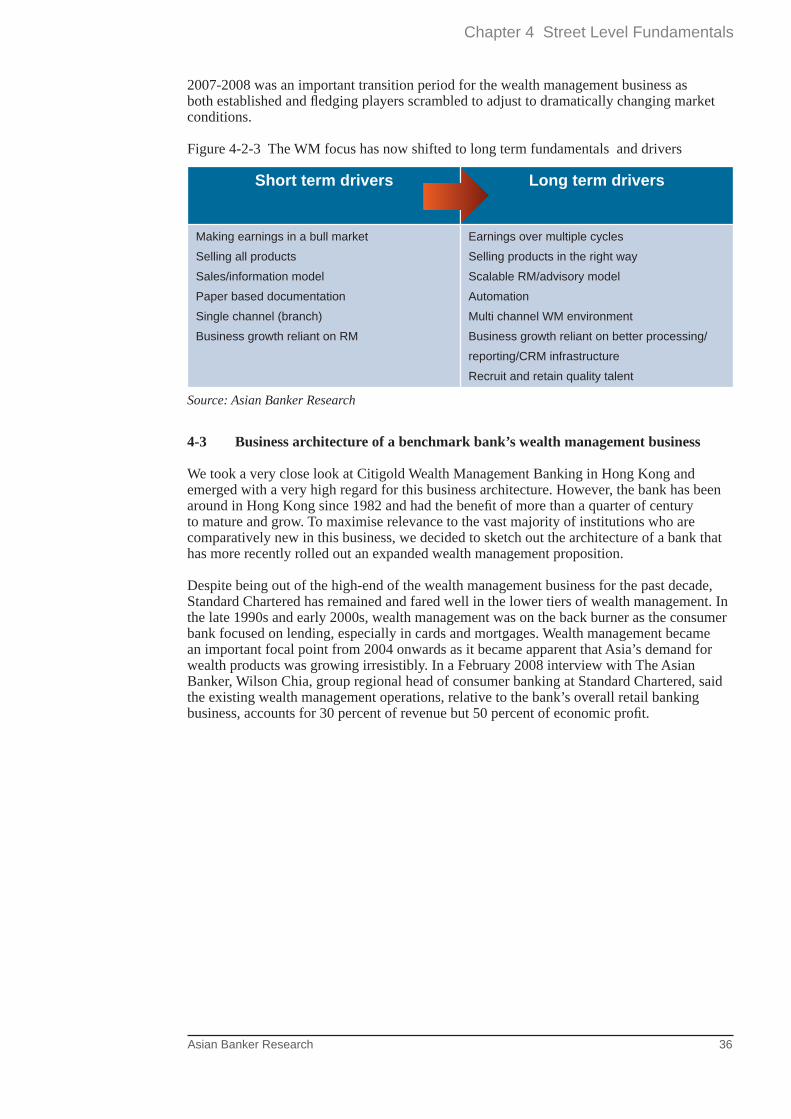
Asian Banker Research 36
Chapter 4 Street Level Fundamentals
2007-2008 was an important transition period for the wealth management business as both established and fl edging players scrambled to adjust to dramatically changing market conditions.
Figure 4-2-3 The WM focus has now shifted to long term fundamentals and drivers
Short term drivers Long term drivers
Making earnings in a bull market
Selling all products
Sales/information model
Paper based documentation
Single channel (branch)
Business growth reliant on RM
Earnings over multiple cycles
Selling products in the right way
Scalable RM/advisory model
Automation
Multi channel WM environment
Business growth reliant on better processing/
reporting/CRM infrastructure
Recruit and retain quality talent
4-3 Business architecture of a benchmark bank’s wealth management business
We took a very close look at Citigold Wealth Management Banking in Hong Kong and emerged with a very high regard for this business architecture. However, the bank has been around in Hong Kong since 1982 and had the benefi t of more than a quarter of century to mature and grow. To maximise relevance to the vast majority of institutions who are comparatively new in this business, we decided to sketch out the architecture of a bank that has more recently rolled out an expanded wealth management proposition.
Despite being out of the high-end of the wealth management business for the past decade, Standard Chartered has remained and fared well in the lower tiers of wealth management. In the late 1990s and early 2000s, wealth management was on the back burner as the consumer bank focused on lending, especially in cards and mortgages. Wealth management became an important focal point from 2004 onwards as it became apparent that Asia’s demand for wealth products was growing irresistibly. In a February 2008 interview with The Asian Banker, Wilson Chia, group regional head of consumer banking at Standard Chartered, said the existing wealth management operations, relative to the bank’s overall retail banking business, accounts for 30 percent of revenue but 50 percent of economic profi t.
Source: Asian Banker Research

Asian Banker Research 37
Chapter 4 Street Level Fundamentals
Figure 4-3-1 Standard Chartered’s wealth management business architecture
The bank reentered the market for servicing HNWIs with investable assets of at least $1 million after having sold its PB in 1996. The private banking arm complements Standard Chartered’s existing priority and international banking operations servicing the lower tiers of the wealth management spectrum (between $100,000 - $1 million). Bryan Henning, head, group wealth management at Standard Chartered, explains that while the private bank might be the glamorous ‘Superbowl’ segment of wealth management, the sweet spot for the bank is actually the mass affl uent market. Customers maturing into the latter stages of the wealth accumulation curve in the coming decades will be migrated to the Standard Chartered Private Bank.
Standard Chartered does not see setting up the private banking arm later than such banks as HSBC and Citibank as a critical handicap. It gives two main reasons – the fragmented market in Asia, which sees the top 10 players accounting for less than 7% of total market share and the predominance of wealth onshore in Asia (more than 80% for the bank’s key markets), which plays to its network presence in the region. Many in the growing cohort of Asian HNWIs are in the fi rst-generation wealth accumulation stage with reduced liquidity due to the bulk of their wealth being committed to running businesses. This is a good opportunity for a well branded commercial bank with a large Asian network and capability to cross-sell wealth offerings with other business units such as SME banking.
Source: Asian Banker Research
Source: Asian Banker Research
Client’sInvestable Assets
$1 million
‘Customer One’
Software Interface
Externally sourced products
- investment- treasury- insurance - some deposits
Client Volume
$100,000
Relationship Manager
50:1
Relationship Manager
250:1
Walk-in Personal Financial
Consultant
Internally sourced products
- some deposits - current savings - debit cards, other
-- personal loans - credit cards
0
Product Specialist
Product Specialist
Product Specialist
‘Customer One’
Software Interface
Relationship Manager
50:1
Relationship Manager
250:1
Walk-in Personal Financial
Consultant
-
-
Advisory Specialists
Product Specialist
Investment Strategists
‘
-
Product Specialist
Product Specialist
Product Specialist
payment methods - mortgages
Advisory Specialists
Product Specialist
Investment Strategists

Asian Banker Research 38
Chapter 4 Street Level Fundamentals
4-4 Identifying strengths and weaknesses of customer relationship cycle management
Figure 4-4-1 Each stage has its own strengths and weaknesses
4-5 Benchmarking the frequency of customer contact across channel types
Figure 4-5-1 Number of contacts required to close a deal for a HNWI
Mass market and mass affl uent customers are encouraged to go on self-serve or call center channels. Lower and middle segment customers typically do not interact with their relationship managers more than two to four times a year. The situation is markedly different for the higher segments - relationship managers are encouraged to undertake regular conversations while growing the client base. Best practice banks require less than fi ve contacts to close a deal with a HNWI client.
Source: Asian Banker Research
Source: Asian Banker Research
Client/Director/
RM
Client profilingClient
profiling
Proposal& Solutions
Proposal& Solutions
Agreement&Implementation
Agreement&Implementation
ReviewReview
Strength and Weaknesses�Solutions are not team-based
�Solutions are not tailored to current/future needs
�RM is not involved in product development (Product DevelpUnit only)
�Focus is too much time on product recommendation
�RM draws on a limited range of products solutions
�RM has limited product solutions knowledge
Strength and Weaknesses�Collaborative manner with the client�Clear written contract guidelines�Customer Service Statement
Strength and Weaknesses� Regular reporting� Sustaining these conversations while
undergoing rapid growth� Consolidated global statement
Strength and Weaknesses� Gaining a workable overview over clients total
� Focus on Share of Wallet� Client segmentation
investable assets
% o
f tot
al c
alls
1-2 3-5 6-9 10-15 16+Contacts
Bank in Singapore Bank in Singapore
Contacts
Bank in Singapore Bank in Singapore
50%
40%
30%
20%
10%
0%

Asian Banker Research 39
Chapter 4 Street Level Fundamentals
Figure 4-5-2 Frequency of contact across channels
4-6 Models that support low advisor attrition and high customer retention
One unusual twist to customer and staff retention that we came across is Merrill Lynch’s approach to diversity. Roman Matla, head of Diversity & Inclusion, Pacifi c Rim, Merrill Lynch Global Wealth Management, explained that this is a strategy that is rolled out in Asia after having met with signifi cant success in the US and Europe.
In more developed markets where philanthropy and social awareness has become a signifi cant interest for the highest segments, diversity can deliver tangible business value. Merrill Lynch’s relationship managers span a diverse range of races, cultures, sexual orientations and disabilities. The rationale is that customers, who themselves come from diverse backgrounds, are more loyal if they know some relationship managers come from the same backgrounds. For example, gay clients tend to consider it a plus if they know there are gay relationship managers. Clients who have disabilities, or who have family members with disabilities, or are more socially aware, do value seeing relationship managers who have disabilities. Staff who come from these ‘minority backgrounds’ tend to have a strong sense of identity with the institution and are comparable to their peers in terms of tenure and performance. Matla, whose responsibility includes delivering measurable business value through diversity, said that the strategy remains unusual for most of Asia, unlike more mature economies in Europe or North America.
Amongst commercial banks, Citibank HK turned in strong results for staff and customer retention for 2007 thanks to its industry leading Citigold programme. On the staffi ng side, they succeed by building a strong organizational identity. For example, the most profi table 25% of their customers are served by relationship managers with a minimum of 10 years experience. An estimated 80% of these relationship managers are internal promotions from the lower segments which makes for a powerful institutional DNA. Lower segment staff, such as personal bankers serving mass market clients, typically need a minimum of three years experience before they can even be considered for the position of Citigold relationship manager, although the talent crunch of the mid 2000s lowered that to two years experience in some instances.The recruitment process favours high energy individuals who are naturally inclined towards connecting emotionally with customers. New relationship managers require two months of fulltime training before they are allowed to face clients, and through the course of their career, attend after-hours conference calls several times a week to connect with colleagues from the segment and product groups to further refi ne the overall business.
Banks Bank A
SingaporeBank X
Country XBank A
SingaporeBank X
Country XBank A
SingaporeBank X
Country X
% Telephone % Telephone % F-F meetings %
F-F meetings % Fax % Fax % Mail % E-mail %
Use Method (NET) 100 83 78 76 63
Daily 2 0 0 1 9
More than once a week 23 1 8 14 4
Once a week 14 0 2 0 10
3-4 times a month 16 2 8 8 6
1-2 times a month 28 14 22 19 14
Less than once a month 18 66 37 34 21
Never 0 17 22 24 37
0 1 9
Source: Asian Banker Research

Asian Banker Research 40
Chapter 4 Street Level Fundamentals
The business is structured around these three main groups –relationship management, the products, and the segment. The segment group ultimately owns the customers. This group is responsible for market sizing, consumer insight research, developing market leading propositions, channel management and customer life cycle management, The segment group also works with relationship management to measure, incentivise and retain relationship managers. For example, one way the segment group has affected relationship managers’ standards of performance is by developing the relationship manager scorecard over the last six years. In 2002, relationship managers only had 3 basic items on their scorecards – deposit acquisitions by volume, mutual fund revenue acquisition by volume, and a self-admitted token measurement for customer. By 2008, the scorecard has become much more detailed, and structured around three key categories – total customer revenue across the bank, franchise measurements and service elements.
Figure 4-6-1 The correlation between revenue and length of relationship
The bank implemented the measuring of total customer revenue across the bank as opposed to only the products that the relationship manager is responsible for after noticing that relationship managers were overwhelmingly focused on the small minority of their clients who were giving them the mutual fund sales. It links incentives for relationship managers with the total value of the customer to the bank. It also helps the transition from a bank where the loyalties are largely between a relationship manager and a select group of favoured clients, into a bank which owns more of the loyalties of both relationship managers and clients.
Source: Asian Banker Research
Length of the RelationshipMonths Years
Rev
enue
$ M
illio
ns
Trustees/Family “Advisor”
Accountants& Tax Advisors
IFA’s
Low
High
PrivateBanks
Retail

Asian Banker Research 41
Chapter 4 Street Level Fundamentals
Figure 4-6-2 Building long term primary relationships with RM and clients
Franchise measurements include customer retention indicators such as how many customers were kept, retained or lost by a given relationship manager. It also measures stickiness with indicators such as how many customers are purchasing more products and how many have started using other services like online brokerage.
Figure 4-6-3 Cross sell ratios in wealth management across the region
The service elements portion of the scorecard is one of the most sophisticated in the world. A few years ago, the bank used to only have one customer satisfaction score at the business level. The problem then was that relationship managers could not accurately gauge how they affect that score. Therefore, the bank brought customer satisfaction scoring down to the branch level so that they know what the customer satisfaction scores for each branch is. Starting in 2007, the bank also brought it down to individual relationship manager level. The marketing survey team of the bank calls groups of 5-10 customers for each relationship manager several times a year, picking random clients at random times without the prior knowledge of relationship managers. The score forms part of the relationship manager’s customer satisfaction rating for their scorecard.
Source: Asian Banker Research
Source: Asian Banker Research
% Client Retention (p.a.)
% R
M A
ttriti
on (
p.a.
) Generalist RM Model
Internal Aggregator RM Model
Validator RM Model
Team-based RM ModelBank HK
Bank HK
Bank Korea
Bank Australia
Strong Client – RM relationship Strong Client –Institutionrelationship
Strong loyalty of client and RM to institution
Weak client loyalty
Banks aim to play in this space in the long term
RM Model
Weak client loyalty
0
2
4
6
8
10
12
14
16
1 2 3 4 5 6 7 8 9 10 11 12
Cross Sell R
atio No. of years in WM business
Bank Taiwan
Bank Aus
Bank HK
Bank HK
Bank HK
Bank Sing
HNWI
Affluent
Mass Retail

Asian Banker Research 42
Chapter 4 Street Level Fundamentals
Of course, the bank makes full use of its global network, offering standard benefi ts such as use of business lounges, fax machines, and toll free numbers for customers traveling overseas. In the last annual bank wide survey, Citibank Hong Kong reported an average of a 15% increase in the customer satisfaction indices. For 2007, the bank achieved an average customer penetration rate of 47% and footing penetration of 39% for its wealth management product lines, with the higher segments turning in the best penetration rates.
4-7 Operational roadmap towards successful customer segmentation
It takes at least fi ve years to properly leverage on a meaningful and robust customer segmentation. Banks that succeed in the wealth management business are well aware of that, and the best banks make customer retention a high priority when measuring the performance of their relationship managers.
Figure 4-7-1 Operational roadmap for successful segmentation
4-8 Rationalising customer segmentation to support relationship centric strategies
Figure 4-8-1 Five criteria for customer segmentation
Source: Asian Banker Research
Source: Asian Banker Research
Strategic Planning
Customer Data Collection
Customer Segmentation
Validation
Offering Customisation
Gap Analysis Data Standardisation Calibration
System Integration
Modeling & Sampling
Finer Calibration
Cluster Analysis
Testing
Data Warehousing
Data Capturing Campaign
Year 2 to 3
Year 3 to 4
Year 5 Onward
Year 1 to 2
Strategic Planning
Offering Customisation
4-8 Rationalising
Homogenetity within each segment
Homogenetity between segmentsSegments are
actrionable
Segments are profitable
Segments are identifiable

Asian Banker Research 43
Chapter 4 Street Level Fundamentals
4-9 Our scorecard for assessing players in this business
Figure 4-9-1 Measurable drivers in the wealth management business
4-10 The Questions we ask
Figure 4-10-1 Some of the questions we ask
Questions we askHow customer centric is the business architecture?
Does the bank have a wealth management brand consistent with its overall brand?
Is the bank able to provide a branch experience that is consistent with the wealth management business?
Is there a strong liabilities base that can be converted into a wealth management clientele?
Is there a strong multi-channel sales capability?
Is there a truly open architecture to ensure best-in-breed products?
How do you built franchise value?
How good is the relationship management team and how many years of experience do they have in average?
Source: Asian Banker Research
Source: Asian Banker Research
109876543210
ROE
Margins
AUM (%)
Client/RM
Channels used by customers
Open architecture for products
Wallet share as KPI for clients
Healthy cross sell ratio by segments
Average years of experience by RM
Average tenure of customers
Strength of brand