Embed Size (px)
Citation preview
EAST-WEST Journal of ECONOMICS AND BUSINESS
37
Journal of Economics and Business Vol. XVI – 2013, No 1 (37-58)
_______________________________________________________
PERFORMANCE BENCHMARKING OF NON-BANKING FINANCIAL INSTITUTIONS
BY MEANS OF SELF-ORGANISING MAP ALGORITHM
__________________________________________________________________
Adrian Costea Department of Statistics and Econometrics, Bucharest University of Economics, Romania
ABSTRACT: We construct a benchmarking model in the form of a two-dimensional self-organising map (SOM) to compare the performance of non-banking financial institutions (NFIs) in Romania. The NFIs are characterized by a number of performance dimensions such as capital adequacy, assets’ quality and profitability. First, we apply Kohonen’ SOM algorithm (an unsupervised neural network algorithm) to group the NFIs in clusters with similar characteristics. Then, we use the U-matrix method to build maps that facilitate the visualization of SOM results and select the best map in terms of quantisation error and ease of readability. The best map is used to analyze the companies over time by studying the cluster where each company was positioned for each period. We conclude that there are benefits in using SOM for interpreting large and complex financial data by identifying and visualizing clusters.
KEYWORDS: benchmarking, non-banking financial institutions, self-organising map, financial performance
JEL Classification: C38, C81, G23
EAST-WEST Journal of ECONOMICS AND BUSINESS
38
Introduction
Non-banking financial institutions (NFIs) are financial institutions, other than banks, that engage in lending activities on a professional basis. The most important lending activities include: granting of credits, financial leasing and issuance of guarantees. One of the challenges the supervision authority faces when engaging in the prudential supervision of the NFIs’ sector is the efficient allocation of its resources (time and personnel). Consequently, there is a need for models for evaluating comparatively the performance of NFIs so that the supervisory authority focuses its attention on institutions that present a lower level of financial stability. We call these models NFIs’ performance benchmarking models.
In a previous paper (Costea, 2011) we formalized the process of assessing comparatively the performance of NFIs by considering it as a knowledge discovery problem and by following the formal steps of a well-known discovery process called Knowledge Discovery in Databases (KDD) process. We argued that the current system used to evaluate the performance of credit institutions (e.g.: the CAAMPL system) is suboptimal when applied to assessing NFIs’ performance and that the KDD and Data Mining (DM) processes could offer specific methods -Computational-Intelligence (CI) methods - that may be used to develop better systems. These methods come from different fields such as machine learning,neural networks, evolutionary computation and fuzzy logic and offer an alternative to the traditional statistical methods.
Fayyad et al. (1996) state that DM is a particular step in the KDD process. Fayad etal. (1996) define broadly the KDD process as a set of various activities for making sense of data. The KDD process includes a number of steps such as:
developing an understanding of the application domain and identifying the goal of the KDD process, creating the target dataset (data preparation, data selection), data cleaning and pre-processing, data reduction and projection, matching the goal of the KDD process with the data-mining task (summarisation, classification, regression, clustering), choosing the data-mining algorithm to perform the tasks, the effective data mining, interpreting the patterns and evaluating the results, and consolidating/reporting the discovered knowledge.
EAST-WEST Journal of ECONOMICS AND BUSINESS
39
The KDD process and its engine, DM, represent the umbrella under which the CI methods operate. DM is at the core of the KDD process, because it is the outcome of DM that after evaluation and refinement reveals the nuggets of knowledge. In order to fulfil its role DM could perform a number of tasks such as clustering, classification, regression, dependency modelling, summarisation, and change and deviation detection. The link between these tasks and the real-world applications is not straightforward, because the latter ones rarely have a simple single solution. Many different DM tasks may match a particular application, depending on how one approaches the problem. For example, we could match a real-world application such as NFIs’ performance benchmarking with both DM clustering and classification tasks. We use clustering methods in order to find patterns (models) that describe the financial situation of NFIs and classification methods for performance class predictions. The DM tasks are performed by the means of DM techniques, including the CI methods. There are numerous CI methods available in the scientific literature with which we could perform the different DM tasks. However, throughout our research we present a restricted number of CI methods to perform the DM tasks, as it would be unfeasible to test all possible solutions (methods). This is in line with Hevner et al.’s (2004) sixth guideline for design science research.
In this paper we show how CI methods, e.g. SOM algorithm, can be used to evaluate comparatively the performance of NFIs in Romania. We expect that the benchmarking model obtained would reveal companies with poor performance that would be subject to serious scrutiny in the future prudential supervision activities. The rest of the paper is structured as follows. In Section two we present the taxonomy of DM techniques and explain in detail a particular CI method used to perform DM clustering task, namely the SOM algorithm. In Section three, we engage in reviewing the literature on applying CI methods, particularly SOMs, to assessing comparatively the performance of different entities. In Section four, we present an experiment that explores the capability of SOM clustering for addressing the performance benchmarking of NFIs in Romania. Finally, in Section five, we draw our conclusions.
Data Mining Techniques
The algorithms used to perform data-mining (DM) tasks are numerous and they come from different research fields (statistics, machine learning, artificial intelligence, fuzzy logic, etc.). Romeu (2001) groups DM algorithms in three categories: mathematically-based, statistically-based and “mixed” algorithms.
EAST-WEST Journal of ECONOMICS AND BUSINESS
40
Mathematically-based (deterministic) algorithms include mathematical programming (linear, non-linear, integer), network methods (link and affinity analysis), and memory-based reasoning approaches (nearest-neighbour classifiers).
Statistically-based (stochastic) algorithms include traditional statistics regression, discrimination techniques (linear discriminants, quadratic discriminants, logistic discriminants or logistic regression), statistical time series analysis, factor analysis, etc.
The difference between mathematical and statistical algorithms lies in their approaches: mathematical models are deterministic (random phenomena are not involved and these models produce the same output for a given starting condition), while statistical ones are stochastic (based on random trials).
“Mixed” algorithms borrow heavily from both, the algorithmic and the stochastic components (Romeu, 2001). Romeu includes here: clustering methods, induction techniques such as decision trees, neural networks, fuzzy logic and genetic algorithms. We introduced these techniques as CI methods. In our previous research (Costea, 2005) we have tested different such methods on a diversity of business problems (financial performance benchmarking of pulp-and-paper and telecom companies, economic performance benchmarking of south and east European countries, etc.).
For the DM clustering task we tested Self-Organising Maps, C-Means, Fuzzy C-Means (FCM) and our previously developed algorithm: Weighting FCM. C-Means is a partitive statistical clustering technique whose objective is to minimise the sum of the variances within clusters. The strengths of the C-Means algorithm come from its relative efficiency and ability to yield local optimum results. However, the C-Means algorithm has certain disadvantages: the need to specify the number of the clusters in advance, it is sensitive to initialisation of the centres, etc (Han and Kamber, 2006). Fuzzy C-Means – FCM – (Bezdek, 1981) is a variation of C-Means based on the theoretical concepts from fuzzy logic. In fuzzy clustering every observation is assigned a vector representing its membership degree in every cluster, which indicates that observations may contain, with different strengths, the characteristics of more than one cluster. The FCM algorithm gives the membership degree of every observation for every cluster. The usual criterion for assigning the data to their clusters is to choose the cluster where the observation has the highest membership value. While that may work for a great number of elements, some other data vectors may be misallocated. This is the case when the two highest membership degrees are very close to each other, for example, one observation has a membership degree of 0.45 for the first cluster and 0.46 for the third. It is
EAST-WEST Journal of ECONOMICS AND BUSINESS
41
difficult to say in which cluster should we include it and it is possible that, after analysing the clusters’ centers, we realise it does not correspond to the average characteristics of the cluster chosen. We call this data vector an “uncertain” observation. Therefore, it would be useful to introduce into the algorithm some kind of information about the characteristics of every cluster so that the “uncertain” observations can be better allocated depending on which of these features they fulfil more. In Alcaraz-Garcia and Costea (2004) the authors developed an algorithm called Weighting FCM that allocates better than normal FCM these “uncertain” observations.
For the DM classification task we explored classification methods such as multinomial logistic regression, Quinlan’s algorithm for decision-tree induction, artificial neural networks (ANNs) for supervised learning, and genetic algorithms for learning the weights of an ANN.
The Self-Organising Map algorithm
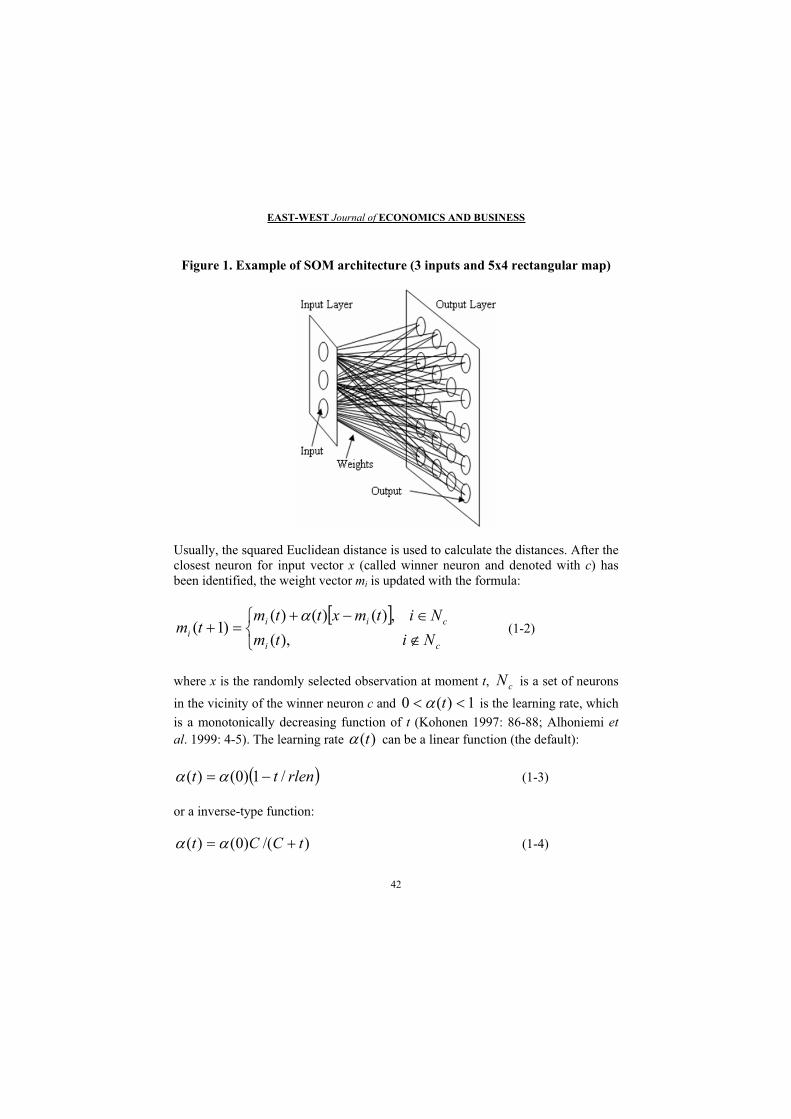
The SOM (Self-Organising Map) algorithm is a well-known unsupervised-learning algorithm developed by Kohonen in the early 80’s and is based on a two-layer neural network (Kohonen, 1997). The algorithm creates a two-dimensional map from n-dimensional input data (Figure 1).
After training, each neuron (unit) of the map contains input vectors with similar characteristics, e.g. companies with similar performance.
The SOM has a rectangular or hexagonal topology. Each neuron i contains a weight vector mi = [mi1, …, min] where n is the number of inputs. Before training, the weight vectors are initialised. The default initialisation is a random initialisation. At each step of the training algorithm an input observation x is randomly selected and distances from x to all weight vectors are calculated. The best matching unit (neuron) – denoted by mc – is the one whose weight vector is closest to x (Equation 1-1).
iic mxmx min
(1-1)
EAST-WEST Journal of ECONOMICS AND BUSINESS
42
Figure 1. Example of SOM architecture (3 inputs and 5x4 rectangular map)
Usually, the squared Euclidean distance is used to calculate the distances. After the closest neuron for input vector x (called winner neuron and denoted with c) has been identified, the weight vector mi is updated with the formula:
ci
ciii Nitm
Nitmxttmtm
),(,)()()(
)1( (1-2)
where x is the randomly selected observation at moment t, is a set of neurons
in the vicinity of the winner neuron c and cN
1)(0 t is the learning rate, which is a monotonically decreasing function of t (Kohonen 1997: 86-88; Alhoniemi etal. 1999: 4-5). The learning rate )(t can be a linear function (the default):
rlentt /1)0()( (1-3)
or a inverse-type function:
)/()0()( tCCt (1-4)
EAST-WEST Journal of ECONOMICS AND BUSINESS
43
0
The algorithm stops when a predefined number of training steps has been reached (the default stopping criterion) or if the improvement in the overall average quantisation error is very small. The overall average quantisation error is given by formula:
where is the initial learning rate, C rlen/100 and rlen is number of
steps in training. In any case, )(t decreases to 0. The set can be defined using the radius length N (the radius of the circle, which represents the vicinity of the winner c). N can be defined as a function of time:
cN
rlentNtN 1101)(
0N
(1-5)
where is the initial radius length. N(t) decreases linearly to 1.
n
i
ici mx
nqe
1
)(1
)(icm ixwhere is the closest weight vector for the input vector .
(1-6)
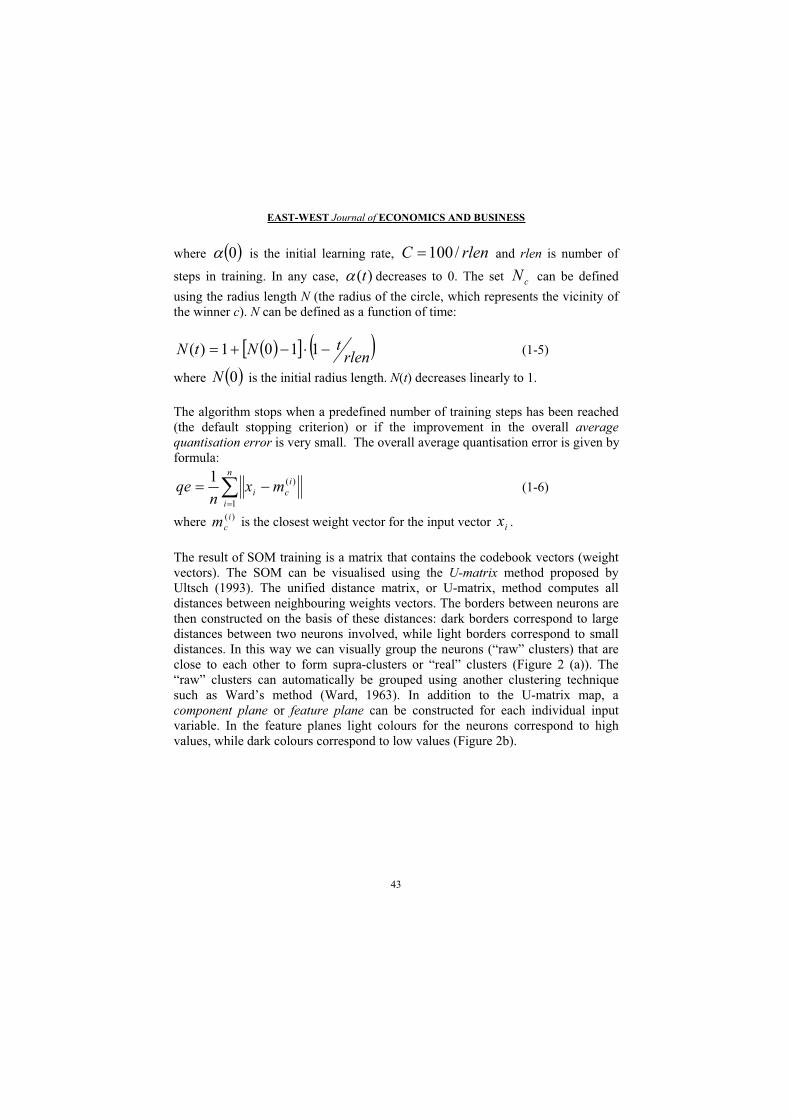
The result of SOM training is a matrix that contains the codebook vectors (weight vectors). The SOM can be visualised using the U-matrix method proposed by Ultsch (1993). The unified distance matrix, or U-matrix, method computes all distances between neighbouring weights vectors. The borders between neurons are then constructed on the basis of these distances: dark borders correspond to large distances between two neurons involved, while light borders correspond to small distances. In this way we can visually group the neurons (“raw” clusters) that are close to each other to form supra-clusters or “real” clusters (Figure 2 (a)). The “raw” clusters can automatically be grouped using another clustering technique such as Ward’s method (Ward, 1963). In addition to the U-matrix map, a component plane or feature plane can be constructed for each individual input variable. In the feature planes light colours for the neurons correspond to high values, while dark colours correspond to low values (Figure 2b).
EA
ST-W
EST
Jour
nal o
f EC
ON
OM
ICS
AN
D B
USI
NE
SS
44
Figu
re 2
. (a)
The
U-m
atri
x re
pres
enta
tion
with
Nen
et v
1.1a
soft
war
e pr
ogra
m a
nd (b
) Equ
ity r
atio
(Lev
erag
e)
com
pone
nt p
lane
(a)
(b
)
EAST-WEST Journal of ECONOMICS AND BUSINESS
45
Literature review on applying CI methods, particularly SOMs, to assessing comparatively the performance of different entities
The literature in assessing comparatively companies’ financial performance encompasses several areas such as: companies’ financial benchmarking, companies’ failure prediction, companies’ credit/bond rating, analysis of companies’ financial statement, and analysis of companies’ financial text data.
We find several models for evaluating the performance of financial entities, applicable mainly to the credit institutions. In Giba (2010) the author examines the consequences of the current economic crisis on the risk and profitability indicators of financial institutions, studying, at the same time, recent developments in strategic management and crisis response of these institutions.
In Collier et al. (2003) the authors described the characteristics of the off-site monitoring instrument of the FDIC (Federal Deposit Insurance Corporation) andthe data used in its development. Doumpos and Zopounidis (2009) proposed a newclassification system for the credit institutions as a support-tool for the analystsfrom the National Bank of Greece. The system provides a rich set of assessment,visualization and reporting options. Swicegood and Clark (2001) compare threemodels (based on discriminant analysis, neural networks and professional human judgment) used to predict underperformance of commercial banks. Neuralnetworks based model showed better predictive capacity than the other twomodels.
Boyacioglu et al. (2009) proposed several methods for classifying creditinstitutions based on 20 performance indicators grouped into six dimensions(CAMELS). They used four sets of financial data, the results showing that amongthe clustering and classification techniques tested, the best in terms of accuracyrates were neural networks.
Ravi Kumar and Ravi (2007) makes a literature review for research conductedduring 1968-2005 on the application of statistical and computational intelligence methods in banks’ or firm’s bankruptcy prediction. The authors show, for each source of data, indicators used, country of origin and period of data collection.
tef nescu et al. (2010) apply computational intelligence methods (e.g. clustering techniques) to classify the shares from Bucharest Stock Exchange which had profit during the last two years, in order to find similarities and differences between these shares and build a diversified portfolio.
EAST-WEST Journal of ECONOMICS AND BUSINESS
46
The SOM algorithm is used extensively in assessing comparatively companies’ financial performance. There are two pioneer works applying the SOM to companies’ financial performance assessment. One is Martín-del-Brío and Serrano Cinca (1993) followed by Serrano Cinca (1996, 1998a, 1998b). Martín-del-Brío and Serrano Cinca (1993) propose SOM as a tool for financial analysis. The sample dataset contains 66 Spanish banks, of which 29 went bankrupt. Martín-del-Brío and Serrano Cinca (1993) use 9 financial ratios, among which there are 3 liquidity ratios: current assets/total assets, (current assets – cash and banks)/total assets, current assets/loans, 3 profitability ratios: net income/total assets, net income/total equity capital, net income/loans, and 3 other ratios: reserves/loans, cost of sales/sales, and cash flows/loans. A solvency map is constructed, and different regions of low liquidity, high liquidity, low profitability, high cost of sales, etc. are highlighted on the map. Serrano Cinca (1996) extends the applicability of SOM to bankruptcy prediction. The data contain five financial ratios taken from Moody's Industrial Manual from 1975 to 1985 for a total of 129 firms, of which 65 are bankrupt and the rest are solvent. After a preliminary statistical analysis, the last ratio (sales/total assets) is eliminated because of its poor ability to discriminate between solvent and bankrupt firms. Again, a solvency map is constructed and, using a procedure to automatically extract the clusters, different regions of low liquidity, high debt, low market values, high profitability, etc. are revealed. Serrano Cinca (1998a, 1998b) extend the scope of the Decision Support System proposed in the earlier studies by addressing, in addition to corporate failure prediction, problems such as: bond rating, the strategy followed by the company in relation to the sector in which it operates based on its published accounting information, and comparison of the financial and economic indicators of various countries.
The other major SOM financial application is Back et al. (1998), which is an extended version of Back et al. (1996). Back et al. (1998) analyse and compare more than 120 pulp-and-paper companies between 1985 and 1989 based on their annual financial statements. The authors used 9 ratios, of which 4 are profitability ratios (operating margin, profit after financial items/total sales, return on total assets, return on equity), 1 is an indebtedness ratio (total liabilities/total sales), 1 denotes the capital structure (solidity), 1 is a liquidity ratios (current ratio), and 2 are cash flow ratios (funds from operations/total sales, investments/total sales). The maps are constructed separately for each year and feature planes are used to interpret them. An analysis over time of the companies is conducted by studying the position each company has in every map.
Eklund et al. (2003) investigate the suitability of SOM for financial benchmarking of world-wide pulp-and-paper companies. The dataset consists of 7 financial ratios
EAST-WEST Journal of ECONOMICS AND BUSINESS
47
calculated for 77 companies for six years (1995-2000). Eklund et al. (2003) construct a single map for all the years and find clusters of similar financial performance by studying the feature plane for each ratio. Next, the authors use SOM visualisation capabilities to show how the countries’ averages, the five largest companies, the best performers and the poorest performers evolved over time according to their position in the newly constructed financial performance clusters. Karlsson et al. (2001) use SOM to analyse and compare companies from the telecommunications sector. The dataset consists of 7 financial ratios calculated for 88 companies for five years (1995-1999). Karlsson et al. (2001) use a similar approach to Eklund et al. (2003) and build a single map. The authors identify six financial performance clusters and show the movements over time of the largest companies, countries’ averages and Nordic companies. Both, Eklund et al. (2003) and Karlsson et al. (2001) use quantitative financial data from the companies’ annual financial statements. The ratios are chosen based on Lehtinen’s study (Lehtinen, 1996) of the validity and reliability of ratios in an international comparison. Kloptchenko (2003) use the prototype matching method (Visa et al., 2002; Toivonen et al., 2001; Back et al., 2001) to analyse qualitative (text) data from telecom companies’ quarterly reports. Kloptchenko et al. (2004) combine data and text-mining methods to analyse quantitative and qualitative data from financial reports, in order to see if the textual part of the reports can offer support for what the figures indicate and provide possible future hints. They use the dataset from Karlsson et al. (2001).
The application of Self-Organising Map algorithm to NFIs’ performance benchmarking
In this experiment we assess comparatively the performance of different NFIs. We base our variables choice on the existing Uniform Evaluation Systems – CAAMPL (Cerna et al., 2008) applicable in the case of credit institutions or banks. TheCAAMPL system uses the financial reports of credit institutions and evaluates sixcomponents that reflect in a consistent and comprehensive manner the performanceof banks in concordance with the banking laws and regulations in force: capitaladequacy (C), quality of ownership (A), assets’ quality (A), management (M), profitability (P), liquidity (L). The six dimensions are rated using a 1 to 5 scale, where 1 represents best performance and 5 the worst. Four dimensions (capital adequacy, assets’ quality, profitability, and liquidity) are quantitative dimensions and are evaluated based on a number of indicators. The other two dimensions are qualitative dimensions, evaluated on the textual information provided by the banks as legal reporting requirements at the time of their authorization or as a consequence of changes in their situation. These two dimensions can also be
EAST-WEST Journal of ECONOMICS AND BUSINESS
48
evaluated from the information obtained during on-site inspections. Finally, a composite rating is calculated as a weighted average of the dimensions’ ratings.In this application we have restricted the number of the performance dimensions to three quantitative dimensions, namely: capital adequacy (C), assets’ quality (A) and profitability (P). The other quantitative dimension used in evaluating the credit institutions (liquidity dimesnion) is not applicable to NFIs, since they do not attract retail deposits. We have also eliminated the qualitative dimensions from our experiment (quality of ownership and management) because they involve a distinct approach and it was not the scope of this study to take them into account.
After choosing the performance dimensions, we select different indicators for each dimension based on the analysis of the periodic financial statements of the NFIs. We select the following indicators for assessing the degree of capitalization:
1. Equity ratio (Leverage) = own capital / total assets (net value) 2. Own capital / equity 3. Indebtedness sources = borrowings / own capital
The evaluation of the assets’ quality of NFIs is generally based on the value of loans granted, as well as on the value of nonperforming loans. The set of indicators for assessing the assets’ quality is as follows:
1. Loans granted to clients (net value) / total assets (net value) 2. Loan granted to clients (net value) / total borrowings 3. Past due and doubtful loans (net value) / total loans portfolio (net value) 4. Past due and doubtful claims (net value) / total assets (net value) 5. Past due and doubtful claims (net value) / own capital
Profitability is measured by classical indicators, namely:
1. Return on assets (ROA) = net income / total assets (net value)2. Return on equity (ROE) = net profit / own capital 3. The rate of profit = gross profit / total revenues 4. Activity cost = total costs / total revenues
The next step of the analysis is to define the best indicator for each dimension and collect the data necessary to calculate these indicators. The final indicators used in the experiment are: Equity ratio (Leverage) for the “capital adequacy” dimension, Loans granted to clients (net value) / total assets (net value) for the “assets’ quality” dimension and Return on assets (ROA) for the “profitability” dimension. The data were collected with the help of the members of the NFIs’ Supervision
EAST-WEST Journal of ECONOMICS AND BUSINESS
49
Unit4 within the Supervision Department of the National Bank of Romania. The data were collected annually from 2007 to 2010 for the NFIs registered in the Special Register that have as main activity financial leasing and have been active since the introduction of the regulatory framework for these institutions in Romania. In total there were 11 NFIs that met the above criteria and 44 observations (11 NFIs x 4 Years = 44 observations).
We proceed in two stages: in the first stage we apply the SOM algorithm and build a 2-dimensional map from the input space. This map contains “raw” clusters or neurons (in Figure 3, a “raw” cluster is any of the 24 green hexagons in the map). After the training, each neuron contains a number of observations or none.
In the second stage, we use the U-matrix method proposed by Ultsch (1993), to display group the “raw” clusters that are close to each other to form supra-clusters or “real” clusters (in Figure 3 a “real” cluster is cluster A, B, C or D).
We used SOM_PAK – a software program built by a research team at Helsinki University of Technology – to train the maps and Nenet v1.1a – a visualization tool built by the same team - for presenting the final trained map. Nenet v1.1a implements the U-matrix method by showing dark/light borders between different neurons on the map.
For the first stage of the methodology we have trained several maps by selecting different values for the specific parameters specific of the SOM algorithm. We used our dataset without preprocessing the data given the values of the ratios are already standardised in a [-1; 1] interval. In this way the potential negative impact the Euclidean distance calculations would have on the clustering is diminished. The right choice of the SOM parameters is problem and data-dependent. However, whatever data we use for training, the algorithm works best when the results of a first training session are calibrated by a second training session where the parameters are fine-tuned (Kohonen et al., 1996, p. 16).
The final map chosen (Figure 3) is the best in terms of quantisation error (0.074522). The parameters are as follows:
1. For the initialization phase we used a 6x4 map (24 “raw” neurons or clusters), the topology – hexa, the neighborhood function – bubble and the initialization type – random.
4 Ms. Denisa Dervi , expert in the Supervision Department, developed the Microsoft Excel’s formulas based on which the data was gathered from the disparate reports of the NFIs.
EAST-WEST Journal of ECONOMICS AND BUSINESS
50
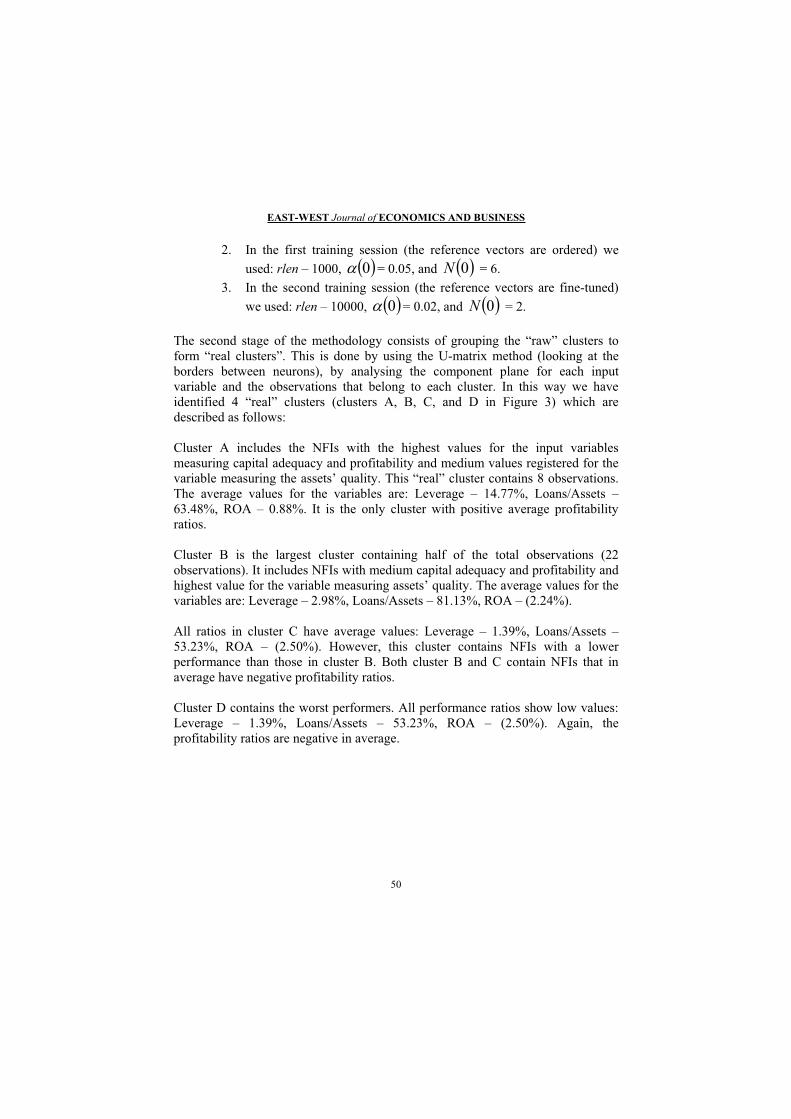
2. In the first training session (the reference vectors are ordered) we used: rlen – 1000, 0 = 0.05, and 0N = 6.
3. In the second training session (the reference vectors are fine-tuned) we used: rlen – 10000, 0 = 0.02, and 0N = 2.
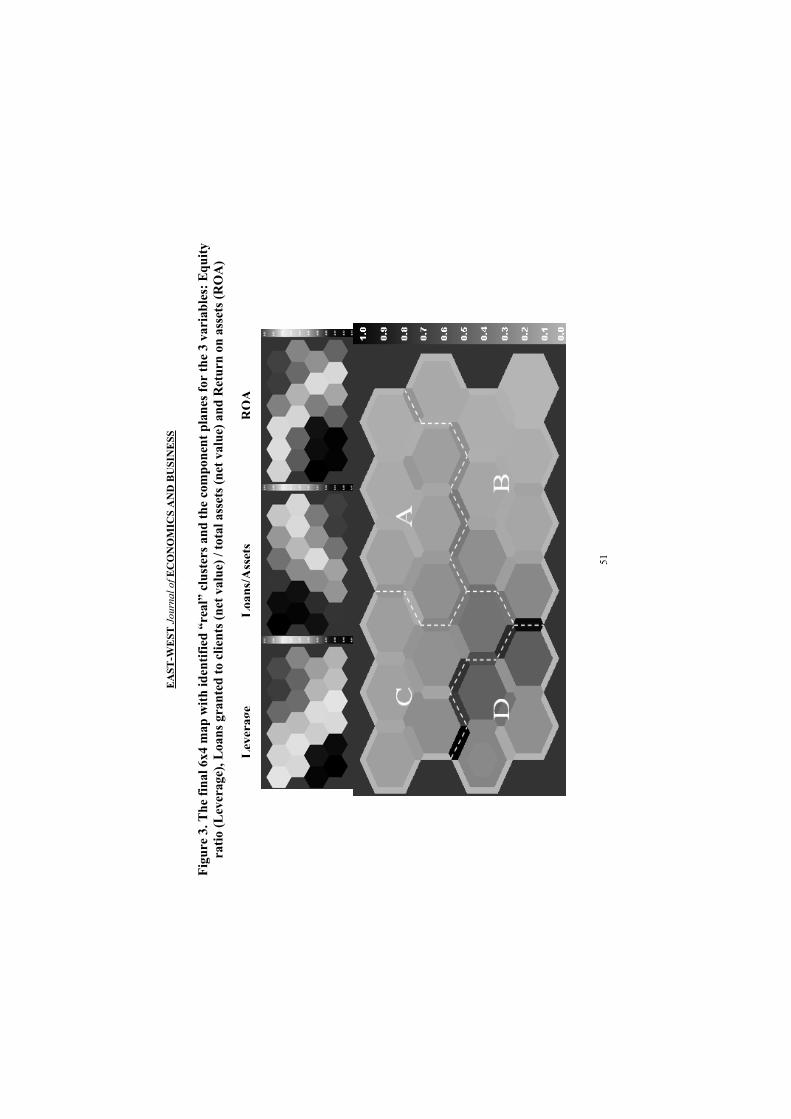
The second stage of the methodology consists of grouping the “raw” clusters to form “real clusters”. This is done by using the U-matrix method (looking at the borders between neurons), by analysing the component plane for each input variable and the observations that belong to each cluster. In this way we have identified 4 “real” clusters (clusters A, B, C, and D in Figure 3) which are described as follows:
Cluster A includes the NFIs with the highest values for the input variables measuring capital adequacy and profitability and medium values registered for the variable measuring the assets’ quality. This “real” cluster contains 8 observations. The average values for the variables are: Leverage – 14.77%, Loans/Assets – 63.48%, ROA – 0.88%. It is the only cluster with positive average profitability ratios.
Cluster B is the largest cluster containing half of the total observations (22 observations). It includes NFIs with medium capital adequacy and profitability and highest value for the variable measuring assets’ quality. The average values for the variables are: Leverage – 2.98%, Loans/Assets – 81.13%, ROA – (2.24%).
All ratios in cluster C have average values: Leverage – 1.39%, Loans/Assets – 53.23%, ROA – (2.50%). However, this cluster contains NFIs with a lower performance than those in cluster B. Both cluster B and C contain NFIs that in average have negative profitability ratios.
Cluster D contains the worst performers. All performance ratios show low values: Leverage – 1.39%, Loans/Assets – 53.23%, ROA – (2.50%). Again, the profitability ratios are negative in average.
EA
ST-W
EST
Jour
nal o
f EC
ON
OM
ICS
AN
D B
USI
NE
SS
51
Figu
re 3
. The
fina
l 6x4
map
with
iden
tifie
d “r
eal”
clu
ster
s and
the
com
pone
nt p
lane
s for
the
3 va
riab
les:
Equ
ity
ratio
(Lev
erag
e), L
oans
gra
nted
to c
lient
s (ne
t val
ue) /
tota
l ass
ets (
net v
alue
) and
Ret
urn
on a
sset
s (R
OA
)
RO
AL
oans
/Ass
ets
Lev
erag
e
EAST-WEST Journal of ECONOMICS AND BUSINESS
52
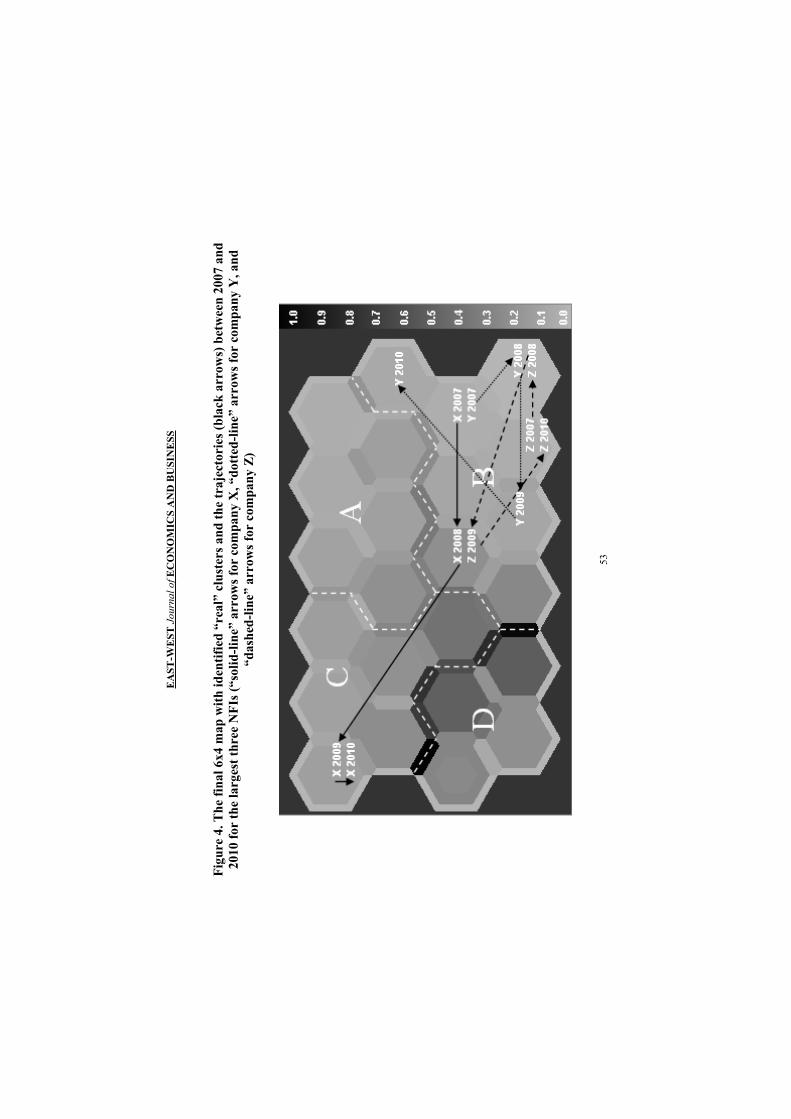
Next, in Figure 4 we analyse the movements of the three bigest NFIs (in terms of average total assets for four years – 2007-2010). We denote these NFIs with Company X, Y and Z in decreasing order of assets (X – 1,021,687,807 RON, Y – 930,793,315 RON, and Z – 782,497,452 RON).
The trajectories in Figure 4 show the movements of the three largest NFIs: the largest denoted with X (solid-line), the second largest denoted with Y (dotted-line) and the third largest denoted with Z (dashed-line) between 2007 and 2010.
Company X started in cluster B in 2007 and 2008, but dropped to cluster C the following year and remained there in 2010. This was partially due to a greater decrease in own capital as compared to a smaller increase in total assets. At the same time, in 2009 the loans granted by company X have decreased dramatically as compared to 2008, reaching almost a 50% decrease.
Company Y had a similar evolution although it always stayed in cluster B. Like company X, in 2009 company Y encountered a significant decrease in all its performance indicators, starting with a dramatic decrease of own capital of about 70% and a significant loans decrease of about 40%. However, the ratios maintained their values as the denominator (total assets) also decreased substantially (by about 35%).
The third largest NFI in terms of average total assets, company Z, showed average values for all performance indicators during the analysis period. It stayed in cluster B for all years, although the capital adequacy and profitability ratios dropped somewhat in 2009 compared to 2008. In 2009 and 2010, company Z encountered negative value for the profitability ratio (ROA), even though these values were rather small.
As a main pattern, we can see that for the analyzed companies there was a sharp drop in their performance in 2009 as compared to 2008. This coincides with the effect of the global financial crisis that materialized in Romania during year 2009 and hardly hit the auto sales industry which in turn affected negatively the performance of the NFIs that engaged in financing this sector.
EA
ST-W
EST
Jour
nal o
f EC
ON
OM
ICS
AN
D B
USI
NE
SS
53
Figu
re 4
. The
fina
l 6x4
map
with
iden
tifie
d “r
eal”
clu
ster
s and
the
traj
ecto
ries
(bla
ck a
rrow
s) b
etw
een
2007
and
20
10 fo
r th
e la
rges
t thr
ee N
FIs (
“sol
id-li
ne”
arro
ws f
or c
ompa
ny X
, “do
tted
-line
” ar
row
s for
com
pany
Y, a
nd
“das
hed-
line”
arr
ows f
or c
ompa
ny Z
)
EAST-WEST Journal of ECONOMICS AND BUSINESS
54
Conclusions
In this paper we showed how one Data Mining technique, namely the SOM algorithm, can be used in addressing the NFIs’ performance benchmarking based on a number of financial ratios that define different performance dimensions such as: capital adequacy, assets’ quality and profitability.
All stakeholders (decision-makers, creditors, investors) can benefit from this type of analysis. Decision-makers in the companies involved in the analysis can understand the causes of their business problems by learning from others’ achievements/mistakes. Creditors can obtain a general picture about the financial situation of different companies that would help them manage their credit exposure. Using our models, investors would be able to weigh the different investment opportunities.
We have constructed several maps and selected the best one in terms of quantisation error and ease of readability. The final map was used to analyze the companies over time by studying the cluster where each company was positioned for each period. As a result, we claim that there are benefits in using SOM for managing large and complex financial data in terms of identifying and visualizing the clusters. By building the benchmarking model we showed how new technologies, e.g. neural networks with Self-Organising Maps algorithms, could be used to evaluate comparatively the performance of non-banking financial institutions. Moreover, we argue that the benchmarking model obtained can be used in allocating more efficiently the resources that are available to supervisory authorities by identifying those companies that present the worst performance for several periods. This paper is the first to study the application of neural networks model to evaluate comparatively the performance of non-banking financial institutions. Moreover, few studies have benefited from the possibility of immediate implementation in practice, e.g. in our case the Supervision Department of National Bank of Romanian engaged in the project and promised to explore the benefits provided by the benchmarking model.
Acknowledgements
This work was supported from the European Social Fund through Sectoral Operational Programme Human Resources Development 2007-2013, project number POSDRU/89/1.5/S/59184 „Performance and excellence in postdoctoral research in Romanian economics science domain”.
The author would like to thank Professor Jacques Pezier for his constructive comments on the article.
EAST-WEST Journal of ECONOMICS AND BUSINESS
55
Index of acronyms
ANN Artificial Neural Network CAAMPL Capital adequacy (C), Shareholding quality (A), Assets quality (A),
Management (M), Profitability (P), Liquidity (L) CAMELS Capital adequacy (C), Assets quality (A), Management (M), Earnings (E),
Liquidity (L), Sensitivity to market risk (S) CI Computational Intelligence DM Data Mining FCM Fuzzy C-Means FDIC Federal Deposit Insurance CorporationKDD Knowledge Discovery in Databases NFI Non-banking Financial Institution Qe quantisation error ROA Return On Assets ROE Return On Equity SOM Self-Organising Map U-matrix Unified distance matrix
References
Alcaraz-Garcia, Augusto Francisco and Adrian Costea, 2004, A Weighting FCM algorithm for clusterization of companies as to their financial performances, in Proceedings of the IEEE 4th International Conference on Intelligent Systems Design and Applications (ISDA 2004), Rudas I. (ed.), CD-ROM Edition, Budapest, Hungary, August 26-28, 2004, Track: Intelligent Business: 589-594.
Alhoniemi, Esa, Jaakko Hollmen, Olli Simula and Juha Vesanto, 1999, Process monitoring and modeling using the self-organising map”, Integrated Computer-Aided Engineering 6(1): 3-14.
Back, Barbro, Kaisa Sere and Hannu Vanharantam, 1996, Data mining accounting numbers using self organising maps”, Proceedings of Finnish Artificial Intelligence Society Conference, Alander J., Honkela T., Jakobsson M. (eds.), Vaasa, Finland, August 20-23, 1996: 35-47.
Back, Barbro, Kaisa Sere and Hannu Vanharanta, 1998, Managing complexity in large databases using self-organising maps, Accounting Management and Information Technologies 8(4):191-210.
Back, Barbro, Jarmo Toivonen, Hannu Vanharanta and Ari Visa, 2001, Comparing numerical data and text information from annual reports using self-organising maps, International Journal of Accounting Information Systems 2(4): 249-269.
Boyacioglu, Melek Acar, Yakup Kara and Omer Kaan Baykan, 2009, Predicting financial bank failures using neural networks, support vector machines and multivariate statistical methods: A comparative analysis of samples in
EAST-WEST Journal of ECONOMICS AND BUSINESS
56
the savings deposit insurance fund (SDIF) transferred banks in Turkey, Expert Systems with Applications 36(2): 3355-3366.
Cerna, Silviu, Liliana Donath, Victoria Seulean, Marius Herbei, Diana B rgl zan, Claudiu Albulescu and Bogdan Boldea, 2008, Financial stability, West University Publishing House, Timi oara, Romania, 2008.
Collier, Charles, Sean Forbush, Daniel A. Nuxoll and John O'Keefe, 2003, The SCOR system of off-site monitoring: Its objectives, functioning, and performance” FDIC Banking Review 15(3): 17-32.
Costea, Adrian, 2005, Computational Intelligence Methods for Quantitative Data Mining, TUCS PhD dissertation No. 67, Painosalama Oy, Turku, Finland.
Costea, Adrian, 2011, The process of knowledge discovery in databases (KDD) – a framework for assessing the performance of non-banking financial institutions”, Proceedings of the Tenth International Conference on Informatics in Economy (IE 2011), Bucharest, Romania, May 5-7.
Doumpos, Michael and Constantin Zopounidis, 2009, A multicriteria bank rating system”, European Working Group "Multiple Criteria Decision Aiding"3(19): 17-19.
Eklund, Tomas, Barbro Back, Hannu Vanharanta and Ari Visa, 2003, Financial benchmarking using self-organising maps – Studying the international pulp and paper Industry, in Wang J. (ed.), Data Mining - Opportunities and Challenges, Hershey, PA, Idea Group Publishing: 323-349.
Fayyad, Usama, Gregory Piatetsky-Shapiro and Padhraic Smyth, 1996, From data mining to knowledge discovery: An overview”, in Fayyad U., Piatetsky-Shapiro G., Smyth P. and Uthurusamy R. (eds.), Advances in Knowledge Discovery and Data Mining, AAAI Press, Menlo Park, California: 1-30.
Giba, Adriana, 2010, The impact of the crisis on financial institutions. From growth obsession to limiting losses, Journal of Doctoral Research in Economics, II(3): 12-19.
Han, Jiawei and Micheline Kamber, 2006, Data mining: Concepts and techniques,2nd Edition, Morgan Kaufmann Publishers.
Hevner, Alan R., Salvatore T. March, Jinsoo Park and Sudha Ram, 2004, Design science in information systems research”, MIS Quarterly 28(1): 75-105.
Karlsson, Jonas, Barbro Back, Hannu Vanharanta and Ari Visa, 2001, Financial benchmarking of telecommunications companies”, TUCS Technical Report 395, February.
Kloptchenko, Antonina, 2003, Text mining based on the prototype matching method, TUCS Ph.D. dissertation No. 47, Turku, Finland.
Kloptchenko, Antonina, Tomas Eklund, Jonas Karlsson, Barbro Back, Hannu Vanharanta and Ari Visa, 2004, Combining data and text mining techniques for analysing financial reports, International Journal of
EAST-WEST Journal of ECONOMICS AND BUSINESS
57
Intelligent Systems in Accounting, Finance and Management 12(1): 29-41.
Kohonen, Teuvo, 1997, Self-organising aps, 2nd edition, Springer-Verlag, Heidelberg.
Kohonen, Teuvo, Jussi Hynninen, Jari Kangas and Jorma Laaksonen, 1996, SOM_PAK: The self-organising map program package, Helsinki University of Technology, Report A31, Otaniemi.
Lehtinen, Janne, 1996, Financial ratios in an international comparison. Validity and Reliability, Acta Wasaensia 49, Vaasa, Finland.
Martín-del-Brío, Bonifacio and Carlos Serrano Cinca, 1993, Self organising neural networks for the analysis and representation of data: some financial cases, Neural Computing & Applications, 1(2): 193-206.
Ravi Kumar, P. and V. Ravi, 2007, Banks and firms in bankruptcy prediction via intelligent and statistical techniques - A review”, European Journal of Operational Research 180(1): 1-28.
Romeu, Jorge L., 2001, Operations research/statistics techniques: A key to quantitative data mining”, Proceedings of FCSM (Federal Committee on Statistical Methodology) Conference, Key Bridge Marriott, Arlington,Virginia, November 14-16.
Serrano Cinca, Carlos, 1996, Self organising neural networks for financial diagnosis, Decision Support Systems, 17: 227-238.
Serrano Cinca, Carlos, 1998a, Self-organising maps for initial data analysis: Let financial data speak for themselves, in Deboeck G. and Kohonen T. (eds.), Visual intelligence in finance using self-organising maps, Springer Verlag.
Serrano Cinca, Carlos, 1998b, From financial information to strategic groups - a self organising neural network approach, Journal of Forecasting, 17: 415-428.
Swicegood, Philip and Jeffrey A. Clark, 2001, Off-site monitoring systems for predicting bank underperformance: a comparison of neural networks, discriminant analysis, and human professional judgement, Intelligent Systems in Accounting, Finance & Management 10(3): 169-186.
tef nescu, Viorica, Florentin erban, Mihail Bu u and Massimiliano Ferrara, 2010, Portfolio optimization using classification and functional data analysis techniques, Economic Computation and Economic Cybernetic Studies and Research 44(3): 93-108.
Toivonen, Jarmo, Ari Visa, Tomi Vesanen, Barbro Back and Hannu Vanharanta, 2001, Validation of text clustering based on document contents, Proceedings of the Second International Workshop on Machine Learning and Data Mining in Pattern Recognition (MLDM 2001), Leipzig, Germany: 184-195.
EAST-WEST Journal of ECONOMICS AND BUSINESS
58
Ultsch, Alfred, 1993, Self organized feature maps for monitoring and knowledge aquisition of a chemical process, in Gielen S., Kappen B. (eds.), Proceedings of the International Conference on Artificial Neural Networks (ICANN93), London, Springer-Verlag: 864-867.
Visa, Ari, Jarmo Toivonen, Barbro Back and Hannu Vanharanta, 2002, Contents matching defined by prototypes: Methodology verification with books of the Bible”, Journal of Management Information Systems 18(4): 87-100.
Ward, Joe H. Jr., 1963, Hierarchical grouping to optimize an objective function, Journal of the American Statistical Association 58: 236-244.