Embed Size (px)
Citation preview
1
Appetite for Destruction: The Impact of the September 11 Attacks on Business Founding
Srikanth Paruchuri Associate Professor
Warrington College of Business University of Florida
Gainesville, FL 32611 Ph: 352-392-8128
Email: [email protected]
Paul Ingram Kravis Professor of Business
Columbia University 3022 Broadway
New York, NY 10027 Tel: 212-854-2740
Email: [email protected]
June 15, 2010
We are grateful to Heather Haveman, Felix Oberholzer-Gee, Peter Roberts, Elaine Romanelli, Brian Silverman, Olav Sorensen and David Weinstein for help and comments, and to CIBER for providing financial support. An earlier version of this paper was presented at the annual meetings of the Academy of Management in Philadelphia in August 2007.
2
Appetite for Destruction:
The Impact of the September 11 Attacks on Business Founding
ABSTRACT It is widely accepted that entrepreneurial creation affects destruction, as new and better organizations, technologies and transactions replace old ones. This phenomenon is labeled creative destruction, but it might more accurately be called destructive creation, given the driving role of creation in the process. We reverse the typical causal ordering, and ask whether destruction may drive creation. We argue that economic systems may get stuck in suboptimal equilibria due to path dependence, and that destruction may sweep away this inertia, and open the way for entrepreneurship. To test this idea we need an exogenous destructive shock, rather than destruction that is endogenous to the process of economic progress. Our identification strategy relies on the September 11 attacks as an exogenous destructive shock to the economic system centered on New York City. Consistent with our theoretical claim, we find fifteen months after the attacks, the rate of business founding close to New York City exceeds the rate before the attacks, even after controlling for the inflow of recovery funds. Furthermore, the increase in the business founding rate after the attacks grows faster closer to Manhattan than it does further away from the epicenter of destruction.
3
The term creative destruction evokes a tension between an innovative future and an inertial status
quo. In origin and application, the tension inherent in the label has been bypassed, and creation
has been emphasized over destruction. Schumpeter himself characterized economic evolution as
resulting from new markets, new products and new methods. Destruction of the old in
capitalism, in his view, was a simple necessity to make room for the new. The research that has
followed under the creative destruction banner has also given pride of place to innovation.
Innovations have been categorized in terms of their destructive implications (Abernathy and
Clark, 1985), how firm strategies may moderate their impact (Tripsas, 1997), and it has been
argued that the rate of innovation at one time may be determined by expectations regarding
innovation (and accompanying destruction) in the future (Aghion and Howitt, 1992). Some even
claim that destruction is not necessary at all, that innovation may exist without it (Bhide, 2008).
But in all of these works it is innovation that drives the process that (perhaps) leads to
destruction. The whole set of ideas, from Schumpeter to the present, would be more accurately
labeled as destructive creation rather than creative destruction.
In this paper we start with destruction. We reverse the typical causal pattern and ask
whether and when destruction may produce creation. We consider material and psychological
implications of destruction. On both of these dimensions, destruction may produce positive
impacts in addition to the more obvious negative ones. In the material realm, the advantage of
destruction derives from the disadvantages of the status quo. Entrenched interests and sunk costs
may inhibit progress, and maintain economic systems in suboptimal arrangements. Destroying
these pre-existing arrangements opens the possibility of a systemic improvement. In the
4
psychological realm, destruction has the potential to motivate individuals, to promote social
cohesion, and to encourage them to contribute to collective goods.
There is an identification challenge with regard to examining these ideas, because
according to the familiar theory of progress, destruction is an endogenous result of innovation.
Consider, for example, Caballero and Hammour’s (1996: 805) definition of creative destruction
as at the process where economic structure adapts “to innovations in products, techniques, modes
of organization, and to the evolving competitiveness of world markets. Production units that
embody new techniques must be constantly created, while outdated units must be destroyed.”
From this perspective, destruction is “good by association” to innovation. Our argument is that
destruction may sometimes be good in its own right. To show this, it is necessary to separate the
effects of destruction from the benefits of creation with which they are often associated. What
we need to test our ideas is an exogenous destructive shock, rather than destruction that is
endogenous to the process of economic progress.
To this end, we analyze a natural experiment created by the September 11 attacks on the
World Trade Center, which devastated lower Manhattan and caused a major disruption in the
extended economic system centered on New York City. Clearly, these attacks were not
endogenous to the evolution of the New York economy. As the slack-jawed response to the
attacks from near and far indicates, they were as close to an exogenous shock as can been found
in the social world. Our identification strategy has precedent in the work of Davis and Weinstein
(2002, 2008) who used the bombing of Japanese cities in World War II as a natural experiment
to examine theories on the evolution of cities. In our case, the foundational idea is that the
destruction wrought in the attacks, which was not only physical, but organizational, relational,
and psychological, sets the stage for entrepreneurial creation, which we operationalize as new
5
business founding. Our claim that destruction may stimulate creation is intended to apply
broadly, in the contexts of systems of transactions, production arrangements and technologies.
New business founding is therefore an example of the phenomenon we seek to explain, not the
whole of it.
We are also aware that the methodological advantage of the exogenous September 11
attacks comes with a cost in terms of the idiosyncrasy of that event. Specifically, those attacks
were intended to produce terror. Other forms of exogenous destruction, for example an
earthquake, or even the bombing of a city in the context of a war between states, may be more or
less likely to produce fear and despair, more or less likely to influence social cohesion, and may
be associated with different expectations with regard to the likelihood of repeat events of the
same type in the future. In other words, the psychological influences of destruction may not be
the same for a terrorist attack as for other destructive events. We take the idiosyncrasies of
terrorism into account when we generate predictions below, and we highlight it as a concern for
generalizing from our study. At the same time, the exogenous influences on the psychology of
entrepreneurs is a topic that has received scant attention—for example the issue is almost
completely absent in the organizational ecology literature on business founding. So, even as we
recognize that terrorism’s effect on collective psychology is not indicative of all forms of
destruction, we also claim a contribution as an early examination of the idea that exogenously-
influenced collective psychology may influence industry dynamics.
The Creative Results of Material Destruction
We propose that destruction may allow creation and systemic improvement by removing
technologies, organizations, jobs, and civic infrastructure that is suboptimal, but persists because
6
of inertia or path dependence. The essence of the argument is that inferior systems may persist
because particular actors have an interest in the status quo and can resist change. If the status
quo were wiped out, the resistance of these actors would be eliminated, and the system could
move closer to optimality. This argument also assumes the existence of transaction costs,
because without them the constituents of the system could compensate the resistors by sharing
the gains of moving from the inferior equilibrium to a better one.
The antecedent of our argument, that economic systems can get stuck in suboptimal
equilibria, is familiar in a number of literatures. Paul David (1985) evokes path dependence to
explain the persistence of inferior technologies. Caballero and Hammour (1996) introduce the
term “technological sclerosis” to describe the inertia in economic systems that emerges because
of efforts to protect current jobs. Similarly, students of New York City politics identify
ossification produced by interest groups and civil service unions as a barrier to progress to a
better city (Lowi, 1969; Brecher and Horton, 1993).
In The Rise and Decline of Nations (1982), Mancur Olson begins with the observation
that the rate of growth in developed countries has varied greatly in the decades after World War
II. His explanation has all elements of the argument we present above. The defenders of the
economic status quo in his account are interest groups. The barrier that stops the majority from
successfully bargaining with the defenders of the status quo is the well known problem of
collective action. And the evidence that destruction can actually be productive is that the post-
war growth rates of Japan and Germany are substantially higher than the UK and the US, which
suffered less destruction in the war. The most compelling case for Olson is France, a country
that “in less than two centuries…has experienced some of the most profound and protracted
revolutions in human history, has gone through constitutions almost as thought they were
7
periodical literature, and has suffered partial or total occupation four times (5),” yet in 1970
when Olson made his comparison had “per capita income decidedly above that of Great Britain,
about the same as that of Germany, and only a fourth lower than the United States.”
Given that our empirical analysis examines business founding, it is important that the
suboptimization argument has also been made at the organization level. Fogel, Morck and
Yeung (2006) argue that “large established firms invest political rent-seeking, manipulating their
economies’ institutions to lock in the status quo and block upstarts. This maintains their
dominance at the expense of their economy’s growth (2).” They find that countries whose roster
of big businesses are more stable exhibit slower economic and productivity growth.
And while many of the above examples identify political institutions as the contexts
where inertia happens, the status quo may also be enforced within organizations and markets.
For example, Barnett (1997) argues that weak competitors may survive because they are part of
larger organizations, and therefore shielded by organizational slack. And Oberholzer-Gee and
Calanog (2007) demonstrate sub-optimizing in market transactions with evidence that buyers
that engage in close, repeat transactions with sellers are more likely to miss useful new products,
presumably because they bias their search for solutions to their existing suppliers. As that
finding suggests, cognitive satisficing could contribute to the persistence of a wide range of sub-
optimal arrangements within organizations and between organizations.
Beunza and Stark (2005) illustrate both the persistence of the status quo and the
opportunity for change presented by the September 11 attack. They follow a group of arbitragers
working in the trading room of an investment bank in the aftermath of the attack. Days after
they were driven from their office in the World Financial Center (adjacent to the World Trade
Center) by the attack, the group re-established itself in a converted warehouse in New Jersey.
8
The initial organization of the warehouse reflects the strong shadow of the operation the group
had abandoned. Even though the warehouse was a large flat space, they replicated as best they
could the three dimensions of their space in the World Financial Center, taping signs in the
corners of the warehouse that read “19th Floor, Risk Management”, “20th Floor, Equities”, and
“21st Foor, Fixed Income.” The arbitragers arranged their desks as best they could to replicate
the spatial relationships from the old set up, with one group, the “agency trading desk” wedging
themselves into a table partly occupied by two photocopiers and three fax machines so they
could remain together.
In the subsequent months, the group relaxed the strict replication of the earliest days.
They nudged their enactment of their occupational identities by adopting a casual jeans-and-
boots norm of dress. They experimented with structural decoupling when 24 traders split from
the group and rented office space in mid-town Manhattan. They justified the move by citing the
necessity of networking and face-to-face contact to confirm the veracity of executives explaining
the logic of mergers. When it came time to relocate the whole operation to Manhattan, a number
of locations were considered. Ultimately, the group chose to return to exactly where they started,
and in March 2002 they were back in the World Financial Center, retaining every trader from the
previous September. But they were not an unchanged organization. Based on their updated
understanding of the risks they faced, they had created a mirror trading site in New Jersey. Other
banks have made permanent re-allocations of staff from Manhattan to other places in the wake of
the re-allocation forced by the attacks. Individual workers have made their own decisions. For
example, some were prompted by the long exodus on foot from lower Manhattan to take jobs
closer to their homes and families, which did not require crossing a bridge to get to work.
9
In summary we argue that the exogenous destruction of organizations, institutions,
physical capital and reified transactions may actually increase entrepreneurial creation, by
eliminating inertial, inferior arrangements. This is an important variation on the more familiar
arguments that we re-label “destructive creation,” which identify the key mechanism as
economic progress. In those accounts, destruction happens because the future is so inviting. In
ours, creation happens because the anchor of the past is destroyed.
It is worth noting some credible alternatives to our theoretical claim that destruction will
bring creation. First, creation is aided by material resources, and if destruction is sufficiently
wide spread, there may not be enough left over to restart the entrepreneurial process. We
consider the impact of resource destruction immediately below. Second is that destruction’s
impact is not only material but also psychological. If entrepreneurs are fearful and anxious then
they won’t be able to take advantage of the opportunity presented by a clean slate. We consider
the psychological effects of destruction in the second section below. Third, our argument
assumes that inertia sometimes limits economic systems to sub-optimal equilibria. If that isn’t
true, then systems wouldn’t need destruction for creation, and the best that could be hoped for
after a destructive event would be a return to the pre-destruction state.
Resource Implications of Material Destruction
The creative possibility of destruction can only be expected to emerge in the medium to long
term. In the short term, destruction is associated with disruption that should undermine
productive efforts of all types. Our specific context for creative destruction, business founding
after the September 11 attacks, is a good context to illustrate this. Immediately after the attacks,
there were a number of material effects that would be expected to suppress business founding
10
and productive activities of all types. This attack dislocated 18,000 businesses employing
around 550,000 people in the vicinity of the WTC (Makinen, 2002). It also caused disruption in
communications, transportation, and other vital requirements for smooth functioning of
businesses. For example, in an unprecedented event, the New York Stock Exchange was closed
after the attack until September 17.
These material disruptions had the immediate effect of reducing resources available for
entrepreneurs to start businesses. Businesses are founded when resources such as financing are
available in the environment (Aldrich, 1999; Sorenson and Stuart, 2003; Stinchcombe, 1978).
For example, Sorenson and Stuart (2003) found that the rate of venture formation increased as
resources arising from liquidity events, such as acquisition and initial public offering, increased
in a region. In the aftermath of the attack, many resources were directed toward supporting the
victims of the attack and rebuilding their lives. Thus, resources that may have flowed to potential
entrepreneurs were diverted to other purposes. Moreover, potential entrepreneurs themselves
may have been affected by job loss and loss of property, so their personal resources available to
found a business may be lessened. This significantly influences the rate of venture formation
because a majority of entrepreneurs rely on their personal resources to fund new ventures
(Reynolds and White, 1997; Evans and Jovanovic, 1989). Furthermore, the opportunities for new
businesses depend on whether there are individuals and healthy businesses available to patronize
the new venture (Blau, 1987). The attack reduced the material demand for new businesses as it
destroyed many and dislocated people and businesses.
These effects of material disruption will not be uniformly distributed across geographic
space. Because the attack on the WTC mostly destroyed resources, jobs and businesses in
Manhattan, those regions most intertwined with Manhattan were also directly affected by the
11
attack. Specifically, regions closer to Manhattan will be dependent on Manhattan for their jobs,
businesses, and opportunities. And, those regions that are farther away from Manhattan are less
interdependent with it (Rosenthal and Strange, 2003). So, the material disruption caused by the
WTC attack in terms of destroyed resources, opportunities, and supply of initiatives will cause
the largest impact on those regions that are close to Manhattan, and lesser impact on those farther
away. This is akin to the ripple created with the fall of a stone in the still water. The water close
to the impact has higher wave and the wave decreases with distance from the epicenter. Of
course, the opportunity we see for creation flowing from destruction should also be greater
where destruction is more thorough. In our case that is closer to Manhattan.
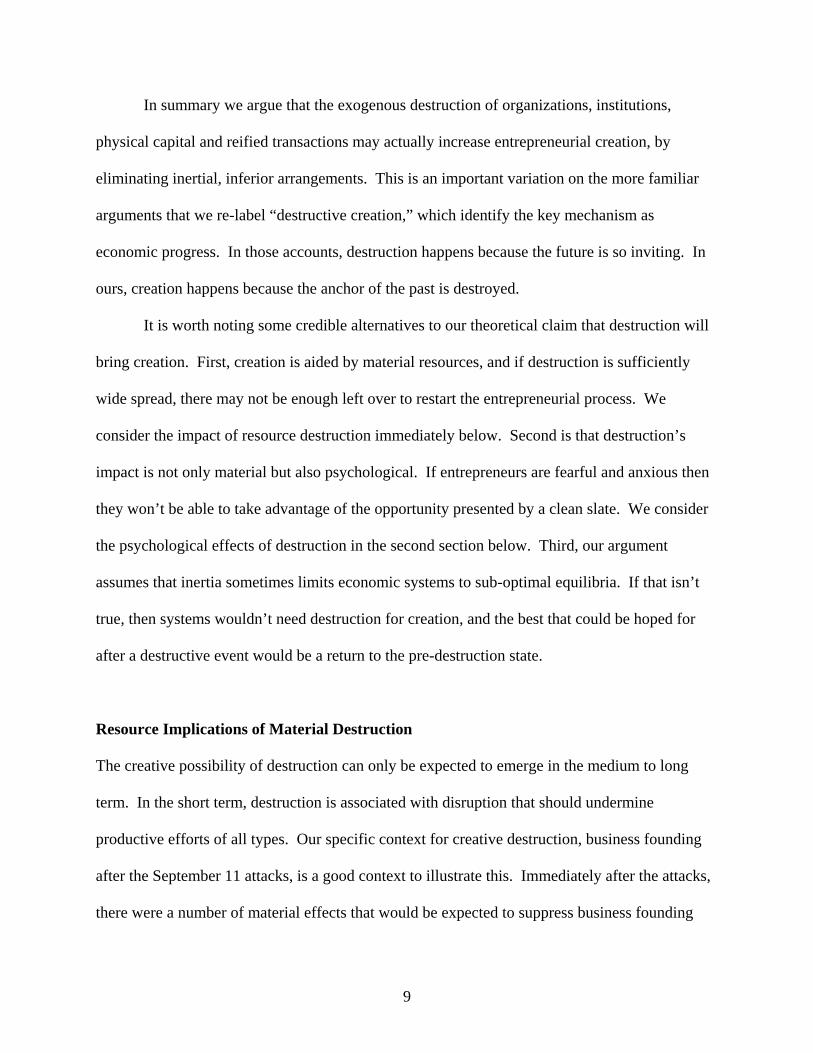
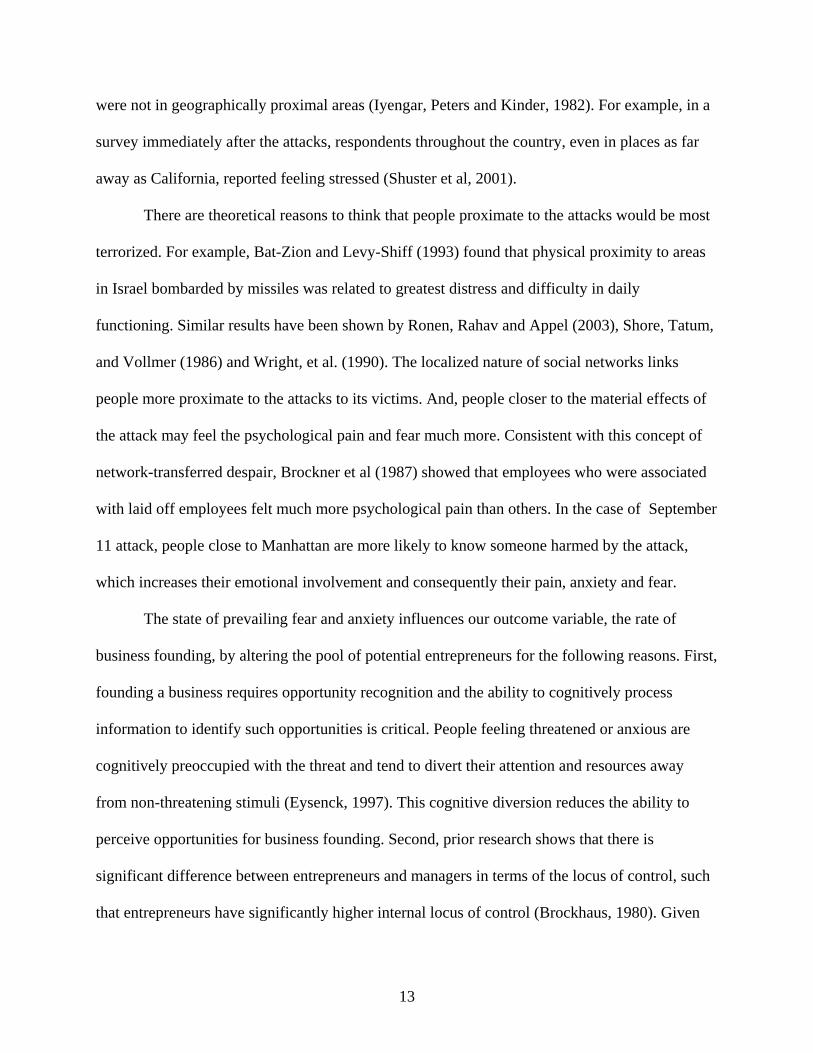
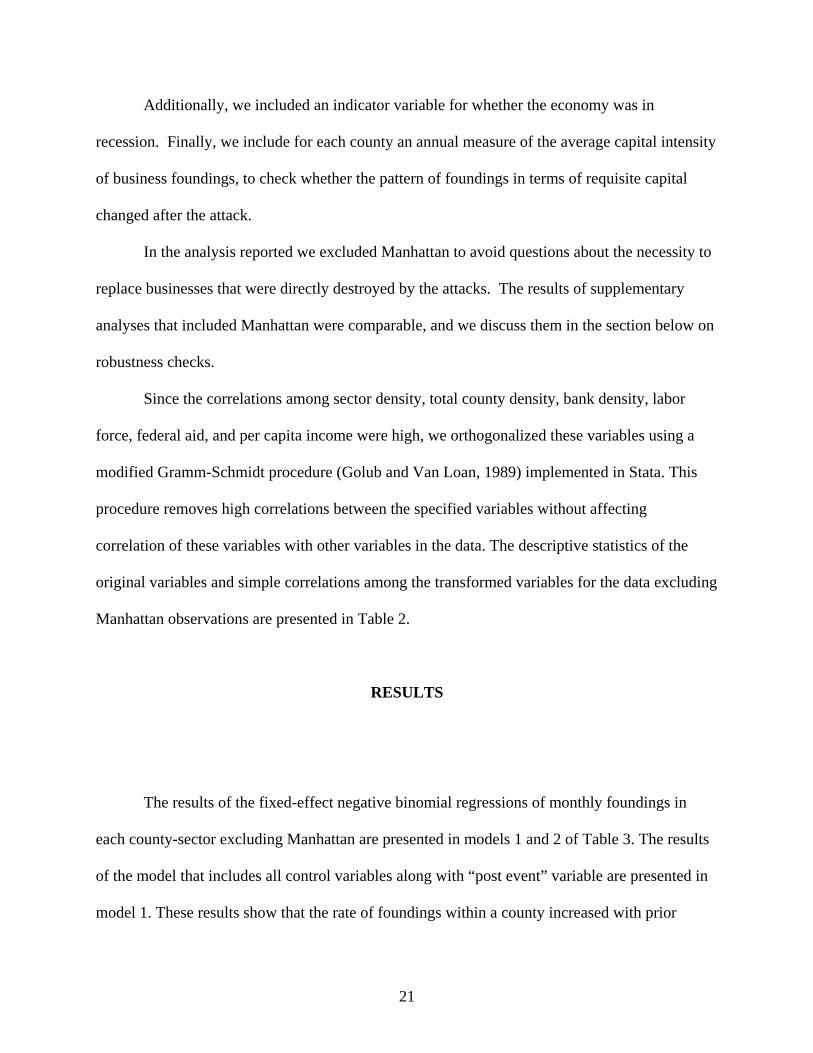
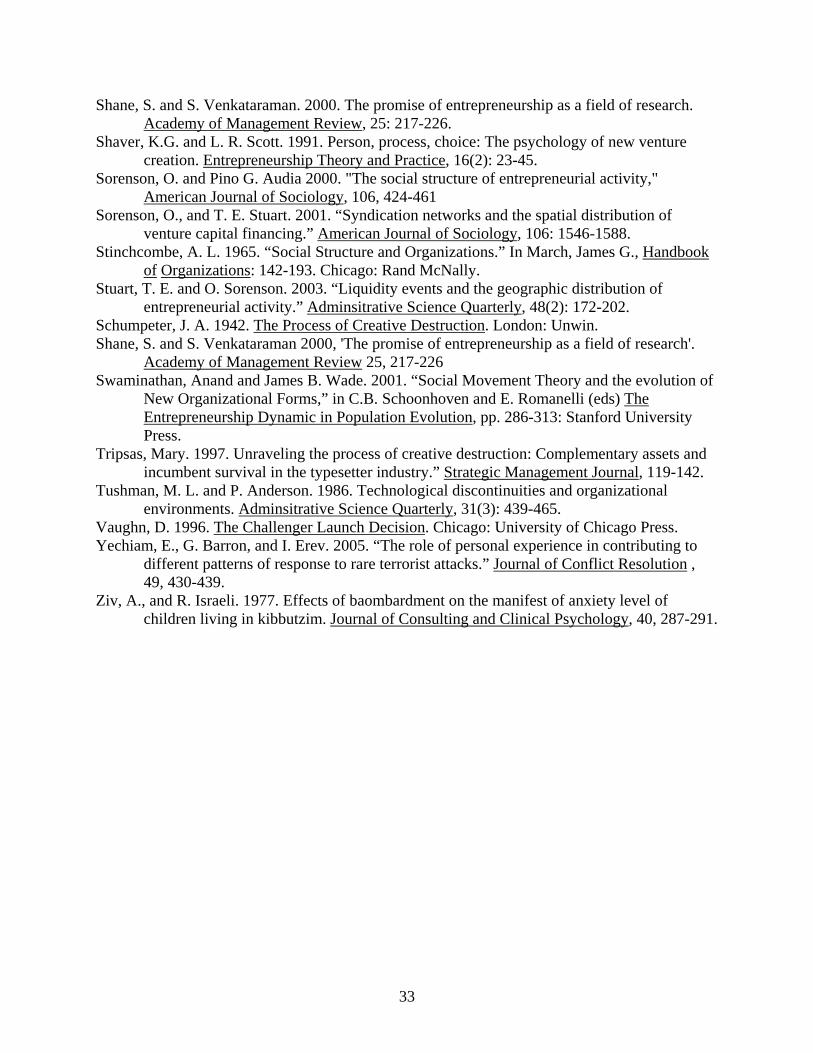
Interestingly, regions farther away from Manhattan suffered from two processes on the
flip side of the creative destruction dynamic. First, incremental flows of resources to regions
farther away were diverted towards Manhattan in the reconstruction process. Figure 1 shows the
distribution of federal funding to counties of New York State. Areas closer to Manhattan
received an increased amount of federal funding after the attack while areas farther from
Manhattan did not. Additionally, there was no destruction that provided opportunities for
creation. Because of the lack of opportunities for creative destruction and the lack of increase in
flow of funds to regions farther away from the location of the attack, the business founding in
these regions would not be expected to improve post-attack as it does closer to Manhattan.
Second, this situation is worsened by the changing interdependence with Manhattan. A natural
response to a disaster is to decouple interdependent systems, to minimize the disruption if a
disaster should re-occur (Perrow, 1999). Such a decoupling occurred after the WTC attacks
(Beunza and Stark, 2005). For example, businesses there may have been more hesitant to build
12
reliance on a supplier from outside the city. Thus, regions farther away from Manhattan may get
minimal positive spillovers from the material recovery.
To summarize, the relevant arguments suggest that there will be a material effect of the
attacks that will in the short run reduce the rate of business founding, and that this effect will be
greater closer to lower Manhattan. The material recovery will be quicker closer to Manhattan, as
indicated by opportunities for creative destruction and the geographic focus of recovery grants.
Regions farther away from Manhattan are expected to recover slowly because of lack of
opportunities for creative destruction, lack of increases in resources, and restructuring of the
interdependence to Manhattan.
The Psychological Impact of Destruction
We see the psychological impacts of destruction as depending on the form of destruction. For
example, terrorism, war, accidents and natural disasters may evoke different levels and types of
fear because their victims may draw different conclusions regarding the likelihood that one
destructive event will be followed by another. These destructive forms also differ in terms of the
locus of agency, the process of blame, and the implications for motivation. We therefore present
the arguments below within the scope of a large-scale terrorist attack, which has the
distinguishing characteristics of uncertain targets, the risk of repeat events, and identifiable
human perpetrators.
The goal of the September 11 attacks was to make all Americans afraid, not just those
immediately effected. Because the event was televised and covered in the popular press, people
from all places saw the aftermath of the attacks. Such exposure has momentous consequences,
creating anxiety, fear and stress in people even when they did not witness the attack directly, and
13
were not in geographically proximal areas (Iyengar, Peters and Kinder, 1982). For example, in a
survey immediately after the attacks, respondents throughout the country, even in places as far
away as California, reported feeling stressed (Shuster et al, 2001).
There are theoretical reasons to think that people proximate to the attacks would be most
terrorized. For example, Bat-Zion and Levy-Shiff (1993) found that physical proximity to areas
in Israel bombarded by missiles was related to greatest distress and difficulty in daily
functioning. Similar results have been shown by Ronen, Rahav and Appel (2003), Shore, Tatum,
and Vollmer (1986) and Wright, et al. (1990). The localized nature of social networks links
people more proximate to the attacks to its victims. And, people closer to the material effects of
the attack may feel the psychological pain and fear much more. Consistent with this concept of
network-transferred despair, Brockner et al (1987) showed that employees who were associated
with laid off employees felt much more psychological pain than others. In the case of September
11 attack, people close to Manhattan are more likely to know someone harmed by the attack,
which increases their emotional involvement and consequently their pain, anxiety and fear.
The state of prevailing fear and anxiety influences our outcome variable, the rate of
business founding, by altering the pool of potential entrepreneurs for the following reasons. First,
founding a business requires opportunity recognition and the ability to cognitively process
information to identify such opportunities is critical. People feeling threatened or anxious are
cognitively preoccupied with the threat and tend to divert their attention and resources away
from non-threatening stimuli (Eysenck, 1997). This cognitive diversion reduces the ability to
perceive opportunities for business founding. Second, prior research shows that there is
significant difference between entrepreneurs and managers in terms of the locus of control, such
that entrepreneurs have significantly higher internal locus of control (Brockhaus, 1980). Given
14
that they have no control over terrorist attacks, threatened or anxious people already feel that
they are in a position of harm or risk and that they do not have control over the situation. Such
change in perceived locus of control will deter people from turning into entrepreneurs, as they
tend to prefer non-risky options in actions on which they have control (Lerner and Keltner,
2001). Third, people who are in an anxious or fearful state tend to be in prevention mode and
prefer to avoid losses (Higgins, 1997). Therefore, they tend to take less risk.
Fear and anxiety will assuage if people emotionally move away from the event (Huddy et
al, 2005). One factor that could influence the emotions felt by people is the proximity in time.
With the passage of time from the event, the saliency of the attack decreases. The fear and
anxiety felt after the attack reduces as people cope with their emotions over time. This reduction
in emotional attachment makes the effects of the attack less salient. This reduced saliency then
allows people to focus on things other than fear and anxiety.
However, in the case of the September 11 attack, the event was kept alive through many
facets of governmental and media discourse. For example, after the September 11 attacks, the
government set up a color code to remind the nation of the level of threat and this code has
always indicated “elevated” or higher threat levels. Similarly, the media has kept the issue alive
by its coverage. Provided proper coping mechanisms, people react to such continuous exposure
to stress by becoming desensitized, habituated and inoculated to the underlying stress conditions
(Breznitz, 1983). For example, Ziv and Israeli (1973) found that the anxiety levels of Israeli
children exposed to frequent shelling were no different than those of children who were not
exposed, the explanation being that the former group became habituated to the threat. Similarly
in the September 11 case, when provided with proper coping mechanisms, people would also
15
become habituated and inoculated to the threat signals arising from continuous exposure from
media and governmental discourse, which will lead to alleviation of fear and anxiety over time.
Such alleviation of fear is likely to be faster in locations closer to Manhattan because
people close to the attack were provided with social mechanisms for coping with the distress
arising from the attack. For example, the environment in and near Manhattan had many
memorial sites, where people could leave messages venting their emotional feelings. Further,
there were many groups which arrived in Manhattan to provide psychiatric and psychological
help after the event, further enhancing access and resources for psychological recovery.
Moreover, those proximate to the epicenter of the attacks had more opportunities to share their
feelings and experiences with other victims which promotes catharsis and support (Austin and
Godleski, 1999) and produces social cohesion and positive norms (Muller and Barash-Kishon,
1998). This is less likely to happen farther away from the epicenter, where people have not
directly experienced hardship, and therefore are not drawn together to overcome it. These people
were not provided with legitimate means of coping with their emotional distress, as they were
not seen as direct victims of the attack. Such lack of coping mechanisms could keep these people
anxious and afraid for a long time.
Further, people farther from the attacks may be hindered longer by fear and anxiety
because of a tendency to overestimate the likelihood of more attacks. Yechiam, Barron, and
Erev (2005) showed that tourists tended to over-estimate the likelihood of terrorist attacks, while
Israelis with proximate experience to terrorism made more accurate estimates. There can be
little doubt that citizens proximate to Manhattan were prompted to be more analytical about the
likelihood of another attack after September 11, as they were more exposed to active debates
about appropriate security measures and because they were forced to make constant decisions
16
about the implications of terrorism for their own safety. Farther away, there was less reason to
thoroughly analyze the likelihood of attack. Yechiam et al.’s results suggest that in such “low
analysis” circumstances, the general tendency to over-estimate the likelihood of rare events is
more prevalent.
To summarize the arguments related to the psychological effect of the attacks are
expected to reduce founding after the attacks. There is reason to believe the effect will be
widespread, but greatest initially closer to lower Manhattan. It is expected that the effect of fear
will decrease with time in locations closer to the epicenter, and persist longer farther away,
where there are fewer mechanisms for coping, and greater over-estimation of the likelihood of
more attacks.
Combining the Material and Psychological Effects To Predict Founding Rates
Because the effects of material disruption and psychological effects are present simultaneously,
our prediction for founding rates must consider both simultaneously. Fortunately, both the
material and fear arguments suggest similar temporal and spatial patterns of founding rates.
Both lines of argument suggest that foundings will decrease after the attacks, and that the
decrease will be greatest close to Manhattan. Both arguments also suggest a post-attack recovery
that is quicker close to Manhattan and eventually reaches a level of business founding higher
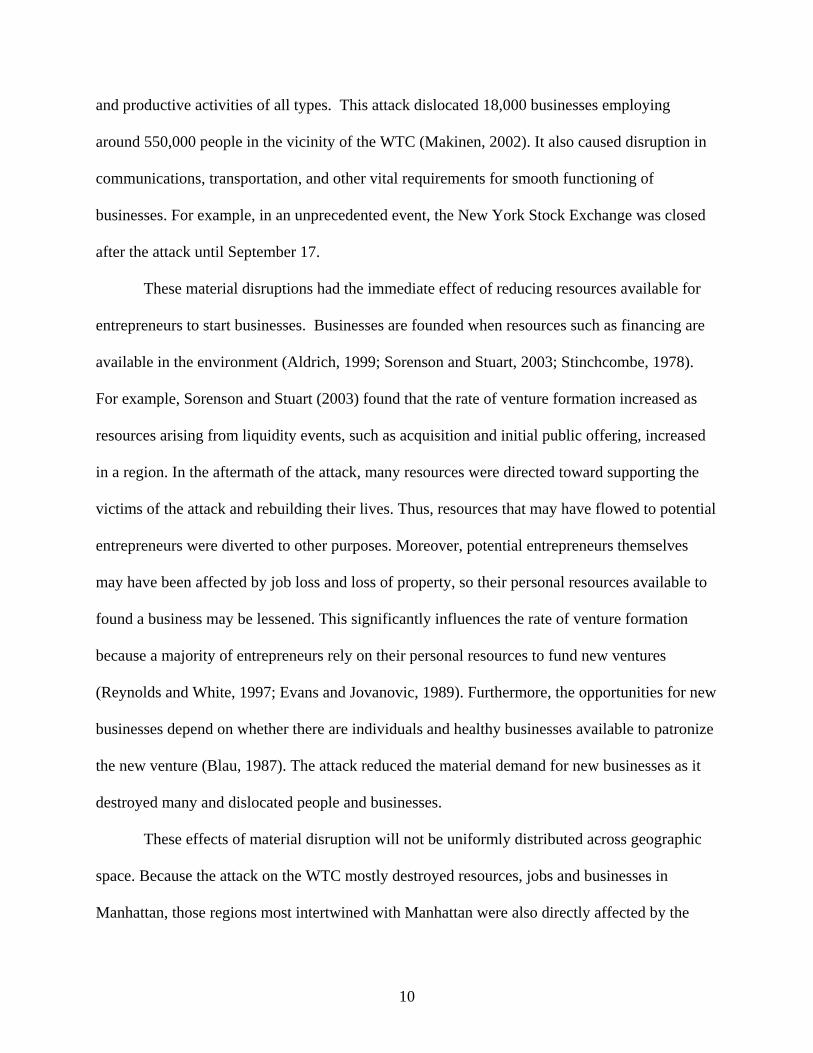
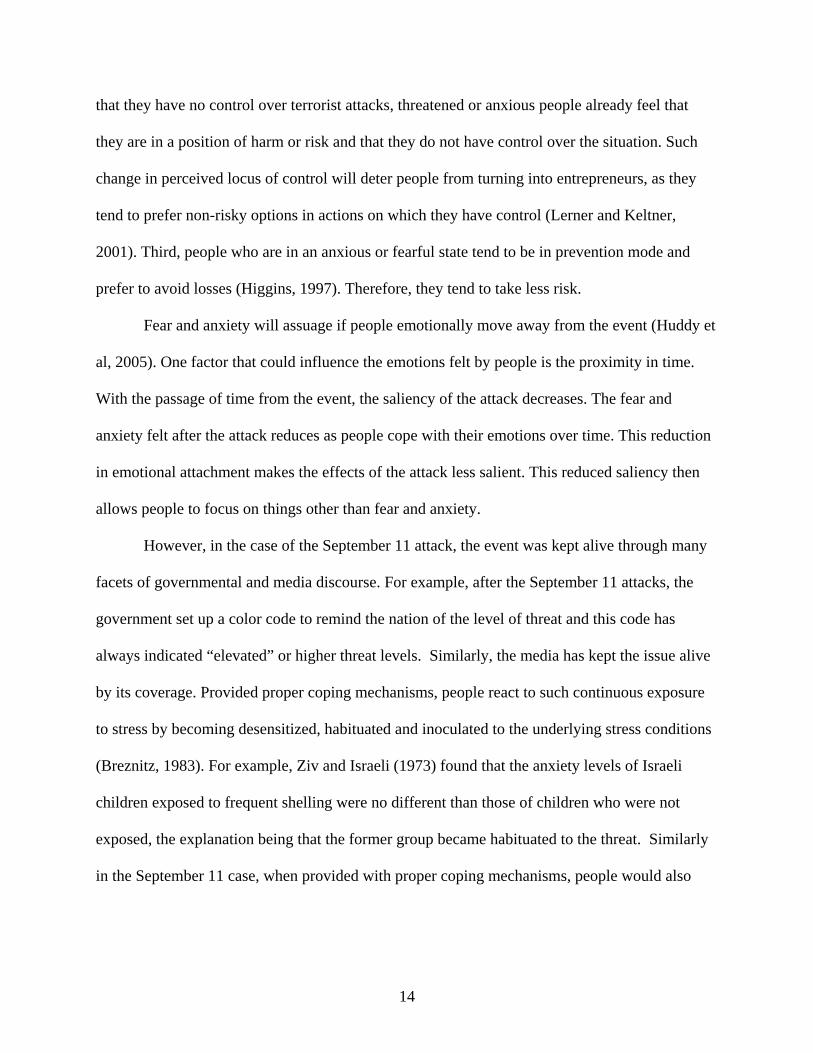
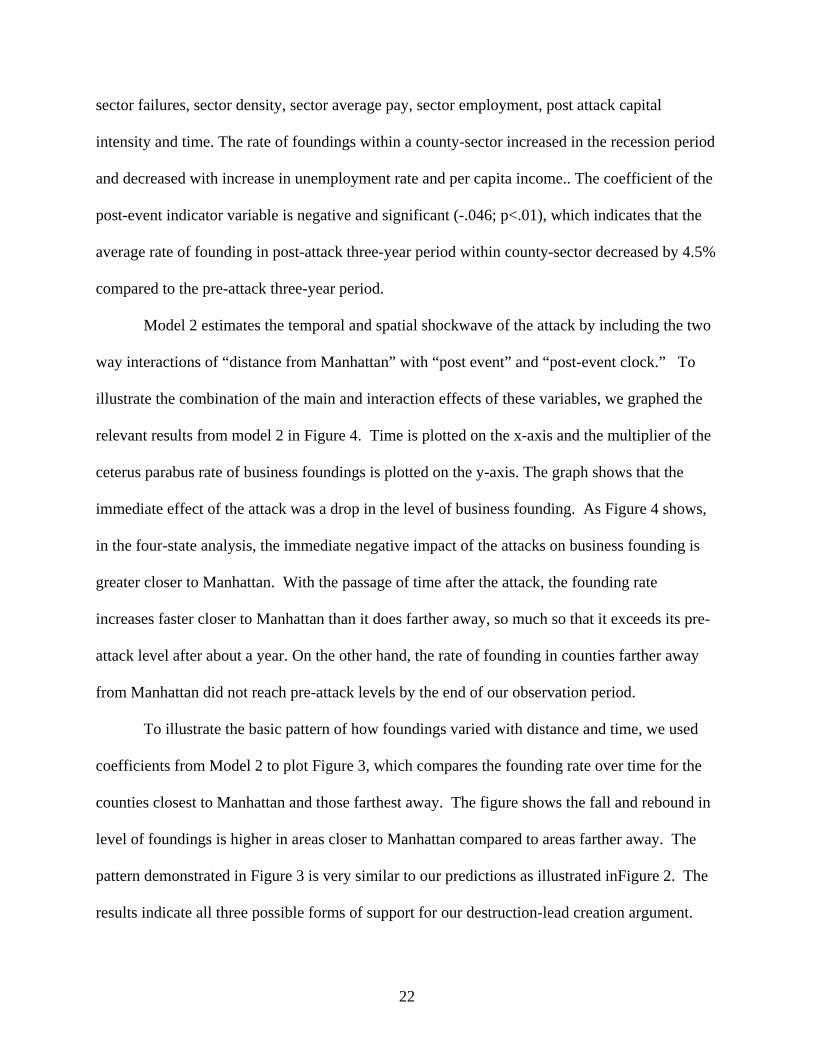
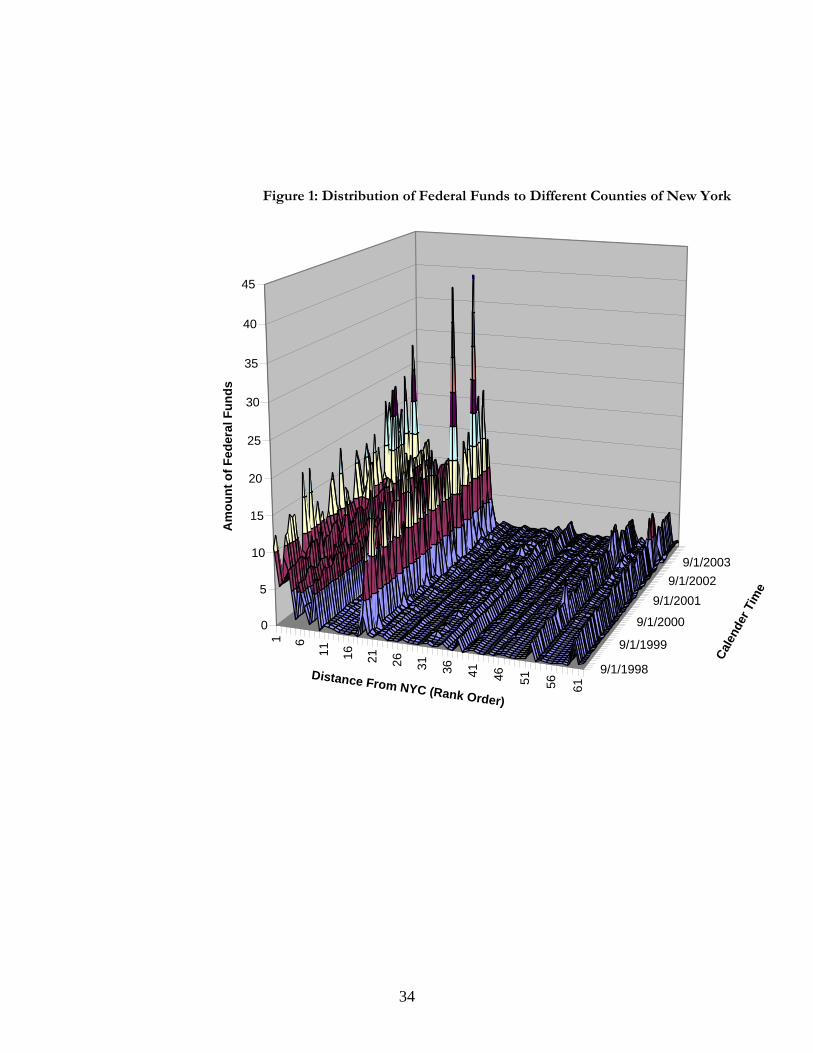
than pre-attack level. Figure 2 illustrates the pattern our arguments predict. Calendar time is on
the x-axis and the multiplier rate of the founding rate on the y-axis. The effect of the attack is
shown to be most negative in the area immediately around Manhattan, but also rebounds faster
there due to creative destruction.
17
Evidence of destruction-lead creation appears in three ways in Figure 2. First, the
territory close to Manhattan (most subject to destruction) could experience a steeper positive
trajectory of post-attack business founding (the slope of line segment B is steeper than that of
line segment C). This comparison is closest to Olson’s (1982) comparison between France and
Great Britain. Second, the business founding rate close to Manhattan could eventually exceed its
point at the time of attacks (line segment B eventually exceeds A*). This indicates that the
entrepreneurial system in the area most subject to attack exceeded its pre-attack level. Third
would be to compare at the rates of growth in the founding rate pre- and post-attack, specifically
whether line segment B had a greater slope than line segment A. This comparison requires a
tenuous assumption, that the pre-attack growth rate would have continued on its trajectory into
the future.
Just as importantly, it is fully possible that the actual results might vary from Figure 2 in
ways that disconfirm our arguments. Most obviously, if foundings did not decrease immediately
after September 11, or did not subsequently reach their pre-attack levels, it would indicate that
our argument was fundamentally wrong. Also, if the post-attack growth in the founding rate was
greater farther from Manhattan, it would indicate that recovery process were impeded where the
destruction was greater, again counter to our claim that exogenous destruction clears the path of
entrepreneurial progress. Either of these patterns could occur, for example, if the destruction
wrought by the attack caused a permanent decrease in economic activity, as might be predicted
by multiple-equilibria theories of the location of economic activity (Davis and Weinstein, 2008).
RESEARCH METHODS
Sample, Dependent Variables and Analytic Technique
18
To examine the above arguments we rely on annual data of new business foundings in each of
the counties of New York, New Jersey, Connecticut and Pennsylvania, as the economic gravity
of New York City includes the neighboring states of New Jersey, Connecticut and Pennsylvania.
We collected annual data on the number of foundings in each county of thesestates for each of 19
industrial sectors for the years 1998-2003. Each observations in our data represents the number
of businesses founded in a sector in a county in a year. Because each annual observation covers
period from April of one year to March of the next, our data cover three years before , one that
spans the attack and two that follow it. Detailed descriptions of operationalization and data
sources of our variables appear in Table 1.
Founding tallies are counts of events over a discrete period of a year. Poisson regression
is potentially suitable to analyze these measures (Hausman, Hall, and Zriliches, 1984):
Pr(Yi=yi) = !
)exp(i
ii
Y
Yiλλ−
where λi represents the mean and the variance of the event count and Yi is the count of new
venture formations in county-sector “i”. Poisson regression estimates λi as a function of βjXij,
where X is the data vector for the j variables and β is the associated vector of regression
coefficients:
λi = exp(∑ ijjXβ )
Poisson regression models rely on an assumption that the conditional mean is equal to
variance, which does not hold in our data. Therefore, we used negative binomial regression to
account for over-dispersion (Cameron and Trivedi, 1998). Another issue with these analyses is
that there are multiple observations for each county and sector. To account for unobserved
heterogeneity, we employ two sets of fixed-effects, one for counties and one for sectors. Given
19
that the standard packages estimate only conditional fixed-effect models (Hausman, Hall, and
Griliches, 1984), we include an indicator variable for each county and sector in the regression
equation to capture the real fixed-effects of each county (Allison and Waterman, 2004).1
Independent Variables
To test the arguments regarding the temporal and spatial pattern of business founding as affected
by the attack, we used an indicator variable, post event, as well as the distance of the focal
country from Manhattan. We interact these variables and a post-event time clock which is zero
for April 2001 – March 2002 observations, and increases by one in each subsequent year.
Control Variables
Several factors that are beyond the theoretical scope of this paper may influence the rate of
formation of new businesses in a geographic location. We made a particular effort to control for
these influences so that our post-event clock and distance variables would represent the impact of
the attacks, and not other correlates of the business founding rate. We include several county-
sector-level control variables. We include a measure of the number of business failures in each
sector, which may represent the possibility to recycle organizational resources (Schumpeter,
1942; Delacroix, Swaminathan and Solt, 1989). And because the density (total number) of
existing businesses in each sector has implications for availability of resources we included this
variable as a control (Hannan and Freeman, 1989; Carroll and Hannan, 2000). To capture the
1 The advantage of conditional fixed-effect models is that they estimate the coefficients even for time-invariant variables. As a robustness test, we also present results with conditional negative binomial models. Additional robustness analysis using the log of the count variable as a dependent variable employing ordinary least squares regression with fixed-effects for counties yielded similar results.
20
significance of the sector to the local economy, we also control for the average pay and
employment in each county-sector. We also include the capital intensity of each sector.
We include a large number of variables that are at the county level. We included labor
force, that is, the number of people qualified to work in a county, to reflect a source of
productive inputs and consumer demand (Stuart and Sorenson, 2003). Further, we included the
unemployment rate in the county to reflect the spare labor force that is available. We also include
the total number of businesses in each county to capture its economic activity.
We also included the proportion of at least bachelor-level educated population within the
county to capture the education level. And, we measure the percentage of votes in the county for
Republican candidates in the mose recent Presidential election to reflect the possibility that
political leanings may influence the entrepreneurial response to terrorism.
We used four time-invariant variables to capture elements of a county’s geography that
may affect founding but are not captured by our predictor variable of distance to Manhattan.2
These included whether the county was contiguous with Manhattan, whether it was the capital
county of its state, the area in square miles, and a count of the number of cities in the county.
We also included a number of direct measures of the resources to found businesses
ineach county. These include average per capita income in the county, as well as the flow of
initial public offering (IPO) and venture capital (VC) funds to the county. We also included the
bank density, as the total number of bank branches in the county, and the average savings in the
banks per person in each county. We also included grants from the federal government to the
county. Since we also consider the issue of fear arising from the terrorist attack, we included a
measure, suicide rate, to capture the psychological state of despondency in each county.
2 These variables are dropped from the unconditional negative binomial models with indicator variables for counties but are estimated in the conditional fixed-effect models.
21
Additionally, we included an indicator variable for whether the economy was in
recession. Finally, we include for each county an annual measure of the average capital intensity
of business foundings, to check whether the pattern of foundings in terms of requisite capital
changed after the attack.
In the analysis reported we excluded Manhattan to avoid questions about the necessity to
replace businesses that were directly destroyed by the attacks. The results of supplementary
analyses that included Manhattan were comparable, and we discuss them in the section below on
robustness checks.
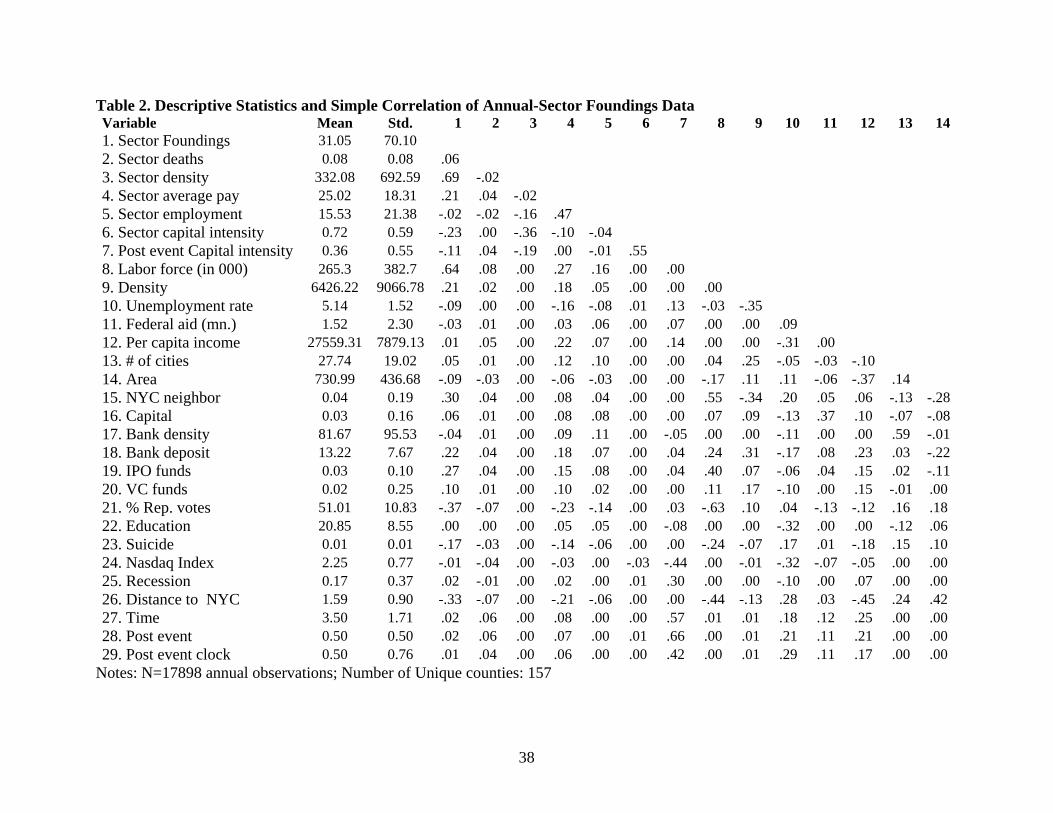
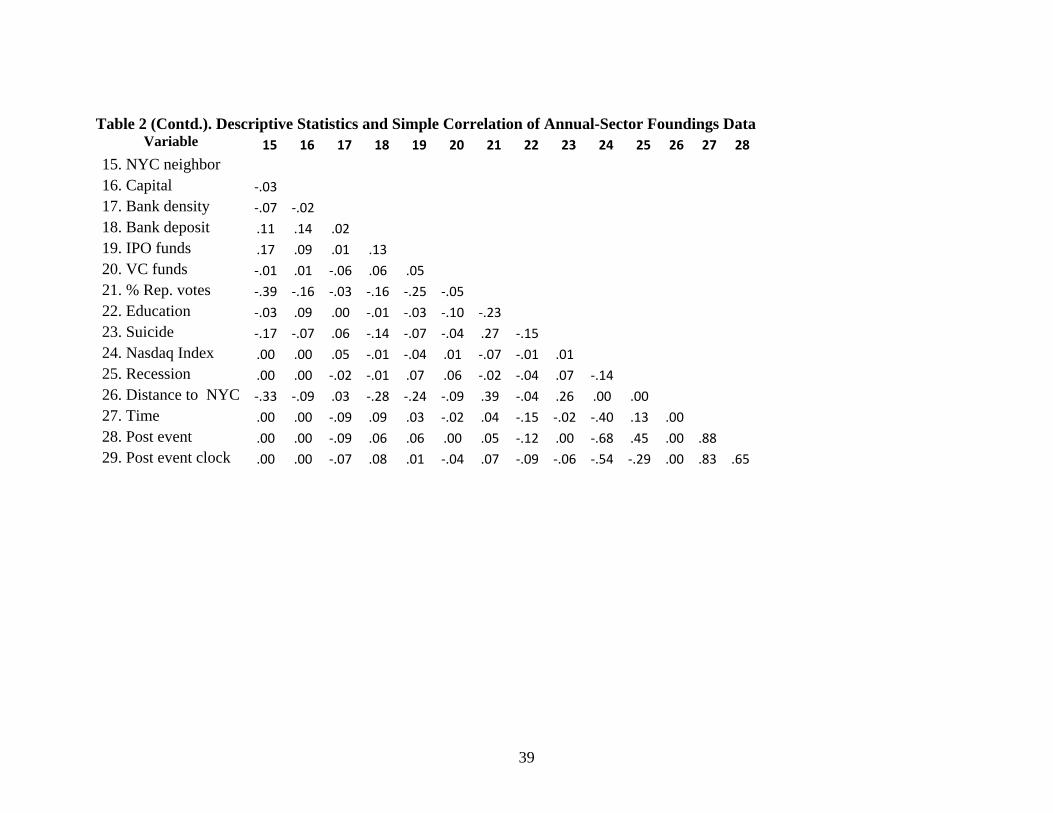
Since the correlations among sector density, total county density, bank density, labor
force, federal aid, and per capita income were high, we orthogonalized these variables using a
modified Gramm-Schmidt procedure (Golub and Van Loan, 1989) implemented in Stata. This
procedure removes high correlations between the specified variables without affecting
correlation of these variables with other variables in the data. The descriptive statistics of the
original variables and simple correlations among the transformed variables for the data excluding
Manhattan observations are presented in Table 2.
RESULTS
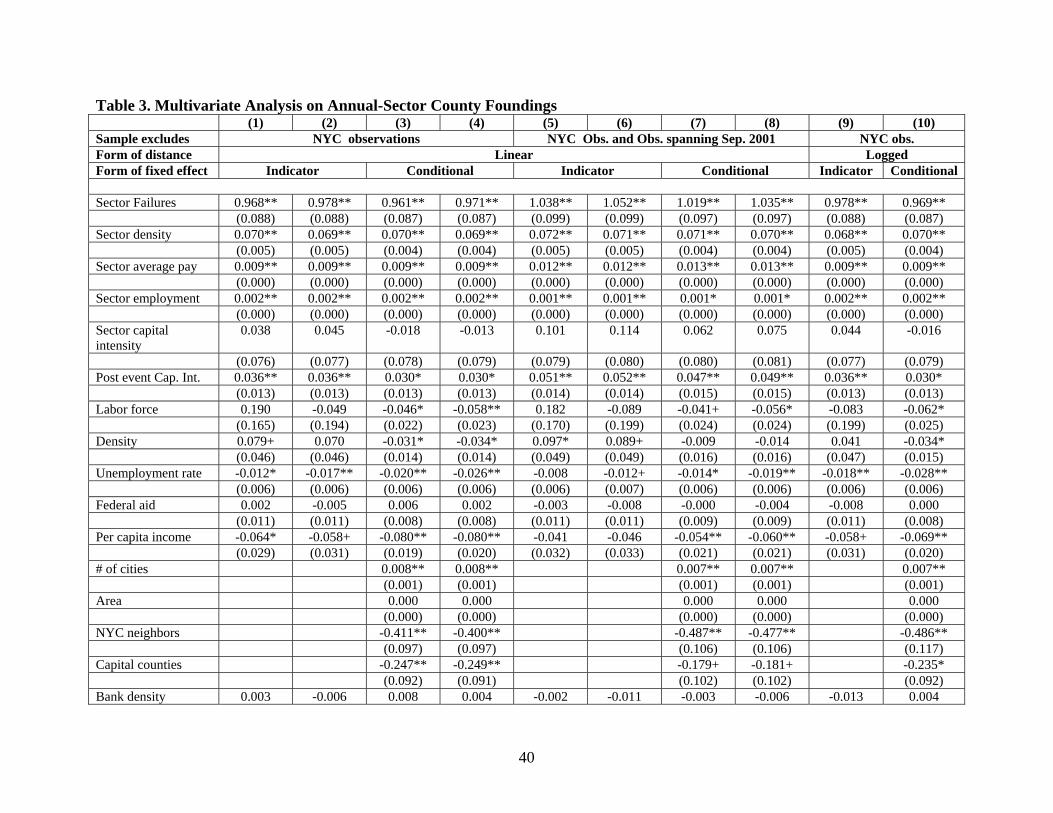
The results of the fixed-effect negative binomial regressions of monthly foundings in
each county-sector excluding Manhattan are presented in models 1 and 2 of Table 3. The results
of the model that includes all control variables along with “post event” variable are presented in
model 1. These results show that the rate of foundings within a county increased with prior
22
sector failures, sector density, sector average pay, sector employment, post attack capital
intensity and time. The rate of foundings within a county-sector increased in the recession period
and decreased with increase in unemployment rate and per capita income.. The coefficient of the
post-event indicator variable is negative and significant (-.046; p<.01), which indicates that the
average rate of founding in post-attack three-year period within county-sector decreased by 4.5%
compared to the pre-attack three-year period.
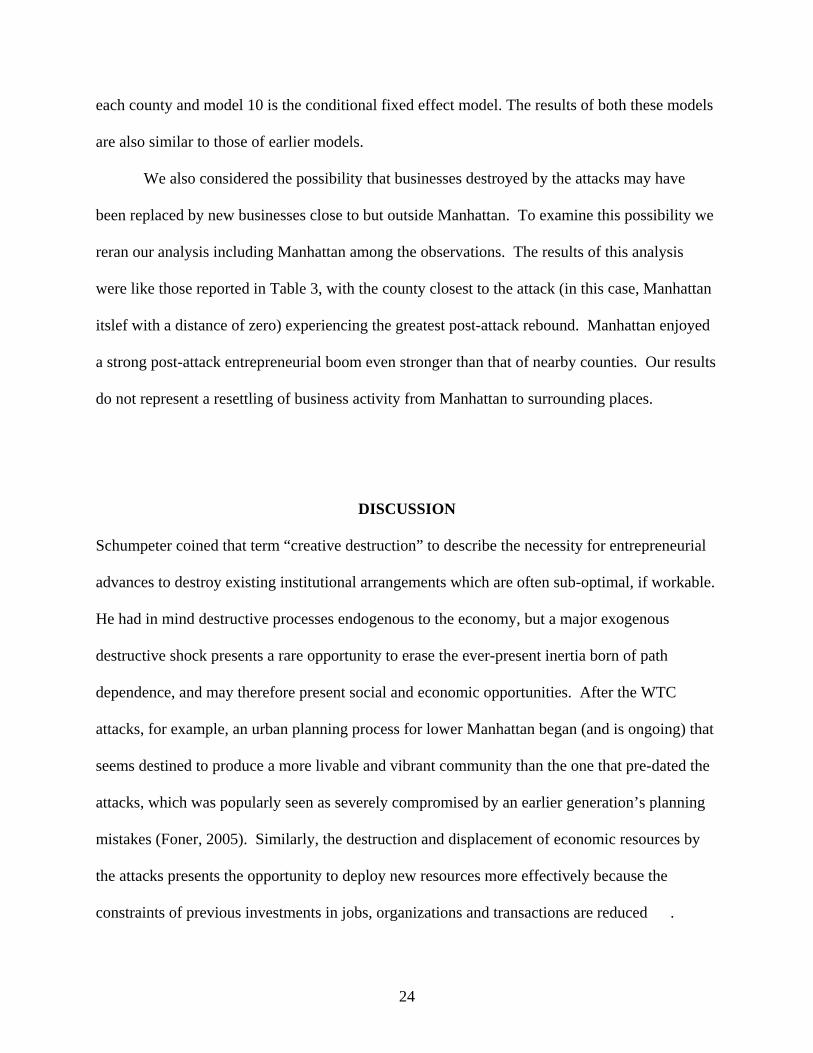
Model 2 estimates the temporal and spatial shockwave of the attack by including the two
way interactions of “distance from Manhattan” with “post event” and “post-event clock.” To
illustrate the combination of the main and interaction effects of these variables, we graphed the
relevant results from model 2 in Figure 4. Time is plotted on the x-axis and the multiplier of the
ceterus parabus rate of business foundings is plotted on the y-axis. The graph shows that the
immediate effect of the attack was a drop in the level of business founding. As Figure 4 shows,
in the four-state analysis, the immediate negative impact of the attacks on business founding is
greater closer to Manhattan. With the passage of time after the attack, the founding rate
increases faster closer to Manhattan than it does farther away, so much so that it exceeds its pre-
attack level after about a year. On the other hand, the rate of founding in counties farther away
from Manhattan did not reach pre-attack levels by the end of our observation period.
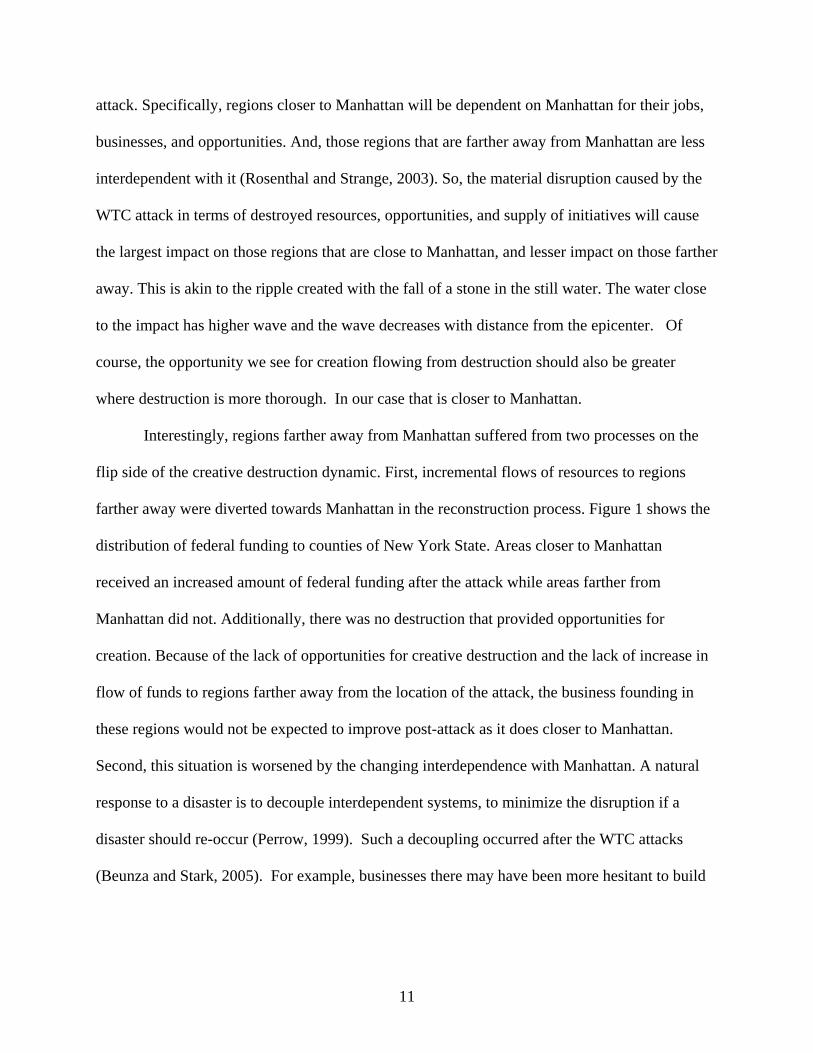
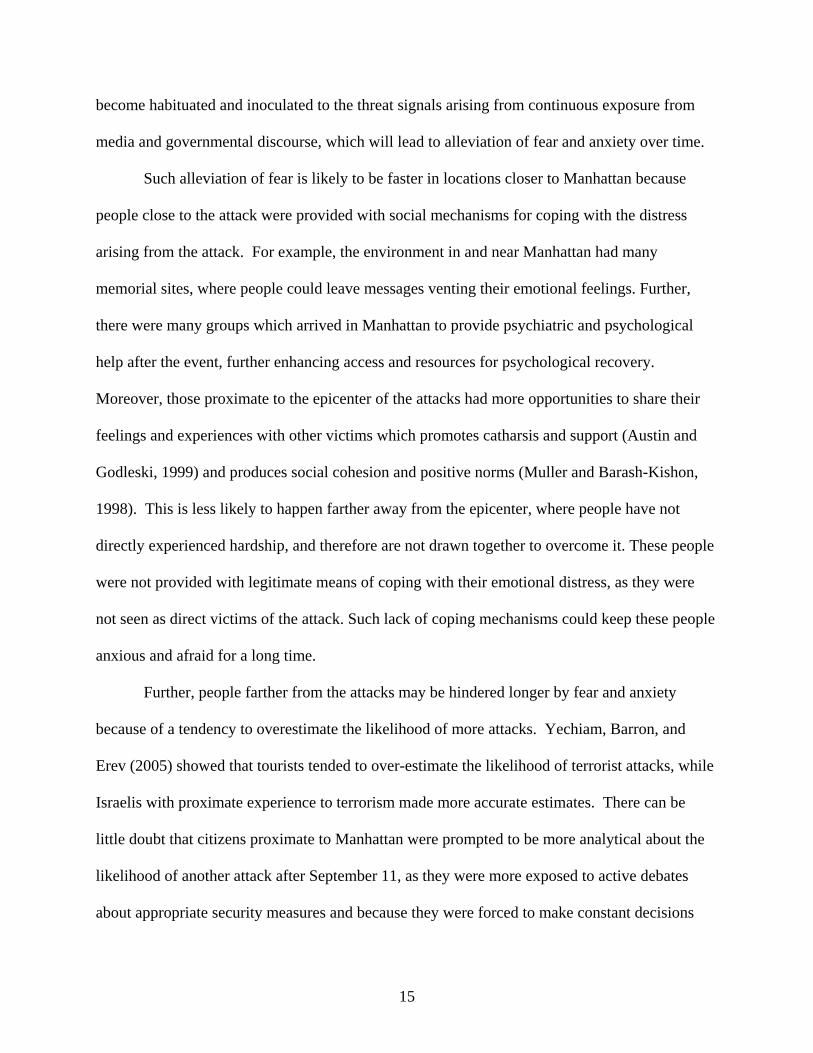
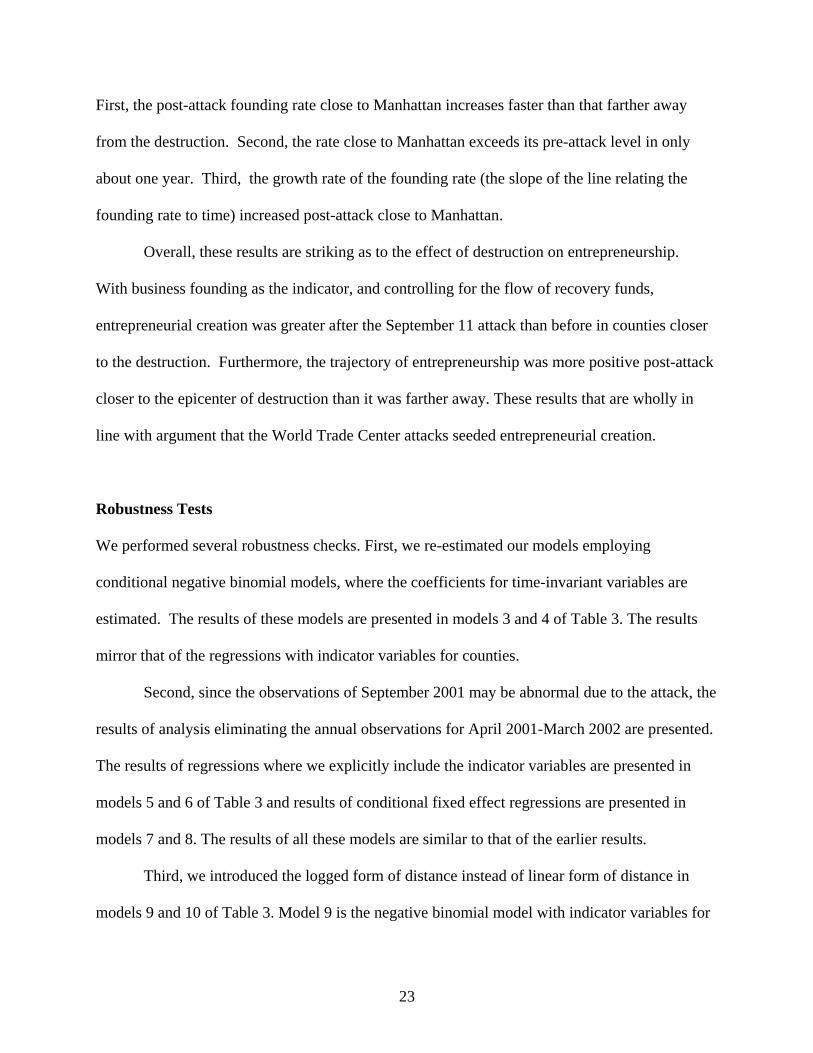
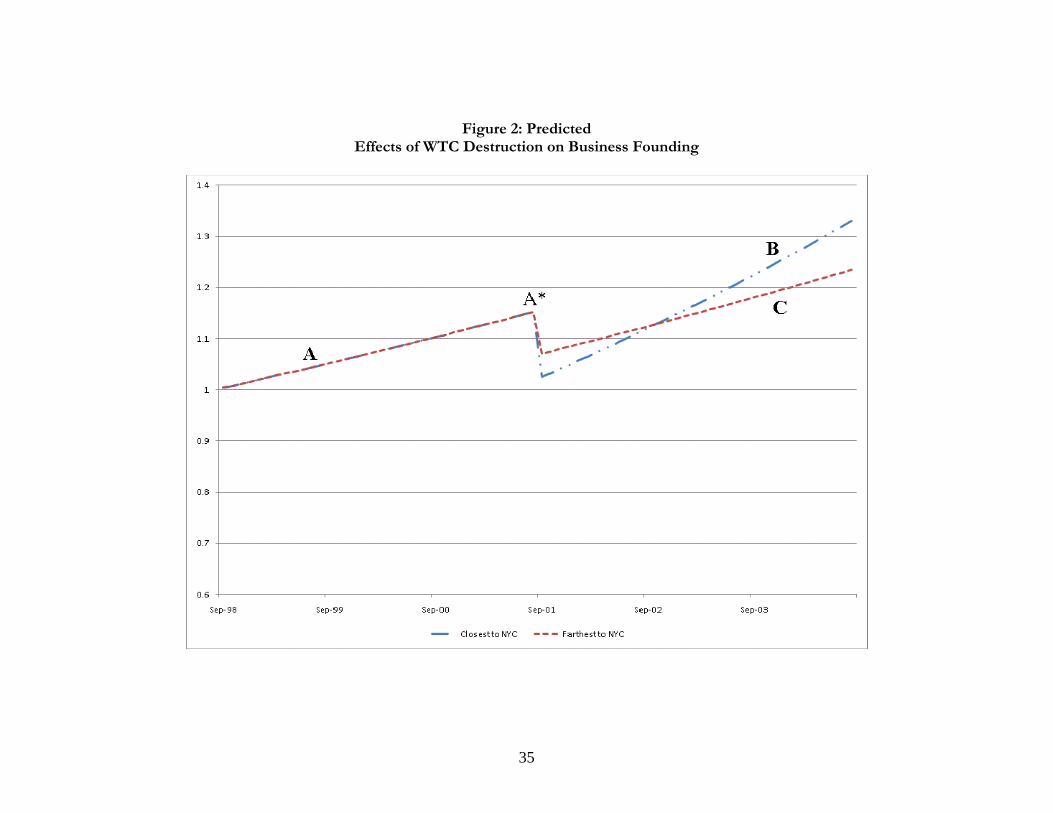
To illustrate the basic pattern of how foundings varied with distance and time, we used
coefficients from Model 2 to plot Figure 3, which compares the founding rate over time for the
counties closest to Manhattan and those farthest away. The figure shows the fall and rebound in
level of foundings is higher in areas closer to Manhattan compared to areas farther away. The
pattern demonstrated in Figure 3 is very similar to our predictions as illustrated inFigure 2. The
results indicate all three possible forms of support for our destruction-lead creation argument.
23
First, the post-attack founding rate close to Manhattan increases faster than that farther away
from the destruction. Second, the rate close to Manhattan exceeds its pre-attack level in only
about one year. Third, the growth rate of the founding rate (the slope of the line relating the
founding rate to time) increased post-attack close to Manhattan.
Overall, these results are striking as to the effect of destruction on entrepreneurship.
With business founding as the indicator, and controlling for the flow of recovery funds,
entrepreneurial creation was greater after the September 11 attack than before in counties closer
to the destruction. Furthermore, the trajectory of entrepreneurship was more positive post-attack
closer to the epicenter of destruction than it was farther away. These results that are wholly in
line with argument that the World Trade Center attacks seeded entrepreneurial creation.
Robustness Tests
We performed several robustness checks. First, we re-estimated our models employing
conditional negative binomial models, where the coefficients for time-invariant variables are
estimated. The results of these models are presented in models 3 and 4 of Table 3. The results
mirror that of the regressions with indicator variables for counties.
Second, since the observations of September 2001 may be abnormal due to the attack, the
results of analysis eliminating the annual observations for April 2001-March 2002 are presented.
The results of regressions where we explicitly include the indicator variables are presented in
models 5 and 6 of Table 3 and results of conditional fixed effect regressions are presented in
models 7 and 8. The results of all these models are similar to that of the earlier results.
Third, we introduced the logged form of distance instead of linear form of distance in
models 9 and 10 of Table 3. Model 9 is the negative binomial model with indicator variables for
24
each county and model 10 is the conditional fixed effect model. The results of both these models
are also similar to those of earlier models.
We also considered the possibility that businesses destroyed by the attacks may have
been replaced by new businesses close to but outside Manhattan. To examine this possibility we
reran our analysis including Manhattan among the observations. The results of this analysis
were like those reported in Table 3, with the county closest to the attack (in this case, Manhattan
itslef with a distance of zero) experiencing the greatest post-attack rebound. Manhattan enjoyed
a strong post-attack entrepreneurial boom even stronger than that of nearby counties. Our results
do not represent a resettling of business activity from Manhattan to surrounding places.
DISCUSSION
Schumpeter coined that term “creative destruction” to describe the necessity for entrepreneurial
advances to destroy existing institutional arrangements which are often sub-optimal, if workable.
He had in mind destructive processes endogenous to the economy, but a major exogenous
destructive shock presents a rare opportunity to erase the ever-present inertia born of path
dependence, and may therefore present social and economic opportunities. After the WTC
attacks, for example, an urban planning process for lower Manhattan began (and is ongoing) that
seems destined to produce a more livable and vibrant community than the one that pre-dated the
attacks, which was popularly seen as severely compromised by an earlier generation’s planning
mistakes (Foner, 2005). Similarly, the destruction and displacement of economic resources by
the attacks presents the opportunity to deploy new resources more effectively because the
constraints of previous investments in jobs, organizations and transactions are reduced .
25
This evidence prompts a rethinking both of the phenomenon of entrepreneurship, and of
public policies that may promote it. Of course, we think that the destruction-lead creation that
we document occurs in other contexts. For example, Rosen (1986) history of great urban fires
attributes to them a stimulating effect for the development of important U.S. cities. More
recently, the U.S. Secretary of Education Arne Duncan observed that “the best thing that
happened to the education system in New Orleans was Hurricane Katrina.” Duncan’s
explanation of the creative effect of the hurricane is in line with our argument, specifically that it
swept away an entrenched education system that was itself a disaster. Our evidence and these
examples suggest that explaining the incidence of entrepreneurship and economic creation of all
forms requires attention to the macro-system of inertia. Terrorist attacks and natural disasters are
rare but significant parts of this system and deserve more theoretical and empirical attention.
In the policy realm, while we are not prepared at this point to argue that disasters should
be engineered as part of economic development, the evidence here suggests at the least a new
perspective on the public response to disaster. If societies aspired to improvement, rather than
recovery, after disasters, they would act differently. To take another contemporary example,
consider the response to the current financial crisis. Some commentators and legislators have
argued that protecting every job should be a policy goal in this crisis (Koller, 2010). Yet this
approach is at odds with empirical evidence that job losses during recessions actually spur
subsequent economic growth (Cabballero and Hammour, 1996). The right policy approach to
protection from and the occurrence of disasters depends on an accurate and comprehensive
understanding of the implications of destruction. We don’t claim to present a comprehensive
theory of destruction in this paper, but we do move toward that goal by highlighting an under-
emphasized and positive result, the removal of a sub-optimal status-quo.
26
Our results also suggest that theories of entrepreneurship should attend to macro
influences on the psychology of potential entrepreneurs. Entrepreneurship requires both
opportunity and entrepreneurs willing to act. The opening of opportunity following destruction
helps explain why entrepreneurship in the gravity of Manhattan should be vibrant shortly after
the attacks than it was before, but it does not fully account for the phenomenon. It must also be
true that the pool willing entrepreneurs in this area also increased after the attacks, an indication
of a psychological recovery.
In counties farther away from Manhattan, the decline immediately after the attack and
slow rebound in regions farthest from Manhattan can also be construed as evidence of
psychological effect of the terrorist attack on the pool of willing entrepreneurs. These furthest
regions are beyond the economic pull of Manhattan’s gravity, so they would not benefit from the
creative destruction that made structural improvements in the opportunities for entrepreneurship
closer to Manhattan. But the lack of economic interdependence to Manhattan makes it all the
more notable that the negative impact of the attacks persisted in these areas for so long. This
must be attributed to a psychological effect of the attacks.
The evidence that the pool of willing entrepreneurs rebounded so quickly in areas closer
to Manhattan compared to farther places also reminds of the evidence that those with direct
experience with terrorism are less disabled by the fear of it than those who are inexperienced
(e.g., Ziv and Israeli, 1973; Yechiam, Barron and Erev, 2005). Being subject to the attacks could
produce social cohesion and positive norms. Apparently, this is less likely farther from the
attacks, where people have not directly experienced hardship, and therefore are not drawn
together to overcome it. Of course, there is plenty of folk evidence that the attacks produced
cohesion and defiance among New Yorkers. This is also supported by scientific evidence that
27
coercive acts by outsiders on a population can produce norms in the population for behavior that
is the opposite of what the coercers dictate (Heckathorn, 1990).
These findings also complement prior research that explores how the broader economic
context affects the pool of entrepreneurs. For example, Evans and Jovanovic (1989) found that
about 1.3% of the population was deterred from trying entrepreneurship in the presence of
liquidity constraints. Our paper can be considered as studying the effects of the cultural mood
arising from fear and anxiety to entrepreneurship. The fear and anxiety that arose from the
terrorist attack altered the pool of potential entrepreneurs by diverting cognitive attention of
individuals away from opportunity recognition, shifting the locus of control to external factors,
and placing people in the prevention mode. Because the mechanisms for coping with fear and
anxiety were not readily available for people farther away from Manhattan, these effects were
present for a considerably longer time in those regions. In contrast, several coping mechanisms
were available in regions closer to Manhattan, which ameliorated the fear and anxiety of people
much faster thereby increasing the pool of potential entrepreneurs quickly.
Analogous findings of differences in economic recovery of regions with variations in
coping mechanisms can also be found in economic geography literature, For example, Safford’s
(2005) study comparing the reactions to and recovery from economic recession of Allentown and
Youngstown found that Allentown was able to recover better than Youngstown because
Allentown’s key economic leaders’ concentrated civic participation in a few prominent
organizations allowed the concerns of the community to be deliberated and responded to while
the Youngstown’s key economic leaders’ diffused civic participation in large number of
organizations did not allow for addressing their concerns.
28
Our study also has implications for entrepreneurship literature, which has two broad
frameworks of entrepreneurship. The first model deals with the system level aspect and
emphasizes the entrepreneurial opportunities (Kirzner, 1973; Schumpeter, 1934; Shane and
Venkataraman, 2000). This stream assumes that existing novel economic opportunities will be
pursued, and this research does not specifically examine who pursues those opportunities. The
problem in this stream is that if opportunities are not pursued, they are considered to not exist.
The second model emphasizes individual level activity and focuses on differences between
individuals who pursue entrepreneurship and those who don’t (Shane, 2000; Shaver and Scott,
1991). This stream seldom pays attention to the system level opportunities and considers them as
given. Our model of entrepreneurship combines aspects of both these models. The material
implications part of the theory deals with the opportunities that are available to be pursued within
each county. It suggests that after the attack, such opportunities were widely available in regions
around Manhattan because the existing path-dependent institutions were destroyed. The
psychological implications part of the theory deals with the supply of entrepreneurs at the system
level. It suggests that the fear and anxiety that arose because of the terrorist attack alters the pool
of potential entrepreneurs. Further, coping mechanisms available in regions closer to Manhattan
resulted in quick recovery of the pool of potential entrepreneurs, but non-availability of such
mechanisms in regions farther away from Manhattan lead to slower rebound of the pool of
potential entrepreneurs.
While our emphasis has been on the effect of “general destruction” on entrepreneurship,
our results say something about the impact on society of the specific form of destruction we
analyze, terrorism. Most notable is the evidence that so much of both the initial post-attack
decrease in entrepreneurial activity, and its subsequent recovery, occurred through psychological
29
mechanisms, the production and spread of fear and despair. The production of terror is of course
the proximate goal of terrorism (Friedland and Merari, 1985; Long, 1990). Understanding
terrorism therefore requires documenting the indirect effects of terrorist acts. Oddly, while
sociologists have examined the production of fear post September 11, focus has been on fear
produced by Western governments and media, and not the fear produced by the terrorism itself
(Furedi, 2005; Giddens, 2005). We recognize that such institutions play a role in the diffusion of
fear, but also see that actual terrorist acts generate fear, and that terrorism-related fear is not
wholly the product of media and governmental discourse.
In conclusion we return to the question around which we organized this paper. Is there
evidence that external destructive event unhinged path-dependent processes and lead to creative
processes? The answer is decisively yes in the area where such an effect might be most expected.
Within the economic gravity of lower Manhattan, business founding rebounded after a short
post-attack depression and reached levels higher than pre-attack levels. This is an outcome of
the combined effects of both the material as well as psychological resilience. On the other hand,
a slow recovery was apparent farther away from Manhattan, indicating that psychological
response to terrorism may be less positive the less direct the experience. The implication is that
research on creative destruction also needs to pay attention to seldom considered non-material
aspects.
30
References Abernathy, William J., Kim B. Clark 1985. “Innovation: Mapping the winds of creative
destruction.” Research Policy, 3-22. Aldrich, H. 1999. Organizations Evolving. London: Sage. Arabsheibani, G., D. de Meza, J. Maloney, and B. Pearson. 2000. “And a vision appeared to
them of a great profit: evidence of self-deception among the self-employed,” Economic Letters, 67: 35-41.
Austin, L.S. and Godleski, L.S. 1999. Theapeutic approaches for survivors of disaster. Psychiatric Clinics of North America, 22(4): 897-910.
Baker, M., R. S. Ruback, J. Wurgler (2004). “Behavioral corporate finance: A survey.” NBER Working Paper, 10863.
Barnett, W. P. 1997. The dynamics of competitive intensity. Administrative Science Quarterly, 42(1): 128-160.
Bat-Zion, N. and R. Levy_shiff. 1993. Children in war: Stress and coping reactions under the threat of Scud missile attacks and the effect of proximity. Leavitt, L. A. and N. A. Fox (eds.) The Pyschological Effects of War and Violence on Children. Hillsdale, NJ: Lawrence Erlabum Associates, Publishers.
Blau, D. M. 1987. “A time series analysis of self employment in the United States,” Journal of Political Economy, 95(3): 445-467.
Breznitz, S. (Ed.) 1983. The Denial of Stress. New York: International Universities Press. Brockhaus, R. H. Sr. 1980. Risk taking propensity of entrepreneurs. Academy of Management
Journal, 23: 509-520. Brockner, J., S. Grover, T. F. Reed, R. L. DeWitt, and M. O’Malley. 1987. “Survivors’ reactions
to layoffs: We get by with a little help for our friend,” Administrative Science Quarterly, 32: 536-541.
Beunza, David and David Stark. 2005. “Resolving Identities: Successive Crises in a Trading Room after 9/11.” In Nancy Foner, Wounded City: The Social Impact of 9/11. New York, Russell Sage Foundation Press, 2005, pp. 293-320.
Caballero, R. and Hammour, M. 1996. “On the timing and efficiency of creative destruction. Quarterly Journal of Economics, 111, 905-51.
Carroll, G. R. and M. T. Hannan. 2000. The Demography of Corporations and Industries. NJ: Princeton University Press.
David, Paul, A. 1985. CLIO and the economics of QWERTY. The American Economic Review, 7(2): 332-337.
Davis, Donald R. and David E. Weinstein. 2002. Bones, bombs, and break points: The geography of economic activity. The American Economic Review, 92(5): 1269-1289.
Davis , Donald R. and David E. Weinstein, 2008. "A Search For Multiple Equilibria In Urban Industrial Structure," Journal of Regional Science, 48(1), pages 29-65.
Delacroix, Jacques, Anand Swaminathan, and Michael E. Solt 1989 'Density dependence versus population dynamics: an ecological study of failings in the California wine industry'. American Sociological Review 54: 245-262.
31
Dohmen, T., A. Falk, D. Huffman and U. Sunde. 2006. “Seemingly Irrelevant Events Affect Economic Perceptions and Expectations: The FIFA World Cup 2006 as a Natural Experiment.” IZA Discussion Paper no. 2275.
Evans, D. S. and B. Jovanovich. 1989. “Estimates of a model of entrepreneurial choice under liquidity constraints,” Journal of Political Economy, 97(3): 657-674.
Evans, D. S. and L. Leighton. 1990. “Small business formation by unemployed and employed workers,” Small Business Economics, 2(4): 319-330.
Eysenck, M.W. (1997). Anxiety and Cognition: A Unified Theory. Hove, UK: Psychology Press Foner, N. (ed.). 2005. Wounded City: The Social Impact of 9/11. New York: Russell Sage. Friedland, N. and A. Merari. 1985. “The Psychological Impact of terrorism: A Double-Edged
Sword.” Political Psychology, 6: 591-604. Furedi, F. 2005. The Politics of Fear. Continuum Press: London. Giddens, A. 2005. “Scaring people may be the only way to avoid the risks of new-style
terrorism…” The Statesman. January, 10, 2005. Golub, G.H. and C. F. Van Loan. 1989. Matrix Computations. Baltimore: Johns Hopkins
University Press.
Hannan, M.T., and J. Freeman. 1989. Organizational Ecology. Cambridge, MA: Harvard University Press.
Hannan, M.T., G. R. Carroll, E. A. Dundon and J. C. Torres. 1995. Organizational evolution in a multinational context: Entries of automobile manufacturers in Belgium, Britain, France, Germany, and Italy. American Sociological Review 60: 509–528
Hausman, J. 1978. “Specification tests in econometrics.” Econometrica, 46: 1251-1271. Hausman, J., B. Hall, & Z. Griliches. 1984. “Econometric models for count data with an
application to the patents-R&D relationship.” Econometrica 52(4):909-938. Heckathorn, D. D. 1990. “Collective Sanctions and Compliance Norms: A Formal Theory of
Group-Mediated Control,” American Sociological Review, 55: 366-384. Higgins, E.T. (1997). “Beyond pleasure and pain.”American Psychologist,52,1280–1300. Higgins, E.T. (2002). “How self-regulation creates distinct values: The case of promotion and
prevention decision making.” Journal of Consumer Psychology, 12, 177–191. Hsiao, C. 1986. Analysis of Panel Data. Cambridge: Cambridge University Press.
Huddy, L., S. Feldman, C. Taber and G. Lahav. 2005. “Threat, Anxiety, andSupport of Antiterrorism Policies.” American Journal of Political Science 49: 593-608.
Iyengar, S., Peters, M.D. and D. R. Kinder. 1993. “Experimental demonstrations of the ‘not-so-minimal’ consequences of television news programs,” In D.R. Kinder & T.R. Palfrey (eds.), Experimental foundations of political science, Ann Arbor, MI: University of Michigan Press.
Kirzner, I. M. 1973. Competition and entrepreneurship. Chicago: University of Chicago Press. Klingman, A. 1995. Israeli children’s response to the stress of the Gulf War: A year later. School
Pyschology International, 16: 303-313. Koller, Frank, 2010. Spark. New York: PublicAffairs. Lerner, J. S. and D. Keltner. 2001. “Fear, Anger, and Risk.” Journal of Personality and Social
Psychology, 81(1): 146–59. Long, D. E. 1990. The Anatomy of Terrorism. New York: Free Press. MacLeod, A. K. and A. Byrne. 1996. “Anxiety, depression and the anticipation of future positive
and negative experiences.” Journal of Abnormal Psychology, 105, 286-289.
32
MacLeod, A. K., J. M. G. Williams, and D. A. Bekerian. 1991. “Worry is reasonable: The role of explanations in pessimism about future personal events.” Journal of Abnormal Psychology, 100, 478-486.
Makinen, G. 2002. “The economic effects of 9/11: A retrospective assessment.” Report for Congress, Congress Research Service.
Manove, M. 1997. “Entrepreneurs, optimism, and the competitive edge, Boston University: Working Paper.
Mathews, A. M. and C. MacLeod. 1986. “Discrimination of threat cues without awareness in anxiety states.” Journal of Abnormal Psychology,95, 131-138.
Mathews A. M. and C. MacLeod. 1994. “Cognitive approaches to emotion and emotional disorders.” Annual Review Psychology 45:25–50.
Muller, U., Barash-Kishon, R. 1998. Psychodynamic-supportive group therapy model for elderly Holocaust survivors. International Journal of Group Pyschotherapy, 48(4): 461-475.
Oberholzer-Gee, Felix and Victor Calanog. 2007. “The speed of new ideas: Trust, institutions and the diffusion of new ideas,” Harvard Business School working paper, 07-063.
Olson, Mancur. 1982. The rise and decline of nations: Economic growth, stagflation, and social rigidities. New Haven: Yale University Press.
Pennings, J. M. 1982. “Organizational birth frequencies: An empirical investigation.” Administrative Science Quarterly, 27: 120-144.
Perrow, C. 1999. Normal Accidents: Living With High-Risk Technologies. NJ: Princeton University Press.
Raghunathan, R., & M. T. Pham. 1999. “All negative moods are not equal: Motivational influences of anxiety and sadness on decision making.” Organizational Behavior and Human Decision Processes, 79, 56-77.
Rao, H. 1994. “The social construction of reputation: Certification contests, legitimation, and the survival of organizations in the American automobile industry: 1895-1912.” Strategic Management Journal (Winter, 1994) 15: 29-44.
Reynolds, P. D. and S. B. White. 1997. The Entrepreneurial Process: Economic Growth, Men, Women, and Minorities. Westport, CT: Quorum Books.
Ronen, T., Rahav, G., and N. Appel. 2003. Adolescent stress responses to a single acute stress and to continuous external stress: Terrorist attacks. Journal of Loss & Trauma, 8: 261-282.
Rosen, Christine M. 1986. The Limits of Power: Great Fires and the Process of City Growth in America. New York: Cambridge University Press.
Rosenthal, S. S. and W. C. Strange. 2003. “Geography, Industrial Organization, and Agglomeration,” Review of Economics and Statistics 85:2, 377-393.
Rubonis, A. V. and L. Bickman. 1991. Psychological impairment in the wake of disaster: The disaster-psychopathology relationship. Psychological Bulletin, 109(3): 384-399.
Safford, S. C. 2007. "Why the Garden Club Couldn't Save Youngstown: Social Networks and the Transformation of the Rust Belt," Harvard University Press
Schuster, M. A., B.D. Stein, L.H. Jaycox, R. L. Collins, G.N. Marshall, M. N. Elliott, A.J. Zhou, D.E. Kanouse, J. L. Morrison, and S. H. Berry. 2001. “A National Survey of Stress Reactions after The September 11, 2001 Terrorist Attacks.” New England Journal of Medicine, 345, 1507-1513.
Shane, S. 2000. Prior knowledge and the discovery of entrepreneurial opportunities. Organization Science, 11: 448-469.
33
Shane, S. and S. Venkataraman. 2000. The promise of entrepreneurship as a field of research. Academy of Management Review, 25: 217-226.
Shaver, K.G. and L. R. Scott. 1991. Person, process, choice: The psychology of new venture creation. Entrepreneurship Theory and Practice, 16(2): 23-45.
Sorenson, O. and Pino G. Audia 2000. "The social structure of entrepreneurial activity," American Journal of Sociology, 106, 424-461
Sorenson, O., and T. E. Stuart. 2001. “Syndication networks and the spatial distribution of venture capital financing.” American Journal of Sociology, 106: 1546-1588.
Stinchcombe, A. L. 1965. “Social Structure and Organizations.” In March, James G., Handbook of Organizations: 142-193. Chicago: Rand McNally.
Stuart, T. E. and O. Sorenson. 2003. “Liquidity events and the geographic distribution of entrepreneurial activity.” Adminsitrative Science Quarterly, 48(2): 172-202.
Schumpeter, J. A. 1942. The Process of Creative Destruction. London: Unwin. Shane, S. and S. Venkataraman 2000, 'The promise of entrepreneurship as a field of research'.
Academy of Management Review 25, 217-226 Swaminathan, Anand and James B. Wade. 2001. “Social Movement Theory and the evolution of
New Organizational Forms,” in C.B. Schoonhoven and E. Romanelli (eds) The Entrepreneurship Dynamic in Population Evolution, pp. 286-313: Stanford University Press.
Tripsas, Mary. 1997. Unraveling the process of creative destruction: Complementary assets and incumbent survival in the typesetter industry.” Strategic Management Journal, 119-142.
Tushman, M. L. and P. Anderson. 1986. Technological discontinuities and organizational environments. Adminsitrative Science Quarterly, 31(3): 439-465.
Vaughn, D. 1996. The Challenger Launch Decision. Chicago: University of Chicago Press. Yechiam, E., G. Barron, and I. Erev. 2005. “The role of personal experience in contributing to
different patterns of response to rare terrorist attacks.” Journal of Conflict Resolution , 49, 430-439.
Ziv, A., and R. Israeli. 1977. Effects of baombardment on the manifest of anxiety level of children living in kibbutzim. Journal of Consulting and Clinical Psychology, 40, 287-291.
34
1 6
11 16 21 26 31 36 41 46 51 56 61
9/1/1998
9/1/1999
9/1/2000
9/1/20019/1/2002
9/1/2003
0
5
10
15
20
25
30
35
40
45
Am
ount
of F
eder
al F
unds
Distance From NYC (Rank Order)Ca
lend
er T
ime
Figure 1: Distribution of Federal Funds to Different Counties of New York
35
Figure 2: Predicted Effects of WTC Destruction on Business Founding
36
Figure 3: Effects of WTC Attack on Foundings in Counties-Sectors of Four States

37
Table 1: Summary Description of Variables Variable Description Source of Data
1. Annual county-sector foundings
# of establishment in each county-sector from March to next March
U.S. Census Bureau’s Statistics on US Businesses
2. Sector failures # of business failures in the county in specific sector in prior period
U.S. Census Bureau
3. Sector density # of firms in specific sector in each county in the prior period
Census Bureau’s County Business Patterns
4. Sector employment # of people employed by the sector in the county in prior period
U.S. Census Bureau
5. Sector avg. pay Average amount of pay for employees in the sector in the county prior period
U.S. Census Bureau
6. Sector capital intensity Fixed assets/Sales Internal Revenue Service; Computed
7. Post Event Capital intensity
Sum of fixed assets/Sales of each sector weighted by number of foundings in that sector in the county
Internal Revenue Service; Computed
8. Labor force Total labor available in each county U.S. Department of Labor 9. Density # of firms in each county in the prior period Census Bureau’s County Business
Patterns 10. Unemployment % of unemployed people in each county U.S. Department of Labor 11. Federal aid Amount of money given by federal government to
the county in the prior period Federal Assistance Award Data System, U.S. Census Bureau
12. Per capital income Per capital income of county in the last period U.S. Census Bureau 13. # of cities/towns # of cities and towns in the county Statistical Abstract of NY 14. Area Area is square miles Statistical Abstract 15. Manhattan neighbors Neighboring counties of Manhattan=1; others=0 Computed 16. Capital county Coded as one if county is capital Computed 17. Bank density # of bank branches in the county Federal Reserve Bank 18. Bank deposits Average bank deposit/population Federal Reserve Bank 19. IPO funds Amount of IPO money raised by firms in the
county in the last period S.D.C. database
20. VC funds Amount of venture capital funds in the county in the last period
VentureX of S.D.C.
21. % republican Percentage of votes for republican presidential candidate (Intrapolated)
NY State Election Board
22. Education % of people educated at least at Bachelors level U.S. Department of Education 23. Suicide rate Percentage of suicides in county in prior period State Agencies 24.Recession March, 2001 to Nov., 2001=1; other periods=0 National Bureau of Economic
Research 25. Distance to Manhattan
Distance between population centriods of each county
U.S. Census Bureau; Computed
26. Time Linear clock Computed 27. Post event If time> Sep., 2001 then post-event=1; else 0; Computed 28. Post event clock 0 for observations before Oct. 2001; is a linear
clock starting with 1 from Oct. 2001. Computed
38
Table 2. Descriptive Statistics and Simple Correlation of Annual-Sector Foundings Data Variable Mean Std. 1 2 3 4 5 6 7 8 9 10 11 12 13 141. Sector Foundings 31.05 70.10 2. Sector deaths 0.08 0.08 .06 3. Sector density 332.08 692.59 .69 -.02 4. Sector average pay 25.02 18.31 .21 .04 -.02 5. Sector employment 15.53 21.38 -.02 -.02 -.16 .47 6. Sector capital intensity 0.72 0.59 -.23 .00 -.36 -.10 -.04 7. Post event Capital intensity 0.36 0.55 -.11 .04 -.19 .00 -.01 .55 8. Labor force (in 000) 265.3 382.7 .64 .08 .00 .27 .16 .00 .00 9. Density 6426.22 9066.78 .21 .02 .00 .18 .05 .00 .00 .00 10. Unemployment rate 5.14 1.52 -.09 .00 .00 -.16 -.08 .01 .13 -.03 -.35 11. Federal aid (mn.) 1.52 2.30 -.03 .01 .00 .03 .06 .00 .07 .00 .00 .09 12. Per capita income 27559.31 7879.13 .01 .05 .00 .22 .07 .00 .14 .00 .00 -.31 .00 13. # of cities 27.74 19.02 .05 .01 .00 .12 .10 .00 .00 .04 .25 -.05 -.03 -.10 14. Area 730.99 436.68 -.09 -.03 .00 -.06 -.03 .00 .00 -.17 .11 .11 -.06 -.37 .14 15. NYC neighbor 0.04 0.19 .30 .04 .00 .08 .04 .00 .00 .55 -.34 .20 .05 .06 -.13 -.2816. Capital 0.03 0.16 .06 .01 .00 .08 .08 .00 .00 .07 .09 -.13 .37 .10 -.07 -.0817. Bank density 81.67 95.53 -.04 .01 .00 .09 .11 .00 -.05 .00 .00 -.11 .00 .00 .59 -.0118. Bank deposit 13.22 7.67 .22 .04 .00 .18 .07 .00 .04 .24 .31 -.17 .08 .23 .03 -.2219. IPO funds 0.03 0.10 .27 .04 .00 .15 .08 .00 .04 .40 .07 -.06 .04 .15 .02 -.1120. VC funds 0.02 0.25 .10 .01 .00 .10 .02 .00 .00 .11 .17 -.10 .00 .15 -.01 .00 21. % Rep. votes 51.01 10.83 -.37 -.07 .00 -.23 -.14 .00 .03 -.63 .10 .04 -.13 -.12 .16 .18 22. Education 20.85 8.55 .00 .00 .00 .05 .05 .00 -.08 .00 .00 -.32 .00 .00 -.12 .06 23. Suicide 0.01 0.01 -.17 -.03 .00 -.14 -.06 .00 .00 -.24 -.07 .17 .01 -.18 .15 .10 24. Nasdaq Index 2.25 0.77 -.01 -.04 .00 -.03 .00 -.03 -.44 .00 -.01 -.32 -.07 -.05 .00 .00 25. Recession 0.17 0.37 .02 -.01 .00 .02 .00 .01 .30 .00 .00 -.10 .00 .07 .00 .00 26. Distance to NYC 1.59 0.90 -.33 -.07 .00 -.21 -.06 .00 .00 -.44 -.13 .28 .03 -.45 .24 .42 27. Time 3.50 1.71 .02 .06 .00 .08 .00 .00 .57 .01 .01 .18 .12 .25 .00 .00 28. Post event 0.50 0.50 .02 .06 .00 .07 .00 .01 .66 .00 .01 .21 .11 .21 .00 .00 29. Post event clock 0.50 0.76 .01 .04 .00 .06 .00 .00 .42 .00 .01 .29 .11 .17 .00 .00
Notes: N=17898 annual observations; Number of Unique counties: 157
39
Table 2 (Contd.). Descriptive Statistics and Simple Correlation of Annual-Sector Foundings Data
Variable 15 16 17 18 19 20 21 22 23 24 25 26 27 2815. NYC neighbor 16. Capital ‐.03 17. Bank density ‐.07 ‐.02 18. Bank deposit .11 .14 .02 19. IPO funds .17 .09 .01 .13 20. VC funds ‐.01 .01 ‐.06 .06 .05 21. % Rep. votes ‐.39 ‐.16 ‐.03 ‐.16 ‐.25 ‐.05 22. Education ‐.03 .09 .00 ‐.01 ‐.03 ‐.10 ‐.23 23. Suicide ‐.17 ‐.07 .06 ‐.14 ‐.07 ‐.04 .27 ‐.15 24. Nasdaq Index .00 .00 .05 ‐.01 ‐.04 .01 ‐.07 ‐.01 .01 25. Recession .00 .00 ‐.02 ‐.01 .07 .06 ‐.02 ‐.04 .07 ‐.14 26. Distance to NYC ‐.33 ‐.09 .03 ‐.28 ‐.24 ‐.09 .39 ‐.04 .26 .00 .00 27. Time .00 .00 ‐.09 .09 .03 ‐.02 .04 ‐.15 ‐.02 ‐.40 .13 .00 28. Post event .00 .00 ‐.09 .06 .06 .00 .05 ‐.12 .00 ‐.68 .45 .00 .88 29. Post event clock .00 .00 ‐.07 .08 .01 ‐.04 .07 ‐.09 ‐.06 ‐.54 ‐.29 .00 .83 .65
40
Table 3. Multivariate Analysis on Annual-Sector County Foundings (1) (2) (3) (4) (5) (6) (7) (8) (9) (10) Sample excludes NYC observations NYC Obs. and Obs. spanning Sep. 2001 NYC obs. Form of distance Linear Logged Form of fixed effect Indicator Conditional Indicator Conditional Indicator Conditional
Sector Failures 0.968** 0.978** 0.961** 0.971** 1.038** 1.052** 1.019** 1.035** 0.978** 0.969** (0.088) (0.088) (0.087) (0.087) (0.099) (0.099) (0.097) (0.097) (0.088) (0.087) Sector density 0.070** 0.069** 0.070** 0.069** 0.072** 0.071** 0.071** 0.070** 0.068** 0.070** (0.005) (0.005) (0.004) (0.004) (0.005) (0.005) (0.004) (0.004) (0.005) (0.004) Sector average pay 0.009** 0.009** 0.009** 0.009** 0.012** 0.012** 0.013** 0.013** 0.009** 0.009** (0.000) (0.000) (0.000) (0.000) (0.000) (0.000) (0.000) (0.000) (0.000) (0.000) Sector employment 0.002** 0.002** 0.002** 0.002** 0.001** 0.001** 0.001* 0.001* 0.002** 0.002** (0.000) (0.000) (0.000) (0.000) (0.000) (0.000) (0.000) (0.000) (0.000) (0.000) Sector capital intensity
0.038 0.045 -0.018 -0.013 0.101 0.114 0.062 0.075 0.044 -0.016
(0.076) (0.077) (0.078) (0.079) (0.079) (0.080) (0.080) (0.081) (0.077) (0.079) Post event Cap. Int. 0.036** 0.036** 0.030* 0.030* 0.051** 0.052** 0.047** 0.049** 0.036** 0.030* (0.013) (0.013) (0.013) (0.013) (0.014) (0.014) (0.015) (0.015) (0.013) (0.013) Labor force 0.190 -0.049 -0.046* -0.058** 0.182 -0.089 -0.041+ -0.056* -0.083 -0.062* (0.165) (0.194) (0.022) (0.023) (0.170) (0.199) (0.024) (0.024) (0.199) (0.025) Density 0.079+ 0.070 -0.031* -0.034* 0.097* 0.089+ -0.009 -0.014 0.041 -0.034* (0.046) (0.046) (0.014) (0.014) (0.049) (0.049) (0.016) (0.016) (0.047) (0.015) Unemployment rate -0.012* -0.017** -0.020** -0.026** -0.008 -0.012+ -0.014* -0.019** -0.018** -0.028** (0.006) (0.006) (0.006) (0.006) (0.006) (0.007) (0.006) (0.006) (0.006) (0.006) Federal aid 0.002 -0.005 0.006 0.002 -0.003 -0.008 -0.000 -0.004 -0.008 0.000 (0.011) (0.011) (0.008) (0.008) (0.011) (0.011) (0.009) (0.009) (0.011) (0.008) Per capita income -0.064* -0.058+ -0.080** -0.080** -0.041 -0.046 -0.054** -0.060** -0.058+ -0.069** (0.029) (0.031) (0.019) (0.020) (0.032) (0.033) (0.021) (0.021) (0.031) (0.020) # of cities 0.008** 0.008** 0.007** 0.007** 0.007** (0.001) (0.001) (0.001) (0.001) (0.001) Area 0.000 0.000 0.000 0.000 0.000 (0.000) (0.000) (0.000) (0.000) (0.000) NYC neighbors -0.411** -0.400** -0.487** -0.477** -0.486** (0.097) (0.097) (0.106) (0.106) (0.117) Capital counties -0.247** -0.249** -0.179+ -0.181+ -0.235* (0.092) (0.091) (0.102) (0.102) (0.092) Bank density 0.003 -0.006 0.008 0.004 -0.002 -0.011 -0.003 -0.006 -0.013 0.004
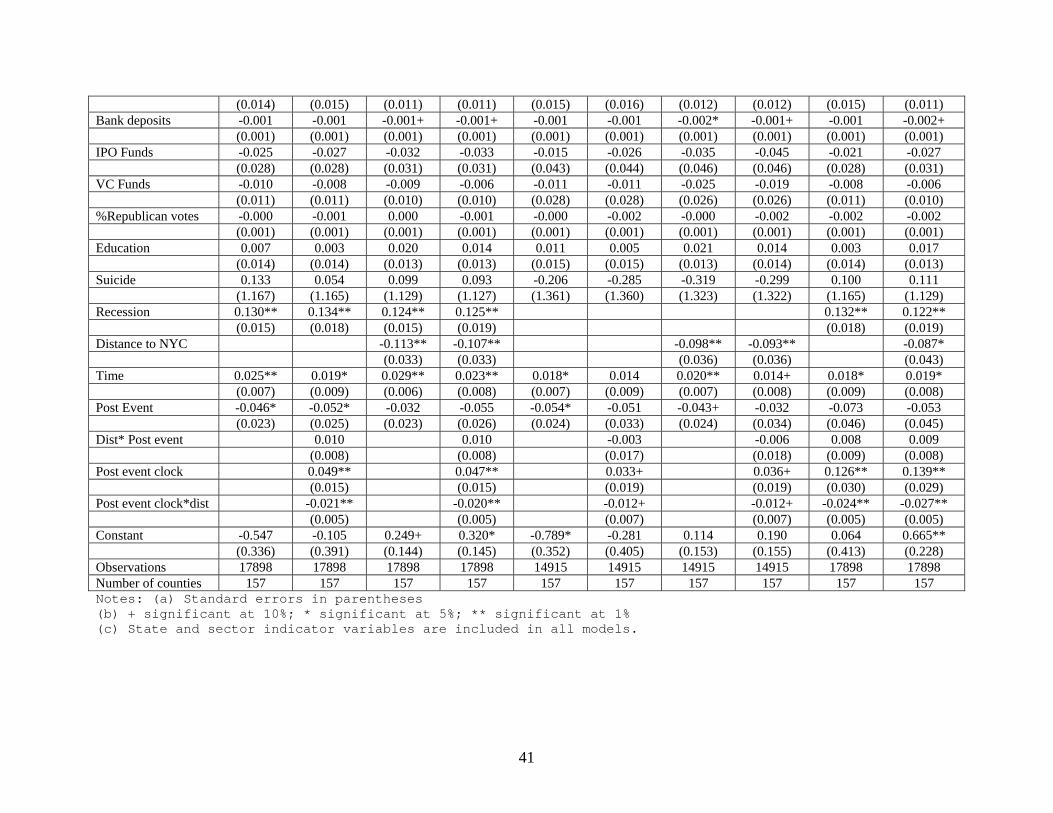
41
(0.014) (0.015) (0.011) (0.011) (0.015) (0.016) (0.012) (0.012) (0.015) (0.011) Bank deposits -0.001 -0.001 -0.001+ -0.001+ -0.001 -0.001 -0.002* -0.001+ -0.001 -0.002+ (0.001) (0.001) (0.001) (0.001) (0.001) (0.001) (0.001) (0.001) (0.001) (0.001) IPO Funds -0.025 -0.027 -0.032 -0.033 -0.015 -0.026 -0.035 -0.045 -0.021 -0.027 (0.028) (0.028) (0.031) (0.031) (0.043) (0.044) (0.046) (0.046) (0.028) (0.031) VC Funds -0.010 -0.008 -0.009 -0.006 -0.011 -0.011 -0.025 -0.019 -0.008 -0.006 (0.011) (0.011) (0.010) (0.010) (0.028) (0.028) (0.026) (0.026) (0.011) (0.010) %Republican votes -0.000 -0.001 0.000 -0.001 -0.000 -0.002 -0.000 -0.002 -0.002 -0.002 (0.001) (0.001) (0.001) (0.001) (0.001) (0.001) (0.001) (0.001) (0.001) (0.001) Education 0.007 0.003 0.020 0.014 0.011 0.005 0.021 0.014 0.003 0.017 (0.014) (0.014) (0.013) (0.013) (0.015) (0.015) (0.013) (0.014) (0.014) (0.013) Suicide 0.133 0.054 0.099 0.093 -0.206 -0.285 -0.319 -0.299 0.100 0.111 (1.167) (1.165) (1.129) (1.127) (1.361) (1.360) (1.323) (1.322) (1.165) (1.129) Recession 0.130** 0.134** 0.124** 0.125** 0.132** 0.122** (0.015) (0.018) (0.015) (0.019) (0.018) (0.019) Distance to NYC -0.113** -0.107** -0.098** -0.093** -0.087* (0.033) (0.033) (0.036) (0.036) (0.043) Time 0.025** 0.019* 0.029** 0.023** 0.018* 0.014 0.020** 0.014+ 0.018* 0.019* (0.007) (0.009) (0.006) (0.008) (0.007) (0.009) (0.007) (0.008) (0.009) (0.008) Post Event -0.046* -0.052* -0.032 -0.055 -0.054* -0.051 -0.043+ -0.032 -0.073 -0.053 (0.023) (0.025) (0.023) (0.026) (0.024) (0.033) (0.024) (0.034) (0.046) (0.045) Dist* Post event 0.010 0.010 -0.003 -0.006 0.008 0.009 (0.008) (0.008) (0.017) (0.018) (0.009) (0.008) Post event clock 0.049** 0.047** 0.033+ 0.036+ 0.126** 0.139** (0.015) (0.015) (0.019) (0.019) (0.030) (0.029) Post event clock*dist -0.021** -0.020** -0.012+ -0.012+ -0.024** -0.027** (0.005) (0.005) (0.007) (0.007) (0.005) (0.005) Constant -0.547 -0.105 0.249+ 0.320* -0.789* -0.281 0.114 0.190 0.064 0.665** (0.336) (0.391) (0.144) (0.145) (0.352) (0.405) (0.153) (0.155) (0.413) (0.228) Observations 17898 17898 17898 17898 14915 14915 14915 14915 17898 17898 Number of counties 157 157 157 157 157 157 157 157 157 157 Notes: (a) Standard errors in parentheses (b) + significant at 10%; * significant at 5%; ** significant at 1% (c) State and sector indicator variables are included in all models.


![[Guitar Songbook] Guns _n_ Roses - Appetite for Destruction](https://img.pdfslide.us/doc/110x75/577c818b1a28abe054ad30f0/guitar-songbook-guns-n-roses-appetite-for-destruction.jpg)


![[Guitar songbook] guns and roses appetite for destruction](https://img.pdfslide.us/doc/110x75/5559631bd8b42a93708b5092/guitar-songbook-guns-and-roses-appetite-for-destruction.jpg)