Embed Size (px)
Citation preview
The Consequences of Chernobyl The Consequences of Chernobyl Accident in the Agriculture of Zhytomyr Accident in the Agriculture of Zhytomyr
region and counterregion and counter--measures against measures against themthem
Mykola Didukh,Zhytomyr national agroecological university (Ukraine)E-mail: [email protected]

UKRAINEUKRAINE IS THE EPICENTRE OF CHERNOBYL IS THE EPICENTRE OF CHERNOBYL NUCLEAR CATASTROPHENUCLEAR CATASTROPHE
As a result of Chernobyl accident there are 6,7 million hectares of territories polluted, among them 1,2 million hectare of agricultural grounds with density of radioactive pollution of the soil by 137Cs from above 37 KBq /m2.
130,6 thousand hectares of agricultural grounds which have been withdrawn from economic use still require rehabilitation and returning in production.
On the polluted by radionuclides territories there are 2161 settlements in which live over 3 million people, from them 600 thousand children.

Zhytomyr region was one of the first to Zhytomyr region was one of the first to feel the blow of Chernobyl radiation.feel the blow of Chernobyl radiation.
Pollution of its territory basically has taken place on April, 26-27th, 1986. The most expressed radioactive trace is observed in northern areas which border upon Belarus.
To the zone of radioactive pollution were ascribed half of the region territories, third of its agricultural grounds and almost the same area of arable lands. The area of land with pollution level by 137Cs from above 1,0 Ki/km2 makes 977,6 thousand in hectare.
To the zone of radioactive pollution were ascribed 9 areas 734settlements in which lived about 386,3 thousand persons.

Density of pollution of the territoryDensity of pollution of the territory 137137Cs Cs ((year year 1998)1998)
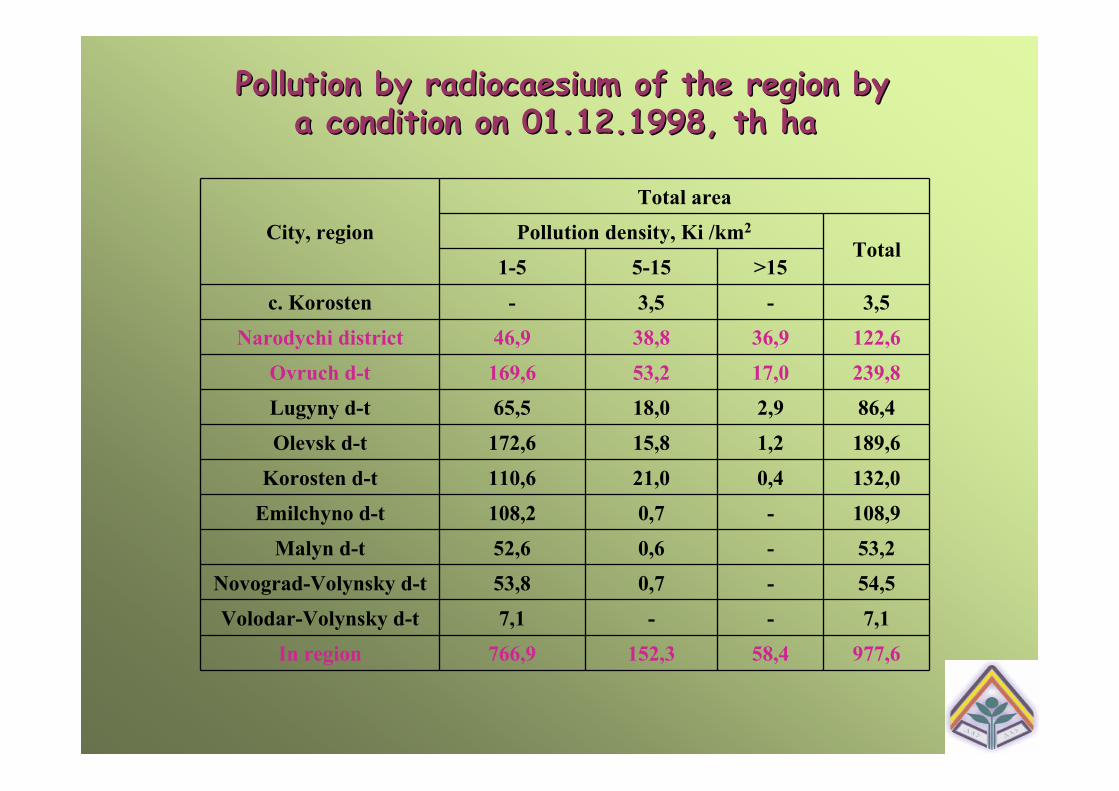
Pollution by radiocaesium of the region by Pollution by radiocaesium of the region by a condition on 01.12.1998, th haa condition on 01.12.1998, th ha
City, region
Total area
Pollution density, Ki /km2
Total1-5 5-15 >15
c. Korosten - 3,5 - 3,5
Narodychi district 46,9 38,8 36,9 122,6
Ovruch d-t 169,6 53,2 17,0 239,8
Lugyny d-t 65,5 18,0 2,9 86,4
Olevsk d-t 172,6 15,8 1,2 189,6
Korosten d-t 110,6 21,0 0,4 132,0
Emilchyno d-t 108,2 0,7 - 108,9
Malyn d-t 52,6 0,6 - 53,2
Novograd-Volynsky d-t 53,8 0,7 - 54,5
Volodar-Volynsky d-t 7,1 - - 7,1
In region 766,9 152,3 58,4 977,6

Density of the farmland pollution by Density of the farmland pollution by caesiumcaesium--137137
# Distict
Farmlands and household forests, ha
With the density of pollution, Ki/km2
Total1–5 5–15 >15
1 Narodychi 30073 24915 11117 66105
2 Ovruch 78195 12807 2098 93100
3 Lugyny 37745 9683 594 48022
4 Olevsk 51613 9647 780 62040
5 Korosten 80322 15537 433 96292
6 Emilchyn 58201 657 - 58858
7 Malyn 29653 572 - 30225
8 Novograd-Volynskyi 11762 - - 11762
9 Volodar-Volynskyi 6419 - - 6419
10 c. Korosten - - - -
TOTAL 383983 73818 15022 472823

Belonging of the farmlands to the pollution Belonging of the farmlands to the pollution zoneszones
Relatively to the pollution zones the given territories look like this:
4th zone- 383,9 th ha (density of polution 1 - 5 Кi/km2);
3rd zone – 62,4 th ha (density of polution 5 - 15 Кi/km2);
2nd zone – 26,4 th ha (density of polution 5 – 15 and more then 15 Кi/km2).

Areas of the territories, that are polluted Areas of the territories, that are polluted with with 137137Cs more then 15 Ki/kmCs more then 15 Ki/km22, that are , that are
withdrawn from land tenure, ha.withdrawn from land tenure, ha.
District Were subject to withdrawal
Are actually withdrawned
Including farmlands
Novograd-Volynsk 2237 1473 -
Voldar-Volynsk 2205 122 -
Emilchynsk 7312 5054 -
Korosten 21679 23319 181
Lugyny 4157 2532 159
Malyn 4866 5678 -Narodychi 32573 21131 9630
Ovruch 11213 3600 326
Olevsk 6167 1042 617
Total in Zone 92409 64045 10813

Quantity of the settlements ascribed to Quantity of the settlements ascribed to zones of radioactive pollution according zones of radioactive pollution according
to the current legislation.to the current legislation.
District1st Zone
ofalienation
2sd Zoneuncondition
al (obligatory)
removal
3rd Zone of the Guaranteed
voluntary removal
4th Zone of thestrengthened
radioecological control
Total
Narodychi 4 36 36 8 84
Ovruch 3 19 107 30 459
Lugyny - 4 35 11 50
Olevsk - 2 45 14 61
Korosten - 1 26 86 113
Emilchyno - - 44 757 119
Malyn - 1 - 103 104
Novograd-Volynskyi - - 10 28 36
Volodar-Volynskyi - - 8 8 8
Total 7 63 301 363 734

Dynamics ofDynamics of the population of Zhytomyr region in the zones of the population of Zhytomyr region in the zones of radioactive pollution owing to Chernobyl accidentradioactive pollution owing to Chernobyl accident
Year Total in the region
Including in zones
ІІ zone ІІІ zone IV zone
1990 424285 16738 211079 196469
1991 419646 14375 211833 193438
1992 419917 13067 213400 193450
1993 417531 10618 220559 186354
1994 407203 8539 215538 183126
1995 401283 7775 212454 181354
1996 396136 6451 210259 179426
1997 390802 5784 207126 177892
1998 386320 4963 205255 176102
1999 381657 4462 203354 173841
2000 375900 4101 200166 171633
2001 369899 3857 199798 166244
2002 361969 4408 196007 161524
2003 357772 4232 194180 159360
2004 352519 4018 191778 156723
2005 347732 3847 189650 154235
2005 до 1990 (+,-) -76553 -12891 -21429 -42233

During the time, that has passed since the accident on the During the time, that has passed since the accident on the ChNPP, the radiation situation in Ukraine has considerably ChNPP, the radiation situation in Ukraine has considerably improved. It has happened as a result of:improved. It has happened as a result of:
realization of careful radiation monitoring of an agricultural production, manufacture, its quality control;
realization of the complex of counter-measures in a field of agricultural production directed on decrease of pollution of foodstuffs of the population;
existence of natural rehabilitation processes (physical decay of radionuclides, their fixing and redistribution in the environmental objects).
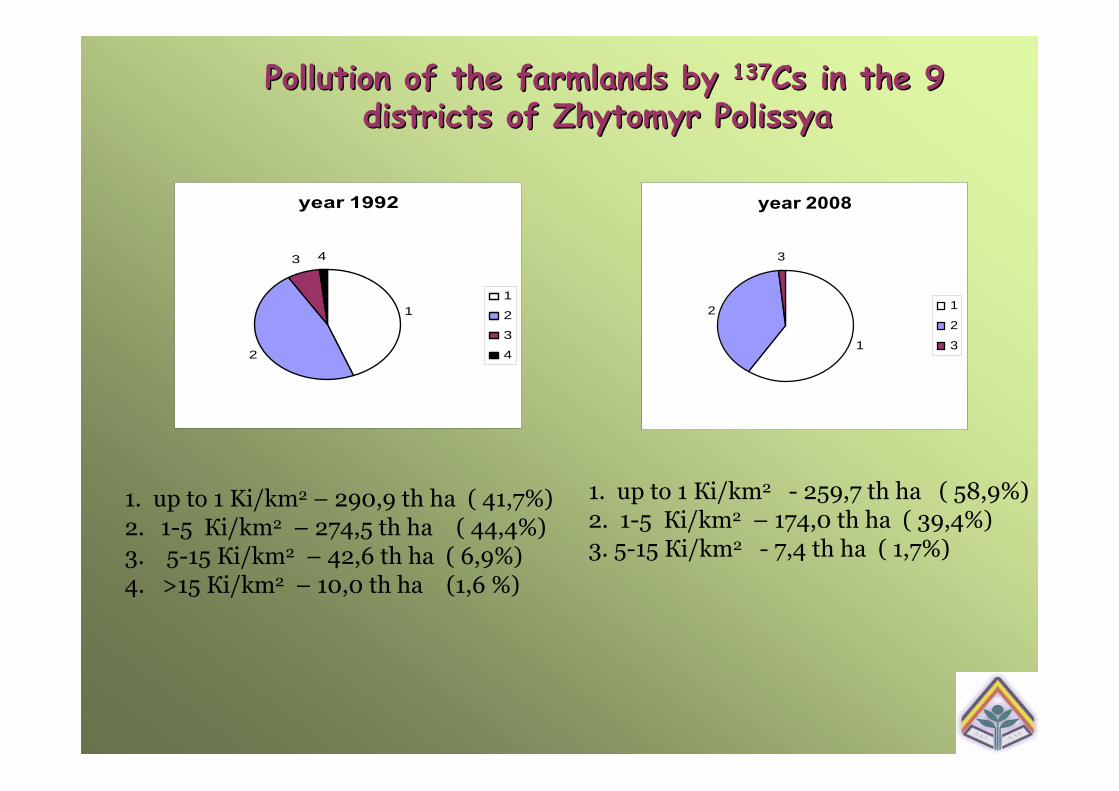
Pollution of the farmlands byPollution of the farmlands by 137137Cs Cs in the 9 in the 9 districts of Zhytomyr Polissyadistricts of Zhytomyr Polissya
year 1992
1
2
3 4
1
2
3
4
1. up to 1 Кі/km2 - 259,7 th ha ( 58,9%)2. 1-5 Кі/km2 – 174,0 th ha ( 39,4%)3. 5-15 Кі/km2 - 7,4 th ha ( 1,7%)
1. up to 1 Ki/km2 – 290,9 th ha ( 41,7%)2. 1-5 Кі/km2 – 274,5 th ha ( 44,4%)3. 5-15 Кі/km2 – 42,6 th ha ( 6,9%)4. >15 Кі/km2 – 10,0 th ha (1,6 %)
year 2008
1
2
3
1
2
3

Forming structure of theForming structure of the irradiation dose of the population irradiation dose of the population in 1986in 1986
35% - external irradiation 13,5 –internal irradiation 50% - internal irradiation due to
inhalation of radionuclides
50,0
35,0%
13,5%1,5%

Forming structure of the dose loads of the population in Forming structure of the dose loads of the population in northern areas of Zhytomyr region in 2008northern areas of Zhytomyr region in 2008
80-95% - internal irradiation from radionuclides, arriving in theorganism with foodstuffs5-20% - external gamma-radiation
<2% - internal irradiation from radionuclides, received by theorganism with drinking water<0,1 - internal irradiation from inhalation receipt of theradionuclides in the organism
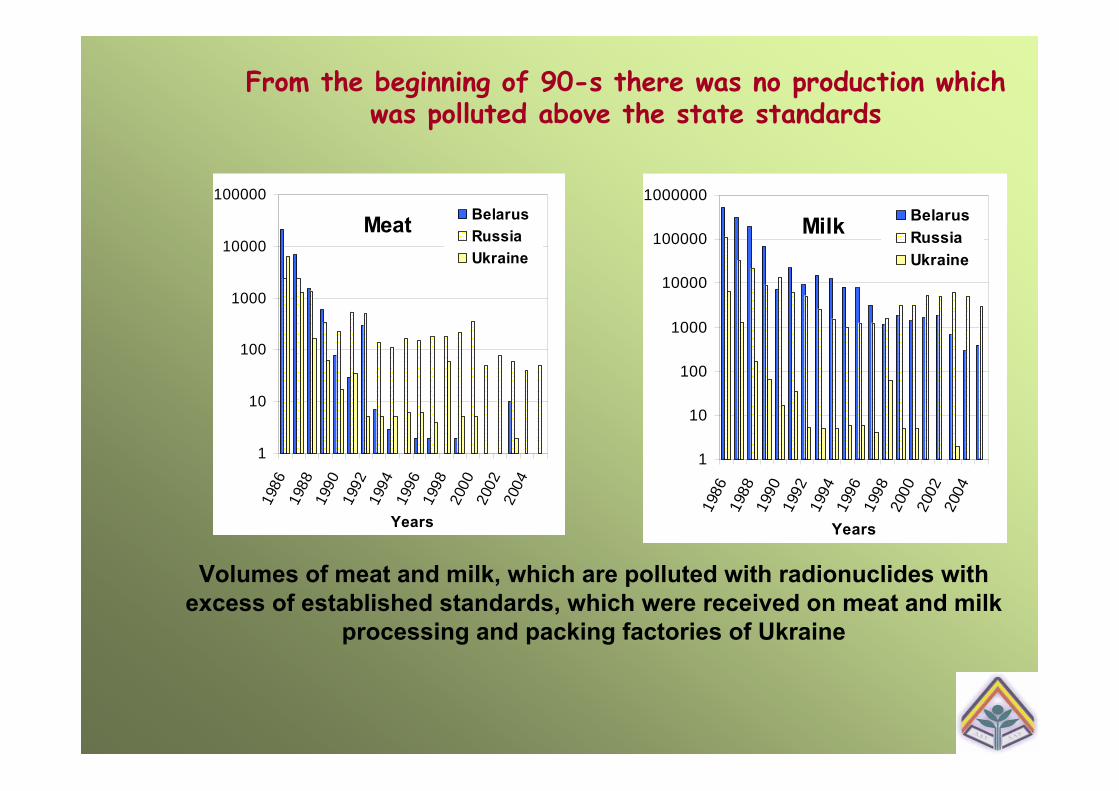
From the beginning of 90-s there was no production which was polluted above the state standards
Volumes of meat and milk, which are polluted with radionuclides with excess of established standards, which were received on meat and milk
processing and packing factories of Ukraine
1
10
100
1000
10000
100000
1000000
1986
1988
1990
1992
1994
1996
1998
2000
2002
2004
Years
BelarusRussiaUkraine
Milk
1
10
100
1000
10000
100000
1986
1988
1990
1992
1994
1996
1998
2000
2002
2004
Years
BelarusRussiaUkraine
Meat

Realization of counterRealization of counter--measures in the agricultural measures in the agricultural production sphere of Ukraine after the Chernobyl accidentproduction sphere of Ukraine after the Chernobyl accident
Absence of optimization and the efficiency control of the application of the counter-measures
Inopportuneness of realization because of the tender delay
0
20
40
60
80
100
120
140
160
180
200
1986
1988
1990
1992
1994
1996
1998
2000
2002
2004 рік
Тисячі
га Liming of soils
Applying heightened doses ofmineral fertilizersRadical improvement of meadows

Radiological efficiency of realization of the counter-measures
CONTER-MEASUREEfficiency of the reduction of the content of 137Cs in
production, timesMineral soil Biogenic soil
Liming 4-6 t/ha 1.5-3.0 1.5-2.0NPK *. Optimum ratio 1.5-2.0 1.5-3.0 Manure 20 т/га 1.5-3.0 -Liming + NPK 1.8-2.7 2.5-4.0NPK + Manure 1.5-3.0 -Liming + Manure + NPK 2.5-4.0Sapropel 2 - 4Zeolite 1.5-2.5Ploughing after the accident: 1st yearnext years
2.5-3.01.5-1.8
3.0-4.01.5-2.2
Ploughing with turning over the stratum(1st
year after the accident)8-12 10-16
Radical improvement: on fallow landnext years
3-91.8-2.5
4-162-3
Superficial improvement: on fallow landnext years
2-31.5-1.8
2-141.5-2.5
Ferocin bolus 5-7Ferocin powder 2-5Salt-drop with ferocin 2-4Mineral and salt briquettes + fodder mixture 3-5

•In the zone of unconditional (obligatory) evacuation there are still more than 4 thousand persons in 63 settlements living.
•Half of them has up to 10 person living (1-2 families).
•In half of the settlements permanently and in 24 settlements in some cases radioactivity of the milk exceed permissible level of pollution (LA -2006)
• There are some cases of exceeding of content of 137Cs in potatoes, vegetables and 90Sr in grain cultures , what was not noticed in passed years .
•The dose load on the population in 36 settlements exceeds the norm ( 1 mg.Zv/ hour).
Nowadays in Zhytomyr regionNowadays in Zhytomyr region
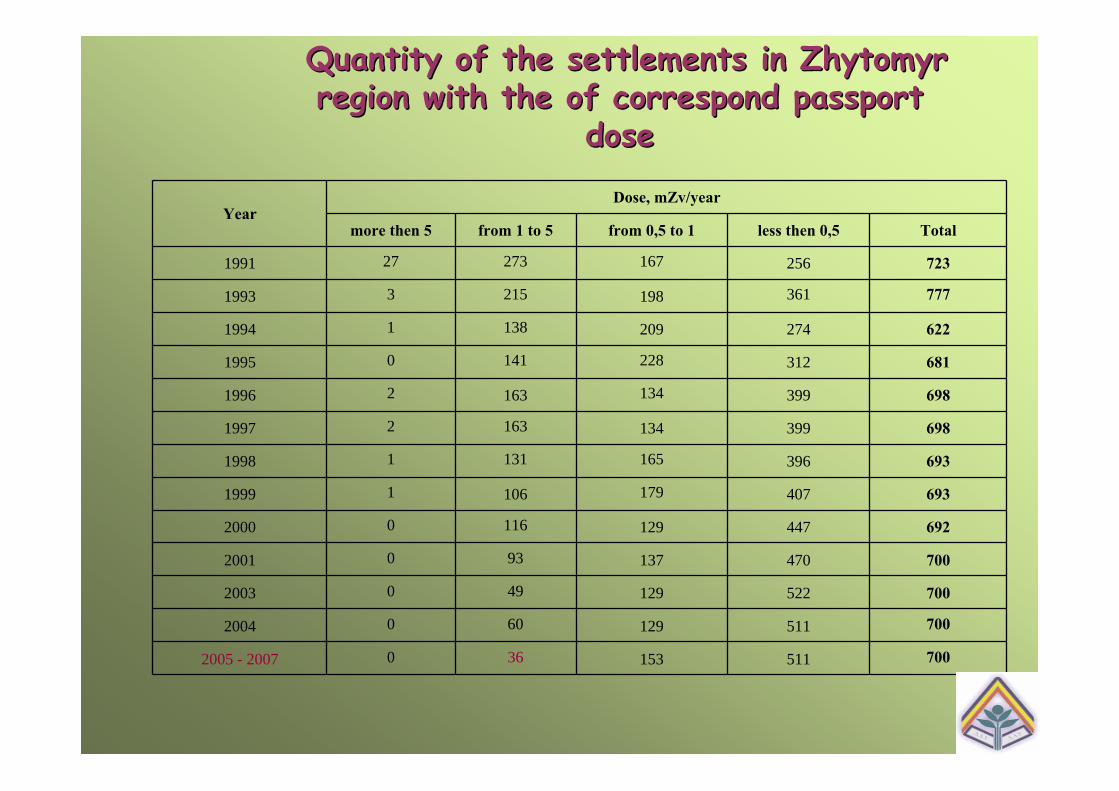
Quantity of the settlements in Zhytomyr Quantity of the settlements in Zhytomyr region with the of correspond passport region with the of correspond passport
dosedose
YearDose, mZv/year
more then 5 from 1 tо 5 from 0,5 tо 1 less then 0,5 Total
1991 27 273 167 256 723
1993 3 215 198 361 777
1994 1 138 209 274 622
1995 0 141 228 312 681
1996 2 163 134 399 698
1997 2 163 134 399 698
1998 1 131 165 396 693
1999 1 106 179 407 693
2000 0 116 129 447 692
2001 0 93 137 470 700
2003 0 49 129 522 700
2004 0 60 129 511 700
2005 - 2007 0 36 153 511 700

Distribution of the settlements with excess of the Distribution of the settlements with excess of the state standards state standards ((ALAL--06) 06) of the content ofof the content of 137137Cs Cs inin milkmilk
(100 (100 BqBq//ll) ) forfor 20042004--20072007
DistrictQuantity of settlements, whre milk is being produced with
the exceeding of AL-97
Quantity of the inspected settlements
Vinnytsya 0 89
Volynsk 166 166
Zhytomyr 53-84 700
Ivano-Frankivsk 0 5
Kyiv 0-4 469
Rivno 86-154 339
Sumy 0-1 11
Ternopil 0 10
Khmelnytsk 0 9
Cherkassy 0 103
Chernigiv 0-4 248
Chernivtsi 0 14

2020 years after the Chernobyl accident the processes of the naturalyears after the Chernobyl accident the processes of the naturalssorption orption of the radionuclides by soil almost of the radionuclides by soil almost exhausexhausted them selvested them selves..
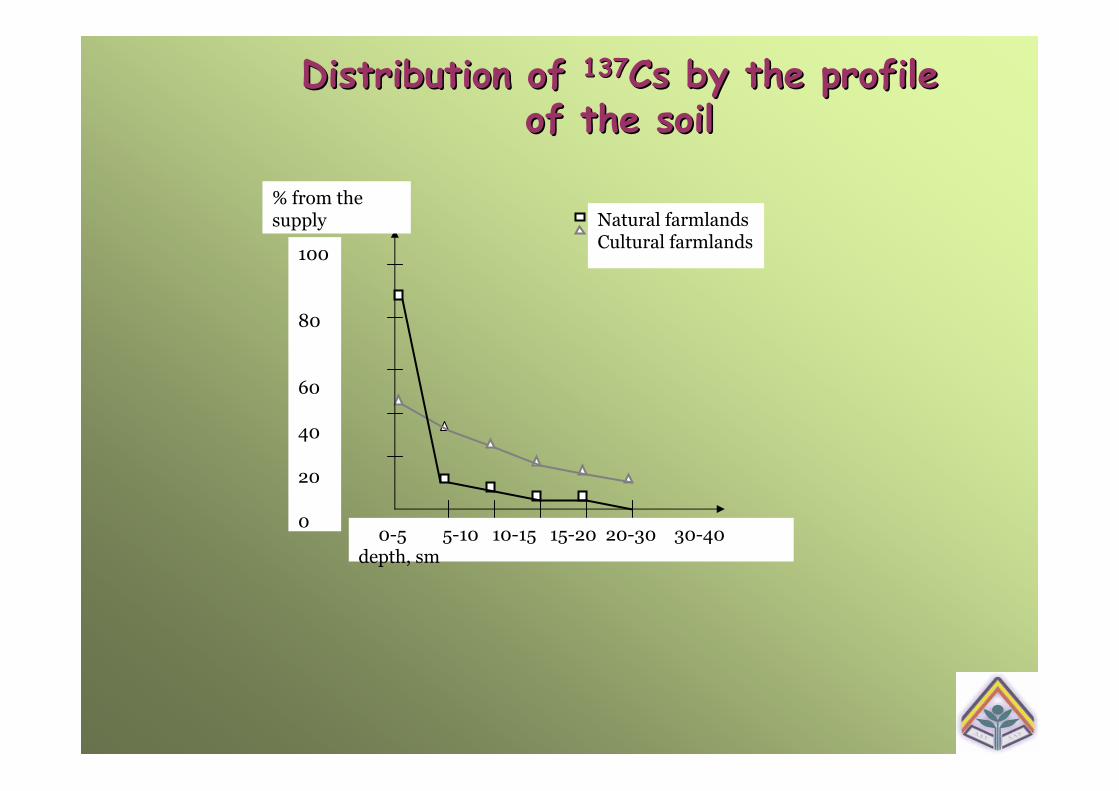
Distribution of Distribution of 137137Cs by the profile Cs by the profile of the soilof the soil
100
80
60
40
20
0 0-5 5-10 10-15 15-20 20-30 30-40
depth, sm
Natural farmlandsCultural farmlands
% from the supply

Dynamic of transition factor in plants on different soilsDynamic of transition factor in plants on different soils
1
2
а
3
0,0
0,1
1,0
10,0
100,01986 1991 1996 2001 2006
t , yearsTF
, m2 *k
g-1

SpecificSpecific activity ofactivity of 137137Cs Cs in vegetablesin vegetables andand forest mushroomsforest mushrooms inin vv. . KhrystynovkaKhrystynovka((20032003--20082008))
Kind of production Year Specific activity of 137Cs, Bq/kgminimum-maximum
arithmetical mean AL-97 іAL-2006
Potato 2005-2008 9,0÷98 14±9 60Red beet 2005 -2008 10÷160 11±17 40Carrot 2005 -2008 15÷50 9±8 40Pumpkin 2005 -2008 10÷400 47±29 40Cabbage 2005 -2008 15÷180 37±11 40
Dried mushrooms 2008 4380÷180000 44500±53000 2500Fresh mushrooms 2008 800÷45380 9450±10600 500

The activity of the ration and the dose of the internal The activity of the ration and the dose of the internal irradiation owing toirradiation owing to 113737Cs Cs in inhabitants of the in inhabitants of the
NarodychiNarodychi region, village region, village KhrystynivkaKhrystynivka
Foodstuffs Consumption, kg/day.
Concentration137Cs , Bq/kg
Receipt to the organism137Cs, Bq
% from the total receipt of 137Cs
Foodstuffs of the vegetable originBakery 0,41 24,0 9,8 0,32Potato 0,5 9,2 4,6 0,15
Root vegetable 0,05 18,8 0,9 0,03Leaf vegetable 0,05 15,3 0,8 0,03
Fruits 0,4 4,7 1,9 0,06Total 1,41 18 0,59
Year dose, mZv/year 0,09Foodstuffs of the animal origin
Diary 1,0 61,3 61,3 2,01Meat 0,2 30,3 6,1 0,20Eggs 0,14 2,5 0,4 0,01Fish 0,05 48,6 2,4 0,08Всего 1.39 70.2 2.3
Year dose, mZv/year 0,36Foodstuffs of the forest origin
Berries 0,011 7230 79,5 1,72Mushrooms 0,01 288356 2883,6 94,50
Total 0,021 2963,1 96,22Year dose, mZv/year 15,14Total within 24 hours 2,821 3051,3 100Year dose, mZv/year 15,6

ConclusionConclusion
From the beginning of the 90-s there was no production which was polluted above the state standards, which was received on meat and milk processing and packing factories of Ukraine
Neverthelessin the zone of unconditional (obligatory) evacuation there are still more than 4 thousand persons in 63 settlements living
Reduction of volumes of the counter-measures, high pollution levels of a foodstuff of own production cause the significant contribution of an internal irradiation in total dose load.
In 36 settlements of the region the dose load on the population exceed the standard ( 1 mlZv/hour).
The regulation of the internal dose of the irradiation (consumption of the polluted products) is more efficient the external dose regulation.
Presence of the big areas with a low polluted farmlands demands realization of a complex of rehabilitation measures on their returning to the industrial operation.
Rehabilitation of the polluted farmlands by a method of cultivation of cultures for technical purposes is the important stabilizing social and radiological factor for the polluted region.

Thank you for your attentionThank you for your attention !!