Embed Size (px)
Citation preview

THE CONNECTICUT
ECONOMIC DIGESTOCTOBER 2016
October 2016
Economic Indicators on the Overall Economy ......................... 5 Individual Data Items ......................... 6-8Comparative Regional Data .............. 9Economic Indicator Trends ........ 10-11Help Wanted OnLine ........................ 15Business and Employment ChangesAnnounced in the News Media ...... 19Labor Market Areas: Nonfarm Employment .................... 12-17 Sea. Adj. Nonfarm Employment ..........14 Labor Force ............................................ 18 Hours and Earnings .............................. 19Cities and Towns: Labor Force ..................................... 20-21 Housing Permits .................................... 22Technical Notes ............................... 23At a Glance ....................................... 24
Connecticut Town EconomicIndex (CTEI): 2010-2015 ........ 1-3,5
Seasonally Adjusted Unemploy-ment Rates by Labor Market Area,1990-July 2016 ............................. 4
IN THIS ISSUE...
In August...Nonfarm Employment Connecticut..................... 1,690,800 Change over month ........... +0.02% Change over year ................ +1.1%
United States .............. 144,598,000 Change over month ........... +0.10% Change over year ................. +1.7%
Unemployment Rate Connecticut............................. 5.6% United States .......................... 4.9%
Consumer Price Index United States ...................... 240.853 Change over year .................. +1.1%
Vol.21 No.10 A joint publication of the Connecticut Department of Labor & the Connecticut Department of Economic and Community Development
T
Connecticut Town EconomicIndex (CTEI): 2010-2015By Jungmin Charles Joo, DOL
he Connecticut TownEconomic Index (CTEI)
showed the state’s cities andtowns experienced furthereconomic improvement in 2015.The CTEI was introduced lastyear and will be released annuallyin the October issue. The revised2011 index values for all 169cities and towns in the state areavailable upon request.
CTEI: Methodology The Connecticut Departmentof Labor’s Office of Researchdeveloped the Connecticut TownEconomic Index (CTEI), an annualcomposite index of all 169 citiesand towns in Connecticut. Thisindex measures each town orcity’s overall economic health,which can be ranked andcompared to others to gainperspective of its performanceeach year. Four annual average
town economic indicators wereused as components, which aretotal covered businessestablishments, total coveredemployment, real covered wages,and the unemployment rate. Establishments are thephysical work units located in thetown. Employment is the numberof employees on payroll in theestablishments that are located inthe town. Wages are the average ofthe aggregate wages earneddivided by the total averageemployment. These threemeasures include all those whoare covered under theunemployment insurance law,thus capturing nearly 100 percentof all the employees in each town. Establishments, employmentand wages are proxy for eachtown’s business activities and itsoverall economic strength, whilethe unemployment rate measures
0
5
10
15
20
25
30
35
40
NORTHSTONINGTON
KENT EASTFORD CANAAN ROCKY HILL
Chart 1. CTEI Top Five Towns, 2010‐2015 % Change

THE CONNECTICUT ECONOMIC DIGEST2 October 2016
ConnecticutDepartment of Labor
Connecticut Departmentof Economic andCommunity Development
THE CONNECTICUT
The Connecticut Economic Digest ispublished monthly by the ConnecticutDepartment of Labor, Office of Research, andthe Connecticut Department of Economic andCommunity Development. Its purpose is toregularly provide users with a comprehensivesource for the most current, up-to-date dataavailable on the workforce and economy of thestate, within perspectives of the region andnation.
The annual subscription is $50. Sendsubscription requests to: The ConnecticutEconomic Digest, Connecticut Department ofLabor, Office of Research, 200 Folly BrookBoulevard, Wethersfield, CT 06109-1114.Make checks payable to the ConnecticutDepartment of Labor. Back issues are $4 percopy. The Digest can be accessed free ofcharge from the DOL Web site. Articles fromThe Connecticut Economic Digest may bereprinted if the source is credited. Please sendcopies of the reprinted material to the ManagingEditor. The views expressed by the authors aretheirs alone and may not reflect those of theDOL or DECD.
Managing Editor: Jungmin Charles Joo
Associate Editor: Erin C. Wilkins
We would like to acknowledge the contributionsof many DOL Research and DECD staff andRob Damroth to the publication of the Digest.
Catherine Smith, CommissionerTim Sullivan, Deputy CommissionerBart Kollen, Deputy Commissioner
505 Hudson StreetHartford, CT 06106-2502Phone: (860) 270-8000Fax: (860) 270-8200E-Mail: [email protected]: http://www.decd.org
Scott D. Jackson, CommissionerKurt Westby, Deputy Commissioner
Andrew Condon, Ph.D., DirectorOffice of Research200 Folly Brook BoulevardWethersfield, CT 06109-1114Phone: (860) 263-6275Fax: (860) 263-6263E-Mail: [email protected]: http://www.ctdol.state.ct.us/lmi
ECONOMIC DIGESTthe overall economic health of itsresidents. Each of the fourcomponents was given a 25percent weight. CTEI’s base year is2010, which equals 100. The wagecomponent was adjusted to 2010dollars and unemployment ratechanges were inversed to reflectthe right direction. By combiningthese four major economicindicators, the index gives a broadmeasure of business and residenteconomic health of each town,allowing comparisons amongthem.
CTEI: 2014 to 2015 Reflecting an ongoing economicrecovery, business and laborconditions of all cities and townsin Connecticut (except one)continued to improve from 2014 to2015 (Table 1). Sprague was theonly one with the index figurestaying the same over the year. Bycomparison, five towns had showndeclining index from 2013 to 2014.Canaan, once again, led with thebiggest percentage increase from2014 to 2015 (+14.3%).Bridgewater (+12.2%), Franklin(+11.5%), Beacon Falls (+11.2%),and Willington (+11.0%) roundedout the top fastest recoveringtowns in the state over the year. Of the five largest cities, with a2010 Census population of100,000 or more, New Haven,again, had the fastest overalleconomic recovery in 2015(+6.8%). Waterbury continued to
experience the slowest growth(+5.9%), although its index grewsignificantly from 4.2% over the2013-14 period. All in all, morethan half of the cities and townshad index growth rates above thestatewide rate of 6.6% from 2014to 2015.
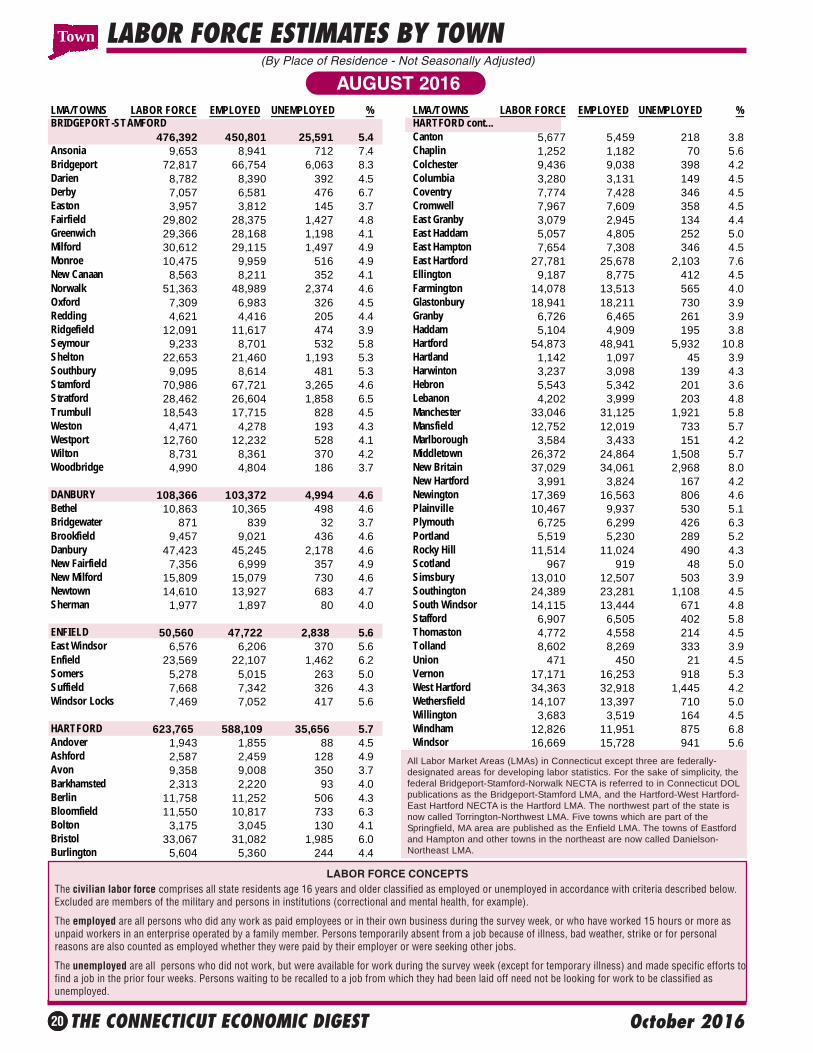
CTEI: 2010 to 2015 When compared with 2010,when the employment recoverybegan in Connecticut, all but twotowns showed positive economicgrowth in 2015. As Chart 1shows, the top five fastest growthoccurred in North Stonington(+36.6%), Kent (+32.1%), Eastford(+31.2%), Canaan (+30.2%), andRocky Hill (+29.5%). Only Warrenand Colebrook index numberswere still below the 2010 levels,suggesting a slowest overalleconomic recovery among thecities and towns, when newbusiness formations, jobs, realwages, and unemployment ratesare all factored in. Among the largest cities, asChart 2 shows, Stamford hadperformed the best again between2010 and 2015 (+20.8%). BothStamford and New Haven againgrew above the statewideeconomic recovery rate of 18.0%.Overall, nearly 60% of all citiesand towns in Connecticutrecovered faster than thestatewide average over the sixyear period.
0
5
10
15
20
25
STAMFORD NEW HAVEN STATEWIDE HARTFORD BRIDGEPORT WATERBURY
Chart 2. CTEI of Largest Cities, Percent Changes
2010‐15% 2013‐14% 2014‐15%
-continued on page 5-

THE CONNECTICUT ECONOMIC DIGEST 3October 2016
Town/City 2012 2013 2014 2015 Town/City 2012 2013 2014 2015 Town/City 2012 2013 2014 2015Andover 93.3 93.7 102.4 109.1 Griswold 95.7 97.8 102.9 111.3 Prospect 106.7 111.2 117.3 120.9Ansonia 99.4 97.7 102.7 110.3 Groton 104.3 106.4 113.0 118.7 Putnam 100.5 102.8 109.5 114.4Ashford 105.8 110.0 118.4 128.3 Guilford 107.5 108.9 114.7 124.6 Redding 103.4 105.6 113.9 122.9Avon 103.6 103.9 108.1 116.7 Haddam 104.0 108.7 116.5 125.5 Ridgefield 102.6 104.9 109.9 117.4Barkhamsted 104.7 104.2 113.7 124.4 Hamden 101.7 105.4 110.0 116.5 Rocky Hill 104.0 108.0 121.2 129.5Beacon Falls 102.6 108.3 113.6 126.2 Hampton 102.8 107.7 122.4 129.0 Roxbury 103.5 101.5 112.7 122.3Bethlehem 105.4 109.6 111.7 118.0 Hartford 102.3 103.8 109.9 117.1 Salem 94.9 96.9 103.4 110.6Berlin 105.6 109.4 117.0 125.0 Hartland 102.0 105.8 108.4 112.7 Salisbury 103.7 104.7 113.1 121.1Bethany 107.8 110.3 113.0 122.3 Harwinton 103.1 104.3 109.1 117.4 Scotland 106.5 105.9 101.1 103.2Bethel 102.7 105.8 111.6 122.0 Hebron 104.7 107.9 111.9 119.7 Seymour 103.0 106.0 110.9 119.5Bloomfield 104.5 107.2 112.7 118.9 Kent 112.0 115.8 124.9 132.1 Sharon 102.2 101.7 107.8 116.6Bolton 104.8 106.9 113.0 120.0 Killingly 101.2 104.7 112.9 120.5 Shelton 102.8 106.3 110.3 116.0Bozrah 97.6 102.1 108.8 116.0 Killingworth 100.8 99.0 105.5 113.6 Sherman 102.3 106.8 113.2 120.8Branford 101.7 105.6 112.6 117.9 Lebanon 101.5 106.8 113.8 122.1 Simsbury 104.2 105.6 111.3 118.8Bridgeport 100.8 102.2 107.8 114.6 Ledyard 97.4 99.8 103.7 114.6 Somers 101.5 105.2 108.4 115.4Bridgewater 96.8 97.2 100.2 112.4 Lisbon 102.7 104.9 105.9 110.5 South Windsor 105.9 108.2 112.9 120.4Bristol 107.1 109.9 116.8 122.4 Litchfield 103.0 106.1 111.1 119.6 Southbury 103.3 103.0 107.3 111.7Brookfield 103.6 107.1 113.3 122.2 Lyme 113.9 116.7 121.6 129.0 Southington 103.1 106.2 113.0 121.1Brooklyn 102.7 106.4 111.5 121.5 Madison 102.4 105.8 113.3 122.8 Sprague 92.3 97.4 102.2 102.2Burlington 102.0 108.8 116.9 120.4 Manchester 101.2 104.4 109.1 116.0 Stafford 99.7 102.5 108.4 113.9Canaan 93.5 97.7 113.9 130.2 Mansfield 99.2 101.4 109.4 117.8 Stamford 105.8 107.5 113.2 120.8Canterbury 103.0 106.9 113.9 121.8 Marlborough 108.2 111.0 115.9 123.0 Sterling 101.6 103.9 102.0 108.8Canton 110.7 114.7 119.6 128.4 Meriden 102.8 103.7 108.0 115.9 Stonington 103.8 104.6 105.7 113.0Chaplin 105.5 108.0 107.9 110.9 Middlebury 104.1 110.5 113.8 120.8 Stratford 101.2 103.0 108.1 115.9Cheshire 104.9 108.3 114.7 121.7 Middlefield 107.8 109.6 116.2 119.5 Suffield 100.2 103.9 109.9 118.7Chester 107.5 109.0 115.0 121.5 Middletown 102.2 104.1 108.9 115.9 Thomaston 104.6 108.3 114.4 123.6Clinton 102.7 104.8 109.7 118.3 Milford 105.8 109.7 114.9 122.8 Thompson 107.8 109.0 119.7 129.2Colchester 104.4 107.7 117.6 126.3 Monroe 104.9 108.7 113.7 121.5 Tolland 106.4 102.4 108.5 115.7Colebrook 89.4 92.1 92.1 99.4 Montville 99.8 100.9 107.4 112.5 Torrington 104.5 107.3 112.8 120.0Columbia 103.0 104.2 107.8 112.9 Morris 109.3 114.2 116.4 126.7 Trumbull 101.4 102.1 104.3 110.4Cornwall 103.9 99.5 115.3 121.0 Naugatuck 104.3 107.0 111.7 116.8 Union 92.5 94.1 97.6 102.0Coventry 102.1 106.8 111.6 118.2 New Britain 102.4 104.5 110.5 117.6 Vernon 100.0 103.6 109.0 116.2Cromwell 105.3 111.2 116.9 125.6 New Canaan 103.2 104.8 111.2 118.3 Voluntown 101.7 101.7 108.2 115.0Danbury 104.9 108.8 115.3 121.3 New Fairfield 101.4 102.8 111.3 118.1 Wallingford 105.0 109.1 114.9 122.3Darien 101.5 103.2 111.1 118.7 New Hartford 104.7 104.6 109.1 117.6 Warren 99.1 98.2 97.7 98.5Deep River 103.5 105.2 112.5 116.7 New Haven 102.0 104.6 111.5 119.1 Washington 102.1 103.4 107.6 116.9Derby 101.7 104.0 108.1 116.6 New London 92.0 93.5 98.7 104.9 Waterbury 101.9 102.7 107.0 113.3Durham 106.2 109.7 111.3 123.4 New Milford 100.1 101.7 107.3 114.4 Waterford 98.4 101.2 109.6 114.0East Granby 106.0 106.6 110.8 120.5 Newington 103.1 108.3 117.8 126.6 Watertown 103.4 106.5 111.7 117.9East Haddam 100.6 103.6 107.9 117.3 Newtown 102.7 109.7 117.0 125.1 West Hartford 104.3 107.9 114.0 121.9East Hampton 101.5 106.2 114.8 123.8 Norfolk 94.5 99.3 106.4 115.3 West Haven 100.9 103.6 109.7 117.4East Hartford 102.6 106.1 111.0 117.0 North Branford 106.0 111.1 115.4 123.2 Westbrook 105.8 109.5 114.9 122.6East Haven 102.5 104.9 111.2 118.4 North Canaan 100.6 103.6 108.1 115.0 Weston 101.0 102.4 109.0 117.8East Lyme 99.7 101.2 107.3 113.2 North Haven 98.1 97.7 101.7 110.6 Westport 100.2 98.2 102.9 111.5East Windsor 104.9 105.0 112.1 119.8 North Stonington 120.7 119.3 125.9 136.6 Wethersfield 102.8 105.5 110.0 118.6Eastford 110.5 113.0 118.2 131.2 Norwalk 102.9 107.7 112.3 119.3 Willington 104.3 110.0 114.2 126.8Easton 102.5 102.7 110.0 118.5 Norwich 100.9 102.4 107.5 113.2 Wilton 97.4 103.9 112.8 120.1Ellington 108.2 110.9 118.5 122.7 Old Lyme 101.5 103.5 109.7 118.4 Winchester 105.2 107.5 114.1 124.1Enfield 103.9 106.1 113.8 121.4 Old Saybrook 101.7 105.9 113.6 121.4 Windham 102.7 103.5 108.5 116.0Essex 102.0 105.9 112.2 117.4 Orange 108.7 112.7 117.8 126.7 Windsor 102.1 104.3 110.3 118.4Fairfield 103.3 108.0 113.8 121.4 Oxford 109.7 111.3 117.3 127.1 Windsor Locks 102.1 104.5 110.1 116.1Farmington 104.2 107.7 112.3 121.3 Plainfield 102.1 106.8 110.8 118.3 Wolcott 103.7 110.4 118.5 126.1Franklin 106.0 105.2 104.8 116.8 Plainville 106.7 108.9 115.3 125.7 Woodbridge 107.4 107.7 113.2 117.1Glastonbury 106.3 109.1 112.9 120.5 Plymouth 103.3 108.3 112.9 120.0 Woodbury 104.3 104.3 110.6 118.2Goshen 103.2 109.3 112.1 115.7 Pomfret 104.7 108.9 115.6 123.6 Woodstock 103.4 106.3 114.2 121.5Granby 102.5 106.7 111.5 119.3 Portland 106.2 109.3 113.6 122.7Greenwich 99.4 100.4 107.1 113.1 Preston 100.6 103.1 105.9 114.1 CONNECTICUT 102.8 104.8 110.7 118.0* 2010 = 100 for all 169 cities and towns 2011 CTEI is available upon requestSource: Connecticut Department of Labor, Office o f Research
CONNECTICUT TOWN ECONOMIC INDEX (2010=100), 2012-2015*

THE CONNECTICUT ECONOMIC DIGEST4 October 2016
I
Seasonally Adjusted Unemployment Ratesby Labor Market Area, 1990-July 2016By Jungmin Charles Joo, DOL, [email protected]
n addition to not seasonallyadjusted unemployment
rate estimates, the Bureau ofLabor Statistics (BLS) alsoproduces monthly seasonallyadjusted data by major labormarket areas (LMAs) forConnecticut, going back to 1990.Because of the one-month lag,these estimates are not publishedin the Labor Situation or theConnecticut Economic Digest,but they are available uponrequest. This article looks at thelong-term monthly trends ofseasonally adjustedunemployment rates of all theLMAs. The ConnecticutDepartment of Labor’s Office ofResearch separately producedseasonally adjusted estimates forsmall areas (Enfield, Torrington-
Northwest, and Danielson-Northeast) so that all areas inthe state can be compared andanalyzed. Note that because ofthe recent geographical changes,these small non-BLS LMAs canbe seasonally adjusted only backto 2010.
As the chart shows, all theregions trended similarly overthe historical period, with peaksand troughs of the LMAscoinciding about the same time.Waterbury LMA consistentlyposted highest jobless rates outof the six major areas during the1990-2016 timeframe. In fact,during the last recession, thatregion reached the highestunemployment rate out of all theareas at 11.7% in December
2009. Conversely, the DanburyLMA's unemployment rates werethe lowest throughout thehistory. Overall, theunemployment rates coming outof the latest 2008-2010employment recession in thestate were higher than thosecoming out of the 1989-1992downturn.
Having these seasonally adjustedstatistics by LMA is useful tokeep track of the underlyingtrends each month, where it isnot readily apparent with notseasonally adjusted series. Alsoavailable upon request are laborforce, employed, and unemployeddata from 1990 for the six majorareas.
Seasonally Adjusted Unemployment Rates by Labor Market Area, 1990- July 2016
0.0
2.0
4.0
6.0
8.0
10.0
12.0
14.0
90 91 92 93 94 95 96 97 98 99 00 01 02 03 04 05 06 07 08 09 10 11 12 13 14 15 16
Bridgeport Danbury
Hartford New Haven
New London Waterbury
Enfield Torrington‐Northwest
Danielson‐Northeast CONNECTICUT

THE CONNECTICUT ECONOMIC DIGEST 5October 2016
GENERAL ECONOMIC INDICATORS
Sources: *Dr. Steven P. Lanza, University of Connecticut **Farmington Bank ***Federal Reserve Bank of Philadelphia
General Drift Indicators are composite measures of the four-quarter change in three coincident (Connecticut Manufacturing Production Index, nonfarm employment, andreal personal income) and three leading (housing permits, manufacturing average weekly hours, and initial unemployment claims) economic variables, and are indexed so1996 = 100.
The Farmington Bank Business Barometer is a measure of overall economic growth in the state of Connecticut that is derived from non-manufacturing employment,real disposable personal income, and manufacturing production.
The Philadelphia Fed’s Coincident Index summarizes current economic condition by using four coincident variables: nonfarm payroll employment, average hoursworked in manufacturing, the unemployment rate, and wage and salary disbursements deflated by the consumer price index (U.S. city average).
2Q 2Q CHANGE 1Q(Seasonally adjusted) 2016 2015 NO. % 2016General Drift Indicator (1996=100)* Leading NA NA NA NA NA Coincident NA NA NA NA NAFarmington Bank Business Barometer (1992=100)** 135.1 132.1 3.0 2.3 134.3
Philadelphia Fed's Coincident Index (July 1992=100)*** Aug Aug Jul(Seasonally adjusted) 2016 2015 2016 Connecticut 169.46 162.99 6.47 4.0 168.79 United States 178.62 173.45 5.17 3.0 178.20
Index by Labor Market Area:2010-2015 The index by Labor MarketArea (LMA) is the average of alltown indexes that make up thatlabor market area. The index in allnine regions in Connecticut grewfrom 2010 to 2015. In 2015, theDanielson-Northeast LMA’s overalleconomy grew the fastest at21.8%. Waterbury and New Havenareas came in second at 20.3%and 19.9%, respectively. Theindexes in Bridgeport-Stamford(+17.6%) and Norwich-NewLondon (+15.3%) LMAs, however,increased at a slower pace thanthe statewide’s 18.0% average.
The Components of CTEI:
Establishments The total number of businessestablishments in Connecticutrose by 1.6% to 116,468 over theyear, a faster growth than the0.8% from 2013 to 2014. Stamfordcontinued to dominate with thelargest number of businesses outof 169 cities and towns, with5,740 units in 2015, an increaseof 1.3% over the year. Greenwich,Hartford, Norwalk, and New Havenrounded out the top five. Ledyardhad the highest rate of businessformation for both over the year(+23.5%) and over the six years
(+29.6%) in the state. From 2010to 2015, Connecticut’s overallnumber of businesses increased4.6%.
Employment Last year’s average statewideemployment rose 0.6% from 2014and 4.2% from 2010. Hartfordemployment was the largest of all169 cities and towns at 111,593in 2015, a 0.5% decline over theyear but a 2.4% increase since2010. The fastest job growth overthe year occurred in Franklin(+9.0%). North Stonington toppedthe list with the fastest job growthsince 2010 (+53.2%). Almost 60%of the cities and towns in thestate experienced job recoveryover the year, and nearly 80%have added jobs since theemployment recovery began in2010.
Nominal Wages In 2015, about 90% of all citiesand towns in the state postedwage gains both over the year andfrom 2010. The statewide annualaverage wage was $65,517 perworker, a 2.5% increase over2014 and a 10.2% increase over2010. Almost half of cities andtowns grew faster than thestatewide average from 2010 to2015, while 64% of them rosefaster than the statewide over the
year. Once again, the highestaverage pay was in businesseslocated in Greenwich at $129,596.The fastest wage growth over theyear occurred in Oxford (+28.6%),while Barkhamsted topped the listwith the fastest wage growth since2010 at 54.2%.
Unemployment Rate Hartford continued to post thehighest unemployment rate(10.4%) in the state in 2015, adrop from 12.2% in 2014. Theresidents of Waterbury (9.3%),Bridgeport (8.7%), New London(8.3%), and New Britain (8.1%)rounded out the top five highestunemployment rates last year.Overall, the statewide rate fellfrom 6.6% in 2014 to 5.6% in2015. For a detailed analysis andthe complete table ofunemployment rates by all citiesand towns for 2011 through 2015,see “Annual Town UnemploymentRates, 2011-2015” in the June2016 issue of the ConnecticutEconomic Digest.
Conclusion The CTEI shows that almost allcities and towns in Connecticuthave been recovering steadily from2010. At this pace, all areexpected to recover and many willbe on their ways to economicexpansion by the end of 2016.
-continued from page 2-

THE CONNECTICUT ECONOMIC DIGEST6 October 2016
EMPLOYMENT BY INDUSTRY SECTOR
INCOME
Average weekly initial
claims fell from a year
ago.
UNEMPLOYMENT
The production worker
weekly earnings rose
over the year.
MANUFACTURING ACTIVITY
ECONOMIC INDICATORSTotal nonfarm
employment increased
over the year.
Personal income for first
quarter 2017 is
forecasted to increase 3.6
percent from a year
earlier.
Source: Connecticut Department of Labor * Includes Native American tribal government employment
Sources: Connecticut Department of Labor; U.S. Bureau of Labor Statistics
Sources: Connecticut Department of Labor; U.S. Department of Energy*Latest two months are forecasted.
Source: Bureau of Economic Analysis*Forecasted by Connecticut Department of Labor
(Seasonally adjusted) 1Q* 1Q CHANGE 4Q*(Annualized; $ Millions) 2017 2016 NO. % 2016Personal Income $255,373 $246,600 8,773 3.6 $253,151UI Covered Wages $109,610 $107,699 1,911 1.8 $112,352
Aug Aug CHANGE Jul(Seasonally adjusted; 000s) 2016 2015 NO. % 2016TOTAL NONFARM 1,690.8 1,672.2 18.6 1.1 1,690.5 Natural Res & Mining 0.5 0.5 0.0 0.0 0.6 Construction 56.0 57.6 -1.6 -2.8 57.6 Manufacturing 160.0 159.4 0.6 0.4 160.3 Trade, Transportation & Utilities 297.3 296.4 0.9 0.3 297.4 Information 33.6 32.5 1.1 3.4 33.3 Financial Activities 132.8 130.0 2.8 2.2 133.4 Professional and Business Services 218.2 216.3 1.9 0.9 219.0 Education and Health Services 329.9 325.9 4.0 1.2 327.9 Leisure and Hospitality 155.2 150.6 4.6 3.1 154.1 Other Services 66.2 64.3 1.9 3.0 67.6 Government* 241.1 238.7 2.4 1.0 239.3
STATE
Aug Aug CHANGE Jul Jun(Not seasonally adjusted) 2016 2015 NO. % 2016 2016Production Worker Avg Wkly Hours 42.2 40.5 1.7 4.2 43.2 --Prod. Worker Avg Hourly Earnings 26.54 25.90 0.64 2.5 27.20 --Prod. Worker Avg Weekly Earnings 1,119.99 1,048.95 71.04 6.8 1,175.04 --CT Mfg. Prod. Index, NSA (2009=100) 118.4 118.0 0.4 0.3 114.7 113.8 Production Worker Hours (000s) 4,047 3,990 57 1.4 4,160 -- Industrial Electricity Sales (mil kWh)* 304 313 -9.2 -2.9 287 283CT Mfg. Prod. Index, SA (2009=100) 107.1 106.7 0.4 0.3 108.3 110.5
Aug Aug CHANGE Jul(Seasonally adjusted) 2016 2015 NO. % 2016Labor Force, resident (000s) 1,902.3 1,884.2 18.1 1.0 1,900.6 Employed (000s) 1,796.2 1,783.5 12.7 0.7 1,792.1 Unemployed (000s) 106.1 100.6 5.5 5.5 108.5Unemployment Rate (%) 5.6 5.3 0.3 --- 5.7Labor Force Participation Rate (%) 65.9 65.6 0.3 --- 65.9Employment-Population Ratio (%) 62.2 62.1 0.1 --- 62.1Average Weekly Initial Claims 3,970 4,000 -30 -0.7 3,671Avg. Insured Unemp. Rate (%) 2.58 2.65 -0.07 --- 2.64
2Q2016 2Q2015 1Q2016U-6 Rate (%) 11.1 12.1 -1.0 --- 10.7

THE CONNECTICUT ECONOMIC DIGEST 7October 2016
TOURISM AND TRAVEL
ECONOMIC INDICATORSBUSINESS ACTIVITY S&P 500 Index increased
over the year.
Gaming slots fell over the
year.
BUSINESS STARTS AND TERMINATIONS Net business formation, as
measured by starts minus
stops registered with the
Secretary of the State, was
up over the year.
STATE REVENUES
Sources: Connecticut Department of Economic and Community Development; U.S. Department of Energy,Energy Information Administration; Connecticut Department of Revenue Services; F.W. Dodge;Connecticut Department of Motor Vehicles; Wisertrade.org
* Estimated by the Bureau of the Census
Sources: Connecticut Secretary of the State; Connecticut Department of Labor
Aug Aug % % (Millions of dollars) 2016 2015 CHG CURRENT PRIOR CHGTOTAL ALL REVENUES* 794.3 776.5 2.3 11,958.9 13,206.7 -9.4 Corporate Tax 15.2 14.9 2.3 630.0 596.0 5.7 Personal Income Tax 330.1 295.3 11.8 6,442.0 7,140.0 -9.8 Real Estate Conv. Tax 12.4 11.3 9.4 133.4 147.0 -9.3 Sales & Use Tax 324.1 351.6 -7.8 2,858.7 3,242.3 -11.8 Gaming Payments** 23.3 24.2 -3.8 178.8 179.5 -0.4
YEAR TO DATE
Sources: Connecticut Department of Revenue Services; Division of Special Revenue*Includes all sources of revenue; Only selected sources are displayed; Most July receipts arecredited to the prior fiscal year and are not shown. **See page 23 for explanation.
Sources: Connecticut Department of Transportation, Bureau of Aviation and Ports; ConnecticutCommission on Culture and Tourism; Division of Special Revenue
*STR, Inc. Due to layoffs, Info Center Visitors data are no longer published.**Attraction participants expanded from 6 to 23 beginning with July 2014 data***See page 23 for explanation
Y/Y % YEAR TO DATE % MONTH LEVEL CHG CURRENT PRIOR CHG
Occupancy Rate (%)* Aug 2016 71.0 1.7 61.2 62.0 -1.3Major Attraction Visitors** Aug 2016 938,348 -7.5 4,624,579 4,695,783 -1.5Air Passenger Count Jul 2016 539,890 1.1 3,483,701 3,457,237 0.8Gaming Slots (Mil.$)*** Aug 2016 1,137.8 -2.8 8,761.6 8,617.4 1.7
Y/Y % %MO/QTR LEVEL CHG CURRENT PRIOR CHG
STARTS Secretary of the State Aug 2016 2,788 20.2 19,143 17,326 10.5 Department of Labor 4Q 2015 1,592 -12.5 8,078 8,352 -3.3
TERMINATIONS Secretary of the State Aug 2016 943 5.6 7,227 7,761 -6.9 Department of Labor 4Q 2015 2,223 -22.5 7,313 8,035 -9.0
YEAR TO DATE
STATE
Gaming payments were down
from a year ago.
Y/Y % YEAR TO DATE % MONTH LEVEL CHG CURRENT PRIOR CHG
New Housing Permits* Aug 2016 357 17.4 3,715 3,517 5.6Electricity Sales (mil kWh) Jul 2016 2,723 -1.2 16,538 17,391 -4.9Construction Contracts Index (1980=100) Aug 2016 155.1 -26.8 --- --- ---New Auto Registrations Aug 2016 20,558 104.7 193,184 126,040 53.3Exports (Bil. $) 2Q 2016 3.62 -11.7 7.40 8.03 -7.9S&P 500: Monthly Close Aug 2016 2,170.95 10.1 --- --- ---

THE CONNECTICUT ECONOMIC DIGEST8 October 2016
CONSUMER NEWS
EMPLOYMENT COST INDEXCompensation cost for the
nation rose 2.4 percent
over the year.
Conventional mortgage
rate stayed at 3.44
percent over the month.
INTEREST RATES
ECONOMIC INDICATORS
U.S. inflation rate
was up by 1.1 percent
over the year.
Source: U.S. Department of Labor, Bureau of Labor Statistics
Sources: U.S. Department of Labor, Bureau of Labor Statistics; The Conference Board*Change over prior monthly or quarterly period**The Boston CPI can be used as a proxy for New England and is measured every other month.
Sources: Federal Reserve; Federal Home Loan Mortgage Corp.
Aug Jul Aug(Percent) 2016 2016 2015Prime 3.50 3.50 3.25
Federal Funds 0.40 0.39 0.14
3 Month Treasury Bill 0.30 0.30 0.07
6 Month Treasury Bill 0.45 0.40 0.22
1 Year Treasury Note 0.57 0.51 0.38
3 Year Treasury Note 0.85 0.79 1.03
5 Year Treasury Note 1.13 1.07 1.54
7 Year Treasury Note 1.40 1.33 1.9110 Year Treasury Note 1.56 1.50 2.17
20 Year Treasury Note 1.89 1.82 2.55
Conventional Mortgage 3.44 3.44 3.91
Seasonally Adjusted Not Seasonally AdjustedPrivate Industry Workers Jun Mar 3-Mo Jun Jun 12-Mo(Dec. 2005 = 100) 2016 2016 % Chg 2016 2015 % ChgUNITED STATES TOTAL 126.1 125.4 0.6 126.2 123.3 2.4
Wages and Salaries 126.0 125.2 0.6 126.1 122.9 2.6
Benefit Costs 126.4 125.9 0.4 126.5 124.4 1.7
NORTHEAST TOTAL --- --- --- 127.7 124.3 2.7 Wages and Salaries --- --- --- 127.2 123.2 3.2
STATE
(Not seasonally adjusted) MO/QTR LEVEL Y/Y P/P*CONSUMER PRICES CPI-U (1982-84=100)
U.S. City Average Aug 2016 240.853 1.1 0.1 Purchasing Power of $ (1982-84=$1.00) Aug 2016 0.415 -1.1 -0.1
Northeast Region Aug 2016 255.605 1.1 0.1
NY-Northern NJ-Long Island Aug 2016 264.306 1.1 0.2
Boston-Brockton-Nashua** Jul 2016 260.800 1.5 0.0 CPI-W (1982-84=100)
U.S. City Average Aug 2016 234.909 0.7 0.1
% CHANGE

THE CONNECTICUT ECONOMIC DIGEST 9October 2016
UNEMPLOYMENT RATES
LABOR FORCE
NONFARM EMPLOYMENT
Six states showed a
decrease in its
unemployment rate over
the year.
All nine states in the
region gained jobs over
the year.
Eight states posted
increases in the labor
force from last year.
COMPARATIVE REGIONAL DATA
Source: U.S. Department of Labor, Bureau of Labor Statistics
Source: U.S. Department of Labor, Bureau of Labor Statistics
Source: U.S. Department of Labor, Bureau of Labor Statistics
Aug Aug CHANGE Jul(Seasonally adjusted; 000s) 2016 2015 NO. % 2016Connecticut 1,690.8 1,672.2 18.6 1.1 1,690.5Maine 616.0 611.3 4.7 0.8 617.8Massachusetts 3,576.4 3,508.3 68.1 1.9 3,570.5New Hampshire 671.5 658.5 13.0 2.0 667.1New Jersey 4,080.8 4,028.6 52.2 1.3 4,078.6New York 9,385.9 9,283.4 102.5 1.1 9,397.0Pennsylvania 5,899.5 5,843.7 55.8 1.0 5,900.4Rhode Island 490.8 485.0 5.8 1.2 491.5Vermont 318.2 311.7 6.5 2.1 318.5United States 144,598.0 142,151.0 2,447.0 1.7 144,447.0
Aug Aug CHANGE Jul(Seasonally adjusted) 2016 2015 NO. % 2016Connecticut 1,902,338 1,884,172 18,166 1.0 1,900,606
Maine 689,629 678,174 11,455 1.7 685,619
Massachusetts 3,610,483 3,567,795 42,688 1.2 3,604,621
New Hampshire 757,070 741,743 15,327 2.1 754,805
New Jersey 4,559,103 4,538,814 20,289 0.4 4,570,568
New York 9,551,911 9,683,821 -131,910 -1.4 9,599,985
Pennsylvania 6,515,123 6,426,326 88,797 1.4 6,521,718
Rhode Island 556,771 554,599 2,172 0.4 555,183
Vermont 346,182 343,933 2,249 0.7 346,243
United States 159,463,000 157,061,000 2,402,000 1.5 159,287,000
Aug Aug Jul(Seasonally adjusted) 2016 2015 CHANGE 2016Connecticut 5.6 5.3 0.3 5.7Maine 4.0 4.3 -0.3 3.9Massachusetts 3.9 4.8 -0.9 4.1New Hampshire 3.0 3.3 -0.3 2.9New Jersey 5.3 5.3 0.0 5.2New York 4.8 5.0 -0.2 4.7Pennsylvania 5.7 4.9 0.8 5.6Rhode Island 5.6 5.8 -0.2 5.5Vermont 3.3 3.7 -0.4 3.2United States 4.9 5.1 -0.2 4.9
STATE

THE CONNECTICUT ECONOMIC DIGEST10 October 2016
ECONOMIC INDICATOR TRENDSSTATE
TOTAL NONFARM EMPLOYMENT, SA, 000s Month 2014 2015 2016Jan 1,653.2 1,671.1 1,681.2
Feb 1,652.1 1,669.6 1,685.3
Mar 1,655.4 1,670.6 1,686.3
Apr 1,660.0 1,669.7 1,689.5
May 1,660.3 1,674.2 1,685.5
Jun 1,660.9 1,675.5 1,691.3
Jul 1,662.0 1,672.8 1,690.5
Aug 1,663.5 1,672.2 1,690.8
Sep 1,663.8 1,672.2
Oct 1,666.0 1,673.2
Nov 1,668.0 1,678.5
Dec 1,668.4 1,680.0
UNEMPLOYMENT RATE, SA, % Month 2014 2015 2016Jan 7.1 6.1 5.5
Feb 7.0 6.0 5.5
Mar 6.9 5.9 5.7
Apr 6.8 5.8 5.7
May 6.6 5.6 5.7
Jun 6.5 5.5 5.8
Jul 6.4 5.4 5.7
Aug 6.4 5.3 5.6
Sep 6.3 5.3
Oct 6.3 5.4
Nov 6.2 5.4
Dec 6.2 5.4
LABOR FORCE, SA, 000s Month 2014 2015 2016
Jan 1,873.8 1900.2 1,892.3
Feb 1,876.5 1900.1 1,896.1
Mar 1,879.0 1898.6 1,901.9
Apr 1,881.1 1895.9 1,904.9
May 1,882.8 1892.4 1,901.9
Jun 1,884.6 1888.7 1,900.6
Jul 1,886.6 1885.8 1,900.6
Aug 1,889.0 1884.2 1,902.3
Sep 1,891.6 1883.6Oct 1,894.4 1883.8
Nov 1,897.1 1884.3
Dec 1,899.1 1885.2
AVERAGE WEEKLY INITIAL CLAIMS, SA Month 2014 2015 2016
Jan 4,516 4,042 3,379
Feb 3,964 4,049 3,884
Mar 4,308 4,035 3,790
Apr 4,345 4,122 3,825
May 4,301 3,814 4,053
Jun 4,279 4,079 4,896
Jul 4,337 3,898 3,671Aug 4,069 4,000 3,970
Sep 4,171 3,795
Oct 4,120 3,723
Nov 4,534 3,665
Dec 4,276 3,722
0123456789
10
02 03 04 05 06 07 08 09 10 11 12 13 14 15 16
1,500
1,540
1,580
1,620
1,660
1,700
1,740
02 03 04 05 06 07 08 09 10 11 12 13 14 15 16
2,000
3,000
4,000
5,000
6,000
7,000
8,000
9,000
02 03 04 05 06 07 08 09 10 11 12 13 14 15 16
1650
1700
1750
1800
1850
1900
1950
02 03 04 05 06 07 08 09 10 11 12 13 14 15 16

THE CONNECTICUT ECONOMIC DIGEST 11October 2016
ECONOMIC INDICATOR TRENDS STATE
REAL AVG MFG HOURLY EARNINGS, NSA, 1982-84$ Month 2014 2015 2016Jan $9.35 $10.78 $11.72
Feb $9.46 $10.78 $11.73
Mar $9.29 $10.88 $11.80
Apr $9.39 $10.99 $11.81
May $9.28 $10.70 $11.98
Jun $9.26 $10.80 $11.65
Jul $9.33 $10.79 $11.58
Aug $9.61 $11.10 $11.30
Sep $9.76 $11.27
Oct $10.00 $11.33
Nov $10.27 $11.52
Dec $10.44 $11.76
AVG MANUFACTURING WEEKLY HOURS, NSA Month 2014 2015 2016Jan 42.0 40.5 41.6
Feb 40.3 40.2 41.5
Mar 41.4 40.7 42.0
Apr 40.0 40.1 41.9
May 40.4 39.7 42.9
Jun 41.4 39.6 42.8
Jul 40.6 39.4 43.2
Aug 40.0 40.5 42.2
Sep 40.6 40.1
Oct 40.4 40.7
Nov 41.4 42.3Dec 40.9 42.4
CT MFG PRODUCTION INDEX (NSA, 12 MMA, 2009=100) Month 2014 2015 2016Jan 110.9 108.3 108.8
Feb 110.9 108.2 108.8
Mar 111.0 108.5 108.8
Apr 110.3 108.5 108.9
May 109.9 107.8 109.8
Jun 109.6 108.3 109.6
Jul 108.5 108.8 109.5
Aug 108.1 108.7 109.6Sep 108.1 108.7
Oct 107.9 109.2
Nov 108.4 108.9
Dec 108.4 108.7
SECRETARY OF STATE'S NET BUSINESS STARTS, 12MMA Month 2014 2015 2016Jan 896 1,238 1,153
Feb 886 1,256 1,163
Mar 947 1,165 1,242
Apr 955 1,097 1,315
May 962 1,054 1,324
Jun 978 1,065 1,285
Jul 1,071 1,067 1,294Aug 1,174 1,073 1,329
Sep 1,242 1,061
Oct 1,264 1,063
Nov 1,266 1,080
Dec 1,260 1,133
38
39
40
41
42
43
44
02 03 04 05 06 07 08 09 10 11 12 13 14 15 16
8.0
9.0
10.0
11.0
12.0
13.0
02 03 04 05 06 07 08 09 10 11 12 13 14 15 16
80
90
100
110
120
130
140
150
02 03 04 05 06 07 08 09 10 11 12 13 14 15 16
500
700
900
1,100
1,300
1,500
1,700
1,900
02 03 04 05 06 07 08 09 10 11 12 13 14 15 16

THE CONNECTICUT ECONOMIC DIGEST12 October 2016
Not Seasonally Adjusted
Aug Aug CHANGE Jul2016 2015 NO. % 2016
TOTAL NONFARM EMPLOYMENT…………… 1,682,500 1,664,700 17,800 1.1 1,690,600TOTAL PRIVATE………………………………… 1,457,900 1,439,100 18,800 1.3 1,467,200 GOODS PRODUCING INDUSTRIES………… 221,900 221,500 400 0.2 223,200 CONSTRUCTION, NAT. RES. & MINING.…… 61,000 61,700 -700 -1.1 61,400 MANUFACTURING…………………………… 160,900 159,800 1,100 0.7 161,800 Durable Goods………………………………… 123,100 124,200 -1,100 -0.9 124,600 Fabricated Metal……………………………… 28,600 29,200 -600 -2.1 29,000 Machinery…………………………………… 13,600 14,100 -500 -3.5 13,900 Computer and Electronic Product………… 11,600 12,200 -600 -4.9 11,700 Transportation Equipment . . . . . . . . . . . . . . 42,400 41,400 1,000 2.4 42,300 Aerospace Product and Parts…………… 27,800 27,700 100 0.4 27,700 Non-Durable Goods………………………… 37,800 35,600 2,200 6.2 37,200 Chemical……………………………………… 9,700 9,800 -100 -1.0 9,700 SERVICE PROVIDING INDUSTRIES………… 1,460,600 1,443,200 17,400 1.2 1,467,400 TRADE, TRANSPORTATION, UTILITIES….. 294,300 291,800 2,500 0.9 295,200 Wholesale Trade……………………………… 64,200 62,600 1,600 2.6 63,500 Retail Trade…………………………………… 182,300 183,600 -1,300 -0.7 182,800 Motor Vehicle and Parts Dealers…………… 21,500 21,400 100 0.5 21,500 Building Material……………………………… 15,400 15,200 200 1.3 15,900 Food and Beverage Stores………………… 45,000 44,300 700 1.6 45,200 General Merchandise Stores……………… 28,700 28,600 100 0.3 28,700 Transportation, Warehousing, & Utilities…… 47,800 45,600 2,200 4.8 48,900 Utilities………………………………………… 5,500 5,600 -100 -1.8 5,500 Transportation and Warehousing………… 42,300 40,000 2,300 5.8 43,400 INFORMATION………………………………… 33,700 32,700 1,000 3.1 33,500 Telecommunications………………………… 9,300 9,100 200 2.2 9,200 FINANCIAL ACTIVITIES……………………… 133,700 131,400 2,300 1.8 134,700 Finance and Insurance……………………… 112,400 110,700 1,700 1.5 113,200 Credit Intermediation………………………… 26,000 25,700 300 1.2 26,100 Securities and Commodity Contracts……… 26,200 25,800 400 1.6 26,400 Insurance Carriers & Related Activities…… 60,200 59,200 1,000 1.7 60,700 Real Estate and Rental and Leasing……… 21,300 20,700 600 2.9 21,500 PROFESSIONAL & BUSINESS SERVICES 220,200 217,900 2,300 1.1 221,900 Professional, Scientific……………………… 94,500 95,200 -700 -0.7 96,300 Legal Services……………………………… 12,800 12,800 0 0.0 12,800 Computer Systems Design………………… 26,900 26,700 200 0.7 27,000 Management of Companies………………… 32,400 32,800 -400 -1.2 32,700 Administrative and Support………………… 93,300 89,900 3,400 3.8 92,900 Employment Services……………………… 29,000 29,300 -300 -1.0 28,600 EDUCATION AND HEALTH SERVICES…… 323,200 319,800 3,400 1.1 323,600 Educational Services………………………… 58,600 56,500 2,100 3.7 59,100 Health Care and Social Assistance………… 264,600 263,300 1,300 0.5 264,500 Hospitals……………………………………… 57,900 58,600 -700 -1.2 58,000 Nursing & Residential Care Facilities……… 62,500 63,300 -800 -1.3 62,800 Social Assistance…………………………… 56,200 54,200 2,000 3.7 55,900 LEISURE AND HOSPITALITY………………… 163,500 158,500 5,000 3.2 166,200 Arts, Entertainment, and Recreation………… 36,000 31,500 4,500 14.3 37,500 Accommodation and Food Services………… 127,500 127,000 500 0.4 128,700 Food Serv., Restaurants, Drinking Places… 114,400 113,600 800 0.7 115,200 OTHER SERVICES…………………………… 67,400 65,500 1,900 2.9 68,900 GOVERNMENT ………………………………… 224,600 225,600 -1,000 -0.4 223,400 Federal Government………………………… 17,900 17,600 300 1.7 17,700 State Government……………………………. 66,000 66,400 -400 -0.6 66,000 Local Government**…………………………… 140,700 141,600 -900 -0.6 139,700
CONNECTICUT
NONFARM EMPLOYMENT ESTIMATES
Current month’s data are preliminary. Prior months’ data have been revised. All data are benchmarked to March 2015. *Total excludes workers idled due to labor-management disputes. **Includes Indian tribal government employment
STATE

THE CONNECTICUT ECONOMIC DIGEST 13October 2016
DANBURY LMA
BRIDGEPORT -STAMFORD LMA
NONFARM EMPLOYMENT ESTIMATES
Current month’s data are preliminary. Prior months’ data have been revised. All data are benchmarked to March 2015. *Total excludes workers idled due to labor-management disputes.
LMA
Not Seasonally Adjusted
Aug Aug CHANGE Jul2016 2015 NO. % 2016
TOTAL NONFARM EMPLOYMENT…………… 417,400 409,900 7,500 1.8 422,400TOTAL PRIVATE………………………………… 374,500 367,400 7,100 1.9 378,800 GOODS PRODUCING INDUSTRIES………… 44,900 44,500 400 0.9 45,300 CONSTRUCTION, NAT. RES. & MINING.…… 13,400 12,900 500 3.9 13,600 MANUFACTURING…………………………… 31,500 31,600 -100 -0.3 31,700 Durable Goods………………………………… 22,900 23,500 -600 -2.6 23,500 SERVICE PROVIDING INDUSTRIES………… 372,500 365,400 7,100 1.9 377,100 TRADE, TRANSPORTATION, UTILITIES….. 70,300 70,100 200 0.3 71,100 Wholesale Trade……………………………… 14,000 13,600 400 2.9 13,900 Retail Trade…………………………………… 46,800 47,500 -700 -1.5 47,500 Transportation, Warehousing, & Utilities…… 9,500 9,000 500 5.6 9,700 INFORMATION………………………………… 12,700 12,100 600 5.0 12,700 FINANCIAL ACTIVITIES……………………… 43,400 41,400 2,000 4.8 44,100 Finance and Insurance……………………… 36,600 34,800 1,800 5.2 36,800 Credit Intermediation………………………… 9,600 9,600 0 0.0 9,600 Securities and Commodity Contracts……… 17,600 17,700 -100 -0.6 17,600 PROFESSIONAL & BUSINESS SERVICES 65,600 67,200 -1,600 -2.4 66,200 Professional, Scientific……………………… 25,800 28,900 -3,100 -10.7 27,100 Administrative and Support………………… 26,000 25,600 400 1.6 25,800 EDUCATION AND HEALTH SERVICES…… 71,000 70,400 600 0.9 71,100 Health Care and Social Assistance………… 60,600 59,600 1,000 1.7 60,500 LEISURE AND HOSPITALITY………………… 47,900 44,100 3,800 8.6 49,200 Accommodation and Food Services………… 33,700 31,900 1,800 5.6 34,300 OTHER SERVICES…………………………… 18,700 17,600 1,100 6.3 19,100 GOVERNMENT ………………………………… 42,900 42,500 400 0.9 43,600 Federal………………………………………… 2,500 2,400 100 4.2 2,400 State & Local…………………………………… 40,400 40,100 300 0.7 41,200
Not Seasonally Adjusted
Aug Aug CHANGE Jul2016 2015 NO. % 2016
TOTAL NONFARM EMPLOYMENT…………… 77,900 77,700 200 0.3 79,000TOTAL PRIVATE………………………………… 69,200 68,500 700 1.0 69,800 GOODS PRODUCING INDUSTRIES………… 12,400 12,400 0 0.0 12,600 SERVICE PROVIDING INDUSTRIES………… 65,500 65,300 200 0.3 66,400 TRADE, TRANSPORTATION, UTILITIES….. 16,900 17,000 -100 -0.6 17,100 Retail Trade…………………………………… 12,100 12,800 -700 -5.5 12,400 PROFESSIONAL & BUSINESS SERVICES 9,600 9,500 100 1.1 9,600 LEISURE AND HOSPITALITY………………… 7,700 7,700 0 0.0 7,800 GOVERNMENT ………………………………… 8,700 9,200 -500 -5.4 9,200 Federal………………………………………… 700 700 0 0.0 700 State & Local…………………………………… 8,000 8,500 -500 -5.9 8,500

THE CONNECTICUT ECONOMIC DIGEST14 October 2016
HARTFORD LMA
NONFARM EMPLOYMENT ESTIMATESLMA
SEASONALLY ADJUSTED TOTAL NONFARM EMPLOYMENT
Current month’s data are preliminary. Prior months’ data have been revised. All data are benchmarked to March 2015.*Total excludes workers idled due to labor-management disputes
** Unofficial seasonally adjusted estimates produced by the Connecticut Department of Labor
Not Seasonally Adjusted
Aug Aug CHANGE Jul2016 2015 NO. % 2016
TOTAL NONFARM EMPLOYMENT…………… 567,800 560,900 6,900 1.2 571,100TOTAL PRIVATE………………………………… 488,100 481,100 7,000 1.5 489,700 GOODS PRODUCING INDUSTRIES………… 76,700 77,000 -300 -0.4 76,800 CONSTRUCTION, NAT. RES. & MINING.…… 20,900 21,300 -400 -1.9 20,600 MANUFACTURING…………………………… 55,800 55,700 100 0.2 56,200 Durable Goods………………………………… 46,100 46,200 -100 -0.2 46,500 Non-Durable Goods………………………… 9,700 9,500 200 2.1 9,700 SERVICE PROVIDING INDUSTRIES………… 491,100 483,900 7,200 1.5 494,300 TRADE, TRANSPORTATION, UTILITIES….. 88,300 87,600 700 0.8 88,600 Wholesale Trade……………………………… 17,200 18,100 -900 -5.0 17,000 Retail Trade…………………………………… 55,900 55,500 400 0.7 55,900 Transportation, Warehousing, & Utilities…… 15,200 14,000 1,200 8.6 15,700 Transportation and Warehousing………… 14,300 13,100 1,200 9.2 14,800 INFORMATION………………………………… 11,900 11,900 0 0.0 11,900 FINANCIAL ACTIVITIES……………………… 58,400 57,800 600 1.0 58,400 Depository Credit Institutions……………… 6,100 6,100 0 0.0 6,100 Insurance Carriers & Related Activities…… 37,900 38,000 -100 -0.3 38,000 PROFESSIONAL & BUSINESS SERVICES 75,500 73,600 1,900 2.6 75,600 Professional, Scientific……………………… 34,800 34,500 300 0.9 34,900 Management of Companies………………… 10,000 10,000 0 0.0 10,000 Administrative and Support………………… 30,700 29,100 1,600 5.5 30,700 EDUCATION AND HEALTH SERVICES…… 106,100 103,000 3,100 3.0 105,900 Educational Services………………………… 11,700 11,300 400 3.5 11,700 Health Care and Social Assistance………… 94,400 91,700 2,700 2.9 94,200 Ambulatory Health Care…………………… 31,700 30,800 900 2.9 31,400 LEISURE AND HOSPITALITY………………… 48,500 47,900 600 1.3 49,300 Accommodation and Food Services………… 39,300 39,000 300 0.8 39,700 OTHER SERVICES…………………………… 22,700 22,300 400 1.8 23,200 GOVERNMENT ………………………………… 79,700 79,800 -100 -0.1 81,400 Federal………………………………………… 5,400 5,300 100 1.9 5,400 State & Local…………………………………… 74,300 74,500 -200 -0.3 76,000
Seasonally AdjustedAug Aug CHANGE Jul
Labor Market Areas 2016 2015 NO. % 2016 BRIDGEPORT-STAMFORD LMA……………… 416,400 409,400 7,000 1.7 415,300 DANBURY LMA**……………………………… 78,600 78,500 100 0.1 79,000 HARTFORD LMA………………………………. 575,700 568,900 6,800 1.2 574,900 NEW HAVEN LMA……………………………… 284,200 279,800 4,400 1.6 283,400 NORWICH-NEW LONDON LMA……………… 129,300 127,900 1,400 1.1 128,700 WATERBURY LMA**…………………………… 67,200 66,600 600 0.9 67,700 ENFIELD LMA**………………………………… 45,700 45,500 200 0.4 45,700 TORRINGTON-NORTHWEST LMA**………… 33,600 33,400 200 0.6 33,900 DANIELSON-NORTHEAST LMA**…………… 27,200 27,000 200 0.7 27,300

THE CONNECTICUT ECONOMIC DIGEST 15October 2016
NEW HAVEN LMA
NONFARM EMPLOYMENT ESTIMATES
Current month’s data are preliminary. Prior months’ data have been revised. All data are benchmarked to March 2015. *Total excludes workers idled due to labor-management disputes. **Value less than 50
LMA
HELP WANTED ONLINE
* A percent of advertised vacancies per 100 persons in labor forceSource: The Conference Board
CT Online Labor DemandFell 700 in August 2016
The Conference Board’s HelpWanted OnLine (HWOL) datareported that there were 64,100advertisements for Connecticut-based jobs in August 2016, a 1.1percent decrease over the monthand a 16.4 percent decrease overthe year. There were 3.37 adver-tised vacancies for every 100persons in Connecticut’s labor force,while nationally it was 3.02 percent.Among the New England states,Massachusetts had the highestlabor demand rate (4.04), whileMaine had the lowest rate (2.59).
The Conference Board Help Wanted OnLine® Data Series (HWOL) measures the number ofnew, first-time online jobs and jobs reposted from the previous month for over 16,000 Internet jobboards, corporate boards and smaller job sites that serve niche markets and smaller geographicareas. Background information and technical notes and discussion of revisions to the series areavailable at: www.conference-board.org/data/helpwantedonline.cfm.
Not Seasonally Adjusted
Aug Aug CHANGE Jul2016 2015 NO. % 2016
TOTAL NONFARM EMPLOYMENT…………… 278,800 274,200 4,600 1.7 281,200 TOTAL PRIVATE………………………………… 247,000 242,800 4,200 1.7 248,900 GOODS PRODUCING INDUSTRIES………… 35,500 35,600 -100 -0.3 35,800 CONSTRUCTION, NAT. RES. & MINING.…… 11,700 11,200 500 4.5 11,800 MANUFACTURING…………………………… 23,800 24,400 -600 -2.5 24,000 Durable Goods………………………………… 17,900 18,300 -400 -2.2 18,200 SERVICE PROVIDING INDUSTRIES………… 243,300 238,600 4,700 2.0 245,400 TRADE, TRANSPORTATION, UTILITIES….. 50,000 49,300 700 1.4 50,200 Wholesale Trade……………………………… 11,500 11,200 300 2.7 11,400 Retail Trade…………………………………… 29,800 29,600 200 0.7 29,800 Transportation, Warehousing, & Utilities…… 8,700 8,500 200 2.4 9,000 INFORMATION………………………………… 3,300 3,500 -200 -5.7 3,300 FINANCIAL ACTIVITIES……………………… 13,000 12,800 200 1.6 13,100 Finance and Insurance……………………… 9,100 9,000 100 1.1 9,100 PROFESSIONAL & BUSINESS SERVICES 31,500 30,400 1,100 3.6 31,900 Administrative and Support………………… 15,600 14,500 1,100 7.6 15,500 EDUCATION AND HEALTH SERVICES…… 75,200 75,600 -400 -0.5 75,700 Educational Services………………………… 26,500 26,200 300 1.1 27,100 Health Care and Social Assistance………… 48,700 49,400 -700 -1.4 48,600 LEISURE AND HOSPITALITY………………… 27,400 24,800 2,600 10.5 27,500 Accommodation and Food Services………… 21,300 20,800 500 2.4 21,100 OTHER SERVICES…………………………… 11,100 10,800 300 2.8 11,400 GOVERNMENT ………………………………… 31,800 31,400 400 1.3 32,300 Federal………………………………………… 4,900 4,800 100 2.1 4,800 State & Local…………………………………… 26,900 26,600 300 1.1 27,500
Aug Aug Jul(Seasonally adjusted) 2016 2015 2016CT Vacancies (000s) 64.1 76.7 64.8
Hartford Vac. (000s) 25.5 30.5 25.2
Connecticut 3.37 4.07 3.41
United States 3.02 3.42 3.02
Maine 2.59 3.70 3.21
Massachusetts 4.04 4.70 4.08
New Hampshire 3.10 3.44 3.20Rhode Island 2.71 3.79 2.74
Vermont 3.00 3.91 3.14
Labor Demand Rate *

THE CONNECTICUT ECONOMIC DIGEST16 October 2016
NORWICH-NEW LONDON-WESTERLY, CT-RI LMA
Current month’s data are preliminary. Prior months’ data have been revised. All data are benchmarked to March 2015. *Total excludes workers idled due to labor-management disputes. **Includes Indian tribal government employment.
NONFARM EMPLOYMENT ESTIMATES
WATERBURY LMA
LMA
Not Seasonally Adjusted
Aug Aug CHANGE Jul2016 2015 NO. % 2016
TOTAL NONFARM EMPLOYMENT…………… 130,100 129,700 400 0.3 130,600TOTAL PRIVATE………………………………… 100,600 98,300 2,300 2.3 101,000 GOODS PRODUCING INDUSTRIES………… 20,500 20,000 500 2.5 20,500 CONSTRUCTION, NAT. RES. & MINING.…… 4,200 4,000 200 5.0 4,200 MANUFACTURING…………………………… 16,300 16,000 300 1.9 16,300 Durable Goods………………………………… 13,000 12,600 400 3.2 13,000 Non-Durable Goods………………………… 3,300 3,400 -100 -2.9 3,300 SERVICE PROVIDING INDUSTRIES………… 109,600 109,700 -100 -0.1 110,100 TRADE, TRANSPORTATION, UTILITIES….. 23,300 23,100 200 0.9 23,300 Wholesale Trade……………………………… 2,600 2,500 100 4.0 2,600 Retail Trade…………………………………… 16,400 16,600 -200 -1.2 16,300 Transportation, Warehousing, & Utilities…… 4,300 4,000 300 7.5 4,400 INFORMATION………………………………… 1,100 1,100 0 0.0 1,100 FINANCIAL ACTIVITIES……………………… 3,200 3,200 0 0.0 3,200 PROFESSIONAL & BUSINESS SERVICES 8,900 8,400 500 6.0 9,000 EDUCATION AND HEALTH SERVICES…… 19,500 20,200 -700 -3.5 19,600 Health Care and Social Assistance………… 17,400 18,100 -700 -3.9 17,500 LEISURE AND HOSPITALITY………………… 20,300 18,700 1,600 8.6 20,500 Accommodation and Food Services………… 15,200 15,500 -300 -1.9 15,400 Food Serv., Restaurants, Drinking Places… 12,900 12,900 0 0.0 12,900 OTHER SERVICES…………………………… 3,800 3,600 200 5.6 3,800 GOVERNMENT ………………………………… 29,500 31,400 -1,900 -6.1 29,600 Federal………………………………………… 2,800 2,800 0 0.0 2,800 State & Local**………………………………… 26,700 28,600 -1,900 -6.6 26,800
Not Seasonally Adjusted
Aug Aug CHANGE Jul 2016 2015 NO. % 2016
TOTAL NONFARM EMPLOYMENT…………… 66,500 65,900 600 0.9 67,300TOTAL PRIVATE………………………………… 57,600 56,900 700 1.2 58,000 GOODS PRODUCING INDUSTRIES………… 10,600 10,500 100 1.0 10,700 CONSTRUCTION, NAT. RES. & MINING.…… 2,800 2,800 0 0.0 2,900 MANUFACTURING…………………………… 7,800 7,700 100 1.3 7,800 SERVICE PROVIDING INDUSTRIES………… 55,900 55,400 500 0.9 56,600 TRADE, TRANSPORTATION, UTILITIES….. 13,100 12,700 400 3.1 13,100 Wholesale Trade……………………………… 2,100 2,100 0 0.0 2,100 Retail Trade…………………………………… 9,400 9,100 300 3.3 9,400 Transportation, Warehousing, & Utilities…… 1,600 1,500 100 6.7 1,600 INFORMATION………………………………… 600 600 0 0.0 600 FINANCIAL ACTIVITIES……………………… 2,000 2,000 0 0.0 2,000 PROFESSIONAL & BUSINESS SERVICES 5,100 5,300 -200 -3.8 5,100 EDUCATION AND HEALTH SERVICES…… 17,300 17,000 300 1.8 17,600 Health Care and Social Assistance………… 15,500 15,500 0 0.0 15,600 LEISURE AND HOSPITALITY………………… 6,100 6,100 0 0.0 6,100 OTHER SERVICES…………………………… 2,800 2,700 100 3.7 2,800 GOVERNMENT ………………………………… 8,900 9,000 -100 -1.1 9,300 Federal………………………………………… 500 500 0 0.0 500 State & Local…………………………………… 8,400 8,500 -100 -1.2 8,800

THE CONNECTICUT ECONOMIC DIGEST 17October 2016
NONFARM EMPLOYMENT ESTIMATES
NOTE: More industry detail data is available for the State and its nine labor market areas at: http://www.ctdol.state.ct.us/lmi/202/covered.htm. The data published there differ from the data in the preced-ing tables in that they are developed from a near-universe count of Connecticut employment covered bythe unemployment insurance (UI) program, while the data here is sample-based. The data drawn fromthe UI program does not contain estimates of employment not covered by unemployment insurance, andis lagged several months behind the current employment estimates presented here.
SMALLER LMAS*
Current month’s data are preliminary. Prior months’ data have been revised. All data are benchmarked to March 2015. *Total excludes workers idled due to labor-management disputes.
SPRINGFIELD, MA-CTNECTA**
** New England City and Town Area
LMA
For further information on these nonfarm employment estimates contact Lincoln Dyer at (860) 263-6292.
Not Seasonally Adjusted
Aug Aug CHANGE Jul 2016 2015 NO. % 2016
TOTAL NONFARM EMPLOYMENT ENFIELD LMA…………………………………… 45,400 45,300 100 0.2 45,600 TORRINGTON-NORTHWEST LMA…………… 34,000 33,800 200 0.6 34,700 DANIELSON-NORTHEAST LMA……………… 27,400 27,200 200 0.7 27,200
Not Seasonally Adjusted
Aug Aug CHANGE Jul2016 2015 NO. % 2016
TOTAL NONFARM EMPLOYMENT…………… 329,300 324,000 5,300 1.6 328,300TOTAL PRIVATE………………………………… 272,700 266,600 6,100 2.3 271,000 GOODS PRODUCING INDUSTRIES………… 41,100 41,300 -200 -0.5 40,800 CONSTRUCTION, NAT. RES. & MINING.…… 12,200 12,100 100 0.8 12,000 MANUFACTURING…………………………… 28,900 29,200 -300 -1.0 28,800 Durable Goods………………………………… 19,600 19,900 -300 -1.5 19,600 Non-Durable Goods………………………… 9,300 9,300 0 0.0 9,200 SERVICE PROVIDING INDUSTRIES………… 288,200 282,700 5,500 1.9 287,500 TRADE, TRANSPORTATION, UTILITIES….. 60,000 58,700 1,300 2.2 59,800 Wholesale Trade……………………………… 11,300 11,400 -100 -0.9 11,400 Retail Trade…………………………………… 35,000 34,500 500 1.4 34,700 Transportation, Warehousing, & Utilities…… 13,700 12,800 900 7.0 13,700 INFORMATION………………………………… 3,400 3,400 0 0.0 3,400 FINANCIAL ACTIVITIES……………………… 17,400 17,400 0 0.0 17,500 Finance and Insurance……………………… 13,900 13,900 0 0.0 13,900 Insurance Carriers & Related Activities…… 9,300 9,400 -100 -1.1 9,400 PROFESSIONAL & BUSINESS SERVICES 30,600 26,600 4,000 15.0 29,900 EDUCATION AND HEALTH SERVICES…… 76,100 75,300 800 1.1 75,900 Educational Services………………………… 12,200 13,100 -900 -6.9 12,100 Health Care and Social Assistance………… 63,900 62,200 1,700 2.7 63,800 LEISURE AND HOSPITALITY………………… 30,900 30,900 0 0.0 30,400 OTHER SERVICES…………………………… 13,200 13,000 200 1.5 13,300 GOVERNMENT ………………………………… 56,600 57,400 -800 -1.4 57,300 Federal………………………………………… 5,800 5,900 -100 -1.7 5,800 State & Local…………………………………… 50,800 51,500 -700 -1.4 51,500
* State-designated Non-CES areas

THE CONNECTICUT ECONOMIC DIGEST18 October 2016
LABOR FORCE ESTIMATES
Current month’s data are preliminary. Prior months’ data have been revised. All data are benchmarked to March 2015.
EMPLOYMENT Aug Aug CHANGE Jul(Not seasonally adjusted) STATUS 2016 2015 NO. % 2016
CONNECTICUT Civilian Labor Force 1,919,300 1,898,900 20,400 1.1 1,940,500Employed 1,812,100 1,792,300 19,800 1.1 1,831,400
Unemployed 107,200 106,500 700 0.7 109,100Unemployment Rate 5.6 5.6 0.0 --- 5.6
BRIDGEPORT-STAMFORD LMA Civilian Labor Force 476,400 469,500 6,900 1.5 483,800Employed 450,800 444,100 6,700 1.5 457,700
Unemployed 25,600 25,500 100 0.4 26,000Unemployment Rate 5.4 5.4 0.0 --- 5.4
DANBURY LMA Civilian Labor Force 108,400 107,600 800 0.7 110,100Employed 103,400 102,700 700 0.7 105,000
Unemployed 5,000 4,900 100 2.0 5,100Unemployment Rate 4.6 4.6 0.0 --- 4.6
DANIELSON-NORTHEAST LMA Civilian Labor Force 43,900 43,400 500 1.2 44,200Employed 41,400 40,800 600 1.5 41,700
Unemployed 2,500 2,500 0 0.0 2,500Unemployment Rate 5.6 5.8 -0.2 --- 5.7
ENFIELD LMA Civilian Labor Force 50,600 49,800 800 1.6 50,600Employed 47,700 47,200 500 1.1 47,700
Unemployed 2,800 2,600 200 7.7 2,900Unemployment Rate 5.6 5.3 0.3 --- 5.8
HARTFORD LMA Civilian Labor Force 623,800 617,700 6,100 1.0 629,100Employed 588,100 582,700 5,400 0.9 592,800
Unemployed 35,700 35,000 700 2.0 36,300Unemployment Rate 5.7 5.7 0.0 --- 5.8
NEW HAVEN LMA Civilian Labor Force 326,400 322,400 4,000 1.2 330,100Employed 307,900 303,800 4,100 1.3 311,300
Unemployed 18,400 18,600 -200 -1.1 18,800Unemployment Rate 5.6 5.8 -0.2 --- 5.7
NORWICH-NEW LONDON LMA Civilian Labor Force 145,000 145,200 -200 -0.1 145,900Employed 136,900 136,800 100 0.1 137,700
Unemployed 8,100 8,400 -300 -3.6 8,200Unemployment Rate 5.6 5.8 -0.2 --- 5.6
TORRINGTON-NORTHWEST LMA Civilian Labor Force 48,800 48,300 500 1.0 49,400Employed 46,400 45,900 500 1.1 46,900
Unemployed 2,400 2,400 0 0.0 2,500Unemployment Rate 5.0 4.9 0.1 --- 5.0
WATERBURY LMA Civilian Labor Force 112,300 111,400 900 0.8 113,600Employed 104,700 103,600 1,100 1.1 105,900
Unemployed 7,700 7,800 -100 -1.3 7,600Unemployment Rate 6.8 7.0 -0.2 --- 6.7
UNITED STATES Civilian Labor Force 159,800,000 157,390,000 2,410,000 1.5 160,705,000Employed 151,804,000 149,228,000 2,576,000 1.7 152,437,000
Unemployed 7,996,000 8,162,000 -166,000 -2.0 8,267,000Unemployment Rate 5.0 5.2 -0.2 --- 5.1
LMA

THE CONNECTICUT ECONOMIC DIGEST 19October 2016
HOURS AND EARNINGS
Current month’s data are preliminary. Prior months’ data have been revised. All data are benchmarked to March 2015.
BUSINESS AND EMPLOYMENT CHANGES ANNOUNCED IN THE NEWS MEDIA
In August 2016, More than a year after the closure of the Farmington Avenue Restaurant,a new family-run eatery will soon be opening at the site on Route 372. Renovations willsoon be completed on the restaurant, which will be known as The Avenue.
In August 2016, Department of Developmental Services is shifting dozens of state-runprograms to private sector to meet a savings target, involving 600 workers. SikorskyAircraft is laying off 109 employees from its helicopter manufacturing location in Stratford.
Business & Employment Changes Announced in the News Media lists start-ups, expansions, staff reductions, and layoffs reportedby the media, both current and future. The report provides company name, the number of workers involved, date of the action, theprincipal product or service of the company, a brief synopsis of the action, and the source and date of the media article. Thispublication is available in both HTML and PDF formats at the Connecticut Department of Labor Web site, http://www.ctdol.state.ct.us/lmi/busemp.htm.
LMA
AVG WEEKLY EARNINGS AVG WEEKLY HOURS AVG HOURLY EARNINGSAug CHG Jul Aug CHG Jul Aug CHG Jul
(Not seasonally adjusted) 2016 2015 Y/Y 2016 2016 2015 Y/Y 2016 2016 2015 Y/Y 2016
PRODUCTION WORKERMANUFACTURING $1,119.99 $1,048.95 $71.04 $1,175.04 42.2 40.5 1.7 43.2 $26.54 $25.90 $0.64 $27.20 DURABLE GOODS 1,165.15 1,094.42 70.73 1,221.45 42.4 40.7 1.7 43.1 27.48 26.89 0.59 28.34 NON-DUR. GOODS 969.70 905.60 64.10 1,007.31 41.6 40.0 1.6 43.4 23.31 22.64 0.67 23.21CONSTRUCTION 1,145.82 1,175.07 -29.25 1,158.92 39.0 39.3 -0.3 39.1 29.38 29.90 -0.52 29.64
ALL EMPLOYEESSTATEWIDETOTAL PRIVATE 1,018.07 997.90 20.17 1,014.05 33.5 34.0 -0.5 33.6 30.39 29.35 1.04 30.18GOODS PRODUCING 1,251.12 1,236.90 14.22 1,269.45 40.1 39.9 0.2 40.3 31.20 31.00 0.20 31.50 Construction 1,189.56 1,221.97 -32.40 1,192.23 38.9 39.7 -0.8 39.0 30.58 30.78 -0.20 30.57 Manufacturing 1,280.99 1,236.80 44.19 1,309.34 40.9 40.0 0.9 41.2 31.32 30.92 0.40 31.78SERVICE PROVIDING 975.78 953.77 22.01 968.44 32.3 32.9 -0.6 32.4 30.21 28.99 1.22 29.89 Trade, Transp., Utilities 868.79 809.28 59.51 874.78 32.6 33.4 -0.8 32.8 26.65 24.23 2.42 26.67 Financial Activities 1,701.53 1,794.39 -92.86 1,644.64 36.6 39.0 -2.4 37.1 46.49 46.01 0.48 44.33 Prof. & Business Serv. 1,219.41 1,221.79 -2.39 1,223.94 34.9 35.2 -0.3 35.1 34.94 34.71 0.23 34.87 Education & Health Ser. 894.48 826.10 68.37 886.82 31.9 31.7 0.2 31.9 28.04 26.06 1.98 27.80 Leisure & Hospitality 424.58 421.09 3.49 428.47 26.0 26.5 -0.5 26.4 16.33 15.89 0.44 16.23 Other Services 723.96 623.34 100.62 692.59 31.6 29.5 2.1 30.7 22.91 21.13 1.78 22.56
LABOR MARKET AREAS: TOTAL PRIVATE Bridgeport-Stamford 1,153.07 1,187.84 -34.76 1,143.02 33.5 34.5 -1.0 33.5 34.42 34.43 -0.01 34.12 Danbury 942.36 931.60 10.76 953.02 33.1 34.8 -1.7 34.0 28.47 26.77 1.70 28.03 Hartford 1,056.44 1,028.31 28.13 1,058.49 34.3 34.6 -0.3 34.4 30.80 29.72 1.08 30.77 New Haven 942.15 927.42 14.73 929.45 33.0 33.7 -0.7 33.1 28.55 27.52 1.03 28.08 Norwich-New London 793.61 752.73 40.88 770.15 32.3 32.6 -0.3 32.4 24.57 23.09 1.48 23.77 Waterbury 827.75 786.79 40.96 817.71 35.0 33.1 1.9 34.9 23.65 23.77 -0.12 23.43
THE CONNECTICUT ECONOMIC DIGEST20 October 2016
LABOR FORCE ESTIMATES BY TOWN
AUGUST 2016(By Place of Residence - Not Seasonally Adjusted)
The civilian labor force comprises all state residents age 16 years and older classified as employed or unemployed in accordance with criteria described below.Excluded are members of the military and persons in institutions (correctional and mental health, for example).
The employed are all persons who did any work as paid employees or in their own business during the survey week, or who have worked 15 hours or more asunpaid workers in an enterprise operated by a family member. Persons temporarily absent from a job because of illness, bad weather, strike or for personalreasons are also counted as employed whether they were paid by their employer or were seeking other jobs.
The unemployed are all persons who did not work, but were available for work during the survey week (except for temporary illness) and made specific efforts tofind a job in the prior four weeks. Persons waiting to be recalled to a job from which they had been laid off need not be looking for work to be classified asunemployed.
LABOR FORCE CONCEPTS
Town
All Labor Market Areas (LMAs) in Connecticut except three are federally-designated areas for developing labor statistics. For the sake of simplicity, thefederal Bridgeport-Stamford-Norwalk NECTA is referred to in Connecticut DOLpublications as the Bridgeport-Stamford LMA, and the Hartford-West Hartford-East Hartford NECTA is the Hartford LMA. The northwest part of the state isnow called Torrington-Northwest LMA. Five towns which are part of theSpringfield, MA area are published as the Enfield LMA. The towns of Eastfordand Hampton and other towns in the northeast are now called Danielson-Northeast LMA.
LMA/TOWNS LABOR FORCE EMPLOYED UNEMPLOYED % LMA/TOWNS LABOR FORCE EMPLOYED UNEMPLOYED %BRIDGEPORT-STAMFORD HARTFORD cont...
476,392 450,801 25,591 5.4 Canton 5,677 5,459 218 3.8Ansonia 9,653 8,941 712 7.4 Chaplin 1,252 1,182 70 5.6Bridgeport 72,817 66,754 6,063 8.3 Colchester 9,436 9,038 398 4.2Darien 8,782 8,390 392 4.5 Columbia 3,280 3,131 149 4.5Derby 7,057 6,581 476 6.7 Coventry 7,774 7,428 346 4.5Easton 3,957 3,812 145 3.7 Cromwell 7,967 7,609 358 4.5Fairfield 29,802 28,375 1,427 4.8 East Granby 3,079 2,945 134 4.4Greenwich 29,366 28,168 1,198 4.1 East Haddam 5,057 4,805 252 5.0Milford 30,612 29,115 1,497 4.9 East Hampton 7,654 7,308 346 4.5Monroe 10,475 9,959 516 4.9 East Hartford 27,781 25,678 2,103 7.6New Canaan 8,563 8,211 352 4.1 Ellington 9,187 8,775 412 4.5Norwalk 51,363 48,989 2,374 4.6 Farmington 14,078 13,513 565 4.0Oxford 7,309 6,983 326 4.5 Glastonbury 18,941 18,211 730 3.9Redding 4,621 4,416 205 4.4 Granby 6,726 6,465 261 3.9Ridgefield 12,091 11,617 474 3.9 Haddam 5,104 4,909 195 3.8Seymour 9,233 8,701 532 5.8 Hartford 54,873 48,941 5,932 10.8Shelton 22,653 21,460 1,193 5.3 Hartland 1,142 1,097 45 3.9Southbury 9,095 8,614 481 5.3 Harwinton 3,237 3,098 139 4.3Stamford 70,986 67,721 3,265 4.6 Hebron 5,543 5,342 201 3.6Stratford 28,462 26,604 1,858 6.5 Lebanon 4,202 3,999 203 4.8Trumbull 18,543 17,715 828 4.5 Manchester 33,046 31,125 1,921 5.8Weston 4,471 4,278 193 4.3 Mansfield 12,752 12,019 733 5.7Westport 12,760 12,232 528 4.1 Marlborough 3,584 3,433 151 4.2Wilton 8,731 8,361 370 4.2 Middletown 26,372 24,864 1,508 5.7Woodbridge 4,990 4,804 186 3.7 New Britain 37,029 34,061 2,968 8.0
New Hartford 3,991 3,824 167 4.2DANBURY 108,366 103,372 4,994 4.6 Newington 17,369 16,563 806 4.6Bethel 10,863 10,365 498 4.6 Plainville 10,467 9,937 530 5.1Bridgewater 871 839 32 3.7 Plymouth 6,725 6,299 426 6.3Brookfield 9,457 9,021 436 4.6 Portland 5,519 5,230 289 5.2Danbury 47,423 45,245 2,178 4.6 Rocky Hill 11,514 11,024 490 4.3New Fairfield 7,356 6,999 357 4.9 Scotland 967 919 48 5.0New Milford 15,809 15,079 730 4.6 Simsbury 13,010 12,507 503 3.9Newtown 14,610 13,927 683 4.7 Southington 24,389 23,281 1,108 4.5Sherman 1,977 1,897 80 4.0 South Windsor 14,115 13,444 671 4.8
Stafford 6,907 6,505 402 5.8ENFIELD 50,560 47,722 2,838 5.6 Thomaston 4,772 4,558 214 4.5East Windsor 6,576 6,206 370 5.6 Tolland 8,602 8,269 333 3.9Enfield 23,569 22,107 1,462 6.2 Union 471 450 21 4.5Somers 5,278 5,015 263 5.0 Vernon 17,171 16,253 918 5.3Suffield 7,668 7,342 326 4.3 West Hartford 34,363 32,918 1,445 4.2Windsor Locks 7,469 7,052 417 5.6 Wethersfield 14,107 13,397 710 5.0
Willington 3,683 3,519 164 4.5HARTFORD 623,765 588,109 35,656 5.7 Windham 12,826 11,951 875 6.8Andover 1,943 1,855 88 4.5 Windsor 16,669 15,728 941 5.6Ashford 2,587 2,459 128 4.9Avon 9,358 9,008 350 3.7Barkhamsted 2,313 2,220 93 4.0Berlin 11,758 11,252 506 4.3Bloomfield 11,550 10,817 733 6.3Bolton 3,175 3,045 130 4.1Bristol 33,067 31,082 1,985 6.0Burlington 5,604 5,360 244 4.4

THE CONNECTICUT ECONOMIC DIGEST 21October 2016
LABOR FORCE ESTIMATES BY TOWN
The unemployment rate represents the number unemployed as a percent of the civilian labor force.
With the exception of those persons temporarily absent from a job or waiting to be recalled to one, persons with no job and who are not actively looking for oneare counted as "not in the labor force".
Over the course of a year, the size of the labor force and the levels of employment undergo fluctuations due to such seasonal events as changes in weather,reduced or expanded production, harvests, major holidays and the opening and closing of schools. Because these seasonal events follow a regular pattern eachyear, their influence on statistical trends can be eliminated by adjusting the monthly statistics. Seasonal Adjustment makes it easier to observe cyclical and othernonseasonal developments.
(By Place of Residence - Not Seasonally Adjusted)
AUGUST 2016
LABOR FORCE CONCEPTS (Continued)
Town
LMA/TOWNS LABOR FORCE EMPLOYED UNEMPLOYED % LMA/TOWNS LABOR FORCE EMPLOYED UNEMPLOYED %NEW HAVEN 326,367 307,935 18,432 5.6 TORRINGTON-NORTHWESTBethany 3,110 2,987 123 4.0 48,806 46,372 2,434 5.0Branford 16,055 15,273 782 4.9 Canaan 746 725 21 2.8Cheshire 15,636 15,037 599 3.8 Colebrook 854 814 40 4.7Chester 2,358 2,261 97 4.1 Cornwall 785 764 21 2.7Clinton 7,352 7,044 308 4.2 Goshen 1,732 1,668 64 3.7Deep River 2,878 2,770 108 3.8 Kent 1,578 1,512 66 4.2Durham 4,346 4,190 156 3.6 Litchfield 4,909 4,699 210 4.3East Haven 15,888 14,900 988 6.2 Morris 1,490 1,434 56 3.8Essex 3,322 3,189 133 4.0 Norfolk 919 882 37 4.0Guilford 12,884 12,385 499 3.9 North Canaan 1,752 1,659 93 5.3Hamden 35,442 33,554 1,888 5.3 Roxbury 1,364 1,316 48 3.5Killingworth 3,837 3,696 141 3.7 Salisbury 1,865 1,802 63 3.4Madison 9,060 8,677 383 4.2 Sharon 1,514 1,466 48 3.2Meriden 32,396 30,196 2,200 6.8 Torrington 20,053 18,839 1,214 6.1Middlefield 2,530 2,405 125 4.9 Warren 812 782 30 3.7New Haven 65,017 60,160 4,857 7.5 Washington 2,096 2,022 74 3.5North Branford 8,205 7,833 372 4.5 Winchester 6,337 5,988 349 5.5North Haven 13,405 12,751 654 4.9Old Saybrook 5,103 4,863 240 4.7 WATERBURY 112,322 104,655 7,667 6.8Orange 7,251 6,932 319 4.4 Beacon Falls 3,443 3,260 183 5.3Wallingford 26,419 25,153 1,266 4.8 Bethlehem 2,008 1,922 86 4.3West Haven 30,252 28,238 2,014 6.7 Middlebury 3,842 3,667 175 4.6Westbrook 3,621 3,441 180 5.0 Naugatuck 17,432 16,346 1,086 6.2
Prospect 5,561 5,322 239 4.3*NORWICH-NEW LONDON-WESTERLY, CT PART Waterbury 51,413 46,824 4,589 8.9
128,775 121,704 7,071 5.5 Watertown 13,152 12,543 609 4.6Bozrah 1,472 1,404 68 4.6 Wolcott 9,887 9,420 467 4.7Canterbury 2,899 2,756 143 4.9 Woodbury 5,584 5,351 233 4.2East Lyme 8,818 8,383 435 4.9Franklin 1,118 1,062 56 5.0 DANIELSON-NORTHEASTGriswold 6,470 6,040 430 6.6 43,897 41,423 2,474 5.6Groton 18,905 17,992 913 4.8 Brooklyn 4,179 3,936 243 5.8Ledyard 8,122 7,748 374 4.6 Eastford 962 930 32 3.3Lisbon 2,402 2,255 147 6.1 Hampton 1,062 999 63 5.9Lyme 1,235 1,191 44 3.6 Killingly 9,746 9,164 582 6.0Montville 9,602 9,079 523 5.4 Plainfield 8,818 8,246 572 6.5New London 12,285 11,342 943 7.7 Pomfret 2,532 2,437 95 3.8No. Stonington 2,957 2,829 128 4.3 Putnam 4,932 4,633 299 6.1Norwich 20,761 19,387 1,374 6.6 Sterling 2,041 1,920 121 5.9Old Lyme 3,791 3,640 151 4.0 Thompson 5,353 5,081 272 5.1Preston 2,477 2,362 115 4.6 Woodstock 4,272 4,077 195 4.6Salem 2,149 2,044 105 4.9Sprague 1,658 1,556 102 6.2Stonington 9,701 9,284 417 4.3Voluntown 1,545 1,468 77 5.0Waterford 10,408 9,882 526 5.1
Not Seasonally Adjusted:CONNECTICUT 1,919,300 1,812,100 107,200 5.6
*Connecticut portion only. For whole NECTA,including RI part, see below. UNITED STATES 159,800,000 151,804,000 7,996,000 5.0NORWICH-NEW LONDON-WESTERLY, CT-RI
144,978 136,889 8,089 5.6 Seasonally Adjusted:RI part 16,203 15,185 1,018 6.3 CONNECTICUT 1,902,300 1,796,200 106,100 5.6(Hopkinton and Westerly) UNITED STATES 159,463,000 151,614,000 7,849,000 4.9

THE CONNECTICUT ECONOMIC DIGEST22 October 2016
HOUSING PERMIT ACTIVITY BY TOWN
For further information on the housing permit data, contact Kolie Sun of DECD at (860) 270-8167.
TOWN AUG YR TO DATE TOWN AUG YR TO DATE TOWN AUG YR TO DATE2016 2016 2015 2016 2016 2015 2016 2016 2015
Andover 0 1 0 Griswold 1 8 2 Preston 2 4 4Ansonia na na na Groton na na na Prospect 4 18 23Ashford na na na Guilford na na na Putnam na na naAvon 3 17 22 Haddam 0 6 10 Redding 0 2 4Barkhamsted na na na Hamden na na na Ridgefield 1 34 22Beacon Falls na na na Hampton na na na Rocky Hill 2 9 103Berlin 0 8 15 Hartford 1 3 4 Roxbury na na naBethany na na na Hartland 0 0 0 Salem na na naBethel 5 50 44 Harwinton na na na Salisbury na na naBethlehem na na na Hebron 1 7 9 Scotland na na na
Bloomfield 0 88 14 Kent 0 1 0 Seymour na na naBolton 0 3 4 Killingly na na na Sharon na na naBozrah na na na Killingworth 1 4 3 Shelton 2 34 99Branford 2 18 15 Lebanon 11 15 2 Sherman 0 0 5Bridgeport 4 71 106 Ledyard na na na Simsbury 17 224 9Bridgewater 0 0 0 Lisbon na na na Somers 0 11 9Bristol 2 25 18 Litchfield na na na South Windsor 2 62 20Brookfield 2 23 38 Lyme 1 3 3 Southbury na na naBrooklyn 0 7 8 Madison na na na Southington 6 61 54Burlington 1 14 12 Manchester 6 21 8 Sprague 0 1 0
Canaan na na na Mansfield 0 3 8 Stafford 1 83 2Canterbury na na na Marlborough 0 0 1 Stamford 3 40 321Canton 0 3 7 Meriden na na na Sterling na na naChaplin na na na Middlebury na na na Stonington na na naCheshire 4 21 25 Middlefield 2 5 6 Stratford 0 12 19Chester 0 1 0 Middletown 3 18 25 Suffield 2 21 21Clinton 1 10 4 Milford 17 109 266 Thomaston na na naColchester 19 51 22 Monroe 1 5 1 Thompson na na naColebrook na na na Montville na na na Tolland 0 4 5Columbia 1 8 11 Morris na na na Torrington na na na
Cornwall na na na Naugatuck na na na Trumbull 2 4 5Coventry 3 11 18 New Britain 0 3 64 Union 0 0 1Cromwell 2 12 13 New Canaan 2 19 21 Vernon 12 71 43Danbury 6 70 563 New Fairfield 1 9 1 Voluntown 1 2 4Darien 5 29 53 New Hartford na na na Wallingford 2 15 14Deep River 0 1 0 New Haven 0 133 236 Warren na na naDerby na na na New London 4 25 27 Washington na na naDurham 1 8 4 New Milford na na na Waterbury 0 12 78East Granby 2 2 0 Newington 2 9 9 Waterford na na naEast Haddam 2 13 3 Newtown 2 34 11 Watertown na na na
East Hampton 1 15 24 Norfolk na na na West Hartford 6 27 80East Hartford 0 1 2 North Branford na na na West Haven na na naEast Haven na na na North Canaan na na na Westbrook 1 14 26East Lyme 3 15 26 North Haven na na na Weston 3 6 10East Windsor 1 11 5 North Stonington na na na Westport 4 48 58Eastford na na na Norwalk 1 187 85 Wethersfield 0 1 2Easton 0 5 1 Norwich 10 11 3 Willington 0 25 0Ellington 9 56 75 Old Lyme na na na Wilton 0 8 14Enfield 11 63 9 Old Saybrook 2 9 7 Winchester na na naEssex 1 27 3 Orange na na na Windham 0 2 7
Fairfield 6 222 71 Oxford 1 14 18 Windsor 0 11 10Farmington 11 21 26 Plainfield na na na Windsor Locks 2 12 6Franklin na na na Plainville 1 5 5 Wolcott 4 11 18Glastonbury 1 23 28 Plymouth na na na Woodbridge na na naGoshen na na na Pomfret na na na Woodbury 1 5 3Granby 1 23 5 Portland 3 5 4 Woodstock na na naGreenwich 12 91 69
Town

THE CONNECTICUT ECONOMIC DIGEST 23October 2016
TECHNICAL NOTESBUSINESS STARTS AND TERMINATIONSRegistrations and terminations of business entities as recorded with the Secretary of the State and the ConnecticutDepartment of Labor (DOL) are an indication of new business formation and activity. DOL business starts include newemployers which have become liable for unemployment insurance taxes during the quarter, as well as new establish-ments opened by existing employers. DOL business terminations are those accounts discontinued due to inactivity (noemployees) or business closure, and accounts for individual business establishments that are closed by still activeemployers. The Secretary of the State registrations include limited liability companies, limited liability partnerships, andforeign-owned (out-of-state) and domestic-owned (in-state) corporations.
CONSUMER PRICE INDEXThe Consumer Price Index (CPI), computed and published by the U.S. Bureau of Labor Statistics, is a measure of theaverage change in prices over time in a fixed market basket of goods and services. It is based on prices of food, clothing,shelter, fuels, transportation fares, charges for doctors’ and dentists’ services, drugs and other goods and services thatpeople buy for their day-to-day living. The Northeast region is comprised of the New England states, New York, NewJersey and Pennsylvania.
EMPLOYMENT COST INDEXThe Employment Cost Index (ECI) covers both wages and salaries and employer costs for employee benefits for alloccupations and establishments in both the private nonfarm sector and state and local government. The ECI measuresemployers’ labor costs free from the influences of employment shifts among industries and occupations. The base periodfor all data is December 2005 when the ECI is 100.
GAMING DATAIndian Gaming Payments are amounts received by the State as a result of the slot compact with the two Federallyrecognized tribes in Connecticut, which calls for 25 percent of net slot receipts to be remitted to the State. IndianGaming Slots are the total net revenues from slot machines only received by the two Federally recognized Indian tribes.
HOURS AND EARNINGS ESTIMATESProduction worker earnings and hours estimates include full- and part-time employees working within manufacturingindustries. Hours worked and earnings data are computed based on payroll figures for the week including the 12th of themonth. Average hourly earnings are affected by such factors as premium pay for overtime and shift differential as well aschanges in basic hourly and incentive rates of pay. Average weekly earnings are the product of weekly hours worked andhourly earnings. These data are developed in cooperation with the U.S. Department of Labor, Bureau of Labor Statistics.
INITIAL CLAIMSAverage weekly initial claims are calculated by dividing the total number of new claims for unemployment insurancereceived in the month by the number of weeks in the month. A minor change in methodology took effect with datapublished in the March 1997 issue of the DIGEST. Data have been revised back to January 1980.
INSURED UNEMPLOYMENT RATEPrimarily a measure of unemployment insurance program activity, the insured unemployment rate is the 13-weekaverage of the number of people claiming unemployment benefits divided by the number of workers covered by theunemployment insurance system.
LABOR FORCE ESTIMATESLabor force estimates are a measure of the work status of people who live in Connecticut. Prepared under the direction ofthe U.S. Bureau of Labor Statistics, the statewide estimates are the product of a signal-plus noise model, which usesresults from the Current Population Survey (CPS), a monthly survey of Connecticut households, counts of claimants forunemployment benefits, and establishment employment estimates. The 2015 LAUS Redesign includes improved time-series models for the census divisions, states, select substate areas, and the balances of those states; an improved real-time benchmarking procedure to the national Current Population Survey (CPS) estimates; an improved smoothedseasonal adjustment procedure; and improved treatment of outliers. Non-modeled area estimation improvements in-clude: updated Dynamic Residency Ratios (DRR); more accurate estimates for all-other employment; more accurateestimation of agricultural employment; and improved estimation of non-covered agricultural unemployment. Handbookestimation is now done at the city/town level instead of at the Labor Market Area (LMA) level in Connecticut, whichbetter reflects local conditions. The Redesign also introduces estimation inputs from the American Community Survey(ACS) to replace inputs that were previously obtained from the decennial census long-form survey. Labor force data,reflecting persons employed by place of residence, are not directly comparable to the place-of-work industry employmentseries. In the labor force estimates, workers involved in labor disputes are counted as employed. The labor force data alsoincludes agricultural workers, unpaid family workers, domestics and the self-employed. Because of these conceptualdifferences, total labor force employment is almost always different from nonfarm wage and salary employment.
LABOR MARKET AREASAll Labor Market Areas (LMAs) in Connecticut except three are federally-designated areas for developing labor statistics.For the sake of simplicity, the federal Bridgeport-Stamford-Norwalk NECTA is referred to in Connecticut DOL publica-tions as the Bridgeport-Stamford LMA, and the Hartford-West Hartford-East Hartford NECTA is the Hartford LMA. Thenorthwest part of the state is now called Torrington-Northwest LMA. Five towns which are part of the Springfield, MAarea are published as the Enfield LMA. The towns of Eastford and Hampton and other towns in the northeast are nowcalled Danielson-Northeast LMA. Industry employment and labor force data estimates contained in Connecticut Depart-ment of Labor publications are prepared following the same statistical procedures developed by the U.S. Department ofLabor, Bureau of Labor Statistics, whether for federally designated or state-determined areas.
NONFARM EMPLOYMENT ESTIMATESNonfarm employment estimates are derived from a survey of businesses to measure jobs by industry. The estimatesinclude all full- and part-time wage and salary employees who worked during or received pay for the pay period whichincludes the 12th of the month. Excluded from these estimates are proprietors, self-employed workers, private householdemployees and unpaid family workers. In some cases, due to space constraints, all industry estimates are not shown.These data are developed in cooperation with the U.S. Department of Labor, Bureau of Labor Statistics.
UI COVERED WAGESUI covered wages is the total amount paid to those employees who are covered under the Connecticut’s UnemploymentInsurance (UI) law for services performed during the quarter. The fluctuations in the 1992-93 period reflect the effect ofthe changes in the tax law and the massive restructuring in the state’s economy.

ECONOMIC INDICATORS AT A GLANCE
Leading General Drift Indicator ....... NACoincident General Drift Indicator .. NAFarmington Bank Bus. Barometer +2.3Phil. Fed’s CT Coincident Index .... +4.0
Total Nonfarm Employment........... +1.1
Labor Force ..................................... +1.0Employed ......................................... +0.7Unemployed .................................... +5.5Unemployment Rate ..................... +0.3*Labor Force Participation Rate ......... +0.3Employment-Population Ratio .......... +0.1
Average Weekly Initial Claims ........ -0.7Avg Insured Unempl. Rate ........... -0.07*U-6 Rate ......................................... -1.0*
Prod. Worker Avg Wkly Hrs, Mfg .... +4.2PW Avg Hourly Earnings, Mfg ....... +2.5PW Avg Weekly Earnings, Mfg ...... +6.8CT Mfg. Production Index .............. +0.3 Production Worker Hours ............... +1.4 Industrial Electricity Sales ............... -2.9
Personal Income ............................ +3.6UI Covered Wages .......................... +1.8
Business Activity New Housing Permits ................... +17.4 Electricity Sales .............................. -1.2 Construction Contracts Index ........ -26.8 New Auto Registrations .............. +104.7 Exports ......................................... -11.7 S&P 500: Monthly Close .............. +10.1
Business Starts Secretary of the State .................. +20.2 Dept. of Labor ............................... -12.5
Business Terminations Secretary of the State .................... +5.6 Dept. of Labor ............................... -22.5
State Revenues .............................. +2.3 Corporate Tax ................................. +2.3 Personal Income Tax ..................... +11.8 Real Estate Conveyance Tax ........... +9.4 Sales & Use Tax ............................... -7.8 Gaming Payments ........................... -3.8
Tourism and Travel Occupancy Rate ............................ +1.7 Major Attraction Visitors................... -7.5 Air Passenger Count ...................... +1.1 Gaming Slots .................................. -2.8
Employment Cost Index (U.S.) Total ............................................... +2.4 Wages & Salaries........................... +2.6 Benefit Costs ................................. +1.7
Consumer Prices U.S. City Average ........................... +1.1 Northeast Region ........................... +1.1 NY-NJ-Long Island ......................... +1.1 Boston-Brockton-Nashua ............... +1.5
Interest Rates Prime .......................................... +0.25* Conventional Mortgage ................ -0.47*
Mailing address:
Connecticut Economic DigestConnecticut Department of Labor
Office of Research200 Folly Brook Boulevard
Wethersfield, CT 06109-1114
THE CONNECTICUT ECONOMIC DIGEST
*Percentage point change; **Less than 0.05 percent; NA = Not Available
The Connecticut Economic Digest is available on the internet at:
http://www.ctdol.state.ct.us/lmi
October 2016
(Percent change from prior year; see pages 4-8 for reference months or quarters)
THE CONNECTICUT
A joint publication of The Connecticut Departments of Labor and Economic and Community Development
ECONOMIC DIGEST
If you wish to have your name removed from our mailing list, please
check here and return this page (or a photocopy) to the address at left.
If your address has changed, please check here, make the necessary
changes to your address label and return this page to the address at left.
If you receive more than one copy of this publication, please check
here and return this page from the duplicate copy to the address at left.
DO YOU WANT TO BE NOTIFIED BY EMAIL WHEN THEDIGEST IS PUBLISHED EACH MONTH?
Simply email to [email protected] with only the following in thebody of the message, leave subject blank:SUBSCRIBE DOL-CTEconomicDigest your_name(type in your name where it says your_name)