Embed Size (px)
Citation preview
THE CONNECTICUT
ECONOMIC DIGESTDECEMBER 2010
December 2010
Economic Indicators of Employment ........................................ 4 on the Overall Economy ......................... 5 Individual Data Items ......................... 6-8Comparative Regional Data .............. 9Economic Indicator Trends ....... 10-11Business & Economic News .......... 15Business and Employment ChangesAnnounced in the News Media ...... 19Labor Market Areas: Nonfarm Employment .................... 12-17 Sea. Adj. Nonfarm Employment ..........14 Labor Force ............................................ 18 Hours and Earnings .............................. 19Cities and Towns: Labor Force ...................................... 20-21 Housing Permits .................................... 22Technical Notes ............................... 23At a Glance ....................................... 24
The Geography of ConnecticutLabor Market Dynamics ..... 1-3
Connecticut GDP Declines in2009 ......................................... 5
IN THIS ISSUE...
In October...Nonfarm Employment Connecticut..................... 1,616,400 Change over month ........... +0.33% Change over year ................. -0.0%
United States .............. 130,462,000 Change over month ........... +0.12% Change over year ................. +0.6%
Unemployment Rate Connecticut............................. 9.1% United States .......................... 9.6%
Consumer Price Index United States ......................... 218.7 Change over year .................... 1.2%
Vol.15 No.12 A joint publication of the Connecticut Department of Labor & the Connecticut Department of Economic and Community Development
By Patrick J. Flaherty, Economist, DOL, [email protected]
T
The Geography of ConnecticutThe Geography of ConnecticutThe Geography of ConnecticutThe Geography of ConnecticutThe Geography of ConnecticutLabor Market DynamicsLabor Market DynamicsLabor Market DynamicsLabor Market DynamicsLabor Market Dynamics
he labor market is dynamic.Even during the worst months
of the recession, when nationallyjobs on net were declining by ap-proximately 800,000 per month,there were still approximately fourmillion new hires. Of course, therewere even more separations, whichis why total employment declined onnet – but the number of separationswas actually lower during therecession than during the previousperiod of job growth. In times ofstrong growth, approximately fivemillion workers lose or leave theirjobs every month.1
One measure of the dynamicnature of Connecticut’s labor marketis the Business Employment Dynam-ics. In the fourth quarter of 2009,the low quarter of the recession,Connecticut’s payroll jobs fell a net5,500 from September to December.2
However, during that quarter 70,506jobs were created at 17,421 expand-ing establishments and 2,586 new
establishments. Unfortunately, evenmore establishments contracted andclosed causing the net decline. Evenduring good times, Connecticut losesapproximately 70,000 jobs eachquarter due to contractions andanother 10,000 due to closings – butgains even more due to expansionsand new establishments.3
Focusing only on the net maymiss underlying changes in theeconomy. After the end of therecession in the early 2000s, thenumber of payroll jobs in Connecti-cut increased through the end of2007. Jobs declined until the end of2009 and have experienced a mod-est, yet significant, increase in 2010. But the net job losses of therecession are not the whole story.According to the QCEW, total jobsdecreased by over 118,000 from the1st quarter of 2008 to the 1st quarterof 2010.4 But these were net losses.Measuring changes by detailedindustry by town shows that gains
Litchfield County Hartford County
Fairfield County
New London County
New Haven County
Windham CountyTolland County
Middlesex County
Job Growth in Recovery and RecessionGained jobs in both recession and recovery
Lost jobs in recession and gained jobs in recovery
Lost jobs in recovery but gained in recession
Lost jobs in both recession and recovery
THE CONNECTICUT ECONOMIC DIGEST2 December 2010
ConnecticutDepartment of Labor
Connecticut Departmentof Economic andCommunity Development
THE CONNECTICUT
The Connecticut Economic Digest ispublished monthly by the ConnecticutDepartment of Labor, Office of Research, andthe Connecticut Department of Economic andCommunity Development. Its purpose is toregularly provide users with a comprehensivesource for the most current, up-to-date dataavailable on the workforce and economy of thestate, within perspectives of the region andnation.
The annual subscription is $50. Sendsubscription requests to: The ConnecticutEconomic Digest, Connecticut Department ofLabor, Office of Research, 200 Folly BrookBoulevard, Wethersfield, CT 06109-1114.Make checks payable to the ConnecticutDepartment of Labor. Back issues are $4 percopy. The Digest can be accessed free ofcharge from the DOL Web site. Articles fromThe Connecticut Economic Digest may bereprinted if the source is credited. Please sendcopies of the reprinted material to the ManagingEditor. The views expressed by the authorsare theirs alone and may not reflect those ofthe DOL or DECD.
Managing Editor: Jungmin Charles Joo
Associate Editor: Sarah C. York
We would like to acknowledge the contributionsof many DOL Research and DECD staff andRob Damroth (CCT) to the publication of theDigest.
Joan McDonald, CommissionerRonald Angelo, Deputy Commissioner
Stan McMillen, Ph.D., Managing Economist505 Hudson StreetHartford, CT 06106-2502Phone: (860) 270-8000Fax: (860) 270-8200E-Mail: [email protected]: http://www.decd.org
Linda L. Agnew, Acting Commissioner
Andrew Condon, Ph.D., DirectorOffice of Research200 Folly Brook BoulevardWethersfield, CT 06109-1114Phone: (860) 263-6275Fax: (860) 263-6263E-Mail: [email protected]: http://www.ctdol.state.ct.us/lmi
ECONOMIC DIGEST
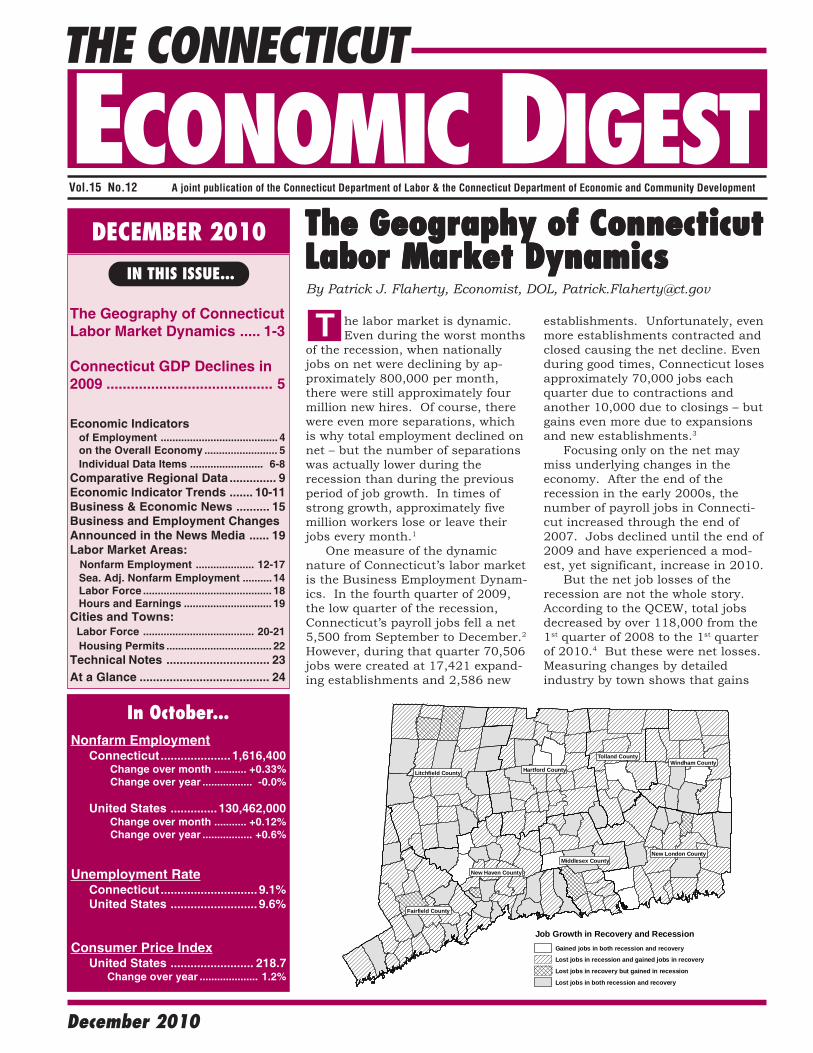
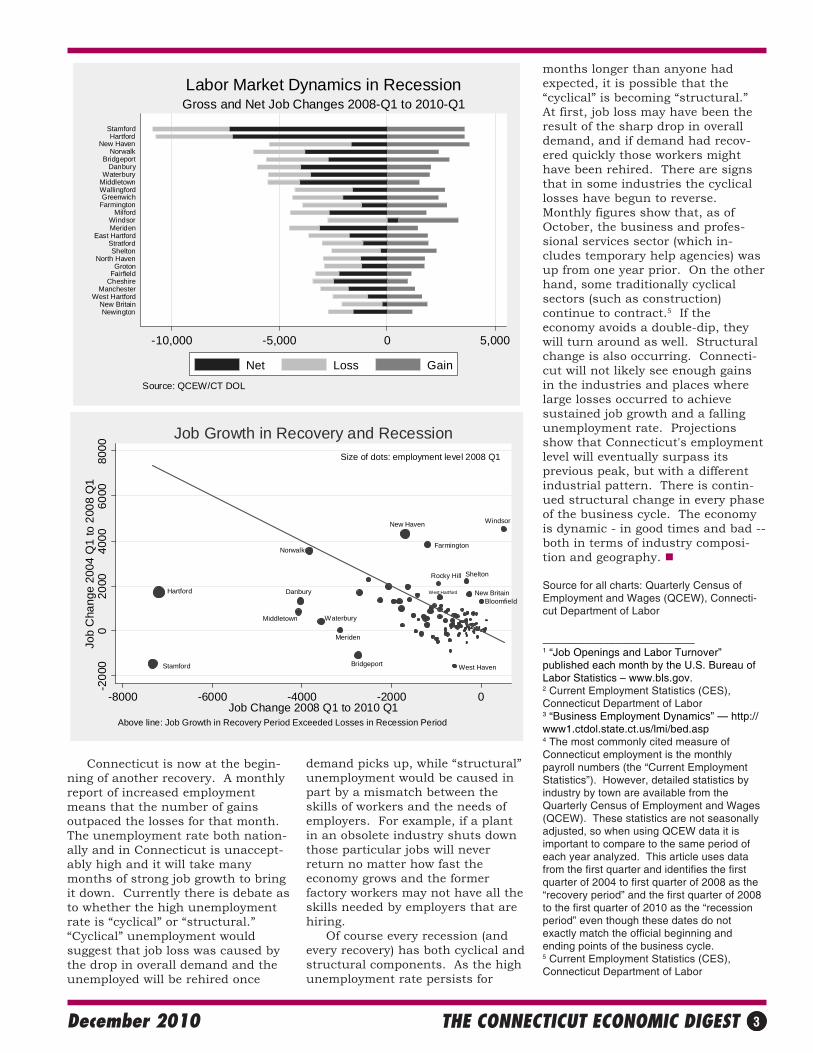
during this period of over 113,000exceeded losses of more than231,000. A measure of industry dynamicsby town can be constructed byadding the losses and the gains. Bythis measure, the most dynamiccities in Connecticut were alsoamong the largest: Stamford,Hartford, New Haven, Norwalk,Bridgeport, Danbury, and Water-bury. Middletown, Wallingford, andGreenwich round out the top 10.The table above shows selectedindustries with gains and losses inthe top six as well as Windsor, themost dynamic town to show a netgain of jobs during the recessionperiod. The gain in Windsor is partof an overall pattern of
suburbanization of employment inthe Hartford area. As mentioned,overall losses in the recessionaryperiod were severe. The 118,000 netloss statewide was significantly morethan the 73,000 net gain during thefour years 2004 Q1 to 2008 Q1following the end of the previousrecession. Still, 56 towns either hadgreater job gains during the recoveryperiod than were lost in the laterrecession period or, like Windsor,gained in both periods. Four of thetowns with the largest net gains overboth periods are Hartford suburbs:Windsor, Farmington, Bloomfield,and Rocky Hill. (The other three areNew Haven, Shelton and NewBritain.)
Recession Period (1st Quarter 2008 to 1st Quarter 2010) Examples of Industries with Employment Gains and Losses
Gains Losses Stamford
Motion Picture and Video Production Continuing Care Retirement Communities Hospitals Commercial Banking Pet and Pet Supplies Stores
Temporary Help Services Offices of Lawyers Investment Banking & Security Dealing Portfolio Management Investment Advice
Hartford Pension Funds Hospitals Private Elementary & Secondary Schools Medical Laboratories Home Health Care Services Retail Bakeries Sign Manufacturing
Direct Life Insurance Carriers Temporary Help Services Commercial Banking
New Haven Several Education-related industries Several Health Care-related industries Offices of Certified Public Accountants Full-Service Restaurants
Hardware Manufacturing Telecommunications Newspaper Publishing
Norwalk Convention and Trade Show Organizers Wine and Spirit Merchant Wholesalers Shellfish Farming Software Publishing
Temporary Help Services Managing Offices Full-Service Restaurants Landscaping Services
Bridgeport Supermarkets and Other Grocery Stores Motor and Generator Manufacturing Police Protection Hospitals
Elementary and Secondary Schools Savings Institutions Newspaper Publishers Automobile Dealers Collection Agencies
Danbury Irradiation Apparatus Manufacturing Janitorial Services Colleges and Universities
Managing Offices Hotels and Motels Temporary Help Services
Windsor Direct Life Insurance Carriers General Warehousing and Storage Elementary and Secondary Schools Home Health Care Services All Other Insurance Related Activities Commercial Building Construction
Gasoline Engines and Engine Parts Manufacturing Confectionary Merchant Wholesalers Business Associations
THE CONNECTICUT ECONOMIC DIGEST 3December 2010
Connecticut is now at the begin-ning of another recovery. A monthlyreport of increased employmentmeans that the number of gainsoutpaced the losses for that month.The unemployment rate both nation-ally and in Connecticut is unaccept-ably high and it will take manymonths of strong job growth to bringit down. Currently there is debate asto whether the high unemploymentrate is “cyclical” or “structural.”“Cyclical” unemployment wouldsuggest that job loss was caused bythe drop in overall demand and theunemployed will be rehired once
Size of dots: employment level 2008 Q1
Hartford
Stamford
Danbury
Middletown Waterbury
Meriden
Bridgeport West Haven
New Haven
Farmington
Windsor
Shelton
New BritainBloomfield
Rocky Hill
West Hartford
Norwalk
-200
00
2000
4000
6000
8000
Job
Cha
nge
2004
Q1
to 2
008
Q1
-8000 -6000 -4000 -2000 0Job Change 2008 Q1 to 2010 Q1
Above line: Job Growth in Recovery Period Exceeded Losses in Recession Period
Job Growth in Recovery and Recession
-10,000 -5,000 0 5,000
NewingtonNew Britain
West HartfordManchester
CheshireFairfieldGroton
North HavenShelton
StratfordEast Hartford
MeridenWindsor
MilfordFarmingtonGreenwich
WallingfordMiddletownWaterbury
DanburyBridgeport
NorwalkNew Haven
HartfordStamford
Source: QCEW/CT DOL
Gross and Net Job Changes 2008-Q1 to 2010-Q1Labor Market Dynamics in Recession
Net Loss Gain
demand picks up, while “structural”unemployment would be caused inpart by a mismatch between theskills of workers and the needs ofemployers. For example, if a plantin an obsolete industry shuts downthose particular jobs will neverreturn no matter how fast theeconomy grows and the formerfactory workers may not have all theskills needed by employers that arehiring. Of course every recession (andevery recovery) has both cyclical andstructural components. As the highunemployment rate persists for
months longer than anyone hadexpected, it is possible that the“cyclical” is becoming “structural.”At first, job loss may have been theresult of the sharp drop in overalldemand, and if demand had recov-ered quickly those workers mighthave been rehired. There are signsthat in some industries the cyclicallosses have begun to reverse.Monthly figures show that, as ofOctober, the business and profes-sional services sector (which in-cludes temporary help agencies) wasup from one year prior. On the otherhand, some traditionally cyclicalsectors (such as construction)continue to contract.5 If theeconomy avoids a double-dip, theywill turn around as well. Structuralchange is also occurring. Connecti-cut will not likely see enough gainsin the industries and places wherelarge losses occurred to achievesustained job growth and a fallingunemployment rate. Projectionsshow that Connecticut's employmentlevel will eventually surpass itsprevious peak, but with a differentindustrial pattern. There is contin-ued structural change in every phaseof the business cycle. The economyis dynamic - in good times and bad --both in terms of industry composi-tion and geography.
Source for all charts: Quarterly Census ofEmployment and Wages (QCEW), Connecti-cut Department of Labor
_________________________1 “Job Openings and Labor Turnover”published each month by the U.S. Bureau ofLabor Statistics – www.bls.gov.2 Current Employment Statistics (CES),Connecticut Department of Labor3 “Business Employment Dynamics” — http://www1.ctdol.state.ct.us/lmi/bed.asp4 The most commonly cited measure ofConnecticut employment is the monthlypayroll numbers (the “Current EmploymentStatistics”). However, detailed statistics byindustry by town are available from theQuarterly Census of Employment and Wages(QCEW). These statistics are not seasonallyadjusted, so when using QCEW data it isimportant to compare to the same period ofeach year analyzed. This article uses datafrom the first quarter and identifies the firstquarter of 2004 to first quarter of 2008 as the“recovery period” and the first quarter of 2008to the first quarter of 2010 as the “recessionperiod” even though these dates do notexactly match the official beginning andending points of the business cycle.5 Current Employment Statistics (CES),Connecticut Department of Labor
THE CONNECTICUT ECONOMIC DIGEST4 December 2010
EMPLOYMENT INDICATORS
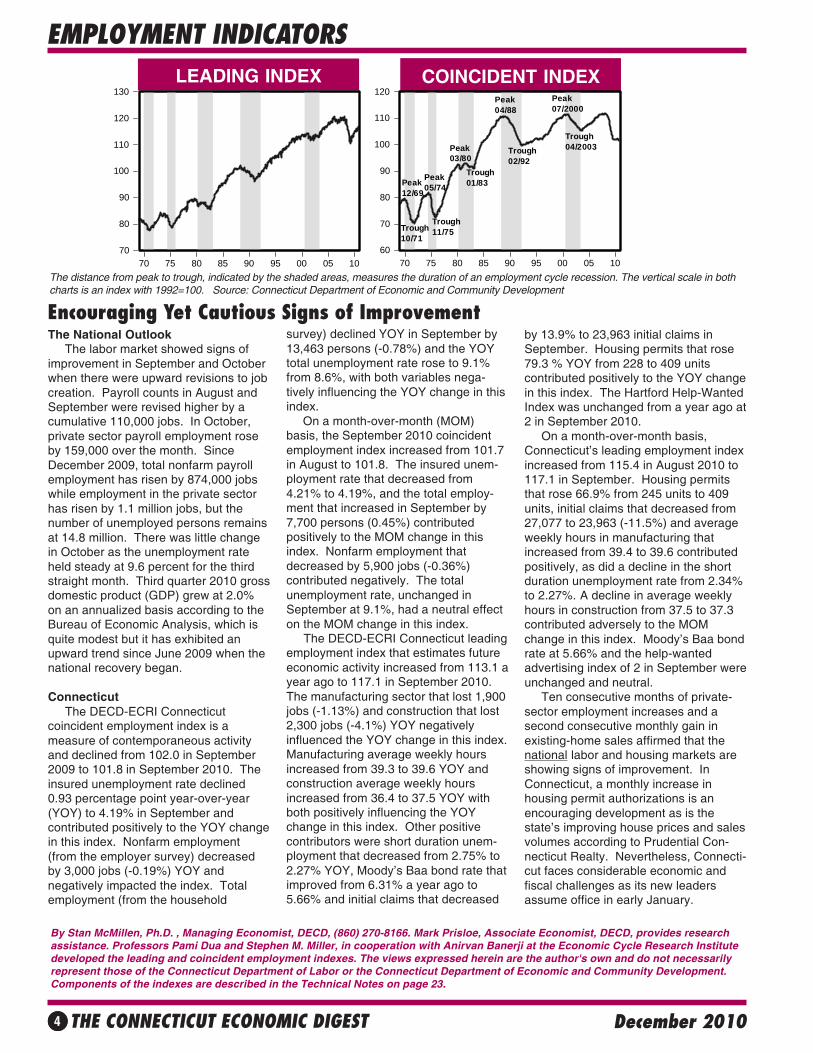
The distance from peak to trough, indicated by the shaded areas, measures the duration of an employment cycle recession. The vertical scale in bothcharts is an index with 1992=100. Source: Connecticut Department of Economic and Community Development
Encouraging Yet Cautious Signs of Improvement
By Stan McMillen, Ph.D. , Managing Economist, DECD, (860) 270-8166. Mark Prisloe, Associate Economist, DECD, provides researchassistance. Professors Pami Dua and Stephen M. Miller, in cooperation with Anirvan Banerji at the Economic Cycle Research Institutedeveloped the leading and coincident employment indexes. The views expressed herein are the author's own and do not necessarilyrepresent those of the Connecticut Department of Labor or the Connecticut Department of Economic and Community Development.Components of the indexes are described in the Technical Notes on page 23.
LEADING INDEX COINCIDENT INDEX
60
70
80
90
100
110
120
70 75 80 85 90 95 00 05 1070
80
90
100
110
120
130
70 75 80 85 90 95 00 05 10
Peak12/69
Trough10/71
Peak05/74
Trough11/75
Peak03/80
Trough01/83
Peak04/88
Trough02/92
Peak07/2000
Trough04/2003
The National Outlook The labor market showed signs ofimprovement in September and Octoberwhen there were upward revisions to jobcreation. Payroll counts in August andSeptember were revised higher by acumulative 110,000 jobs. In October,private sector payroll employment roseby 159,000 over the month. SinceDecember 2009, total nonfarm payrollemployment has risen by 874,000 jobswhile employment in the private sectorhas risen by 1.1 million jobs, but thenumber of unemployed persons remainsat 14.8 million. There was little changein October as the unemployment rateheld steady at 9.6 percent for the thirdstraight month. Third quarter 2010 grossdomestic product (GDP) grew at 2.0%on an annualized basis according to theBureau of Economic Analysis, which isquite modest but it has exhibited anupward trend since June 2009 when thenational recovery began.
Connecticut The DECD-ECRI Connecticutcoincident employment index is ameasure of contemporaneous activityand declined from 102.0 in September2009 to 101.8 in September 2010. Theinsured unemployment rate declined0.93 percentage point year-over-year(YOY) to 4.19% in September andcontributed positively to the YOY changein this index. Nonfarm employment(from the employer survey) decreasedby 3,000 jobs (-0.19%) YOY andnegatively impacted the index. Totalemployment (from the household
survey) declined YOY in September by13,463 persons (-0.78%) and the YOYtotal unemployment rate rose to 9.1%from 8.6%, with both variables nega-tively influencing the YOY change in thisindex. On a month-over-month (MOM)basis, the September 2010 coincidentemployment index increased from 101.7in August to 101.8. The insured unem-ployment rate that decreased from4.21% to 4.19%, and the total employ-ment that increased in September by7,700 persons (0.45%) contributedpositively to the MOM change in thisindex. Nonfarm employment thatdecreased by 5,900 jobs (-0.36%)contributed negatively. The totalunemployment rate, unchanged inSeptember at 9.1%, had a neutral effecton the MOM change in this index. The DECD-ECRI Connecticut leadingemployment index that estimates futureeconomic activity increased from 113.1 ayear ago to 117.1 in September 2010.The manufacturing sector that lost 1,900jobs (-1.13%) and construction that lost2,300 jobs (-4.1%) YOY negativelyinfluenced the YOY change in this index.Manufacturing average weekly hoursincreased from 39.3 to 39.6 YOY andconstruction average weekly hoursincreased from 36.4 to 37.5 YOY withboth positively influencing the YOYchange in this index. Other positivecontributors were short duration unem-ployment that decreased from 2.75% to2.27% YOY, Moody’s Baa bond rate thatimproved from 6.31% a year ago to5.66% and initial claims that decreased
by 13.9% to 23,963 initial claims inSeptember. Housing permits that rose79.3 % YOY from 228 to 409 unitscontributed positively to the YOY changein this index. The Hartford Help-WantedIndex was unchanged from a year ago at2 in September 2010. On a month-over-month basis,Connecticut’s leading employment indexincreased from 115.4 in August 2010 to117.1 in September. Housing permitsthat rose 66.9% from 245 units to 409units, initial claims that decreased from27,077 to 23,963 (-11.5%) and averageweekly hours in manufacturing thatincreased from 39.4 to 39.6 contributedpositively, as did a decline in the shortduration unemployment rate from 2.34%to 2.27%. A decline in average weeklyhours in construction from 37.5 to 37.3contributed adversely to the MOMchange in this index. Moody’s Baa bondrate at 5.66% and the help-wantedadvertising index of 2 in September wereunchanged and neutral. Ten consecutive months of private-sector employment increases and asecond consecutive monthly gain inexisting-home sales affirmed that thenational labor and housing markets areshowing signs of improvement. InConnecticut, a monthly increase inhousing permit authorizations is anencouraging development as is thestate’s improving house prices and salesvolumes according to Prudential Con-necticut Realty. Nevertheless, Connecti-cut faces considerable economic andfiscal challenges as its new leadersassume office in early January.
THE CONNECTICUT ECONOMIC DIGEST 5December 2010
GENERAL ECONOMIC INDICATORS
Sources: *The Connecticut Economy, University of Connecticut **Farmington Bank ***Federal Reserve Bank of Philadelphia
The Connecticut Economy's General Drift Indicators are composite measures of the four-quarter change in three coincident (Connecticut Manufacturing ProductionIndex, nonfarm employment, and real personal income) and four leading (housing permits, manufacturing average weekly hours, Hartford help-wanted advertising, andinitial unemployment claims) economic variables, and are indexed so 1986 = 100.
The Farmington Bank Business Barometer is a measure of overall economic growth in the state of Connecticut that is derived from non-manufacturing employment, realdisposable personal income, and manufacturing production.
The Philadelphia Fed’s Coincident Index summarizes current economic condition by using four coincident variables: nonfarm payroll employment, average hoursworked in manufacturing, the unemployment rate, and wage and salary disbursements deflated by the consumer price index (U.S. city average).
3Q 3Q CHANGE 2Q(Seasonally adjusted) 2010 2009 NO. % 2010Employment Indexes (1992=100)* Leading 116.1 113.1 3.0 2.7 115.5 Coincident 101.8 102.2 -0.4 -0.4 102.4General Drift Indicator (1986=100)* Leading NA NA NA NA NA Coincident NA NA NA NA NAFarmington Bank Business Barometer (1992=100)** 119.4 119.5 -0.1 -0.1 119.7
Philadelphia Fed's Coincident Index (July 1992=100)*** OCT OCT SEP(Not seasonally adjusted) 2010 2009 2010 Connecticut 152.8 150.3 2.5 1.7 152.6 United States 150.0 147.4 2.6 1.8 149.7
By Lincoln S. Dyer, Economist, DOL, [email protected]
C
Connecticut GDP Declines in 2009Connecticut GDP Declines in 2009Connecticut GDP Declines in 2009Connecticut GDP Declines in 2009Connecticut GDP Declines in 2009onnecticut’s Gross DomesticProduct (GDP), the most
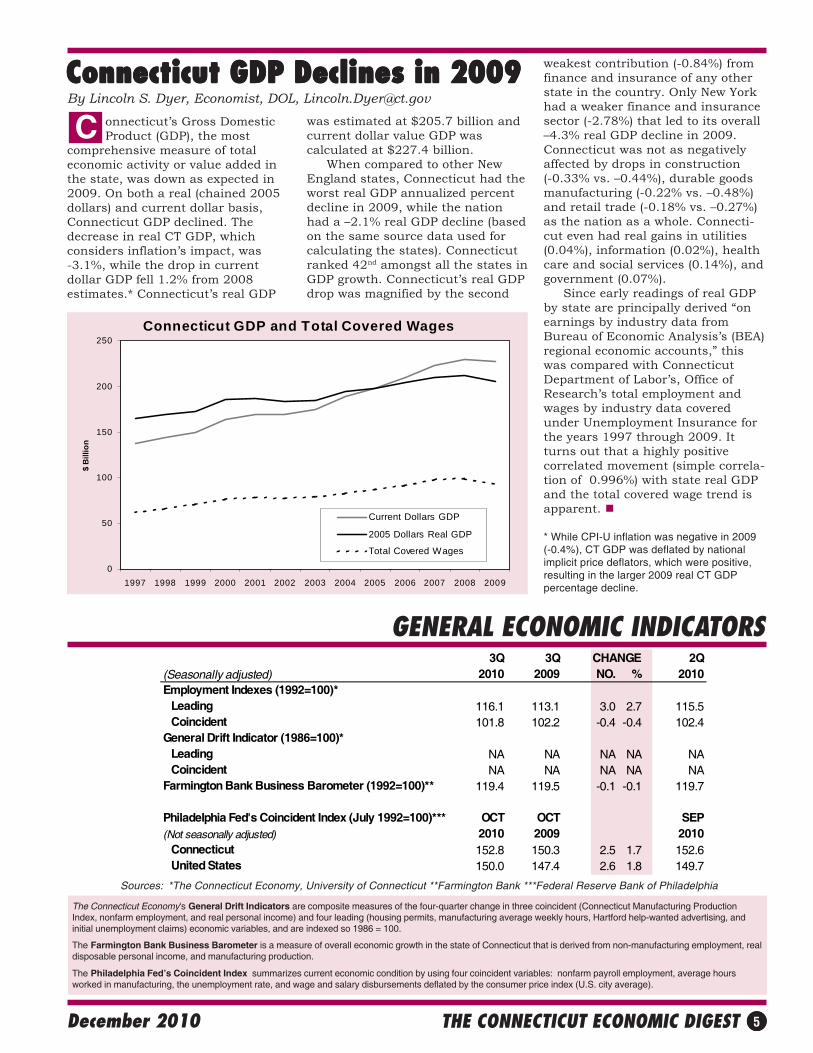
comprehensive measure of totaleconomic activity or value added inthe state, was down as expected in2009. On both a real (chained 2005dollars) and current dollar basis,Connecticut GDP declined. Thedecrease in real CT GDP, whichconsiders inflation’s impact, was-3.1%, while the drop in currentdollar GDP fell 1.2% from 2008estimates.* Connecticut’s real GDP
was estimated at $205.7 billion andcurrent dollar value GDP wascalculated at $227.4 billion. When compared to other NewEngland states, Connecticut had theworst real GDP annualized percentdecline in 2009, while the nationhad a –2.1% real GDP decline (basedon the same source data used forcalculating the states). Connecticutranked 42nd amongst all the states inGDP growth. Connecticut’s real GDPdrop was magnified by the second
weakest contribution (-0.84%) fromfinance and insurance of any otherstate in the country. Only New Yorkhad a weaker finance and insurancesector (-2.78%) that led to its overall–4.3% real GDP decline in 2009.Connecticut was not as negativelyaffected by drops in construction(-0.33% vs. –0.44%), durable goodsmanufacturing (-0.22% vs. –0.48%)and retail trade (-0.18% vs. –0.27%)as the nation as a whole. Connecti-cut even had real gains in utilities(0.04%), information (0.02%), healthcare and social services (0.14%), andgovernment (0.07%). Since early readings of real GDPby state are principally derived “onearnings by industry data fromBureau of Economic Analysis’s (BEA)regional economic accounts,” thiswas compared with ConnecticutDepartment of Labor’s, Office ofResearch’s total employment andwages by industry data coveredunder Unemployment Insurance forthe years 1997 through 2009. Itturns out that a highly positivecorrelated movement (simple correla-tion of 0.996%) with state real GDPand the total covered wage trend isapparent.
* While CPI-U inflation was negative in 2009(-0.4%), CT GDP was deflated by nationalimplicit price deflators, which were positive,resulting in the larger 2009 real CT GDPpercentage decline.
Connecticut GDP and Total Covered Wages
0
50
100
150
200
250
1997 1998 1999 2000 2001 2002 2003 2004 2005 2006 2007 2008 2009
$ B
illio
n
Current Dollars GDP
2005 Dollars Real GDP
Total Covered Wages
THE CONNECTICUT ECONOMIC DIGEST6 December 2010
EMPLOYMENT BY INDUSTRY SECTOR
INCOME
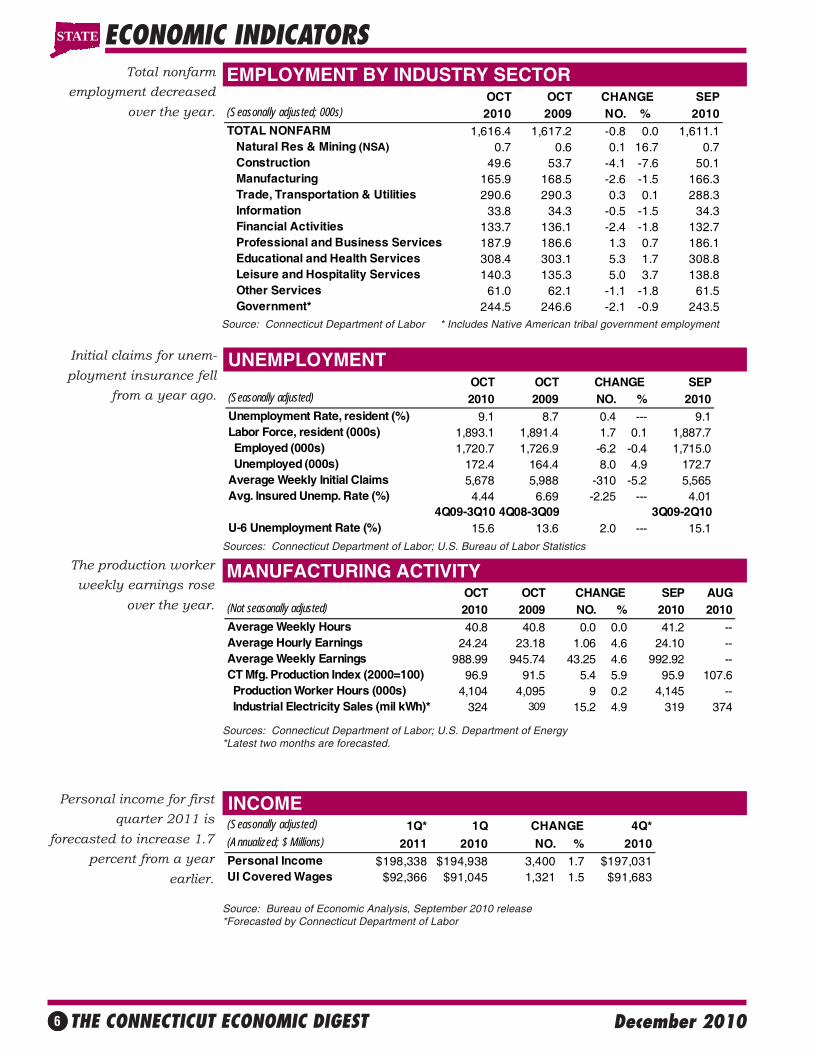
Initial claims for unem-ployment insurance fell
from a year ago.
UNEMPLOYMENT
The production workerweekly earnings rose
over the year.
MANUFACTURING ACTIVITY
ECONOMIC INDICATORSTotal nonfarm
employment decreasedover the year.
Personal income for firstquarter 2011 is
forecasted to increase 1.7percent from a year
earlier.
Source: Connecticut Department of Labor * Includes Native American tribal government employment
Sources: Connecticut Department of Labor; U.S. Bureau of Labor Statistics
Sources: Connecticut Department of Labor; U.S. Department of Energy*Latest two months are forecasted.
Source: Bureau of Economic Analysis, September 2010 release*Forecasted by Connecticut Department of Labor
(Seasonally adjusted) 1Q* 1Q CHANGE 4Q*(Annualized; $ Millions) 2011 2010 NO. % 2010Personal Income $198,338 $194,938 3,400 1.7 $197,031UI Covered Wages $92,366 $91,045 1,321 1.5 $91,683
OCT OCT CHANGE SEP AUG(Not seasonally adjusted) 2010 2009 NO. % 2010 2010Average Weekly Hours 40.8 40.8 0.0 0.0 41.2 --Average Hourly Earnings 24.24 23.18 1.06 4.6 24.10 --Average Weekly Earnings 988.99 945.74 43.25 4.6 992.92 --CT Mfg. Production Index (2000=100) 96.9 91.5 5.4 5.9 95.9 107.6 Production Worker Hours (000s) 4,104 4,095 9 0.2 4,145 -- Industrial Electricity Sales (mil kWh)* 324 309 15.2 4.9 319 374
OCT OCT CHANGE SEP(Seasonally adjusted; 000s) 2010 2009 NO. % 2010TOTAL NONFARM 1,616.4 1,617.2 -0.8 0.0 1,611.1 Natural Res & Mining (NSA) 0.7 0.6 0.1 16.7 0.7 Construction 49.6 53.7 -4.1 -7.6 50.1 Manufacturing 165.9 168.5 -2.6 -1.5 166.3 Trade, Transportation & Utilities 290.6 290.3 0.3 0.1 288.3 Information 33.8 34.3 -0.5 -1.5 34.3 Financial Activities 133.7 136.1 -2.4 -1.8 132.7 Professional and Business Services 187.9 186.6 1.3 0.7 186.1 Educational and Health Services 308.4 303.1 5.3 1.7 308.8 Leisure and Hospitality Services 140.3 135.3 5.0 3.7 138.8 Other Services 61.0 62.1 -1.1 -1.8 61.5 Government* 244.5 246.6 -2.1 -0.9 243.5
STATE
OCT OCT CHANGE SEP(Seasonally adjusted) 2010 2009 NO. % 2010Unemployment Rate, resident (%) 9.1 8.7 0.4 --- 9.1Labor Force, resident (000s) 1,893.1 1,891.4 1.7 0.1 1,887.7 Employed (000s) 1,720.7 1,726.9 -6.2 -0.4 1,715.0 Unemployed (000s) 172.4 164.4 8.0 4.9 172.7Average Weekly Initial Claims 5,678 5,988 -310 -5.2 5,565Avg. Insured Unemp. Rate (%) 4.44 6.69 -2.25 --- 4.01
4Q09-3Q10 4Q08-3Q09 3Q09-2Q10U-6 Unemployment Rate (%) 15.6 13.6 2.0 --- 15.1
THE CONNECTICUT ECONOMIC DIGEST 7December 2010
TOURISM AND TRAVEL
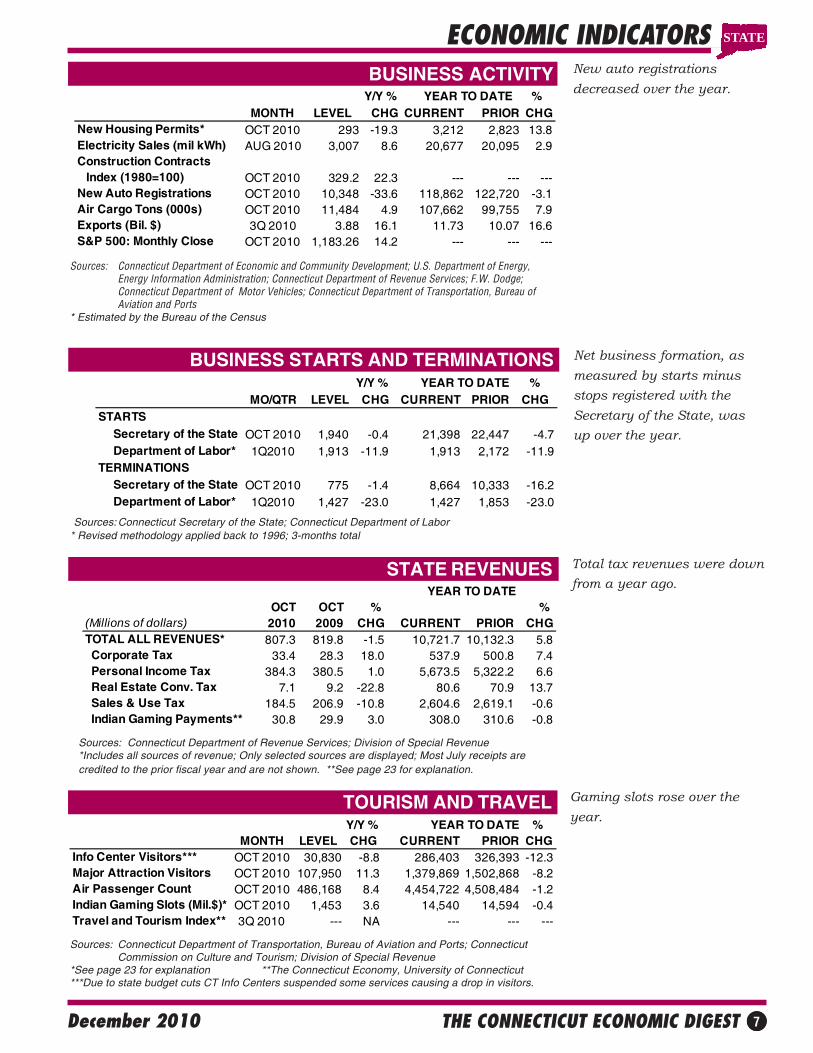
ECONOMIC INDICATORSBUSINESS ACTIVITY New auto registrations
decreased over the year.
Gaming slots rose over theyear.
BUSINESS STARTS AND TERMINATIONS Net business formation, asmeasured by starts minusstops registered with theSecretary of the State, wasup over the year.
Total tax revenues were downfrom a year ago.
STATE REVENUES
Sources: Connecticut Department of Economic and Community Development; U.S. Department of Energy,Energy Information Administration; Connecticut Department of Revenue Services; F.W. Dodge;Connecticut Department of Motor Vehicles; Connecticut Department of Transportation, Bureau ofAviation and Ports
* Estimated by the Bureau of the Census
Sources: Connecticut Secretary of the State; Connecticut Department of Labor* Revised methodology applied back to 1996; 3-months total
OCT OCT % % (Millions of dollars) 2010 2009 CHG CURRENT PRIOR CHGTOTAL ALL REVENUES* 807.3 819.8 -1.5 10,721.7 10,132.3 5.8 Corporate Tax 33.4 28.3 18.0 537.9 500.8 7.4 Personal Income Tax 384.3 380.5 1.0 5,673.5 5,322.2 6.6 Real Estate Conv. Tax 7.1 9.2 -22.8 80.6 70.9 13.7 Sales & Use Tax 184.5 206.9 -10.8 2,604.6 2,619.1 -0.6 Indian Gaming Payments** 30.8 29.9 3.0 308.0 310.6 -0.8
YEAR TO DATE
Sources: Connecticut Department of Revenue Services; Division of Special Revenue*Includes all sources of revenue; Only selected sources are displayed; Most July receipts arecredited to the prior fiscal year and are not shown. **See page 23 for explanation.
Sources: Connecticut Department of Transportation, Bureau of Aviation and Ports; ConnecticutCommission on Culture and Tourism; Division of Special Revenue
*See page 23 for explanation **The Connecticut Economy, University of Connecticut***Due to state budget cuts CT Info Centers suspended some services causing a drop in visitors.
Y/Y % YEAR TO DATE % MONTH LEVEL CHG CURRENT PRIOR CHG
Info Center Visitors*** OCT 2010 30,830 -8.8 286,403 326,393 -12.3Major Attraction Visitors OCT 2010 107,950 11.3 1,379,869 1,502,868 -8.2Air Passenger Count OCT 2010 486,168 8.4 4,454,722 4,508,484 -1.2Indian Gaming Slots (Mil.$)* OCT 2010 1,453 3.6 14,540 14,594 -0.4Travel and Tourism Index** 3Q 2010 --- NA --- --- ---
Y/Y % %MO/QTR LEVEL CHG CURRENT PRIOR CHG
STARTS Secretary of the State OCT 2010 1,940 -0.4 21,398 22,447 -4.7 Department of Labor* 1Q2010 1,913 -11.9 1,913 2,172 -11.9TERMINATIONS Secretary of the State OCT 2010 775 -1.4 8,664 10,333 -16.2 Department of Labor* 1Q2010 1,427 -23.0 1,427 1,853 -23.0
YEAR TO DATE
STATE
Y/Y % YEAR TO DATE % MONTH LEVEL CHG CURRENT PRIOR CHG
New Housing Permits* OCT 2010 293 -19.3 3,212 2,823 13.8Electricity Sales (mil kWh) AUG 2010 3,007 8.6 20,677 20,095 2.9Construction Contracts Index (1980=100) OCT 2010 329.2 22.3 --- --- ---New Auto Registrations OCT 2010 10,348 -33.6 118,862 122,720 -3.1Air Cargo Tons (000s) OCT 2010 11,484 4.9 107,662 99,755 7.9Exports (Bil. $) 3Q 2010 3.88 16.1 11.73 10.07 16.6S&P 500: Monthly Close OCT 2010 1,183.26 14.2 --- --- ---
THE CONNECTICUT ECONOMIC DIGEST8 December 2010
CONSUMER NEWS
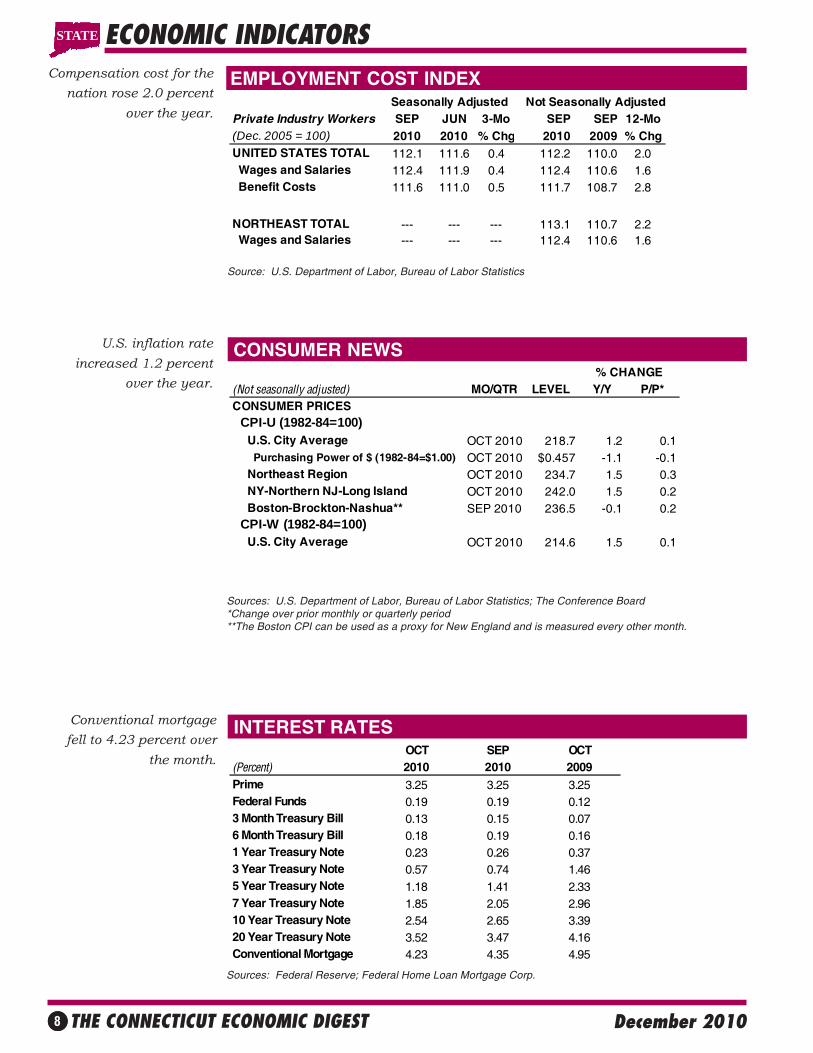
EMPLOYMENT COST INDEXCompensation cost for thenation rose 2.0 percent
over the year.
Conventional mortgagefell to 4.23 percent over
the month.
INTEREST RATES
ECONOMIC INDICATORS
U.S. inflation rateincreased 1.2 percent
over the year.
Source: U.S. Department of Labor, Bureau of Labor Statistics
Sources: U.S. Department of Labor, Bureau of Labor Statistics; The Conference Board*Change over prior monthly or quarterly period**The Boston CPI can be used as a proxy for New England and is measured every other month.
Sources: Federal Reserve; Federal Home Loan Mortgage Corp.
OCT SEP OCT(Percent) 2010 2010 2009Prime 3.25 3.25 3.25Federal Funds 0.19 0.19 0.123 Month Treasury Bill 0.13 0.15 0.076 Month Treasury Bill 0.18 0.19 0.161 Year Treasury Note 0.23 0.26 0.373 Year Treasury Note 0.57 0.74 1.465 Year Treasury Note 1.18 1.41 2.337 Year Treasury Note 1.85 2.05 2.9610 Year Treasury Note 2.54 2.65 3.3920 Year Treasury Note 3.52 3.47 4.16Conventional Mortgage 4.23 4.35 4.95
Seasonally Adjusted Not Seasonally AdjustedPrivate Industry Workers SEP JUN 3-Mo SEP SEP 12-Mo(Dec. 2005 = 100) 2010 2010 % Chg 2010 2009 % ChgUNITED STATES TOTAL 112.1 111.6 0.4 112.2 110.0 2.0 Wages and Salaries 112.4 111.9 0.4 112.4 110.6 1.6 Benefit Costs 111.6 111.0 0.5 111.7 108.7 2.8
NORTHEAST TOTAL --- --- --- 113.1 110.7 2.2 Wages and Salaries --- --- --- 112.4 110.6 1.6
STATE
(Not seasonally adjusted) MO/QTR LEVEL Y/Y P/P*CONSUMER PRICES CPI-U (1982-84=100) U.S. City Average OCT 2010 218.7 1.2 0.1 Purchasing Power of $ (1982-84=$1.00) OCT 2010 $0.457 -1.1 -0.1 Northeast Region OCT 2010 234.7 1.5 0.3 NY-Northern NJ-Long Island OCT 2010 242.0 1.5 0.2 Boston-Brockton-Nashua** SEP 2010 236.5 -0.1 0.2 CPI-W (1982-84=100) U.S. City Average OCT 2010 214.6 1.5 0.1
% CHANGE
THE CONNECTICUT ECONOMIC DIGEST 9December 2010
UNEMPLOYMENT RATES
LABOR FORCE
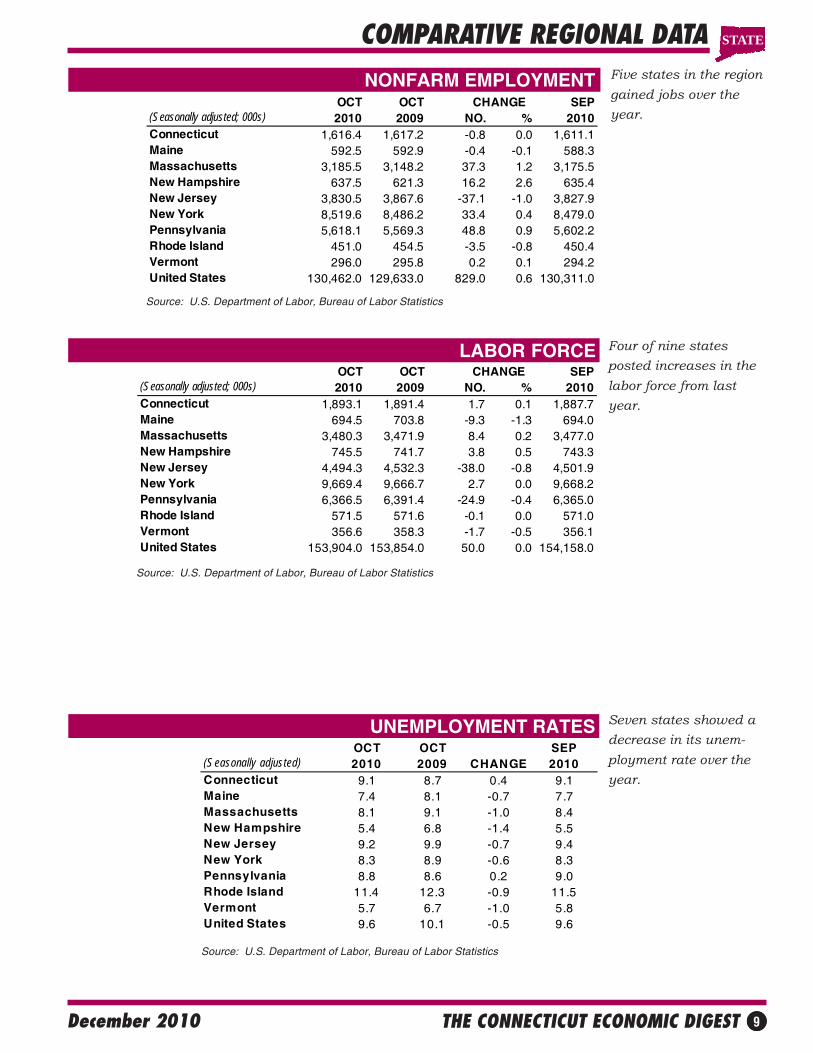
NONFARM EMPLOYMENT
Seven states showed adecrease in its unem-ployment rate over theyear.
Five states in the regiongained jobs over theyear.
Four of nine statesposted increases in thelabor force from lastyear.
COMPARATIVE REGIONAL DATA
Source: U.S. Department of Labor, Bureau of Labor Statistics
Source: U.S. Department of Labor, Bureau of Labor Statistics
Source: U.S. Department of Labor, Bureau of Labor Statistics
OCT OCT CHANGE SEP(Seasonally adjusted; 000s) 2010 2009 NO. % 2010Connecticut 1,616.4 1,617.2 -0.8 0.0 1,611.1Maine 592.5 592.9 -0.4 -0.1 588.3Massachusetts 3,185.5 3,148.2 37.3 1.2 3,175.5New Hampshire 637.5 621.3 16.2 2.6 635.4New Jersey 3,830.5 3,867.6 -37.1 -1.0 3,827.9New York 8,519.6 8,486.2 33.4 0.4 8,479.0Pennsylvania 5,618.1 5,569.3 48.8 0.9 5,602.2Rhode Island 451.0 454.5 -3.5 -0.8 450.4Vermont 296.0 295.8 0.2 0.1 294.2United States 130,462.0 129,633.0 829.0 0.6 130,311.0
OCT OCT CHANGE SEP(Seasonally adjusted; 000s) 2010 2009 NO. % 2010Connecticut 1,893.1 1,891.4 1.7 0.1 1,887.7Maine 694.5 703.8 -9.3 -1.3 694.0Massachusetts 3,480.3 3,471.9 8.4 0.2 3,477.0New Hampshire 745.5 741.7 3.8 0.5 743.3New Jersey 4,494.3 4,532.3 -38.0 -0.8 4,501.9New York 9,669.4 9,666.7 2.7 0.0 9,668.2Pennsylvania 6,366.5 6,391.4 -24.9 -0.4 6,365.0Rhode Island 571.5 571.6 -0.1 0.0 571.0Vermont 356.6 358.3 -1.7 -0.5 356.1United States 153,904.0 153,854.0 50.0 0.0 154,158.0
OCT OCT SEP(Seasonally adjusted) 2010 2009 CHANGE 2010Connecticut 9.1 8.7 0.4 9.1Maine 7.4 8.1 -0.7 7.7Massachusetts 8.1 9.1 -1.0 8.4New Hampshire 5.4 6.8 -1.4 5.5New Jersey 9.2 9.9 -0.7 9.4New York 8.3 8.9 -0.6 8.3Pennsylvania 8.8 8.6 0.2 9.0Rhode Island 11.4 12.3 -0.9 11.5Vermont 5.7 6.7 -1.0 5.8United States 9.6 10.1 -0.5 9.6
STATE
THE CONNECTICUT ECONOMIC DIGEST10 December 2010
ECONOMIC INDICATOR TRENDSSTATE
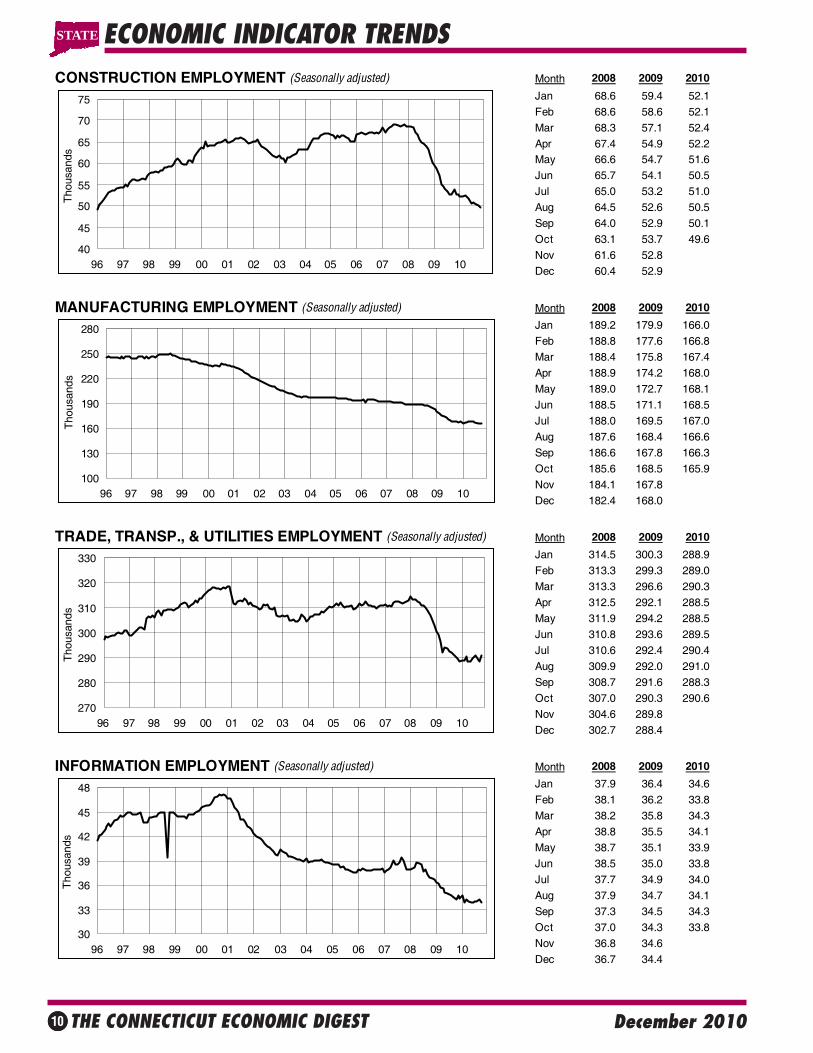
CONSTRUCTION EMPLOYMENT (Seasonally adjusted) Month 2008 2009 2010
Jan 68.6 59.4 52.1
Feb 68.6 58.6 52.1
Mar 68.3 57.1 52.4
Apr 67.4 54.9 52.2May 66.6 54.7 51.6
Jun 65.7 54.1 50.5
Jul 65.0 53.2 51.0
Aug 64.5 52.6 50.5
Sep 64.0 52.9 50.1
Oct 63.1 53.7 49.6
Nov 61.6 52.8
Dec 60.4 52.9
MANUFACTURING EMPLOYMENT (Seasonally adjusted) Month 2008 2009 2010
Jan 189.2 179.9 166.0
Feb 188.8 177.6 166.8
Mar 188.4 175.8 167.4
Apr 188.9 174.2 168.0
May 189.0 172.7 168.1
Jun 188.5 171.1 168.5
Jul 188.0 169.5 167.0
Aug 187.6 168.4 166.6
Sep 186.6 167.8 166.3
Oct 185.6 168.5 165.9
Nov 184.1 167.8
Dec 182.4 168.0
TRADE, TRANSP., & UTILITIES EMPLOYMENT (Seasonally adjusted) Month 2008 2009 2010
Jan 314.5 300.3 288.9
Feb 313.3 299.3 289.0
Mar 313.3 296.6 290.3
Apr 312.5 292.1 288.5
May 311.9 294.2 288.5
Jun 310.8 293.6 289.5
Jul 310.6 292.4 290.4
Aug 309.9 292.0 291.0
Sep 308.7 291.6 288.3
Oct 307.0 290.3 290.6
Nov 304.6 289.8
Dec 302.7 288.4
INFORMATION EMPLOYMENT (Seasonally adjusted) Month 2008 2009 2010
Jan 37.9 36.4 34.6
Feb 38.1 36.2 33.8
Mar 38.2 35.8 34.3
Apr 38.8 35.5 34.1
May 38.7 35.1 33.9
Jun 38.5 35.0 33.8
Jul 37.7 34.9 34.0
Aug 37.9 34.7 34.1
Sep 37.3 34.5 34.3
Oct 37.0 34.3 33.8
Nov 36.8 34.6
Dec 36.7 34.4
100
130
160
190
220
250
280
96 97 98 99 00 01 02 03 04 05 06 07 08 09 10
Tho
usan
ds
40
45
50
55
60
65
70
75
96 97 98 99 00 01 02 03 04 05 06 07 08 09 10
Tho
usan
ds
30
33
36
39
42
45
48
96 97 98 99 00 01 02 03 04 05 06 07 08 09 10
Tho
usan
ds
270
280
290
300
310
320
330
96 97 98 99 00 01 02 03 04 05 06 07 08 09 10
Tho
usan
ds
THE CONNECTICUT ECONOMIC DIGEST 11December 2010
ECONOMIC INDICATOR TRENDS STATE
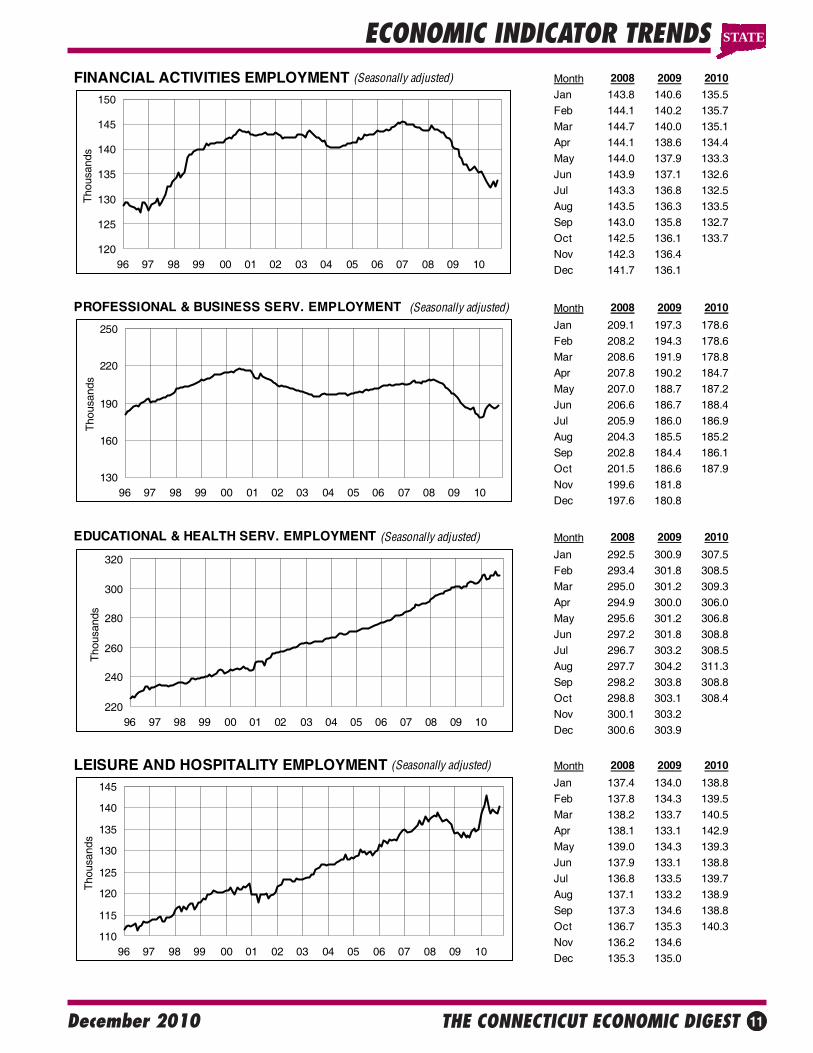
FINANCIAL ACTIVITIES EMPLOYMENT (Seasonally adjusted) Month 2008 2009 2010
Jan 143.8 140.6 135.5
Feb 144.1 140.2 135.7
Mar 144.7 140.0 135.1
Apr 144.1 138.6 134.4
May 144.0 137.9 133.3
Jun 143.9 137.1 132.6
Jul 143.3 136.8 132.5
Aug 143.5 136.3 133.5
Sep 143.0 135.8 132.7
Oct 142.5 136.1 133.7
Nov 142.3 136.4
Dec 141.7 136.1
PROFESSIONAL & BUSINESS SERV. EMPLOYMENT (Seasonally adjusted) Month 2008 2009 2010
Jan 209.1 197.3 178.6
Feb 208.2 194.3 178.6
Mar 208.6 191.9 178.8
Apr 207.8 190.2 184.7
May 207.0 188.7 187.2
Jun 206.6 186.7 188.4
Jul 205.9 186.0 186.9
Aug 204.3 185.5 185.2
Sep 202.8 184.4 186.1
Oct 201.5 186.6 187.9
Nov 199.6 181.8
Dec 197.6 180.8
EDUCATIONAL & HEALTH SERV. EMPLOYMENT (Seasonally adjusted) Month 2008 2009 2010
Jan 292.5 300.9 307.5
Feb 293.4 301.8 308.5
Mar 295.0 301.2 309.3
Apr 294.9 300.0 306.0
May 295.6 301.2 306.8
Jun 297.2 301.8 308.8
Jul 296.7 303.2 308.5
Aug 297.7 304.2 311.3
Sep 298.2 303.8 308.8
Oct 298.8 303.1 308.4
Nov 300.1 303.2
Dec 300.6 303.9
LEISURE AND HOSPITALITY EMPLOYMENT (Seasonally adjusted) Month 2008 2009 2010
Jan 137.4 134.0 138.8
Feb 137.8 134.3 139.5
Mar 138.2 133.7 140.5
Apr 138.1 133.1 142.9
May 139.0 134.3 139.3
Jun 137.9 133.1 138.8
Jul 136.8 133.5 139.7
Aug 137.1 133.2 138.9
Sep 137.3 134.6 138.8
Oct 136.7 135.3 140.3
Nov 136.2 134.6
Dec 135.3 135.0
110
115
120
125
130
135
140
145
96 97 98 99 00 01 02 03 04 05 06 07 08 09 10
Tho
usan
ds
130
160
190
220
250
96 97 98 99 00 01 02 03 04 05 06 07 08 09 10
Tho
usan
ds
220
240
260
280
300
320
96 97 98 99 00 01 02 03 04 05 06 07 08 09 10
Tho
usan
ds
120
125
130
135
140
145
150
96 97 98 99 00 01 02 03 04 05 06 07 08 09 10
Tho
usan
ds
THE CONNECTICUT ECONOMIC DIGEST12 December 2010
Not Seasonally Adjusted
OCT OCT CHANGE SEP2010 2009 NO. % 2010
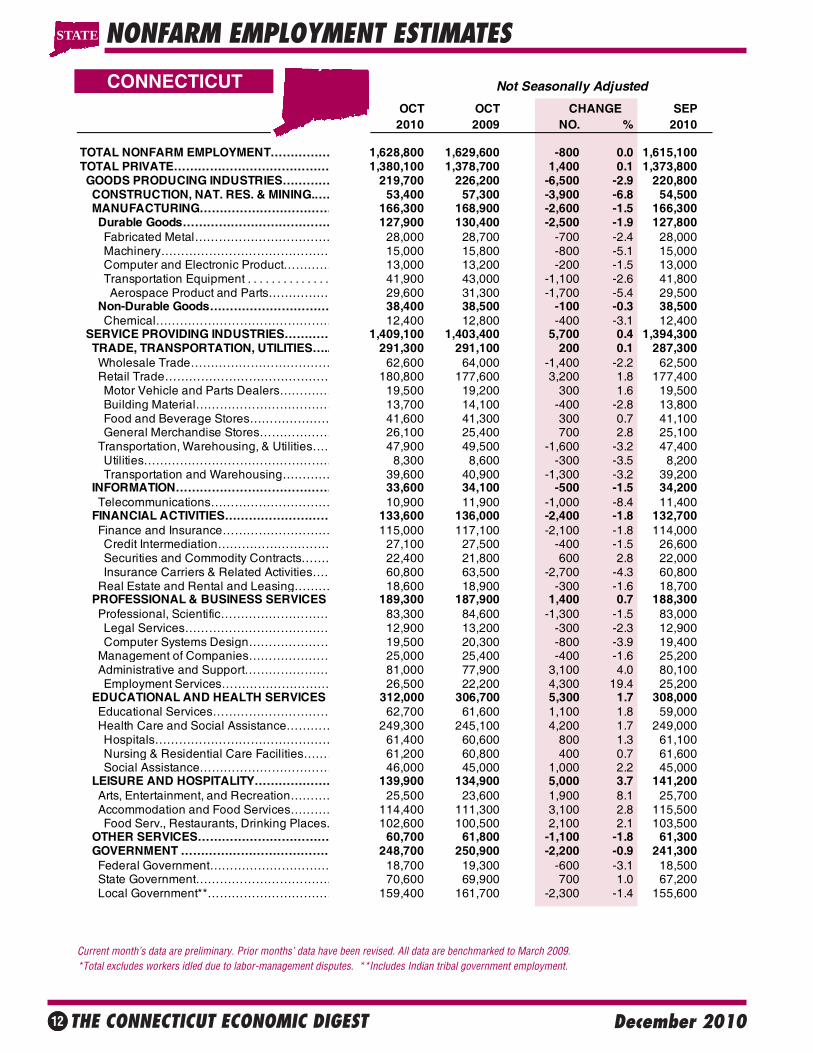
TOTAL NONFARM EMPLOYMENT…………… 1,628,800 1,629,600 -800 0.0 1,615,100TOTAL PRIVATE………………………………… 1,380,100 1,378,700 1,400 0.1 1,373,800 GOODS PRODUCING INDUSTRIES………… 219,700 226,200 -6,500 -2.9 220,800 CONSTRUCTION, NAT. RES. & MINING.…… 53,400 57,300 -3,900 -6.8 54,500 MANUFACTURING…………………………… 166,300 168,900 -2,600 -1.5 166,300 Durable Goods………………………………… 127,900 130,400 -2,500 -1.9 127,800 Fabricated Metal……………………………… 28,000 28,700 -700 -2.4 28,000 Machinery…………………………………… 15,000 15,800 -800 -5.1 15,000 Computer and Electronic Product………… 13,000 13,200 -200 -1.5 13,000 Transportation Equipment . . . . . . . . . . . . . . 41,900 43,000 -1,100 -2.6 41,800 Aerospace Product and Parts…………… 29,600 31,300 -1,700 -5.4 29,500 Non-Durable Goods………………………… 38,400 38,500 -100 -0.3 38,500 Chemical……………………………………… 12,400 12,800 -400 -3.1 12,400 SERVICE PROVIDING INDUSTRIES………… 1,409,100 1,403,400 5,700 0.4 1,394,300 TRADE, TRANSPORTATION, UTILITIES….. 291,300 291,100 200 0.1 287,300 Wholesale Trade……………………………… 62,600 64,000 -1,400 -2.2 62,500 Retail Trade…………………………………… 180,800 177,600 3,200 1.8 177,400 Motor Vehicle and Parts Dealers…………… 19,500 19,200 300 1.6 19,500 Building Material……………………………… 13,700 14,100 -400 -2.8 13,800 Food and Beverage Stores………………… 41,600 41,300 300 0.7 41,100 General Merchandise Stores……………… 26,100 25,400 700 2.8 25,100 Transportation, Warehousing, & Utilities…… 47,900 49,500 -1,600 -3.2 47,400 Utilities………………………………………… 8,300 8,600 -300 -3.5 8,200 Transportation and Warehousing………… 39,600 40,900 -1,300 -3.2 39,200 INFORMATION………………………………… 33,600 34,100 -500 -1.5 34,200 Telecommunications………………………… 10,900 11,900 -1,000 -8.4 11,400 FINANCIAL ACTIVITIES……………………… 133,600 136,000 -2,400 -1.8 132,700 Finance and Insurance……………………… 115,000 117,100 -2,100 -1.8 114,000 Credit Intermediation………………………… 27,100 27,500 -400 -1.5 26,600 Securities and Commodity Contracts……… 22,400 21,800 600 2.8 22,000 Insurance Carriers & Related Activities…… 60,800 63,500 -2,700 -4.3 60,800 Real Estate and Rental and Leasing……… 18,600 18,900 -300 -1.6 18,700 PROFESSIONAL & BUSINESS SERVICES 189,300 187,900 1,400 0.7 188,300 Professional, Scientific……………………… 83,300 84,600 -1,300 -1.5 83,000 Legal Services……………………………… 12,900 13,200 -300 -2.3 12,900 Computer Systems Design………………… 19,500 20,300 -800 -3.9 19,400 Management of Companies………………… 25,000 25,400 -400 -1.6 25,200 Administrative and Support………………… 81,000 77,900 3,100 4.0 80,100 Employment Services……………………… 26,500 22,200 4,300 19.4 25,200 EDUCATIONAL AND HEALTH SERVICES 312,000 306,700 5,300 1.7 308,000 Educational Services………………………… 62,700 61,600 1,100 1.8 59,000 Health Care and Social Assistance………… 249,300 245,100 4,200 1.7 249,000 Hospitals……………………………………… 61,400 60,600 800 1.3 61,100 Nursing & Residential Care Facilities……… 61,200 60,800 400 0.7 61,600 Social Assistance…………………………… 46,000 45,000 1,000 2.2 45,000 LEISURE AND HOSPITALITY………………… 139,900 134,900 5,000 3.7 141,200 Arts, Entertainment, and Recreation………… 25,500 23,600 1,900 8.1 25,700 Accommodation and Food Services………… 114,400 111,300 3,100 2.8 115,500 Food Serv., Restaurants, Drinking Places… 102,600 100,500 2,100 2.1 103,500 OTHER SERVICES…………………………… 60,700 61,800 -1,100 -1.8 61,300 GOVERNMENT ………………………………… 248,700 250,900 -2,200 -0.9 241,300 Federal Government………………………… 18,700 19,300 -600 -3.1 18,500 State Government……………………………. 70,600 69,900 700 1.0 67,200 Local Government**…………………………… 159,400 161,700 -2,300 -1.4 155,600
CONNECTICUT
NONFARM EMPLOYMENT ESTIMATES
Current month’s data are preliminary. Prior months’ data have been revised. All data are benchmarked to March 2009. *Total excludes workers idled due to labor-management disputes. **Includes Indian tribal government employment.
STATE
THE CONNECTICUT ECONOMIC DIGEST 13December 2010
Not Seasonally Adjusted
OCT OCT CHANGE SEP2010 2009 NO. % 2010
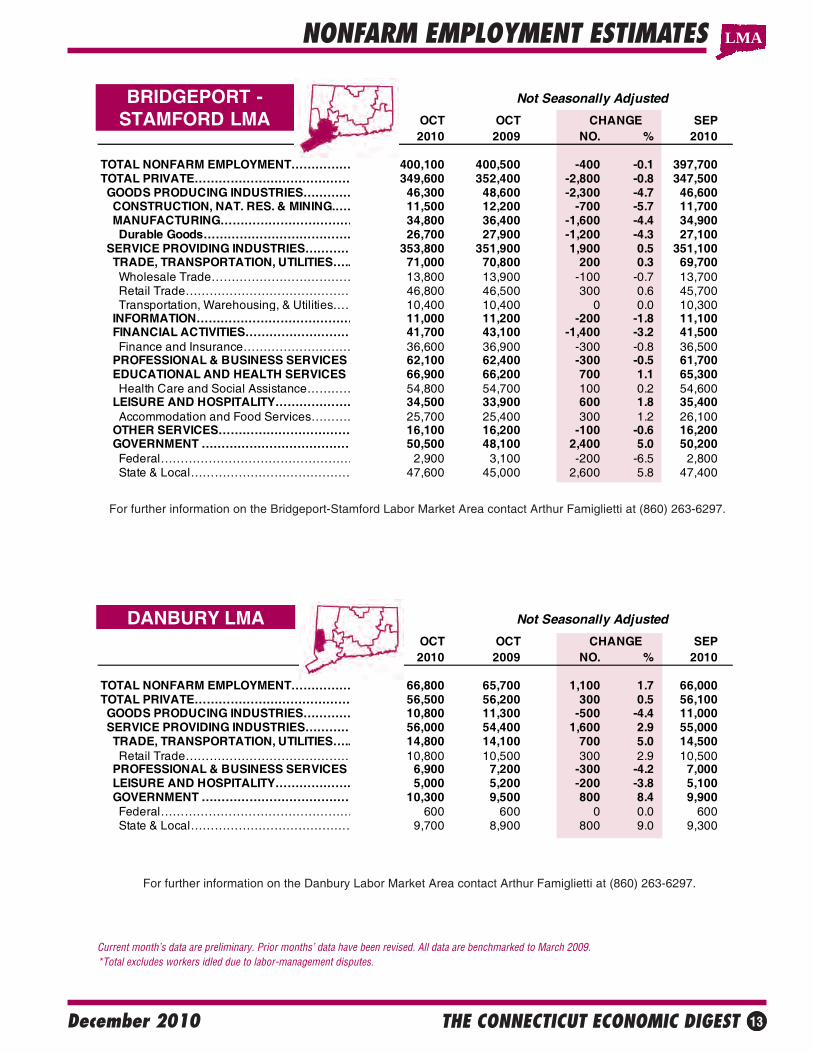
TOTAL NONFARM EMPLOYMENT…………… 66,800 65,700 1,100 1.7 66,000TOTAL PRIVATE………………………………… 56,500 56,200 300 0.5 56,100 GOODS PRODUCING INDUSTRIES………… 10,800 11,300 -500 -4.4 11,000 SERVICE PROVIDING INDUSTRIES………… 56,000 54,400 1,600 2.9 55,000 TRADE, TRANSPORTATION, UTILITIES….. 14,800 14,100 700 5.0 14,500 Retail Trade…………………………………… 10,800 10,500 300 2.9 10,500 PROFESSIONAL & BUSINESS SERVICES 6,900 7,200 -300 -4.2 7,000 LEISURE AND HOSPITALITY………………… 5,000 5,200 -200 -3.8 5,100 GOVERNMENT ………………………………… 10,300 9,500 800 8.4 9,900 Federal………………………………………… 600 600 0 0.0 600 State & Local…………………………………… 9,700 8,900 800 9.0 9,300
Not Seasonally Adjusted
OCT OCT CHANGE SEP2010 2009 NO. % 2010
TOTAL NONFARM EMPLOYMENT…………… 400,100 400,500 -400 -0.1 397,700TOTAL PRIVATE………………………………… 349,600 352,400 -2,800 -0.8 347,500 GOODS PRODUCING INDUSTRIES………… 46,300 48,600 -2,300 -4.7 46,600 CONSTRUCTION, NAT. RES. & MINING.…… 11,500 12,200 -700 -5.7 11,700 MANUFACTURING…………………………… 34,800 36,400 -1,600 -4.4 34,900 Durable Goods………………………………… 26,700 27,900 -1,200 -4.3 27,100 SERVICE PROVIDING INDUSTRIES………… 353,800 351,900 1,900 0.5 351,100 TRADE, TRANSPORTATION, UTILITIES….. 71,000 70,800 200 0.3 69,700 Wholesale Trade……………………………… 13,800 13,900 -100 -0.7 13,700 Retail Trade…………………………………… 46,800 46,500 300 0.6 45,700 Transportation, Warehousing, & Utilities…… 10,400 10,400 0 0.0 10,300 INFORMATION………………………………… 11,000 11,200 -200 -1.8 11,100 FINANCIAL ACTIVITIES……………………… 41,700 43,100 -1,400 -3.2 41,500 Finance and Insurance……………………… 36,600 36,900 -300 -0.8 36,500 PROFESSIONAL & BUSINESS SERVICES 62,100 62,400 -300 -0.5 61,700 EDUCATIONAL AND HEALTH SERVICES 66,900 66,200 700 1.1 65,300 Health Care and Social Assistance………… 54,800 54,700 100 0.2 54,600 LEISURE AND HOSPITALITY………………… 34,500 33,900 600 1.8 35,400 Accommodation and Food Services………… 25,700 25,400 300 1.2 26,100 OTHER SERVICES…………………………… 16,100 16,200 -100 -0.6 16,200 GOVERNMENT ………………………………… 50,500 48,100 2,400 5.0 50,200 Federal………………………………………… 2,900 3,100 -200 -6.5 2,800 State & Local…………………………………… 47,600 45,000 2,600 5.8 47,400
DANBURY LMA
BRIDGEPORT -STAMFORD LMA
NONFARM EMPLOYMENT ESTIMATES
Current month’s data are preliminary. Prior months’ data have been revised. All data are benchmarked to March 2009. *Total excludes workers idled due to labor-management disputes.
For further information on the Bridgeport-Stamford Labor Market Area contact Arthur Famiglietti at (860) 263-6297.
For further information on the Danbury Labor Market Area contact Arthur Famiglietti at (860) 263-6297.
LMA
THE CONNECTICUT ECONOMIC DIGEST14 December 2010
Not Seasonally Adjusted
OCT OCT CHANGE SEP2010 2009 NO. % 2010
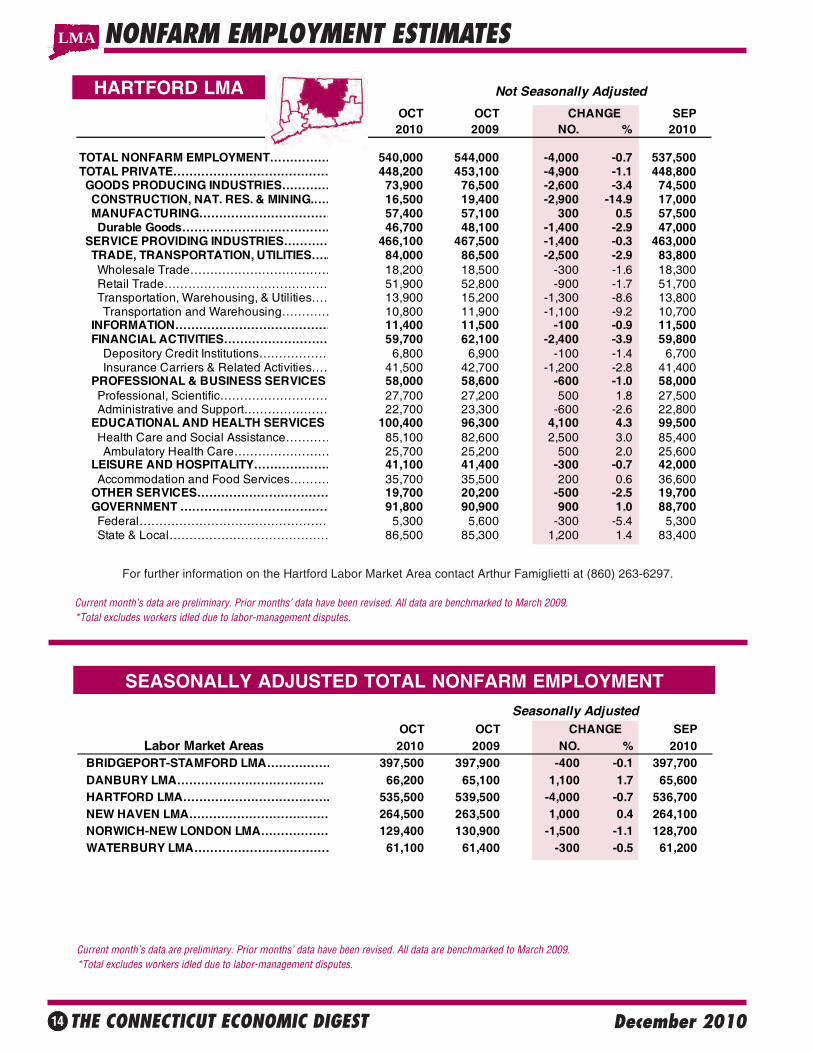
TOTAL NONFARM EMPLOYMENT…………… 540,000 544,000 -4,000 -0.7 537,500TOTAL PRIVATE………………………………… 448,200 453,100 -4,900 -1.1 448,800 GOODS PRODUCING INDUSTRIES………… 73,900 76,500 -2,600 -3.4 74,500 CONSTRUCTION, NAT. RES. & MINING.…… 16,500 19,400 -2,900 -14.9 17,000 MANUFACTURING…………………………… 57,400 57,100 300 0.5 57,500 Durable Goods………………………………… 46,700 48,100 -1,400 -2.9 47,000 SERVICE PROVIDING INDUSTRIES………… 466,100 467,500 -1,400 -0.3 463,000 TRADE, TRANSPORTATION, UTILITIES….. 84,000 86,500 -2,500 -2.9 83,800 Wholesale Trade……………………………… 18,200 18,500 -300 -1.6 18,300 Retail Trade…………………………………… 51,900 52,800 -900 -1.7 51,700 Transportation, Warehousing, & Utilities…… 13,900 15,200 -1,300 -8.6 13,800 Transportation and Warehousing………… 10,800 11,900 -1,100 -9.2 10,700 INFORMATION………………………………… 11,400 11,500 -100 -0.9 11,500 FINANCIAL ACTIVITIES……………………… 59,700 62,100 -2,400 -3.9 59,800 Depository Credit Institutions……………… 6,800 6,900 -100 -1.4 6,700 Insurance Carriers & Related Activities…… 41,500 42,700 -1,200 -2.8 41,400 PROFESSIONAL & BUSINESS SERVICES 58,000 58,600 -600 -1.0 58,000 Professional, Scientific……………………… 27,700 27,200 500 1.8 27,500 Administrative and Support………………… 22,700 23,300 -600 -2.6 22,800 EDUCATIONAL AND HEALTH SERVICES 100,400 96,300 4,100 4.3 99,500 Health Care and Social Assistance………… 85,100 82,600 2,500 3.0 85,400 Ambulatory Health Care…………………… 25,700 25,200 500 2.0 25,600 LEISURE AND HOSPITALITY………………… 41,100 41,400 -300 -0.7 42,000 Accommodation and Food Services………… 35,700 35,500 200 0.6 36,600 OTHER SERVICES…………………………… 19,700 20,200 -500 -2.5 19,700 GOVERNMENT ………………………………… 91,800 90,900 900 1.0 88,700 Federal………………………………………… 5,300 5,600 -300 -5.4 5,300 State & Local…………………………………… 86,500 85,300 1,200 1.4 83,400
HARTFORD LMA
NONFARM EMPLOYMENT ESTIMATES
Current month’s data are preliminary. Prior months’ data have been revised. All data are benchmarked to March 2009. *Total excludes workers idled due to labor-management disputes.
For further information on the Hartford Labor Market Area contact Arthur Famiglietti at (860) 263-6297.
LMA
SEASONALLY ADJUSTED TOTAL NONFARM EMPLOYMENT
Current month’s data are preliminary. Prior months’ data have been revised. All data are benchmarked to March 2009. *Total excludes workers idled due to labor-management disputes.
Seasonally AdjustedOCT OCT CHANGE SEP
Labor Market Areas 2010 2009 NO. % 2010 BRIDGEPORT-STAMFORD LMA……………… 397,500 397,900 -400 -0.1 397,700 DANBURY LMA………………………………. 66,200 65,100 1,100 1.7 65,600 HARTFORD LMA………………………………. 535,500 539,500 -4,000 -0.7 536,700 NEW HAVEN LMA……………………………… 264,500 263,500 1,000 0.4 264,100 NORWICH-NEW LONDON LMA……………… 129,400 130,900 -1,500 -1.1 128,700 WATERBURY LMA……………………………… 61,100 61,400 -300 -0.5 61,200
THE CONNECTICUT ECONOMIC DIGEST 15December 2010
Not Seasonally Adjusted
OCT OCT CHANGE SEP2010 2009 NO. % 2010
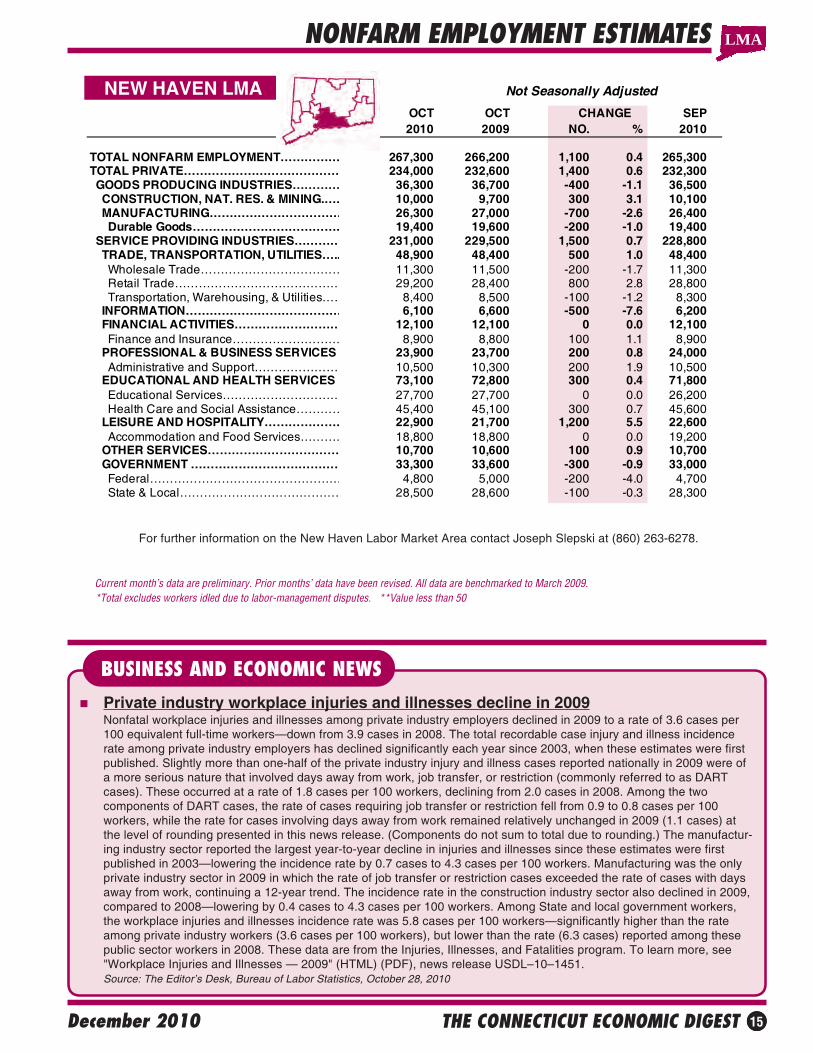
TOTAL NONFARM EMPLOYMENT…………… 267,300 266,200 1,100 0.4 265,300 TOTAL PRIVATE………………………………… 234,000 232,600 1,400 0.6 232,300 GOODS PRODUCING INDUSTRIES………… 36,300 36,700 -400 -1.1 36,500 CONSTRUCTION, NAT. RES. & MINING.…… 10,000 9,700 300 3.1 10,100 MANUFACTURING…………………………… 26,300 27,000 -700 -2.6 26,400 Durable Goods………………………………… 19,400 19,600 -200 -1.0 19,400 SERVICE PROVIDING INDUSTRIES………… 231,000 229,500 1,500 0.7 228,800 TRADE, TRANSPORTATION, UTILITIES….. 48,900 48,400 500 1.0 48,400 Wholesale Trade……………………………… 11,300 11,500 -200 -1.7 11,300 Retail Trade…………………………………… 29,200 28,400 800 2.8 28,800 Transportation, Warehousing, & Utilities…… 8,400 8,500 -100 -1.2 8,300 INFORMATION………………………………… 6,100 6,600 -500 -7.6 6,200 FINANCIAL ACTIVITIES……………………… 12,100 12,100 0 0.0 12,100 Finance and Insurance……………………… 8,900 8,800 100 1.1 8,900 PROFESSIONAL & BUSINESS SERVICES 23,900 23,700 200 0.8 24,000 Administrative and Support………………… 10,500 10,300 200 1.9 10,500 EDUCATIONAL AND HEALTH SERVICES 73,100 72,800 300 0.4 71,800 Educational Services………………………… 27,700 27,700 0 0.0 26,200 Health Care and Social Assistance………… 45,400 45,100 300 0.7 45,600 LEISURE AND HOSPITALITY………………… 22,900 21,700 1,200 5.5 22,600 Accommodation and Food Services………… 18,800 18,800 0 0.0 19,200 OTHER SERVICES…………………………… 10,700 10,600 100 0.9 10,700 GOVERNMENT ………………………………… 33,300 33,600 -300 -0.9 33,000 Federal………………………………………… 4,800 5,000 -200 -4.0 4,700 State & Local…………………………………… 28,500 28,600 -100 -0.3 28,300
NEW HAVEN LMA
NONFARM EMPLOYMENT ESTIMATES
Current month’s data are preliminary. Prior months’ data have been revised. All data are benchmarked to March 2009. *Total excludes workers idled due to labor-management disputes. **Value less than 50
For further information on the New Haven Labor Market Area contact Joseph Slepski at (860) 263-6278.
BUSINESS AND ECONOMIC NEWS
LMA
Private industry workplace injuries and illnesses decline in 2009Nonfatal workplace injuries and illnesses among private industry employers declined in 2009 to a rate of 3.6 cases per100 equivalent full-time workers—down from 3.9 cases in 2008. The total recordable case injury and illness incidencerate among private industry employers has declined significantly each year since 2003, when these estimates were firstpublished. Slightly more than one-half of the private industry injury and illness cases reported nationally in 2009 were ofa more serious nature that involved days away from work, job transfer, or restriction (commonly referred to as DARTcases). These occurred at a rate of 1.8 cases per 100 workers, declining from 2.0 cases in 2008. Among the twocomponents of DART cases, the rate of cases requiring job transfer or restriction fell from 0.9 to 0.8 cases per 100workers, while the rate for cases involving days away from work remained relatively unchanged in 2009 (1.1 cases) atthe level of rounding presented in this news release. (Components do not sum to total due to rounding.) The manufactur-ing industry sector reported the largest year-to-year decline in injuries and illnesses since these estimates were firstpublished in 2003—lowering the incidence rate by 0.7 cases to 4.3 cases per 100 workers. Manufacturing was the onlyprivate industry sector in 2009 in which the rate of job transfer or restriction cases exceeded the rate of cases with daysaway from work, continuing a 12-year trend. The incidence rate in the construction industry sector also declined in 2009,compared to 2008—lowering by 0.4 cases to 4.3 cases per 100 workers. Among State and local government workers,the workplace injuries and illnesses incidence rate was 5.8 cases per 100 workers—significantly higher than the rateamong private industry workers (3.6 cases per 100 workers), but lower than the rate (6.3 cases) reported among thesepublic sector workers in 2008. These data are from the Injuries, Illnesses, and Fatalities program. To learn more, see"Workplace Injuries and Illnesses — 2009" (HTML) (PDF), news release USDL–10–1451.Source: The Editor’s Desk, Bureau of Labor Statistics, October 28, 2010
THE CONNECTICUT ECONOMIC DIGEST16 December 2010
Not Seasonally Adjusted
OCT OCT CHANGE SEP 2010 2009 NO. % 2010
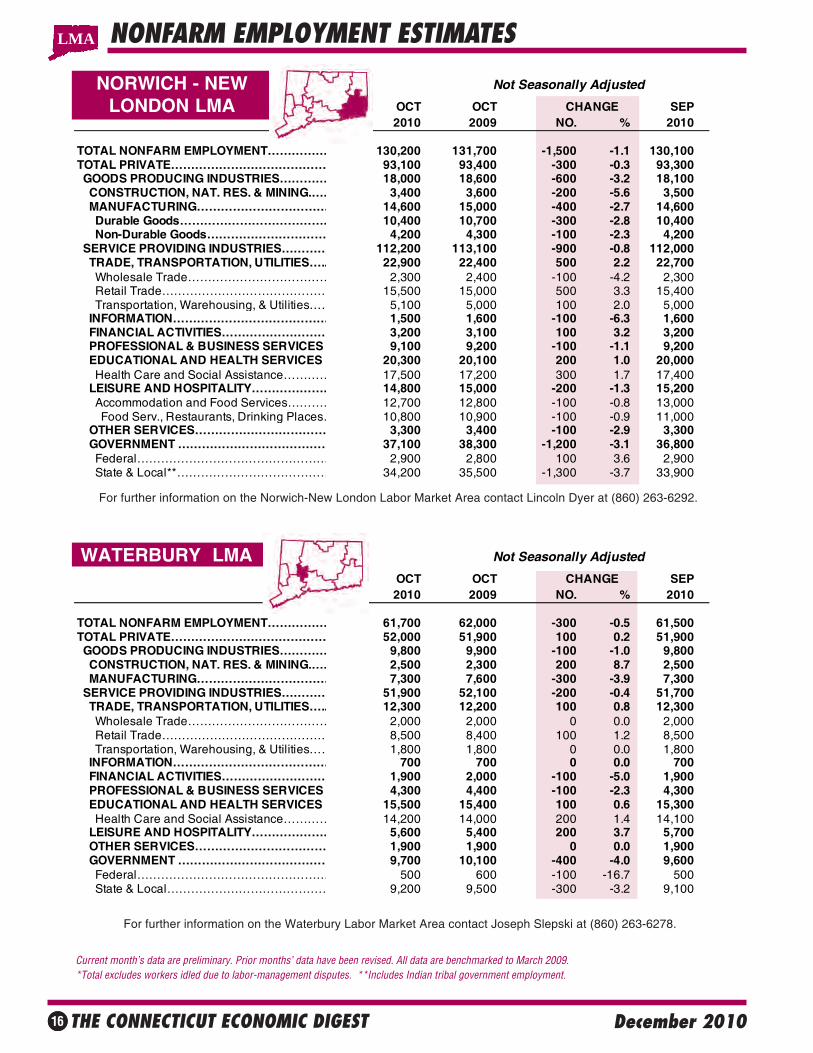
TOTAL NONFARM EMPLOYMENT…………… 61,700 62,000 -300 -0.5 61,500TOTAL PRIVATE………………………………… 52,000 51,900 100 0.2 51,900 GOODS PRODUCING INDUSTRIES………… 9,800 9,900 -100 -1.0 9,800 CONSTRUCTION, NAT. RES. & MINING.…… 2,500 2,300 200 8.7 2,500 MANUFACTURING…………………………… 7,300 7,600 -300 -3.9 7,300 SERVICE PROVIDING INDUSTRIES………… 51,900 52,100 -200 -0.4 51,700 TRADE, TRANSPORTATION, UTILITIES….. 12,300 12,200 100 0.8 12,300 Wholesale Trade……………………………… 2,000 2,000 0 0.0 2,000 Retail Trade…………………………………… 8,500 8,400 100 1.2 8,500 Transportation, Warehousing, & Utilities…… 1,800 1,800 0 0.0 1,800 INFORMATION………………………………… 700 700 0 0.0 700 FINANCIAL ACTIVITIES……………………… 1,900 2,000 -100 -5.0 1,900 PROFESSIONAL & BUSINESS SERVICES 4,300 4,400 -100 -2.3 4,300 EDUCATIONAL AND HEALTH SERVICES 15,500 15,400 100 0.6 15,300 Health Care and Social Assistance………… 14,200 14,000 200 1.4 14,100 LEISURE AND HOSPITALITY………………… 5,600 5,400 200 3.7 5,700 OTHER SERVICES…………………………… 1,900 1,900 0 0.0 1,900 GOVERNMENT ………………………………… 9,700 10,100 -400 -4.0 9,600 Federal………………………………………… 500 600 -100 -16.7 500 State & Local…………………………………… 9,200 9,500 -300 -3.2 9,100
Not Seasonally Adjusted
OCT OCT CHANGE SEP2010 2009 NO. % 2010
TOTAL NONFARM EMPLOYMENT…………… 130,200 131,700 -1,500 -1.1 130,100TOTAL PRIVATE………………………………… 93,100 93,400 -300 -0.3 93,300 GOODS PRODUCING INDUSTRIES………… 18,000 18,600 -600 -3.2 18,100 CONSTRUCTION, NAT. RES. & MINING.…… 3,400 3,600 -200 -5.6 3,500 MANUFACTURING…………………………… 14,600 15,000 -400 -2.7 14,600 Durable Goods………………………………… 10,400 10,700 -300 -2.8 10,400 Non-Durable Goods………………………… 4,200 4,300 -100 -2.3 4,200 SERVICE PROVIDING INDUSTRIES………… 112,200 113,100 -900 -0.8 112,000 TRADE, TRANSPORTATION, UTILITIES….. 22,900 22,400 500 2.2 22,700 Wholesale Trade……………………………… 2,300 2,400 -100 -4.2 2,300 Retail Trade…………………………………… 15,500 15,000 500 3.3 15,400 Transportation, Warehousing, & Utilities…… 5,100 5,000 100 2.0 5,000 INFORMATION………………………………… 1,500 1,600 -100 -6.3 1,600 FINANCIAL ACTIVITIES……………………… 3,200 3,100 100 3.2 3,200 PROFESSIONAL & BUSINESS SERVICES 9,100 9,200 -100 -1.1 9,200 EDUCATIONAL AND HEALTH SERVICES 20,300 20,100 200 1.0 20,000 Health Care and Social Assistance………… 17,500 17,200 300 1.7 17,400 LEISURE AND HOSPITALITY………………… 14,800 15,000 -200 -1.3 15,200 Accommodation and Food Services………… 12,700 12,800 -100 -0.8 13,000 Food Serv., Restaurants, Drinking Places… 10,800 10,900 -100 -0.9 11,000 OTHER SERVICES…………………………… 3,300 3,400 -100 -2.9 3,300 GOVERNMENT ………………………………… 37,100 38,300 -1,200 -3.1 36,800 Federal………………………………………… 2,900 2,800 100 3.6 2,900 State & Local**………………………………… 34,200 35,500 -1,300 -3.7 33,900
NORWICH - NEWLONDON LMA
Current month’s data are preliminary. Prior months’ data have been revised. All data are benchmarked to March 2009. *Total excludes workers idled due to labor-management disputes. **Includes Indian tribal government employment.
For further information on the Norwich-New London Labor Market Area contact Lincoln Dyer at (860) 263-6292.
For further information on the Waterbury Labor Market Area contact Joseph Slepski at (860) 263-6278.
NONFARM EMPLOYMENT ESTIMATES
WATERBURY LMA
LMA
THE CONNECTICUT ECONOMIC DIGEST 17December 2010
Not Seasonally Adjusted
OCT OCT CHANGE SEP 2010 2009 NO. % 2010
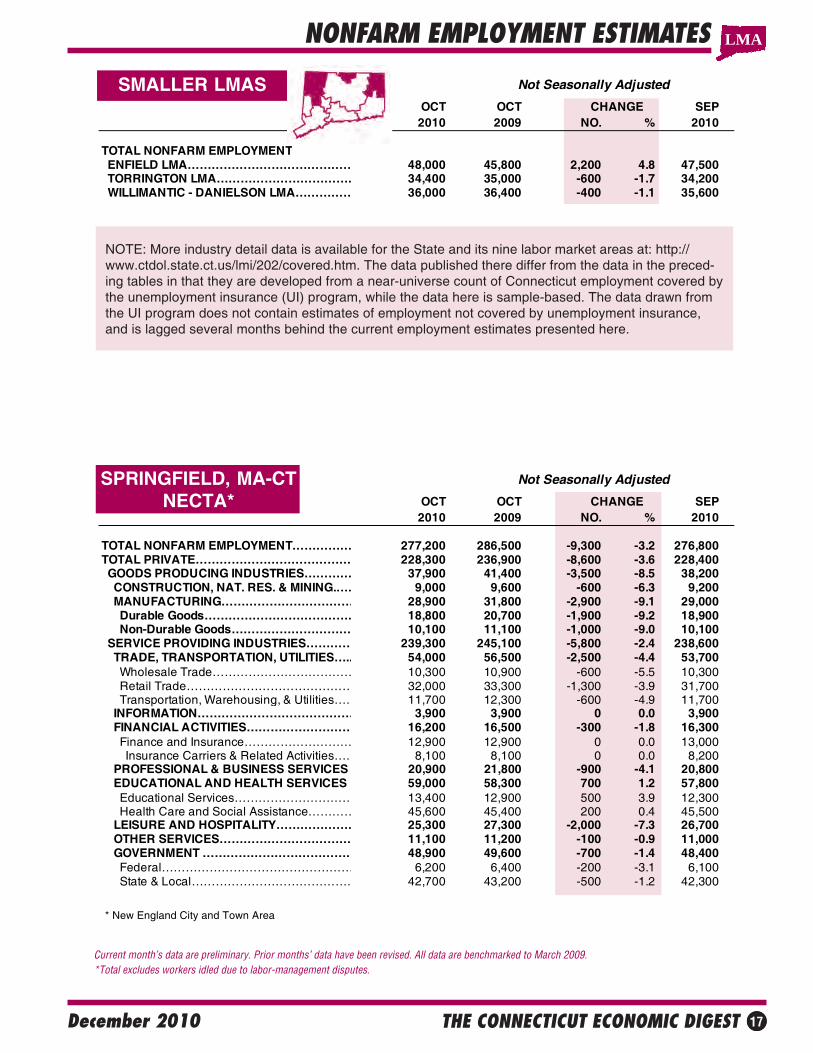
TOTAL NONFARM EMPLOYMENT ENFIELD LMA…………………………………… 48,000 45,800 2,200 4.8 47,500 TORRINGTON LMA……………………………… 34,400 35,000 -600 -1.7 34,200 WILLIMANTIC - DANIELSON LMA…………… 36,000 36,400 -400 -1.1 35,600
NONFARM EMPLOYMENT ESTIMATES
NOTE: More industry detail data is available for the State and its nine labor market areas at: http://www.ctdol.state.ct.us/lmi/202/covered.htm. The data published there differ from the data in the preced-ing tables in that they are developed from a near-universe count of Connecticut employment covered bythe unemployment insurance (UI) program, while the data here is sample-based. The data drawn fromthe UI program does not contain estimates of employment not covered by unemployment insurance,and is lagged several months behind the current employment estimates presented here.
SMALLER LMAS
Current month’s data are preliminary. Prior months’ data have been revised. All data are benchmarked to March 2009. *Total excludes workers idled due to labor-management disputes.
SPRINGFIELD, MA-CTNECTA*
* New England City and Town Area
LMA
Not Seasonally Adjusted
OCT OCT CHANGE SEP2010 2009 NO. % 2010
TOTAL NONFARM EMPLOYMENT…………… 277,200 286,500 -9,300 -3.2 276,800TOTAL PRIVATE………………………………… 228,300 236,900 -8,600 -3.6 228,400 GOODS PRODUCING INDUSTRIES………… 37,900 41,400 -3,500 -8.5 38,200 CONSTRUCTION, NAT. RES. & MINING.…… 9,000 9,600 -600 -6.3 9,200 MANUFACTURING…………………………… 28,900 31,800 -2,900 -9.1 29,000 Durable Goods………………………………… 18,800 20,700 -1,900 -9.2 18,900 Non-Durable Goods………………………… 10,100 11,100 -1,000 -9.0 10,100 SERVICE PROVIDING INDUSTRIES………… 239,300 245,100 -5,800 -2.4 238,600 TRADE, TRANSPORTATION, UTILITIES….. 54,000 56,500 -2,500 -4.4 53,700 Wholesale Trade……………………………… 10,300 10,900 -600 -5.5 10,300 Retail Trade…………………………………… 32,000 33,300 -1,300 -3.9 31,700 Transportation, Warehousing, & Utilities…… 11,700 12,300 -600 -4.9 11,700 INFORMATION………………………………… 3,900 3,900 0 0.0 3,900 FINANCIAL ACTIVITIES……………………… 16,200 16,500 -300 -1.8 16,300 Finance and Insurance……………………… 12,900 12,900 0 0.0 13,000 Insurance Carriers & Related Activities…… 8,100 8,100 0 0.0 8,200 PROFESSIONAL & BUSINESS SERVICES 20,900 21,800 -900 -4.1 20,800 EDUCATIONAL AND HEALTH SERVICES 59,000 58,300 700 1.2 57,800 Educational Services………………………… 13,400 12,900 500 3.9 12,300 Health Care and Social Assistance………… 45,600 45,400 200 0.4 45,500 LEISURE AND HOSPITALITY………………… 25,300 27,300 -2,000 -7.3 26,700 OTHER SERVICES…………………………… 11,100 11,200 -100 -0.9 11,000 GOVERNMENT ………………………………… 48,900 49,600 -700 -1.4 48,400 Federal………………………………………… 6,200 6,400 -200 -3.1 6,100 State & Local…………………………………… 42,700 43,200 -500 -1.2 42,300
THE CONNECTICUT ECONOMIC DIGEST18 December 2010
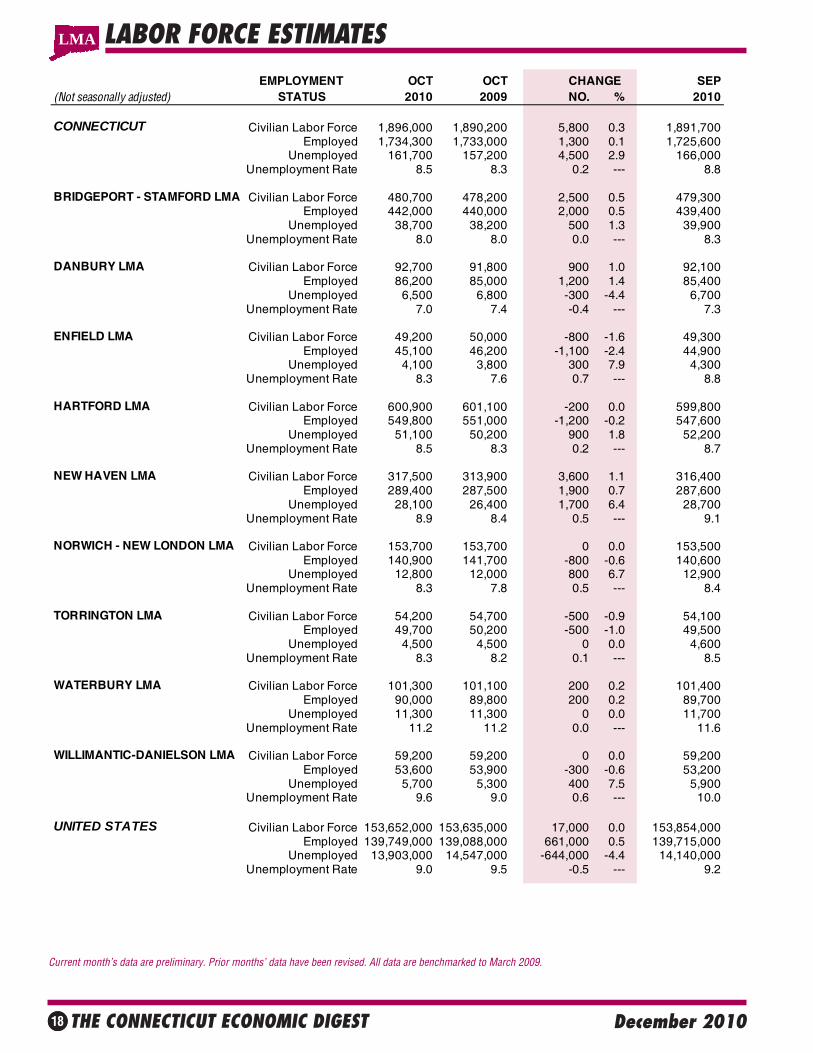
LABOR FORCE ESTIMATES
Current month’s data are preliminary. Prior months’ data have been revised. All data are benchmarked to March 2009.
EMPLOYMENT OCT OCT CHANGE SEP(Not seasonally adjusted) STATUS 2010 2009 NO. % 2010
CONNECTICUT Civilian Labor Force 1,896,000 1,890,200 5,800 0.3 1,891,700Employed 1,734,300 1,733,000 1,300 0.1 1,725,600
Unemployed 161,700 157,200 4,500 2.9 166,000Unemployment Rate 8.5 8.3 0.2 --- 8.8
BRIDGEPORT - STAMFORD LMA Civilian Labor Force 480,700 478,200 2,500 0.5 479,300Employed 442,000 440,000 2,000 0.5 439,400
Unemployed 38,700 38,200 500 1.3 39,900Unemployment Rate 8.0 8.0 0.0 --- 8.3
DANBURY LMA Civilian Labor Force 92,700 91,800 900 1.0 92,100Employed 86,200 85,000 1,200 1.4 85,400
Unemployed 6,500 6,800 -300 -4.4 6,700Unemployment Rate 7.0 7.4 -0.4 --- 7.3
ENFIELD LMA Civilian Labor Force 49,200 50,000 -800 -1.6 49,300Employed 45,100 46,200 -1,100 -2.4 44,900
Unemployed 4,100 3,800 300 7.9 4,300Unemployment Rate 8.3 7.6 0.7 --- 8.8
HARTFORD LMA Civilian Labor Force 600,900 601,100 -200 0.0 599,800Employed 549,800 551,000 -1,200 -0.2 547,600
Unemployed 51,100 50,200 900 1.8 52,200Unemployment Rate 8.5 8.3 0.2 --- 8.7
NEW HAVEN LMA Civilian Labor Force 317,500 313,900 3,600 1.1 316,400Employed 289,400 287,500 1,900 0.7 287,600
Unemployed 28,100 26,400 1,700 6.4 28,700Unemployment Rate 8.9 8.4 0.5 --- 9.1
NORWICH - NEW LONDON LMA Civilian Labor Force 153,700 153,700 0 0.0 153,500Employed 140,900 141,700 -800 -0.6 140,600
Unemployed 12,800 12,000 800 6.7 12,900Unemployment Rate 8.3 7.8 0.5 --- 8.4
TORRINGTON LMA Civilian Labor Force 54,200 54,700 -500 -0.9 54,100Employed 49,700 50,200 -500 -1.0 49,500
Unemployed 4,500 4,500 0 0.0 4,600Unemployment Rate 8.3 8.2 0.1 --- 8.5
WATERBURY LMA Civilian Labor Force 101,300 101,100 200 0.2 101,400Employed 90,000 89,800 200 0.2 89,700
Unemployed 11,300 11,300 0 0.0 11,700Unemployment Rate 11.2 11.2 0.0 --- 11.6
WILLIMANTIC-DANIELSON LMA Civilian Labor Force 59,200 59,200 0 0.0 59,200Employed 53,600 53,900 -300 -0.6 53,200
Unemployed 5,700 5,300 400 7.5 5,900Unemployment Rate 9.6 9.0 0.6 --- 10.0
UNITED STATES Civilian Labor Force 153,652,000 153,635,000 17,000 0.0 153,854,000Employed 139,749,000 139,088,000 661,000 0.5 139,715,000
Unemployed 13,903,000 14,547,000 -644,000 -4.4 14,140,000Unemployment Rate 9.0 9.5 -0.5 --- 9.2
LMA
THE CONNECTICUT ECONOMIC DIGEST 19December 2010
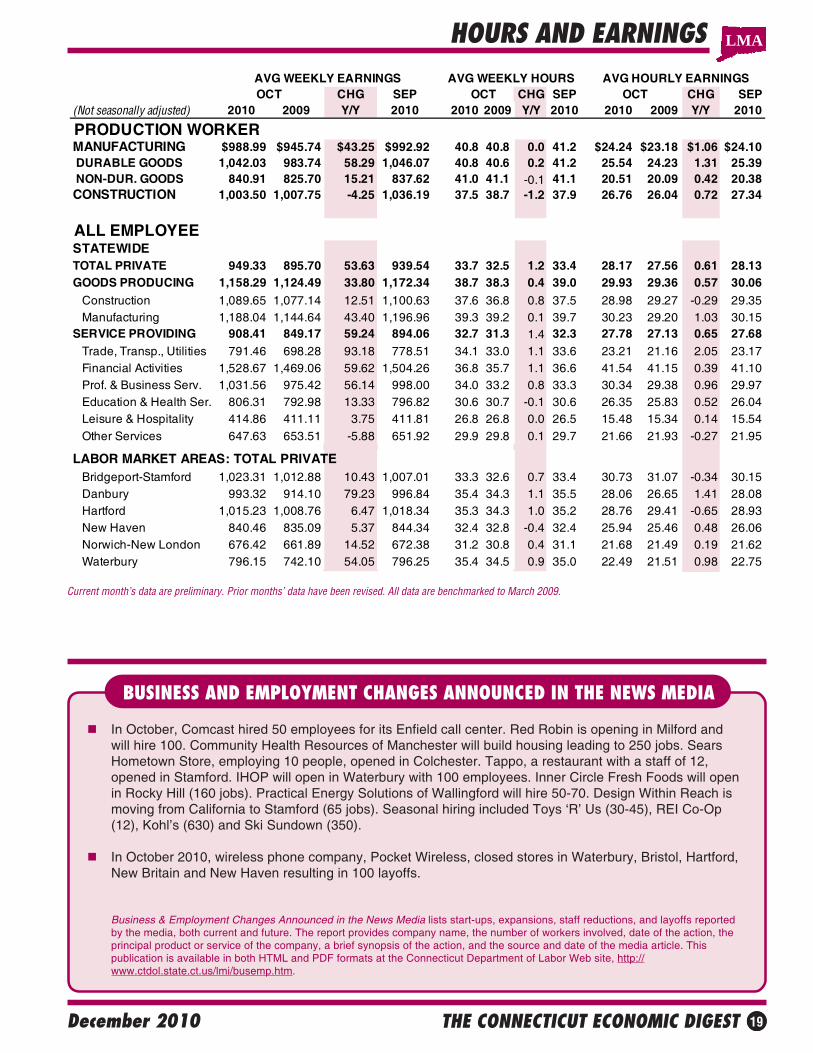
HOURS AND EARNINGS
Current month’s data are preliminary. Prior months’ data have been revised. All data are benchmarked to March 2009.
BUSINESS AND EMPLOYMENT CHANGES ANNOUNCED IN THE NEWS MEDIA
In October, Comcast hired 50 employees for its Enfield call center. Red Robin is opening in Milford andwill hire 100. Community Health Resources of Manchester will build housing leading to 250 jobs. SearsHometown Store, employing 10 people, opened in Colchester. Tappo, a restaurant with a staff of 12,opened in Stamford. IHOP will open in Waterbury with 100 employees. Inner Circle Fresh Foods will openin Rocky Hill (160 jobs). Practical Energy Solutions of Wallingford will hire 50-70. Design Within Reach ismoving from California to Stamford (65 jobs). Seasonal hiring included Toys ‘R’ Us (30-45), REI Co-Op(12), Kohl’s (630) and Ski Sundown (350).
In October 2010, wireless phone company, Pocket Wireless, closed stores in Waterbury, Bristol, Hartford,New Britain and New Haven resulting in 100 layoffs.
Business & Employment Changes Announced in the News Media lists start-ups, expansions, staff reductions, and layoffs reportedby the media, both current and future. The report provides company name, the number of workers involved, date of the action, theprincipal product or service of the company, a brief synopsis of the action, and the source and date of the media article. Thispublication is available in both HTML and PDF formats at the Connecticut Department of Labor Web site, http://www.ctdol.state.ct.us/lmi/busemp.htm.
LMA
AVG WEEKLY EARNINGS AVG WEEKLY HOURS AVG HOURLY EARNINGSOCT CHG SEP OCT CHG SEP OCT CHG SEP
(Not seasonally adjusted) 2010 2009 Y/Y 2010 2010 2009 Y/Y 2010 2010 2009 Y/Y 2010
PRODUCTION WORKERMANUFACTURING $988.99 $945.74 $43.25 $992.92 40.8 40.8 0.0 41.2 $24.24 $23.18 $1.06 $24.10 DURABLE GOODS 1,042.03 983.74 58.29 1,046.07 40.8 40.6 0.2 41.2 25.54 24.23 1.31 25.39 NON-DUR. GOODS 840.91 825.70 15.21 837.62 41.0 41.1 -0.1 41.1 20.51 20.09 0.42 20.38CONSTRUCTION 1,003.50 1,007.75 -4.25 1,036.19 37.5 38.7 -1.2 37.9 26.76 26.04 0.72 27.34
ALL EMPLOYEESTATEWIDETOTAL PRIVATE 949.33 895.70 53.63 939.54 33.7 32.5 1.2 33.4 28.17 27.56 0.61 28.13GOODS PRODUCING 1,158.29 1,124.49 33.80 1,172.34 38.7 38.3 0.4 39.0 29.93 29.36 0.57 30.06
Construction 1,089.65 1,077.14 12.51 1,100.63 37.6 36.8 0.8 37.5 28.98 29.27 -0.29 29.35 Manufacturing 1,188.04 1,144.64 43.40 1,196.96 39.3 39.2 0.1 39.7 30.23 29.20 1.03 30.15SERVICE PROVIDING 908.41 849.17 59.24 894.06 32.7 31.3 1.4 32.3 27.78 27.13 0.65 27.68 Trade, Transp., Utilities 791.46 698.28 93.18 778.51 34.1 33.0 1.1 33.6 23.21 21.16 2.05 23.17 Financial Activities 1,528.67 1,469.06 59.62 1,504.26 36.8 35.7 1.1 36.6 41.54 41.15 0.39 41.10 Prof. & Business Serv. 1,031.56 975.42 56.14 998.00 34.0 33.2 0.8 33.3 30.34 29.38 0.96 29.97 Education & Health Ser. 806.31 792.98 13.33 796.82 30.6 30.7 -0.1 30.6 26.35 25.83 0.52 26.04 Leisure & Hospitality 414.86 411.11 3.75 411.81 26.8 26.8 0.0 26.5 15.48 15.34 0.14 15.54 Other Services 647.63 653.51 -5.88 651.92 29.9 29.8 0.1 29.7 21.66 21.93 -0.27 21.95
LABOR MARKET AREAS: TOTAL PRIVATE Bridgeport-Stamford 1,023.31 1,012.88 10.43 1,007.01 33.3 32.6 0.7 33.4 30.73 31.07 -0.34 30.15 Danbury 993.32 914.10 79.23 996.84 35.4 34.3 1.1 35.5 28.06 26.65 1.41 28.08 Hartford 1,015.23 1,008.76 6.47 1,018.34 35.3 34.3 1.0 35.2 28.76 29.41 -0.65 28.93 New Haven 840.46 835.09 5.37 844.34 32.4 32.8 -0.4 32.4 25.94 25.46 0.48 26.06 Norwich-New London 676.42 661.89 14.52 672.38 31.2 30.8 0.4 31.1 21.68 21.49 0.19 21.62 Waterbury 796.15 742.10 54.05 796.25 35.4 34.5 0.9 35.0 22.49 21.51 0.98 22.75
THE CONNECTICUT ECONOMIC DIGEST20 December 2010
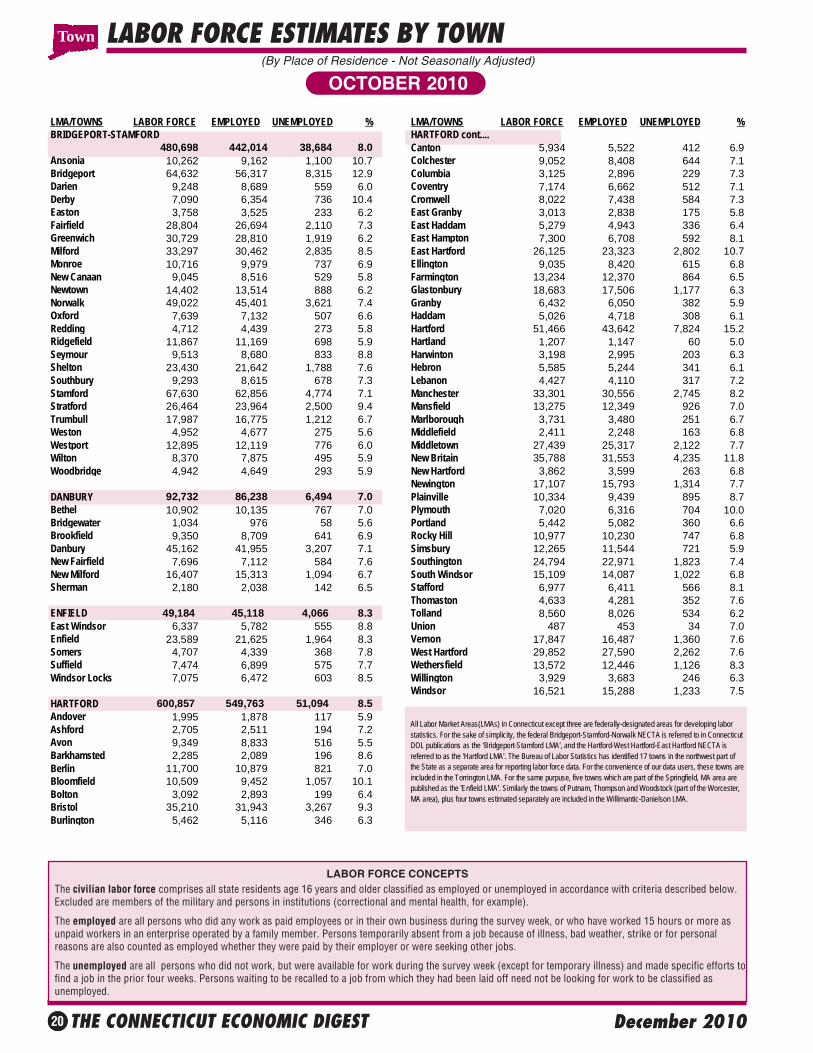
LABOR FORCE ESTIMATES BY TOWN
OCTOBER 2010(By Place of Residence - Not Seasonally Adjusted)
The civilian labor force comprises all state residents age 16 years and older classified as employed or unemployed in accordance with criteria described below.Excluded are members of the military and persons in institutions (correctional and mental health, for example).
The employed are all persons who did any work as paid employees or in their own business during the survey week, or who have worked 15 hours or more asunpaid workers in an enterprise operated by a family member. Persons temporarily absent from a job because of illness, bad weather, strike or for personalreasons are also counted as employed whether they were paid by their employer or were seeking other jobs.
The unemployed are all persons who did not work, but were available for work during the survey week (except for temporary illness) and made specific efforts tofind a job in the prior four weeks. Persons waiting to be recalled to a job from which they had been laid off need not be looking for work to be classified asunemployed.
LABOR FORCE CONCEPTS
Town
LMA/TOWNS LABOR FORCE EMPLOYED UNEMPLOYED % LMA/TOWNS LABOR FORCE EMPLOYED UNEMPLOYED %BRIDGEPORT-STAMFORD HARTFORD cont....
480,698 442,014 38,684 8.0 Canton 5,934 5,522 412 6.9Ansonia 10,262 9,162 1,100 10.7 Colchester 9,052 8,408 644 7.1Bridgeport 64,632 56,317 8,315 12.9 Columbia 3,125 2,896 229 7.3Darien 9,248 8,689 559 6.0 Coventry 7,174 6,662 512 7.1Derby 7,090 6,354 736 10.4 Cromwell 8,022 7,438 584 7.3Easton 3,758 3,525 233 6.2 East Granby 3,013 2,838 175 5.8Fairfield 28,804 26,694 2,110 7.3 East Haddam 5,279 4,943 336 6.4Greenwich 30,729 28,810 1,919 6.2 East Hampton 7,300 6,708 592 8.1Milford 33,297 30,462 2,835 8.5 East Hartford 26,125 23,323 2,802 10.7Monroe 10,716 9,979 737 6.9 Ellington 9,035 8,420 615 6.8New Canaan 9,045 8,516 529 5.8 Farmington 13,234 12,370 864 6.5Newtown 14,402 13,514 888 6.2 Glastonbury 18,683 17,506 1,177 6.3Norwalk 49,022 45,401 3,621 7.4 Granby 6,432 6,050 382 5.9Oxford 7,639 7,132 507 6.6 Haddam 5,026 4,718 308 6.1Redding 4,712 4,439 273 5.8 Hartford 51,466 43,642 7,824 15.2Ridgefield 11,867 11,169 698 5.9 Hartland 1,207 1,147 60 5.0Seymour 9,513 8,680 833 8.8 Harwinton 3,198 2,995 203 6.3Shelton 23,430 21,642 1,788 7.6 Hebron 5,585 5,244 341 6.1Southbury 9,293 8,615 678 7.3 Lebanon 4,427 4,110 317 7.2Stamford 67,630 62,856 4,774 7.1 Manchester 33,301 30,556 2,745 8.2Stratford 26,464 23,964 2,500 9.4 Mansfield 13,275 12,349 926 7.0Trumbull 17,987 16,775 1,212 6.7 Marlborough 3,731 3,480 251 6.7Weston 4,952 4,677 275 5.6 Middlefield 2,411 2,248 163 6.8Westport 12,895 12,119 776 6.0 Middletown 27,439 25,317 2,122 7.7Wilton 8,370 7,875 495 5.9 New Britain 35,788 31,553 4,235 11.8Woodbridge 4,942 4,649 293 5.9 New Hartford 3,862 3,599 263 6.8
Newington 17,107 15,793 1,314 7.7DANBURY 92,732 86,238 6,494 7.0 Plainville 10,334 9,439 895 8.7Bethel 10,902 10,135 767 7.0 Plymouth 7,020 6,316 704 10.0Bridgewater 1,034 976 58 5.6 Portland 5,442 5,082 360 6.6Brookfield 9,350 8,709 641 6.9 Rocky Hill 10,977 10,230 747 6.8Danbury 45,162 41,955 3,207 7.1 Simsbury 12,265 11,544 721 5.9New Fairfield 7,696 7,112 584 7.6 Southington 24,794 22,971 1,823 7.4New Milford 16,407 15,313 1,094 6.7 South Windsor 15,109 14,087 1,022 6.8Sherman 2,180 2,038 142 6.5 Stafford 6,977 6,411 566 8.1
Thomaston 4,633 4,281 352 7.6ENFIELD 49,184 45,118 4,066 8.3 Tolland 8,560 8,026 534 6.2East Windsor 6,337 5,782 555 8.8 Union 487 453 34 7.0Enfield 23,589 21,625 1,964 8.3 Vernon 17,847 16,487 1,360 7.6Somers 4,707 4,339 368 7.8 West Hartford 29,852 27,590 2,262 7.6Suffield 7,474 6,899 575 7.7 Wethersfield 13,572 12,446 1,126 8.3Windsor Locks 7,075 6,472 603 8.5 Willington 3,929 3,683 246 6.3
Windsor 16,521 15,288 1,233 7.5HARTFORD 600,857 549,763 51,094 8.5Andover 1,995 1,878 117 5.9Ashford 2,705 2,511 194 7.2Avon 9,349 8,833 516 5.5Barkhamsted 2,285 2,089 196 8.6Berlin 11,700 10,879 821 7.0Bloomfield 10,509 9,452 1,057 10.1Bolton 3,092 2,893 199 6.4Bristol 35,210 31,943 3,267 9.3Burlington 5,462 5,116 346 6.3
All Labor Market Areas(LMAs) in Connecticut except three are federally-designated areas for developing labor statistics. For the sake of simplicity, the federal Bridgeport-Stamford-Norwalk NECTA is referred to in Connecticut DOL publications as the 'Bridgeport-Stamford LMA', and the Hartford-West Hartford-East Hartford NECTA is referred to as the 'Hartford LMA'. The Bureau of Labor Statistics has identified 17 towns in the northwest part of the State as a separate area for reporting labor force data. For the convenience of our data users, these towns are included in the Torrington LMA. For the same purpuse, five towns which are part of the Springfield, MA area are published as the 'Enfield LMA'. Similarly the towns of Putnam, Thompson and Woodstock (part of the Worcester, MA area), plus four towns estimated separately are included in the Willimantic-Danielson LMA.
THE CONNECTICUT ECONOMIC DIGEST 21December 2010
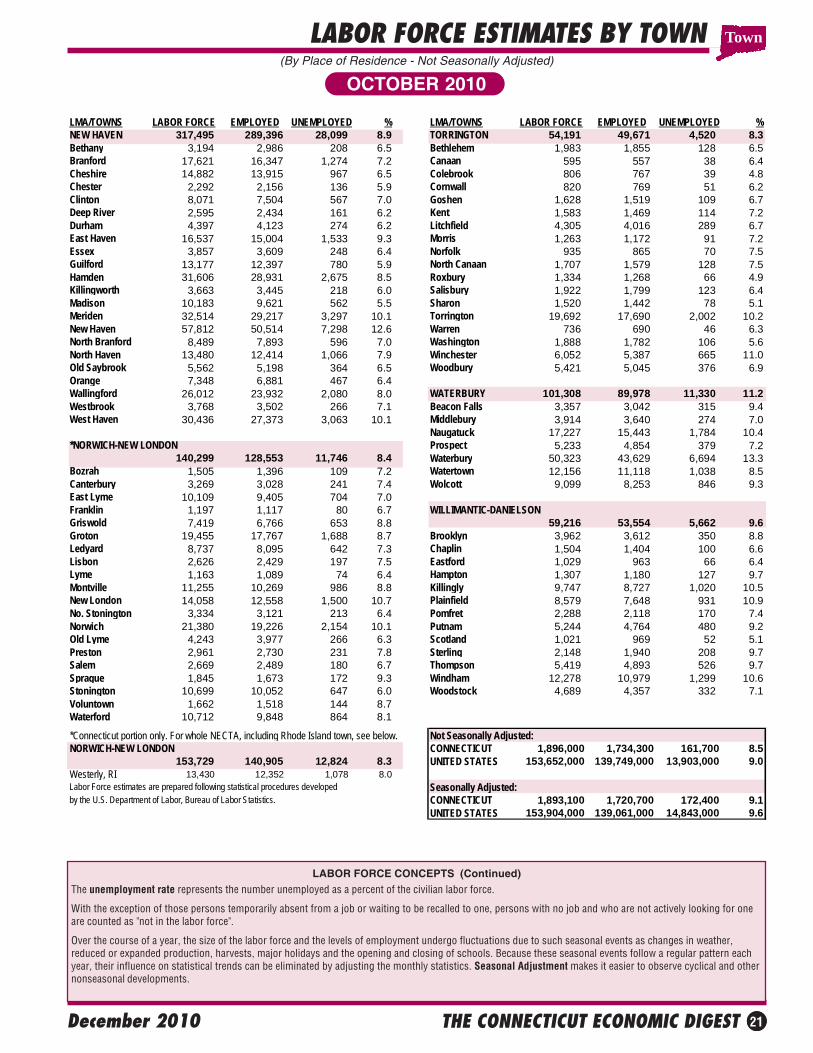
LABOR FORCE ESTIMATES BY TOWN
The unemployment rate represents the number unemployed as a percent of the civilian labor force.
With the exception of those persons temporarily absent from a job or waiting to be recalled to one, persons with no job and who are not actively looking for oneare counted as "not in the labor force".
Over the course of a year, the size of the labor force and the levels of employment undergo fluctuations due to such seasonal events as changes in weather,reduced or expanded production, harvests, major holidays and the opening and closing of schools. Because these seasonal events follow a regular pattern eachyear, their influence on statistical trends can be eliminated by adjusting the monthly statistics. Seasonal Adjustment makes it easier to observe cyclical and othernonseasonal developments.
(By Place of Residence - Not Seasonally Adjusted)
OCTOBER 2010
LABOR FORCE CONCEPTS (Continued)
Town
LMA/TOWNS LABOR FORCE EMPLOYED UNEMPLOYED % LMA/TOWNS LABOR FORCE EMPLOYED UNEMPLOYED %NEW HAVEN 317,495 289,396 28,099 8.9 TORRINGTON 54,191 49,671 4,520 8.3Bethany 3,194 2,986 208 6.5 Bethlehem 1,983 1,855 128 6.5Branford 17,621 16,347 1,274 7.2 Canaan 595 557 38 6.4Cheshire 14,882 13,915 967 6.5 Colebrook 806 767 39 4.8Chester 2,292 2,156 136 5.9 Cornwall 820 769 51 6.2Clinton 8,071 7,504 567 7.0 Goshen 1,628 1,519 109 6.7Deep River 2,595 2,434 161 6.2 Kent 1,583 1,469 114 7.2Durham 4,397 4,123 274 6.2 Litchfield 4,305 4,016 289 6.7East Haven 16,537 15,004 1,533 9.3 Morris 1,263 1,172 91 7.2Essex 3,857 3,609 248 6.4 Norfolk 935 865 70 7.5Guilford 13,177 12,397 780 5.9 North Canaan 1,707 1,579 128 7.5Hamden 31,606 28,931 2,675 8.5 Roxbury 1,334 1,268 66 4.9Killingworth 3,663 3,445 218 6.0 Salisbury 1,922 1,799 123 6.4Madison 10,183 9,621 562 5.5 Sharon 1,520 1,442 78 5.1Meriden 32,514 29,217 3,297 10.1 Torrington 19,692 17,690 2,002 10.2New Haven 57,812 50,514 7,298 12.6 Warren 736 690 46 6.3North Branford 8,489 7,893 596 7.0 Washington 1,888 1,782 106 5.6North Haven 13,480 12,414 1,066 7.9 Winchester 6,052 5,387 665 11.0Old Saybrook 5,562 5,198 364 6.5 Woodbury 5,421 5,045 376 6.9Orange 7,348 6,881 467 6.4Wallingford 26,012 23,932 2,080 8.0 WATERBURY 101,308 89,978 11,330 11.2Westbrook 3,768 3,502 266 7.1 Beacon Falls 3,357 3,042 315 9.4West Haven 30,436 27,373 3,063 10.1 Middlebury 3,914 3,640 274 7.0
Naugatuck 17,227 15,443 1,784 10.4*NORWICH-NEW LONDON Prospect 5,233 4,854 379 7.2
140,299 128,553 11,746 8.4 Waterbury 50,323 43,629 6,694 13.3Bozrah 1,505 1,396 109 7.2 Watertown 12,156 11,118 1,038 8.5Canterbury 3,269 3,028 241 7.4 Wolcott 9,099 8,253 846 9.3East Lyme 10,109 9,405 704 7.0Franklin 1,197 1,117 80 6.7 WILLIMANTIC-DANIELSONGriswold 7,419 6,766 653 8.8 59,216 53,554 5,662 9.6Groton 19,455 17,767 1,688 8.7 Brooklyn 3,962 3,612 350 8.8Ledyard 8,737 8,095 642 7.3 Chaplin 1,504 1,404 100 6.6Lisbon 2,626 2,429 197 7.5 Eastford 1,029 963 66 6.4Lyme 1,163 1,089 74 6.4 Hampton 1,307 1,180 127 9.7Montville 11,255 10,269 986 8.8 Killingly 9,747 8,727 1,020 10.5New London 14,058 12,558 1,500 10.7 Plainfield 8,579 7,648 931 10.9No. Stonington 3,334 3,121 213 6.4 Pomfret 2,288 2,118 170 7.4Norwich 21,380 19,226 2,154 10.1 Putnam 5,244 4,764 480 9.2Old Lyme 4,243 3,977 266 6.3 Scotland 1,021 969 52 5.1Preston 2,961 2,730 231 7.8 Sterling 2,148 1,940 208 9.7Salem 2,669 2,489 180 6.7 Thompson 5,419 4,893 526 9.7Sprague 1,845 1,673 172 9.3 Windham 12,278 10,979 1,299 10.6Stonington 10,699 10,052 647 6.0 Woodstock 4,689 4,357 332 7.1Voluntown 1,662 1,518 144 8.7Waterford 10,712 9,848 864 8.1
*Connecticut portion only. For whole NECTA, including Rhode Island town, see below. Not Seasonally Adjusted:NORWICH-NEW LONDON CONNECTICUT 1,896,000 1,734,300 161,700 8.5
153,729 140,905 12,824 8.3 UNITED STATES 153,652,000 139,749,000 13,903,000 9.0Westerly, RI 13,430 12,352 1,078 8.0Labor Force estimates are prepared following statistical procedures developed Seasonally Adjusted:by the U.S. Department of Labor, Bureau of Labor Statistics. CONNECTICUT 1,893,100 1,720,700 172,400 9.1
UNITED STATES 153,904,000 139,061,000 14,843,000 9.6
THE CONNECTICUT ECONOMIC DIGEST22 December 2010
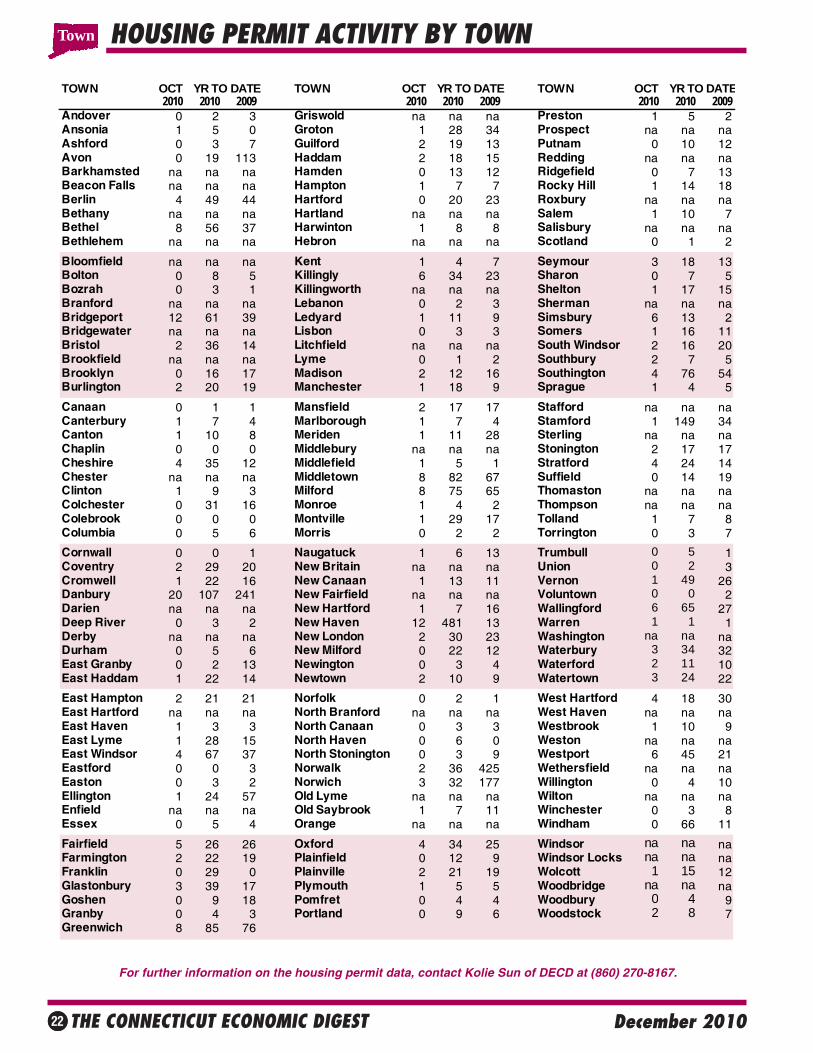
HOUSING PERMIT ACTIVITY BY TOWN
For further information on the housing permit data, contact Kolie Sun of DECD at (860) 270-8167.
TOWN OCT YR TO DATE TOWN OCT YR TO DATE TOWN OCT YR TO DATE2010 2010 2009 2010 2010 2009 2010 2010 2009
Andover 0 2 3 Griswold na na na Preston 1 5 2Ansonia 1 5 0 Groton 1 28 34 Prospect na na naAshford 0 3 7 Guilford 2 19 13 Putnam 0 10 12Avon 0 19 113 Haddam 2 18 15 Redding na na naBarkhamsted na na na Hamden 0 13 12 Ridgefield 0 7 13Beacon Falls na na na Hampton 1 7 7 Rocky Hill 1 14 18Berlin 4 49 44 Hartford 0 20 23 Roxbury na na naBethany na na na Hartland na na na Salem 1 10 7Bethel 8 56 37 Harwinton 1 8 8 Salisbury na na naBethlehem na na na Hebron na na na Scotland 0 1 2
Bloomfield na na na Kent 1 4 7 Seymour 3 18 13Bolton 0 8 5 Killingly 6 34 23 Sharon 0 7 5Bozrah 0 3 1 Killingworth na na na Shelton 1 17 15Branford na na na Lebanon 0 2 3 Sherman na na naBridgeport 12 61 39 Ledyard 1 11 9 Simsbury 6 13 2Bridgewater na na na Lisbon 0 3 3 Somers 1 16 11Bristol 2 36 14 Litchfield na na na South Windsor 2 16 20Brookfield na na na Lyme 0 1 2 Southbury 2 7 5Brooklyn 0 16 17 Madison 2 12 16 Southington 4 76 54Burlington 2 20 19 Manchester 1 18 9 Sprague 1 4 5
Canaan 0 1 1 Mansfield 2 17 17 Stafford na na naCanterbury 1 7 4 Marlborough 1 7 4 Stamford 1 149 34Canton 1 10 8 Meriden 1 11 28 Sterling na na naChaplin 0 0 0 Middlebury na na na Stonington 2 17 17Cheshire 4 35 12 Middlefield 1 5 1 Stratford 4 24 14Chester na na na Middletown 8 82 67 Suffield 0 14 19Clinton 1 9 3 Milford 8 75 65 Thomaston na na naColchester 0 31 16 Monroe 1 4 2 Thompson na na naColebrook 0 0 0 Montville 1 29 17 Tolland 1 7 8Columbia 0 5 6 Morris 0 2 2 Torrington 0 3 7
Cornwall 0 0 1 Naugatuck 1 6 13 Trumbull 0 5 1Coventry 2 29 20 New Britain na na na Union 0 2 3Cromwell 1 22 16 New Canaan 1 13 11 Vernon 1 49 26Danbury 20 107 241 New Fairfield na na na Voluntown 0 0 2Darien na na na New Hartford 1 7 16 Wallingford 6 65 27Deep River 0 3 2 New Haven 12 481 13 Warren 1 1 1Derby na na na New London 2 30 23 Washington na na naDurham 0 5 6 New Milford 0 22 12 Waterbury 3 34 32East Granby 0 2 13 Newington 0 3 4 Waterford 2 11 10East Haddam 1 22 14 Newtown 2 10 9 Watertown 3 24 22
East Hampton 2 21 21 Norfolk 0 2 1 West Hartford 4 18 30East Hartford na na na North Branford na na na West Haven na na naEast Haven 1 3 3 North Canaan 0 3 3 Westbrook 1 10 9East Lyme 1 28 15 North Haven 0 6 0 Weston na na naEast Windsor 4 67 37 North Stonington 0 3 9 Westport 6 45 21Eastford 0 0 3 Norwalk 2 36 425 Wethersfield na na naEaston 0 3 2 Norwich 3 32 177 Willington 0 4 10Ellington 1 24 57 Old Lyme na na na Wilton na na naEnfield na na na Old Saybrook 1 7 11 Winchester 0 3 8Essex 0 5 4 Orange na na na Windham 0 66 11
Fairfield 5 26 26 Oxford 4 34 25 Windsor na na naFarmington 2 22 19 Plainfield 0 12 9 Windsor Locks na na naFranklin 0 29 0 Plainville 2 21 19 Wolcott 1 15 12Glastonbury 3 39 17 Plymouth 1 5 5 Woodbridge na na naGoshen 0 9 18 Pomfret 0 4 4 Woodbury 0 4 9Granby 0 4 3 Portland 0 9 6 Woodstock 2 8 7Greenwich 8 85 76
Town
THE CONNECTICUT ECONOMIC DIGEST 23December 2010
TECHNICAL NOTESBUSINESS STARTS AND TERMINATIONSRegistrations and terminations of business entities as recorded with the Secretary of the State and the Connecticut Department of Labor (DOL)are an indication of new business formation and activity. DOL business starts include new employers which have become liable for unemploy-ment insurance taxes during the quarter, as well as new establishments opened by existing employers. DOL business terminations are thoseaccounts discontinued due to inactivity (no employees) or business closure, and accounts for individual business establishments that are closedby still active employers. The Secretary of the State registrations include limited liability companies, limited liability partnerships, and foreign-owned (out-of-state) and domestic-owned (in-state) corporations.
CONSUMER PRICE INDEXThe Consumer Price Index (CPI), computed and published by the U.S. Bureau of Labor Statistics, is a measure of the average change in pricesover time in a fixed market basket of goods and services. It is based on prices of food, clothing, shelter, fuels, transportation fares, charges fordoctors’ and dentists’ services, drugs and other goods and services that people buy for their day-to-day living. The Northeast region is comprisedof the New England states, New York, New Jersey and Pennsylvania.
EMPLOYMENT COST INDEXThe Employment Cost Index (ECI) covers both wages and salaries and employer costs for employee benefits for all occupations and establish-ments in both the private nonfarm sector and state and local government. The ECI measures employers’ labor costs free from the influences ofemployment shifts among industries and occupations. The base period for all data is June 1989 when the ECI is 100.
HOURS AND EARNINGS ESTIMATESProduction worker earnings and hours estimates include full- and part-time employees working within manufacturing industries. Hours workedand earnings data are computed based on payroll figures for the week including the 12th of the month. Average hourly earnings are affected bysuch factors as premium pay for overtime and shift differential as well as changes in basic hourly and incentive rates of pay. Average weeklyearnings are the product of weekly hours worked and hourly earnings. These data are developed in cooperation with the U.S. Department ofLabor, Bureau of Labor Statistics.
INDIAN GAMING DATAIndian Gaming Payments are amounts received by the State as a result of the slot compact with the two Federally recognized tribes in Connecti-cut, which calls for 25 percent of net slot receipts to be remitted to the State. Indian Gaming Slots are the total net revenues from slot machinesonly received by the two Federally recognized Indian tribes.
INITIAL CLAIMSAverage weekly initial claims are calculated by dividing the total number of new claims for unemployment insurance received in the month bythe number of weeks in the month. A minor change in methodology took effect with data published in the March 1997 issue of the DIGEST.Data have been revised back to January 1980.
INSURED UNEMPLOYMENT RATEPrimarily a measure of unemployment insurance program activity, the insured unemployment rate is the 13-week average of the number ofpeople claiming unemployment benefits divided by the number of workers covered by the unemployment insurance system.
LABOR FORCE ESTIMATESLabor force estimates are a measure of the work status of people who live in Connecticut. Prepared under the direction of the U.S. Bureau ofLabor Statistics, the statewide estimates are the product of a signal-plus noise model, which uses results from the Current Population Survey(CPS), a monthly survey of Connecticut households, counts of claimants for unemployment benefits, and establishment employment estimates.Beginning with the publication of January 2005 data, an improved methodology is being used to develop labor force estimates, by whichmonthly state model-based employment and unemployment estimates are controlled to add to the national CPS levels. This will ensure thatnational economic events are reflected in the state estimates, and it will significantly reduce end-of-year revisions. (For more information, pleasesee the Connecticut Economic Digest, December 2004 issue.) Labor force data, reflecting persons employed by place of residence, are notdirectly comparable to the place-of-work industry employment series. In the labor force estimates, workers involved in labor disputes arecounted as employed. The labor force data also includes agricultural workers, unpaid family workers, domestics and the self-employed. Becauseof these conceptual differences, total labor force employment is almost always different from nonfarm wage and salary employment.
LABOR MARKET AREASAll Labor Market Areas (LMAs) in Connecticut except three are federally-designated areas for developing labor statistics. For the sake ofsimplicity, the federal Bridgeport-Norwalk-Stamford Metropolitan Statistical Area (MSA) is referred to in Connecticut Department of Laborpublications as the Bridgeport-Stamford LMA, and the Hartford-West Hartford-East Hartford MSA is called the Hartford LMA. The Bureau ofLabor Statistics has identified the 17 towns in the in the northwestern part of the state as a separate area for reporting labor force data. For theconvenience of our data users, data for these towns are included in the Torrington LMA. For the same purpose, data for the towns of EastWindsor, Enfield, Somers, Suffield and Windsor Locks, which are officially part of the Springfield MSA, are published as the Enfield LMA.Similarly, the towns of Putnam, Thompson and Woodstock - part of the Worcester MSA - are included in the Willimantic-Danielson LMA. Also,data for Westerly, Rhode Island are included in the Norwich-New London LMA. Industry employment and labor force data estimates containedin Connecticut Department of Labor publications are prepared following the same statistical procedures developed by the U.S. Department ofLabor, Bureau of Labor Statistics, whether for federally designated or state-determined areas.
LEADING AND COINCIDENT EMPLOYMENT INDICESThe leading employment index is a composite of six individual largely employment-related series -- the average workweek of manufacturingproduction and construction workers, Hartford help-wanted advertising index, short-duration (less than 15 weeks) unemployment rate, initialclaims for unemployment insurance, total housing permits, and Moody's BAA corporate bond yield. While not employment-sector variables,housing permits are closely related to construction employment and the corporate bond yield adds important information about the movementin interest rates. The coincident employment index is a composite indicator of four individual employment-related series -- the total unemploy-ment rate, nonfarm employment (employer survey), total employment (state residents employed measured by a household survey), and theinsured unemployment rate. All data are seasonally adjusted and come from the Connecticut Labor Department, the Federal Reserve Bank ofBoston, and the Board of Governors of the Federal Reserve System.
NONFARM EMPLOYMENT ESTIMATESNonfarm employment estimates are derived from a survey of businesses to measure jobs by industry. The estimates include all full- and part-time wage and salary employees who worked during or received pay for the pay period which includes the 12th of the month. Excluded fromthese estimates are proprietors, self-employed workers, private household employees and unpaid family workers. In some cases, due to spaceconstraints, all industry estimates are not shown. Call (860) 263-6275 for a more comprehensive breakout of nonfarm employment estimates.These data are developed in cooperation with the U.S. Department of Labor, Bureau of Labor Statistics.
UI COVERED WAGESUI covered wages is the total amount paid to those employees who are covered under the Connecticut’s Unemployment Insurance (UI) law forservices performed during the quarter. The fluctuations in the 1992-93 period reflect the effect of the changes in the tax law and the massiverestructuring in the state’s economy.
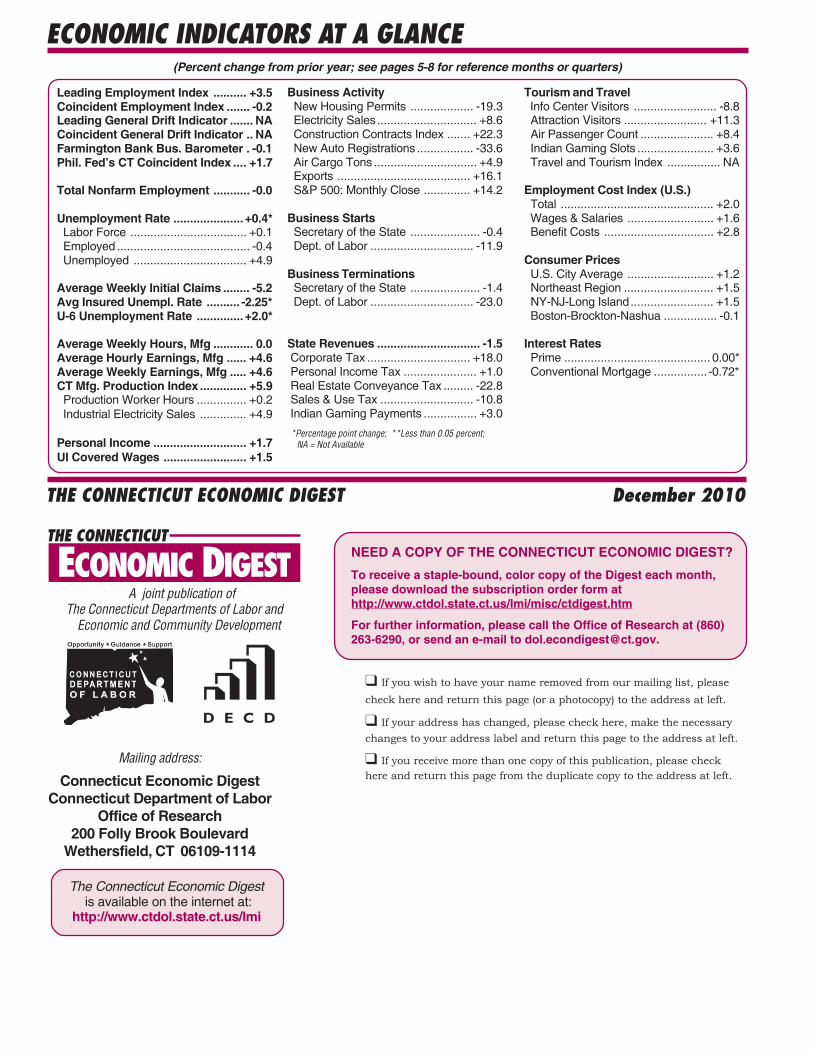
ECONOMIC INDICATORS AT A GLANCE
Leading Employment Index .......... +3.5Coincident Employment Index ....... -0.2Leading General Drift Indicator ....... NACoincident General Drift Indicator .. NAFarmington Bank Bus. Barometer . -0.1Phil. Fed’s CT Coincident Index .... +1.7
Total Nonfarm Employment ........... -0.0
Unemployment Rate ..................... +0.4* Labor Force ................................... +0.1 Employed ........................................ -0.4 Unemployed .................................. +4.9
Average Weekly Initial Claims ........ -5.2Avg Insured Unempl. Rate .......... -2.25*U-6 Unemployment Rate .............. +2.0*
Average Weekly Hours, Mfg ............ 0.0Average Hourly Earnings, Mfg ...... +4.6Average Weekly Earnings, Mfg ..... +4.6CT Mfg. Production Index .............. +5.9 Production Worker Hours ............... +0.2 Industrial Electricity Sales .............. +4.9
Personal Income ............................ +1.7UI Covered Wages ......................... +1.5
Business Activity New Housing Permits ................... -19.3 Electricity Sales.............................. +8.6 Construction Contracts Index ....... +22.3 New Auto Registrations ................. -33.6 Air Cargo Tons ............................... +4.9 Exports ........................................ +16.1 S&P 500: Monthly Close .............. +14.2
Business Starts Secretary of the State ..................... -0.4 Dept. of Labor ............................... -11.9
Business Terminations Secretary of the State ..................... -1.4 Dept. of Labor ............................... -23.0
State Revenues ............................... -1.5 Corporate Tax ............................... +18.0 Personal Income Tax ...................... +1.0 Real Estate Conveyance Tax ......... -22.8 Sales & Use Tax ............................ -10.8 Indian Gaming Payments ................ +3.0
Tourism and Travel Info Center Visitors ......................... -8.8 Attraction Visitors ......................... +11.3 Air Passenger Count ...................... +8.4 Indian Gaming Slots ....................... +3.6 Travel and Tourism Index ................ NA
Employment Cost Index (U.S.) Total .............................................. +2.0 Wages & Salaries .......................... +1.6 Benefit Costs ................................. +2.8
Consumer Prices U.S. City Average .......................... +1.2 Northeast Region ........................... +1.5 NY-NJ-Long Island......................... +1.5 Boston-Brockton-Nashua ................ -0.1
Interest Rates Prime ............................................ 0.00* Conventional Mortgage ................ -0.72*
Mailing address:
Connecticut Economic DigestConnecticut Department of Labor
Office of Research200 Folly Brook Boulevard
Wethersfield, CT 06109-1114
THE CONNECTICUT ECONOMIC DIGEST
*Percentage point change; **Less than 0.05 percent; NA = Not Available
The Connecticut Economic Digest is available on the internet at:
http://www.ctdol.state.ct.us/lmi
December 2010
(Percent change from prior year; see pages 5-8 for reference months or quarters)
THE CONNECTICUT
A joint publication of The Connecticut Departments of Labor and Economic and Community Development
ECONOMIC DIGEST
If you wish to have your name removed from our mailing list, pleasecheck here and return this page (or a photocopy) to the address at left.
If your address has changed, please check here, make the necessarychanges to your address label and return this page to the address at left.
If you receive more than one copy of this publication, please checkhere and return this page from the duplicate copy to the address at left.
NEED A COPY OF THE CONNECTICUT ECONOMIC DIGEST?
To receive a staple-bound, color copy of the Digest each month,please download the subscription order form athttp://www.ctdol.state.ct.us/lmi/misc/ctdigest.htm
For further information, please call the Office of Research at (860)263-6290, or send an e-mail to [email protected].