Embed Size (px)
Citation preview
THE CONNECTICUT
ECONOMIC DIGESTJULY 2013
July 2013
Economic Indicators on the Overall Economy ......................... 5 Individual Data Items ......................... 6-8Comparative Regional Data .............. 9Economic Indicator Trends ........ 10-11Help Wanted OnLine ........................ 15Business and Employment ChangesAnnounced in the News Media ...... 19Labor Market Areas: Nonfarm Employment .................... 12-17 Sea. Adj. Nonfarm Employment ..........14 Labor Force ............................................ 18 Hours and Earnings .............................. 19Cities and Towns: Labor Force ..................................... 20-21 Housing Permits .................................... 22Technical Notes ............................... 23At a Glance ....................................... 24
State's 2012 Housing Market inReview ................................... 1-2, 5
Every time is different, but thisone is really different ............... 3-4
IN THIS ISSUE...
In May...Nonfarm Employment Connecticut..................... 1,650,400 Change over month ........... +0.06% Change over year ................ +0.8%
United States .............. 135,637,000 Change over month ........... +0.13% Change over year ................. +1.6%
Unemployment Rate Connecticut............................. 8.0% United States .......................... 7.6%
Consumer Price Index United States ..................... 232.945 Change over year .................. +1.4%
Vol.18 No.7 A joint publication of the Connecticut Department of Labor & the Connecticut Department of Economic and Community Development
By Kolie Sun, Senior Research Analyst, DECD
T
State's 2012 Housing MarketState's 2012 Housing MarketState's 2012 Housing MarketState's 2012 Housing MarketState's 2012 Housing Marketin Reviewin Reviewin Reviewin Reviewin Review
CT Housing Units Authorized, 1960-2012
0
5,000
10,000
15,000
20,000
25,000
30,000
1960 1965 1970 1975 1980 1985 1990 1995 2000 2005 2010
he housing market is animportant sector of the
economy — it creates jobs, spurseconomic growth and impacts ouroverall quality of life. This articletakes a look at many aspects ofConnecticut’s housing industry andthe factors that led to modesthousing growth in 2012, despite thefact that permits did not reach pre-recession levels.
Housing Production According to the recent releasefrom the U.S. Census, Connecticutcities and towns authorized 4,669new housing units, including singleand multi-unit dwellings for alltowns in 2012. This level ofproduction represents a 47.1%increase from a six-decade low of3,173 in 2011. Last year marked
the best year since 2008, when therewere 5,220 units authorized. TheCity of Stamford led all municipalitieswith 564 units authorized, followedby Danbury with 396, Shelton with299, Norwalk with 230 andBridgeport with 175. The combinedpermits issued for these fivecommunities accounted for 35.6% oflast year’s total housing production.(See chart below) In 2012, Fairfield County had themost permit activity with 2,138 newhousing units authorized, whichaccounted for nearly half of thestatewide total. Windham Countyhad the fewest with 94. In March, the ConnecticutDepartment of Economic andCommunity Development (DECD)sent out its annual demolition surveyin which 131 cities and towns

THE CONNECTICUT ECONOMIC DIGEST2 July 2013
ConnecticutDepartment of Labor
Connecticut Departmentof Economic andCommunity Development
THE CONNECTICUT
The Connecticut Economic Digest ispublished monthly by the ConnecticutDepartment of Labor, Office of Research, andthe Connecticut Department of Economic andCommunity Development. Its purpose is toregularly provide users with a comprehensivesource for the most current, up-to-date dataavailable on the workforce and economy of thestate, within perspectives of the region andnation.
The annual subscription is $50. Sendsubscription requests to: The ConnecticutEconomic Digest, Connecticut Department ofLabor, Office of Research, 200 Folly BrookBoulevard, Wethersfield, CT 06109-1114.Make checks payable to the ConnecticutDepartment of Labor. Back issues are $4 percopy. The Digest can be accessed free ofcharge from the DOL Web site. Articles fromThe Connecticut Economic Digest may bereprinted if the source is credited. Please sendcopies of the reprinted material to the ManagingEditor. The views expressed by the authorsare theirs alone and may not reflect those ofthe DOL or DECD.
Managing Editor: Jungmin Charles Joo
Associate Editor: Sarah C. York
We would like to acknowledge the contributionsof many DOL Research and DECD staff andRob Damroth to the publication of the Digest.
Catherine Smith, CommissionerRonald Angelo, Deputy CommissionerChristopher Bergstrom, Deputy Commissioner
505 Hudson StreetHartford, CT 06106-2502Phone: (860) 270-8000Fax: (860) 270-8200E-Mail: [email protected]: http://www.decd.org
Sharon Palmer, CommissionerDennis Murphy, Deputy Commissioner
Andrew Condon, Ph.D., DirectorOffice of Research200 Folly Brook BoulevardWethersfield, CT 06109-1114Phone: (860) 263-6275Fax: (860) 263-6263E-Mail: [email protected]: http://www.ctdol.state.ct.us/lmi
ECONOMIC DIGEST
-continued on page 5-
responded. With a 77.5% responserate, the survey yielded a total of 955demolished housing units last year.As a result, the state’s net gain of3,714 authorizations brings itshousing inventory estimate to1,481,3961 units in 2012. Connecticut’s housing permitactivity mirrored the nation as 48states experienced permit growthfrom 2011 to 2012. Only Wyomingand New Hampshire had negativegrowth of housing permits. Thenation as a whole experienced a33.3% permit increase in 2012 from2011. Connecticut fared better thanthe U.S. and ranked 10th in thenation according to the Bureau of theCensus.
Home Sales and Prices Improved consumer confidenceand stronger employment databoosted the economic recovery in2012. According to the WarrenGroup, state single-family homesales increased 14.8% from 21,141in 2011 to 24,276 in 2012, the firstyear-over-year percentage increasesince 2005. Last year’s sales werethe highest since 2009. Because of the fluctuations of thereal estate market, home sales pricesvary over time. As reported by theWarren Group, Connecticut’s mediansingle-family homes sales price in2012 was $240,000, a slight drop of1.2% comparing to $243,000 in2011; down 18.6% from the peakhome median price of $295,000 in2007. Condo markets followed the samepattern as single-family homes in thenumber of transactions and homevalues. The state’s condominiumsales increased 7% from 5,704 unitsin 2011 to 6,111 in 2012 while themedian condo sales prices decreased5% from $171,000 in 2011 to$163,000 in 2012. The Housing Market Index (HMI)published by the NationalAssociation of Home Builders (NAHB)has three components: current salesconditions, sales expectations andtraffic of prospective buyers. HMIscores range from 1 to 100, with 1being the worst and 100 the best.DECD averaged the monthly ratingsto yearly data. Last year, the annualHMI rating of 34 was more thandouble the ratings from the previoustwo years and scored the highestsince 2006. The building
constructions industry was on therebound as suggested by HMI.
Foreclosures Lis Pendens2 and ForeclosureDeed3 filings are the two mostcommon measures of foreclosureactivities. In Connecticut, thenumber of Lis Pendens increased47.5% from 12,563 in 2011 to18,526 in 2012; down 24.5% from24,544 in 2009. Foreclosure Deedfilings also increased by 31.4% from2,723 in 2011 to 3,578 in 2012;down nearly 50% from 5,090 in2009. Last year, the MortgageBankers Association NationalDelinquency Survey reported thatthe percentage of homeowners whoare seriously delinquent inConnecticut was on average at 8.1%,compared to 7.1% at the U.S. level.Connecticut was ranked 8th highestamong all 50 states for thepercentage of seriously delinquentloans.4 One possible explanation isthat relatively higher home prices inConnecticut (compared to thenation) caused the higherforeclosure rate.
Housing and Transit-OrientedDevelopment Transit-oriented development(TOD) is a strategy to design anddevelop a mixed-use residential andcommercial area in proximity ofpublic transit. A typical TODneighborhood has a transit stationcenter surrounded by relativelyhigh-density development. TOD has many benefits,including reducing traffic andcongestion on roads and highways,increasing disposable income byreducing transportation-relatedexpenses, promoting more affordablehousing options, bringing greaterenergy efficiency and lowering autoemissions when people choose masstransit over their cars.5
To build upon the state’s longhistory of commuter rail servicesand provide more opportunities forTOD, several municipalities haveinitiated efforts to develop TODwithin their communities. Theseefforts include the development ofTOD zoning regulations, privatesector investment, intermodalfacility planning, market analysis,and integration of parking expansionplans with TOD. These demonstrate

THE CONNECTICUT ECONOMIC DIGEST 3July 2013
By Patrick J. Flaherty, Economist, [email protected]
N
Every time is different, but this one is reallyEvery time is different, but this one is reallyEvery time is different, but this one is reallyEvery time is different, but this one is reallyEvery time is different, but this one is reallydifferentdifferentdifferentdifferentdifferent
9810
010
210
410
610
8M
ay 1
991
= 10
0
1989 1990 1991 1992 1993 1994
Connecticut United States
Employment Indexed to U.S. LowChart 1: Connecticut vs. U.S. in Recession
100
101
102
103
Aug
ust 2
003
= 10
0
2001 2002 2003 2004 2005
Connecticut United States
Employment Indexed to U.S. LowChart 2: Connecticut vs. U.S. in Recession
o two business cycles arealike, but at least since the
1990’s it had become conventionalwisdom that recessions inConnecticut would last longer andsee much larger job drops than thenation as a whole. This was certainlytrue of the recessions of 1990 and2001, but that story didn’t hold forthe recession that hit Connecticut in2008.
Late 1980’s – early 1990’s Connecticut’s recession startedearlier, ended later, saw larger joblosses, and had a weaker recoverythan the country as a whole. By thetime U.S. jobs peaked in June 1990,Connecticut jobs had been falling formore than a year. The low point forU.S. jobs was May 1991, butConnecticut jobs continued to fallfor another year and half. Worse,while the recession claimed 1.5% of
U.S. jobs, in Connecticut the dropwas 9.2%. Three years after the endof the decline (May 1994), U.S. jobshad more than regained the loss andwere 3.7% above the previous peak,while in December 1995, three yearsafter the end of the Connecticutdecline, less than 30% of the lostjobs had been recovered. (Chart 1)
Early 2000’s In the 2000’s recession,Connecticut had a milder version ofthe same story: a slightly longerrecession, a somewhat larger jobdecline, and a slower bounce-back.The U.S. economy entered recessionin early 2001 with jobs peaking inFebruary. Connecticut employmenthad been falling since the previousJuly. U.S. jobs stopped falling inAugust 2003 but fell a month longerin Connecticut. The U.S. job declinewas 2.0% while in Connecticut it was3.7%. Three years later, U.S. jobswere 2.9% above the previous peakwhile Connecticut had recovered67.2% of the jobs lost during therecession. (Chart 2)
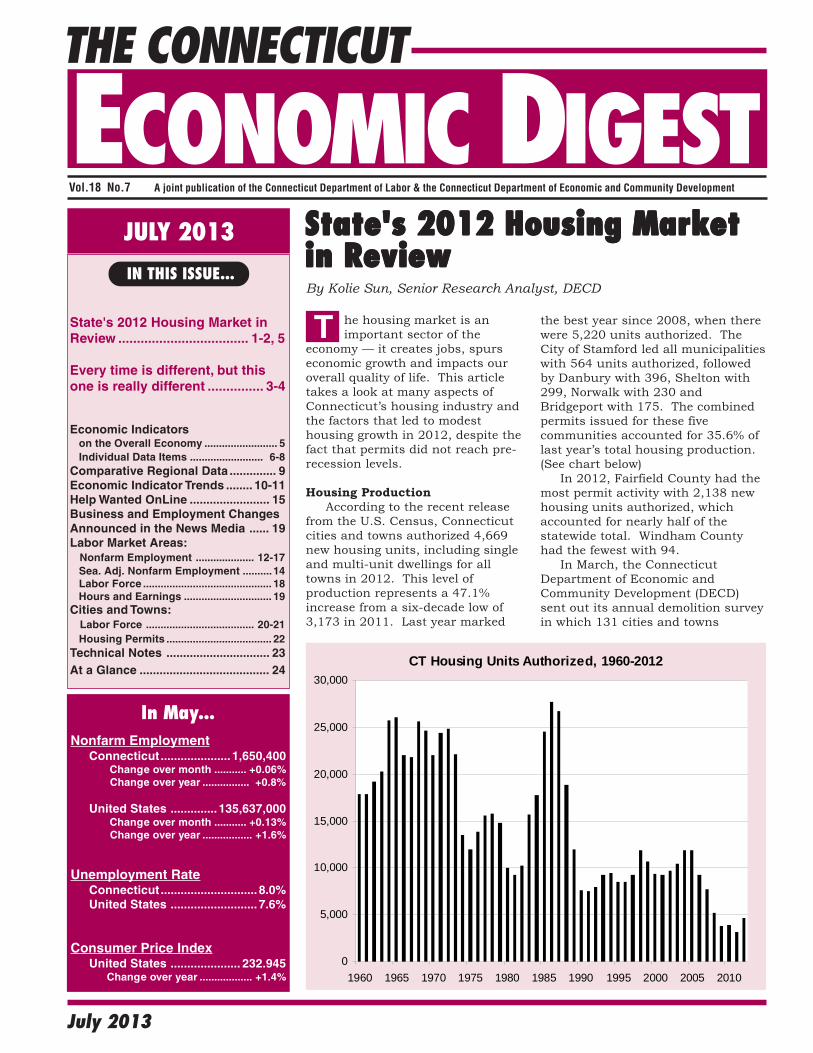
Recent Recession Connecticut’s recession was(slightly) shorter than the nation’sand, at first, Connecticut’s recoverywas stronger. Connecticut jobspeaked in March of 2008, twomonths later than in the country as awhole and both saw jobs stop fallingin February 2010. National joblosses were a bit less severe with theU.S. losing 6.3% of jobs compared toConnecticut’s 7.1% decline. Comingout of the recession the pattern was,at first, also reversed. By October2010 Connecticut had regained 21%of the jobs that had been lost whilethe U.S. had recovered less than10%. Since then U.S. job growth hasoutpaced Connecticut’s – as of May2013 the U.S. had recovered 72% ofthe jobs lost during the recessionwhile Connecticut has recovered 48%of its lost jobs. This, however,understates the strength of theConnecticut economy. In thisrecovery, job gains were concentratedin the private sector which hasrecovered 59% of its lost jobs inConnecticut. Additionally, there is
THE CONNECTICUT ECONOMIC DIGEST4 July 2013
100
102
104
106
108
Febr
uary
201
0 =
100
2008 2009 2010 2011 2012 2013
ConnecticutCT Potential RevisionUnited States
Employment Indexed to U.S. LowChart 3: Connecticut vs. U.S. in Recession
-1.5 -1.25 -1 -.75 -.5 -.25 0 .25 .5Percent of Total Jobs at Peak
Health Care & Social AssistanceEducational Services
Natural ResourcesFederal Government
Management of CompaniesReal Estate
Arts & RecreationState Government
Other ServicesLocal Government
Transportation & UtilAccommodation & Food Service
InformationNon-Durable Goods Manuf.
Finance & InsuranceWholesale Trade
Prof. Scientific & Tech. ServicesAdmin & Support Services
Retail TradeDurable Goods Manuf.
Construction
March 2008 to February 2010Chart 4: Change in Employment
CT
U.S.
-.5 0 .5 1Percent of Total Jobs at Peak
Health Care & Social AssistanceAccommodation & Food Service
Admin & Support ServicesRetail TradeConstruction
Educational ServicesManagement of Companies
Arts & RecreationTransportation & Util
Prof. Scientific & Tech. ServicesOther Services
Wholesale TradeReal Estate
Natural ResourcesState Government
InformationNon-Durable Goods Manuf.
Federal GovernmentDurable Goods Manuf.
Finance & InsuranceLocal Government
February 2010 to May 2013Chart 5: Change in Employment
CTU.S.
the potential for a significant upwardrevision to the current jobs totalwhen the annual benchmarkingtakes place in early 2014. (Chart 3)The Quarterly Census ofEmployment and Wages (QCEW), acomprehensive count of all payrolljobs in the state, has been showingmore growth than the monthlynumbers which are based on asurvey of employers. (Unofficial CTPotential Revision through December2012 was calculated using methoddescribed on pages 4 and 5 of theMay "Connecticut Labor Situation"available at http://www1.ctdol.state.ct.us/lmi/laborsit.pdf. The 2013 levels arethen calculated by the author usingthe (unrevised) reported monthlychanges starting from the revisedDecember level.)
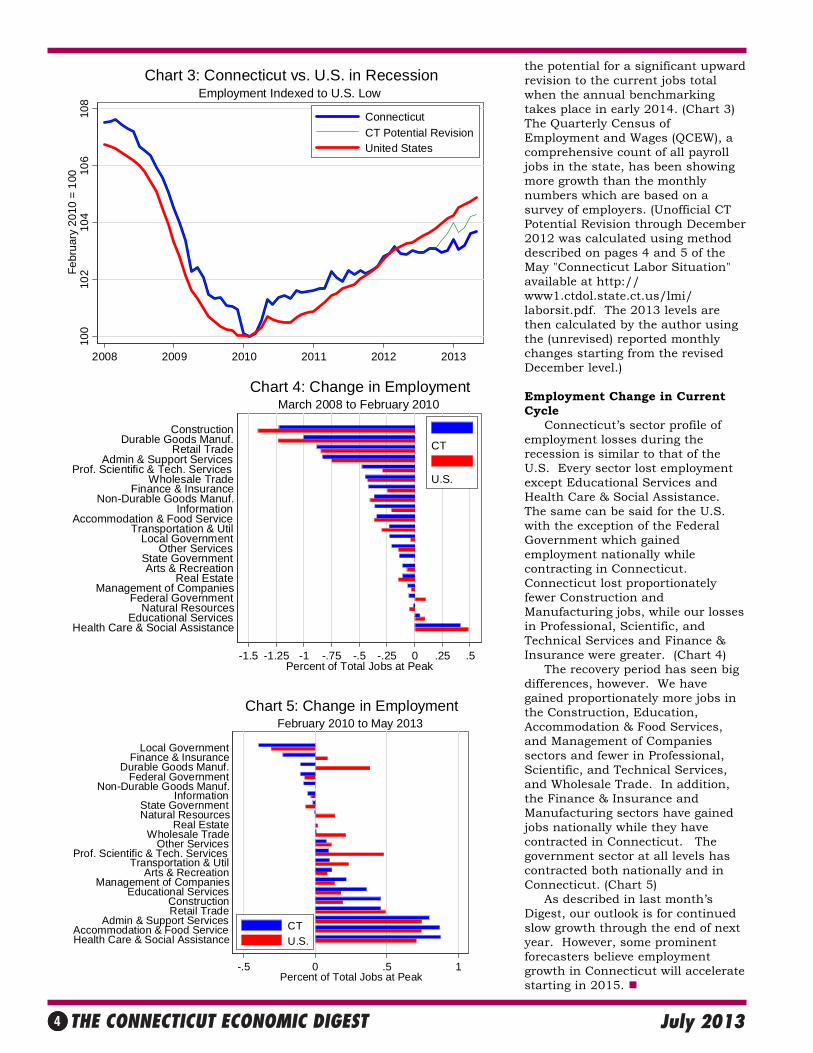
Employment Change in CurrentCycle Connecticut’s sector profile ofemployment losses during therecession is similar to that of theU.S. Every sector lost employmentexcept Educational Services andHealth Care & Social Assistance.The same can be said for the U.S.with the exception of the FederalGovernment which gainedemployment nationally whilecontracting in Connecticut.Connecticut lost proportionatelyfewer Construction andManufacturing jobs, while our lossesin Professional, Scientific, andTechnical Services and Finance &Insurance were greater. (Chart 4) The recovery period has seen bigdifferences, however. We havegained proportionately more jobs inthe Construction, Education,Accommodation & Food Services,and Management of Companiessectors and fewer in Professional,Scientific, and Technical Services,and Wholesale Trade. In addition,the Finance & Insurance andManufacturing sectors have gainedjobs nationally while they havecontracted in Connecticut. Thegovernment sector at all levels hascontracted both nationally and inConnecticut. (Chart 5) As described in last month’sDigest, our outlook is for continuedslow growth through the end of nextyear. However, some prominentforecasters believe employmentgrowth in Connecticut will acceleratestarting in 2015.
THE CONNECTICUT ECONOMIC DIGEST 5July 2013
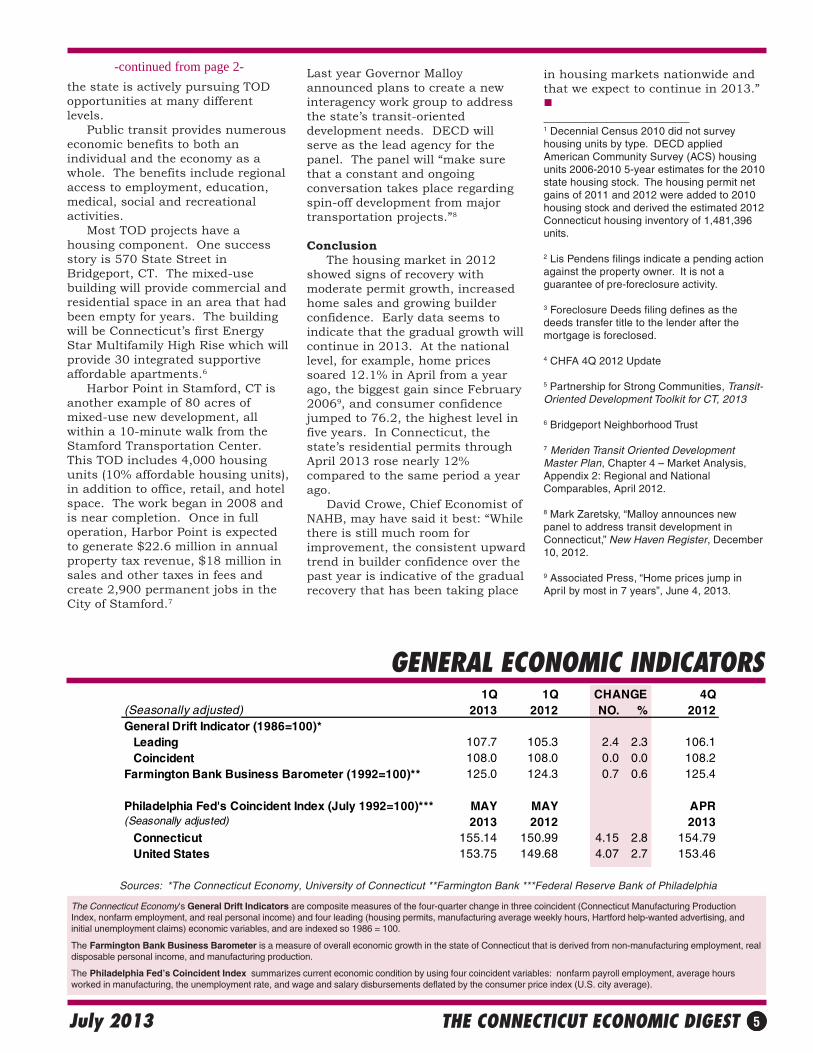
GENERAL ECONOMIC INDICATORS
Sources: *The Connecticut Economy, University of Connecticut **Farmington Bank ***Federal Reserve Bank of Philadelphia
The Connecticut Economy's General Drift Indicators are composite measures of the four-quarter change in three coincident (Connecticut Manufacturing ProductionIndex, nonfarm employment, and real personal income) and four leading (housing permits, manufacturing average weekly hours, Hartford help-wanted advertising, andinitial unemployment claims) economic variables, and are indexed so 1986 = 100.
The Farmington Bank Business Barometer is a measure of overall economic growth in the state of Connecticut that is derived from non-manufacturing employment, realdisposable personal income, and manufacturing production.
The Philadelphia Fed’s Coincident Index summarizes current economic condition by using four coincident variables: nonfarm payroll employment, average hoursworked in manufacturing, the unemployment rate, and wage and salary disbursements deflated by the consumer price index (U.S. city average).
1Q 1Q CHANGE 4Q(Seasonally adjusted) 2013 2012 NO. % 2012General Drift Indicator (1986=100)* Leading 107.7 105.3 2.4 2.3 106.1 Coincident 108.0 108.0 0.0 0.0 108.2Farmington Bank Business Barometer (1992=100)** 125.0 124.3 0.7 0.6 125.4
Philadelphia Fed's Coincident Index (July 1992=100)*** MAY MAY APR(Seasonally adjusted) 2013 2012 2013 Connecticut 155.14 150.99 4.15 2.8 154.79 United States 153.75 149.68 4.07 2.7 153.46
-continued from page 2-the state is actively pursuing TODopportunities at many differentlevels. Public transit provides numerouseconomic benefits to both anindividual and the economy as awhole. The benefits include regionalaccess to employment, education,medical, social and recreationalactivities. Most TOD projects have ahousing component. One successstory is 570 State Street inBridgeport, CT. The mixed-usebuilding will provide commercial andresidential space in an area that hadbeen empty for years. The buildingwill be Connecticut’s first EnergyStar Multifamily High Rise which willprovide 30 integrated supportiveaffordable apartments.6
Harbor Point in Stamford, CT isanother example of 80 acres ofmixed-use new development, allwithin a 10-minute walk from theStamford Transportation Center.This TOD includes 4,000 housingunits (10% affordable housing units),in addition to office, retail, and hotelspace. The work began in 2008 andis near completion. Once in fulloperation, Harbor Point is expectedto generate $22.6 million in annualproperty tax revenue, $18 million insales and other taxes in fees andcreate 2,900 permanent jobs in theCity of Stamford.7
Last year Governor Malloyannounced plans to create a newinteragency work group to addressthe state’s transit-orienteddevelopment needs. DECD willserve as the lead agency for thepanel. The panel will “make surethat a constant and ongoingconversation takes place regardingspin-off development from majortransportation projects.”8
Conclusion The housing market in 2012showed signs of recovery withmoderate permit growth, increasedhome sales and growing builderconfidence. Early data seems toindicate that the gradual growth willcontinue in 2013. At the nationallevel, for example, home pricessoared 12.1% in April from a yearago, the biggest gain since February20069, and consumer confidencejumped to 76.2, the highest level infive years. In Connecticut, thestate’s residential permits throughApril 2013 rose nearly 12%compared to the same period a yearago. David Crowe, Chief Economist ofNAHB, may have said it best: “Whilethere is still much room forimprovement, the consistent upwardtrend in builder confidence over thepast year is indicative of the gradualrecovery that has been taking place
in housing markets nationwide andthat we expect to continue in 2013.”
________________________1 Decennial Census 2010 did not surveyhousing units by type. DECD appliedAmerican Community Survey (ACS) housingunits 2006-2010 5-year estimates for the 2010state housing stock. The housing permit netgains of 2011 and 2012 were added to 2010housing stock and derived the estimated 2012Connecticut housing inventory of 1,481,396units.
2 Lis Pendens filings indicate a pending actionagainst the property owner. It is not aguarantee of pre-foreclosure activity.
3 Foreclosure Deeds filing defines as thedeeds transfer title to the lender after themortgage is foreclosed.
4 CHFA 4Q 2012 Update
5 Partnership for Strong Communities, Transit-Oriented Development Toolkit for CT, 2013
6 Bridgeport Neighborhood Trust
7 Meriden Transit Oriented DevelopmentMaster Plan, Chapter 4 – Market Analysis,Appendix 2: Regional and NationalComparables, April 2012.
8 Mark Zaretsky, “Malloy announces newpanel to address transit development inConnecticut,” New Haven Register, December10, 2012.
9 Associated Press, “Home prices jump inApril by most in 7 years”, June 4, 2013.
THE CONNECTICUT ECONOMIC DIGEST6 July 2013
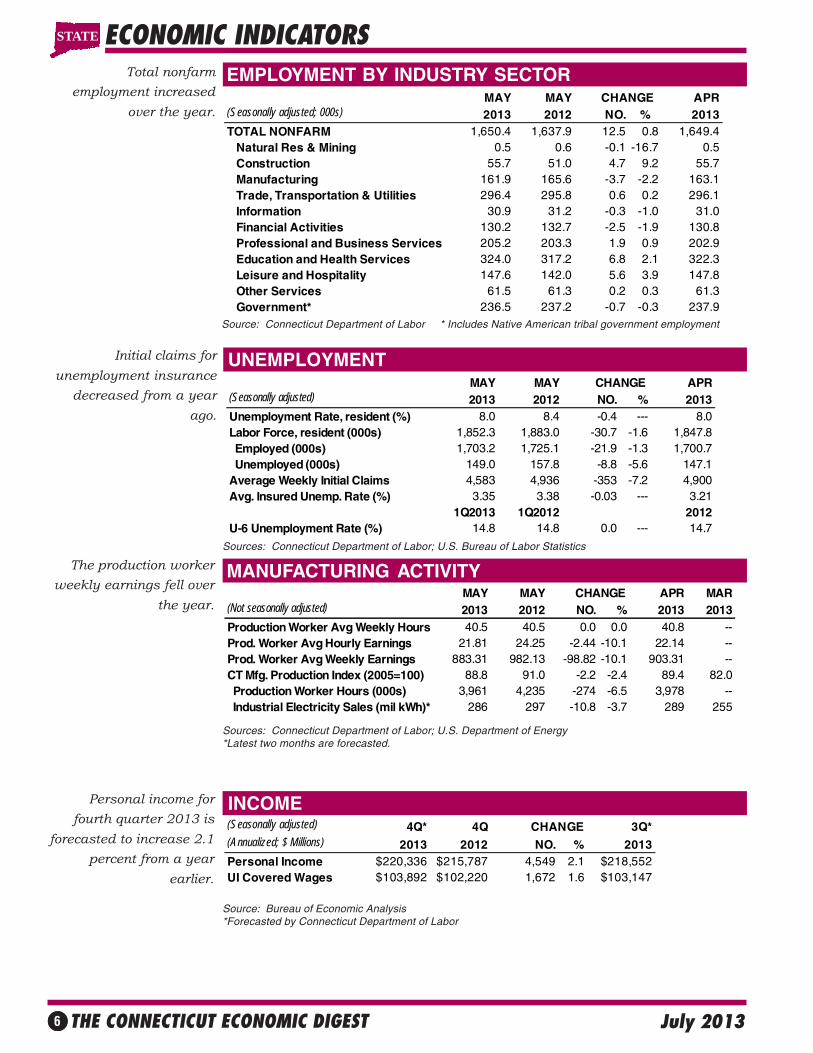
EMPLOYMENT BY INDUSTRY SECTOR
INCOME
Initial claims forunemployment insurance
decreased from a yearago.
UNEMPLOYMENT
The production workerweekly earnings fell over
the year.
MANUFACTURING ACTIVITY
ECONOMIC INDICATORSTotal nonfarm
employment increasedover the year.
Personal income forfourth quarter 2013 is
forecasted to increase 2.1percent from a year
earlier.
Source: Connecticut Department of Labor * Includes Native American tribal government employment
Sources: Connecticut Department of Labor; U.S. Bureau of Labor Statistics
Sources: Connecticut Department of Labor; U.S. Department of Energy*Latest two months are forecasted.
Source: Bureau of Economic Analysis*Forecasted by Connecticut Department of Labor
(Seasonally adjusted) 4Q* 4Q CHANGE 3Q*(Annualized; $ Millions) 2013 2012 NO. % 2013Personal Income $220,336 $215,787 4,549 2.1 $218,552UI Covered Wages $103,892 $102,220 1,672 1.6 $103,147
MAY MAY CHANGE APR MAR(Not seasonally adjusted) 2013 2012 NO. % 2013 2013Production Worker Avg Weekly Hours 40.5 40.5 0.0 0.0 40.8 --Prod. Worker Avg Hourly Earnings 21.81 24.25 -2.44 -10.1 22.14 --Prod. Worker Avg Weekly Earnings 883.31 982.13 -98.82 -10.1 903.31 --CT Mfg. Production Index (2005=100) 88.8 91.0 -2.2 -2.4 89.4 82.0 Production Worker Hours (000s) 3,961 4,235 -274 -6.5 3,978 -- Industrial Electricity Sales (mil kWh)* 286 297 -10.8 -3.7 289 255
MAY MAY CHANGE APR(Seasonally adjusted; 000s) 2013 2012 NO. % 2013TOTAL NONFARM 1,650.4 1,637.9 12.5 0.8 1,649.4 Natural Res & Mining 0.5 0.6 -0.1 -16.7 0.5 Construction 55.7 51.0 4.7 9.2 55.7 Manufacturing 161.9 165.6 -3.7 -2.2 163.1 Trade, Transportation & Utilities 296.4 295.8 0.6 0.2 296.1 Information 30.9 31.2 -0.3 -1.0 31.0 Financial Activities 130.2 132.7 -2.5 -1.9 130.8 Professional and Business Services 205.2 203.3 1.9 0.9 202.9 Education and Health Services 324.0 317.2 6.8 2.1 322.3 Leisure and Hospitality 147.6 142.0 5.6 3.9 147.8 Other Services 61.5 61.3 0.2 0.3 61.3 Government* 236.5 237.2 -0.7 -0.3 237.9
STATE
MAY MAY CHANGE APR(Seasonally adjusted) 2013 2012 NO. % 2013Unemployment Rate, resident (%) 8.0 8.4 -0.4 --- 8.0Labor Force, resident (000s) 1,852.3 1,883.0 -30.7 -1.6 1,847.8 Employed (000s) 1,703.2 1,725.1 -21.9 -1.3 1,700.7 Unemployed (000s) 149.0 157.8 -8.8 -5.6 147.1Average Weekly Initial Claims 4,583 4,936 -353 -7.2 4,900Avg. Insured Unemp. Rate (%) 3.35 3.38 -0.03 --- 3.21
1Q2013 1Q2012 2012U-6 Unemployment Rate (%) 14.8 14.8 0.0 --- 14.7

THE CONNECTICUT ECONOMIC DIGEST 7July 2013
TOURISM AND TRAVEL
ECONOMIC INDICATORSBUSINESS ACTIVITY New auto registrations
rose over the year.
Indian gaming slots fell overthe year.
BUSINESS STARTS AND TERMINATIONS Net business formation, asmeasured by starts minusstops registered with theSecretary of the State, wasup over the year.
STATE REVENUES
Sources: Connecticut Department of Economic and Community Development; U.S. Department of Energy,Energy Information Administration; Connecticut Department of Revenue Services; F.W. Dodge;Connecticut Department of Motor Vehicles; Connecticut Department of Transportation, Bureau ofAviation and Ports
* Estimated by the Bureau of the Census
Sources: Connecticut Secretary of the State; Connecticut Department of Labor
MAY MAY % % (Millions of dollars) 2013 2012 CHG CURRENT PRIOR CHGTOTAL ALL REVENUES* 974.4 992.0 -1.8 8,214.5 7,589.3 8.2 Corporate Tax 24.7 20.1 22.9 318.3 308.3 3.2 Personal Income Tax 484.3 524.7 -7.7 4,689.9 4,310.2 8.8 Real Estate Conv. Tax 13.8 11.6 19.0 55.2 47.1 17.2 Sales & Use Tax 330.5 317.0 4.3 1,653.5 1,694.6 -2.4 Indian Gaming Payments** 25.9 28.2 -8.2 121.2 139.7 -13.3
YEAR TO DATE
Sources: Connecticut Department of Revenue Services; Division of Special Revenue*Includes all sources of revenue; Only selected sources are displayed; Most July receipts arecredited to the prior fiscal year and are not shown. **See page 23 for explanation.
Sources: Connecticut Department of Transportation, Bureau of Aviation and Ports; ConnecticutCommission on Culture and Tourism; Division of Special Revenue
*See page 23 for explanation **The Connecticut Economy, University of Connecticut***Due to state budget cuts CT Info Centers suspended some services causing a drop in visitors.
Y/Y % YEAR TO DATE % MONTH LEVEL CHG CURRENT PRIOR CHG
Info Center Visitors*** MAY 2013 17,824 -20.6 52,714 71,053 -25.8Major Attraction Visitors MAY 2013 154,954 1.2 536,859 574,234 -6.5Air Passenger Count MAY 2013 483,658 0.8 2,144,615 2,207,578 -2.9Indian Gaming Slots (Mil.$)* MAY 2013 1,213 -3.8 5,756 6,319 -8.9Travel and Tourism Index** 1Q2013 --- -3.7 --- --- ---
Y/Y % %MO/QTR LEVEL CHG CURRENT PRIOR CHG
STARTS Secretary of the State MAY 2013 2,513 -0.7 12,147 12,716 -4.5 Department of Labor 4Q2012 1,387 -7.7 7,312 7,391 -1.1TERMINATIONS Secretary of the State MAY 2013 840 -11.3 5,144 5,044 2.0 Department of Labor 4Q2012 2,308 -22.4 7,056 8,554 -17.5
YEAR TO DATE
STATE
Total revenues were downfrom a year ago.
Y/Y % YEAR TO DATE % MONTH LEVEL CHG CURRENT PRIOR CHG
New Housing Permits* MAY 2013 488 36.3 2,361 1,470 60.6Electricity Sales (mil kWh) APR 2013 2,329 9.7 9,874 9,495 4.0Construction Contracts Index (1980=100) MAY 2013 433.0 47.2 --- --- ---New Auto Registrations MAY 2013 22,372 18.5 79,997 76,442 4.7Air Cargo Tons (000s) MAY 2013 11,678 -4.3 52,875 57,884 -8.7Exports (Bil. $) 1Q2013 4.20 5.4 4.20 3.99 5.4S&P 500: Monthly Close MAY 2013 1,630.74 24.5 --- --- ---
THE CONNECTICUT ECONOMIC DIGEST8 July 2013
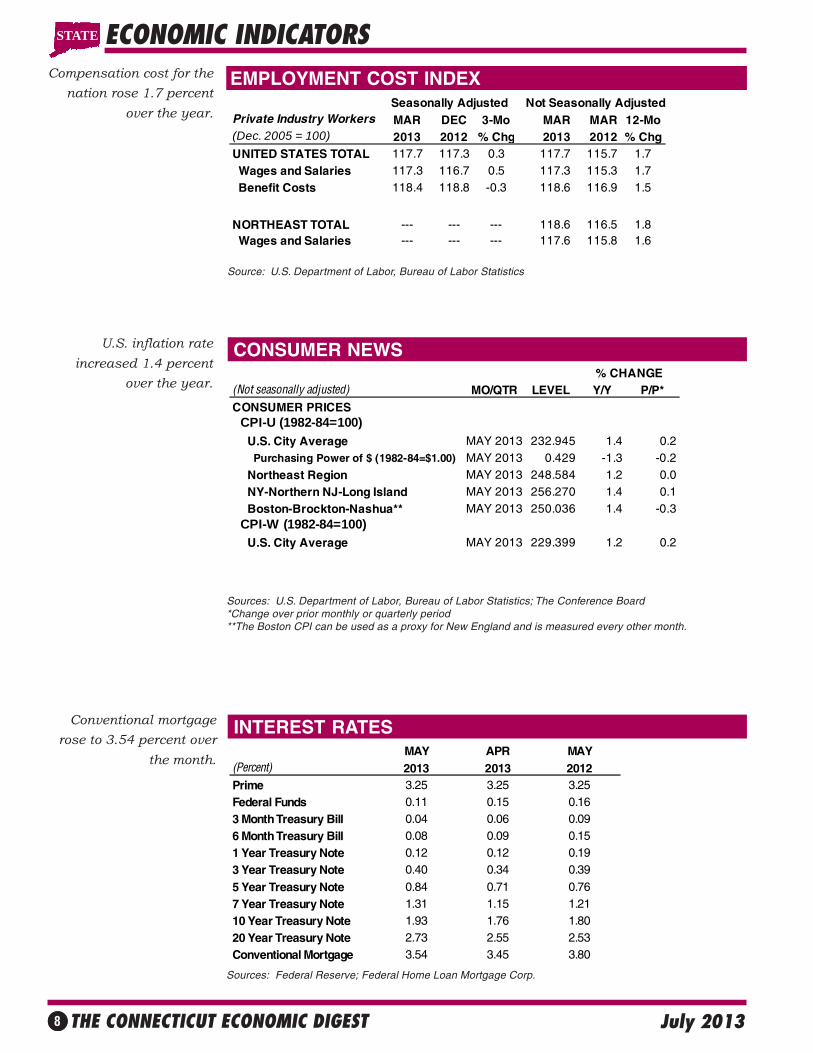
CONSUMER NEWS
EMPLOYMENT COST INDEXCompensation cost for thenation rose 1.7 percent
over the year.
Conventional mortgagerose to 3.54 percent over
the month.
INTEREST RATES
ECONOMIC INDICATORS
U.S. inflation rateincreased 1.4 percent
over the year.
Source: U.S. Department of Labor, Bureau of Labor Statistics
Sources: U.S. Department of Labor, Bureau of Labor Statistics; The Conference Board*Change over prior monthly or quarterly period**The Boston CPI can be used as a proxy for New England and is measured every other month.
Sources: Federal Reserve; Federal Home Loan Mortgage Corp.
MAY APR MAY(Percent) 2013 2013 2012Prime 3.25 3.25 3.25Federal Funds 0.11 0.15 0.163 Month Treasury Bill 0.04 0.06 0.096 Month Treasury Bill 0.08 0.09 0.151 Year Treasury Note 0.12 0.12 0.193 Year Treasury Note 0.40 0.34 0.39
5 Year Treasury Note 0.84 0.71 0.767 Year Treasury Note 1.31 1.15 1.2110 Year Treasury Note 1.93 1.76 1.8020 Year Treasury Note 2.73 2.55 2.53Conventional Mortgage 3.54 3.45 3.80
Seasonally Adjusted Not Seasonally AdjustedPrivate Industry Workers MAR DEC 3-Mo MAR MAR 12-Mo(Dec. 2005 = 100) 2013 2012 % Chg 2013 2012 % ChgUNITED STATES TOTAL 117.7 117.3 0.3 117.7 115.7 1.7 Wages and Salaries 117.3 116.7 0.5 117.3 115.3 1.7 Benefit Costs 118.4 118.8 -0.3 118.6 116.9 1.5
NORTHEAST TOTAL --- --- --- 118.6 116.5 1.8 Wages and Salaries --- --- --- 117.6 115.8 1.6
STATE
(Not seasonally adjusted) MO/QTR LEVEL Y/Y P/P*CONSUMER PRICES CPI-U (1982-84=100) U.S. City Average MAY 2013 232.945 1.4 0.2 Purchasing Power of $ (1982-84=$1.00) MAY 2013 0.429 -1.3 -0.2 Northeast Region MAY 2013 248.584 1.2 0.0 NY-Northern NJ-Long Island MAY 2013 256.270 1.4 0.1 Boston-Brockton-Nashua** MAY 2013 250.036 1.4 -0.3 CPI-W (1982-84=100) U.S. City Average MAY 2013 229.399 1.2 0.2
% CHANGE

THE CONNECTICUT ECONOMIC DIGEST 9July 2013
UNEMPLOYMENT RATES
LABOR FORCE
NONFARM EMPLOYMENT
All nine states showed adecrease in its unem-ployment rate over theyear.
All nine states in theregion gained jobs overthe year.
Five states postedincreases in the laborforce from last year.
COMPARATIVE REGIONAL DATA
Source: U.S. Department of Labor, Bureau of Labor Statistics
Source: U.S. Department of Labor, Bureau of Labor Statistics
Source: U.S. Department of Labor, Bureau of Labor Statistics
MAY MAY CHANGE APR(Seasonally adjusted; 000s) 2013 2012 NO. % 2013Connecticut 1,650.4 1,637.9 12.5 0.8 1,649.4Maine 600.4 599.0 1.4 0.2 598.0Massachusetts 3,313.6 3,264.0 49.6 1.5 3,310.1New Hampshire 641.5 631.7 9.8 1.6 639.0New Jersey 3,962.2 3,887.6 74.6 1.9 3,947.9New York 8,897.1 8,801.7 95.4 1.1 8,897.3Pennsylvania 5,740.4 5,735.7 4.7 0.1 5,749.6Rhode Island 466.9 465.3 1.6 0.3 467.1Vermont 305.1 301.7 3.4 1.1 307.1United States 135,637.0 133,522.0 2,115.0 1.6 135,462.0
MAY MAY CHANGE APR(Seasonally adjusted; 000s) 2013 2012 NO. % 2013Connecticut 1,852.3 1,883.0 -30.7 -1.6 1,847.8Maine 708.9 706.2 2.7 0.4 706.5Massachusetts 3,481.7 3,474.1 7.6 0.2 3,472.8New Hampshire 744.6 741.9 2.7 0.4 744.2New Jersey 4,611.4 4,582.2 29.2 0.6 4,610.7New York 9,571.6 9,589.9 -18.3 -0.2 9,562.2Pennsylvania 6,521.0 6,475.9 45.1 0.7 6,505.1Rhode Island 558.9 559.4 -0.5 -0.1 558.3Vermont 351.4 356.0 -4.6 -1.3 351.1United States 155,658.0 154,998.0 660.0 0.4 155,238.0
MAY MAY APR(Seasonally adjusted) 2013 2012 CHANGE 2013Connecticut 8.0 8.4 -0.4 8.0Maine 6.8 7.3 -0.5 6.9Massachusetts 6.6 6.7 -0.1 6.5New Hampshire 5.3 5.5 -0.2 5.5New Jersey 8.6 9.5 -0.9 8.7New York 7.6 8.6 -1.0 7.8Pennsylvania 7.5 7.9 -0.4 7.6Rhode Island 8.9 10.6 -1.7 8.8Vermont 4.1 5.0 -0.9 4.0United States 7.6 8.2 -0.6 7.5
STATE
THE CONNECTICUT ECONOMIC DIGEST10 July 2013
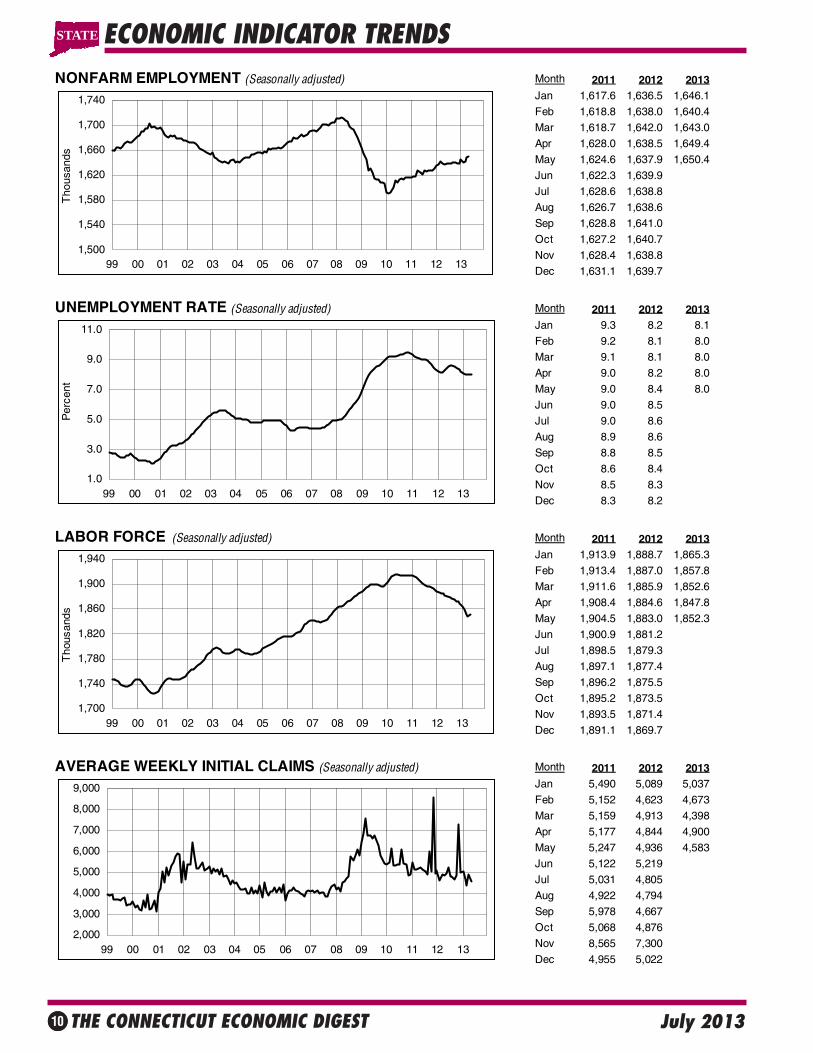
ECONOMIC INDICATOR TRENDSSTATE
NONFARM EMPLOYMENT (Seasonally adjusted) Month 2011 2012 2013Jan 1,617.6 1,636.5 1,646.1
Feb 1,618.8 1,638.0 1,640.4
Mar 1,618.7 1,642.0 1,643.0
Apr 1,628.0 1,638.5 1,649.4
May 1,624.6 1,637.9 1,650.4
Jun 1,622.3 1,639.9
Jul 1,628.6 1,638.8
Aug 1,626.7 1,638.6
Sep 1,628.8 1,641.0
Oct 1,627.2 1,640.7
Nov 1,628.4 1,638.8
Dec 1,631.1 1,639.7
UNEMPLOYMENT RATE (Seasonally adjusted) Month 2011 2012 2013Jan 9.3 8.2 8.1
Feb 9.2 8.1 8.0
Mar 9.1 8.1 8.0
Apr 9.0 8.2 8.0
May 9.0 8.4 8.0
Jun 9.0 8.5
Jul 9.0 8.6
Aug 8.9 8.6
Sep 8.8 8.5
Oct 8.6 8.4
Nov 8.5 8.3
Dec 8.3 8.2
LABOR FORCE (Seasonally adjusted) Month 2011 2012 2013Jan 1,913.9 1,888.7 1,865.3
Feb 1,913.4 1,887.0 1,857.8
Mar 1,911.6 1,885.9 1,852.6
Apr 1,908.4 1,884.6 1,847.8
May 1,904.5 1,883.0 1,852.3
Jun 1,900.9 1,881.2
Jul 1,898.5 1,879.3
Aug 1,897.1 1,877.4
Sep 1,896.2 1,875.5
Oct 1,895.2 1,873.5
Nov 1,893.5 1,871.4
Dec 1,891.1 1,869.7
AVERAGE WEEKLY INITIAL CLAIMS (Seasonally adjusted) Month 2011 2012 2013Jan 5,490 5,089 5,037
Feb 5,152 4,623 4,673
Mar 5,159 4,913 4,398
Apr 5,177 4,844 4,900
May 5,247 4,936 4,583
Jun 5,122 5,219
Jul 5,031 4,805
Aug 4,922 4,794
Sep 5,978 4,667
Oct 5,068 4,876
Nov 8,565 7,300
Dec 4,955 5,022
1.0
3.0
5.0
7.0
9.0
11.0
99 00 01 02 03 04 05 06 07 08 09 10 11 12 13
Per
cent
1,500
1,540
1,580
1,620
1,660
1,700
1,740
99 00 01 02 03 04 05 06 07 08 09 10 11 12 13
Tho
usan
ds
2,000
3,000
4,000
5,000
6,000
7,000
8,000
9,000
99 00 01 02 03 04 05 06 07 08 09 10 11 12 13
1,700
1,740
1,780
1,820
1,860
1,900
1,940
99 00 01 02 03 04 05 06 07 08 09 10 11 12 13
Tho
usan
ds
THE CONNECTICUT ECONOMIC DIGEST 11July 2013
ECONOMIC INDICATOR TRENDS STATE
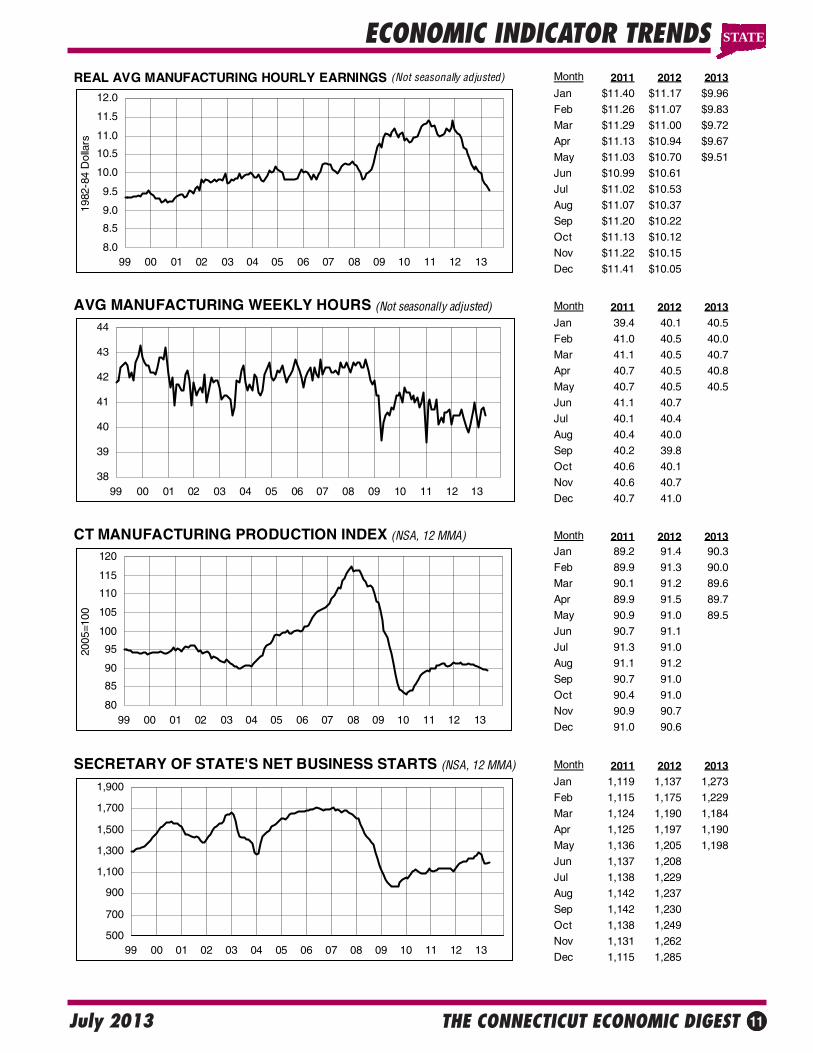
REAL AVG MANUFACTURING HOURLY EARNINGS (Not seasonally adjusted) Month 2011 2012 2013Jan $11.40 $11.17 $9.96
Feb $11.26 $11.07 $9.83
Mar $11.29 $11.00 $9.72
Apr $11.13 $10.94 $9.67
May $11.03 $10.70 $9.51
Jun $10.99 $10.61
Jul $11.02 $10.53
Aug $11.07 $10.37
Sep $11.20 $10.22
Oct $11.13 $10.12
Nov $11.22 $10.15
Dec $11.41 $10.05
AVG MANUFACTURING WEEKLY HOURS (Not seasonally adjusted) Month 2011 2012 2013Jan 39.4 40.1 40.5
Feb 41.0 40.5 40.0
Mar 41.1 40.5 40.7
Apr 40.7 40.5 40.8
May 40.7 40.5 40.5
Jun 41.1 40.7
Jul 40.1 40.4
Aug 40.4 40.0
Sep 40.2 39.8
Oct 40.6 40.1
Nov 40.6 40.7
Dec 40.7 41.0
CT MANUFACTURING PRODUCTION INDEX (NSA, 12 MMA) Month 2011 2012 2013Jan 89.2 91.4 90.3
Feb 89.9 91.3 90.0
Mar 90.1 91.2 89.6
Apr 89.9 91.5 89.7
May 90.9 91.0 89.5
Jun 90.7 91.1
Jul 91.3 91.0
Aug 91.1 91.2
Sep 90.7 91.0
Oct 90.4 91.0
Nov 90.9 90.7
Dec 91.0 90.6
SECRETARY OF STATE'S NET BUSINESS STARTS (NSA, 12 MMA) Month 2011 2012 2013Jan 1,119 1,137 1,273
Feb 1,115 1,175 1,229
Mar 1,124 1,190 1,184
Apr 1,125 1,197 1,190
May 1,136 1,205 1,198
Jun 1,137 1,208
Jul 1,138 1,229
Aug 1,142 1,237
Sep 1,142 1,230
Oct 1,138 1,249
Nov 1,131 1,262
Dec 1,115 1,285
38
39
40
41
42
43
44
99 00 01 02 03 04 05 06 07 08 09 10 11 12 13
8.0
8.5
9.0
9.5
10.0
10.5
11.0
11.5
12.0
99 00 01 02 03 04 05 06 07 08 09 10 11 12 13
1982
-84
Dol
lars
80
85
90
95
100
105
110
115
120
99 00 01 02 03 04 05 06 07 08 09 10 11 12 13
2005
=100
500
700
900
1,100
1,300
1,500
1,700
1,900
99 00 01 02 03 04 05 06 07 08 09 10 11 12 13
THE CONNECTICUT ECONOMIC DIGEST12 July 2013
Not Seasonally Adjusted
MAY MAY CHANGE APR2013 2012 NO. % 2013
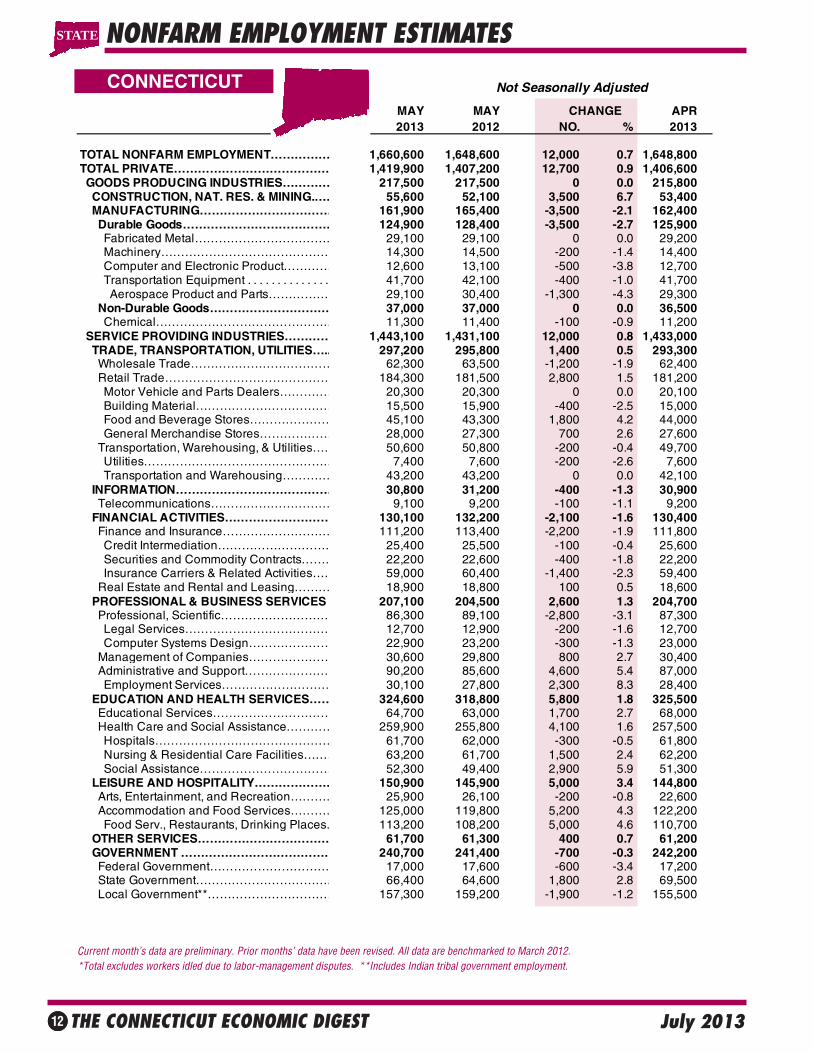
TOTAL NONFARM EMPLOYMENT…………… 1,660,600 1,648,600 12,000 0.7 1,648,800TOTAL PRIVATE………………………………… 1,419,900 1,407,200 12,700 0.9 1,406,600 GOODS PRODUCING INDUSTRIES………… 217,500 217,500 0 0.0 215,800 CONSTRUCTION, NAT. RES. & MINING.…… 55,600 52,100 3,500 6.7 53,400 MANUFACTURING…………………………… 161,900 165,400 -3,500 -2.1 162,400 Durable Goods………………………………… 124,900 128,400 -3,500 -2.7 125,900 Fabricated Metal……………………………… 29,100 29,100 0 0.0 29,200 Machinery…………………………………… 14,300 14,500 -200 -1.4 14,400 Computer and Electronic Product………… 12,600 13,100 -500 -3.8 12,700 Transportation Equipment . . . . . . . . . . . . . . 41,700 42,100 -400 -1.0 41,700 Aerospace Product and Parts…………… 29,100 30,400 -1,300 -4.3 29,300 Non-Durable Goods………………………… 37,000 37,000 0 0.0 36,500 Chemical……………………………………… 11,300 11,400 -100 -0.9 11,200 SERVICE PROVIDING INDUSTRIES………… 1,443,100 1,431,100 12,000 0.8 1,433,000 TRADE, TRANSPORTATION, UTILITIES….. 297,200 295,800 1,400 0.5 293,300 Wholesale Trade……………………………… 62,300 63,500 -1,200 -1.9 62,400 Retail Trade…………………………………… 184,300 181,500 2,800 1.5 181,200 Motor Vehicle and Parts Dealers…………… 20,300 20,300 0 0.0 20,100 Building Material……………………………… 15,500 15,900 -400 -2.5 15,000 Food and Beverage Stores………………… 45,100 43,300 1,800 4.2 44,000 General Merchandise Stores……………… 28,000 27,300 700 2.6 27,600 Transportation, Warehousing, & Utilities…… 50,600 50,800 -200 -0.4 49,700 Utilities………………………………………… 7,400 7,600 -200 -2.6 7,600 Transportation and Warehousing………… 43,200 43,200 0 0.0 42,100 INFORMATION………………………………… 30,800 31,200 -400 -1.3 30,900 Telecommunications………………………… 9,100 9,200 -100 -1.1 9,200 FINANCIAL ACTIVITIES……………………… 130,100 132,200 -2,100 -1.6 130,400 Finance and Insurance……………………… 111,200 113,400 -2,200 -1.9 111,800 Credit Intermediation………………………… 25,400 25,500 -100 -0.4 25,600 Securities and Commodity Contracts……… 22,200 22,600 -400 -1.8 22,200 Insurance Carriers & Related Activities…… 59,000 60,400 -1,400 -2.3 59,400 Real Estate and Rental and Leasing……… 18,900 18,800 100 0.5 18,600 PROFESSIONAL & BUSINESS SERVICES 207,100 204,500 2,600 1.3 204,700 Professional, Scientific……………………… 86,300 89,100 -2,800 -3.1 87,300 Legal Services……………………………… 12,700 12,900 -200 -1.6 12,700 Computer Systems Design………………… 22,900 23,200 -300 -1.3 23,000 Management of Companies………………… 30,600 29,800 800 2.7 30,400 Administrative and Support………………… 90,200 85,600 4,600 5.4 87,000 Employment Services……………………… 30,100 27,800 2,300 8.3 28,400 EDUCATION AND HEALTH SERVICES…… 324,600 318,800 5,800 1.8 325,500 Educational Services………………………… 64,700 63,000 1,700 2.7 68,000 Health Care and Social Assistance………… 259,900 255,800 4,100 1.6 257,500 Hospitals……………………………………… 61,700 62,000 -300 -0.5 61,800 Nursing & Residential Care Facilities……… 63,200 61,700 1,500 2.4 62,200 Social Assistance…………………………… 52,300 49,400 2,900 5.9 51,300 LEISURE AND HOSPITALITY………………… 150,900 145,900 5,000 3.4 144,800 Arts, Entertainment, and Recreation………… 25,900 26,100 -200 -0.8 22,600 Accommodation and Food Services………… 125,000 119,800 5,200 4.3 122,200 Food Serv., Restaurants, Drinking Places… 113,200 108,200 5,000 4.6 110,700 OTHER SERVICES…………………………… 61,700 61,300 400 0.7 61,200 GOVERNMENT ………………………………… 240,700 241,400 -700 -0.3 242,200 Federal Government………………………… 17,000 17,600 -600 -3.4 17,200 State Government……………………………. 66,400 64,600 1,800 2.8 69,500 Local Government**…………………………… 157,300 159,200 -1,900 -1.2 155,500
CONNECTICUT
NONFARM EMPLOYMENT ESTIMATES
Current month’s data are preliminary. Prior months’ data have been revised. All data are benchmarked to March 2012. *Total excludes workers idled due to labor-management disputes. **Includes Indian tribal government employment.
STATE
THE CONNECTICUT ECONOMIC DIGEST 13July 2013
DANBURY LMA
BRIDGEPORT -STAMFORD LMA
NONFARM EMPLOYMENT ESTIMATES
Current month’s data are preliminary. Prior months’ data have been revised. All data are benchmarked to March 2012. *Total excludes workers idled due to labor-management disputes.
LMA
Not Seasonally Adjusted
MAY MAY CHANGE APR2013 2012 NO. % 2013
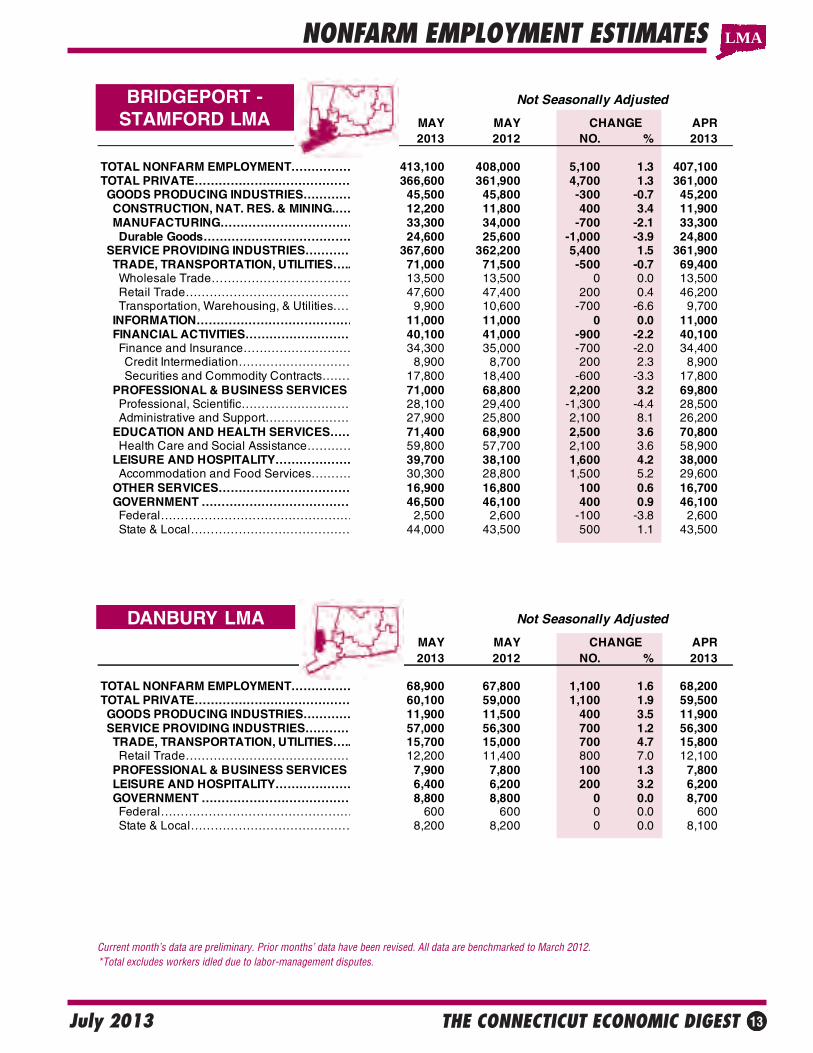
TOTAL NONFARM EMPLOYMENT…………… 413,100 408,000 5,100 1.3 407,100TOTAL PRIVATE………………………………… 366,600 361,900 4,700 1.3 361,000 GOODS PRODUCING INDUSTRIES………… 45,500 45,800 -300 -0.7 45,200 CONSTRUCTION, NAT. RES. & MINING.…… 12,200 11,800 400 3.4 11,900 MANUFACTURING…………………………… 33,300 34,000 -700 -2.1 33,300 Durable Goods………………………………… 24,600 25,600 -1,000 -3.9 24,800 SERVICE PROVIDING INDUSTRIES………… 367,600 362,200 5,400 1.5 361,900 TRADE, TRANSPORTATION, UTILITIES….. 71,000 71,500 -500 -0.7 69,400 Wholesale Trade……………………………… 13,500 13,500 0 0.0 13,500 Retail Trade…………………………………… 47,600 47,400 200 0.4 46,200 Transportation, Warehousing, & Utilities…… 9,900 10,600 -700 -6.6 9,700 INFORMATION………………………………… 11,000 11,000 0 0.0 11,000 FINANCIAL ACTIVITIES……………………… 40,100 41,000 -900 -2.2 40,100 Finance and Insurance……………………… 34,300 35,000 -700 -2.0 34,400 Credit Intermediation………………………… 8,900 8,700 200 2.3 8,900 Securities and Commodity Contracts……… 17,800 18,400 -600 -3.3 17,800 PROFESSIONAL & BUSINESS SERVICES 71,000 68,800 2,200 3.2 69,800 Professional, Scientific……………………… 28,100 29,400 -1,300 -4.4 28,500 Administrative and Support………………… 27,900 25,800 2,100 8.1 26,200 EDUCATION AND HEALTH SERVICES…… 71,400 68,900 2,500 3.6 70,800 Health Care and Social Assistance………… 59,800 57,700 2,100 3.6 58,900 LEISURE AND HOSPITALITY………………… 39,700 38,100 1,600 4.2 38,000 Accommodation and Food Services………… 30,300 28,800 1,500 5.2 29,600 OTHER SERVICES…………………………… 16,900 16,800 100 0.6 16,700 GOVERNMENT ………………………………… 46,500 46,100 400 0.9 46,100 Federal………………………………………… 2,500 2,600 -100 -3.8 2,600 State & Local…………………………………… 44,000 43,500 500 1.1 43,500
Not Seasonally Adjusted
MAY MAY CHANGE APR2013 2012 NO. % 2013
TOTAL NONFARM EMPLOYMENT…………… 68,900 67,800 1,100 1.6 68,200TOTAL PRIVATE………………………………… 60,100 59,000 1,100 1.9 59,500 GOODS PRODUCING INDUSTRIES………… 11,900 11,500 400 3.5 11,900 SERVICE PROVIDING INDUSTRIES………… 57,000 56,300 700 1.2 56,300 TRADE, TRANSPORTATION, UTILITIES….. 15,700 15,000 700 4.7 15,800 Retail Trade…………………………………… 12,200 11,400 800 7.0 12,100 PROFESSIONAL & BUSINESS SERVICES 7,900 7,800 100 1.3 7,800 LEISURE AND HOSPITALITY………………… 6,400 6,200 200 3.2 6,200 GOVERNMENT ………………………………… 8,800 8,800 0 0.0 8,700 Federal………………………………………… 600 600 0 0.0 600 State & Local…………………………………… 8,200 8,200 0 0.0 8,100
THE CONNECTICUT ECONOMIC DIGEST14 July 2013
HARTFORD LMA
NONFARM EMPLOYMENT ESTIMATESLMA
SEASONALLY ADJUSTED TOTAL NONFARM EMPLOYMENT
Current month’s data are preliminary. Prior months’ data have been revised. All data are benchmarked to March 2012. *Total excludes workers idled due to labor-management disputes.
Not Seasonally Adjusted
MAY MAY CHANGE APR2013 2012 NO. % 2013
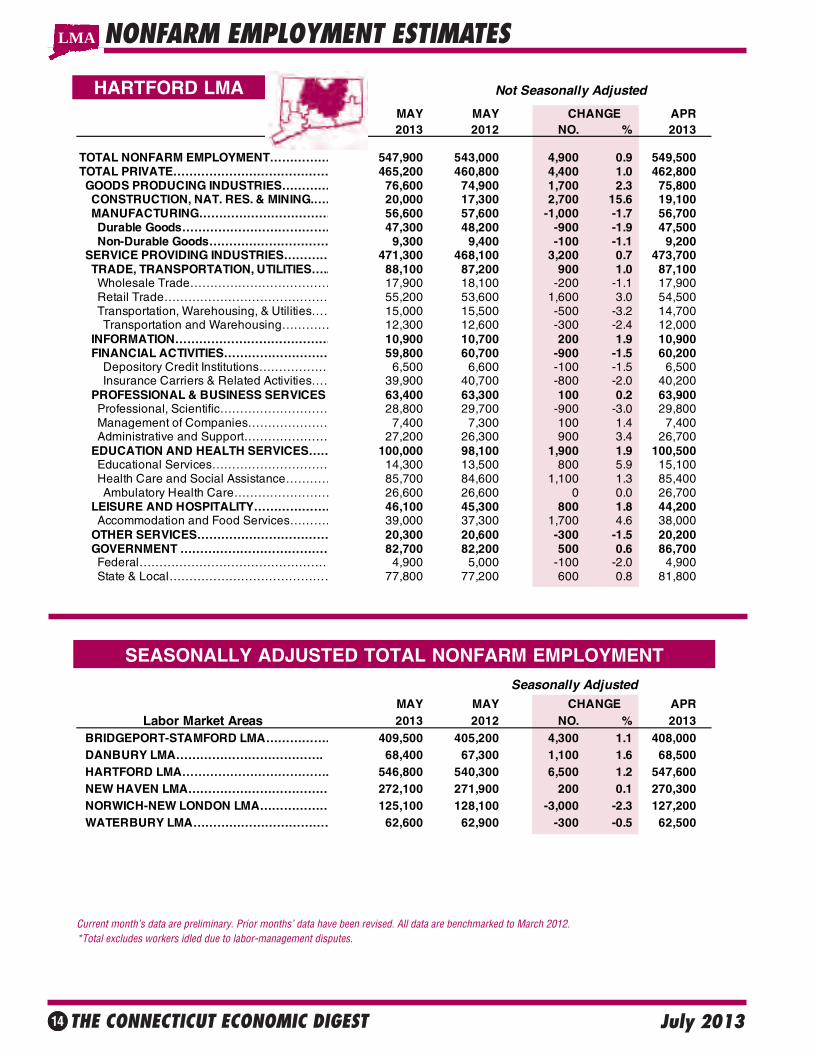
TOTAL NONFARM EMPLOYMENT…………… 547,900 543,000 4,900 0.9 549,500TOTAL PRIVATE………………………………… 465,200 460,800 4,400 1.0 462,800 GOODS PRODUCING INDUSTRIES………… 76,600 74,900 1,700 2.3 75,800 CONSTRUCTION, NAT. RES. & MINING.…… 20,000 17,300 2,700 15.6 19,100 MANUFACTURING…………………………… 56,600 57,600 -1,000 -1.7 56,700 Durable Goods………………………………… 47,300 48,200 -900 -1.9 47,500 Non-Durable Goods………………………… 9,300 9,400 -100 -1.1 9,200 SERVICE PROVIDING INDUSTRIES………… 471,300 468,100 3,200 0.7 473,700 TRADE, TRANSPORTATION, UTILITIES….. 88,100 87,200 900 1.0 87,100 Wholesale Trade……………………………… 17,900 18,100 -200 -1.1 17,900 Retail Trade…………………………………… 55,200 53,600 1,600 3.0 54,500 Transportation, Warehousing, & Utilities…… 15,000 15,500 -500 -3.2 14,700 Transportation and Warehousing………… 12,300 12,600 -300 -2.4 12,000 INFORMATION………………………………… 10,900 10,700 200 1.9 10,900 FINANCIAL ACTIVITIES……………………… 59,800 60,700 -900 -1.5 60,200 Depository Credit Institutions……………… 6,500 6,600 -100 -1.5 6,500 Insurance Carriers & Related Activities…… 39,900 40,700 -800 -2.0 40,200 PROFESSIONAL & BUSINESS SERVICES 63,400 63,300 100 0.2 63,900 Professional, Scientific……………………… 28,800 29,700 -900 -3.0 29,800 Management of Companies………………… 7,400 7,300 100 1.4 7,400 Administrative and Support………………… 27,200 26,300 900 3.4 26,700 EDUCATION AND HEALTH SERVICES…… 100,000 98,100 1,900 1.9 100,500 Educational Services………………………… 14,300 13,500 800 5.9 15,100 Health Care and Social Assistance………… 85,700 84,600 1,100 1.3 85,400 Ambulatory Health Care…………………… 26,600 26,600 0 0.0 26,700 LEISURE AND HOSPITALITY………………… 46,100 45,300 800 1.8 44,200 Accommodation and Food Services………… 39,000 37,300 1,700 4.6 38,000 OTHER SERVICES…………………………… 20,300 20,600 -300 -1.5 20,200 GOVERNMENT ………………………………… 82,700 82,200 500 0.6 86,700 Federal………………………………………… 4,900 5,000 -100 -2.0 4,900 State & Local…………………………………… 77,800 77,200 600 0.8 81,800
Seasonally AdjustedMAY MAY CHANGE APR
Labor Market Areas 2013 2012 NO. % 2013 BRIDGEPORT-STAMFORD LMA……………… 409,500 405,200 4,300 1.1 408,000 DANBURY LMA………………………………. 68,400 67,300 1,100 1.6 68,500 HARTFORD LMA………………………………. 546,800 540,300 6,500 1.2 547,600 NEW HAVEN LMA……………………………… 272,100 271,900 200 0.1 270,300 NORWICH-NEW LONDON LMA……………… 125,100 128,100 -3,000 -2.3 127,200 WATERBURY LMA……………………………… 62,600 62,900 -300 -0.5 62,500
THE CONNECTICUT ECONOMIC DIGEST 15July 2013
MAY MAY APR(Seasonally adjusted) 2013 2012 2013CT Vacancies (000s) 62.1 63.1 65.3 Hartford Vac. (000s) 23.5 24.0 24.8
Connecticut 3.36 3.35 3.54 Hartford 4.01 4.04 4.22
United States 3.11 3.01 3.21Maine 3.02 2.88 3.22Massachusetts 4.13 4.01 4.30New Hampshire 3.16 3.28 3.28Rhode Island 3.34 3.22 3.38Vermont 3.36 3.60 3.42
Labor Demand Rate *
NEW HAVEN LMA
NONFARM EMPLOYMENT ESTIMATES
Current month’s data are preliminary. Prior months’ data have been revised. All data are benchmarked to March 2012. *Total excludes workers idled due to labor-management disputes. **Value less than 50
LMA
HELP WANTED ONLINE
* A percent of advertised vacancies per 100 persons in labor forceSource: The Conference Board
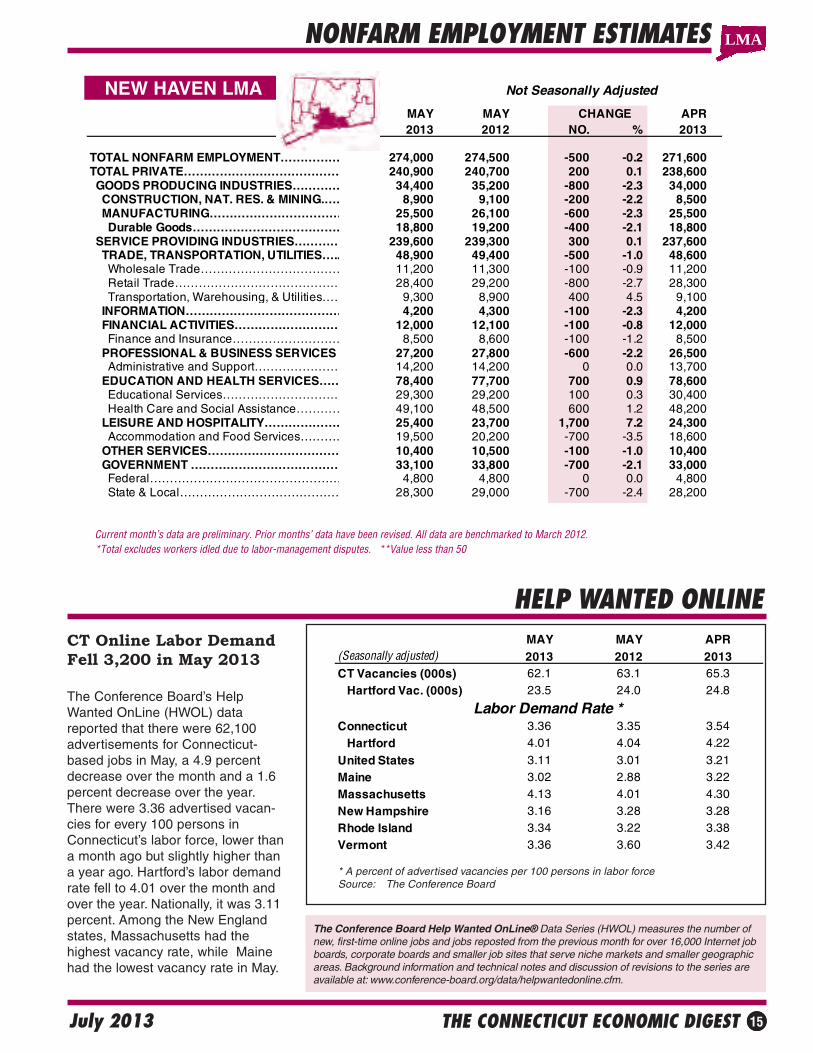
CT Online Labor DemandFell 3,200 in May 2013
The Conference Board’s HelpWanted OnLine (HWOL) datareported that there were 62,100advertisements for Connecticut-based jobs in May, a 4.9 percentdecrease over the month and a 1.6percent decrease over the year.There were 3.36 advertised vacan-cies for every 100 persons inConnecticut’s labor force, lower thana month ago but slightly higher thana year ago. Hartford’s labor demandrate fell to 4.01 over the month andover the year. Nationally, it was 3.11percent. Among the New Englandstates, Massachusetts had thehighest vacancy rate, while Mainehad the lowest vacancy rate in May.
The Conference Board Help Wanted OnLine® Data Series (HWOL) measures the number ofnew, first-time online jobs and jobs reposted from the previous month for over 16,000 Internet jobboards, corporate boards and smaller job sites that serve niche markets and smaller geographicareas. Background information and technical notes and discussion of revisions to the series areavailable at: www.conference-board.org/data/helpwantedonline.cfm.
Not Seasonally Adjusted
MAY MAY CHANGE APR2013 2012 NO. % 2013
TOTAL NONFARM EMPLOYMENT…………… 274,000 274,500 -500 -0.2 271,600 TOTAL PRIVATE………………………………… 240,900 240,700 200 0.1 238,600 GOODS PRODUCING INDUSTRIES………… 34,400 35,200 -800 -2.3 34,000 CONSTRUCTION, NAT. RES. & MINING.…… 8,900 9,100 -200 -2.2 8,500 MANUFACTURING…………………………… 25,500 26,100 -600 -2.3 25,500 Durable Goods………………………………… 18,800 19,200 -400 -2.1 18,800 SERVICE PROVIDING INDUSTRIES………… 239,600 239,300 300 0.1 237,600 TRADE, TRANSPORTATION, UTILITIES….. 48,900 49,400 -500 -1.0 48,600 Wholesale Trade……………………………… 11,200 11,300 -100 -0.9 11,200 Retail Trade…………………………………… 28,400 29,200 -800 -2.7 28,300 Transportation, Warehousing, & Utilities…… 9,300 8,900 400 4.5 9,100 INFORMATION………………………………… 4,200 4,300 -100 -2.3 4,200 FINANCIAL ACTIVITIES……………………… 12,000 12,100 -100 -0.8 12,000 Finance and Insurance……………………… 8,500 8,600 -100 -1.2 8,500 PROFESSIONAL & BUSINESS SERVICES 27,200 27,800 -600 -2.2 26,500 Administrative and Support………………… 14,200 14,200 0 0.0 13,700 EDUCATION AND HEALTH SERVICES…… 78,400 77,700 700 0.9 78,600 Educational Services………………………… 29,300 29,200 100 0.3 30,400 Health Care and Social Assistance………… 49,100 48,500 600 1.2 48,200 LEISURE AND HOSPITALITY………………… 25,400 23,700 1,700 7.2 24,300 Accommodation and Food Services………… 19,500 20,200 -700 -3.5 18,600 OTHER SERVICES…………………………… 10,400 10,500 -100 -1.0 10,400 GOVERNMENT ………………………………… 33,100 33,800 -700 -2.1 33,000 Federal………………………………………… 4,800 4,800 0 0.0 4,800 State & Local…………………………………… 28,300 29,000 -700 -2.4 28,200
THE CONNECTICUT ECONOMIC DIGEST16 July 2013
NORWICH - NEWLONDON LMA
Current month’s data are preliminary. Prior months’ data have been revised. All data are benchmarked to March 2012 *Total excludes workers idled due to labor-management disputes. **Includes Indian tribal government employment.
NONFARM EMPLOYMENT ESTIMATES
WATERBURY LMA
LMA
Not Seasonally Adjusted
MAY MAY CHANGE APR2013 2012 NO. % 2013
TOTAL NONFARM EMPLOYMENT…………… 126,600 129,300 -2,700 -2.1 126,000TOTAL PRIVATE………………………………… 92,800 94,200 -1,400 -1.5 91,900 GOODS PRODUCING INDUSTRIES………… 17,900 17,600 300 1.7 17,700 CONSTRUCTION, NAT. RES. & MINING.…… 3,700 3,400 300 8.8 3,600 MANUFACTURING…………………………… 14,200 14,200 0 0.0 14,100 Durable Goods………………………………… 11,000 10,600 400 3.8 10,900 Non-Durable Goods………………………… 3,200 3,600 -400 -11.1 3,200 SERVICE PROVIDING INDUSTRIES………… 108,700 111,700 -3,000 -2.7 108,300 TRADE, TRANSPORTATION, UTILITIES….. 22,700 23,000 -300 -1.3 22,500 Wholesale Trade……………………………… 2,700 2,700 0 0.0 2,700 Retail Trade…………………………………… 15,100 15,400 -300 -1.9 15,000 Transportation, Warehousing, & Utilities…… 4,900 4,900 0 0.0 4,800 INFORMATION………………………………… 1,400 1,400 0 0.0 1,400 FINANCIAL ACTIVITIES……………………… 3,100 3,100 0 0.0 3,100 PROFESSIONAL & BUSINESS SERVICES 8,900 9,100 -200 -2.2 8,800 EDUCATION AND HEALTH SERVICES…… 21,300 21,100 200 0.9 21,300 Health Care and Social Assistance………… 18,600 18,300 300 1.6 18,400 LEISURE AND HOSPITALITY………………… 14,200 15,600 -1,400 -9.0 13,800 Accommodation and Food Services………… 13,200 13,200 0 0.0 12,800 Food Serv., Restaurants, Drinking Places… 11,000 11,000 0 0.0 10,600 OTHER SERVICES…………………………… 3,300 3,300 0 0.0 3,300 GOVERNMENT ………………………………… 33,800 35,100 -1,300 -3.7 34,100 Federal………………………………………… 2,500 2,600 -100 -3.8 2,600 State & Local**………………………………… 31,300 32,500 -1,200 -3.7 31,500
Not Seasonally Adjusted
MAY MAY CHANGE APR 2013 2012 NO. % 2013
TOTAL NONFARM EMPLOYMENT…………… 62,900 63,300 -400 -0.6 62,500TOTAL PRIVATE………………………………… 52,900 53,200 -300 -0.6 52,500 GOODS PRODUCING INDUSTRIES………… 9,700 9,900 -200 -2.0 9,700 CONSTRUCTION, NAT. RES. & MINING.…… 2,200 2,300 -100 -4.3 2,100 MANUFACTURING…………………………… 7,500 7,600 -100 -1.3 7,600 SERVICE PROVIDING INDUSTRIES………… 53,200 53,400 -200 -0.4 52,800 TRADE, TRANSPORTATION, UTILITIES….. 12,400 12,300 100 0.8 12,200 Wholesale Trade……………………………… 2,100 2,100 0 0.0 2,100 Retail Trade…………………………………… 8,600 8,500 100 1.2 8,500 Transportation, Warehousing, & Utilities…… 1,700 1,700 0 0.0 1,600 INFORMATION………………………………… 600 600 0 0.0 600 FINANCIAL ACTIVITIES……………………… 2,000 2,000 0 0.0 2,000 PROFESSIONAL & BUSINESS SERVICES 4,400 4,500 -100 -2.2 4,400 EDUCATION AND HEALTH SERVICES…… 16,400 16,200 200 1.2 16,400 Health Care and Social Assistance………… 14,700 14,600 100 0.7 14,600 LEISURE AND HOSPITALITY………………… 5,100 5,300 -200 -3.8 4,900 OTHER SERVICES…………………………… 2,300 2,400 -100 -4.2 2,300 GOVERNMENT ………………………………… 10,000 10,100 -100 -1.0 10,000 Federal………………………………………… 400 500 -100 -20.0 400 State & Local…………………………………… 9,600 9,600 0 0.0 9,600
THE CONNECTICUT ECONOMIC DIGEST 17July 2013
NONFARM EMPLOYMENT ESTIMATES
NOTE: More industry detail data is available for the State and its nine labor market areas at: http://www.ctdol.state.ct.us/lmi/202/covered.htm. The data published there differ from the data in the preced-ing tables in that they are developed from a near-universe count of Connecticut employment covered bythe unemployment insurance (UI) program, while the data here is sample-based. The data drawn fromthe UI program does not contain estimates of employment not covered by unemployment insurance,and is lagged several months behind the current employment estimates presented here.
SMALLER LMAS
Current month’s data are preliminary. Prior months’ data have been revised. All data are benchmarked to March 2012. *Total excludes workers idled due to labor-management disputes.
SPRINGFIELD, MA-CTNECTA**
** New England City and Town Area
LMA
For further information on these nonfarm employment estimates contact Lincoln Dyer at (860) 263-6292.
Not Seasonally Adjusted
MAY MAY CHANGE APR 2013 2012 NO. % 2013
TOTAL NONFARM EMPLOYMENT ENFIELD LMA…………………………………… 45,300 45,100 200 0.4 46,200 TORRINGTON LMA……………………………… 36,500 35,900 600 1.7 35,700 WILLIMANTIC - DANIELSON LMA…………… 37,300 36,700 600 1.6 36,700
Not Seasonally Adjusted
MAY MAY CHANGE APR2013 2012 NO. % 2013
TOTAL NONFARM EMPLOYMENT…………… 285,500 287,600 -2,100 -0.7 283,700TOTAL PRIVATE………………………………… 236,500 238,900 -2,400 -1.0 234,800 GOODS PRODUCING INDUSTRIES………… 41,100 41,900 -800 -1.9 40,300 CONSTRUCTION, NAT. RES. & MINING.…… 10,300 10,300 0 0.0 9,600 MANUFACTURING…………………………… 30,800 31,600 -800 -2.5 30,700 Durable Goods………………………………… 20,800 21,100 -300 -1.4 20,700 Non-Durable Goods………………………… 10,000 10,500 -500 -4.8 10,000 SERVICE PROVIDING INDUSTRIES………… 244,400 245,700 -1,300 -0.5 243,400 TRADE, TRANSPORTATION, UTILITIES….. 58,200 57,400 800 1.4 57,100 Wholesale Trade……………………………… 10,800 11,200 -400 -3.6 10,700 Retail Trade…………………………………… 35,200 34,100 1,100 3.2 34,500 Transportation, Warehousing, & Utilities…… 12,200 12,100 100 0.8 11,900 INFORMATION………………………………… 3,700 3,900 -200 -5.1 3,700 FINANCIAL ACTIVITIES……………………… 14,800 15,000 -200 -1.3 14,700 Finance and Insurance……………………… 11,900 12,000 -100 -0.8 11,800 Insurance Carriers & Related Activities…… 7,400 7,500 -100 -1.3 7,400 PROFESSIONAL & BUSINESS SERVICES 24,200 24,300 -100 -0.4 24,200 EDUCATION AND HEALTH SERVICES…… 57,500 58,300 -800 -1.4 58,500 Educational Services………………………… 10,600 11,200 -600 -5.4 11,500 Health Care and Social Assistance………… 46,900 47,100 -200 -0.4 47,000 LEISURE AND HOSPITALITY………………… 27,800 28,800 -1,000 -3.5 27,200 OTHER SERVICES…………………………… 9,200 9,300 -100 -1.1 9,100 GOVERNMENT ………………………………… 49,000 48,700 300 0.6 48,900 Federal………………………………………… 5,700 6,000 -300 -5.0 5,700 State & Local…………………………………… 43,300 42,700 600 1.4 43,200

THE CONNECTICUT ECONOMIC DIGEST18 July 2013
LABOR FORCE ESTIMATES
Current month’s data are preliminary. Prior months’ data have been revised. All data are benchmarked to March 2012.
EMPLOYMENT MAY MAY CHANGE APR(Not seasonally adjusted) STATUS 2013 2012 NO. % 2013
CONNECTICUT Civilian Labor Force 1,862,300 1,886,400 -24,100 -1.3 1,832,100Employed 1,711,500 1,730,400 -18,900 -1.1 1,688,600
Unemployed 150,800 156,000 -5,200 -3.3 143,500Unemployment Rate 8.1 8.3 -0.2 --- 7.8
BRIDGEPORT - STAMFORD LMA Civilian Labor Force 476,500 481,000 -4,500 -0.9 465,800Employed 440,700 443,800 -3,100 -0.7 432,000
Unemployed 35,800 37,200 -1,400 -3.8 33,800Unemployment Rate 7.5 7.7 -0.2 --- 7.3
DANBURY LMA Civilian Labor Force 91,800 92,300 -500 -0.5 90,000Employed 86,000 86,200 -200 -0.2 84,500
Unemployed 5,800 6,100 -300 -4.9 5,600Unemployment Rate 6.4 6.6 -0.2 --- 6.2
ENFIELD LMA Civilian Labor Force 48,800 49,900 -1,100 -2.2 48,300Employed 45,000 46,000 -1,000 -2.2 44,500
Unemployed 3,800 3,900 -100 -2.6 3,800Unemployment Rate 7.8 7.8 0.0 --- 7.8
HARTFORD LMA Civilian Labor Force 587,800 593,600 -5,800 -1.0 582,800Employed 540,000 544,200 -4,200 -0.8 537,200
Unemployed 47,800 49,400 -1,600 -3.2 45,600Unemployment Rate 8.1 8.3 -0.2 --- 7.8
NEW HAVEN LMA Civilian Labor Force 312,300 317,700 -5,400 -1.7 306,600Employed 285,900 290,500 -4,600 -1.6 281,700
Unemployed 26,300 27,200 -900 -3.3 24,900Unemployment Rate 8.4 8.6 -0.2 --- 8.1
NORWICH - NEW LONDON LMA Civilian Labor Force 145,200 149,900 -4,700 -3.1 142,900Employed 133,100 137,200 -4,100 -3.0 131,400
Unemployed 12,200 12,700 -500 -3.9 11,500Unemployment Rate 8.4 8.5 -0.1 --- 8.1
TORRINGTON LMA Civilian Labor Force 54,100 54,700 -600 -1.1 52,800Employed 50,200 50,600 -400 -0.8 49,000
Unemployed 3,900 4,100 -200 -4.9 3,900Unemployment Rate 7.3 7.6 -0.3 --- 7.3
WATERBURY LMA Civilian Labor Force 99,800 101,400 -1,600 -1.6 98,100Employed 89,000 90,400 -1,400 -1.5 87,800
Unemployed 10,800 10,900 -100 -0.9 10,400Unemployment Rate 10.8 10.8 0.0 --- 10.6
WILLIMANTIC-DANIELSON LMA Civilian Labor Force 57,600 58,000 -400 -0.7 56,500Employed 52,400 52,500 -100 -0.2 51,500
Unemployed 5,300 5,500 -200 -3.6 5,000Unemployment Rate 9.2 9.5 -0.3 --- 8.9
UNITED STATES Civilian Labor Force 155,734,000 154,998,000 736,000 0.5 154,739,000Employed 144,432,000 142,727,000 1,705,000 1.2 143,724,000
Unemployed 11,302,000 12,271,000 -969,000 -7.9 11,014,000Unemployment Rate 7.3 7.9 -0.6 --- 7.1
LMA

THE CONNECTICUT ECONOMIC DIGEST 19July 2013
HOURS AND EARNINGS
Current month’s data are preliminary. Prior months’ data have been revised. All data are benchmarked to March 2012.
BUSINESS AND EMPLOYMENT CHANGES ANNOUNCED IN THE NEWS MEDIA
In May 2013, NewOak Capital announced it will expand in Danbury and create 100 jobs over thenext three years. Also, Cannondale Sports Unlimited plans to create a new headquarters inWilton and add 75 jobs over the next four years. Wing It On will open a new restaurant inWatertown this summer, adding 12 jobs.
In May, ESPN cut 100 jobs at its Bristol location to manage costs. Lebon Press, a commercialprinter in Hartford, closed and 20 people lost jobs. In June, First Student, a transportation serviceprovider, will end its contract with both Trumbull and Shelton schools, affecting 104 and 70 jobs,respectively. Also in June, Carter’s, a children’s clothing company, will close its office in Sheltonand 95 jobs will be cut.
Business & Employment Changes Announced in the News Media lists start-ups, expansions, staff reductions, and layoffs reportedby the media, both current and future. The report provides company name, the number of workers involved, date of the action, theprincipal product or service of the company, a brief synopsis of the action, and the source and date of the media article. Thispublication is available in both HTML and PDF formats at the Connecticut Department of Labor Web site, http://www.ctdol.state.ct.us/lmi/busemp.htm.
LMA
AVG WEEKLY EARNINGS AVG WEEKLY HOURS AVG HOURLY EARNINGSMAY CHG APR MAY CHG APR MAY CHG APR
(Not seasonally adjusted) 2013 2012 Y/Y 2013 2013 2012 Y/Y 2013 2013 2012 Y/Y 2013
PRODUCTION WORKERMANUFACTURING $883.31 $982.13 -$98.82 $903.31 40.5 40.5 0.0 40.8 $21.81 $24.25 -$2.44 $22.14 DURABLE GOODS 906.12 1,054.39 -148.27 925.60 41.3 41.3 0.0 41.6 21.94 25.53 -3.59 22.25 NON-DUR. GOODS 809.17 747.46 61.71 833.41 37.9 38.0 -0.1 38.3 21.35 19.67 1.68 21.76CONSTRUCTION 1,024.49 980.63 43.86 983.99 38.5 37.5 1.0 37.6 26.61 26.15 0.46 26.17
ALL EMPLOYEESSTATEWIDETOTAL PRIVATE 935.76 942.25 -6.49 943.49 33.6 33.7 -0.1 33.6 27.85 27.96 -0.11 28.08GOODS PRODUCING 1,180.87 1,176.80 4.07 1,178.30 39.6 38.8 0.8 39.7 29.82 30.33 -0.51 29.68 Construction 1,155.41 1,069.64 85.76 1,120.54 39.1 37.4 1.7 38.8 29.55 28.60 0.95 28.88 Manufacturing 1,187.63 1,208.79 -21.16 1,194.80 39.8 39.4 0.4 40.0 29.84 30.68 -0.84 29.87SERVICE PROVIDING 891.15 900.36 -9.21 901.23 32.5 32.8 -0.3 32.5 27.42 27.45 -0.03 27.73 Trade, Transp., Utilities 821.44 870.00 -48.56 836.06 34.0 34.8 -0.8 34.0 24.16 25.00 -0.84 24.59 Financial Activities 1,580.06 1,500.23 79.82 1,607.54 36.9 36.6 0.3 37.1 42.82 40.99 1.83 43.33 Prof. & Business Serv. 1,064.00 1,053.74 10.26 1,065.75 35.0 34.8 0.2 35.0 30.40 30.28 0.12 30.45 Education & Health Ser. 782.79 809.10 -26.31 792.20 31.1 31.0 0.1 31.3 25.17 26.10 -0.93 25.31 Leisure & Hospitality 401.65 391.64 10.00 400.66 26.2 25.8 0.4 26.0 15.33 15.18 0.15 15.41 Other Services 665.24 618.46 46.78 640.10 30.6 30.8 -0.2 29.8 21.74 20.08 1.66 21.48
LABOR MARKET AREAS: TOTAL PRIVATE Bridgeport-Stamford 1,050.49 1,069.72 -19.23 1,062.36 34.9 34.1 0.8 34.9 30.10 31.37 -1.27 30.44 Danbury 943.72 906.69 37.03 932.50 32.7 33.2 -0.5 32.3 28.86 27.31 1.55 28.87 Hartford 969.74 1,010.45 -40.71 976.86 34.4 35.0 -0.6 34.3 28.19 28.87 -0.68 28.48 New Haven 877.81 876.48 1.33 889.34 33.2 33.2 0.0 33.7 26.44 26.40 0.04 26.39 Norwich-New London 869.13 761.22 107.91 865.64 33.3 31.3 2.0 33.5 26.10 24.32 1.78 25.84 Waterbury 788.17 773.89 14.28 787.63 33.2 33.3 -0.1 32.9 23.74 23.24 0.50 23.94
THE CONNECTICUT ECONOMIC DIGEST20 July 2013
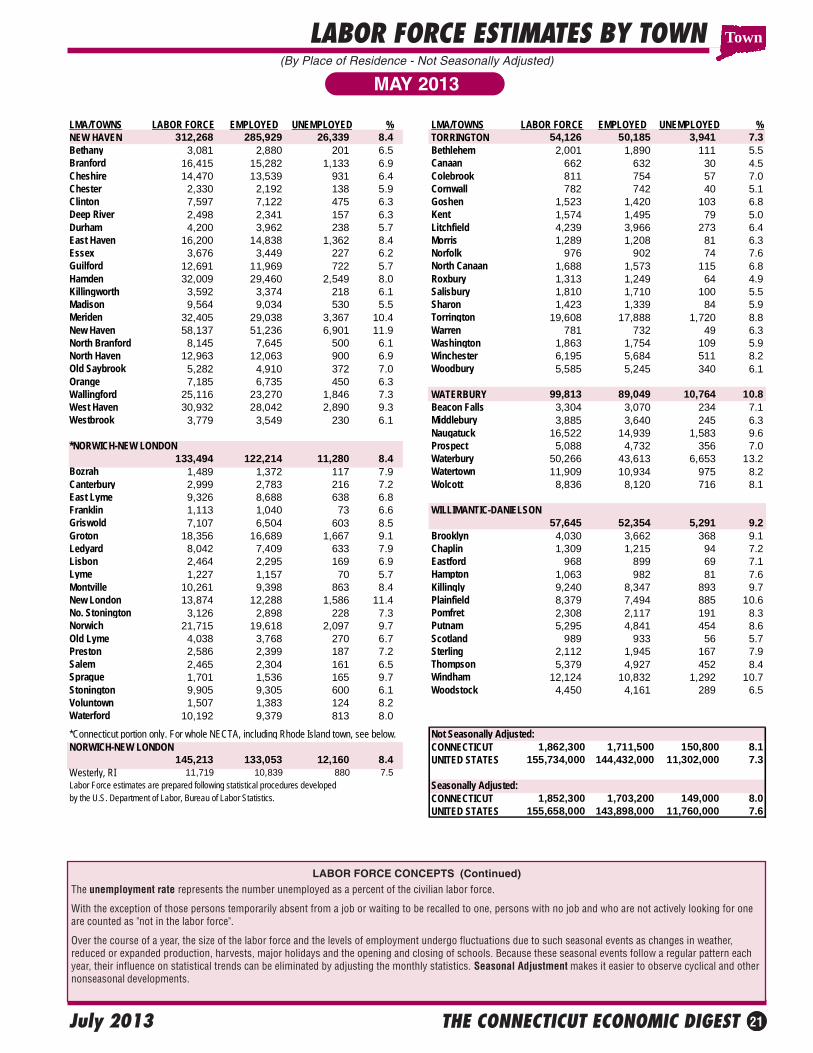
LABOR FORCE ESTIMATES BY TOWN
MAY 2013(By Place of Residence - Not Seasonally Adjusted)
The civilian labor force comprises all state residents age 16 years and older classified as employed or unemployed in accordance with criteria described below.Excluded are members of the military and persons in institutions (correctional and mental health, for example).
The employed are all persons who did any work as paid employees or in their own business during the survey week, or who have worked 15 hours or more asunpaid workers in an enterprise operated by a family member. Persons temporarily absent from a job because of illness, bad weather, strike or for personalreasons are also counted as employed whether they were paid by their employer or were seeking other jobs.
The unemployed are all persons who did not work, but were available for work during the survey week (except for temporary illness) and made specific efforts tofind a job in the prior four weeks. Persons waiting to be recalled to a job from which they had been laid off need not be looking for work to be classified asunemployed.
LABOR FORCE CONCEPTS
Town
LMA/TOWNS LABOR FORCE EMPLOYED UNEMPLOYED % LMA/TOWNS LABOR FORCE EMPLOYED UNEMPLOYED %BRIDGEPORT-STAMFORD HARTFORD cont…
476,495 440,704 35,791 7.5 Canton 5,746 5,418 328 5.7Ansonia 10,227 9,228 999 9.8 Colchester 8,913 8,330 583 6.5Bridgeport 66,269 58,306 7,963 12.0 Columbia 3,083 2,872 211 6.8Darien 9,277 8,745 532 5.7 Coventry 7,029 6,524 505 7.2Derby 6,994 6,405 589 8.4 Cromwell 7,895 7,389 506 6.4Easton 3,736 3,523 213 5.7 East Granby 2,897 2,730 167 5.8Fairfield 29,099 27,065 2,034 7.0 East Haddam 5,227 4,892 335 6.4Greenwich 29,635 27,867 1,768 6.0 East Hampton 7,135 6,612 523 7.3Milford 30,060 27,831 2,229 7.4 East Hartford 26,527 23,707 2,820 10.6Monroe 10,510 9,834 676 6.4 Ellington 9,266 8,669 597 6.4New Canaan 8,798 8,269 529 6.0 Farmington 12,823 12,023 800 6.2Newtown 14,501 13,639 862 5.9 Glastonbury 18,498 17,453 1,045 5.6Norwalk 49,079 45,758 3,321 6.8 Granby 6,223 5,861 362 5.8Oxford 7,328 6,877 451 6.2 Haddam 5,114 4,817 297 5.8Redding 4,808 4,526 282 5.9 Hartford 49,884 42,280 7,604 15.2Ridgefield 11,906 11,225 681 5.7 Hartland 1,175 1,123 52 4.4Seymour 9,265 8,552 713 7.7 Harwinton 3,109 2,908 201 6.5Shelton 22,554 20,967 1,587 7.0 Hebron 5,567 5,291 276 5.0Southbury 9,023 8,427 596 6.6 Lebanon 4,210 3,920 290 6.9Stamford 67,726 63,283 4,443 6.6 Manchester 32,905 30,403 2,502 7.6Stratford 27,043 24,687 2,356 8.7 Mansfield 13,803 12,805 998 7.2Trumbull 18,199 17,058 1,141 6.3 Marlborough 3,571 3,376 195 5.5Weston 4,871 4,579 292 6.0 Middlefield 2,403 2,259 144 6.0Westport 12,531 11,779 752 6.0 Middletown 26,297 24,227 2,070 7.9Wilton 8,380 7,871 509 6.1 New Britain 35,569 31,566 4,003 11.3Woodbridge 4,675 4,402 273 5.8 New Hartford 3,870 3,568 302 7.8
Newington 16,824 15,656 1,168 6.9DANBURY 91,821 85,986 5,835 6.4 Plainville 10,145 9,353 792 7.8Bethel 10,885 10,182 703 6.5 Plymouth 6,781 6,181 600 8.8Bridgewater 931 882 49 5.3 Portland 5,241 4,881 360 6.9Brookfield 9,129 8,574 555 6.1 Rocky Hill 10,946 10,301 645 5.9Danbury 45,557 42,663 2,894 6.4 Simsbury 11,756 11,070 686 5.8New Fairfield 7,459 6,998 461 6.2 Southington 24,180 22,557 1,623 6.7New Milford 15,962 14,915 1,047 6.6 South Windsor 14,315 13,435 880 6.1Sherman 1,899 1,772 127 6.7 Stafford 6,894 6,327 567 8.2
Thomaston 4,524 4,158 366 8.1ENFIELD 48,836 45,030 3,806 7.8 Tolland 8,409 7,896 513 6.1East Windsor 6,394 5,885 509 8.0 Union 524 495 29 5.5Enfield 23,100 21,225 1,875 8.1 Vernon 16,797 15,497 1,300 7.7Somers 4,852 4,453 399 8.2 West Hartford 29,840 27,795 2,045 6.9Suffield 7,571 7,078 493 6.5 Wethersfield 13,436 12,432 1,004 7.5Windsor Locks 6,918 6,388 530 7.7 Willington 3,716 3,497 219 5.9
Windsor 16,119 14,825 1,294 8.0HARTFORD 587,807 540,024 47,783 8.1Andover 1,989 1,873 116 5.8Ashford 2,493 2,329 164 6.6Avon 9,387 8,887 500 5.3Barkhamsted 2,228 2,073 155 7.0Berlin 10,961 10,223 738 6.7Bloomfield 10,008 9,000 1,008 10.1Bolton 2,897 2,707 190 6.6Bristol 33,347 30,543 2,804 8.4Burlington 5,311 5,010 301 5.7
All Labor Market Areas(LMAs) in Connecticut except three are federally-designated areas for developing labor statistics. For the sake of simplicity, the federal Bridgeport-Stamford-Norwalk NECTA is referred to in Connecticut DOL publications as the 'Bridgeport-Stamford LMA', and the Hartford-West Hartford-East Hartford NECTA is referred to as the 'Hartford LMA'. The Bureau of Labor Statistics has identified 17 towns in the northwest part of the State as a separate area for reporting labor force data. For the convenience of our data users, these towns are included in the Torrington LMA. For the same purpuse, five towns which are part of the Springfield, MA area are published as the 'Enfield LMA'. Similarly the towns of Putnam, Thompson and Woodstock (part of the Worcester, MA area), plus four towns estimated separately are included in the Willimantic-Danielson LMA.
THE CONNECTICUT ECONOMIC DIGEST 21July 2013
LABOR FORCE ESTIMATES BY TOWN
The unemployment rate represents the number unemployed as a percent of the civilian labor force.
With the exception of those persons temporarily absent from a job or waiting to be recalled to one, persons with no job and who are not actively looking for oneare counted as "not in the labor force".
Over the course of a year, the size of the labor force and the levels of employment undergo fluctuations due to such seasonal events as changes in weather,reduced or expanded production, harvests, major holidays and the opening and closing of schools. Because these seasonal events follow a regular pattern eachyear, their influence on statistical trends can be eliminated by adjusting the monthly statistics. Seasonal Adjustment makes it easier to observe cyclical and othernonseasonal developments.
(By Place of Residence - Not Seasonally Adjusted)
MAY 2013
LABOR FORCE CONCEPTS (Continued)
Town
LMA/TOWNS LABOR FORCE EMPLOYED UNEMPLOYED % LMA/TOWNS LABOR FORCE EMPLOYED UNEMPLOYED %NEW HAVEN 312,268 285,929 26,339 8.4 TORRINGTON 54,126 50,185 3,941 7.3Bethany 3,081 2,880 201 6.5 Bethlehem 2,001 1,890 111 5.5Branford 16,415 15,282 1,133 6.9 Canaan 662 632 30 4.5Cheshire 14,470 13,539 931 6.4 Colebrook 811 754 57 7.0Chester 2,330 2,192 138 5.9 Cornwall 782 742 40 5.1Clinton 7,597 7,122 475 6.3 Goshen 1,523 1,420 103 6.8Deep River 2,498 2,341 157 6.3 Kent 1,574 1,495 79 5.0Durham 4,200 3,962 238 5.7 Litchfield 4,239 3,966 273 6.4East Haven 16,200 14,838 1,362 8.4 Morris 1,289 1,208 81 6.3Essex 3,676 3,449 227 6.2 Norfolk 976 902 74 7.6Guilford 12,691 11,969 722 5.7 North Canaan 1,688 1,573 115 6.8Hamden 32,009 29,460 2,549 8.0 Roxbury 1,313 1,249 64 4.9Killingworth 3,592 3,374 218 6.1 Salisbury 1,810 1,710 100 5.5Madison 9,564 9,034 530 5.5 Sharon 1,423 1,339 84 5.9Meriden 32,405 29,038 3,367 10.4 Torrington 19,608 17,888 1,720 8.8New Haven 58,137 51,236 6,901 11.9 Warren 781 732 49 6.3North Branford 8,145 7,645 500 6.1 Washington 1,863 1,754 109 5.9North Haven 12,963 12,063 900 6.9 Winchester 6,195 5,684 511 8.2Old Saybrook 5,282 4,910 372 7.0 Woodbury 5,585 5,245 340 6.1Orange 7,185 6,735 450 6.3Wallingford 25,116 23,270 1,846 7.3 WATERBURY 99,813 89,049 10,764 10.8West Haven 30,932 28,042 2,890 9.3 Beacon Falls 3,304 3,070 234 7.1Westbrook 3,779 3,549 230 6.1 Middlebury 3,885 3,640 245 6.3
Naugatuck 16,522 14,939 1,583 9.6*NORWICH-NEW LONDON Prospect 5,088 4,732 356 7.0
133,494 122,214 11,280 8.4 Waterbury 50,266 43,613 6,653 13.2Bozrah 1,489 1,372 117 7.9 Watertown 11,909 10,934 975 8.2Canterbury 2,999 2,783 216 7.2 Wolcott 8,836 8,120 716 8.1East Lyme 9,326 8,688 638 6.8Franklin 1,113 1,040 73 6.6 WILLIMANTIC-DANIELSONGriswold 7,107 6,504 603 8.5 57,645 52,354 5,291 9.2Groton 18,356 16,689 1,667 9.1 Brooklyn 4,030 3,662 368 9.1Ledyard 8,042 7,409 633 7.9 Chaplin 1,309 1,215 94 7.2Lisbon 2,464 2,295 169 6.9 Eastford 968 899 69 7.1Lyme 1,227 1,157 70 5.7 Hampton 1,063 982 81 7.6Montville 10,261 9,398 863 8.4 Killingly 9,240 8,347 893 9.7New London 13,874 12,288 1,586 11.4 Plainfield 8,379 7,494 885 10.6No. Stonington 3,126 2,898 228 7.3 Pomfret 2,308 2,117 191 8.3Norwich 21,715 19,618 2,097 9.7 Putnam 5,295 4,841 454 8.6Old Lyme 4,038 3,768 270 6.7 Scotland 989 933 56 5.7Preston 2,586 2,399 187 7.2 Sterling 2,112 1,945 167 7.9Salem 2,465 2,304 161 6.5 Thompson 5,379 4,927 452 8.4Sprague 1,701 1,536 165 9.7 Windham 12,124 10,832 1,292 10.7Stonington 9,905 9,305 600 6.1 Woodstock 4,450 4,161 289 6.5Voluntown 1,507 1,383 124 8.2Waterford 10,192 9,379 813 8.0
*Connecticut portion only. For whole NECTA, including Rhode Island town, see below. Not Seasonally Adjusted:NORWICH-NEW LONDON CONNECTICUT 1,862,300 1,711,500 150,800 8.1
145,213 133,053 12,160 8.4 UNITED STATES 155,734,000 144,432,000 11,302,000 7.3Westerly, RI 11,719 10,839 880 7.5Labor Force estimates are prepared following statistical procedures developed Seasonally Adjusted:by the U.S. Department of Labor, Bureau of Labor Statistics. CONNECTICUT 1,852,300 1,703,200 149,000 8.0
UNITED STATES 155,658,000 143,898,000 11,760,000 7.6
THE CONNECTICUT ECONOMIC DIGEST22 July 2013
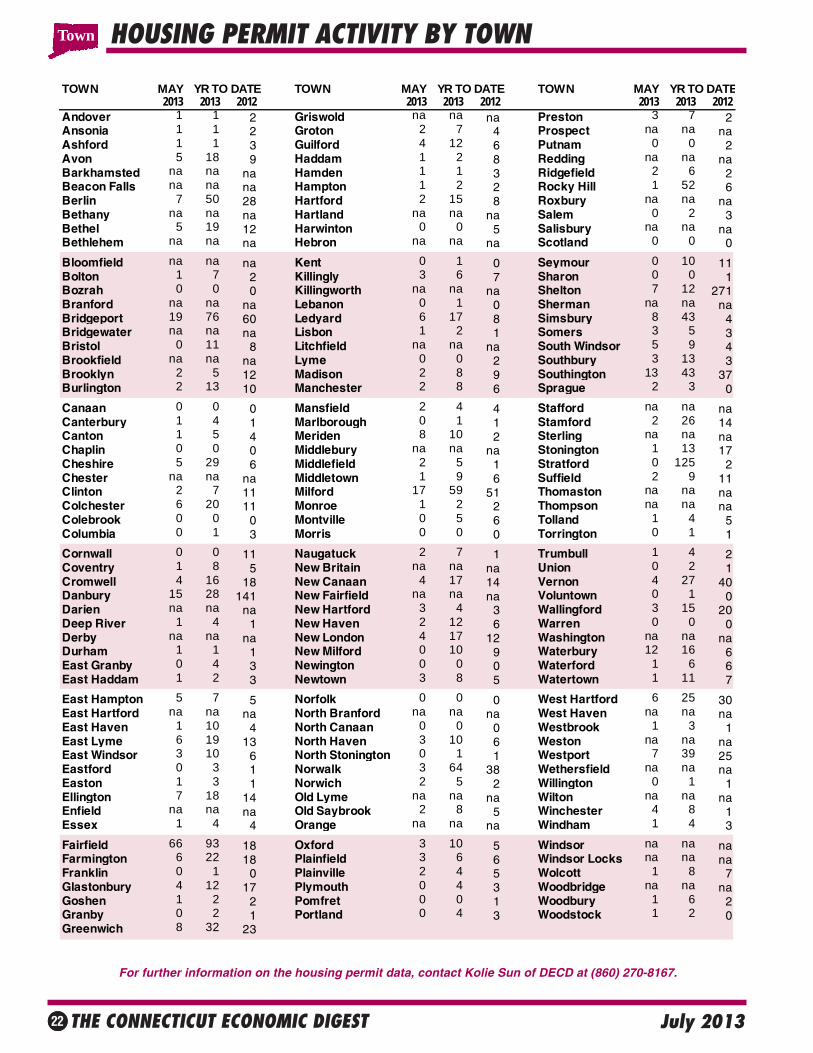
HOUSING PERMIT ACTIVITY BY TOWN
For further information on the housing permit data, contact Kolie Sun of DECD at (860) 270-8167.
TOWN MAY YR TO DATE TOWN MAY YR TO DATE TOWN MAY YR TO DATE2013 2013 2012 2013 2013 2012 2013 2013 2012
Andover 1 1 2 Griswold na na na Preston 3 7 2Ansonia 1 1 2 Groton 2 7 4 Prospect na na naAshford 1 1 3 Guilford 4 12 6 Putnam 0 0 2Avon 5 18 9 Haddam 1 2 8 Redding na na naBarkhamsted na na na Hamden 1 1 3 Ridgefield 2 6 2Beacon Falls na na na Hampton 1 2 2 Rocky Hill 1 52 6Berlin 7 50 28 Hartford 2 15 8 Roxbury na na naBethany na na na Hartland na na na Salem 0 2 3Bethel 5 19 12 Harwinton 0 0 5 Salisbury na na naBethlehem na na na Hebron na na na Scotland 0 0 0
Bloomfield na na na Kent 0 1 0 Seymour 0 10 11Bolton 1 7 2 Killingly 3 6 7 Sharon 0 0 1Bozrah 0 0 0 Killingworth na na na Shelton 7 12 271Branford na na na Lebanon 0 1 0 Sherman na na naBridgeport 19 76 60 Ledyard 6 17 8 Simsbury 8 43 4Bridgewater na na na Lisbon 1 2 1 Somers 3 5 3Bristol 0 11 8 Litchfield na na na South Windsor 5 9 4Brookfield na na na Lyme 0 0 2 Southbury 3 13 3Brooklyn 2 5 12 Madison 2 8 9 Southington 13 43 37Burlington 2 13 10 Manchester 2 8 6 Sprague 2 3 0
Canaan 0 0 0 Mansfield 2 4 4 Stafford na na naCanterbury 1 4 1 Marlborough 0 1 1 Stamford 2 26 14Canton 1 5 4 Meriden 8 10 2 Sterling na na naChaplin 0 0 0 Middlebury na na na Stonington 1 13 17Cheshire 5 29 6 Middlefield 2 5 1 Stratford 0 125 2Chester na na na Middletown 1 9 6 Suffield 2 9 11Clinton 2 7 11 Milford 17 59 51 Thomaston na na naColchester 6 20 11 Monroe 1 2 2 Thompson na na naColebrook 0 0 0 Montville 0 5 6 Tolland 1 4 5Columbia 0 1 3 Morris 0 0 0 Torrington 0 1 1
Cornwall 0 0 11 Naugatuck 2 7 1 Trumbull 1 4 2Coventry 1 8 5 New Britain na na na Union 0 2 1Cromwell 4 16 18 New Canaan 4 17 14 Vernon 4 27 40Danbury 15 28 141 New Fairfield na na na Voluntown 0 1 0Darien na na na New Hartford 3 4 3 Wallingford 3 15 20Deep River 1 4 1 New Haven 2 12 6 Warren 0 0 0Derby na na na New London 4 17 12 Washington na na naDurham 1 1 1 New Milford 0 10 9 Waterbury 12 16 6East Granby 0 4 3 Newington 0 0 0 Waterford 1 6 6East Haddam 1 2 3 Newtown 3 8 5 Watertown 1 11 7
East Hampton 5 7 5 Norfolk 0 0 0 West Hartford 6 25 30East Hartford na na na North Branford na na na West Haven na na naEast Haven 1 10 4 North Canaan 0 0 0 Westbrook 1 3 1East Lyme 6 19 13 North Haven 3 10 6 Weston na na naEast Windsor 3 10 6 North Stonington 0 1 1 Westport 7 39 25Eastford 0 3 1 Norwalk 3 64 38 Wethersfield na na naEaston 1 3 1 Norwich 2 5 2 Willington 0 1 1Ellington 7 18 14 Old Lyme na na na Wilton na na naEnfield na na na Old Saybrook 2 8 5 Winchester 4 8 1Essex 1 4 4 Orange na na na Windham 1 4 3
Fairfield 66 93 18 Oxford 3 10 5 Windsor na na naFarmington 6 22 18 Plainfield 3 6 6 Windsor Locks na na naFranklin 0 1 0 Plainville 2 4 5 Wolcott 1 8 7Glastonbury 4 12 17 Plymouth 0 4 3 Woodbridge na na naGoshen 1 2 2 Pomfret 0 0 1 Woodbury 1 6 2Granby 0 2 1 Portland 0 4 3 Woodstock 1 2 0Greenwich 8 32 23
Town
THE CONNECTICUT ECONOMIC DIGEST 23July 2013
TECHNICAL NOTESBUSINESS STARTS AND TERMINATIONSRegistrations and terminations of business entities as recorded with the Secretary of the State and the ConnecticutDepartment of Labor (DOL) are an indication of new business formation and activity. DOL business starts include newemployers which have become liable for unemployment insurance taxes during the quarter, as well as new establish-ments opened by existing employers. DOL business terminations are those accounts discontinued due to inactivity (noemployees) or business closure, and accounts for individual business establishments that are closed by still activeemployers. The Secretary of the State registrations include limited liability companies, limited liability partnerships, andforeign-owned (out-of-state) and domestic-owned (in-state) corporations.
CONSUMER PRICE INDEXThe Consumer Price Index (CPI), computed and published by the U.S. Bureau of Labor Statistics, is a measure of theaverage change in prices over time in a fixed market basket of goods and services. It is based on prices of food, clothing,shelter, fuels, transportation fares, charges for doctors’ and dentists’ services, drugs and other goods and services thatpeople buy for their day-to-day living. The Northeast region is comprised of the New England states, New York, NewJersey and Pennsylvania.
EMPLOYMENT COST INDEXThe Employment Cost Index (ECI) covers both wages and salaries and employer costs for employee benefits for alloccupations and establishments in both the private nonfarm sector and state and local government. The ECI measuresemployers’ labor costs free from the influences of employment shifts among industries and occupations. The base periodfor all data is June 1989 when the ECI is 100.
HOURS AND EARNINGS ESTIMATESProduction worker earnings and hours estimates include full- and part-time employees working within manufacturingindustries. Hours worked and earnings data are computed based on payroll figures for the week including the 12th of themonth. Average hourly earnings are affected by such factors as premium pay for overtime and shift differential as well aschanges in basic hourly and incentive rates of pay. Average weekly earnings are the product of weekly hours worked andhourly earnings. These data are developed in cooperation with the U.S. Department of Labor, Bureau of Labor Statistics.
INDIAN GAMING DATAIndian Gaming Payments are amounts received by the State as a result of the slot compact with the two Federallyrecognized tribes in Connecticut, which calls for 25 percent of net slot receipts to be remitted to the State. IndianGaming Slots are the total net revenues from slot machines only received by the two Federally recognized Indian tribes.
INITIAL CLAIMSAverage weekly initial claims are calculated by dividing the total number of new claims for unemployment insurancereceived in the month by the number of weeks in the month. A minor change in methodology took effect with datapublished in the March 1997 issue of the DIGEST. Data have been revised back to January 1980.
INSURED UNEMPLOYMENT RATEPrimarily a measure of unemployment insurance program activity, the insured unemployment rate is the 13-weekaverage of the number of people claiming unemployment benefits divided by the number of workers covered by theunemployment insurance system.
LABOR FORCE ESTIMATESLabor force estimates are a measure of the work status of people who live in Connecticut. Prepared under the direction ofthe U.S. Bureau of Labor Statistics, the statewide estimates are the product of a signal-plus noise model, which usesresults from the Current Population Survey (CPS), a monthly survey of Connecticut households, counts of claimants forunemployment benefits, and establishment employment estimates. Beginning with the publication of January 2005 data,an improved methodology is being used to develop labor force estimates, by which monthly state model-based employ-ment and unemployment estimates are controlled to add to the national CPS levels. This will ensure that nationaleconomic events are reflected in the state estimates, and it will significantly reduce end-of-year revisions. (For moreinformation, please see the Connecticut Economic Digest, December 2004 issue.) Labor force data, reflecting personsemployed by place of residence, are not directly comparable to the place-of-work industry employment series. In thelabor force estimates, workers involved in labor disputes are counted as employed. The labor force data also includesagricultural workers, unpaid family workers, domestics and the self-employed. Because of these conceptual differences,total labor force employment is almost always different from nonfarm wage and salary employment.
LABOR MARKET AREASAll Labor Market Areas (LMAs) in Connecticut except three are federally-designated areas for developing labor statistics.For the sake of simplicity, the federal Bridgeport-Norwalk-Stamford Metropolitan Statistical Area (MSA) is referred to inConnecticut Department of Labor publications as the Bridgeport-Stamford LMA, and the Hartford-West Hartford-EastHartford MSA is called the Hartford LMA. The Bureau of Labor Statistics has identified the 17 towns in the in the north-western part of the state as a separate area for reporting labor force data. For the convenience of our data users, data forthese towns are included in the Torrington LMA. For the same purpose, data for the towns of East Windsor, Enfield,Somers, Suffield and Windsor Locks, which are officially part of the Springfield MSA, are published as the Enfield LMA.Similarly, the towns of Putnam, Thompson and Woodstock - part of the Worcester MSA - are included in the Willimantic-Danielson LMA. Also, data for Westerly, Rhode Island are included in the Norwich-New London LMA. Industry employ-ment and labor force data estimates contained in Connecticut Department of Labor publications are prepared followingthe same statistical procedures developed by the U.S. Department of Labor, Bureau of Labor Statistics, whether forfederally designated or state-determined areas.
NONFARM EMPLOYMENT ESTIMATESNonfarm employment estimates are derived from a survey of businesses to measure jobs by industry. The estimatesinclude all full- and part-time wage and salary employees who worked during or received pay for the pay period whichincludes the 12th of the month. Excluded from these estimates are proprietors, self-employed workers, private householdemployees and unpaid family workers. In some cases, due to space constraints, all industry estimates are not shown.Call (860) 263-6275 for a more comprehensive breakout of nonfarm employment estimates. These data are developed incooperation with the U.S. Department of Labor, Bureau of Labor Statistics.
UI COVERED WAGESUI covered wages is the total amount paid to those employees who are covered under the Connecticut’s UnemploymentInsurance (UI) law for services performed during the quarter. The fluctuations in the 1992-93 period reflect the effect ofthe changes in the tax law and the massive restructuring in the state’s economy.

ECONOMIC INDICATORS AT A GLANCE
Leading General Drift Indicator ..... +2.3Coincident General Drift Indicator .. 0.0Farmington Bank Bus. Barometer +0.6Phil. Fed’s CT Coincident Index .... +2.8
Total Nonfarm Employment........... +0.8
Unemployment Rate ..................... -0.4* Labor Force .................................... -1.6 Employed ........................................ -1.3 Unemployed .................................... -5.6
Average Weekly Initial Claims ........ -7.2Avg Insured Unempl. Rate ........... -0.03*U-6 Unemployment Rate................. 0.0*
Prod. Worker Avg Wkly Hrs, Mfg ...... 0.0PW Avg Hourly Earnings, Mfg ...... -10.1PW Avg Weekly Earnings, Mfg ..... -10.1CT Mfg. Production Index ............... -2.4 Production Worker Hours ................ -6.5 Industrial Electricity Sales ............... -3.7
Personal Income ............................ +2.1UI Covered Wages .......................... +1.6
Business Activity New Housing Permits ................... +36.3 Electricity Sales ............................. +9.7 Construction Contracts Index ....... +47.2 New Auto Registrations ................ +18.5 Air Cargo Tons ................................ -4.3 Exports .......................................... +5.4 S&P 500: Monthly Close .............. +24.5
Business Starts Secretary of the State ..................... -0.7 Dept. of Labor ................................. -7.7
Business Terminations Secretary of the State ................... -11.3 Dept. of Labor ............................... -22.4
State Revenues ............................... -1.8 Corporate Tax ............................... +22.9 Personal Income Tax ........................ -7.7 Real Estate Conveyance Tax ......... +19.0 Sales & Use Tax .............................. +4.3 Indian Gaming Payments ................. -8.2
Tourism and Travel Info Center Visitors ........................ -20.6 Attraction Visitors ........................... +1.2 Air Passenger Count ...................... +0.8 Indian Gaming Slots ........................ -3.8 Travel and Tourism Index ................. -3.7
Employment Cost Index (U.S.) Total ............................................... +1.7 Wages & Salaries........................... +1.7 Benefit Costs ................................. +1.5
Consumer Prices U.S. City Average ........................... +1.4 Northeast Region ........................... +1.2 NY-NJ-Long Island ......................... +1.4 Boston-Brockton-Nashua ............... +1.4
Interest Rates Prime ............................................ 0.00* Conventional Mortgage ................ -0.26*
Mailing address:
Connecticut Economic DigestConnecticut Department of Labor
Office of Research200 Folly Brook Boulevard
Wethersfield, CT 06109-1114
THE CONNECTICUT ECONOMIC DIGEST
*Percentage point change; **Less than 0.05 percent; NA = Not Available
The Connecticut Economic Digest is available on the internet at:
http://www.ctdol.state.ct.us/lmi
July 2013
(Percent change from prior year; see pages 4-8 for reference months or quarters)
THE CONNECTICUT
A joint publication of The Connecticut Departments of Labor and Economic and Community Development
ECONOMIC DIGEST
If you wish to have your name removed from our mailing list, pleasecheck here and return this page (or a photocopy) to the address at left.
If your address has changed, please check here, make the necessarychanges to your address label and return this page to the address at left.
If you receive more than one copy of this publication, please checkhere and return this page from the duplicate copy to the address at left.
NEED A COPY OF THE CONNECTICUT ECONOMIC DIGEST?
To receive a staple-bound, color copy of the Digest each month, orfor further information, please call the Office of Research at (860)263-6290, or send an e-mail to [email protected].