Embed Size (px)
Citation preview

The conceptual design of an integrated energy efficient ore reduction plant
AA du Toit
11098554
Dissertation submitted in fulfilment of the requirements for the degree Magister in Mechanical Engineering at the Potchefstroom Campus of the North-West University
Supervisor: Prof M Kleingeld
May 2014
The conceptual design of an integrated energy efficient ore reduction plant ii
ABSTRACT
Title: The conceptual design of an integrated energy efficient ore reduction plant.
Author: A.A. du Toit
Supervisor: Prof. M. Kleingeld
Keywords: Energy efficiency, pyrometallurgical ore reduction plant, energy conservation,
energy efficiency, heat recovery
This study explores ways to determine the energy efficiency of a pyrometallurgical ore
reduction plant and measures to improve it. The feasibility of building a commercial plant -
that is more energy efficient, has a low energy cost, and can operate independently and
cost-effectively of external electricity supply - is determined. The need for energy efficiency
is expanded to three questions: how should the energy efficiency of the plant be determined,
what is the efficiency of the existing plant and to what level it can be improved.
Literature and other relevant sources were consulted. Twenty potential energy conservation
measures were identified through a literature study. A multi-criteria decision-making
approach resulted in the selection of ten measures for conceptual implementation. The
measures ranged from high-efficiency motors, solar power, heat recovery with thermal oil
and various heat engines, to pressure recovery with turbo-generators.
A case study approach was followed with the energy efficiency of an existing prototype plant
the subject being studied. The energy usage of the existing plant and feasible measures to
improve the performance were empirically observed. The impact of these measures was
modelled and the results of the conceptual implementation determined. Two measures that
were implemented during the study are also described and the results reported.
The study found that the energy efficiency of the plant could be determined by the ratio of
product exergy to input energy. By incorporating a number of energy conservation measures
conceptually the internal efficiency of the prototype plant was conceptually improved from
the current 17% to 22% and as a result externally supplied electricity reduced by 47%. The
results were extrapolated to a future commercial plant and energy efficiencies of 26% on-
grid and 21% off-grid predicted.
This study suggests that a significant improvement in energy efficiency and energy cost can
be achieved by integrating appropriate energy conservation measures into the existing and
future plants.

The conceptual design of an integrated energy efficient ore reduction plant iii
ACKNOWLEDGEMENT
We live by grace alone.
My wife, my children and mother, and especially my father, Dr C.M. Toit. He raised
the bar.
My supervisor and North-West University
AlloyStream and colleagues
Johan Groenewald and Johan Nel (from Hatch) for the ranking of criteria
Stephan du Plessis for his through-the-night vigil
Stella Gleimius and Murray Duigan for the review of the system utility function
Dr Theresa Coetsee and Jacques Muller for the Letaba campaign 1 report
Marike van Rensburg and Sumanda Maritz for formatting and editing
The conceptual design of an integrated energy efficient ore reduction plant iv
CONTENTS
Abstract ................................................................................................................................ i
Acknowledgement ............................................................................................................. iii
Contents ............................................................................................................................. iv
List of Figures .................................................................................................................... vi
List of Tables ..................................................................................................................... vii
List of Abbreviations ....................................................................................................... viii
Nomenclature ..................................................................................................................... ix
List of Compounds ............................................................................................................. x
Chapter 1 ............................................................................................................................. 1
1 Introduction ............................................................................................................. 2
1.1 Background ..................................................................................................... 2
1.2 The need ......................................................................................................... 3
1.3 Literature survey .............................................................................................. 6
1.4 Problem statement and objectives of this study ............................................. 18
1.5 Methodology .................................................................................................. 20
1.6 Overview of this document ............................................................................. 22
1.7 Conclusion ..................................................................................................... 22
Chapter 2 ........................................................................................................................... 23
2 Ore reduction plants and the plant selected as a case study ................................. 24
2.1 Overview ........................................................................................................ 24
2.2 Relevant characteristics of pyrometallurgical ore reduction plants ................. 25
2.3 The history of AlloyStream ............................................................................. 27
2.4 Relevance of this study to AlloyStream .......................................................... 28
2.5 Description of the Letaba plant ...................................................................... 29
2.6 Plant energy efficiency measurement ............................................................ 32
2.7 Scenarios, system context and constraints .................................................... 35
2.8 Evaluation criteria and system utility function ................................................. 40
2.9 Conclusion ..................................................................................................... 43
Chapter 3 ........................................................................................................................... 44
3 Design strategies for an energy efficient plant ....................................................... 45
3.1 Overview ........................................................................................................ 45
3.2 Strategies and available technologies ............................................................ 45
3.3 ECM performance simulation ......................................................................... 51
3.4 Evaluation ...................................................................................................... 66
3.5 Conclusion ..................................................................................................... 68
Chapter 4 ........................................................................................................................... 69
4 Current design and proposed conceptual design .................................................. 70
4.1 Overview ........................................................................................................ 70
4.2 LP1 energy flow ............................................................................................. 70
4.3 Proposed conceptual design (LP2) ................................................................ 78
4.4 Evaluation ...................................................................................................... 81
4.5 Conclusion ..................................................................................................... 82
The conceptual design of an integrated energy efficient ore reduction plant v
Chapter 5 ........................................................................................................................... 83
5 Results .................................................................................................................. 84
5.1 Overview ........................................................................................................ 84
5.2 Results from the conceptual design ............................................................... 84
5.3 Plant-wide measurement and verification ....................................................... 85
5.4 Measurement and verification of the conceptual model .................................. 88
5.5 Low-pressure blast air system ....................................................................... 91
5.6 Constant high-temperature cooling water ....................................................... 94
5.7 Conclusion ..................................................................................................... 97
Chapter 6 ........................................................................................................................... 98
6 Conclusion and recommendations ........................................................................ 99
6.1 Overview ........................................................................................................ 99
6.2 Implication for full commercial plant ............................................................... 99
6.3 Further research .......................................................................................... 105
6.4 Recommendations ....................................................................................... 108
6.5 Conclusion ................................................................................................... 109
Reference List ................................................................................................................. 111
Appendix A: System utility functions ............................................................................ 123
Appendix B: Complete evaluation matrix ...................................................................... 126
Appendix D: Furnace blast gas flows (Campaign 1) .................................................... 127
Appendix E: Furnace off-gas flow (Campaign 1) .......................................................... 128
Appendix F: Furnace heat losses (Campaign 1) ........................................................... 129
Appendix G: Inductor power (Campaign 1) ................................................................... 130
Appendix H: Compressor calculations .......................................................................... 131
Appendix I: Blower curves ............................................................................................. 132
Appendix J: Verification of Spreadsheet Calculations ................................................. 133

The conceptual design of an integrated energy efficient ore reduction plant vi
LIST OF FIGURES
Figure 1: Flow diagram of the systematic problem-solving approach .................................. 21
Figure 2: Letaba furnace ..................................................................................................... 24
Figure 3: Simplified process flow diagram of the Letaba plant ............................................. 29
Figure 4: Simplified process flow diagram of the Letaba furnace ......................................... 30
Figure 5: Plant depicted as a thermodynamic system ......................................................... 32
Figure 6: Simplified Sankey diagram of system energy flow ................................................ 35
Figure 7: System context diagram ....................................................................................... 37
Figure 8: Energy and mass flow diagram for the current prototype plant LP1 ...................... 71
Figure 9: Energy and mass flow diagram for the redesigned prototype plant LP2 ............... 78
Figure 10: Compressed air supply system .......................................................................... 91
Figure 11: Low-pressure blast air system ............................................................................ 93
Figure 12: Rivet Cooling water system ................................................................................ 94
Figure 13: Letaba cooling water system .............................................................................. 95
Figure 14: Closed circuit cooling towers .............................................................................. 95
Figure 15: FCP1 basic energy flow diagram ...................................................................... 101
Figure 16: FCP2 basic energy flow diagram ...................................................................... 102
Figure 17: FCP3 basic energy flow diagram ...................................................................... 102
Figure 18: FCP4 basic energy flow diagram ...................................................................... 103
Figure 19: FCP5 basic energy flow diagram ...................................................................... 103
Figure 20: Energy efficiencies of the various plant configurations ..................................... 104
Figure 21: Key cost elements, 2013 base, evaporative cooling ......................................... 105
Figure 22: Furnace blast gas flows .................................................................................... 127
Figure 23: Theoretical calculated wet off-gas volumetric rate ............................................ 128
Figure 24: Furnace heat losses ......................................................................................... 129
Figure 25: Inductor power for Campaign 1 ........................................................................ 130
Figure 26: Blower curves .................................................................................................. 132
The conceptual design of an integrated energy efficient ore reduction plant vii
LIST OF TABLES
Table 1: Energy use of LP1 as designed ............................................................................. 31
Table 2: Present and desired future state of important factors ............................................ 40
Table 3: Preference chart .................................................................................................... 42
Table 4: Evaluation matrix totals ......................................................................................... 67
Table 5: ECM dependency table ......................................................................................... 77
Table 6: Results of ECM conceptual implementation .......................................................... 81
Table 7: Flow and power values .......................................................................................... 96
Table 8: Safety criterion table ............................................................................................ 123
Table 9: Financial criterion table ....................................................................................... 124
Table 10: Reliability criterion table..................................................................................... 124
Table 11: Social criterion table .......................................................................................... 125
The conceptual design of an integrated energy efficient ore reduction plant viii
LIST OF ABBREVIATIONS
BC Brayton Cycle SC Stirling Cycle
Super-Critical Rankine Cycle Bn Billion (109) SCRC
CAPEX Capital Expenditure SRC Steam-Based Rankine Cycle
CFPP Coal-Fired Power Plant STIG Steam Injected Gas Turbine
DOL Direct On Line TEG Thermoelectric Generator
ECM Energy Conservation Measure TLC Trilateral Cycle
EFGT Externally Fired Gas Turbine US United States
EIA Environmental Impact Assessment
USA, US United States of America
VPSA Vacuum and/or Pressure Swing Absorption EPA Environmental Protection
Agency
VSD Variable Speed Drive
EROI Energy Returned on Investment VVID Variable Vane Inlet Damper
FCP First Commercial Plant WI Water Injection
G2GEE Gate to Gate Energy Efficiency
IAC Inlet Air-Cooling
IE International Electrotechnical Commission
IFGT Internally Fired Gas Turbine
ISO International Standards Organisation
KRC Kalina Rankine Cycle
LHV Lower Heating Value
LP1 Letaba Plant 1
LP2 Letaba Plant 2
LTIFR Lost-Time Injury Frequency Rate
OPEX Operating Expenditure
ORC Organic Rankine Cycle
PV Photovoltaic
RC Rankine Cycle
S2GEE Source to Gate Energy Efficiency
SAF Submerged Arc Furnace
The conceptual design of an integrated energy efficient ore reduction plant ix
NOMENCLATURE
°C Celsius Pa Pascal
c Cent P Pressure
c/MJ Cent per megajoule Q Heat or thermal energy
cP Centipoise R Rand
cp Constant pressure specific heat s Second
E Energy S Entropy
Ex Exergy T Temperature
g Gram T0 Environmental temperature
g/s Gram per second TWh Terawatt-hour
GJ Gigajoule W Watt
GJ/t Gigajoule per ton U Internal energy, in Joule, kJ, MJ, GJ h Enthalpy
K Kelvin ρ Density, in kg/m3
km kilometer γ Specific heat ratio, dimensionless
kg Kilogram
kJ Kilojoule ΔT Temperature difference, in Kelvin kJ/kg Kilojoule per kilogram
kJ/s Kilojoule per second η Efficiency, dimensionless
kl Kilolitre
kPa Kilopascal
kV Kilo-volt
kW Kilowatt
kWh Kilowatt-hour
kWh/t Kilowatt-hour per ton
m Meter
ṁ Mass flow
m2 Square meter
mA Milli-Ampere
MJ Megajoule
MJ/s Megajoule per second
MJ/t Megajoule per ton
MPa Megapascal
MW Megawatt
MWh Megawatt-hour
MWh/t Megawatt-hour per ton
Nm3 Normal cubic metre
Note: All pressure values in this study are gauge values unless otherwise indicated.
The conceptual design of an integrated energy efficient ore reduction plant x
LIST OF COMPOUNDS
C Carbon
CO Carbon monoxide
CO2 Carbon dioxide
CO3 Carbonate
Fe Iron
FeMn Ferromanganese
Fe3O4 Ferric oxide
H2 Hydrogen
HC FeMn High carbon ferromanganese
Mn Manganese
MnO Manganese oxide
MnO2 Manganese dioxide
SiO2
Silica dioxide

The conceptual design of an integrated energy efficient ore reduction plant 1
CHAPTER 1
Chapter 1 defines the problem addressed by this study. Potential solutions are identified
through a literature survey. The methodology that is followed in this study is described.
Travel is fatal to prejudice, bigotry, and narrow-mindedness, and many
of our people need it sorely on these accounts. Broad, wholesome,
charitable views of men and things cannot be acquired by vegetating in
one little corner of the earth all one's lifetime. ~Mark Twain
The conceptual design of an integrated energy efficient ore reduction plant 2
1 Introduction
1.1 Background
From prehistoric times man required metals for different purposes. Even epochs in history
are named according to the dominant metal of the time, for example the Bronze Age and the
Iron Age. Today metals are used in numerous applications – from structural steel used in the
construction of buildings, bridges and dam walls; safety pins and paper clips; to the metals
used in cars, ships and trains.
The primary sources of most metals are oxides in the earth’s crust. After mining and some
form of beneficiation, the oxides are reduced to metal using ore reduction plants. The
reduction process moves the oxygen molecules from the metal oxide to a reductant such as
carbon, resulting in metal (the product) and an oxidised reductant such as carbon dioxide, or
CO₂, (the waste). Pyrometallurgical reduction processes occur at high temperatures; in the
case of manganese (Mn) ore the temperature must be above 1 250°C for the reduction of
manganese oxides to manganese to occur [1].
Pyrometallurgical ore reduction plants (or smelters) require ore containing metal oxides,
coal, electricity and water (and oxygen in the case of the AlloyStreamTM process) to function.
The placement of smelters is therefore significantly affected by the availability of these
resources.
Smelters are intensive energy converters with most of the energy converted by the furnace,
the primary high-temperature device in the plant. There are many types of furnaces in
industries other than the ore reduction industry - such as glass making, cement
manufacturing and power generation. Some solutions to the challenges addressed in this
study were obtained from these “non-ore reducing” industries.
This study is based on AlloyStream’s Letaba plant. Letaba was built during the period 2010
to 2011. It started operating in February 2012. It is intended as a pre-commercial technology
demonstrator (or prototype) of the AlloyStreamTM process, and also as a test bed for
technology development and knowledge growth. Although unique in some aspects it uses
the same energy sources as other pyrometallurgical plants.
Electrical and chemical energy that enter the plant is converted into heat and work, most of
the energy conversion occurs in the furnace vessel. Here “work” means the increase in
potential energy of the ferromanganese (FeMn) product above the manganese ore. The
The conceptual design of an integrated energy efficient ore reduction plant 3
difference between the energy entering the plant and the work performed appears as waste
heat that is rejected to the environment. Efficient use of energy is an economic requirement.
In this study a conceptual redesign of the as-built plant is performed in order to improve the
work-to-input energy ratio, or energy efficiency.
The configuration of Letaba as it entered service for the first time is called Letaba Plant 1
(LP1). The proposed energy efficient Letaba configuration is called Letaba Plant 2 (LP2).
The first commercial plant is abbreviated to FCP in this document.
1.2 The need
AlloyStream is developing a new technology for the production of ferromanganese and other
metals from low-grade ores. Their prototype smelter entered operation in February 2012.
This study was initiated as part of the ongoing technology development program of the
organization.
LP1 presents a unique opportunity to use as a case study and test bed for energy efficiency
improvement in a smelter. Energy cost is currently between 20% and 25% of the LP1 cost
base and is expected to increase at a rate higher than inflation. A significant reduction in
energy cost is a key for the technology to achieve economic viability.
Energy efficiency is, however, only one of the requirements for a commercially successful
smelter. Typical high-level requirements are:
Low safety risk
High energy efficiency
Low capital expenditure (capex) and operating expenditure (opex)
Quick deployment time
High yield
Safety risk
High-temperature processes have inherent safety risks. In smelters liquid materials at high
temperature can quickly destroy containing vessels, and it can cause explosions when it
comes into contact with water or other substances with low boiling points. In the past,
explosions have been experienced in many smelters, often because water and liquid metal
(or slag) came into contact with each other in an uncontrolled way [2]. The mechanism of
this type of explosion is probably a boiling-liquid-expanding-vapour explosion [2, 3]. This
mechanism is believed to be the cause of explosions in furnaces at Empangeni and Cato
Ridge [4]. In the drive to reduce the energy consumption per ton of metal produced and to

The conceptual design of an integrated energy efficient ore reduction plant 4
increase the refractory life, furnace designs tend to rely heavily on water-cooling, thereby
increasing the risk of explosions.
Energy efficiency
The energy used by smelters:
Powers the reduction process.
Maintains the high internal temperature of the furnace vessel.
Drives the support processes, such as the water-cooling system, off gas handling,
lighting and others.
Most of the energy that enters the smelter exits the plant as low-level waste heat. Only a
fraction of the input energy is converted into process energy or work. In this document the
energy efficiency of the plant is expressed as the ratio of the theoretical process energy to
the total average energy entering the plant. Another measure used in industry is the
electrical energy required by the furnace to produce one ton of metal – expressed in
kWh/ton.
The energy efficiency obviously impacts on the profitability of the smelter, but it is also
important from a placement, rapid deployment and an environmental point of view. Ore
bodies are often found in underdeveloped parts of the world where electrical grid power is
insufficient, or does not exist at all. Improved electrical energy efficiency moves the plant
closer to a possible self-generation configuration. Reduced energy use is also advantageous
from an environmental impact point of view (fewer CO2 emissions for example) and
operating cost.
Capex and opex
Capex and opex are driven by a number of factors. Placement affects start-up time,
construction cost, inbound and outbound logistic cost. The design determines to a great
extent what the plant will cost to build, how well the plant will perform over its lifecycle, and
how dependent it will be on external resources (such as electricity supply via a grid as well
as bulk water supply). There is a trade-off between capex and opex – in the case of Letaba,
capex had to be minimised even though it was known that it would inflate the opex. In the
case of a commercial plant the focus will be more on opex reduction, thus resulting in higher
capex.
Financial methods such as net present value, return on investment, and payback period are
used to determine the optimum trade-off between capex and opex. These methods also
reduce the risk attached to the investment decision. In this study the simple payback period

The conceptual design of an integrated energy efficient ore reduction plant 5
method will be used to evaluate the financial value of the various measures aimed at
improving the plants’ energy efficiency.
Typical capex of a ferromanganese smelter is R20 000/ton per year, for example: a smelter
that can produce 10 000 ton per year will cost in the order of R200 000 000 [5]. Opex must
be below R12 000/ton to achieve an operating profit at the 2013 London Metal Exchange
price for high carbon ferromanganese (HC FeMn).
Deployment time
Deployment time is the time taken from the moment that funds for the building of the plant
are approved to the actual plant start-up. The deployment time is primarily affected by the
following factors:
Governmental approval to operate – this usually requires a successful environmental
impact assessment process, including an air emission license. The government
approval for Letaba took two years.
Construction of external infrastructure, such as electricity and water supply systems,
and roads and rail facilities if non-existent (up to five years).
Manufacturing of specialised equipment (up to two years).
Construction of the facilities and erection of the plant (up to two years).
Commissioning (three to six months).
Ore deposits are often located in underdeveloped parts of the world where bulk water and
electrical power are not available. Smelters also compete with local communities for
resources. This can result in a negative outcome for the licensing application, or very tight
requirements set by the authorities for the use of scarce resources. An example of the
potential impact of such delays is the substantial write-down Anglo American had to perform
on its Minas-Rio investment [6].
A smelter that generates its own electricity and uses water sparingly can significantly reduce
deployment time resulting in cost savings.
Yield
The yield is defined as the ratio of mass of metal leaving the plant as product to the mass of
metal entering the plant in the ore. The yield is primarily determined by the metallurgical
process technology. The process parameters required for optimum yield are viewed
throughout this study as a constraint to be met by the conceptual design.

The conceptual design of an integrated energy efficient ore reduction plant 6
1.3 Literature survey
Before the literature survey was started the need was already known: to identify ways of
improving the energy efficiency of LP1. With the survey answers to the following questions
were sought:
1. What are typical (benchmark) levels of energy efficiency in smelters?
2. Which methods or technologies are available to improve the energy efficiency?
3. What are the capability and maturity of the available technologies?
The literature survey explored three main groupings: books, academic journals and non-
academic sources.
1.3.1 Benchmark process energy required in HC FeMn-producing smelters
Tangstad and Olsen calculated the process enthalpy (defined as the energy required at
constant pressure to produce HC FeMn from ore) as between 1 495 kWh/ton and
2 174 kWh/ton, depending on the ore composition and water content [1]. Process enthalpy is
defined as the change in enthalpy from reactants to products during the reduction reactions.
Their calculations are based on a submerged arc furnace (SAF) with a top-of-charge
temperature of 200°C to 250°C. This is the temperature at which the off-gas (by-product of
the process) exits the furnace. Tangstad and Olsen followed a fundamental approach. The
higher value is based on an ore water content of 10% and a non-optimum ore composition.
The calculation is based on standard states for both reactants and products. Their sub-
optimum mix contains 339 kg carbon per ton of metal produced.
BHP Billiton uses 2 600 kWh as the electrical energy required to produce one ton of
HC FeMn in an SAF [7]. Assore uses a value of 2 650 kWh/t for an open SAF. None of these
values include the carbon (or coal) enthalpy. The carbon-to-metal ratio can be as high as 0.9
to 1 [8].
The process enthalpy for the Letaba furnace is calculated as 2 951 kWh/t [9]. The enthalpy
of the products is at the furnace internal temperature of 1 550°C.
Wall calculated the exergy efficiency (exergy is work, or the ability to do work) of Swedish
iron production [10]. He found the exergy of the ore after mining to be 0.51 MJ/kg and the
iron after reduction to be 6.91 MJ/kg. The average input energy for mining of the ore and
reduction to iron was 32.9 MJ/kg, giving an exergy efficiency of 21% for the industry.

The conceptual design of an integrated energy efficient ore reduction plant 7
1.3.2 Literature primarily addressing plant-wide energy saving techniques
Soma and Chiogioji list two questions in Chapter 2 of the Handbook of Energy Systems
Engineering that need to be answered to identify areas for energy savings [11]:
1. Which areas have significant potential for savings?
2. Which specific measures should be used to achieve savings?
An example of a site energy and utility diagram with energy balances is given by Soma and
Chiogioji. They stress the importance of energy audits, energy balances and energy
monitoring and accounting. They describe four energy accounting techniques. The activity
method will be used in this study. The term “energy conservation opportunities” is used and
suggestions as to how energy conservation opportunities can be evaluated are given. In this
study the payback period method will be used to evaluate the financial value of the various
measures.
Soma and Chiogioji also list a number of general measures to consider. These are
housekeeping (or proper operations), equipment and process modifications, and integrated
operations. Specific measures mentioned are utilisation of waste heat, improved efficiency
motors, variable speed drives (VSDs) and lighting efficiency improvements. Effective heat
utilisation is also covered by Fazolare and Smith in Chapter 2 of the Handbook of Energy
Systems Engineering [11]. They emphasise management of energy flow and waste heat
recovery and list a number of such measures. Of the heat recovery measures the Steam-
based Rankine Cycle (SRC), externally heated gas turbine and Stirling Cycle (SC) were
considered in this study.
Doty and Turner use the term “energy conservation measure” or ECM [12]. They cover a
broad range of ECM topics. A similar range of topics is covered by Thumann and Mehta [13].
Topics of relevance to this study are:
Effective energy management and energy auditing - mass and energy balance is one
of the analytical techniques used in this study.
Fired system efficiency analysis, preheating of combustion air, heat recovery, pulse
combustion, optimised air-fuel ratios and VSDs.
Cogeneration.
Waste heat recovery (heat-to-heat and heat-to-electricity).
High-efficiency motors and matching motor size to load.
Energy management control systems.
Lighting efficiency measures.

The conceptual design of an integrated energy efficient ore reduction plant 8
Energy systems maintenance.
Use of alternative energy such as photovoltaic (PV) solar.
Commissioning, measurement and verification.
Chan et al. conducted a study of the top hundred energy users in Taiwan from 2001 to 2004
that included the iron, steel, chemical, pulp, paper, textiles and electronic/electrical industries
[14]. The recommendations on how to improve energy efficiency across the industries can
be summarised as:
Improve the efficiency of electrically driven rotating equipment such as compressors,
pumps, kilns and fans by using VSDs.
Recycle waste heat from high-temperature devices such as furnaces by installing air
preheaters, steam recuperators and similar devices.
Reduce waste heat by installing better thermal insulation.
Convert waste heat to electricity.
A potential energy reduction of 5 x 10⁸ litres of crude oil equivalent per year was estimated
by Chan et al. for the industrial sector of Taiwan [14]. This reduction represents about 1% of
the estimated industrial sector of Taiwan’s annual consumption of energy for 2001 to 2004.
Martins reports the electricity use of an SAF in ferrochrome production to be 3 600 kWh/ton
[15]. He cites Riekkola-Vanhanen who found the best practice electrical energy use to be
3 100 kWh/ton to 3 500 kWh/ton. His study lists energy reduction techniques and integration,
as well as indicating practical ways of improving performance in an operating plant based on
SAF technology. Martins specifically mentions efficient motors; the use of VSDs; pump, fan
and lighting efficiency improvements; and furnace optimisation as ECMs to consider. He
points out the importance of following an integrated process and energy improvement
approach.
A study of energy efficiency improvement and CO2 reduction potential in the Chinese iron
and steel industry conducted in 2010 by Hasanbeigi et al. identified measures that could be
implemented in the various unit operations [16]. Some of these measures are adopted in
Chapter 3 of this study. Heat recovery was predicted by Hasanbeigi et al. to result in more
than 50% of the potential savings. A 46% potential energy reduction was calculated for the
industry. Hasanbeigi et al. found an emission factor of 0.77 kg CO2 per kWh electricity
generated by a coal-fired power plant.
Although based on copper production, an article by Warczok and Riveros contains useful
information on energy requirements for various copper ore reduction unit processes [17].

The conceptual design of an integrated energy efficient ore reduction plant 9
Total energy requirements (combined fuel and electricity) vary from 19 GJ/ton to 43 GJ/ton
copper produced for the seven copper production technologies evaluated. The following
ECMs are mentioned in the article:
Utilise the heat energy in liquid metal and slag to preheat raw material.
Switch from a batch to a continuous process.
Use less intensive refractory cooling.
Recover heat from off-gas.
Optimise compressor use.
Preheat air for concentrate drying.
Letaba uses a coreless induction furnace (AlloyStream uses the term “inductor”) to maintain
the liquid bath temperature. Giacone and Mancò measured the energy efficiency in a casting
plant using coreless inductors for melting metal [18]. A method used to model the system,
called the site energy system model, is described. Five components are used in the model:
imported energy, energy generation system, energy carriers, energy utilisation system and
energy drivers. A matrix representation of the energy system of a factory is presented by
Giacone and Mancò with case studies. A simplified version of the matrix approach was used
in this study. This technique should be considered as a key component of an energy
management program for AlloyStream.
Energy flow analysis for three major energy-consuming mills of the pulp and paper industry
in Taiwan (officially the Republic of China) is presented by the Chen, Hsu and Hong [19].
Many of the measures recommended are similar to those proposed by Hasanbeigi et al. [16].
The payback period of energy efficiency improvement measures is calculated by dividing the
estimated capex required to implement the measure with the monthly predicted saving in
energy cost. The same approach is used in this study.
A practical roadmap to improving energy use in a plant is presented by Hagemo [20]. He
emphasises the importance of both the technical factors to consider and the psychological
factors that can be important barriers or enablers for the implementation of ECMs. Hagemo
also indicates practical ways of estimating energy use where a lack of energy measuring
instrumentation exists.
A comprehensive publication by the European Commission’s Directorate-General Joint
Research Centre discusses (in part) energy efficiency measures in smelting processes [21].
Where applicable the recommendations in the document have been adopted in this study,
for example low-temperature coal drying with waste heat and off-gas heat recovery.

The conceptual design of an integrated energy efficient ore reduction plant 10
An Institute of Electrical and Electronics Engineers recommended practice for energy
conservation contains valuable information on motors and lighting [22].
Some useful benchmark values are given in a comprehensive analysis of the USA iron and
steel industry’s energy use by Worrell, Martin and Price [23]. Energy used in the various unit
processes are listed and compared with other regions. The report also lists ECMs that will
improve energy efficiency - such as preventative maintenance, energy monitoring and
management, VSDs, heat recovery, pulverized coal injection, pressure recovery turbines,
heat recuperators, improved furnace insulation and combined off-gas gas turbine/steam
turbine with steam injection in the gas turbine. The payback periods for various ECMs are
estimated. Steam injection for gas turbines is offered as a commercial solution by Cheng
Power Systems [24].
The US Environmental Protection Agency (EPA) Energy Star energy management process
is described in a report by the Office of Air Quality Planning and Standards [25]. The report
lists a large number of ECMs applicable to the iron and steel industry. The applicability,
feasibility and estimated payback period of the measures are indicated and each measure is
discussed in some detail.
Nored, Wilcox and McKee list waste heat recovery methods with basic calculations for
Organic Rankine Cycle (ORC), SRC and gas turbines [26]. They found the capex of ORC
systems to be between $2 000/kW to $2 500/kW and the opex between $0.01/MWh and
$0.05/MWh. A relative ranking of the technologies against four criteria (capex, lifecycle cost,
energy grade and effectiveness) is done.
1.3.3 Specific measures to improve energy efficiency
Barati et al. found that the metal and slag tapped from a furnace represent a significant
energy stream [27]. A slag enthalpy of 1.6 GJ/ton for ferroalloys is indicated in their article.
This value is close to the 1.4 GJ/ton value as used by the AlloyStream metallurgical
department. The slag thermal energy can be recovered but the method is dependent on the
slag cooling requirements. If the slag is intended for use in the cement industry, cooling has
to be rapid to achieve a glassy state. The very low heat transfer coefficient of slag
counteracts rapid cooling. Various means of rapid slag cooling, with the appropriate heat
recovery techniques appropriate to the slag treatment, are described by the authors. A
recovery of up to 65% of the thermal energy is predicted in the article by Barati et al. [27]. In
this study a 50% recovery level is used.

The conceptual design of an integrated energy efficient ore reduction plant 11
The off-gas leaving the LP1 furnace represents a thermal energy rate of more than 3 MJ/s.
Effective utilisation of off-gas is one of the most important measures to improve the energy
efficiency of the plant. One method could be to employ an externally fired gas turbine
(EFGT). Datta, Ganguly and Sarkar performed an energy and exergy analysis of an EFGT
for three sets of pressure ratios, heat exchanger cold-end temperatures and turbine inlet
temperatures [28]. A trade-off design was reached with a thermal efficiency of 26% under
conditions similar to LP1’s off-gas.
An alternative to the gas turbine’s Brayton Cycle (BC) for the conversion of heat to power is
the Rankine Cycle (RC). The RC, based on three different working fluids, has found
application in waste heat recovery:
Steam as working fluid (SRC)
A two-part fluid (Kalina Rankine Cycle, or KRC)
An organic fluid (ORC)
In a theoretical back-to-back comparison of a KRC versus an ORC, both with 1.8 MW output
and utilising waste heat at 140˚C, the thermal efficiency of the KRC was found to be 6%
versus 8.5% for the ORC [29].
Murrugan and Subbarao modelled a combined cycle consisting of SRC-top and KRC-bottom
systems and found a first law efficiency improvement of 1.43% and a power increase from
82.2 MW to 83.6 MW [30]. A further benefit of this configuration is that the SRC condenser
runs at above atmospheric pressure.
Water-cooling is used extensively on LP1 and as a result the plant rejects about 50% of the
waste heat at 40°C to the environment through water evaporation. One option to improve the
energy efficiency is to raise the cooling medium temperature and recover the waste heat at
an elevated temperature. Little and Garimella compared various thermodynamic cycles to
convert low-temperature waste heat (60˚C and 120˚C) to work and for cooling. They found
the ORC to yield the best heat-to-power efficiency [31]. Heat transformers are also
described. A basic description of the Maloney-Robertson Cycle to generate power is given.
The Maloney-Robertson Cycle is based on the absorption-cooling cycle, modified to yield net
power.
Chan et al. reviewed technologies suitable for low-grade thermal (<250˚C) energy recovery
in the United Kingdom [32]. The ORC, Super-critical Rankine Cycle (SCRC), KRC, and
Trilateral Cycle (TLC) are discussed with valuable metrics. The SCRC was found to have a
marginally higher thermal efficiency than the ORC. The TLC is theoretically more efficient
The conceptual design of an integrated energy efficient ore reduction plant 12
than both the ORC and SCRC, but it is not a commercial option at present. A large reference
base is given. A similar study was performed by Ammar et al. that also covers the basics of
heat pipes [33].
Waste heat can also be used to heat combustion air before entering the Letaba furnace. A
regenerator that heats combustion air to between 900˚C and 1 200˚C by recovering heat
from the exhaust gas (off-gas) of a glass furnace was studied by Sardeshpande et al. [34].
Fouling of the heat exchanger by dust caused a substantial deterioration in performance.
The Letaba furnace operates at a gas temperature of 1 550˚C.
Stehlìk discusses heat exchanger design for flue gas at temperatures between 600˚C and
1 000˚C where severe fouling is present [35]. Some practical suggestions are given to
improve heat transfer and reduce fouling under these conditions. In a similar study by the
same author, more practical detail is given [36].
Shekarchian et al. conducted a thermodynamic and economic analysis on industrial-fired
heaters [37]. The authors found that air preheating with off-gas would increase heating
efficiency from 63% to 71%. The payback period for the high-efficiency gain options varied
from 2.6 to 4.5 years.
An extensive list of low-temperature power cycles in operation worldwide are presented in an
article by Ohman and Lundqvist [38]. Performance measures of operating systems are
given. Heat source temperatures ranged from 60°C to 482°C and sink temperatures ranged
from 4°C to 78°C. The fraction of Carnot efficiencies range from 0.05 to 0.65. The most
promising cycles (ORC and KRC) were considered in this study.
An energy benchmark model developed for a glass furnace is described by Sardeshpande et
al. [39]. The model is based on a rigorous mass and energy balance for the plant being
studied. A potential reduction of 20% to 25% in energy use was predicted. The same method
will be followed for the analysis of the entire Letaba plant (not only the furnace as was the
case in the article) and in the development of an energy efficient alternative plant
configuration.
In an article describing the development of conceptual optimal mine energy supply the
authors list five constraints: energy conversion technology, installation (space), utility
balancing, carbon monoxide (CO) emissions and energy market (financial) constraints [40].
Energy flow is depicted graphically in a superstructure diagram.

The conceptual design of an integrated energy efficient ore reduction plant 13
Some practical recommendations are given in a short article by Carpenter [41]. Three of the
seven techniques that he discussed are applicable to this study. These techniques are the
production of products to specification, reduced pressure drop across control valves, and
design for energy efficiency the first time.
De Paepe et al. modelled a micro-gas turbine with steam injection generated with heat from
the exhaust gas [42]. An improvement in the electrical efficiency of 2.2% was predicted when
5% of the air flow was replaced with steam.
Wang, Chiou and Wu analysed a simple gas- or oil-fuelled commercial gas turbine and
determined the effect on power output and efficiency with inlet air-cooling and steam
injection [43]. Both measures were generated with the waste heat from the gas turbine
exhaust. They claim that the standard turbine efficiency is increased from 29% to 40% with
inlet air-cooling and steam injection, and the power output increased from 53 MW to 92 MW.
These gains are considerably more than what De Paepe et al. found. The authors did not
specify how the substantial additional power would affect the gas turbine’s reliability.
An article by Reddy, Naidu and Rangaiah covers a broad range of waste heat recovery
techniques in chemical process industries [44]. They list twelve practical criteria to be
considered such as space, minimum temperatures and so forth. In particular they
recommend that heat-to-heat recovery could be considered in preference to heat-to-
electricity.
Iora and Silva conducted a theoretical analysis of an intercooled, externally heated, double
shaft micro-gas turbine and found an electrical efficiency of 21% at a turbine inlet
temperature of 750°C [45]. The turbine is based on an automotive turbocharger.
An energy and exergoeconomic analysis of a system using combustible blast furnace gas
combined with sinter gas from a steel production plant was done by Yao et al. [46]. The
combined gas stream fuels a combined cycle consisting of a gas turbine top cycle with a
steam turbine bottom cycle. Three possible configurations were analysed and the optimum
configuration from an energy, exergy and economic perspective (including capital cost) was
found.
Externally fired micro-gas turbines with biomass as fuel were evaluated by Cocco, Deiana
and Cau [47]. The high-temperature heat exchanger is the most expensive component of the
system and poses the biggest challenge for thermal efficiency improvement. As expected,
pressure ratio and turbine inlet temperature primarily determine the thermal efficiency. This
was found to be 22% at a turbine inlet temperature of 800°C and 33% at 1 200˚C.
The conceptual design of an integrated energy efficient ore reduction plant 14
Snyman found that the efficiency of the compressed air supply at a South African gold mine
can be increased substantially [48]. He recommends right-sizing the compressors, using
high-efficiency compressors, high-efficiency motors and VSDs where feasible. His study has
relevance since similar initiatives will be considered in this study.
Commercially available solar PV modules are now reaching a claimed conversion efficiency
of 17% at a radiation level of 1 000 W/m² [49].
1.3.4 Articles that are classified as background
A Grasys product brochure gives information on two of three technologies for producing pure
oxygen and/or oxygen-enriched air. These are vacuum and/or pressure swing absorption
(VPSA) and membranes [50]. The use of these two technologies could substantially reduce
the oxygen enrichment cost of Letaba. Oxygen generation with VPSA or membrane
technology is discussed in Chapter 6 of this study.
A low-cost modelling method to identify and quantify the potential for energy reduction in a
fired plant (furnace) is described by Tucker and Ward [51]. The zone method will be useful to
perform a basic heat transfer calculation of the Letaba furnace internally, but is not in the
scope of this study.
An article by Sano, Mizukami and Kaibe describes work done by Komatsu to improve the
efficiency of thermoelectric generation (TEG) modules [52]. By optimising the production
process the thermal efficiency of a low-temperature module was improved from 6% to 7%.
This efficiency was reached at a ΔT of 250°C. An overall efficiency of 6% was predicted
when the inverter losses were included. By comparison a supplier of commercially available
TEG modules [53] states a realistic overall efficiency of 3% at a ΔT of 200°C. Phillips found
an efficiency of 7% at a ΔT of 100°C, with a theoretical efficiency of up to 18% [54].
Chen, Chung and Liu analysed the energy use and performance of steel billet reheating
furnace (gas-fired) in a hot strip mill [55]. They found that 48% the off-gas heat could be
recovered in the furnace.
An energy and exergy assessment of a lime kiln by Gutierrez et al. serves as a valuable
comparison and guide to analysing the reduction process performed in the Letaba furnace
[56]. In the study 50% of the energy loss in the kiln was found to be due to combustion, heat
and momentum transfer and loss to exhaust gases.
Above-inflation increases in electricity cost will have a negative impact on the
competitiveness of ferroalloy producers, as electricity is a substantial operating cost

The conceptual design of an integrated energy efficient ore reduction plant 15
component. In the presidential address to the Southern African Institute of Mining and
Metallurgy in 1980, Dr Jochens commented on the effect energy cost has on ferroalloy
producers (including ferromanganese) in South Africa [57]. Dr Jochens stressed the risk
posed by such cost increases and warned that this could lead to ferroalloy producers moving
their facilities to countries with lower electricity rates. In 2013 Assore announced that they
were to move their ferromanganese production facility to the Philippines, citing lower
electricity rates as one of the reasons [5].
Mahto and Pal explored the efficiency of a dual combined cycle with a gas turbine top and
steam Rankine bottom. Six steam turbine configurations were modelled. The highest
efficiency was obtained with the triple pressure steam turbine combined with inlet fogging of
the gas turbine. At a gas turbine pressure ratio of 20:1 the thermal efficiency exceeded 50%
[58].
Significant opportunities for energy reduction were identified by Matsuda et al. by applying
pinch analysis in the evaluation of energy use at a large steel plant [59]. They found that
21.2 MW can be generated by optimizing the heating and cooling systems with the
technique.
In an article on the history of pyrometallurgy Habashi lists technological changes from the
start of civilisation to present [60]. The fascinating list of technological advances starts with
the ancient Egyptians who used bellows to generate air blasts. Next the water wheel
became a source of power, followed by the replacement of coal with coke in 1735. In 1856,
another major breakthrough came when Bessemer and Kelly on both sides of the Atlantic
developed a technique to produce steel from pig iron.
Jegla describes the conceptual design of a tubular furnace with typical heat flues values [61].
This could be useful for process optimisation inside the Letaba furnace and for off-gas heat
recovery heat exchanger design.
An article by Sano covers power generation plants of TEPCO, a Japanese electricity
producer [62]. TEPCO uses the SRC (47% efficiency), and the Brayton-Rankine combined
cycle (61% efficiency) to generate power. The combined cycle plants use coal gasification.
The turbine inlet temperature is as high as 1 600°C. A list of power plants and performance
measures are presented.
Various commercially available process technologies are described and evaluated by
Riekkola-Vanhanen in a comprehensive report on operating plants producing nickel [63].

The conceptual design of an integrated energy efficient ore reduction plant 16
Although not directly applicable, the method of analysis is instructive and the metrics
valuable to this study.
An optimisation algorithm to find the best overall energy management strategy for combined
heat and power system with district heating and thermal storage is described by Reverberi et
al. [64]. A summary of pinch analysis is given in the study.
The performance of a small (1-5 MJ/s) pressure coal gasification system coupled to either a
gas turbine or an internal combustion engine with syngas storage is described by Cau,
Cocco and Serra [65]. The energy conversion efficiency of the coal-to-syngas component is
reported as 80%. The gas-to-electricity conversion efficiency of the gas turbine engine was
27% at peak load with a corresponding 40% for the internal combustion engine. This study is
relevant for the option of self-generation of electricity by leveraging the coal supply and
infrastructure of FCP.
Engelbrecht tested low-grade coal in a pilot scale low-pressure fluidised bed gasifier [66].
Syngas with a lower heating value (LHV) of 3 000 kJ/kg was produced with a fixed carbon
conversion between 55% and 85%.
Vera et al. compared a biomass to gasifier to syngas to micro turbine process with a
biomass to externally fired micro turbine process, the biomass being generated by the olive
oil industry [67]. The gasifier gas/turbine combination gave an efficiency of 12.3% and the
EFGT configuration gave an efficiency of 19.1%
The need for self-generation is driven by the need for deployment of the AlloyStreamTM
technology in areas where grid power may not be available, but also by the rapidly
escalating grid power cost as reported by MarketLine for South Africa [68]. Eskom’s market
share in 2011 of the South African electricity market was 98.8%. Income from electricity sold
increased from R42.5bn for 2007 to R72.5bn in 2011, whilst volume sold reduced from
220 TWh in 2007 to 214 TWh in 2011. Unit revenue increased from 19c/kWh to 33.9c/kWh
over the same period.
Weisbach et al. calculated energy returned on investment (EROI) values and other
performance measures for various power generation systems (gas-fired turbines, solar PV,
solar thermal, wind power and hydropower) [69]. The methodology to calculate EROI is
explained.
An article by Akiyama et al. compared the recovery of waste heat from slag with two
chemical processes or conversion-to-power or generating hot water. The authors found that

The conceptual design of an integrated energy efficient ore reduction plant 17
methane reforming and producing cement from limestone and slag utilise the exergy of the
slag more efficiently than generating steam or hot water [70].
A combined triple cycle with BC top, steam RC middle and ammonia RC bottom was
analysed by Marrero et al. [71]. A ΔT of 10°C between the gas turbine outlet and steam
middle cycle was used in the model. A thermal efficiency of 60% was predicted at a turbine
inlet temperature of 1 800 K. Operating the steam condenser at atmospheric pressure is an
advantage in addition to the high cycle efficiency.
Beloglazov et al. modelled a coal gasifier integrated with a gas turbine with water injection
after the compressor. Two configurations were considered, both yielding thermal efficiencies
in excess of 50% at a gas turbine pressure ratio of 30:1. A regenerator was included in both
configurations [72].
Horlock covers the theory of water injection into a gas turbine fitted with a regenerator,
focusing on the effect on the heat exchange in the regenerator. Two-stage injection is
expanded to multiple injection sequences. The author found that water injection changes the
performance of the gas turbine favourably. No specific examples or case study are
presented [73].
An article by Tchanche et al. reviews applications of ORC technology. In geothermal to
power applications efficiencies of 10% to 12% are reached with source temperatures of
130°C to 160°C [74]. In solar thermal application similar efficiencies are reported. Solar
ponds with ORC, solar thermal and ORC with reverse osmosis and solar assisted cooling
systems are also included in the article.
1.3.5 Evaluation
The literature survey revealed a wide range of technologies and techniques that could be
considered to improve the Letaba plant’s energy efficiency. These measures, or ECMs, are
not all at the same level of development. The author was fortunate to visit a number of
suppliers in the USA and Europe in February 2013 to gain firsthand information on
commercially available equipment:
Flexenergy in Portsmouth, New Hampshire manufactures a 250 kW gas turbine
generator set that can be configured as an EFGT. Only one of their units has to date
been supplied to a client in Europe for EFGT evaluation.
Elliot in Jeanette, Pennsylvania is a large manufacturer of steam turbines in the
power range applicable to Letaba.
The conceptual design of an integrated energy efficient ore reduction plant 18
Cool Energy in Boulder, Colorado has developed a 3 kW low temperature Stirling
engine that is currently undergoing reliability testing. They are developing a 20 kW
unit.
LA Turbine in Valencia, California manufactures turbo-generators and turbo-
expanders.
Mavi-Trench in Santa Maria, California manufactures ORCs, turbo-generators and
turbo-expanders.
Turboden in Brescia, Italy manufactures ORCs. A 1 MW operating ORC was visited.
Over 200 Turboden ORCs are in service worldwide.
The Handbook of Energy Systems Engineering [11], although printed in 1984, proved
invaluable in guiding this research, as did The Energy Management Handbook by Dowty and
Turner [12]. Most of the articles found were via the online search facility of the North-West
University. The main journal sources were Energy (9), Applied Thermal Engineering (7) and
Applied Energy (6). The US EPA website and dissertations and theses from the University of
Pretoria and the North-West University also proved valuable.
It is clear that not a single technique or technology should be considered in the conceptual
design of an energy efficient plant, but rather a range of technologies. Examples are
improving the efficiency of the conversion of energy by existing devices such as electric
motors to convert waste heat to power by adding additional devices such as a heat
exchanger and an ORC.
Significant variations in performance of the measures are observed in the literature. In this
study the more conservative values were used where more than one value was presented.
1.4 Problem statement and objectives of this study
The key problem addressed in this study can be stated in three parts, being:
1. How can the energy efficiency of the ore reduction plant on which the study is based
be measured?
2. Which is the best way of improving the efficiency?
3. To what level can it be improved?
Question 1 is addressed in Chapter 2, Section 2.6. Chapter 3 identifies ways to improve the
efficiency, thus answering Question 2. Chapter 4 answers Question 3 where the
improvement in efficiency of the Letaba plant is indicated.
The problem statement can be reworded as two hypotheses:
The conceptual design of an integrated energy efficient ore reduction plant 19
1. Hypothesis 1 – the energy efficiency of the plant can be determined (or calculated or
measured) by measuring the output work and input energy.
2. Hypothesis 2 – the energy use of the plant can conceptually be reduced by more
than 5 000 MJ/ton by implementing a number of appropriate ECMs.
Hypothesis 1 is addressed in Chapter 2, Section 2.6. Hypothesis 2 is addressed in Chapter
4.
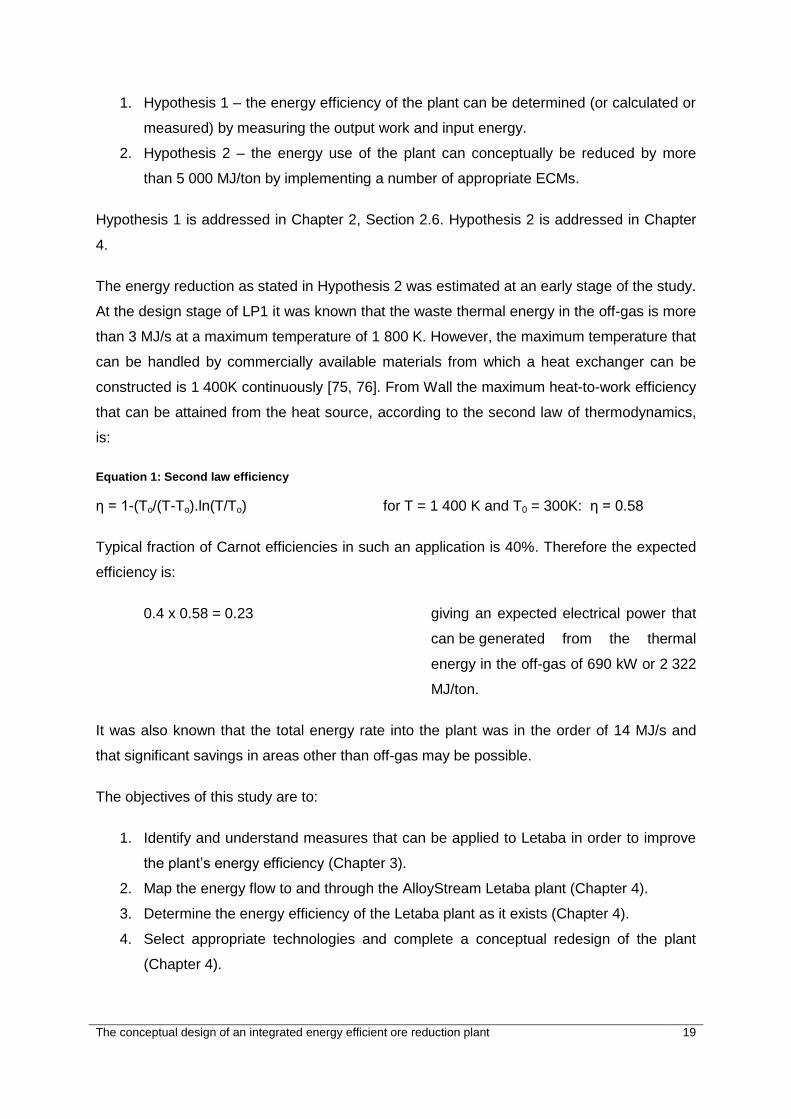
The energy reduction as stated in Hypothesis 2 was estimated at an early stage of the study.
At the design stage of LP1 it was known that the waste thermal energy in the off-gas is more
than 3 MJ/s at a maximum temperature of 1 800 K. However, the maximum temperature that
can be handled by commercially available materials from which a heat exchanger can be
constructed is 1 400K continuously [75, 76]. From Wall the maximum heat-to-work efficiency
that can be attained from the heat source, according to the second law of thermodynamics,
is:
Equation 1: Second law efficiency
η = 1-(To/(T-To).ln(T/To) for T = 1 400 K and T0 = 300K: η = 0.58
Typical fraction of Carnot efficiencies in such an application is 40%. Therefore the expected
efficiency is:
0.4 x 0.58 = 0.23 giving an expected electrical power that
can be generated from the thermal
energy in the off-gas of 690 kW or 2 322
MJ/ton.
It was also known that the total energy rate into the plant was in the order of 14 MJ/s and
that significant savings in areas other than off-gas may be possible.
The objectives of this study are to:
1. Identify and understand measures that can be applied to Letaba in order to improve
the plant’s energy efficiency (Chapter 3).
2. Map the energy flow to and through the AlloyStream Letaba plant (Chapter 4).
3. Determine the energy efficiency of the Letaba plant as it exists (Chapter 4).
4. Select appropriate technologies and complete a conceptual redesign of the plant
(Chapter 4).
The conceptual design of an integrated energy efficient ore reduction plant 20
5. Verify the predicted benefits of two efficiency conservation measures implemented
on Letaba (Chapter 5).
6. Recommend research and development that could result in further gains in energy
efficiency and plant effectiveness (Chapter 6).
7. Prove or disprove the two hypotheses.
1.5 Methodology
The primary methodology followed in this study is process modelling. In-plant testing of the
ECMs is the preferred way to verify the performance predicted by the model. Unfortunately it
is impossible to test the list of ECMs conceptually implemented in practice, given time and
resource constraints. Two measures could fortunately be verified through testing during the
study. They are discussed in Chapter 5. For the ECMs conceptually implemented the focus
was on verifying the information sources and the spreadsheet accuracy.
Supporting the conceptual design is a spreadsheet that models the various plant
configurations described. The accuracy of the data was assured by:
Observing actual values on the Letaba plant.
Calculating data from primarily fundamental thermodynamic and heat transfer
relationships.
Using data from reputed publications.
Obtaining estimates from experienced and reputed specialists on the topic.
This study is normal applied research. Approximately 20% of this study is based on
prototyping, being the two energy efficiency measures described in Chapter 5. They could
be deemed prototypes, even though they are in full-scale operation, because Letaba is in
itself a prototype of the commercial plant. The remaining 80% is a mixture of primarily
quantitative methods based on basic numerical modelling and qualitative methods.
The process followed to arrive at a conceptual design of an energy efficient plant is based on
the problem-solving approach described by Athey [77]. His approach consists of the
following steps:
Formulate the problem to be addressed (Section 1.4).
Define the system within which the problem appears, as well as its boundaries and
its environment (Chapter 2).
Define scenarios within which the solution or solutions must be viable (Chapter 2).
Set objectives to be achieved with the study and the planning horizon (Chapter 2).

The conceptual design of an integrated energy efficient ore reduction plant 21
Describe the existing system and key interrelationships (Chapter 2).
Set performance metrics (Chapter 2).
Set constraints and criteria (technological, economic, psychological, political)
(Chapter 2).
Develop alternative solutions, in this case ECMs that meet the constraints (Chapter
3).
Evaluate alternatives (Chapter 3).
Select the best solution (Chapter 4).
A flow diagram of the problem-solving approach is depicted in Figure 1.
System context
Problem
identification
Screen
alternatives
Preference chart
System change
System utility
function
System simulation
Implementation
plan
Evaluation matrix
Decision process
Selected a
ltern
ative
Solution
implementationSystem changeSystem goals
Sym
pto
ms
Syste
m g
oa
ls
Potential designs
Criteria
Constraints
Feasible alternativ
es Expected performance
Criteria importance
Des
ired
perfo
rman
ce
Ra
nkin
g o
f
alte
rna
tive
s
Figure 1: Flow diagram of the systematic problem-solving approach
This study will deviate somewhat from the process described by Athey for the following
reasons:
A full analysis is beyond the scope of this study.
The process described by Athey focuses on mutually exclusive solutions. In this
study a number of ECMs that will improve the plant’s efficiency have been identified
– actions that are not necessarily exclusive or independent. The challenge is to find
the combination of ECMs that results in the most energy efficient plant within the
bounds of the constraints and with due consideration to the criteria.
The conceptual design of an integrated energy efficient ore reduction plant 22
To reduce complexity the number of scenarios will be limited to two. Scenario 1 will apply to
the AlloyStream Letaba demonstration plant in its location as in 2013. Scenario 2 applies to
the first commercial plant, located next to an ore body with start-up in 2023.
Some of the information in this study is based on observations by the author in his capacity
as the leader of the AlloyStream engineering department from 2006 to present. During that
time the engineering department completed a concept design on a commercial plant and
designed and constructed Letaba. The team typically consisted of five graduate engineers,
five technicians and three engineering assistants.
1.6 Overview of this document
This study takes the reader through a series of steps aimed at answering the three key
questions - how to measure the energy efficiency of the Letaba plant, how can it be
improved and to what level. The problem-solving process described by Athey will be
followed throughout.
Chapter 2, Section 2.6 answers the measurement question, states the relevance of the
problem to AlloyStream, and describes the scenarios, constraints and criteria that potential
and feasible solutions are subject to. In Chapter 3 potential solutions or ECMs are analysed
and their standalone relative worth determined by applying the criteria developed in Chapter
2. The ECMs with the highest relative worth are applied conceptually to the existing plant in
Chapter 4. This leads to a more efficient plant configuration. In Chapter 5 the results from
two ECMs that have been implemented to date are discussed. They are a low-pressure blast
air system and a constant high-ΔT water-cooling system. Chapter 6 concludes the study by
predicting the potential energy efficiency of a commercial plant, given ten years of
technology development. Recommendations on further research to enable the predicted
gains in efficiency to be realised are also made.
1.7 Conclusion
The development of the AlloyStreamTM pyrometallurgical ore reduction process has reached
the commercialisation stage. Plant-wide energy efficiency improvement and energy cost
reduction can significantly change the product’s market appeal. This study was initiated by
AlloyStream to find answers to the three questions posed in Section 1.4.
From the literature study it is clear that substantial improvement in the energy efficiency is
possible and that a host of various measures should be considered for implementation.

The conceptual design of an integrated energy efficient ore reduction plant 23
CHAPTER 2
In Chapter 2 the relevant characteristics of ore reduction plants are discussed; particularly
the characteristics of the plant used as the object of this study. Plant energy efficiency
measurement is discussed. The scenarios within which the existing plant and future plants
will operate are sketched. Constraints applicable to potential measures to improve the
existing plant’s efficiency and criteria that will be applied to select feasible measures are
developed.
The aim of education should be to teach us rather how to think, than
what to think — rather to improve our minds, so as to enable us to think
for ourselves, than to load the memory with thoughts of other men. ~Bill
Beattie

The conceptual design of an integrated energy efficient ore reduction plant 24
2 Ore reduction plants and the plant selected as a case
study
2.1 Overview
Smelters produce metals through ore reduction at a high-temperature. The process involves
mixing ore with a reductant (such as coal), elevating the temperature of the mix in a furnace
to reduce the ore to metal; extract, clean and discard the flue gas, tap and separate the
metal and slag, and refine the metal product to industry standards (Section 2.2).
The Letaba plant is a culmination of many years of research and development. It is
essentially a prototype for commercial plants that should enter the market within the next ten
years. Energy efficiency can be a competitive advantage, hence the importance of this study
to the sponsor (Sections 2.3 and Section 2.4). A basic description of the plant is given in
Section 2.5. In Section 2.7 two scenarios are presented, the system context briefly
discussed and the constraints that solutions will have to meet listed. Hypothesis 1 is also
assessed in Section 2.6. Finally four evaluation criteria and a system utility function are
developed in Section 2.8.
Figure 2: Letaba furnace

The conceptual design of an integrated energy efficient ore reduction plant 25
2.2 Relevant characteristics of pyrometallurgical ore reduction plants
Pyrometallurgical ore reduction plants generally consist of the following sub-systems: raw
material handling, furnace or furnaces, metal and slag handling, off-gas handling, water-
cooling, gas distribution, electricity distribution, waste heat recovery, control and
instrumentation, buildings, cranes and other support systems. The furnace is the most
energy intensive sub-system.
Ore, reductant and fluxes are received, prepared, mixed and charged to the furnace in batch
form or continuously. In the furnace the feedstock is heated to a high temperature to enable
the reduction process. Metal and slag are removed from the furnace as a batch (called
tapping) or continuously. The molten products may leave the furnace separated or in a
combined stream, as is the case with Letaba. The liquid metal and slag are poured from the
furnace into a vessel designed to contain the high-temperature liquid. If the vessel is used to
convey and separate the liquid metal and slag it is called a “ladle” and if the metal and slag
are allowed to solidify in the vessel it is called a “mould” or a “slag pot”. In moulds the liquid
metal and slag are allowed to separate, solidify and cool.
The product-handling system separates metal and slag from the moulds and processes both
to the standard required by clients. Typically the composition, purity and particle size are
specified for metal. For slag the composition, particle size and metal entrainment are
specified.
A typical reduction process is the reduction of manganese and iron oxides to high carbon
ferromanganese containing 76% manganese (Mn), 16% iron (Fe) and 8% carbon (C). The
ore consists of various manganese oxides, ferric oxide (Fe3O4), silica (SiO2), alkali oxides,
and carbonates (CO3). A series of reduction reactions starts at about 400°C with the final
reaction (MnO to Mn) requiring a temperature above 1 250°C [1].
Pure manganese oxide is not found in nature. Invariably the manganese oxide is mined with
sand, iron oxide and other chemical compounds, resulting in a typical manganese content of
25% to 45% by mass in the ore. The reduction process also does not extract all of the
manganese in the ore. The percentage recovery is dependent on a number of factors such
as the temperature of the reaction zone, the carbon monoxide concentration, how well the
reductant and ore are mixed, and the particle size and chemical characteristics of the ore
and reductant.

The conceptual design of an integrated energy efficient ore reduction plant 26
The main types of furnaces used for ferromanganese production are SAFs and blast
furnaces. There are many other types of high-temperature furnace from where measures to
improve energy efficiency can be learned. To name a few:
Open electric arc furnaces.
Vacuum furnaces.
Induction furnaces, mainly used for melting of metals in casting plants.
Basic oxygen furnace used for reducing the carbon content of metals.
Coke furnaces used for converting coal to coke.
Refinery (reforming) furnaces used for cracking of hydrocarbons.
Other furnaces used for reheating of, but not liquefying, materials or metals.
Glass furnaces in which silica is turned into glass.
Waste burning furnaces, or incinerators.
Cement kilns.
Furnaces used for the generation of steam (boilers).
The term “furnace” is derived from the Latin word “formax”, meaning oven. In this study the
term is used for a vessel in which an internal temperature in excess of 1 000ºC (1 273 K) is
reached during normal operation.
Broadly speaking, furnaces are powered primarily by electricity, chemical energy or by a
combination of electricity and chemical energy, as is the case with the Letaba furnace.
A substantial amount of energy is required to generate and maintain the elevated internal
temperature often requiring a fuel source in combination with oxygen enrichment of air or
pure oxygen. Heat is rejected to the environment as waste energy, both through the furnace
walls to the cooling system or surrounding air, to the off-gas and to the environment as the
metal and slag tapped from the furnace cools down.
Some or all of the parts of a furnace shell require intense cooling to maintain structural
integrity. The walls of the furnace and off-gas ducting are usually cooled with forced air,
water film, pressurised water jackets or spray-cooling with water. Where water-cooling is
employed the water temperature is kept below 60ºC to reduce scale formation. This makes
heat recovery from the cooling water impractical. The heated water is usually cooled through
evaporation, with evaporation rates in the order of 1 kg water for every 2 000 kJ of waste
heat rejected. Water-cooling appears to be a low capital cost, highly effective method of
cooling, but the hidden costs, such as pump power and make-up water cost can be
significant.

The conceptual design of an integrated energy efficient ore reduction plant 27
This study focuses on AlloyStream’s Letaba prototype plant for the production of
ferromanganese. The plant is described in the following sections.
2.3 The history of AlloyStream
The development of the AlloyStreamTM technology started in the last decade of the previous
century when direct reduction of iron ore was tested in a liquid iron holding furnace in the
then Iscor’s Newcastle plant. Bench-scale testing eventually culminated in the first
commercial plant being built in Iscor’s Vereeniging Works. This plant had to be shut down
due to a system failure during commissioning in 1999 and was subsequently
decommissioned without producing any steel from iron ore.
After comprehensive reassessment, a process model applicable to ferromanganese
production was developed. A small test furnace with related support systems was
constructed in Pretoria to validate the process model and test various refractory and other
hardware configurations. HC FeMn was successfully produced over three campaigns (or
production runs) in this test facility named Rivet. Campaign durations were from three to five
months.
In 2006, AlloyStream intended to proceed with designing and building their first commercial
plant. Due to the sub-prime financial crisis of 2008/2009, which caused the selling price of
HC FeMn to drop from $2 300/ton to $800/ton, a lower cost pre-commercial proposal was
accepted. The proposal was based on a substantial upgrade of Rivet. In 2009, funds were
obtained for the upgrade but due to financial constraints most of the existing equipment was
reused and plant energy efficiency could not be substantially addressed.
The upgrade entailed increasing the design output of the Rivet facility from 220 kg/hour
HC FeMn to 1 070 kg/hour by modifying some existing sub-systems and replacing others
with larger sub-systems. In the case of the furnace, the internal diameter increased from
2.5 m to 5.3 m necessitating a new shell, a new refractory lining, a new water-cooled
system, a completely new off-gas handling system and other less important changes.
Letaba started its first production run (or campaign) in February 2012. By October 2012 it
produced more than 3 500 ton of HC FeMn. In October 2012 the furnace had to be shut
down due to a premature furnace refractory failure. From October 2012 to July 2013 the
refractory was replaced and some modifications made to the plant. Letaba campaign 2
started in August 2013 and is underway at the time of print.
The conceptual design of an integrated energy efficient ore reduction plant 28
The Letaba plant serves a number of purposes:
It demonstrates the AlloyStreamTM process technology
It enables plant-wide technology development, including equipment reliability
improvements
It enables process operation and equipment maintenance knowledge growth
2.4 Relevance of this study to AlloyStream
The technology being developed by AlloyStream to produce HC FeMn competes with
technologies that have been around for more than a century [79]. Some of the advantages of
the AlloyStreamTM technology are that the electrical energy use per product ton is
substantially less than that of existing technology, and small fraction ore can be processed.
The three main energy streams into Letaba are electricity at 100c/kWh (or 28c/MJ), fuel gas
(natural gas supplied by SASOL) at 7.1c/MJ, and coal at 2c/MJ (excluding the transport cost
for coal). This ratio is expected to stay fairly constant over the next two decades. It would
therefore make economic sense to reduce the use of electricity from the grid by firstly
converting as much as possible waste heat to electricity, and secondly burning additional
coal to generate the balance. This study focuses on the first part of such a strategy. The self-
generation option is explored in Chapter 6.
Energy cost (not necessarily consumption) is a key factor in deciding the economic feasibility
of a smelter. AlloyStream aims to enter the market by 2018 and therefore must use the time
and facility available to at least demonstrate, on a pilot basis, ECMs that will be incorporated
in future commercial plants.
In addition, technology in the energy sector is developing rapidly. An example is PV
technology where the conversion efficiency is increasing and the unit cost reducing
consistently [78]. A similar trend can be identified for heat-to-power conversion cycles such
as KRC and ORC, hence the importance of incorporating energy management, not only at
the existing plant, but also at a company level. In this regard ISO 50001 is a comprehensive
energy management standard that aims to achieve continual energy improvements [80].
This study could be an important step for AlloyStream to become ISO 50001 compliant.
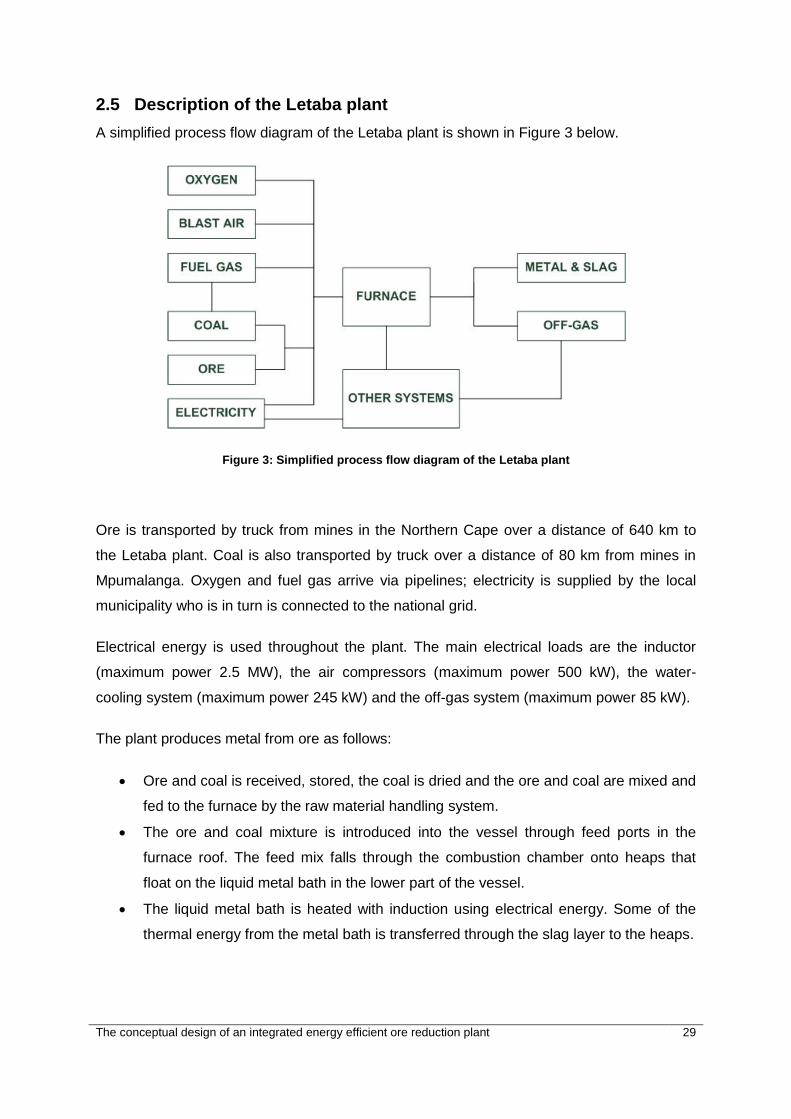
The conceptual design of an integrated energy efficient ore reduction plant 29
2.5 Description of the Letaba plant
A simplified process flow diagram of the Letaba plant is shown in Figure 3 below.
Figure 3: Simplified process flow diagram of the Letaba plant
Ore is transported by truck from mines in the Northern Cape over a distance of 640 km to
the Letaba plant. Coal is also transported by truck over a distance of 80 km from mines in
Mpumalanga. Oxygen and fuel gas arrive via pipelines; electricity is supplied by the local
municipality who is in turn is connected to the national grid.
Electrical energy is used throughout the plant. The main electrical loads are the inductor
(maximum power 2.5 MW), the air compressors (maximum power 500 kW), the water-
cooling system (maximum power 245 kW) and the off-gas system (maximum power 85 kW).
The plant produces metal from ore as follows:
Ore and coal is received, stored, the coal is dried and the ore and coal are mixed and
fed to the furnace by the raw material handling system.
The ore and coal mixture is introduced into the vessel through feed ports in the
furnace roof. The feed mix falls through the combustion chamber onto heaps that
float on the liquid metal bath in the lower part of the vessel.
The liquid metal bath is heated with induction using electrical energy. Some of the
thermal energy from the metal bath is transferred through the slag layer to the heaps.
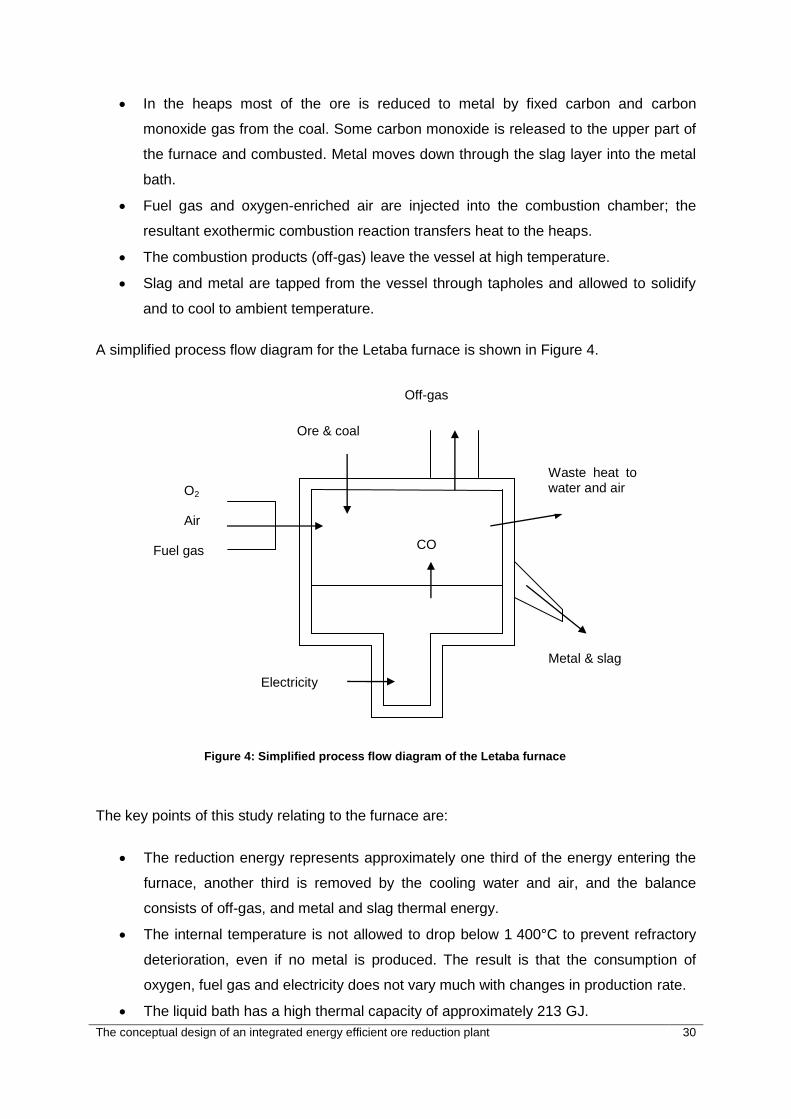
The conceptual design of an integrated energy efficient ore reduction plant 30
In the heaps most of the ore is reduced to metal by fixed carbon and carbon
monoxide gas from the coal. Some carbon monoxide is released to the upper part of
the furnace and combusted. Metal moves down through the slag layer into the metal
bath.
Fuel gas and oxygen-enriched air are injected into the combustion chamber; the
resultant exothermic combustion reaction transfers heat to the heaps.
The combustion products (off-gas) leave the vessel at high temperature.
Slag and metal are tapped from the vessel through tapholes and allowed to solidify
and to cool to ambient temperature.
A simplified process flow diagram for the Letaba furnace is shown in Figure 4.
The key points of this study relating to the furnace are:
The reduction energy represents approximately one third of the energy entering the
furnace, another third is removed by the cooling water and air, and the balance
consists of off-gas, and metal and slag thermal energy.
The internal temperature is not allowed to drop below 1 400°C to prevent refractory
deterioration, even if no metal is produced. The result is that the consumption of
oxygen, fuel gas and electricity does not vary much with changes in production rate.
The liquid bath has a high thermal capacity of approximately 213 GJ.
O2
Air
Fuel gas
Electricity
Ore & coal
Off-gas
Metal & slag
Waste heat to water and air
CO
Figure 4: Simplified process flow diagram of the Letaba furnace
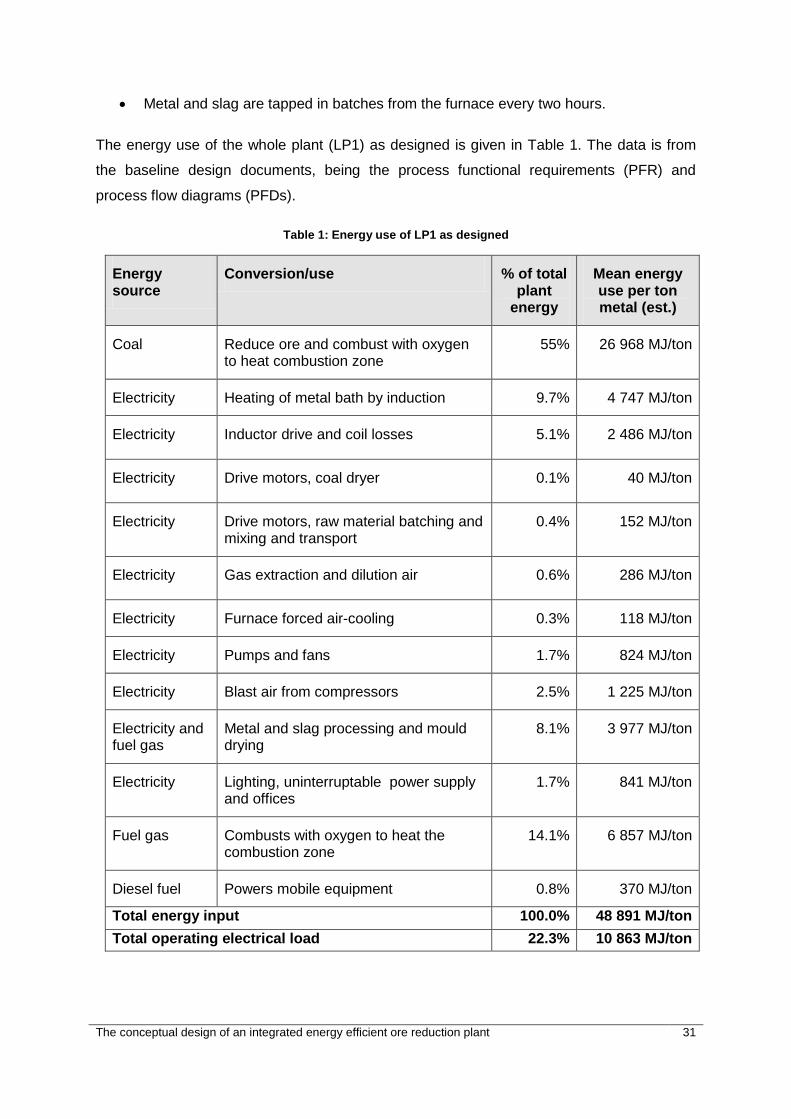
The conceptual design of an integrated energy efficient ore reduction plant 31
Metal and slag are tapped in batches from the furnace every two hours.
The energy use of the whole plant (LP1) as designed is given in Table 1. The data is from
the baseline design documents, being the process functional requirements (PFR) and
process flow diagrams (PFDs).
Table 1: Energy use of LP1 as designed
Energy source
Conversion/use % of total plant
energy
Mean energy use per ton metal (est.)
Coal Reduce ore and combust with oxygen to heat combustion zone
55% 26 968 MJ/ton
Electricity Heating of metal bath by induction 9.7% 4 747 MJ/ton
Electricity Inductor drive and coil losses 5.1% 2 486 MJ/ton
Electricity Drive motors, coal dryer 0.1% 40 MJ/ton
Electricity Drive motors, raw material batching and mixing and transport
0.4% 152 MJ/ton
Electricity Gas extraction and dilution air 0.6% 286 MJ/ton
Electricity Furnace forced air-cooling 0.3% 118 MJ/ton
Electricity Pumps and fans 1.7% 824 MJ/ton
Electricity Blast air from compressors 2.5% 1 225 MJ/ton
Electricity and fuel gas
Metal and slag processing and mould drying
8.1% 3 977 MJ/ton
Electricity Lighting, uninterruptable power supply and offices
1.7% 841 MJ/ton
Fuel gas Combusts with oxygen to heat the combustion zone
14.1% 6 857 MJ/ton
Diesel fuel Powers mobile equipment 0.8% 370 MJ/ton
Total energy input 100.0% 48 891 MJ/ton
Total operating electrical load 22.3% 10 863 MJ/ton
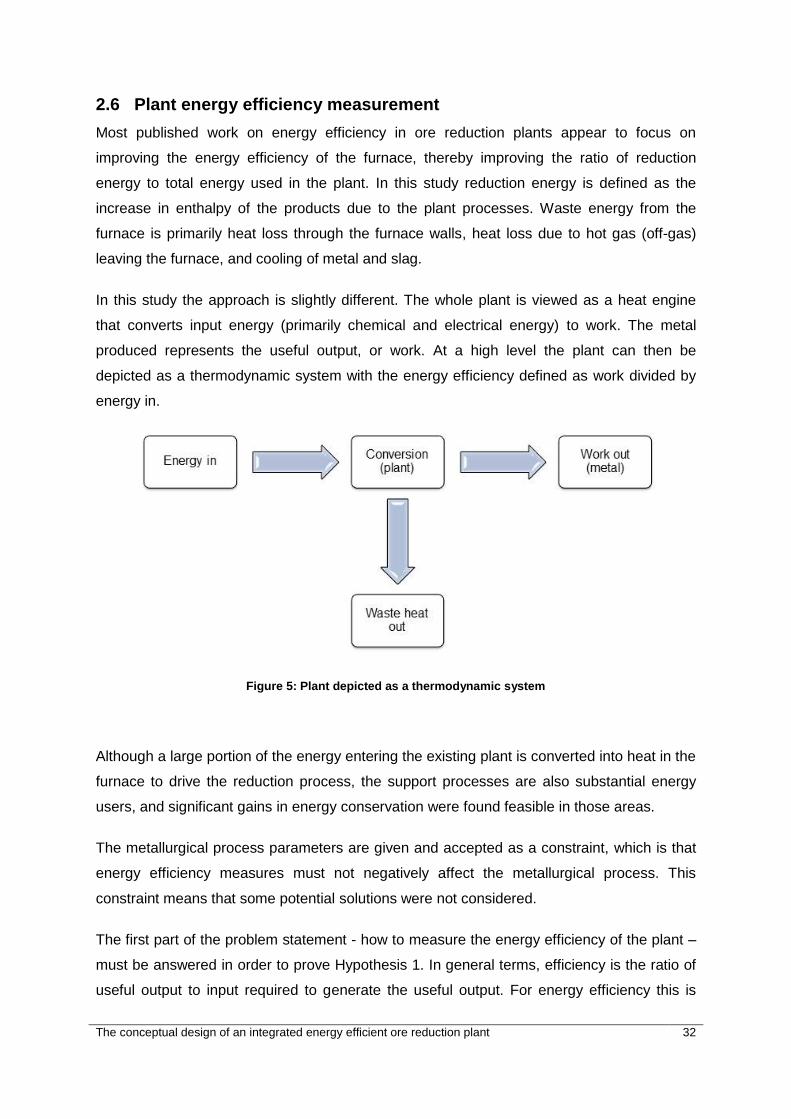
The conceptual design of an integrated energy efficient ore reduction plant 32
2.6 Plant energy efficiency measurement
Most published work on energy efficiency in ore reduction plants appear to focus on
improving the energy efficiency of the furnace, thereby improving the ratio of reduction
energy to total energy used in the plant. In this study reduction energy is defined as the
increase in enthalpy of the products due to the plant processes. Waste energy from the
furnace is primarily heat loss through the furnace walls, heat loss due to hot gas (off-gas)
leaving the furnace, and cooling of metal and slag.
In this study the approach is slightly different. The whole plant is viewed as a heat engine
that converts input energy (primarily chemical and electrical energy) to work. The metal
produced represents the useful output, or work. At a high level the plant can then be
depicted as a thermodynamic system with the energy efficiency defined as work divided by
energy in.
Figure 5: Plant depicted as a thermodynamic system
Although a large portion of the energy entering the existing plant is converted into heat in the
furnace to drive the reduction process, the support processes are also substantial energy
users, and significant gains in energy conservation were found feasible in those areas.
The metallurgical process parameters are given and accepted as a constraint, which is that
energy efficiency measures must not negatively affect the metallurgical process. This
constraint means that some potential solutions were not considered.
The first part of the problem statement - how to measure the energy efficiency of the plant –
must be answered in order to prove Hypothesis 1. In general terms, efficiency is the ratio of
useful output to input required to generate the useful output. For energy efficiency this is
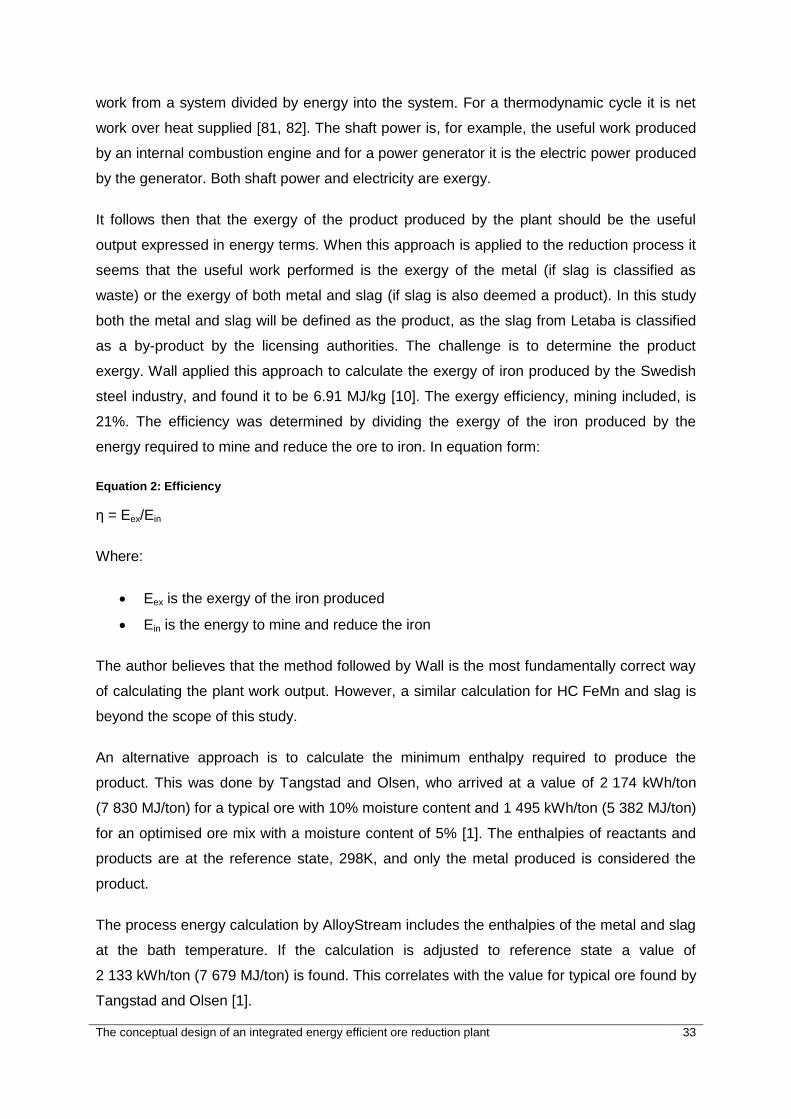
The conceptual design of an integrated energy efficient ore reduction plant 33
work from a system divided by energy into the system. For a thermodynamic cycle it is net
work over heat supplied [81, 82]. The shaft power is, for example, the useful work produced
by an internal combustion engine and for a power generator it is the electric power produced
by the generator. Both shaft power and electricity are exergy.
It follows then that the exergy of the product produced by the plant should be the useful
output expressed in energy terms. When this approach is applied to the reduction process it
seems that the useful work performed is the exergy of the metal (if slag is classified as
waste) or the exergy of both metal and slag (if slag is also deemed a product). In this study
both the metal and slag will be defined as the product, as the slag from Letaba is classified
as a by-product by the licensing authorities. The challenge is to determine the product
exergy. Wall applied this approach to calculate the exergy of iron produced by the Swedish
steel industry, and found it to be 6.91 MJ/kg [10]. The exergy efficiency, mining included, is
21%. The efficiency was determined by dividing the exergy of the iron produced by the
energy required to mine and reduce the ore to iron. In equation form:
Equation 2: Efficiency
η = Eex/Ein
Where:
Eex is the exergy of the iron produced
Ein is the energy to mine and reduce the iron
The author believes that the method followed by Wall is the most fundamentally correct way
of calculating the plant work output. However, a similar calculation for HC FeMn and slag is
beyond the scope of this study.
An alternative approach is to calculate the minimum enthalpy required to produce the
product. This was done by Tangstad and Olsen, who arrived at a value of 2 174 kWh/ton
(7 830 MJ/ton) for a typical ore with 10% moisture content and 1 495 kWh/ton (5 382 MJ/ton)
for an optimised ore mix with a moisture content of 5% [1]. The enthalpies of reactants and
products are at the reference state, 298K, and only the metal produced is considered the
product.
The process energy calculation by AlloyStream includes the enthalpies of the metal and slag
at the bath temperature. If the calculation is adjusted to reference state a value of
2 133 kWh/ton (7 679 MJ/ton) is found. This correlates with the value for typical ore found by
Tangstad and Olsen [1].
The conceptual design of an integrated energy efficient ore reduction plant 34
Deciding what the energy input to the plant is not as straightforward as it seems. The
industry standard for the furnace is not clear – BHP Billiton and Assmang consider the
electrical energy input only, whilst AlloyStream considers both electrical and coal as energy
inputs, but not oxygen. In this study the rule “if it enters the plant and is significant, include it”
was followed. Here significant means any energy stream that exceeds 20 kW averaged over
24 hours, therefore solar energy should be included: a controversial approach. The problem
becomes more complex if the boundaries are moved upstream to include for instance the
point where the reductant and ore is mined. Should direct solar power be included for the
mines? Is the electricity entering the plant generated by burning coal or is a mix of
technologies used? Questions like these are beyond the scope of this study, but they are
important. In order to improve the understanding of the effect of the plant on the energy use
in the plant’s environment the study ventures somewhat outside the boundaries of the plant
to include estimates of:
Energy to mine ore and coal
Energy to transport materials
Coal-to-electricity conversion, assuming a coal-fired power plant
Energy required to generate oxygen
Solar energy entering the plant (the only solar energy considered)
In figure 6 these energy flows are presented in diagram form.
The author arrived at the conclusion that the plant energy efficiency can be measured –
Hypothesis 1 is true. As calculating the exergy of the product is beyond the scope of this
study the work produced by the plant will be taken as the process enthalpy from Tangstad
and Olsen for the production of metal from typical ore, i.e. 2 174 kWh/ton metal, or 7 830
MJ/ton metal. Two plant input energy values will be used to calculate two plant energy
efficiencies. The first input energy value will not include solar radiation and is abbreviated as
G2GEE1 (gate to gate energy efficiency). The second input energy value includes solar
radiation and is abbreviated G2GEE2. A third efficiency value, called the source to gate
energy efficiency, or S2GEE will also be calculated. To calculate S2GEE the energy input to
the ore and coal mine, transport energy, energy to produce electricity and oxygen will be
included in the denominator. This answers Question 1 of the problem statement (How can
the energy efficiency of the existing plant be determined?). Figure 6 displays the significant
energy streams included in the calculations. The plant efficiencies determined in this study is
reported in Chapter 6.
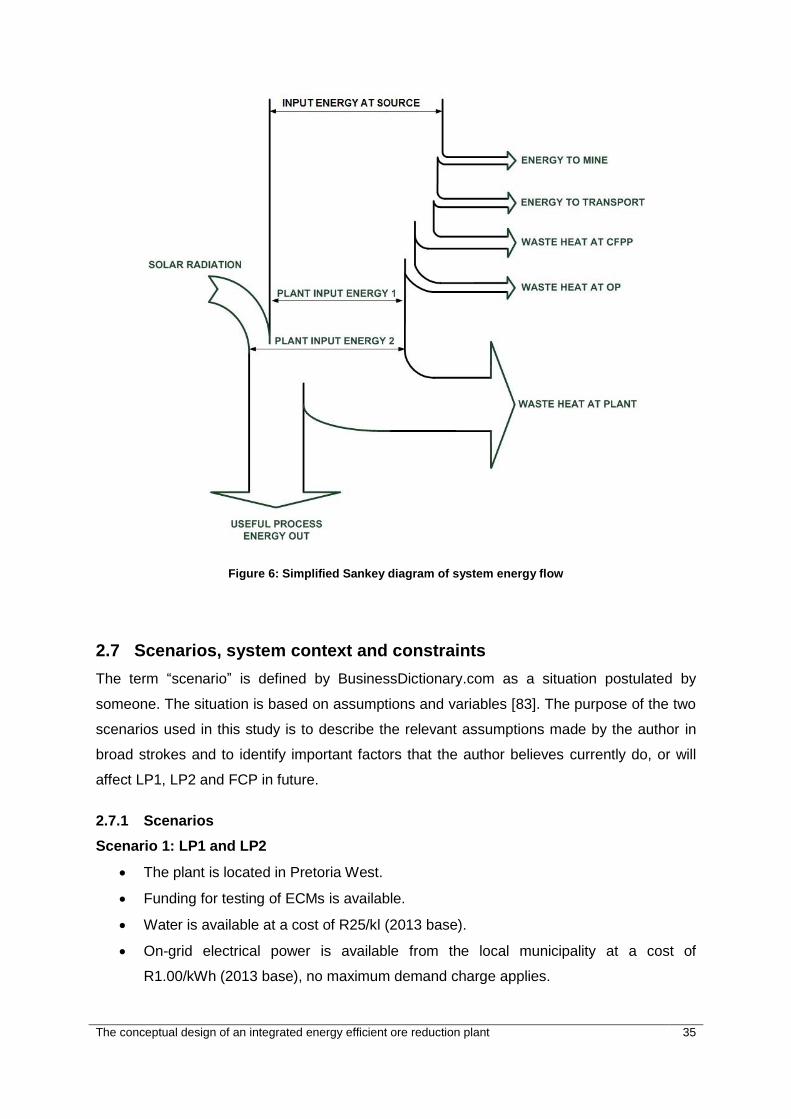
The conceptual design of an integrated energy efficient ore reduction plant 35
Figure 6: Simplified Sankey diagram of system energy flow
2.7 Scenarios, system context and constraints
The term “scenario” is defined by BusinessDictionary.com as a situation postulated by
someone. The situation is based on assumptions and variables [83]. The purpose of the two
scenarios used in this study is to describe the relevant assumptions made by the author in
broad strokes and to identify important factors that the author believes currently do, or will
affect LP1, LP2 and FCP in future.
2.7.1 Scenarios
Scenario 1: LP1 and LP2
The plant is located in Pretoria West.
Funding for testing of ECMs is available.
Water is available at a cost of R25/kl (2013 base).
On-grid electrical power is available from the local municipality at a cost of
R1.00/kWh (2013 base), no maximum demand charge applies.

The conceptual design of an integrated energy efficient ore reduction plant 36
On-grid electrical power cost will increase by 12% per year for the next five years;
thereafter it will increase at the rate of inflation.
Ferromanganese prices will rise in rand terms at the rate of inflation.
Safety legislation is stringent and expected to tighten.
Skilled labour is expensive and less available in future.
Support systems are well developed and in close vicinity.
The coal mine is 80 km from the plant.
The ore mine is 640 km from the plant.
The furnace has a reduction reaction surface area of 22 m².
Fuel gas (natural gas from SASOL) is available at a cost of R3.00/kg (2013 base).
The cost is expected to increase at the rate of inflation.
Coal is available at a cost of R490/ton at the mine (2013 base).
The plant will operate up to 2023.
Scenario 2: FCP is located next to the ore body
The plant is located in Hotazel, South Africa.
Water is a scarce resource; a new pipeline will have to be installed delaying project
start-up and increasing water cost to R35/kl (2013 base).
On-grid electrical power is available from ESCOM at an equivalent cost of 70c/kWh
(2013 base) [84].
On-grid electrical power cost will rise by 8% per year over the life of the plant.
Water cost will rise by 10% per year over the life of the plant.
Ferromanganese prices will rise in rand terms at the rate of inflation.
Safety legislation is stringent and expected to tighten.
Skilled labour is very expensive and scarce.
The coal mine is 720 km from the plant.
The ore source is next to the plant.
The plant has a reduction reaction surface area of 220 m².
Fuel gas is not available.
Coal is available at a cost of R490/ton at the mine (2013 base).
The plant enters operation in 2023 and operates for a minimum of twenty years.
No external oxygen supply will be available.
Funds are available to incorporate energy efficiency and opex reduction measures.
Coal is transported to the plant by road.
ECM technology will reduce in cost and improve in efficiency.

The conceptual design of an integrated energy efficient ore reduction plant 37
2.7.2 System context
Scenario 1 will be considered in this study as a background to determining the effect of the
ECMs selected for implementation on LP1. In Chapter 6, Scenario 2 will be used as
background to predict the potential efficiency and cost of FCP.
A context diagram for Letaba and future plants is shown in Figure 7.
Figure 7: System context diagram
The boundary of the plant can be drawn in a number of ways. According to Athey the
boundaries are determined by the authority of the chief decision maker, in this case the plant
owner [77]. In this study the boundary is the physical boundary of the plant.
For Letaba fuel gas supply, oxygen and electrical generation to feed the grid fall outside the
boundaries of the plant, so the generation of those three commodities are external to LP1
and LP2.
The sensitivity of key external interfaces is now briefly reviewed in order to identify potential
opportunities and threats that could affect both Letaba and the first commercial plant.
Ore supplier:
The AlloyStreamTM technology has a beneficial effect on the ore supplier – waste ore can be
sold, increasing revenue and profitability and reducing environmental footprint.
The conceptual design of an integrated energy efficient ore reduction plant 38
Coal supplier:
Coal suppliers will view the AlloyStreamTM technology as positive as it uses more coal than
the alternative SAF process, neglecting coal burned in thermal power plants to supply the
SAF-based process with electricity. Coal suppliers fetch a higher price for coal from
AlloyStream than from the state-owned power utility.
Electricity supplier:
The electricity supplier should view an AlloyStream plant in a positive light since it means
more business for the utility. Energy efficiency improvements - yielding a reduction in
electricity use - could also be viewed as positive, and even more so if the plant can become
a net producer of electricity that is fed into the supplier’s grid.
Oxygen, fuel gas and water suppliers:
All three suppliers should view Letaba in a positive light even though consumption may
reduce, since the plant’s operational life could be extended. They will probably have a
neutral position towards FCP.
Local community:
Letaba has generated more than 100 direct jobs; FCP will generate more than 150. Both
plants will, however, impact negatively on the physical environment, even though
AlloyStream will attempt to minimise the impact. FCP could also be in competition with the
local community for scarce natural resources, such as energy and water, although industrial
development often improves the availability of these resources. Solutions resulting in a
reduction in electricity usage (and even possibly producing excess electricity) and a
reduction in water consumption will be viewed as positive by the community.
Controlling authorities:
The controlling authorities should have a positive to neutral position with regards to FCP.
Any reduction in consumption of natural resources will probably be viewed as positive, as
will measures limiting the negative impact on the environment.
Slag user:
AlloyStream has successfully had its slag classified as a by-product. Slag produced by
Letaba is used as a replacement for sand in the cement product manufacturing process. The
local cement product industry should view an AlloyStream plant as positive since it improves
their profitability.

The conceptual design of an integrated energy efficient ore reduction plant 39
Investors:
The potential solutions have both a negative (increased capex) and positive (reduced opex,
faster start-up) impact on the return on investment. Investments are primarily determined by
the bottom line: the payback period will probably be the dominant criterion applied when
selecting feasible solutions. It is likely that the long-term benefits of improved energy
efficiency will be welcomed by the investors.
2.7.3 Constraints
The constraints applicable to LP2 and FCP are:
Payback period must be less than twenty years for ECMs to be considered as viable.
The performance of the reduction process must not be negatively affected.
Statutory requirements must be met.
Oxygen must be internally generated for FCP.
Only solutions that are commercially available at present may be incorporated into
LP2.
Solutions that may only be proven in ten years’ time can be considered as options for
FCP.
Ackoff, as does Athey, cautions against application of constraints early in the problem-
solving process [85]. It is important to have visions of a better state, and this vision
generating process can be hampered by one’s own assumptions of what is possible, in other
words self-imposed constraints. Ackoff promotes what he calls proactive planning – a
process in which a future goal is created and ways devised to approach the goal as effective
as possible. The author attempted to follow this ideal throughout this study.
Table 2 describes some elements of a desired future state and the related present state of
the elements.
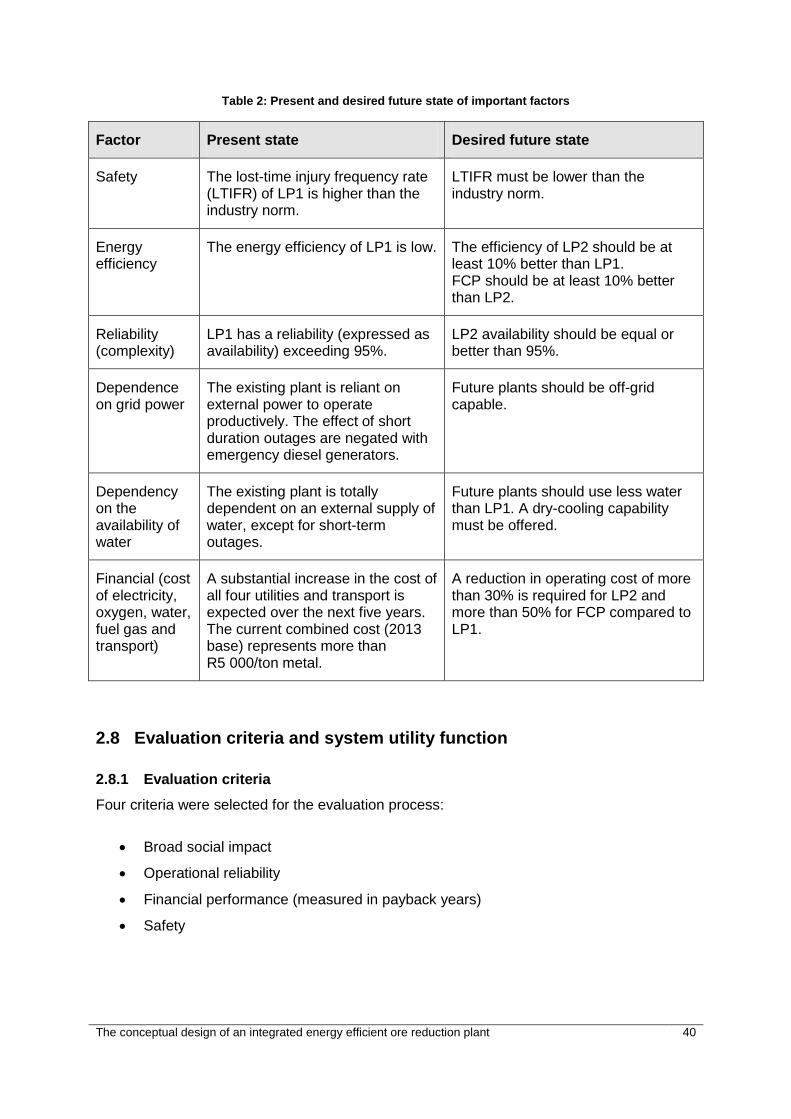
The conceptual design of an integrated energy efficient ore reduction plant 40
Table 2: Present and desired future state of important factors
Factor Present state Desired future state
Safety The lost-time injury frequency rate (LTIFR) of LP1 is higher than the industry norm.
LTIFR must be lower than the industry norm.
Energy efficiency
The energy efficiency of LP1 is low. The efficiency of LP2 should be at least 10% better than LP1. FCP should be at least 10% better than LP2.
Reliability (complexity)
LP1 has a reliability (expressed as availability) exceeding 95%.
LP2 availability should be equal or better than 95%.
Dependence on grid power
The existing plant is reliant on external power to operate productively. The effect of short duration outages are negated with emergency diesel generators.
Future plants should be off-grid capable.
Dependency on the availability of water
The existing plant is totally dependent on an external supply of water, except for short-term outages.
Future plants should use less water than LP1. A dry-cooling capability must be offered.
Financial (cost of electricity, oxygen, water, fuel gas and transport)
A substantial increase in the cost of all four utilities and transport is expected over the next five years. The current combined cost (2013 base) represents more than R5 000/ton metal.
A reduction in operating cost of more than 30% is required for LP2 and more than 50% for FCP compared to LP1.
2.8 Evaluation criteria and system utility function
2.8.1 Evaluation criteria
Four criteria were selected for the evaluation process:
Broad social impact
Operational reliability
Financial performance (measured in payback years)
Safety
The conceptual design of an integrated energy efficient ore reduction plant 41
These criteria are similar to the criteria proposed by Aflaki et al. [86]. Basic definitions of the
criteria are:
Broad social impact (abbreviated to “social” in this study) – this criterion
incorporates the non-quantifiable value of the ECM as seen by parties in the
immediate and general environment of the plant. Examples of parties are investors,
local community, potential clients, non-governmental organisations, as well as
governmental organisations focused on community development and environmental
issues.
Operational reliability – this criterion attempts to describe the non-financial impact
on the plant due to the expected reliability of the ECMs that are considered for
implementation. Billinton and Allen [87] define reliability as “the probability of a device
performing its function as intended under the operating conditions encountered for
the time period required”. In this study device means the hardware related to the
ECM. Operating conditions means the impact that other systems have on the ECM,
including maintenance and operating practices. Time period is interpreted as the
expected lifespan of the ECM hardware, typically twenty years.
Financial performance – a simple payback model was used with payback period
calculated as the cost of implementing the ECM divided by the savings per year (in
most cases due to less energy use). It is assumed that where existing equipment is
replaced the replaced equipment has no financial value.
Safety - under this criterion only the risk posed to people employed at the plant as a
result of ECM failure is considered, and only while operating the equipment. The risk
during construction is not considered.
2.8.2 Ranking of criteria
The four criteria were ranked by Johan Groenewald (the AlloyStream general manager), the
author and Johan Nel (an independent consultant with sound understanding of the industry).
The individual ratings are shown in Table 3 in the sequence that the individuals are
mentioned above. The ratings by the three individuals are close, indicating considerable
agreement on the relative values of the criteria.

The conceptual design of an integrated energy efficient ore reduction plant 42
Table 3: Preference chart
2.8.3 System utility function
The next step in the process is to develop a utility function for each criterion that defines
poor to good performance. Five performance levels are used:
Barely acceptable (score 1 or 2)
Below average (score 3 or 4)
Average (score 5 or 6)
Above average (score 7 or 8)
Exceptional (score 9 or 10)
The full utility function is attached as Appendix A. The method followed to determine the
safety score is explained below.
The safety criterion models the probability of operating personnel being harmed by the
system. It is the combined probability of system failure AND the probability that the failure
will harm people in the immediate vicinity AND the probability that people are in the
immediate vicinity of the system [88]. Performing a sound event probability calculation is
beyond the scope of this study. A simple albeit subjective approach was followed. To arrive
at a single score (1 to 10) each of the three factors was allocated a value from the system
utility function for each ECM and the following calculation performed:
Criteria Financial Safety Reliability Social Total
Financial 3,3,3 3,1,2 0,1,0 6,5,5
Safety 1,1,1 1,1,2 0,1,0 2,3,3
Reliability 1,3,3 3,4,3 1,2,0 5,9,6
Social 4,4,3 4,4,4 3,4,4 11,12,11
Totals 6,8,7 10,11,10 11,6,11 1,4,0 (24,28), (29,29), (25,28)
Combined and normalised 6 8 5 1
Sequence of questions: top to left, e.g. Is financial (top) more or less important than safety (left). All three evaluators scored a 1, meaning “less”.
Meaning of values: 0 - much less, 1 – less, 2 – equal, 3 – more, 4 – much more

The conceptual design of an integrated energy efficient ore reduction plant 43
Equation 3: Simple probability calculation
Value = (factor1+factor2+factor3)/3.
A panel familiar with the plant did the scoring. The team consisted of the author, Stella
Gleimius (a senior process engineer) and Murray Duigan (a senior mechanical engineer).
Each ECM was rated and scored against each of the four criteria; each score was qualified
with a confidence rating. The confidence rating was allocated by the author. Only three
confidence levels were used and these levels are defined as follows:
Low confidence (score 0.1) - the author has no experience of the ECM and no
independent publications could be found.
Medium confidence (score 0.5) - the author has experience of the ECM, and/or
independent publications not directly related to the ECM were found, and/or
datasheets from potential suppliers were found and/or experienced persons agreed
with the values.
High confidence (score 0.9) – Similar or identical systems were studied by
AlloyStream and/or implemented on Letaba and/or commercially valid quotations
were received and/or directly applicable independent publications were found.
2.9 Conclusion
The development of the AlloyStreamTM technology has progressed to the present state
where a prototype plant is in operation. As part of the product development program energy
efficiency must be addressed, even if only on a conceptual level. Energy efficiency is a
market requirement for any new smelter and even more so when the smelter is based on
new process technology. Investors must be confident that the required efficiency will be met
before funds for construction will be released.
In this chapter two scenarios were developed, one applicable to Letaba and the other
applicable to FCP. Constraints that potential solutions will have to meet were identified and
listed. A system utility function and four criteria that will be used to evaluate the feasible
ECMs were developed and the relative importance of the criteria determined.

The conceptual design of an integrated energy efficient ore reduction plant 44
CHAPTER 3
In Chapter 3 twenty ECMs are defined. The energy conservation performance of each ECM
is predicted and the ECM rated against the four criteria (as discussed in Chapter 2). A
confidence rating is attached to the value rating of each ECM. The relative worth, or value, of
each ECM is then determined. The calculations and reasoning that were followed to arrive at
the predicted energy conservation achieved by each ECM are described.
When a man does not know what harbour he is making for, no wind is
the right wind. ~Seneca
The conceptual design of an integrated energy efficient ore reduction plant 45
3 Design strategies for an energy efficient plant
3.1 Overview
Considering the information emanating from the literature survey it became clear that energy
efficiency improvement can be achieved by the following strategies:
1. Improve the efficiency of converting electric power to shaft power, or heat in the case
of the inductor.
2. Utilise solar radiation at the plant to generate electricity, and natural lighting to reduce
the electrical load.
3. Improve the efficiency of mechanical devices driven by electric motors (such as
gearboxes, conveyors, compressors and pumps).
4. Reduce the thermal energy leaving the furnace through the furnace walls.
5. Use waste heat to dry raw material, and/or heat to heat gases, and/or ore and coal,
before it enters the furnace.
6. Use waste heat to drive a heat engine to generate electricity.
7. Use pressure energy from the oxygen entering the plant via pipeline to generate
electricity.
It is also clear that a number of alternative measures could be considered under the same
strategy; some would be mutually exclusive, hence the need for some structured selection
process. By determining relative value the selection of the most promising measures can be
made in a defendable manner.
In this chapter the various strategies are expanded to energy conservation measures and
the performance of each ECM is predicted on a standalone basis.
3.2 Strategies and available technologies
Thermodynamics and heat transfer play a dominant role in pyrometallurgical plants. It is
therefore prudent to briefly review the laws of thermodynamics and the applicable principles
of heat transfer.
Thermodynamics primarily addresses the transformation of heat into other forms of energy
and vice versa. Ever since man learned how to make and control fire he has been searching
for ways to turn heat into work.

The conceptual design of an integrated energy efficient ore reduction plant 46
Heat transfer is a branch of engineering that studies the transfer of heat, which is invariably
important to thermodynamics. Both branches of science are based on proven principles (or
laws in the case of thermodynamics).
The first and second laws of thermodynamics are of particular interest to this study. The first
law of thermodynamics dictates the conservation of energy (excluding nuclear reactions).
For a system that converts heat into work, the heat entering the system equals the work
produced by the system, plus the heat leaving the system. This is represented by the
following equation:
Equation 4: First law of thermodynamics
Qin = Wout + Qout [81,82]
Where:
Wout is the work produced by the system
Qout is the heat leaving the system
The second law dictates that not all heat entering a thermodynamic cycle can be converted
into work [81,82]. The best possible conversion efficiency is given by the following equation
[81,82]:
Equation 5: Maximum second law cycle efficiency
P = 1 – T0/Tmax
Where:
T0 is the ambient temperature
Tmax is the maximum temperature of the Carnot Cycle
Although the zeroth and third law of thermodynamics are background to this study, a
humorous and quite revealing interpretation of the first, second and third laws of
thermodynamics, called Gingsberg’s theorem [89], with an analogous formulation of the
zeroth law states:
Zeroth law: You have to play the game
First law: You cannot win
Second law: You cannot break even
Third law: You cannot even get out the game
The conceptual design of an integrated energy efficient ore reduction plant 47
Exergy, or thermodynamic availability, is the maximum work that can be done by a
thermodynamic system. In other words, exergy is work done by a system or the ability of the
system to do work. Mathematically [10]:
Equation 6: Thermodynamic system’s work produced by a reversible process from state 1 to state 2
Exergy (Ex) =U1 – U2 – T0 (S1 – S2) [10]
Where:
U the internal energy
T0 is the heat sink temperature (or temperature of the environment or ambient
temperature)
S is the entropy at states 1 and 2
The exergy of materials is calculated in a similar manner for a substance, except that the
environmental state of the species forming the substance is considered [10].
Kern defines heat transfer as “the science which deals with the rates of exchange of heat
between hot and cold bodies”. Heat can be transferred from a hot body to a cold body by
four mechanisms: conduction, convection, radiation and diffusion [90].
The implication of these principles for this study is three-fold – not all the heat generated by
Letaba can be recovered (otherwise no heat transfer can occur) and only a portion of the
heat recovered can be turned into work (or electricity) according to the second law of
thermodynamics.
Two main types of energy enter the plant: electrical and chemical. The plant uses the energy
to:
Enable the reduction process.
Transport materials such as ore, metal and slag.
Transport fluids (gases and water).
Maintain the conditions necessary for the plant to operate (cool the furnace shell and
the inductor coil, provide sufficient lighting and ventilation et cetera).
In this study the plant is viewed as a thermodynamic system that turns input energy into
useful work and rejects waste heat. The purpose of the plant is to produce metal from ore.
The theoretical energy required for this reaction is the reduction work or exergy. The energy
efficiency of the plant is defined as the ratio of exergy to energy entering the plant, or
product exergy to input energy. The first law of thermodynamic dictates that the energy
The conceptual design of an integrated energy efficient ore reduction plant 48
entering the plant equals the energy leaving the plant. The second law of thermodynamic
dictates that the exergy entering the plant must be more than the exergy leaving the plant.
The product from the plant was defined as metal; the exergy of the metal was not calculated.
To overcome the lack of information a pragmatic approach is followed and the metal
enthalpy calculated by Tangstad and Olsen for a typical ore used as an estimate of the
product exergy [1].
Various ECMs can be considered to improve the energy efficiency of LP1. These are:
1. Improve the efficiency of converting electric power to shaft power, or heat in the case
of the inductor.
High-efficiency motors and drives: improving the conversion efficiency of
electrical-to-mechanical power in the case of electrical motors is commercially
viable and was introduced during the construction of the Letaba plant to a
limited degree.
ECM1: Replacing all the remaining motors with high-efficiency units.
Inductor efficiency: the inductor installed on the Letaba furnace was reused
from the previous Rivet plant and has an efficiency of 66%. Current designs
offer efficiencies of 71%.
ECM2: Replacing the unit with a higher efficiency unit.
2. Intensify natural lighting: when Rivet was upgraded to Letaba the existing high-
efficiency lighting was retained. Augmenting these with light pipes, or light tubes,
during daylight hours will reduce the electricity use.
ECM3: Installing light tubes.
3. Utilise solar radiation to generate electricity:
The Letaba plant area is approximately 10 000 m2, with 4 000 m2 under
roof. Two commercial solar-to-electricity technologies exist: PV (solar
energy is converted directly into electricity), and solar thermal (a fluid is
heated in solar collectors, and the collected heat is then used by a heat
engine such as Stirling, Rankine or Organic Rankine to produce electricity).
Both technologies are proven, but only PV will be considered for LP2.
The conceptual design of an integrated energy efficient ore reduction plant 49
ECM4: Using solar-to-electricity technologies.
4. Improve the efficiency of mechanical devices driven by electricity, such as
gearboxes, fans, conveyors, compressors, pumps and so forth:
The selection of existing devices was only based on cost and availability, so
some room for improvement in energy efficiency is possible.
ECM5: Improving mechanical efficiency.
Note:
One measure was implemented with the upgrade from Rivet to Letaba –
improving the water-cooling circuit resulted in a significant reduction in
specific pump power. Since it was already present when Letaba was built it
is considered part of the LP1 configuration and is therefore not discussed in
this chapter. After the first campaign a second measure was implemented –
installing a low-pressure blast air system, as discussed in Section 3.3 as
ECM5b. Both the improved water-cooling system and the low-pressure
blast air system will be reviewed in Chapter 5.
5. Reduce the thermal energy leaving the furnace through the furnace walls:
The heat loss through the furnace walls is substantial. About 30% of the
inductor output and 40% of the combustion heat output exit the furnace
through the refractory lining. Apart from the roof, no significant reduction of
heat loss can be achieved by modifying the refractory, leaving the option of
increasing the shell temperature to reduce the ΔT across the refractory.
ECM6: Redesigning the roof refractory.
ECM7: Increasing the shell (and roof) temperature.
6. Use waste heat to heat ore and coal before it enters the furnace and/or to heat blast
gases, and/or to dry raw material:
So-called preheating of raw material with waste heat is a potential solution
that is applied with some success in other pyrometallurgical processes.
ECM8: Preheating raw material.
The conceptual design of an integrated energy efficient ore reduction plant 50
Preheating of combustion gas is a standard solution in especially glass
furnaces.
ECM9: Preheating of combustion gas.
Drying feed material was identified by a number of sources. Coal drying
with waste heat will be considered for LP2.
ECM10: Drying coal with waste heat.
7. Use waste heat to drive a heat engine to generate electricity:
Recovering waste heat and converting some of the thermal energy to
electricity is a potential solution applied in various industries. This is
unquestionably a potential solution, but the question is which
thermodynamic cycle to apply. In this regard six cycles were considered:
SC, BC, SRC, ORC, KRC and a combined Brayton-ORC cycle.
ECM11: Converting off-gas waste heat to electricity.
ECM12: Converting metal and slag waste heat to electricity.
ECM13: Converting waste heat from the cooling circuits of the furnace to
electricity.
8. Use pressure energy from the oxygen entering the plant to generate electricity or
replace electrical drives:
Recovery of pressure energy from gas streams is applied in the oil and gas
industry by turbo-expanders and turbo-generators.
ECM14: Recovering pressure energy from gas streams.
The ECMs identified all meet the constraint of being internal to Letaba. Being self-sufficient
(where oxygen and electricity generation are concerned) could be a requirement for future
deployment of the AlloyStreamTM technology; this is briefly discussed in Chapter 6.
The conceptual design of an integrated energy efficient ore reduction plant 51
3.3 ECM performance simulation
The performance simulation of the ECMs considered is based on the assumption that they
are implemented one at a time on LP1, and that only a single ECM is implemented at any
time.
3.3.1 ECM1 – Replace existing IE1 motors with high-efficiency IE3 motors
The motor failure probability is very low and should a failure occur the risk to people would
be very low. There are seldom people in close proximity to the motors. Only three of the
existing motors are high-efficiency or IE3 standard. An estimated 700 kW motor power is IE1
rated. Replacing the IE1-rated units with IE3-rated units will reduce electricity use by at least
3% [91], resulting in a total expected reduction in electricity use of 21 kW. At 100c/kWh and
a replacement cost of R1 040/kW [92] the payback period is between four and five years at
8 500 operating hours per year. The replaced motors will be kept as spares. The payback
period correlates closely with Chen et al. [19], who found it to be 4.7 years. No change in
reliability is expected. The social value is deemed insignificant.
Safety score = 10, very confident.
Financial score = 7, very confident.
Reliability score = 9, very confident.
Social score = 4, confident.
3.3.2 ECM2 – Upgrade the inductor to a high-efficiency configuration
Upgrading the inductor should not change the risk profile of the existing unit. As is the case
with ECM1, this ECM does not add additional hardware. The failure probability of the
modification is low (the upgrade is a standard for all new ABP inductors). Should the inductor
fail it is likely that people in its vicinity will be harmed, but no-one is allowed close to the unit.
A 5% reduction in electricity use of the coil is predicted by the inductor system supplier ABP.
The power loss in the coil before upgrading is 853 kW; after the upgrade it reduces to 804
kW; a reduction of 49 kW in electrical power use. At 100c/kWh and a capex cost of
R5 000 000 (budget price from the supplier), the payback period is five to six years. The
inductor reliability should not change because of the upgrade. The improvement of the
inductor efficiency will be welcomed by the project sponsor.
Safety score = 8, very confident.
Financial score = 6, very confident.
Reliability score = 5, very confident.
Social score = 5, confident.

The conceptual design of an integrated energy efficient ore reduction plant 52
3.3.3 ECM3 – Augment existing lights with light tubes during daytime
The Environmental Regulations for Workplaces of the Occupational Health and Safety Act
(Act 85 of 1993) specifies a minimum luminance for foundries (charging floor, tumbling,
cleaning etc.) of 100 lux. The luminance of sunlight at peak is close to 100 000 lux/m² and on
average over an 8 hour period is about 40 000 lux/m². Using the average luminance 1 m² of
light tube can illuminate 400 m². However, to compensate for inefficiencies and lower light
levels early and late in the day a ratio of 1:200 will be used. The ratio compares with the
recommended ratio of 1:200 from SunbirdSkylights [93]. This means that the roof area
covered by light tubes will only be 0.5% and will therefore have an insignificant effect on
ECM4. Solar light tubes will have a low failure rate with minor effect on people in the vicinity.
There are sometimes people in the vicinity of the tubes. The cost is R85/m2 for the light
tubes plus an estimated R30/m2 for the installation [93]. The total capex is R460 000 for an
area of 4 000 m2. An electricity use reduction of 20% for the existing lights is predicted.
Based on the existing lighting electrical load of 50kW at 100c/kWh the payback period is five
to six years. The system should be very reliable. Due to the high visual impact and low
technology level the social value is deemed high.
Safety score = 7, very confident.
Financial score = 7, very confident.
Reliability score = 9, very confident.
Social score = 7, very confident.
3.3.4 ECM4 – Use PV solar to generate electricity
It is highly unlikely that the system will fail in such a way that it can harm people in the
immediate vicinity. It is also unlikely that anyone will be in the immediate vicinity. The cost of
commercially available mono-crystalline cells is about R25/W with conversion efficiency in
optimum conditions of 17%. This was confirmed with a local supplier [49]. This conversion
efficiency will not be achieved due to the orientation of the roof, losses in the wiring and
losses in the inverters. An overall efficiency of 8% will instead be used.
The capex cost, including installation, is estimated at R4 000/m2 including storage batteries
and inverters, or about R3 000/m2 excluding batteries. Almost the full roof area of 4 000 m2
can be used. At 5 kWh/(m2.day) solar radiation [11] and 8% effective overall conversion
efficiency (solar radiation to power) 1 600 kWh per day of electrical power can be generated.
The expected lifespan of the panels is more than ten years. The payback period (excluding
maintenance) is twenty to twenty-one years for a system with no batteries. This payback
period does not meet the constraint imposed on ECMs to be twenty years or less. However,
the social value of the ECM is so significant that the constraint will be waived for this ECM.

The conceptual design of an integrated energy efficient ore reduction plant 53
Although regular cleaning will be required the ECM should be very reliable, and the social
value very high.
Safety score = 9, very confident.
Financial score = 1, very confident.
Reliability score = 8, confident.
Social score = 9, confident.
3.3.5 ECM5 – Improved mechanical device efficiency
The ranking of electricity use by mechanical devices (all driven by electrical motors) are:
Compressors 364 kW Fixed speed direct online (DOL) motors
Water pumps 150 kW Fixed speed DOL motors
Induced draft fan 75 kW Driven through VSD, fitted with VVID
Crushing plant 15 kW Fixed speed DOL motors
Conveyors 30 kW Fixed speed DOL motors
Various other small loads 40 kW Mostly driven through VSDs
3.3.6 ECM5a – Install VSDs on all drives above 3 kW
The average power draw of devices not fitted with VSDs is 559 kW. The compressor power
and the crusher will not be considered as part of this ECM, as the low-pressure blast system
(ECM5b) replaced the compressors and the crusher is either run on full power, idled or
stopped. The remaining drives will be fitted with VSDs to achieve a predicted power
reduction of 5% due to more accurate load matching. The cost of VSDs is approximately
R600/kW based on a budget price from WEG [92]. The payback period will be one to two
years. In comparison Chen et al. found the payback period to be 0.3 years [19]. Fitting VSDs
to motor drives will not affect safety adversely, nor should it reduce reliability. The social
value is deemed insignificant.
Safety score = 10, very confident.
Financial score = 9, very confident.
Reliability score = 7, confident.
Social score = 4, confident.
3.3.7 ECM5b – Use low-pressure blast air
Improvements could be possible by redesigning the mechanical devices or systems driven
by the electric motors; the most significant of these was done as part of this study when a
low-pressure blower system was installed to replace the blast air system supplied by the

The conceptual design of an integrated energy efficient ore reduction plant 54
compressors. Another significant improvement in this category was the redesign of the
water-cooling system to a high-ΔT design. The water plant redesign is already incorporated
in LP1. It is therefore not included as an ECM to upgrade LP1 to LP2. The low-pressure
blast air and redesigned water-cooling systems are discussed in Chapter 5. The low-
pressure blast air system will form ECM5b.
ECM5b replaced two screw compressors and a high-pressure air measurement, control and
distribution system with twelve individual blowers. System pressure dropped from 7.5 bar to
3 kPa. It is very unlikely that the blowers will fail in such a way that they could cause harm to
someone in the vicinity. They are placed in an area that is occasionally visited by plant
personnel.
The blowers, VSDs, additional hoses and measuring systems cost R1 500 000 (capex). It
reduced the electricity use from 364 kW to 48 kW, an opex reduction of R316/hour. The
payback period is less than one year. The new system’s reliability should be at least as good
as the system it replaced. The social value is deemed significant.
Safety score = 8, very confident.
Financial score = 9, very confident.
Reliability score = 7, confident.
Social score = 6, very confident.
3.3.8 ECM6 – Reduce heat loss by upgrading the furnace roof refractory
The LP1 furnace roof is lined with an in situ cast refractory with a thickness of 150 mm. The
WA350 mild steel panels are water-cooled at 40°C. In the glass industry it is common
practice to use brick-type refractory for the gas furnace roofs instead of refractory casting (as
is the case with LP1). This will require a redesign of the roof panels and feed ports as the
brick refractory is 450 mm thick and will increase the existing refractory mass by a factor of
3. The new refractory configuration will result in heat loss reducing from 1 000 kJ/s to
350 kJ/s for the same ΔT across the lining. The new refractory mass is estimated at 27 ton.
At a cost of R15 000/ton the capex for the new refractory will be R405 000. The new steel
roof will have a mass of about 15 ton at R40 000/ton; resulting in a cost of R600 000. Eight
new feed ports will cost R50 000 each. The cost estimates are taken from the 2012 Rivet to
LP1 upgrade. The total estimated capex is R1 405 000. A reduction in fuel gas use of 16g/s
(56 kg/hour) is predicted, yielding an opex reduction of R168/hour. The payback period is
less than a year. No significant change in the safety risk is foreseen. The reliability should be
better than the existing design. The social value is deemed insignificant.
The conceptual design of an integrated energy efficient ore reduction plant 55
Safety score = 7, very confident.
Financial score = 9, very confident.
Reliability score = 5, very confident.
Social score = 5, confident.
3.3.9 ECM7 – Reduce heat loss through the furnace walls and roof by increasing the
cooling fluid temperature
The existing shell is cooled over 80% of its area with water that is circulated through water
channels under 6 bar pressure; the balance being cooled with forced and natural air
movement. In addition, the slag line is cooled with water-cooled copper blocks situated
inside the refractory lining. The roof is fully water-cooled. The water temperature circulating
through the cooling circuits is maintained between 40°C and 50°C. The water-cooling
system, and especially the copper coolers, ensures a very high rate of heat removal relative
to the heat transfer from the gas, slag or liquid metal to the refractory hot face. This
promotes a self-healing mechanism (called a “freeze lining”) that ensures extended
refractory life.
Although the forming and maintaining of freeze linings is not an exact science, it is known
that a high heat transfer rate from the heat source to the cooling medium causes the hot
surface temperature of the refractory in contact with for example, liquid slag, to drop below
the solidification temperature of the liquid. By properly selecting the refractory and cooling of
the cold side of the refractory the liquid will solidify against the refractory hot face and protect
the refractory from thermal accelerated abrasive wear and chemical deterioration.
Accelerated wear was experienced firsthand with Rivet campaigns 1 to 3. In preparation for
Rivet campaign 4 copper-cooling blocks were introduced in the slag-line area and at the
taphole, resulting in a significant reduction in wear. For Letaba the design was extended to
two rows of coolers, yielding even better results.
The temperature of the cold face is not as important as the ability of the cooling system to
maintain the temperature at very high heat fluxes. In theory the existing practice of
circulating water at about 40°C at a pressure of about 6 bar can be replaced with water at a
much higher pressure and temperature, for example 20 bar absolute and 180°C, 32°C below
the boiling point at 20 bar absolute.
This approach, however, poses a significant risk. If a circuit fails at 20 bar pressure and
temperature of 180°C, the water will flash boil resulting in a mixture of steam and boiling
water being released at high velocity - a lethal combination to anyone in the vicinity of the
The conceptual design of an integrated energy efficient ore reduction plant 56
failure. High-pressure circuits will also require a complete redesign of the existing
components, thus increasing capital cost. Water treatment is also affected – at temperatures
above 60°C the water quality becomes critical as dissolved salts, mainly calcium carbonate,
tend to precipitate out and deposit on the metal surfaces, thereby reducing the heat transfer
coefficient [94].
An alternative to high-pressure water is thermal oil. Typical applications are in ORC systems
where an oil temperature of 300°C and oil pressures of 2 to 3 bar are common. [95].
Thermal oil also poses significant risk, but less so than high-pressure hot water. The oil
pressure is low and no flash boiling will occur in the event of the release of fluid. Thermal oil,
however, has an additional risk – it will ignite if comes into contact with oxygen and a high
temperature ignition source such as someone welding in the vicinity of a leak. Only the
thermal oil system will be considered in this study.
The physical characteristics of thermal oil differ from water (the existing cooling fluid) in the
following significant ways:
1. The oil viscosity at 316°C is 0.462 cP [93], slightly less than the water viscosity of
0.547 cP at 50°C. Therefore, the Reynolds number, and as a result the pressure drop
for the same wetted perimeter and flow rate, will be very close to that of water.
2. The specific heat of oil is about 2.8 kJ/kg.K, or 67% that of water [93], so for the
same heat transport rate (kJ/kg.s) the mass flow of oil will have to be 30% more than
that of water; or the ΔT will have to be 30% more than that of water.
3. The upper working temperature limit of thermal oil is about 350°C [93]; with water the
upper limit is pressure-dependent. For example, large power station boilers operate
at pressures of about 200 bar At that pressure the boiling temperature is 366°C.
An average oil temperature of 300°C will be used for the evaluation (typically 280°C into the
circuits and 320°C out). An inductor-cooling circuit has not been considered due to the
critical nature of the inductor coil and refractory.
Given the above, it is safe to assume that for ECM7 the existing water-cooled components
will not have to be replaced. The total capex therefore includes the cost of new piping, new
pumps, an oil reservoir, oil, and an oil-to-air heat exchanger (or heat exchangers). This is
estimated as R5 000 000. The opex saving will include less fuel gas use, less electricity use
by the inductor, water pumps and cooling towers and less water evaporation.
Since the ΔT across the refractory will change from 1 500°C for water-cooling to 1 250°C for
thermal oil-cooling, the heat loss through the furnace walls will be reduced by 18%. This
The conceptual design of an integrated energy efficient ore reduction plant 57
translates to a reduction in heat loss of 872 kJ/s, of which 30 kJ/s is from the coolers that are
in contact with the liquid metal. Therefore, a reduction in inductor input power of 30 kW can
be expected. The calculated reduction in fuel gas consumption is 21kg/hour or R63/hour.
The oil circulation pump and heat exchanger fan power draw are assumed to be the same
as the power reduction on the water pumps and cooling tower fans. Water evaporation
should reduce by 0.8 kl/hour or R20/hour. The total opex reduction is R128/hour, giving a
payback period of four to five years. The thermal oil system will increase the safety risk.
From a social point of view oil spills would have a negative implication whilst the reduction in
water consumption will be positive. The social value is deemed low.
Safety score = 4, confident.
Financial score = 7, very confident.
Reliability score = 5, very confident.
Social score = 3, confident.
3.3.10 ECM8 – Preheat raw materials
Preheating of raw materials could have benefits [23], however, for Letaba there are
significant constraints. Since the raw material is a mix of ore and coal, the raw material
cannot be preheated to more than 400°C - the point where the coal will start to devolatilise. It
is also difficult to transfer heat reliably to the solid mix. For example: a raw material
preheating system was installed in a titanium oxide smelter in 2002, but the system was
never put into operation successfully (confirmed by the author during personal discussions
with the plant manager). This option is deemed potentially unreliable and could pose
substantial safety risks.
The solution will entail a major change to the furnace building design (to gain height), an
additional conveyor and eight heat exchangers at an estimated additional cost of
R10 000 000. Preheating to 250 °C reduces the oxygen use by 10% giving a cost reduction
of R67/hour. The payback period is seventeen to eighteen years. The heating will be done
with thermal oil from ECM7. The social value is deemed insignificant.
Safety score = 5, confident.
Financial score = 2, low confidence.
Reliability score = 3, confident.
Social score = 4, confident.
The conceptual design of an integrated energy efficient ore reduction plant 58
3.3.11 ECM9 – Preheat blast air
Fuel gas, pure oxygen and air are injected into the furnace combustion chamber through
twelve injection ports via stainless steel lances. Eight lances are supplied with air and
oxygen with the remaining four supplied with fuel gas and air. A typical overall mass flow
ratio is 1:2:6 (fuel gas: oxygen: air). Heating of oxygen is ruled out for safety reasons, as is
heating of fuel gas to prevent cracking of the hydrocarbons. A 250°C air temperature limit
was applied due to practical constraints imposed by the configuration of the furnace, and to
suit the operating temperature of the thermal oil. The benefit of preheating is a reduction in
either the fuel gas flow or the oxygen flow – only oxygen reduction is considered. To preheat
the blast air will require twelve heat exchangers, an increase in flow resistance resulting in
an increase in blast air power and stainless steel piping. It is assumed that hot oil is available
from ECM7.
Based on a preheat temperature of 250°C, a 15% reduction in oxygen use or 149 kg/hour is
predicted [9], resulting in a saving of R104/hour. The estimated capex is R3 000 000, giving
a payback period of three to four years. The safety risk will be similar to ECM7. The social
value is deemed significant.
Safety score = 4, confident.
Financial score = 7, confident.
Reliability score = 7, confident.
Social score = 6, confident.
3.3.12 ECM10 – Use waste heat to dry coal
Coal drying has to be done continuously to reduce the water content of the coal from 12% to
below 4%.This is done to enable flow through the batching system and to reduce the
negative effect due to evaporation of the water in the furnace. During the drying process the
maximum coal temperature is limited to 100°C to reduce the risk of spontaneous
combustion. In LP1 coal drying is done in a shell and tube heat exchanger with heat supplied
by combusting fuel gas.
Sufficient thermal energy (196 kJ/s) is available in the off-gas leaving the stack to dry the
coal. An off-gas-to-oil heat exchanger, pump, piping, thermal oil tank and oil-to-coal heat
exchanger will be required at an estimated capex of R3 000 000. The reduction in fuel gas
use is estimated at R54/hour. The estimated electrical load of the circulation pump is 5 kW.
The payback period will be six to seven years. The use of hot oil introduces risks similar to
ECM7. The social value is deemed insignificant.

The conceptual design of an integrated energy efficient ore reduction plant 59
Safety: score = 4, confident.
Financial: score = 6, confident.
Reliability: score = 7, confident.
Social: score = 4, confident.
3.3.13 ECM11 – Use off-gas waste heat to generate electricity
From an engineering point of view there are two challenges:
How to transfer as much as possible of the off-gas thermal energy to the working
fluid of the heat engine.
How to achieve the best heat-to-power conversion by the engine.
Before each potential solution is discussed it is necessary to note some challenges and
limitations applicable to all potential solutions discussed under ECM11.
Off-gas characteristics:
Apart from the mass flow and temperature the dust load in the off-gas is significant. LP1
experienced a dust load of 92 kg/hour during campaign 1. Invariably a heat exchanger will
be used to transfer the thermal energy from the dust-laden off-gas to the engine’s working
fluid; this heat exchanger must function efficiently and reliably. Dust is “sticky” in the 1 550°C
to 1 200°C temperature range as it is still in partial molten state. This rapidly clogs heat
exchanger surfaces and is difficult to remove.
There are a number of possible ways to overcome the problem [35]. One option is to reduce
the off-gas temperature by injecting air at the point where the gas exits the furnace; another
option is to employ mechanical scrapers to clean the heat exchanger tubes. For safety
reasons some air injection is required to combust any CO or H2 that may enter the off-gas
system. This dilution air reduces the thermal energy availability (reduces the temperature of
the gas entering the heat exchanger), and thus the potential conversion efficiency, as well as
reducing the temperature difference needed for high heat transfer rates. Dilution air also
increases the thermal energy leaving the heat exchanger.
Heat transfer fluids:
The SC, KRC and ORC engines use thermal oil to collect heat from the heat source and
transport the heat to the engine where the heat is transferred to the engine’s working fluid.
With the SRC and BC engines there is no intermediate fluid. The use of a heat transfer fluid
can introduce additional heat transfer losses.
The conceptual design of an integrated energy efficient ore reduction plant 60
Maximum and minimum temperatures:
The maximum temperature that the heat exchanger can be subjected to is limited by
material considerations. This limit is set at 1 300°C off-gas temperature, which is the upper
limit of a Kanthal APMT tube [75]. A minimum off-gas temperature of 250°C sets the lower
temperature boundary. This minimum temperature is needed to prevent condensation of
corrosive gases and steam before or in the bag-house. This is to prevent bag blinding and
corrosion of the bag-house structure. If thermal oil is used a maximum oil temperature of
350°C must not be exceeded to prevent oil degradation.
Heat transfer:
The KRC, ORC and SRC receive heat energy through boiling of a liquid at almost constant
temperature. Thermal energy of the off-gas below the boiling temperature, plus the
temperature difference required to transfer the heat from the gas to the boiling liquid, cannot
be utilised. In the case of the BC engine heat is transferred to the working fluid (air) at
constant pressure. It is thus theoretically possible to achieve an almost constant temperature
difference between the off-gas and air as heat is transferred to the BC engine.
The overall heat transfer coefficient of the off-gas heat to the engine affects the heat transfer
rate. This coefficient is determined by the coefficients of:
The off-gas-to-thermal oil and thermal oil-to-working fluid for the SC, KRC and ORC
The off-gas-to-air for the BC
The off-gas-to-boiling water and steam for the SRC
The minimum (or pinch) temperature difference is set at 80°C for the SC, KRC, ORC and
SRC. The minimum (or pinch) temperature difference is set at 160°C for the BC.
A high heat exchanger surface area will result in lower temperature differences and increase
the thermal energy that can be recovered from the off-gas, but will increase the heat
exchanger cost. Less surface area will have the opposite effect.
Heat rejection from the heat engines:
KRC, ORC, SRC and SC are “closed”, meaning the working fluid does not leave the engine.
In the KRC, ORC and SRC the working fluid is expanded through a turbine, then condensed
in a heat exchanger and pumped back to the boiler. To achieve a high thermal efficiency the
working fluid must be condensed at the lowest possible temperature; usually attained by
evaporating water in cooling towers. In the SC the working fluid must similarly reject heat to
the sink at the lowest possible temperature. The BC rejects heat to the environment at a
The conceptual design of an integrated energy efficient ore reduction plant 61
much higher than ambient temperature by discharging the working fluid (air) continuously to
the environment – no cooling water is required.
Energy available:
The off-gas mass flow is 1.73 kg/s, cp = 1.38; gas temperature leaving the furnace is
1 550°C; ambient dry bulb temperature is 21°C; thus giving 3 640 kJ/s sensible heat leaving
the furnace. The maximum thermal energy available to a heat recovery engine is:
ṁ x cp.(1550-250) = 3 104 kJ/s minus the thermal energy that cannot be utilised due to the
pinch temperature.
3.3.13.1 ECM11a – Stirling Cycle
The only SC engine considered is the low-temperature unit under development by Cool
Energy Inc. [97]. The unit receives heat at a maximum of 300°C and rejects heat to a cooling
water circuit at about 21°C – values very similar to the ORC offered by Turboden.
Engines based on the SC have their origin in the early 1800s. The theoretical cycle has the
same efficiency as the Carnot Cycle. Stirling engines can yield thermal efficiencies of more
than 40% at a hot-end temperature of 760°C [98] and 25% at 300°C with a cold-end
temperature of 20°C [97]. The engine transfers heat internally between a hot and cold
surface with a gas (air, nitrogen or helium) as a working fluid. This results in the engine
having a low specific power output, in other words it has to be large to produce significant
power.
Based on a thermal oil temperature of 300°C and a pinch temperature of 80°C, thermal
energy can be transferred to the SC from the off-gas at a rate of 2 793 kJ/s. With a cycle
thermal efficiency of 24% a gross 670 kW will be generated. The net electrical output,
however, is 670 kW minus oil, water pumps and cooling tower power (estimated at 100 kW)
and a 2% loss in the inverter required to convert the direct current output of the engine to
alternating current. The resultant power is 557 kW resulting in a reduction in grid electricity
cost of R557/hour. The capex is estimated at R50 000/kW for the engine once in mass
production (information from a personal discussion with the general manager of Cool
Energy).
Other component costs are R600/kW for the inverter, R500/kW for controls, R3 000/(kJ/s) for
the off-gas-to-oil heat exchanger, bypass ducting and dampers, oil tank, oil piping and
pumps. The existing cooling towers, cooling water tanks and pumps will be used; the total
capex is estimated as R36 841 000. Based on the electricity generation income of
R557/hour minus a water use cost of R101/hour the payback period will be nine to ten years.

The conceptual design of an integrated energy efficient ore reduction plant 62
The thermal oil circuit will increase the safety risk. The system is complex, but the existing
heat rejection system will be retained as a back-up. The ECM is deemed to have significant
social value.
Safety score = 6, very confident.
Financial score = 4, low confidence.
Reliability score = 7, confident.
Social score = 6, confident.
3.3.13.2 ECM11b – Externally fired Brayton Cycle
The BC compresses air in a compressor, heats the air in a heat exchanger in the externally
fired heat configuration, expands the hot air through an expansion device, then exhausts the
air to atmosphere. As such the BC does not require an intermediate heat transfer fluid or
cold-end heat exchanger with the resultant water loss. Externally heated (or fired) gas
turbines (EFGT) are not freely available.
Commercially available gas turbines that can be converted to external heating have low
compression ratios; as a result they have low thermal efficiencies compared to the internally
heated (with liquid or gas fuel) high-pressure turbines. Flexenergy’s MT250 turbine has a
thermal efficiency of 20% at full power with an estimated turbine inlet temperature of 950°C
without recuperation (as would be the case for external heating) and 29% at air inlet
temperature of 20°C with recuperation [99]. The compressor outlet temperature is 236°C for
a compressor efficiency of 80%. With a minimum temperature difference of 160°C between
the off-gas and the compressed air 2 755 kJ/s can be transferred to the turbine. A thermal
efficiency of 20% yields a power output of 551 kW.
The cost of the turbine is R16 000/kW (budget price estimate from Flexenergy), the cost of
the heat exchanger is estimated at R5 000/(kJ/s) and R500/kW is estimated for piping. Total
capex is estimated at R25 622 000 with an electricity cost reduction of R551/hour giving a
payback period of six to seven years. Stationary gas turbines are very reliable, requiring a
major service every 100 000 hours [99]. The social value is deemed significant.
Safety score = 8, very confident.
Financial score = 6, confident.
Reliability score = 7, confident.
Social score = 6, confident.
The conceptual design of an integrated energy efficient ore reduction plant 63
3.3.13.3 ECM11c – Steam-based Rankine Cycle
Typical commercial plants run at 60 bar absolute steam pressure with 170°C superheat
[100]. A thermal efficiency of 18% can be expected. The boiling temperature at 60 bar
absolute is 280°C [101]. With a pinch temperature of 80°C, 2 841 kJ/s of thermal energy can
enter the cycle, giving a gross power output of 510 kW. Pumping and cooling plant power is
estimated at 90 kW, giving a net electrical power output of 420 kW.
The cost of the turbine is R5 000/kW [100], the cost of the heat exchanger is R3 000/(kJ/s),
and the cost of piping and control is R500/kW. The total capex is estimated at R12 896 000.
The water cost is calculated as R99/hour. The payback period is three to four years. The
reliability of a steam system is expected to be lower than an ORC. The social value is
deemed significant.
Safety score = 7, very confident.
Financial score = 7, confident.
Reliability score = 6, confident.
Social score = 6, confident.
3.3.13.4 ECM11d – Organic Rankine Cycle
Typical commercial plants run at 20 bar pressure with no superheat [32]. A thermal efficiency
of 20% can be achieved at a boiling temperature of 250°C [96]. With a pinch temperature of
80°C, 2 912 kJ/s of off-gas heat can enter the cycle, giving a power output of 582 kW.
Pumping and cooling tower power is estimated at 99 kW, giving an electrical power output of
492 kW.
The cost of the ORC is R30 000/kW [102], the cost of the heat exchanger and thermal oil
circuit is R3 000/(kJ/s), and the cost of piping and control is R500/kW. Total capex is
estimated at R23 700 000. This correlated with the budget price from Vuselela Energy,
obtained in 2010 [103]. The cost of cooling water used is R99/hour. The payback period is
five to seven years. The social value will be significant.
Safety: score = 8, very confident.
Financial score = 6, very confident.
Reliability score = 7, very confident.
Social score = 6, confident.
3.3.13.5 ECM11e – Kalina Rankine Cycle
A thermal efficiency slightly better than ORC can be achieved by the KRC, so an efficiency
of 22% will be used to calculate the electrical output. More heat can enter the system due to
The conceptual design of an integrated energy efficient ore reduction plant 64
the different boiling points of the dual working fluid [104, 31]. It is estimated that 3% more
heat will enter the cycle than with the ORC, or 3 000 kJ/s, giving a gross power output of 660
kW. Pumping and cooling tower power is estimated at 100 kW. The net electrical power
output will be 560 kW.
The cost of the system is expected to be more than the ORC due to the number of heat
exchangers and the lower market penetration of the KRC. Capex is estimated at
R34 500/kW which is 15% more than the ORC. The cost of cooling water used is R99/hour.
A thermal oil circuit and heat exchanger will be required (similar to ECM11a, ECM11c and
ECM11d). The cost estimate for the oil circuit, heat exchanger and controls is R3 500/(kJ/s).
The total estimated capex is R28 600 000 and the reduction in electricity cost is R560/hour.
The payback period is six to seven years. The social value is deemed significant.
Safety score = 8, very confident.
Financial score = 5, very confident.
Reliability score = 7, very confident.
Social score = 6, confident.
3.3.13.6 ECM11f – EFGT-ORC combined cycle
In this option an ORC receives the waste heat from the EFGT at 80°C less than the exhaust
gas exit temperature from the EFGT. The ORC boiling temperature is set at 180°C with a
thermal efficiency of 15% [38]. A total of 2 204 kJ/s exists the EFGT at 588°C of which 1 229
kJ/s enters the ORC. The ORC generates 144 kW. The combined power output is 695 kW.
Pumping and cooling tower power is estimated at 60 kW, giving an electrical power output of
635 kW and a water cost of R54/hour. Capex is R35 400 000 (from ECM11b and ECM11d).
The payback period is six to seven years. The social value is deemed significant.
Safety score = 7, very confident.
Financial score = 6, confident.
Reliability score = 6, confident.
Social score = 6, confident.
3.3.14 ECM12 – Use waste heat to electricity from metal and slag
Two ton metal and two ton slag are tapped from the LP1 furnace every two hours. The metal
and slag are allowed to solidify and cool for six hours. It is then separated, crushed and
screened to final size. The liquid metal and slag leaving the furnace at 1 550°C have a
combined enthalpy of 6.2 GJ of thermal energy (estimate supplied by AlloyStream
metallurgical department), a combination of latent and sensible heat.
The conceptual design of an integrated energy efficient ore reduction plant 65
Barati et al. estimated that 70% of thermal energy in the slag can be recovered [27]. In this
study it is assumed that 50% of the thermal energy in the metal and slag, or 591 kJ/s, can be
recovered by using thermal oil as the cooling medium. An ORC working at 250°C could
convert 20% of the thermal energy into electricity at an average power of 118 kW. A large
reservoir of thermal oil will be required and significant engineering challenges will have to be
overcome to safely extract the heat from the metal and slag.
The estimated capex cost is R30 000/kW for the ORC, R3 000/(kJ/s) for the heat exchanger
and R500/kJ/s for the oil, piping and pumps, giving a total of R5 720 000. The cooling water
cost will be about R25/hour and the electrical cost related to the oil pumping circuit will be
R10/hour. The system will have a high safety risk. The system will also be more complex
than the existing naturally air-cooled solution. The payback period is eight to nine years. The
social value is deemed high.
Safety score = 5, low confidence.
Financial score = 5, confident.
Reliability score = 4, low confidence.
Social score = 7, low confidence.
3.3.15 ECM13 – Use waste heat to electricity from some of the furnace cooling
circuits
ECM13 is a logical progression from ECM7. Instead of rejecting the heat from the hot oil to
atmosphere the heat is transferred to an ORC and electricity is generated. The heat
harvested in addition to the off-gas thermal energy (ECM11) will be from the roof, sidewall
and slag-line coolers. The waste heat rejected below the copper coolers is not considered.
About 1 409 kJ/s thermal energy can be collected with thermal oil at 300°C. An ORC with an
efficiency of 20% will generate 281 kW. The oil and water pump power is estimated at
75 kW.
The water usage is estimated as 1.6 kl/hour, thus adding R40/hour to the operating cost.
The additional capex is estimated as R10 080 000. The safety risk profile should be better
than ECM12, but worse than ECM11d. Reliability should be similar to ECM11d. The payback
period is seven to eight years. The social value is deemed significant.
Safety score = 6, confident.
Financial score = 6, confident.
Reliability score = 7, confident.
Social score = 5, confident.
The conceptual design of an integrated energy efficient ore reduction plant 66
3.3.16 ECM14 – Recover pressure energy
Oxygen enters LP1 at 13 MPa and fuel gas enters LP1 at 0.6 MPa. This represents
enthalpies of 39 kJ/s and 7kJ/s respectively that could be recovered with turbo-generators if
the gas is not heated with waste energy. Only oxygen flow will be considered and heating is
considered impractical. Typical efficiencies of turbo-generators are in excess of 80% [105].
26 kW could be generated at a turbine efficiency of 80%.
The estimated capex is R2 500 000 for the specialised pipework and turbo-generator. The
installation has some safety risk as pure oxygen handling can cause spontaneous
combustion of components. The existing system will be retained as a back-up. The payback
period is eleven to twelve years. The social value is deemed insignificant.
Safety score = 6, confident.
Financial score = 3, confident.
Reliability score = 7, confident.
Social score = 5, confident.
3.4 Evaluation
The evaluation method used by Athey discounts feasible solutions with the confidence
rating. For example, ECM12 has a utility score of 99 and a discounted utility score of 22 due
to the 0.2 overall confidence rating. An ECM with a high utility score (high total value) could,
due to uncertainty, end up with a low discounted utility score. Solutions with high utility, but
low discounted utility scores are therefore candidates for further research.
The results from the evaluation of the ECMs discussed in this chapter are shown in Table 4.
The ECMs selected for implementation in LP2 are highlighted in the ECM column. The
ECMs with the highest utility scores were selected. Except for ECM12, ECM13 and ECM14,
the selected solutions also have the highest discounted utility scores. Further research is
required on ECM12, ECM13 and ECM14 to increase the confidence rating. The full
evaluation matrix is attached as Appendix B.

The conceptual design of an integrated energy efficient ore reduction plant 67
Table 4: Evaluation matrix totals
ECM C U DU
1 Replace IE1 electrical motors with IE3 0.8 171 152
2 Upgrade inductor to high-efficiency configuration 0.8 130 115
3 Augment existing lights with light tubes 0.9 150 135
4 Convert solar radiation to electricity 0.7 127 95
5a Install VSDs on all drives above 3 kW 0.7 173 140
5b Low-pressure blast air system 0.8 159 129
6 Upgraded furnace roof refractory 0.8 140 124
7 Thermal oil-cooling of existing water-cooled circuits 0.7 102 78
8 Ore and coal preheating 0.4 71 31
9 Blast air preheating 0.5 115 58
10 Coal drying with waste heat 0.5 107 54
11a Off-gas heat recovery with SC 0.5 113 66
11b Off-gas heat recovery with BC 0.6 141 96
11c Off-gas heat recovery with SRC 0.6 134 89
11d Off-gas heat recovery with ORC 0.8 141 125
11e Off-gas heat recovery with KRC 0.8 135 119
11f Off-gas heat recovery with Brayton-ORC 0.6 128 86
12 Waste heat to electricity from metal and slag 0.2 97 22
13 Convert waste heat from ECM 7 to electricity 0.5 124 62
14 Recover pressure energy 0.5 106 53
C = Confidence rating, U = Utility rating, DU = Discounted utility rating (C x U)

The conceptual design of an integrated energy efficient ore reduction plant 68
A number of technologies were not included in the list of ECMs considered. As mentioned
before, any measure that could significantly affect the reduction process was rejected. Off-
gas recirculation, briefly discussed in Chapter 6, is one such a measure. Reconfiguring the
furnace geometry to reduce heat loss is another measure.
Thermoelectric generation (based on the Peltier effect) meets the constraints but the
efficiency of commercially available high-temperature modules is below 8% [53, 54]. Wind
power was not considered for LP2 because the location has a low wind intensity. Biomass
as a replacement of coal could be an elegant option in areas where there is an abundance
of water and land. Land is absent for LP2, water is not in abundance for FCP. Fuel cell
technology was also not considered although the fuel gas could efficiently be converted to
electricity for LP2 [106].
Finally, Athey states that one should keep looking for alternatives until the time runs out. The
time ran out.
3.5 Conclusion
A number of energy efficiency strategies were developed into twenty ECMs. The
performance of each measure was predicted and the utility score of each ECM was
determined. The problem-solving approach identified the ECMs that should be implemented.
It also revealed where lack of confidence significantly affected the relative worth of an ECM.
A comprehensive combination of ECMs is selected for implementation, and some synergy is
apparent. The use of thermal oil, acting as a collector, conveyor and donor of thermal energy
in ECM7 is a measure that positively influences a number of other ECMs. It may be inferred
that an integrated approach is the best way to improve the energy efficiency of LP1.

The conceptual design of an integrated energy efficient ore reduction plant 69
CHAPTER 4
In Chapter 4 the energy flow in the existing plant is discussed. Fourteen ECMs are
conceptually implemented to arrive at a new configuration that is more energy efficient.
If you would attain to what you are not yet, you must always be
displeased by what you are. For where you are pleased with yourself
there you have remained. Keep adding, keep walking, keep advancing.
~Saint Augustine

The conceptual design of an integrated energy efficient ore reduction plant 70
4 Current design and proposed conceptual design
4.1 Overview
Table 4 shows the measures selected for implementation to change LP1 to LP2. In the first
step the unit processes indicated in the energy flow diagram for LP1 are analysed. Next the
dependencies between the selected ECMs are identified. A conceptual redesign of LP1 is
then done, resulting in a reconfigured, more efficient LP2. Fourteen ECMs were
implemented and the result determined by updating the energy model and energy flow
diagrams.
The plant energy efficiency excluding solar radiation (G2GEE1) of LP1 is 16,9%. The plant
energy efficiency including solar radiation (G2GEE2) is 14.7%. The system energy efficiency
(S2GEE) is 10.2%. The total energy entering the plant is on average 54 792 MJ/ton
(including solar radiation). The total electrical energy entering the plant is 3 196 kW or
10 863 MJ/ton. The furnace receives 12 078 kJ/s or 40 637 MJ/ton total energy which is 74%
of the total energy into the plant, and 2 106 kW or 66% of the electrical energy into the plant.
The energy flows from the source to the plant are indicated in Figure 8 and Figure 9.
Although the study is focused on the energy efficiency of the plant, the plant’s effect on the
environment cannot be ignored. By modelling the primary energy flows external to the plant
the effect on the environment of the plant energy efficiency improvement could be estimated.
4.2 LP1 energy flow
In Figure 8 each unit process is depicted as a rectangle and assigned a letter. The energy
and mass entering and leaving the unit process is represented by a line and a number. The
broken line represents the boundary of the Letaba plant. The values of the processes
internal to the plant were taken from the forward calculator, actual values observed during
campaign 1 and estimated values where values were not recorded. The values of external
processes were calculated based on information obtained from literature.
The unit processes of LP1 are discussed in the sections that follow. To enable tracing from
one unit process to the next the source output reference number is given in brackets. For
example coal drying is assigned the letter J, wet coal is an input and assigned the letter J1.
The upstream process delivering the coal to the dryer is coal transport C, the output of coal
to the plant is C2, indicated as (C2).
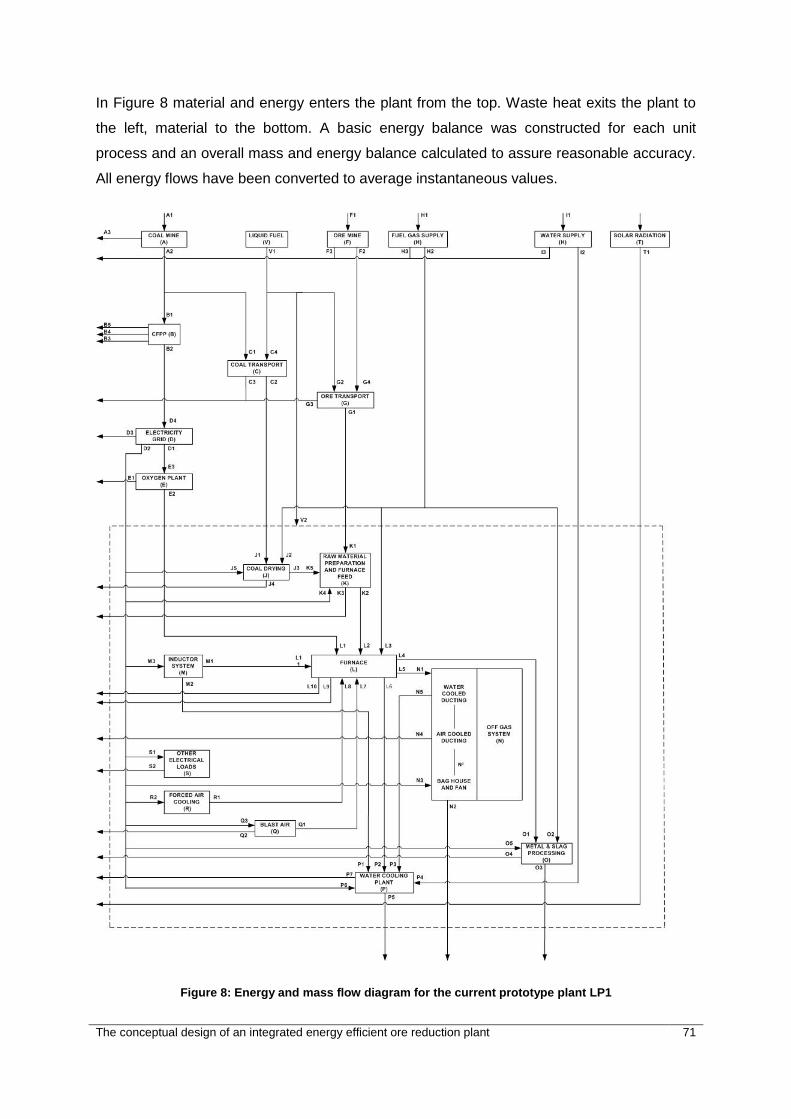
The conceptual design of an integrated energy efficient ore reduction plant 71
In Figure 8 material and energy enters the plant from the top. Waste heat exits the plant to
the left, material to the bottom. A basic energy balance was constructed for each unit
process and an overall mass and energy balance calculated to assure reasonable accuracy.
All energy flows have been converted to average instantaneous values.
Figure 8: Energy and mass flow diagram for the current prototype plant LP1

The conceptual design of an integrated energy efficient ore reduction plant 72
4.2.1 Processes external to the plant
Coal mine (A)
The energy required to mine coal is 19.2 kJ/kg [107]. The coal mass flow from the mine is
0.67 kg/s. The energy content of the coal is 27 740 kJ/kg (higher heating value) with an ash
content of 12.5% [108]. The moisture content is 12%. The mine is 80 km from LP1 and less
than 10 km from the coal-fired power plant (CFPP).
Coal-fired power plant (B)
The thermal efficiency of the CFPP is 37.8% [109,110]. The coal flow to the CFPP to
generate the electrical power required by LP1 is 0.36 kg/s. The electricity to grid is
3 746 kW, related waste heat to the environment is 6 165 kJ/s.
Coal transport to the plant from the mine (C)
Coal is transported from the mine to LP1 and LP2 via 30-ton road trucks. The fuel
consumption is 40 litres per 100 km [111]. The fuel energy use is 40 kJ/kg coal, calculated
over a distance of 80 km for a fully laden 30-ton truck. The coal mass flow to LP1 is 0.31
kg/s.
Electricity grid (D)
The distribution and transmission loss from Eskom is 4.61% [112], compared to the US
Energy Information Administration’s loss of 7% [113]. The distribution and transmission
losses (based on the value from Eskom) amount to 165 kW.
Oxygen plant (E)
Oxygen is generated by a supplier in a cryogenic plant very close to LP1. Typical medium
capacity plants use 0.5 kWh/Nm3 to 0.55 kWh/Nm3 electrical power [114]. For this study
0.55 kWh/Nm3 will be used for LP1 and LP2. The mass flow to LP1 is 0.28 kg/s at
1 300 kPa.
Ore mine (F)
The energy required to mine ore is 56 kJ/kg [115]. The ore mass flow from the mine is
0.62 kg/s. The mine is 620 km from Letaba.
Ore transport (G)
Ore is transported from the mine to LP1 and LP2 using 30-ton road trucks. The fuel
consumption is 320 kJ/kg ore, calculated over a distance of 640 km [111]. The ore mass flow
to LP1 is 0.62 kg/s.
The conceptual design of an integrated energy efficient ore reduction plant 73
Fuel gas supply (H)
Fuel gas from a natural gas field is supplied to LP1 and LP2 via a 700-km pipeline at a
pressure of 600 kPa. The energy content of the gas is 36 100 kJ/kg (LHV) [116]. The energy
required to extract and transport the gas was not estimated. The gas mass flow to LP1 is
0.06 kg/s.
Water supply (H)
Water is supplied to LP1 and LP2 via pipeline at 1 300 kPa. The mass flow to LP1 is
2.22 kg/s. The pressure energy of the water as delivered to LP1 is 2.89 kW. The water used
at the CFPP to generate the electrical power used by LP1 is estimated as 2.52 kg/s. Only
the pressure energy entering the plant was considered.
Liquid fuel (V)
Liquid fuel use was considered only for the ore and coal transport, as well as material
movement inside the plant. The total liquid fuel use for transport of coal and ore is
17 kg/hour. The liquid fuel consumption in LP1 and LP2 is estimated as 9 kg/hour, as
confirmed by the financial manager of AlloyStream.
4.2.2 Processes internal to the plant
Coal drying (J)
Inputs:
o J1 – wet coal, 12% water content (C2)
o J2 – fuel gas, 5 g/s (H2)
o J5 – electricity use, 12 kW (D2)
Outputs:
o J3 – dry coal, 3.6% water content, 27 652 kJ/kg LHV, mass flow 0.29 kg/s
o J4 – waste heat to environment,181 kJ/s
Raw material preparation and furnace feed (K)
Inputs:
o K1 – ore mass flow, 0.62 kg/s (G1)
o K4 – electricity use, 45 kW (D2)
o K5 – coal mass flow, 0.29 kg/s (J3)
Outputs:
o K2 – raw material mix, mass flow 0.91 kg/s
o K3 – waste heat to environment, 45 kJ/s

The conceptual design of an integrated energy efficient ore reduction plant 74
Inductor system (M)
Inputs:
o M3 – electrical power to transformer and drive, 2 150 kW (D2)
Outputs:
o M1 – heat to bath from inductor, 1 411 kJ/s
o M2 – waste heat to water, 853 kJ/s
Forced air-cooling of shell (R)
Inputs:
o R2 - electrical power, 35 kW (D2)
Outputs:
o R1 – air mass flow to furnace shell, 10 kg/s
Blast air (Q)
Inputs:
o Q3 - electrical power, 364 kW (compressor-based)
Outputs:
o Q1 – mass flow to furnace 0.85 kg/s, pressure 7.5 bar (g)
o Q2 – waste heat to environment, 364 kJ/s
Furnace (L)
Inputs:
o L1 – oxygen mass flow, 0.28 kg/s at 1 300 kPa (E2)
o L2 – raw material feed, 0.91 kg/s (K2)
o L3 – fuel gas flow, 0.06 kg/s (H2)
o L7 – blast air flow, 0.85 kg/s (Q1)
o L8 – forced air-cooling, 10 kg/s (R1)
o L11 – electromagnetic power from inductor to bath, 1 411 kW (M1).
Outputs:
o L4 – metal flow 0.29 kg/s, enthalpy 1 954 kJ/kg, slag flow 0.21 kg/s, enthalpy
1 394 kJ/kg
o L5 – off-gas flow 1.73 kg/s, cp = 1.38 kJ/kg.K, sensible heat 3 693 kJ/s,
temperature 1 550°C; radiation heat transfer to off-gas ducts 521 kJ/s
o L6 – waste heat to water, 3 413 kJ/s
o L9 – waste heat to air from natural air-cooling, 155 kJ/s
o L10 – waste heat to air from forced air-cooling, 113 kJ/s
The conceptual design of an integrated energy efficient ore reduction plant 75
Off-gas (N)
Inputs:
o N1 – off-gas from furnace, 3 693 kJ/s (L5)
o N3 – electrical power, 85 kW (D2)
Outputs:
o N2 – sensible heat to atmosphere through stack, 392 kJ/s
o N4 – waste heat to atmosphere from air-cooled ducting, 931 kJ/s
o N5 – waste heat to water, 2 890 kJ/s (including radiation heat from furnace)
Metal and slag processing (O)
Input:
o O1 – metal and slag from furnace 0.5 kg/s, total enthalpy 866 kJ/s,
temperature 1 550°C (L4)
o O2 – fuel gas for mould drying, 0.002 kg/s (H2)
o O5 – electrical power, 10 kW (D2)
Output:
o O3 – metal and slag mass flow 0.5 kg/s
o O4 – waste heat from mould drying, 316 kJ/s, waste heat from metal and slag
cooling 866 kJ/s; waste heat from crushing plant 10 kJ/s
Water-cooling plant (P)
Inputs:
o P1 – waste heat from inductor system, 853 kJ/s (M2)
o P2 – waste heat from furnace, 2 560kJ/s (L6)
o P3 – waste heat from off-gas water-cooled ducting, 2 890 kJ/s (N5)
o P4 – make-up water, 2.4 kg/s (I2)
o P6 – electrical power, 225 kW (D2)
Output:
o P5 – vapour to atmosphere 1.98 kg/s, waste heat 6 049 kJ/s
o P7 – blow-down water, 0.24 kg/s
Other electrical (S)
Input:
o S1 – electrical power, 250 kW (D2)
Output:
o S2 – waste heat, 250 kJ/s

The conceptual design of an integrated energy efficient ore reduction plant 76
Solar radiation (T)
Input:
o I2 – average solar radiation 5 kWh/m2 per day, 10 000 m2, 2 083 kJ/s on
average
Output:
o I2 – waste heat to atmosphere 2 083 kJ/s on average
Liquid fuel (V)
Input
o V2 – mean energy into plant 110 kJ/s
Output
o Not shown on diagram – waste heat 110 kJ/s
The ECM evaluation in Chapter 3 was done assuming that each ECM is a standalone
solution, in other words there is no synergy or conditional relationships: the ECMs are
independent. This assumption is not valid when a combination of ECMs is implemented. To
reveal the relationships amongst the selected ECMs (see table 4) a basic dependency
analysis was done, the results are summarised in Table 5.
From the dependency analysis in Table 5 it is clear that ECM7 favourably affects a number
of other ECMs. Conceptual implementation of the selected ECMs resulted in a modified
energy flow shown in Figure 9.
.

The conceptual design of an integrated energy efficient ore reduction plant 77
Table 5: ECM dependency table
ECM number Affected by Effect
ECM1 – High-efficiency motors
ECM5a, ECM5b and ECM7
All three ECMs will reduce total motor power and thus the saving attributed to ECM1.
ECM2 – Inductor upgrade
Independent
ECM3 – Light tubes
Independent
ECM4 – Solar PV
Independent
ECM5a – VSDs
ECM7 ECM7 will reduce the cooling water pump power substantially and thus reduce the energy savings predicted for installing VSDs on the main pump drives.
ECM5b – Low-pressure blast air
Independent
ECM6 – Low heat loss roof refractory
ECM7 The heat loss reduction due to ECM6 will be slightly affected by ECM7.
ECM7 – Cooling by thermal oil
ECM6 The heat loss reduction through the roof due to ECM6 substantially reduces the heat loss achieved by ECM7.
ECM9 – Preheat blast air
ECM7, ECM11d, ECM12 and ECM13
Hot thermal oil is available.
ECM10 – Dry coal with waste heat
ECM7, ECM11d, ECM12 and ECM13
Hot thermal oil is available.
ECM11d – ORC
ECM7, ECM12 and ECM13
Hot thermal oil is available.
ECM12 – Recover waste heat from metal and slag
ECM7, ECM11d and ECM13
Hot thermal oil is available.
ECM13 – Recover waste heat from furnace cooling circuits
ECM7, ECM11d and ECM12
Hot thermal oil is available.
ECM14 – Recover pressure energy from oxygen
Independent
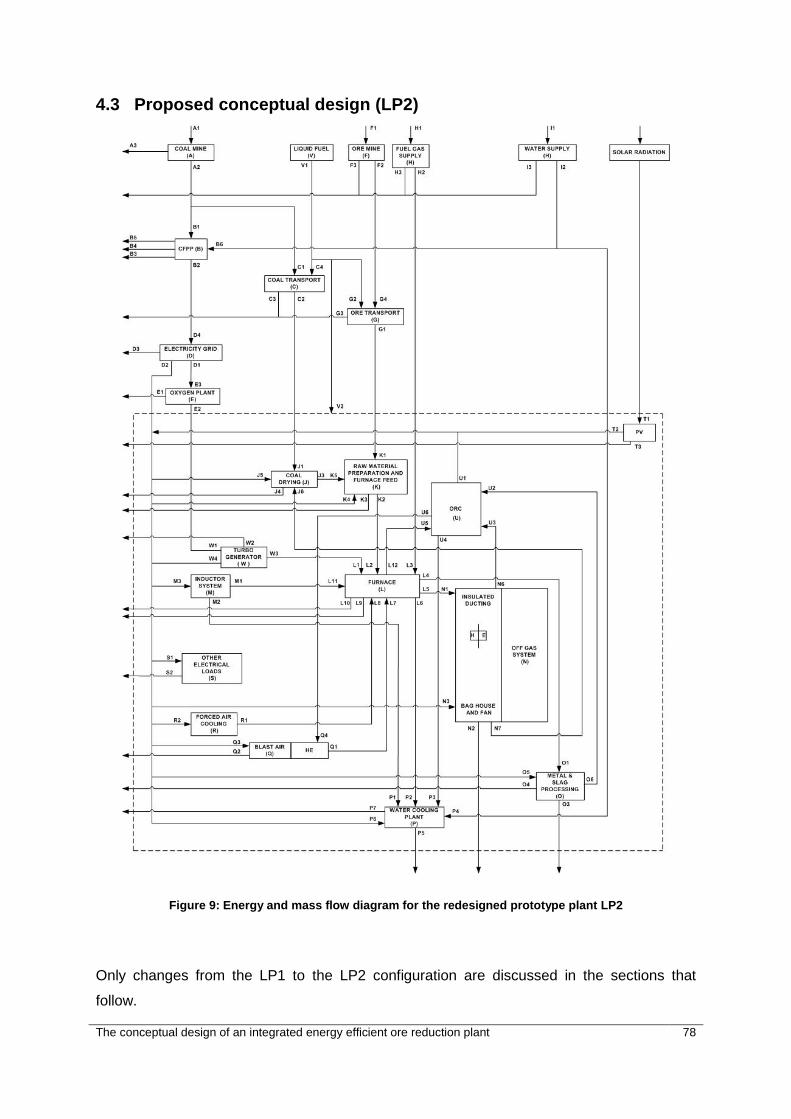
The conceptual design of an integrated energy efficient ore reduction plant 78
4.3 Proposed conceptual design (LP2)
Figure 9: Energy and mass flow diagram for the redesigned prototype plant LP2
Only changes from the LP1 to the LP2 configuration are discussed in the sections that
follow.
The conceptual design of an integrated energy efficient ore reduction plant 79
Coal drying (J)
In LP1 coal is dried using a hot air-to-coal heat exchanger. The air is heated by combusting
fuel gas. By implementing ECM10 in LP2 the coal will be dried by a heat exchanger that
transfers thermal energy from thermal oil to the coal. This could be accomplished through
retrofitting the existing dryer or by installing a different unit. The thermal oil will be heated
with waste heat from the off-gas system after the bag-house where the off-gas temperature
is below 250°C (N7 to J6). The net effect is a reduction of 5 g/s (energy equivalent of 181
kJ/s) in fuel gas use (H2), and an estimated increase in electricity use of 5 kW required to
circulate the oil between the off-gas system and the coal dryer.
Inductor system (M)
By upgrading the inductor installed in LP1 to a high-efficiency configuration (ECM2) the
efficiency of conversion of electricity to electromagnetic energy transferred to the liquid metal
bath increases from 66% to 71%. This results in a 49 kW electrical load reduction (M3) and a
49 kJ/s reduction in waste heat to the cooling water system (M2).
Blast air (Q)
ECM5b replaces the high-pressure compressor system used in LP1 with a low-pressure
blower system. As a result the electricity use reduces by 316 kW from 364 kW for the
compressor system to 48 kW for the blower system (Q3).
No blast air preheating is done in LP1. ECM9 preheats the blast air to 250°C in LP2 (U6 to
Q4). A 15% reduction in oxygen use is predicted (E2).
Furnace (L)
ECM6 will reduce the roof heat loss from 1 079 kJ/s to 350 kJ/s (L6 to P2). ECM7 replaces
the water-cooling for most furnace circuits with thermal oil at an average temperature of
300°C (L12 to U5). The combined effect of ECM6 and ECM7 is a reduction in fuel gas use of
30 g/s (H2 to L3), electrical power to the water-cooling system reduces by 45 kW (P6) and
water consumption reduces by 1 kl/hour (P4).
Off-gas (N)
ECM11 transfers most of the thermal energy in the gas stream to thermal oil which in turn
powers an ORC (N6 to U3).
The conceptual design of an integrated energy efficient ore reduction plant 80
Metal and slag processing (O)
In LP1 metal and slag are tapped on average every two hours into multiple 170-litre
refractory lined moulds. The mixture is allowed to solidify and cool for a six-hour period
before the moulds are emptied. The LP1 metal and slag handling system has a number of
deficiencies, and a new system that will enable heat recovery as a secondary objective is
being developed. ECM12 aims to recover 50% of the available thermal energy, or 591 kJ/s,
with thermal oil heat exchangers and convert the thermal energy into electricity through an
ORC (O6 to U2). In addition the new casting technique in combination with the thermal oil
system will remove the need for mould drying, resulting in a reduction in fuel gas use of 2.4
g/s (H2).
Water-cooling plant (P)
Implementation of ECM1, ECM2, ECM5a, ECM6, ECM7, ECM11d, ECM12 and ECM13 has
a significant impact on the water-cooling plant. The total water usage reduces from 2.4 kg/s
to 1.8 kg/s (P4) and the electrical power required to pump the water and oil and drive the
cooling tower fans reduces from 245 kW to 169 kW (P6).
Other electrical (S)
The LP1 load of 250 kW reduces to 240 kW due to the implementation of ECM3 (S1).
Solar PV (T)
ECM4 generates an average electrical power of 67 kW (T2).
ORC (U)
All thermal energy collected by the thermal oil (U2, U3 and U5) minus the energy needed for
blast air heating (U6 to Q4) enters the ORC. 20% is converted to electricity (U1); the balance
is rejected to the water-cooling plant (U4 to P3). Power required to circulate the thermal oil is
included in the plant output calculation. The ORC produces 935 kW net.
Turbo-generator (W)
A turbo-generator that recovers pressure energy from the oxygen supply (ECM14) is
installed in LP2. The device generates 26 kW electrical power (W4).
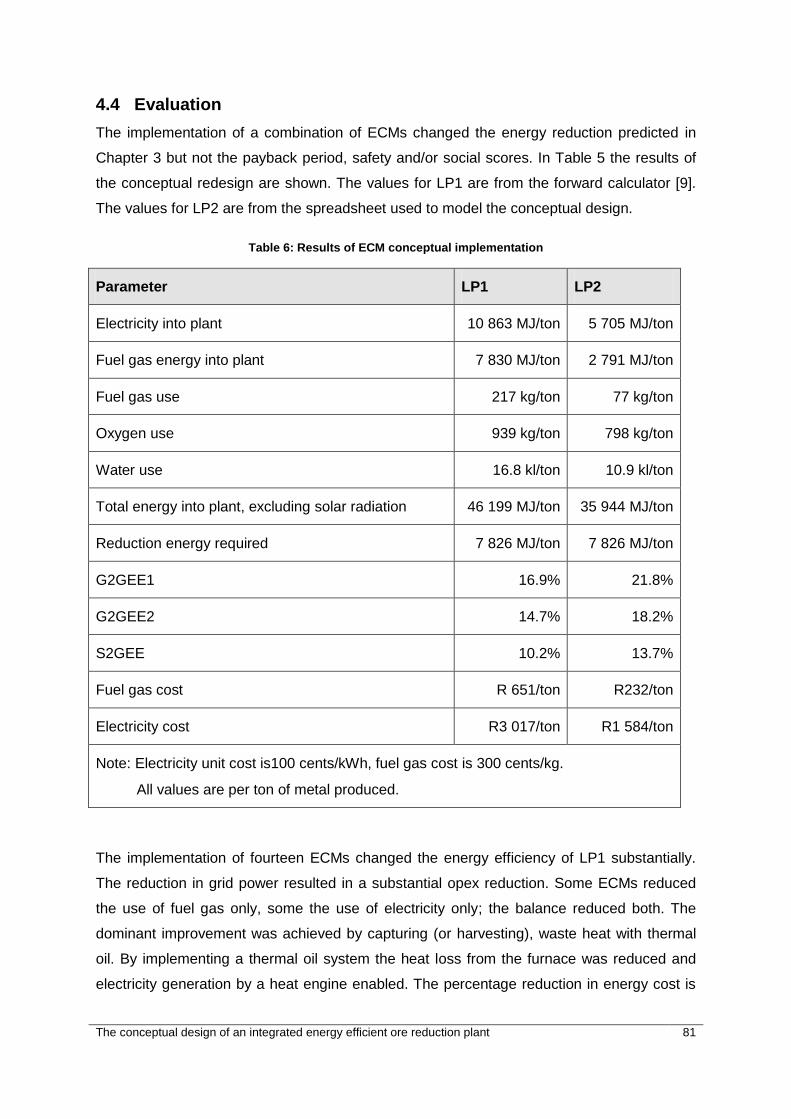
The conceptual design of an integrated energy efficient ore reduction plant 81
4.4 Evaluation
The implementation of a combination of ECMs changed the energy reduction predicted in
Chapter 3 but not the payback period, safety and/or social scores. In Table 5 the results of
the conceptual redesign are shown. The values for LP1 are from the forward calculator [9].
The values for LP2 are from the spreadsheet used to model the conceptual design.
Table 6: Results of ECM conceptual implementation
Parameter LP1 LP2
Electricity into plant 10 863 MJ/ton 5 705 MJ/ton
Fuel gas energy into plant 7 830 MJ/ton 2 791 MJ/ton
Fuel gas use 217 kg/ton 77 kg/ton
Oxygen use 939 kg/ton 798 kg/ton
Water use 16.8 kl/ton 10.9 kl/ton
Total energy into plant, excluding solar radiation 46 199 MJ/ton 35 944 MJ/ton
Reduction energy required 7 826 MJ/ton 7 826 MJ/ton
G2GEE1 16.9% 21.8%
G2GEE2 14.7% 18.2%
S2GEE 10.2% 13.7%
Fuel gas cost R 651/ton R232/ton
Electricity cost R3 017/ton R1 584/ton
Note: Electricity unit cost is100 cents/kWh, fuel gas cost is 300 cents/kg.
All values are per ton of metal produced.
The implementation of fourteen ECMs changed the energy efficiency of LP1 substantially.
The reduction in grid power resulted in a substantial opex reduction. Some ECMs reduced
the use of fuel gas only, some the use of electricity only; the balance reduced both. The
dominant improvement was achieved by capturing (or harvesting), waste heat with thermal
oil. By implementing a thermal oil system the heat loss from the furnace was reduced and
electricity generation by a heat engine enabled. The percentage reduction in energy cost is

The conceptual design of an integrated energy efficient ore reduction plant 82
much more than the percentage energy reduction, illustrating the significant difference in
cost of the two energy sources.
In practice it is unlikely that all the ECMs will be implemented at the same time. A logical
sequence of implementation is as follows:
1. Implement ECM3 and ECM4.
They are independent of the others and do not require a shutdown of the plant.
2. Implement ECM10.
ECM10 does not affect any critical furnace components.
3. Implement ECM5a and ECM11d.
4. Implement ECM12 and ECM14.
5. Implement ECM2, ECM6 and ECM7 during a shutdown.
6. Implement ECM1 when the final motor capacities are known.
4.5 Conclusion
The energy flow of LP1 was analysed and reconfigured by conceptually implementing
fourteen ECMs. The integrated conceptual design created LP2. The energy efficiency
increased from 18% to 23% thus answering Question 3 of the problem statement (To what
level can it be improved?); and the energy cost of the plant decreased. The input energy was
reduced by more than 9 000 MJ/ton proving that Hypothesis 2 is conceptually true (the
energy use of the plant can conceptually be reduced by more than 5 000 MJ/ton). A logical
implementation sequence was also proposed.

The conceptual design of an integrated energy efficient ore reduction plant 83
CHAPTER 5
In Chapter 5 the results of the conceptual redesign and the measurement and verification
approach are discussed. The two measures that were implemented are described and
evaluated.
No man has a good enough memory to make a successful liar.
~Abraham Lincoln
The conceptual design of an integrated energy efficient ore reduction plant 84
5 Results
5.1 Overview
Two plants have been built and operated by AlloyStream to date. The first plant was called
Rivet, the second (and currently in operation) is Letaba. Rivet’s main purpose was to verify
the theoretical ore reduction model whereas Letaba’s main purpose is to demonstrate the
technology on a pre-commercial scale. Rivet was extensively instrumented and the
instrumentation was retained at Letaba.
In Chapter 4 a number of ECMs were conceptually implemented on LP1 to arrive at a new
plant configuration called LP2. Two measures were also designed and implemented on
Letaba to date. The two measures are described and the results of their implementation
discussed in sections 5.5 and 5.6.
When Rivet was upgraded to Letaba a more energy efficient water-cooling system was
designed and constructed. Between Letaba campaign 1 and Letaba campaign 2 the
compressor-based blast air system was replaced with a low-pressure blower system. This
chapter discusses the overall measurement and verification approach followed to date in the
development of the AlloyStreamTM technology and the measurement and verification of the
energy model and the two implemented measures.
5.2 Results from the conceptual design
In Chapter 1, Section 1.4 the problem to be addressed by this study was stated as three
questions:
1. How can the energy efficiency of the ore reduction plant on which the study is based
be measured?
2. Which is the best way of improving the energy efficiency?
3. To what level can it be improved?
In Chapter 2, Section 2.6 Question 1 was answered. In Chapter 4, Section 4.4 Question 2
and Question 3 were answered.
Two hypotheses were also formulated in Chapter 1, Section 1.4: the energy efficiency can
be measured (Hypothesis 1) and the energy use of the plant can be reduced by more than
5 000 MJ/ton (Hypothesis 2).
The conceptual design of an integrated energy efficient ore reduction plant 85
In Chapter 2, Section 2.6 Hypothesis 1 was proven true. The conceptual integrated redesign
of the plant resulted in an input energy reduction of more than 5 000 MJ/ton, indicating that
Hypothesis 2 has a high likelihood of being true.
The study has found (with some confidence) that without affecting the reduction process the:
Electrical energy purchased by the Letaba plant can be reduced by up to 47%
Fuel gas use can be reduced by 64%
Water consumption can be reduced by 35%
5.3 Plant-wide measurement and verification
AlloyStream is an ISO 9002 qualified organisation. All important business processes are
described, documented and regularly reviewed. Design management, and process
measurement and verification are critical sub-processes and managed as such.
The process followed to establish Rivet and Letaba was:
1. Estimate the furnace dimensions.
2. Populate a spreadsheet (forward calculator) with the dimensions and selected ore
and coal characteristics.
3. Adjust the dimensions and recalculate until a workable solution is found.
4. Perform computational fluid dynamics modelling of the combustion chamber to
determine the optimum lance and feed port configuration.
5. Write a functional requirement document that serves as a key engineering design
input.
6. Create process flow diagrams that show the important mass and energy flows as well
as maximum, aim and minimum values for the important variables. Then create
process and instrumentation diagrams.
7. Create other key documents such as drawings and specifications, and obtain
approval from a review committee before release for manufacturing.
8. Manufacture and construct and commission.
9. Verify the actual performance against the functional requirements during final
commissioning.
10. Measure and compare actual measured values during operation with the predicted
values and analyse deviations.
11. Generate a comprehensive report after each campaign, for example the Letaba
campaign 1 Process Report. Extracts from this report appear in the appendices.
The conceptual design of an integrated energy efficient ore reduction plant 86
The Letaba plant has over 2 500 measurements that are captured by a process control
system continuously. The variables relevant to this study (in bold) and background variables
are discussed in the sections that follow.
Inbound and outbound logistics:
Ore and coal are delivered by 30-ton road trucks and stored on-site. Ore is stored in an
enclosed store; coal is stored on an open concrete slab. The mass of each delivered load is
determined by pre- and post-weighing of the trucks at the mines.
Fuel gas enters the plant via a pipeline at a pressure of between 4 and 6 bar. Three mass
flow meters, one on the supplier’s side and two inside the plant, are used to determine the
flow of gas. The supplier’s meter is calibrated annually and the accuracy is considered better
than 97%. The internal meters determine the gas flow to the coal dryer and the flow to the
furnace gas distribution system.
Oxygen enters the plant via a pipeline at a pressure between 9 and 16 bar. One mass flow
meter, situated inside the plant, is used to determine the flow. The meter measures pressure
with a pressure transducer, temperature with a platinum resistance thermometer (Pt-100)
and gas velocity with a Pitot tube-type instrument. The differential pressure obtained from
the Pitot tube is sensed by a differential pressure transducer. The change in values of all
three field instruments is converted to 4 – 20 mA signals by constant voltage supplies.
Analogue to digital converters then convert the analogue signals to digital values; these are
recorded by the central processing system. The flow of gas is calculated using the ideal gas
equation and displayed and recorded in normal cubic metres/hour. Normal is defined by
ISO 10780 as the volume in cubic metres at 0°C and 101.325 kPa. This standard is applied
throughout the plant for gas flow measurement.
Electricity is supplied by two 11 kV sub-stations. The plant is billed by the supplier on an
energy basis; no maximum demand charge is levied. Measurement is done using two kWh
meters.
Water enters the plant through a pipeline at 13 bar. The water usage is measured by a
standard water meter. The plant is billed for the water use as well as for sanitation, which is
calculated pro rata from the water consumption.
Samples are taken from the tap stream and analysed by an ISO-certified laboratory. Slag
and metal are transported from the plant by road trucks. The mass leaving the plant is
determined at the plant by weighing the loads on the trucks with platform scales. The scales
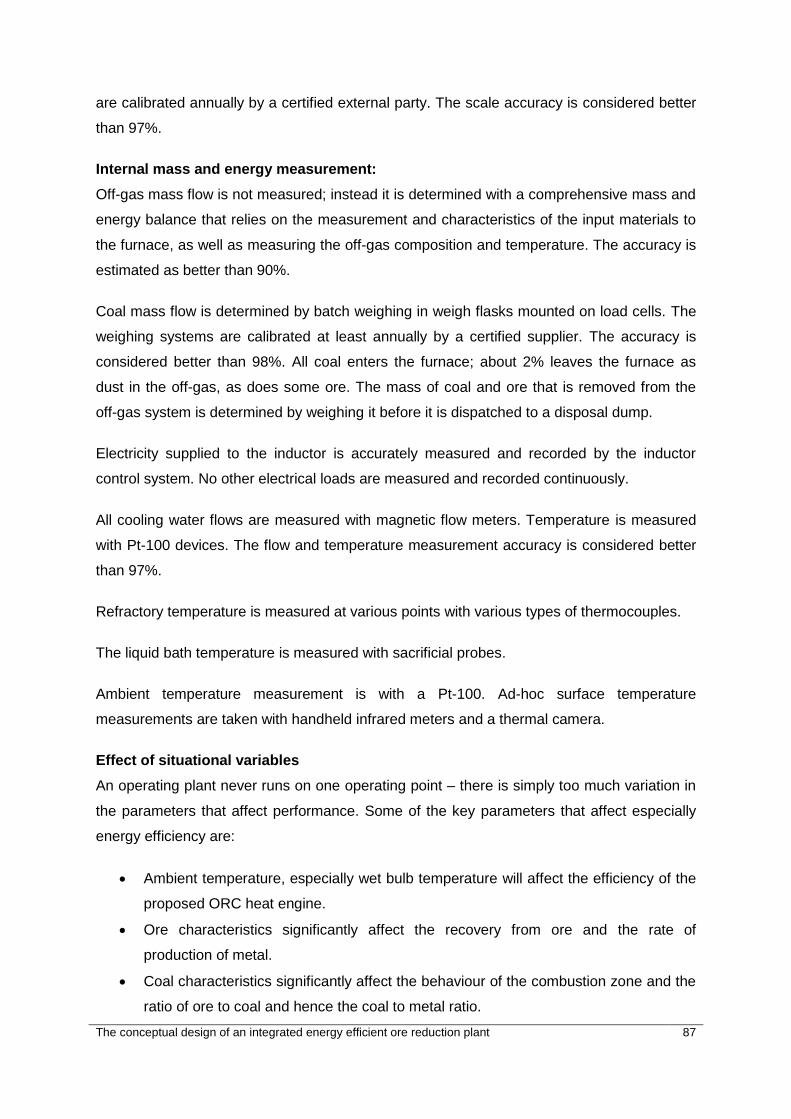
The conceptual design of an integrated energy efficient ore reduction plant 87
are calibrated annually by a certified external party. The scale accuracy is considered better
than 97%.
Internal mass and energy measurement:
Off-gas mass flow is not measured; instead it is determined with a comprehensive mass and
energy balance that relies on the measurement and characteristics of the input materials to
the furnace, as well as measuring the off-gas composition and temperature. The accuracy is
estimated as better than 90%.
Coal mass flow is determined by batch weighing in weigh flasks mounted on load cells. The
weighing systems are calibrated at least annually by a certified supplier. The accuracy is
considered better than 98%. All coal enters the furnace; about 2% leaves the furnace as
dust in the off-gas, as does some ore. The mass of coal and ore that is removed from the
off-gas system is determined by weighing it before it is dispatched to a disposal dump.
Electricity supplied to the inductor is accurately measured and recorded by the inductor
control system. No other electrical loads are measured and recorded continuously.
All cooling water flows are measured with magnetic flow meters. Temperature is measured
with Pt-100 devices. The flow and temperature measurement accuracy is considered better
than 97%.
Refractory temperature is measured at various points with various types of thermocouples.
The liquid bath temperature is measured with sacrificial probes.
Ambient temperature measurement is with a Pt-100. Ad-hoc surface temperature
measurements are taken with handheld infrared meters and a thermal camera.
Effect of situational variables
An operating plant never runs on one operating point – there is simply too much variation in
the parameters that affect performance. Some of the key parameters that affect especially
energy efficiency are:
Ambient temperature, especially wet bulb temperature will affect the efficiency of the
proposed ORC heat engine.
Ore characteristics significantly affect the recovery from ore and the rate of
production of metal.
Coal characteristics significantly affect the behaviour of the combustion zone and the
ratio of ore to coal and hence the coal to metal ratio.

The conceptual design of an integrated energy efficient ore reduction plant 88
Variations in the metal production rate affect the bath temperature; this in turn affects
electrical power input to the inductor.
Refractory deterioration with time increases the heat loss through the furnace walls
and from the bath to the inductor coil.
Equipment malfunction and operator error disturbs the steady-state conditions.
In this study the key situational variables are fixed by the input documents mentioned before.
The model is based on only one theoretical steady-state operating point and the actual
recorded values have therefore no significant effect on the predicted LP2 performance.
During Letaba campaign 1 departure from the operating point were recorded. The metal
production rate was less than predicted by the forward calculator and the fixed value in the
model (1.07 ton/hour). The result is that the actual energy required by the plant to produce a
ton of metal varied from the value in the model by up to +15%.
5.4 Measurement and verification of the conceptual model
As discussed in Section 2.6 the process energy used in equation 7 should be the metal and
slag exergy. In this study an approximation of the product exergy is made by approximating
it with the process enthalpy calculated by Tangstad and Olsen [1].
The energy efficiency of the plant is determined by the equation:
Equation 7: Energy efficiency of the plant
η = process entalpy/input energy
This is the dependent variable of the model. Since the process entalpy is held constant the
input energy is the only independent variable in the equation. The input energy is in turn a
function of the use of fuel gas and electricity use only, as the coal consumption is kept
constant. The energy efficiency therefore has only two independent variables – fuel gas and
electricity use. Conceptual implementation of the ECMs adjusted one or both independent
variables. The sensitivity of the dependent variable to changes in the ECM saving is
important, thus more attention was given to verification of ECMs that have a high impact on
the predicted energy efficiency of LP2.
A manual modelling process using a spreadsheet was followed. The spreadsheet formulas
are the only “automated” calculations. The spreadsheet model requires some insight to
manipulate correctly. The simplicity of the approach, however, enabled results to be
obtained relatively quickly and at low cost.

The conceptual design of an integrated energy efficient ore reduction plant 89
The spreadsheet accuracy was verified with repeated checking and applied logic. The
approach is illustrated in appendix J.
To model the performance of LP1 an energy balance for each unit process was aimed for,
but due to time constraints only done for the furnace, inductor system, off-gas and water
plant. Following the selection of ECMs for conceptual implementation the spreadsheet model
was reworked to determine LP2 performance. This proved to be an iterative process that
increased the confidence in the values used.
The use of the energy diagrams played a vital role. By having visual presentation the subject
could quickly be explained to other people and discussions conducted productively. The total
energy input to LP1 is 13 593 kJ/s and 10 575 kJ/s for LP2, excluding solar radiation. ECM6,
ECM7 and ECM11d are the only ECMs that have an energy conservation contribution of
more than 4% of the LP2 energy input. Variation of the modelled performance of any ECM
within ±20% will not cause a change in plant input energy of more than 1% (0.2 x 4 = 0.8 <
1). It is therefore concluded that inaccuracies within ±20% in the modelled performance of
individual ECMs will not have a significant effect on the predicted LP2 efficiency.
Bias affects all ECMs and could have a significant effect. As an example a consistent 10%
optimistic bias would change the LP2 G2GEE1 from 22% to 24%. To counteract optimistic
bias a conservative approach was followed. For example, the electricity generated by the
ORC is reduced by the pinch temperature difference between the off-gas leaving the heat
exchanger and the thermal oil entering the heat exchanger. A temperature difference of
80°C was used in the model, even though all literature sources referenced use temperature
differences of less than 40°C. The general approach was that where literature sources
differed regarding values, the conservative value quoted was used in the model, or a more
conservative value was used.
A comprehensive campaign report was compiled after Letaba campaign 1 by the
AlloyStream process department [117]. The values below are from that report. The
corresponding values used in the model are shown in brackets.
The recorded flow rates of blast gases (oxygen, fuel gas and air) during LP1 campaign 1 are
shown in Appendix D. The average flow rates over the campaign (design aim values in
brackets) was 1 754 Nm3/hour (2 500) for blast air, 728 Nm3/hour (800) for oxygen and 290
Nm3/hour (250) for fuel gas. The off-gas flow during campaign 1 is shown in Appendix E.
The average flow rate was calculated as 2 098 Nm3/hour (4 822). Towards the end of the
campaign the flow rate was 4 000 Nm3/hour, or 20% less than used in the model. The actual

The conceptual design of an integrated energy efficient ore reduction plant 90
sensible heat available from the off-gas reduces correspondingly. The heat losses from the
upper part of the furnace increased significantly during the campaign, the increase in heat
loss through the roof being the most significant (Appendix F). The roof loss increased from
662 kJ/s to 1 458 kJ/s (1 079) during the campaign.
The calculated process energy varied between 4 659 kWh/ton and 3 796 kWh/ton primarily
due to the lower than predicted metal production rate (Appendix G) which effectively reduces
the thermal efficiency of the combustion chamber and bath heating. The value used in the
model is 2 174 kWh/ton. The inductor input power approached the model power of 2 106 kW
towards the end of the campaign (Appendix H). The metal production rate varied between
770 and 990 kg/hour. The value used in the model is 1 070 kg/hour.
Accuracy of the predicted performance of the ECMs
The systematic systems approach attempts to compensate for inaccuracies due to
uncertainty by discounting an ECM’s relative worth with the uncertainty rating. This approach
results in a conservative assessment – uncertainty reduces the relative worth in all cases. In
practice, uncertainty in project costing is dealt with by attaching an accuracy estimate to
costs, always a plus and minus value. Each organisation has its own rules. For AlloyStream
the required accuracy of costing during concept design phase is +30% to -20%.
The relative values of the safety, reliability and social scores were subjectively determined,
primarily by the author as analyst. The safety scores were reviewed by a panel to improve
confidence. Athey identifies three cases depicting the analyst’s expertise on the problem
studied [77]:
Case 1: analyst has full expertise
Case 2: analyst has no expertise
Case 3: analyst has limited expertise
For this study the author selected Case 3 as the most appropriate.
Athey recommends answering the following four questions to evaluate information [77]:
What is it?
Does it make sense?
How competent is the source?
How credible is the source?

The conceptual design of an integrated energy efficient ore reduction plant 91
His method has been used as thoroughly as possible to evaluate the information and arrive
at the confidence levels discussed in Chapter 3. In addition, an iterative approach was
followed to verify the predicted results with most time spent on the ECMs that yielded the
best results. The development and refining of the flow diagrams and quantifying of the
values in a spreadsheet model assisted the process of verification.
5.5 Low-pressure blast air system
During the five Rivet campaigns and the first Letaba campaign blast air was provided with
two Compair L250 screw compressors that operated in parallel. Each compressor had a
maximum power draw of 250 kW. The standard compressors rating is at an inlet pressure of
100 kPa and temperature of 15°C. A flow diagram of the compressed air supply system is
shown in Figure 10.
Figure 10: Compressed air supply system
In Letaba campaign 1 both compressors were run simultaneously. One compressor was set
to a higher delivery pressure than the other (typically 50 kPa). This caused the “high”
compressor to run continuously at load and the “low” compressor to cycle in and out when
required. A basic calculation to determine the power draw is shown in Appendix H. The
electrical power, assuming no air leakages and a no-load power draw of 20% full load, was
found to be 364 kW at a delivery of 2 500 Nm³/hour.
During the design of Letaba the high electrical energy use of the blast air system based on
compressors was recognised. The compressor-based system was, however, retained due to
time and capital fund constraints. Alternatives that are more energy efficient were
investigated and two promising options identified: Rootes-type blowers that deliver the

The conceptual design of an integrated energy efficient ore reduction plant 92
required flow at up to 85 kPa, and high-pressure centrifugal fans (called blowers) that
delivers the required flow at up to 40 kPa in single-stage configuration.
The blast air supply system had to meet the following requirements:
Minimum pressure: to prevent flow reversal in the lances during a pressure rise
inside the furnace the system must maintain a minimum pressure of 1 kPa
Low energy use
Accurate flow control
High reliability
Minimum space requirement
Low noise
Low purchase cost and low maintenance cost
Accurate flow measurement
With the premature termination of campaign 1 and the subsequent downtime of about nine
months, an opportunity presented itself to upgrade the compressed air system to a more
energy efficient system. The centrifugal blower option was selected on the basis that it met
all the requirements with a lower energy use and considerably less capex than the Rootes
blowers. A distributed approach (one blower per lance) rather than a central system was
selected, because a central system (with say two blowers) would require a control valve for
each line and low-cost valves and actuators could not be found in time. To meet the flow
control requirement each blower motor is driven with a VSD with a speed range of 40% to
120% rated motor speed. A blower curve is attached in Appendix I.
To achieve accurate flow measurement hot wire anemometers were selected. Problems
were experienced with the pitot tube-type flow meters used in the compressed air system
during campaign 1. Also, hot wire anemometers were less expensive. The reliability of the
hot wire anemometers still needs to be proven. A picture of the system is shown in Figure
11.
Before commissioning of the system a series of tests were conducted with one blower and
lance. A configuration identical to the operational system was set up and run at various
blower speeds. The ambient temperature was recorded during the test and varied by less
than 5°C. The static pressure was measured with a pressure transducer at the blower
discharge and at entry to the lance. Air velocity was measured with a calibrated hot wire
anemometer positioned in the straight inlet pipe with thirty pipe diameters upstream and
twenty pipe diameters downstream of the anemometer.
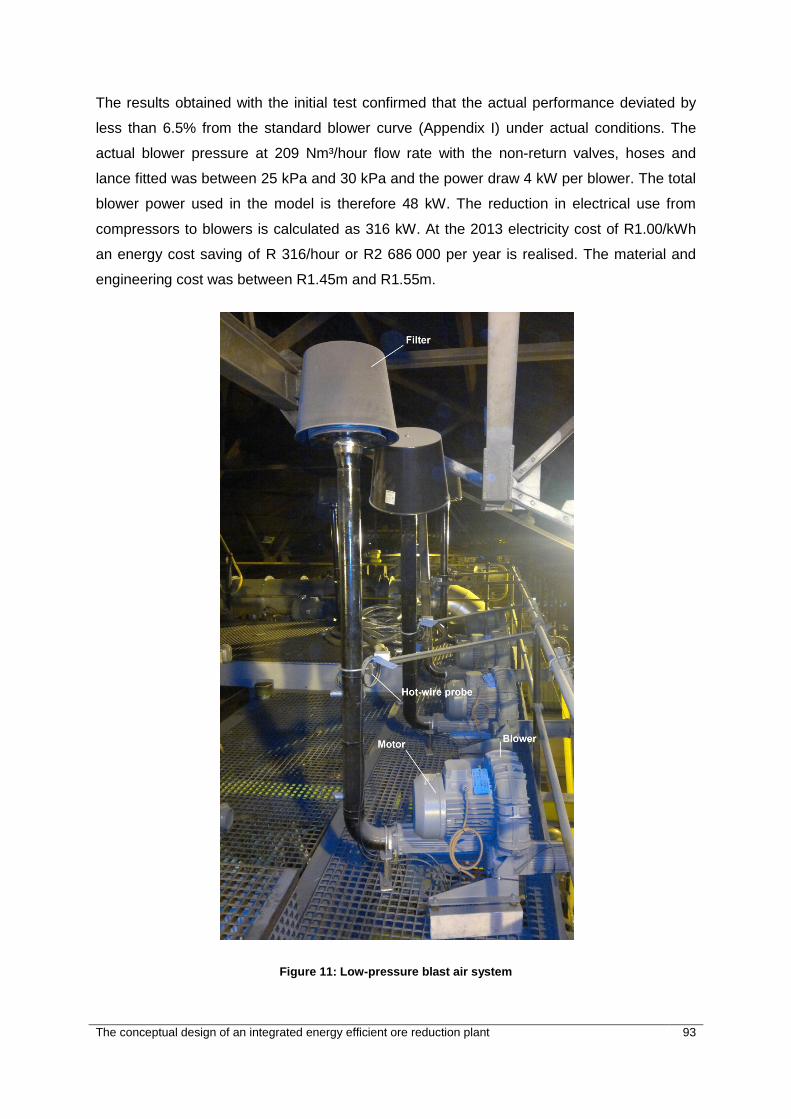
The conceptual design of an integrated energy efficient ore reduction plant 93
The results obtained with the initial test confirmed that the actual performance deviated by
less than 6.5% from the standard blower curve (Appendix I) under actual conditions. The
actual blower pressure at 209 Nm³/hour flow rate with the non-return valves, hoses and
lance fitted was between 25 kPa and 30 kPa and the power draw 4 kW per blower. The total
blower power used in the model is therefore 48 kW. The reduction in electrical use from
compressors to blowers is calculated as 316 kW. At the 2013 electricity cost of R1.00/kWh
an energy cost saving of R 316/hour or R2 686 000 per year is realised. The material and
engineering cost was between R1.45m and R1.55m.
Figure 11: Low-pressure blast air system
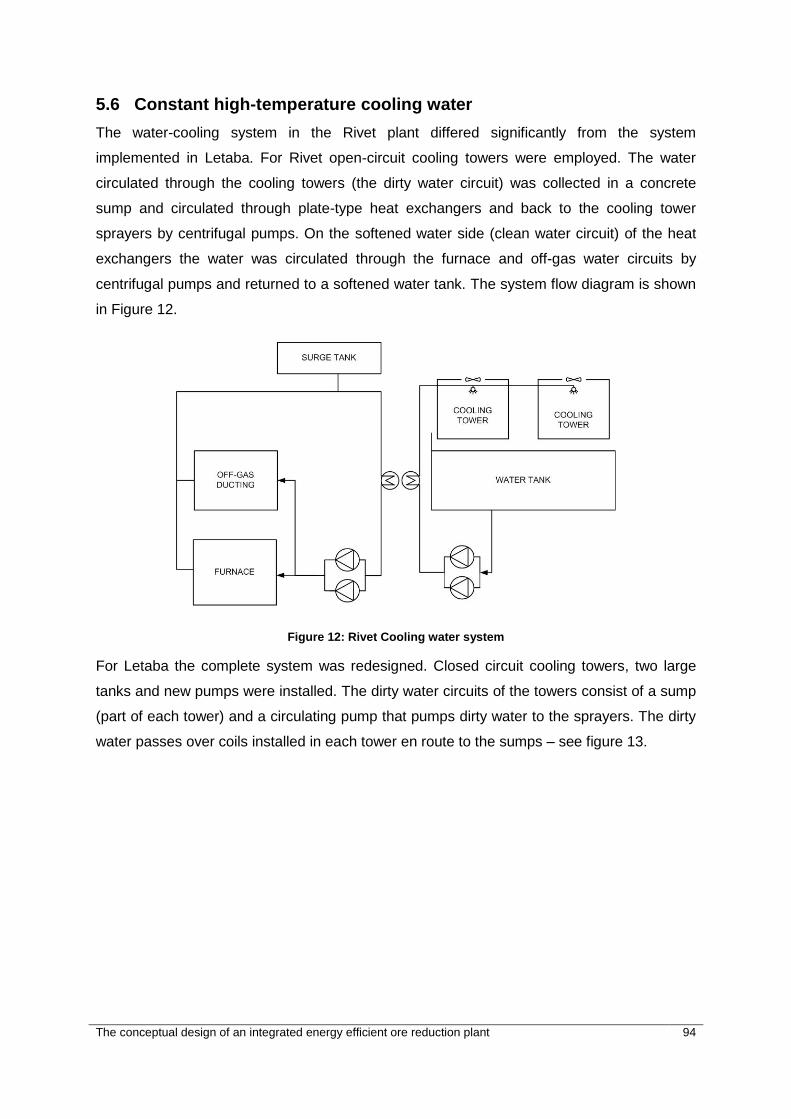
The conceptual design of an integrated energy efficient ore reduction plant 94
5.6 Constant high-temperature cooling water
The water-cooling system in the Rivet plant differed significantly from the system
implemented in Letaba. For Rivet open-circuit cooling towers were employed. The water
circulated through the cooling towers (the dirty water circuit) was collected in a concrete
sump and circulated through plate-type heat exchangers and back to the cooling tower
sprayers by centrifugal pumps. On the softened water side (clean water circuit) of the heat
exchangers the water was circulated through the furnace and off-gas water circuits by
centrifugal pumps and returned to a softened water tank. The system flow diagram is shown
in Figure 12.
Figure 12: Rivet Cooling water system
For Letaba the complete system was redesigned. Closed circuit cooling towers, two large
tanks and new pumps were installed. The dirty water circuits of the towers consist of a sump
(part of each tower) and a circulating pump that pumps dirty water to the sprayers. The dirty
water passes over coils installed in each tower en route to the sumps – see figure 13.

The conceptual design of an integrated energy efficient ore reduction plant 95
Figure 13: Letaba cooling water system
Softened water (water from which most cations were removed) is stored in two main tanks
with a combined capacity of 250 kl. From the tanks two main pumps discharge the water into
a common header. From the discharge header a number of circuits are supplied, each fitted
with a magnetic flow meter. The heated water is returned through the coils inside the cooling
towers and discharged to the tanks. Figure 14 is a picture of the closed circuit towers.
Figure 14: Closed circuit cooling towers

The conceptual design of an integrated energy efficient ore reduction plant 96
The operating approach of the water-cooling system changed significantly from Rivet to
Letaba. With Rivet the approach was to maintain as small a change in temperature across
the circuits to be cooled as possible, and run the cooling tower fans at maximum capacity
continuously, i.e. run the cooling tower approach at minimum (approximately 4°C above wet
bulb) and maintain the airflow at a fixed value. The result was that:
The temperature of the closed water circuit varied with wet bulb temperature.
The tower fan power stayed at maximum.
The water flow rate in the clean water circuit was high to maintain a small change in
temperature. The high flow rate caused high specific pumping power.
With Letaba the control approach was changed to a constant, and as high as possible,
closed water circuit temperature to the plant and a change in temperature of 10°C across the
circuits to be cooled. The constant temperature to the plant was primarily decided on to limit
temperature variations in the copper coolers that cool the slag line in the furnace. Due to the
high thermal expansion coefficient of copper can cause the coolers to lose contact with
refractory bricks or exert unwanted forces on the bricks with temperature changes. The high-
ΔT across the circuits to be cooled was selected to reduce flow and thus pump power.
The result was:
The tower capacity substantially increased as the water temperature into the plant
increased – current practice is to maintain this between 40°C and 45°C.
The electrical use of the water plant as a ratio of electrical power to heat rejection
reduced.
Flow and power values for the two systems are given in Error! Reference source not
found. below.
Table 7: Flow and power values
Parameter Rivet LP1
Flow 80 kg/s 180 kg/s
Clean water circulation pump power 75 kW 150 kW
Dirty water circulation pump power 35 kW 15 kW
Fan power (average) 24 kW 60 kW
Total electrical power 134 kW 225 kW
Average water temperature 18°C (estimated) 40°C
Average heat load 1.5 MJ/s 6 MJ/s

The conceptual design of an integrated energy efficient ore reduction plant 97
Parameter Rivet LP1
Specific electrical power/(heat load) 89 kW/(MJ/s) 37.5 kW/(MJ/s)
The resultant saving in electricity due to the Letaba water-cooling strategy is 309 kW. This
was calculated as follows: Heat load for Rivet = 1.5 MJ/s, power to thermal load 89
kW/(MJ/s). At the same heat load as Letaba (6 MJ/s) the Rivet water plant would have
required 89 x 6 = 543 kW power, Letaba uses 225 kW, or 309 kW less than the Rivet design
extrapolated.
5.7 Conclusion
In this chapter the predicted change in energy efficiency of Letaba was shown and
evaluated. The results from the conceptual design were discussed and both hypotheses
evaluated. The energy efficiency was significantly improved. Measurement and verification
was discussed. Two energy efficiency measures that were implemented were described and
their results presented in sections 5.6 and 5.7.

The conceptual design of an integrated energy efficient ore reduction plant 98
CHAPTER 6
In Chapter 6 five alternative commercial plant configurations are presented and their energy
efficiency and cost are predicted. Recommendations are made regarding further research.
Ideals are like stars; you will not succeed in touching them with your
hands. But like the seafaring man on the desert of waters, you choose
them as your guides, and following them you will reach your destiny.
~Carl Schurz, address, Faneuil Hall, Boston, 1859
The conceptual design of an integrated energy efficient ore reduction plant 99
6 Conclusion and recommendations
6.1 Overview
Five alternative FCP configurations are discussed briefly in this chapter:
FCP1 is similar to LP2, except that the inductor and furnace bottom water-cooling are
replaced with thermal oil-cooling and more solar thermal energy is captured.
FCP2 is identical to FCP1, except that all electricity is internally generated by
combusting additional coal as is oxygen.
FCP3, FCP4 and FCP5 are also coal-fired off-grid configurations with oxygen self-
generation, but with a gas turbine top and ORC bottom cycle.
o In FCP3 an EFGT is installed as a top cycle.
o In FCP4 coal is gasified and syngas combusted in an integrated flue gas
treatment (IFGT) top cycle.
o FCP5 has a coal-fired IFGT and EFGT utilizing off-gas thermal energy as the
top cycle.
The final FCP configuration will depend on technology development over the next ten years.
In view of this future research needs are identified and recommendations are made.
6.2 Implication for full commercial plant
The study has indicated measures that can be considered to increase the energy efficiency
of the existing AlloyStream demonstration plant. The measures are applicable to a future
commercial plant but the following key differences between Scenarios 1 and Scenario 2
must be considered:
A commercial plant will feature substantially larger furnace/s.
Larger furnace/s will probably not require fuel gas during normal operation, as
sufficient combustion energy will be generated by carbon monoxide gas from the
heaps.
The electricity tariff structure will probably consist of a demand and an energy
component. Letaba electricity tariff is a fixed rate energy charge. An operating SAF-
based plant in the Mpumalanga province is billed (2013) an effective 70 c/kWh [84].
The implication is that the payback period of ECMs as calculated in this study will
increase by 40%.
Self-generation of oxygen will be required.

The conceptual design of an integrated energy efficient ore reduction plant 100
ECM technology development will result in improvement in performance and
reduction in cost. In this regard the following improvements are predicted:
o The cost of VSDs will reduce.
o With proper selection it will be possible to oil-cool the inductor coil, adding
2 640 kJ/s thermal energy to the thermal oil circuit of FCP.
o Solar PV efficiency will continue to improve. The capex cost of solar PV and solar
thermal will reduce.
o The capital cost of ORC, KRC and SC will reduce.
o Gas turbine technology with IAC, water injection (WI) and STIG will reach
maturity. The capex cost of gas turbines will reduce and the efficiency will
improve.
o High-temperature gas movers will enable off-gas recirculation.
o Coal gasification technology will mature and reduce in cost.
o VPSA or membrane technology will reduce the electricity required to generate
oxygen.
o The upper working limit of high-temperature high-efficiency gas filters will move
from the current 850°C to 1 000°C offered by MikroPul and Theisen [118, 119].
o The cost of high-temperature materials such as Kanthal, refractory metals and
ceramic linings will reduce and the availability of the materials will increase.
In the light of the above predictions five conceptual designs of a first commercial plant were
developed: FCP1 to FCP5. FCP1 is a scale-up from LP2 with furnace bottom and inductor-
cooling with thermal oil added. All five FCP configurations are based on Scenario 2.
The scale-up effect from LP2 is common across the five conceptual commercial plant
configurations. Scale-up reduces the specific energy use of non-furnace systems such as
raw material handling, lights, other auxiliaries and water-cooling systems as well as the heat
transferred through the furnace walls. The electrical power required to drive the related
electrical loads is predicted to rise by four times even though the product output increases by
ten times.
The heat loss through the furnace roof and bottom increases linearly with an increase in
reaction area and at heat loss through the sidewall with the square root of the reaction area,
assuming that the FCP furnace geometry is the same as LP1 and LP2. Since the area of the
roof and bottom is about 50% of the total area the increase in heat loss is 6.5:1 for ten-fold
process area increase.
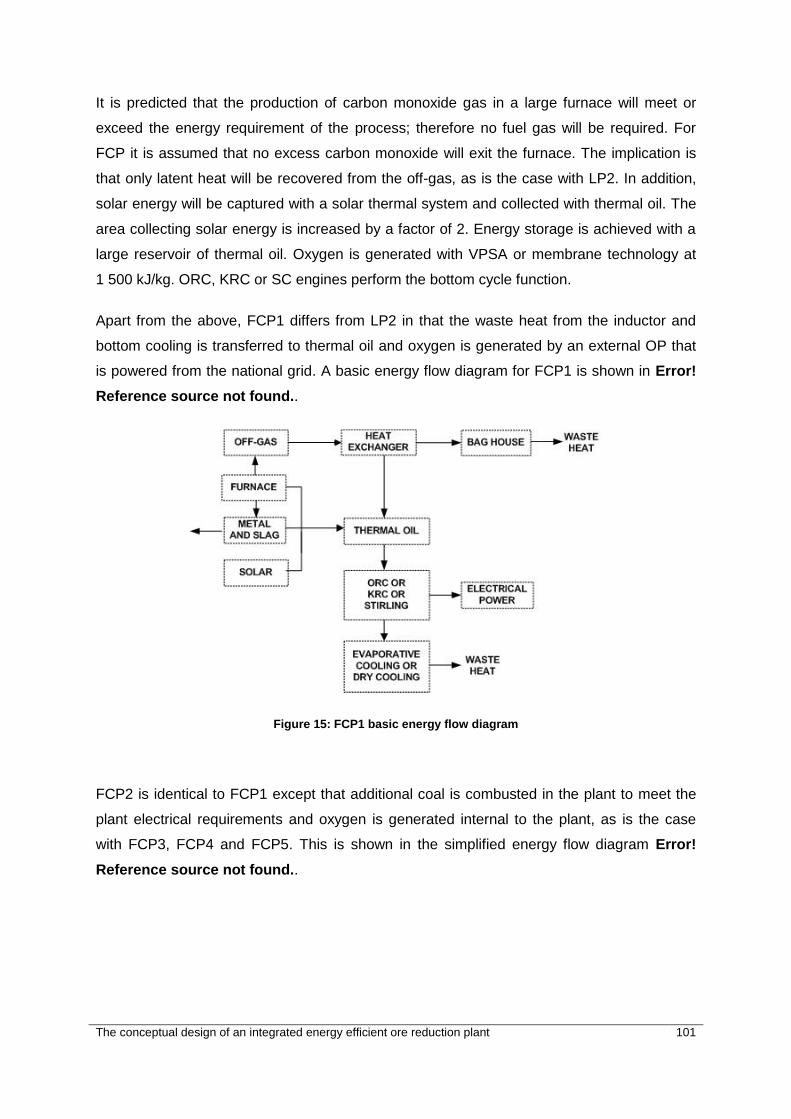
The conceptual design of an integrated energy efficient ore reduction plant 101
It is predicted that the production of carbon monoxide gas in a large furnace will meet or
exceed the energy requirement of the process; therefore no fuel gas will be required. For
FCP it is assumed that no excess carbon monoxide will exit the furnace. The implication is
that only latent heat will be recovered from the off-gas, as is the case with LP2. In addition,
solar energy will be captured with a solar thermal system and collected with thermal oil. The
area collecting solar energy is increased by a factor of 2. Energy storage is achieved with a
large reservoir of thermal oil. Oxygen is generated with VPSA or membrane technology at
1 500 kJ/kg. ORC, KRC or SC engines perform the bottom cycle function.
Apart from the above, FCP1 differs from LP2 in that the waste heat from the inductor and
bottom cooling is transferred to thermal oil and oxygen is generated by an external OP that
is powered from the national grid. A basic energy flow diagram for FCP1 is shown in Error!
Reference source not found..
Figure 15: FCP1 basic energy flow diagram
FCP2 is identical to FCP1 except that additional coal is combusted in the plant to meet the
plant electrical requirements and oxygen is generated internal to the plant, as is the case
with FCP3, FCP4 and FCP5. This is shown in the simplified energy flow diagram Error!
Reference source not found..
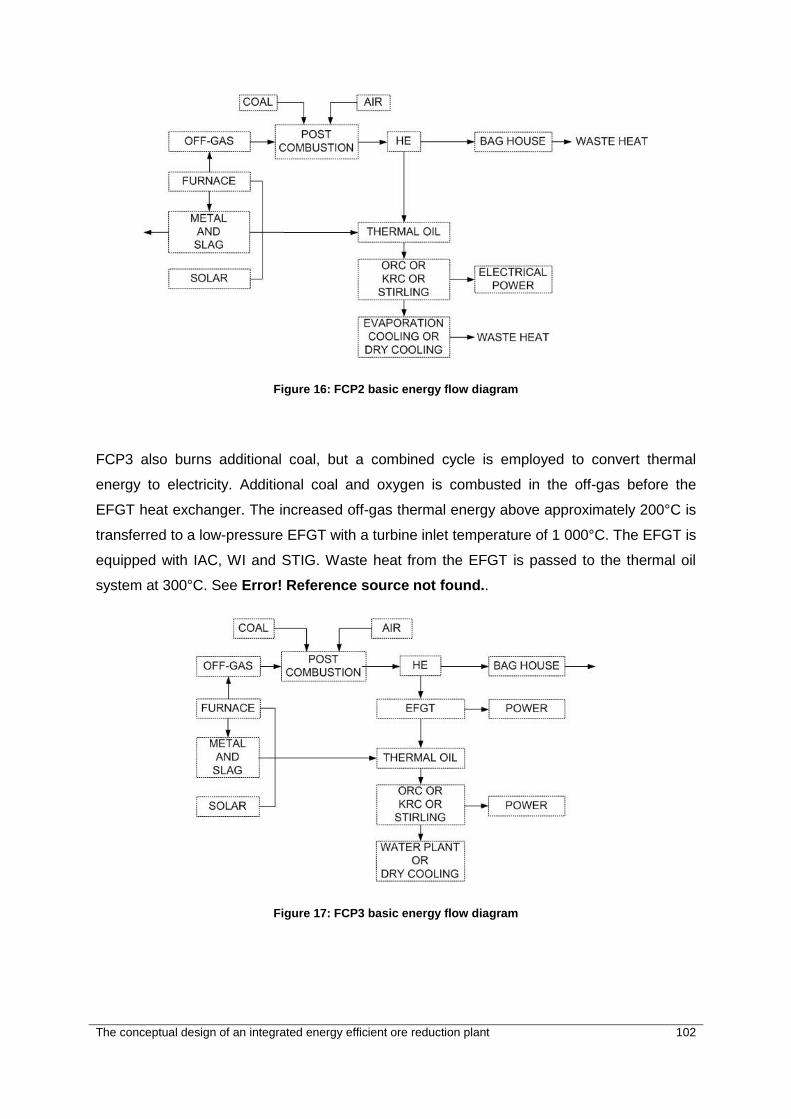
The conceptual design of an integrated energy efficient ore reduction plant 102
Figure 16: FCP2 basic energy flow diagram
FCP3 also burns additional coal, but a combined cycle is employed to convert thermal
energy to electricity. Additional coal and oxygen is combusted in the off-gas before the
EFGT heat exchanger. The increased off-gas thermal energy above approximately 200°C is
transferred to a low-pressure EFGT with a turbine inlet temperature of 1 000°C. The EFGT is
equipped with IAC, WI and STIG. Waste heat from the EFGT is passed to the thermal oil
system at 300°C. See Error! Reference source not found..
Figure 17: FCP3 basic energy flow diagram

The conceptual design of an integrated energy efficient ore reduction plant 103
FCP4 is the same as FCP3 except that an IFGT fuelled by syngas is used as a top cycle
instead of the EFGT of FCP3. Off-gas heat is passed to the bottom cycle through a heat
exchanger. The gasification system is supplied with oxygen, coal and water. The generated
syngas is scrubbed and supplied to a high-efficiency gas turbine or turbines. The gasification
efficiency is 80% and turbine efficiency 35%. See Error! Reference source not found..
Figure 18: FCP4 basic energy flow diagram
FCP5 is the same as FCP3, except that an IFGT with the additional coal directly injected is
added. A high-temperature filter cleans the gas stream after the coal combustor. See Error!
Reference source not found..
Figure 19: FCP5 basic energy flow diagram
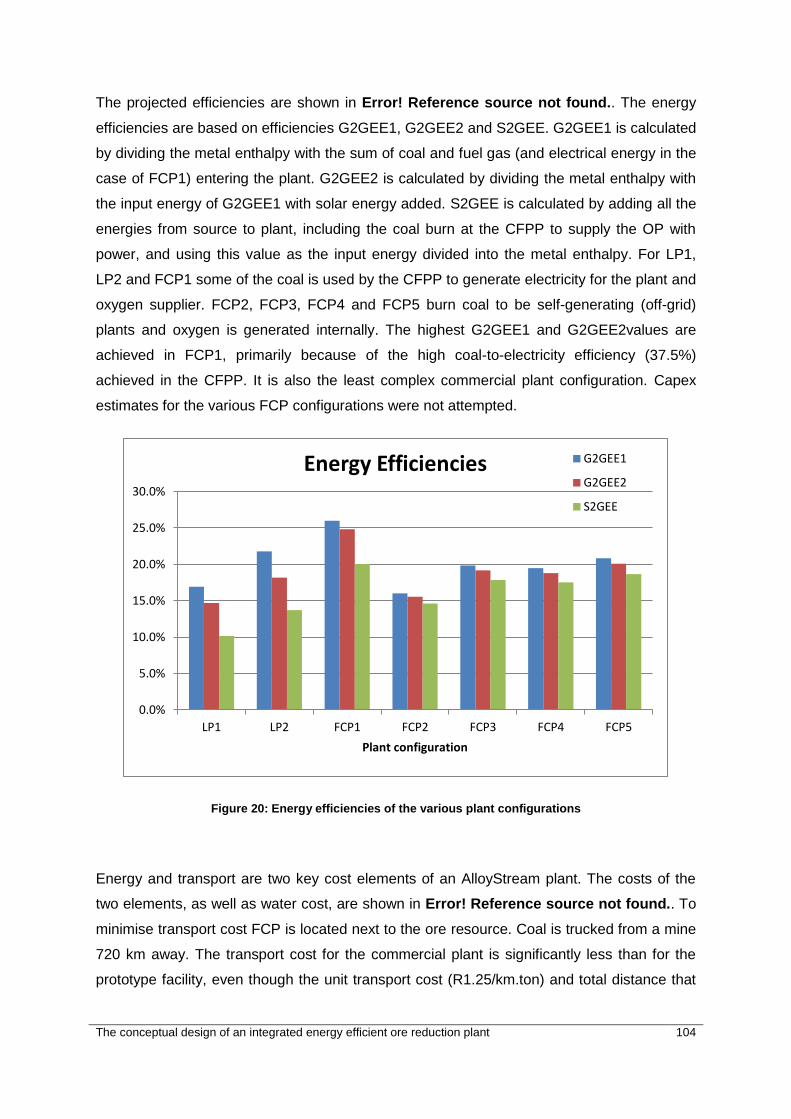
The conceptual design of an integrated energy efficient ore reduction plant 104
The projected efficiencies are shown in Error! Reference source not found.. The energy
efficiencies are based on efficiencies G2GEE1, G2GEE2 and S2GEE. G2GEE1 is calculated
by dividing the metal enthalpy with the sum of coal and fuel gas (and electrical energy in the
case of FCP1) entering the plant. G2GEE2 is calculated by dividing the metal enthalpy with
the input energy of G2GEE1 with solar energy added. S2GEE is calculated by adding all the
energies from source to plant, including the coal burn at the CFPP to supply the OP with
power, and using this value as the input energy divided into the metal enthalpy. For LP1,
LP2 and FCP1 some of the coal is used by the CFPP to generate electricity for the plant and
oxygen supplier. FCP2, FCP3, FCP4 and FCP5 burn coal to be self-generating (off-grid)
plants and oxygen is generated internally. The highest G2GEE1 and G2GEE2values are
achieved in FCP1, primarily because of the high coal-to-electricity efficiency (37.5%)
achieved in the CFPP. It is also the least complex commercial plant configuration. Capex
estimates for the various FCP configurations were not attempted.
Figure 20: Energy efficiencies of the various plant configurations
Energy and transport are two key cost elements of an AlloyStream plant. The costs of the
two elements, as well as water cost, are shown in Error! Reference source not found.. To
minimise transport cost FCP is located next to the ore resource. Coal is trucked from a mine
720 km away. The transport cost for the commercial plant is significantly less than for the
prototype facility, even though the unit transport cost (R1.25/km.ton) and total distance that
0.0%
5.0%
10.0%
15.0%
20.0%
25.0%
30.0%
LP1 LP2 FCP1 FCP2 FCP3 FCP4 FCP5
Plant configuration
Energy Efficiencies G2GEE1
G2GEE2
S2GEE

The conceptual design of an integrated energy efficient ore reduction plant 105
ore and coal are transported is the same. This illustrates the importance of optimum location
and hence the need for electrical self-sufficiency.
Although relatively insignificant, there is a marked increase in water cost due to self-
generation with evaporative cooling. Dry-cooling can be employed but it will adversely affect
the capex and bottom cycle efficiency. The estimated reduction in bottom cycle efficiency
due to dry-cooling is 2%.
Error! Reference source not found. also shows the opex benefit of waste heat recovery
and self-generation. The energy cost is based on an effective grid power cost of 70c/kWh for
FCP1. Additional coal is combusted to replace grid power for the other FCP configurations.
No maintenance or capital cost is included.
Figure 21: Key cost elements, 2013 base, evaporative cooling
6.3 Further research
It is clear that a gas turbine, either in EFGT or IFGT guise, is likely to feature in a future
plant. IAC has merit, considering the anticipated placement of the plant in a hot and high
location. Commercial solutions are available to inject water into the inlet air stream before it
enters the compressor [120]. By injecting water into the inlet air stream the compressor inlet
temperature can approach wet bulb temperature. This results in a reduction in compressor
work and a reduced temperature after compression [121]. A lower temperature after
compression will enable an increase in heat recovery from the off-gas stream, relevant to
0
1000
2000
3000
4000
5000
6000
7000
LP1 LP2 FCP1 FCP2 FCP3 FCP4 FCP5
R/t
on
me
tal
Plant configuration
Energy, water & transport cost
Energy cost
Transport cost
Water cost
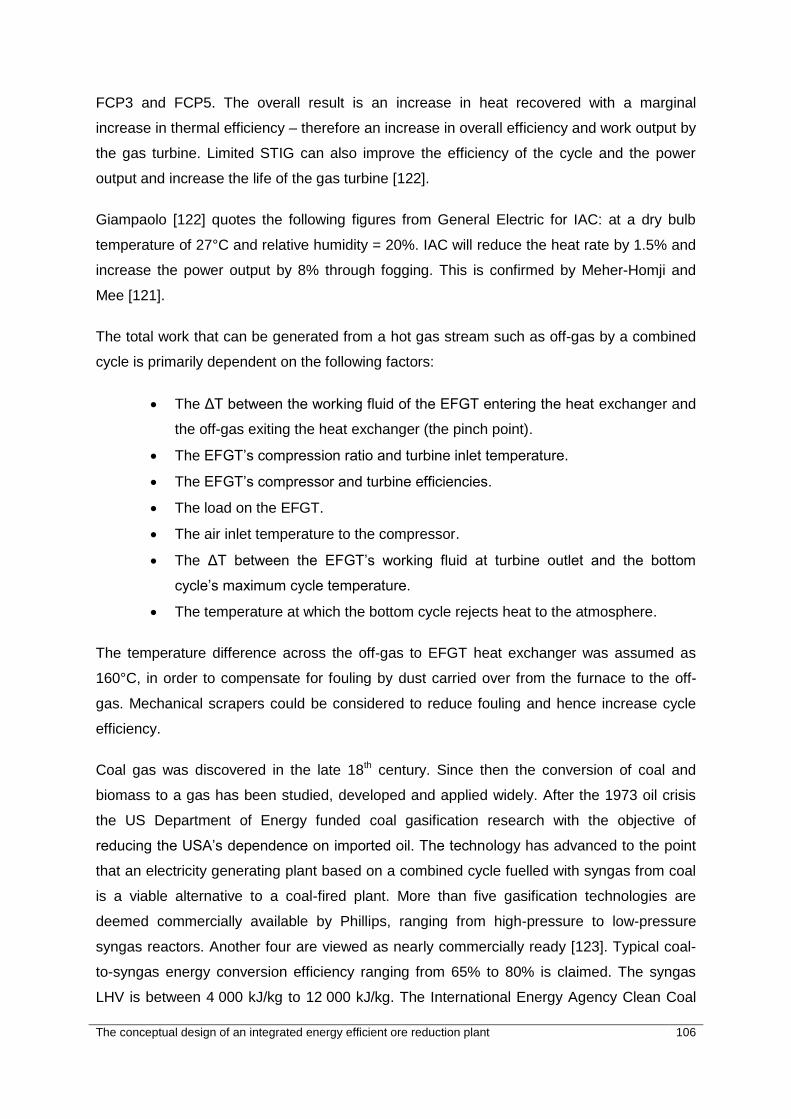
The conceptual design of an integrated energy efficient ore reduction plant 106
FCP3 and FCP5. The overall result is an increase in heat recovered with a marginal
increase in thermal efficiency – therefore an increase in overall efficiency and work output by
the gas turbine. Limited STIG can also improve the efficiency of the cycle and the power
output and increase the life of the gas turbine [122].
Giampaolo [122] quotes the following figures from General Electric for IAC: at a dry bulb
temperature of 27°C and relative humidity = 20%. IAC will reduce the heat rate by 1.5% and
increase the power output by 8% through fogging. This is confirmed by Meher-Homji and
Mee [121].
The total work that can be generated from a hot gas stream such as off-gas by a combined
cycle is primarily dependent on the following factors:
The ΔT between the working fluid of the EFGT entering the heat exchanger and
the off-gas exiting the heat exchanger (the pinch point).
The EFGT’s compression ratio and turbine inlet temperature.
The EFGT’s compressor and turbine efficiencies.
The load on the EFGT.
The air inlet temperature to the compressor.
The ΔT between the EFGT’s working fluid at turbine outlet and the bottom
cycle’s maximum cycle temperature.
The temperature at which the bottom cycle rejects heat to the atmosphere.
The temperature difference across the off-gas to EFGT heat exchanger was assumed as
160°C, in order to compensate for fouling by dust carried over from the furnace to the off-
gas. Mechanical scrapers could be considered to reduce fouling and hence increase cycle
efficiency.
Coal gas was discovered in the late 18th century. Since then the conversion of coal and
biomass to a gas has been studied, developed and applied widely. After the 1973 oil crisis
the US Department of Energy funded coal gasification research with the objective of
reducing the USA’s dependence on imported oil. The technology has advanced to the point
that an electricity generating plant based on a combined cycle fuelled with syngas from coal
is a viable alternative to a coal-fired plant. More than five gasification technologies are
deemed commercially available by Phillips, ranging from high-pressure to low-pressure
syngas reactors. Another four are viewed as nearly commercially ready [123]. Typical coal-
to-syngas energy conversion efficiency ranging from 65% to 80% is claimed. The syngas
LHV is between 4 000 kJ/kg to 12 000 kJ/kg. The International Energy Agency Clean Coal

The conceptual design of an integrated energy efficient ore reduction plant 107
Centre lists seven commercial gasification technologies that are commercially available and
three as under development [124].
Oxygen is produced almost exclusively by air liquification or VPSA. Using air liquification
98% + pure oxygen is produced. Commercial VPSA plants are configured to deliver similar
purities [114]. The AlloyStreamTM process, however, requires oxygen-enriched air in the
range of 25% to a maximum of 60% by mass. This requirement could be met by a VPSA
system at a lower specific energy than the typical 1 980 kJ/kg (0.55 kWh/kg) for air
liquefaction or high purity VPSA plants [125]. In addition, membrane technology has recently
entered the market. This technology is claimed to substantially reduce the specific power
required to generate the oxygen-enriched air [50].
The heat transfer that occurs inside the furnace vessel was excluded from this study.
However, the energy efficiency of the process inside the furnace has a very significant
impact on the overall plant energy efficiency. The process energy requirement of 2 174
kWh/ton metal is a sum of the following:
1. Heating of the ore, reductant and blast gases
2. The net energy required by the various reduction reactions
3. Changing the metal and slag phase from solid to liquid
4. Heating the metal and slag to 1 550°C
To achieve the 2 174 kWh/ton process energy in the order of 10 000 kWh/ton chemical and
electrical energy is supplied to the vessel. About 4 000 kWh/ton exits the vessel as thermal
energy in the off-gas stream and the balance of 3 500 kWh/ton exits through the walls as
heat loss. Only a partial reduction in heat loss and a relatively insignificant amount of heat
regeneration was addressed in this document. In theory it is possible to replace the nitrogen
entering the furnace (80% of blast air) with off-gas recirculation. If this can be done
practically, the oxygen quantity needed to generate the required 1 550°C could be
significantly less than used in the model, and the energy efficiency of the furnace could
increase substantially. However, less thermal energy will be available to generate electricity,
so even though the energy efficiency will increase, the total cost of energy may increase, as
will the complexity of the plant. Off-gas recirculation will require a high-temperature gas
moving system that can pump in the order of 10 kg/s off-gas at a pressure of 3 000 Pa
above ambient.
An alternate approach is to accept the current furnace inefficiencies and utilise the waste
heat to reduce the total cost of energy, as was done for LP2. FCP takes this one step further

The conceptual design of an integrated energy efficient ore reduction plant 108
by using self-generation. This approach is feasible and may even be imperative to the
deployment of the technology. Since the process is reliant on coal as a reductant, coal
material storage and handling systems are already present. The furnace can also be viewed
as a heat generator and the off-gas system already has heat exchangers and gas filtering. In
addition, heat conversion to electricity is proposed in this study, so to expand the systems to
burn additional coal and thereby make the plant independent of external electrical power is a
logical progression.
The LP2 conceptual design is based on evaporative water-cooling. In practice at Pretoria the
average wet bulb temperature is 15°C to 17°C and a heat rejection temperature for the
bottoming cycle of wet bulb +5°C, or 20°C to 22°C is achievable. This should be similar in a
Hotazel location where a lower relative humidity is expected. If no water consumption is a
requirement dry-cooling will have to be employed, using fin fan coolers. Dry-cooling has two
disadvantages – the fan power is significantly more than the fan power for cooling towers,
and the heat rejection temperature is at dry bulb +20°C. The elevated heat rejection
temperature of dry-cooling reduces the thermal efficiency of the bottoming cycle by an
estimated 2%.
The generation of a margin of excess power could play an important role. By cooling down a
large thermal mass at night (a water or thermal oil reservoir), the high ambient in daytime
can be countered. The mix of energy available for generation and storage will have to be
managed continuously to maintain an optimum daily efficiency.
Electrical capacity reserve and internal network stability is a factor that will require careful
attention in self-generation. Internal network design falls outside the scope of this study.
6.4 Recommendations
An important aspect of the ECM Evaluation Matrix (Appendix B) is the confidence rating. A
low rating indicates a lack of dependable information, either because it could not be found or
it does not exist. In practice there are three actions that can be taken to increase the
confidence in the measure:
Search for literature, visit appropriate sites, contact experts
Run a small-scale test
Run a full system
Letaba offers a unique opportunity to test on small- or full-scale.

The conceptual design of an integrated energy efficient ore reduction plant 109
This study has focused on one aspect of energy management, namely engineering
improvements, and has ignored energy management and demand management due to the
flat rate charged. During the design, energy efficiency should be one of the criteria used to
evaluate solutions. Once the plant is in operation, energy management should be practiced,
the US EPA Energy Star program could be an excellent starting point leading to ISO 50001
certification. All significant energy usage should be measured and recorded and adjustments
to the operations made to hold the efficiency gains and even improve on them.
In addition to energy management the following development initiatives are recommended:
Do full-scale research and testing on an EFGT with IAC and water injection and
STIG.
Do full-scale research and testing on coal gasification to IFGT system.
Build a small high-temperature off-gas-to-air heat exchanger and install it in the off-
gas system of Letaba as near to the furnace as possible. Experiment with anti-fouling
solutions.
Install a small ORC with an oil circuit to harvest heat from the second stage off-gas
duct on LP1.
Develop the energy model that supported this study to include various operating
regimes, and include energy storage and demand management.
Develop a model for self-generation of electricity based on coal as a fuel source for
an EFGT with IAC and STIG, or coal gasification integrated with off-gas and syngas
powered IFGT with IAC and STIG.
Develop and test a coal-fired IFGT micro-turbine with high-temperature filters.
Test membrane filter technology on a pilot basis to generate oxygen-enriched air.
6.5 Conclusion
This study was initiated by a need to improve the energy efficiency of a prototype ore
reduction plant. By following the research methodology valuable results were obtained,
pointing the way for plants that may be built in the future. The study could also be of value to
existing plants in industry, as the ECMs studied can in most cases be retrofitted to existing
plants.
The study proved that the energy efficiency of the as-built Letaba plant can be significantly
improved and the energy cost to the plant substantially reduced. When extrapolated to a
commercial size plant even better results are predicted. Further research and development

The conceptual design of an integrated energy efficient ore reduction plant 110
is recommended to increase confidence in the predictions and accelerate the
commercialisation of promising technology.
The road to this document took the author through a number of stages. The first was a
growing realisation that energy efficiency is critical to the success of the AlloyStreamTM
technology and that it was not high on the development agenda. Stage 1 took about three
years. This realisation increased the awareness of the author of how energy was used in the
plant.
In Stage 2 a burst of discussions and reading of information on energy recovery methods
followed. This lasted about two years. During Stage 2 Letaba was designed and the constant
temperature water-cooling system implemented. A fork in the road appeared after Stage 2 –
should the investigation into improved energy efficiency be a commercial investigation only,
or should it also be subjected to the rigours of academic scrutiny? The latter was chosen
primarily for the quality assurance inherent in the scientific method.
The start of Stage 3 was the research proposal, followed by mostly a muddle in the dark for
eighteen months. At the start of Stage 4 the writer had accumulated a large amount of
information and the work of sifting through it, structuring the dissertation, reading and
thinking and again reading had started. All along something profound was happening almost
unnoticed. Clarity and purpose replaced opinions, guesses and confusion. And energy
efficiency became a priority on the development agenda of the business.
The conceptual design of an integrated energy efficient ore reduction plant 111
REFERENCE LIST
[1] Tangstad, M and Olsen, SE, “The ferromanganese process: material and energy
balance” in Proceedings of the INFACON 7 Congress, Trondheim, Norway, Jun.
1995, pp. 621-630.
[2] Pyrotek.info, “Molten aluminium/water explosions,” Aluminium Insight, vol. 5, no. 1,
Feb. 2011.
[3] Hornsby G, “Explosion risks in a casthouse,” presented at the Aluminium Casthouse
Seminar, Richards Bay, 14 Apr. 2013.
[4] Webb, M. (27 Feb. 2008). Assmang furnace explosion death toll climbs. Mining
Weekly.com [Online]. Available: http://www.miningweekly.com/article/assmang-
furnace-explosion-death-toll-climbs-2008-02-27. Accessed: July 2013.
[5] Creamer, M. (2 Sep. 2013). Malaysian project not abandonment of local
beneficiation: ARM. Mining Weekly.com [Online]. Available:
http://www.engineeringnews.co.za/article/arm-malaysia-2013-09-02. Accessed: 13
Sept. 2013.
[6] Mining Technology Market & Customer Insight. (January 2013). “Anglo American
takes $4bn writedown on Brazil mine.” [Online]. Available: http://www.mining-
technology.com/news/newsanglo-american-takes-4bn-impairment-charge-on-minas-
rio-project-in-brazil. Accessed October 2013.
[7] BHP Billiton, “Manganese industry overview,” presented at the Affival Nordic Cored
Wire and Alloy Market Seminar, 7 Sept. 2006.
[8] Roomanay, N, Boonzaier, S and Gediga, J, “Carbon footprint analysis and
technology benchmark for Project Letaba,” unpublished, Sept. 2013.
[9] Exxaro, “Letaba baseline III,” unpublished spreadsheet, Exxaro, Pretoria, South
Africa, 9 Jan. 2009.
[10] Wall, G, Exergetics, Bucaramanga, 2009. Available:
http://exergy.se/ftp/exergetics.pdf. Accessed September 2013.
[11] Wilbur, LC, Handbook of Energy Systems Engineering, New York: Wiley
Interscience, ISBN 0-471 86633-4, 1985.
[12] Doty, S and Turner, WC, Energy Management Handbook, 7th ed., Lilburn: Fairmont,
ISBN 10: 0-88173-609-0, 2009.
The conceptual design of an integrated energy efficient ore reduction plant 112
[13] Thumann, A and Mehta, DP, Handbook of Energy Engineering, 6th ed., Lilburn:
Fairmont, ISBN 0-88173-581-7, ISBN 0-88173-582-5, ISBN 4200-8768-1, 2008.
[14] Chan, DY, Yang, K, Hsu, C, Chien, M, and Hong, G, “Current situation in energy
conservation in high energy-consuming industries in Taiwan,” Energy Policy, vol. 35,
pp. 202-209, 2007.
[15] Martins, GJ, “A methodology to identify, quantify and verify the cost benefits of
energy and process improvements on a ferro-metal production plant,” Dissertation
for Masters of Engineering, North-West University, 2004.
[16] Hasanbeigi, A, Morrow, W, Sathaye, J, Masanet, E and Xu T, “A bottom-up model to
estimate the energy efficiency improvement in the Chinese iron and steel industry,”
Energy, vol. 50, pp. 315-325, 2013.
[17] Warczok, A and Riveros, G, “Energy efficiency in batch, continuous and one-step
copper pyrometallurgical processes,” Universidad de Chile, Santiago, Chile, 2004.
[18] Giacone, E and Mancò, S, “Energy measurement in industrial processes,” Energy,
vol. 38, pp. 331-345, 2012.
[19] Chen, H, Hsu, C and Hong, G, “The case study of energy flow analysis and strategy
in pulp and paper industry,” Energy Policy, vol. 43, pp. 448-455, 2012.
[20] Hagemo, C, “Energy management for dummies: Focus on sulphuric acid plants in a
phosphate fertilizer complex,” Energy Engineering, vol. 110, no. 1, pp. 8-32, 2013.
[21] Directorate-General Joint Research Centre, European Commission, “Summary on
energy efficiency issues in the BREF series,” European Commission, Sevilla, Spain,
2009.
[22] “IEEE recommended practice for energy conservation and cost-effective planning in
industrial facilities,” IEEE Std 739-1984, pp. 15-160, 5 Nov. 1984. Available:
http://ieeexplore.ieee.org/stamp/stamp.jsp?tp=&arnumber=469111&isnumber=9886.
[23] Worrell, E, Martin, N and Price, L, “Energy efficiency and carbon dioxide emissions
reduction opportunities in the US iron and steel sector,” Environmental Energy
Technologies Division, Ernest Orlando Lawrence Berkeley National Laboratory,
University of California, 1999.
[24] Cheng Power Systems. (n.d). The Cheng Cycle®. [Online]. Available:
http://chengpower.com/cheng_cycle%C2%AE. Accessed: 23 Sept. 2013.
The conceptual design of an integrated energy efficient ore reduction plant 113
[25] United States Environmental Protection Agency, “Available and emerging
technologies for reducing greenhouse gas emissions from the iron and steel
industry,” Office of Air and Radiation, United States Environmental Protection
Agency, Research Triangle Park, North Carolina, Sept. 2012.
[26] Nored, M, Wilcox, M and McKee, R “Waste heat recovery technology overview,”
Gas/Electric Partnership, Southwest Research Institute, San Antonio, Texas, 2009.
[27] Barati, M, Esfahani, S and Utigard, TA, “Energy recovery from high temperature
slags,” Energy, vol. 36, pp. 5440-5449, 2011.
[28] Datta, A, Ganguly, R and Sarkar, L, “Energy and exergy analysis of an externally
fired gas turbine (EFGT) cycle integrated with biomass gasifier for distributed power
generation,” Energy, vol. 35, pp. 341-350, 2010.
[29] Rodrigues, CEC et al., “Exergetic and economic comparison of ORC and Kalina
cycle for low temperature enhanced geothermal system in Brazil,” Applied Thermal
Engineering, vol. 52, pp. 109-119, 2013.
[30] Murugan, RS and Subbarao, PMV, “Thermodynamic analysis of Rankine-Kalina
cycle,” International Journal of Thermodynamics, vol. 11, no. 3, pp. 133-141,
September 2008.
[31] Little, AB and Garimella, S, “Comparative assessment of alternative cycles for waste
heat recovery and upgrade,” Energy, 36, pp. 4492-4504, 2011.
[32] Chan, CW, Ling-Chin, J and Roskilly, AP, “A review of chemical heat pumps,
thermodynamic cycles and thermal energy storage technologies for low grade heat
utilisation,” Applied Thermal Engineering, vol. 50, pp. 1257-1273, 2013.
[33] Ammar, Y, Joyce, S, Norman, R, Wang, Y and Roskilly, AP, “Low grade thermal
sources and uses from the process industry in the UK,” Applied Energy, vol. 89, pp.
3-20, 2012.
[34] Sardeshpande, V, Anthony, R, Gaitonde, UN and Banerjee, R, “Performance
analysis for glass furnace regenerator,” Applied Energy, vol. 88, no. 1, pp. 4451-
4458, June 2011.
[35] Stehlìk, P, “Conventional versus specific types of heat exchangers in the case of
polluted flue gas as the process fluid: A review,” Applied Thermal Engineering, vol.
31, no. 1, pp. 1-13, 2011.

The conceptual design of an integrated energy efficient ore reduction plant 114
[36] Stehlìk, P, “Heat transfer as an important subject in waste-to-energy systems,”
Applied Thermal Engineering, vol. 27, pp. 1658-1670, 2007.
[37] Shekarchian, M, Zarifi, F, Moghavvemi, M, Motasemi, F and Mahlia, TMI, “Energy,
exergy, environmental and economic analysis of industrial fired heaters based on
heat recovery and preheating techniques,” Energy Conversion and Management,
vol. 71, pp. 51-61, 2013.
[38] Ohman, H and Lundqvist, P, “Comparison and analysis of performance using low
temperature power cycles,” Applied Thermal Engineering, vol. 52, pp. 160-169,
2013.
[39] Sardeshpande, V, Gaitonde, UN and Banerje, R, “Model based energy benchmark
for glass furnace,” Energy Conversion and Management, vol. 45, pp. 2718-2738,
2007.
[40] Carvalho, M and Millar, DL, “Concept development of optimal mine site energy
supply,” Energies, vol. 5, pp. 4726-4745, 2012.
[41] Carpenter, B. (2011). The Merrick Consultancy: Seven Ways to Reduce Energy in a
Process Facility. [Online]. Available:
http://www.merrick.com/merrickandcompany/media/Resources/Energy/Whitepapers
/Seven-Ways-to-Reduce-Energy-in-a-Process-Facility-White-Paper.pdf?ext=.pdf.
Accessed: 13 Jun. 2013.
[42] De Paepe, W, Delattin, D, Bram, S and De Ruyck, J, “Steam injection experiments
in a micro turbine: A thermodynamic performance analysis,” Applied Energy, vol. 97,
pp. 569-576, 2012.
[43] Wang, FJ, Chiou, JS and Wu, PC, “Economic feasibility of waste heat to power
conversion,” Applied Energy, vol. 84, pp. 442-454, 2007.
[44] Reddy, CCS, Naidu, SV and Rangaiah, GP, “Waste heat recovery methods and
technologies,” Chemical Engineering, pp. 28-38, January 2013.
[45] Iora, P and Silva, P, “Innovative combined heat and power system based on a
double shaft intercooled externally fired gas cycle,” Applied Energy, vol. 105, pp.
108-115, 2013.
The conceptual design of an integrated energy efficient ore reduction plant 115
[46] Yao, H, Sheng, D, Chen, J, Li, W, Wan, A and Chen, H, “Exergoeconomic analysis
of a combined cycle system utilizing associated gasses from steel production
process based on structural theory of thermoeconomics,” Applied Thermal
Engineering, vol. 51, pp. 476-489, 2012.
[47] Cocco, D, Deiana, P and Cau, G, “Performance evaluation of small size externally
fired gas turbine (EFGT) power plants integrated with direct biomass drier,” Energy,
vol. 31, pp. 1459-1471, 2006.
[48] Snyman, J, “Integrating various energy saving initiatives on compressed air systems
of typical South African gold mines,” Dissertation for Masters of Engineering, North-
West University, Potchefstroom, South Africa, 2011.
[49] Bosch. (n.d). Bosch Solar Module c-Si M 60+. [Online]. Available: http://www.bosch-
solarenergy.com/en/bosch_se_online/home_1.html. Accessed: 11 Nov. 2013.
[50] Grasys. (n.d). Adsorption and Membrane Oxygen: Plants and Stations. [Online].
Available: http://www.grasys.com/upload/iblock/556/oxygen_eng.pdf. Accessed: 13
Jun. 2013.
[51] Tucker, R and Ward, J, “Identifying and quantifying energy savings on fired plant
using low-cost modelling techniques,” Applied Energy, vol. 89, pp. 127-132, 2012.
[52] Sano, S, Mizukami, H and Kaibe, H. (2011). Komatsu Technical Report:
Development of High-efficiency Thermo-Electric Power Generation System.
[Online]. Available: http://www.komatsu.com/CompanyInfo/profile/report/pdf/164-E-
05.pdf. Accessed: 16 Oct. 2013.
[53] TEC. (n.d). TEC Website. [Online]. Available: http://thermoelectric-generator.com/.
Accessed: 12 Nov. 2013.
[54] Phillips, SS, “Characterizing the thermal efficiency of thermoelectric modules,”
Thesis for Bachelor of Science, Massachusetts Institute of Technology, Cambridge,
Massachusetts, 2009.
[55] Chen, WH, Chung, YC and Liu, JL, “Analysis on energy consumption and
performance of reheating furnaces in a hot strip mill,” International Communication
in Heat and Mass Transfer, vol. 32, pp. 695-706, 2005.
[56] Gutierrez, AS, Cogollos Martinez, JB and Vandecasteele, C, “Energy and exergy
analysis of a lime shaft kiln,” Applied Thermal Engineering, vol. 51, pp. 273-280,
2013.
The conceptual design of an integrated energy efficient ore reduction plant 116
[57] Jochens, PR, “The energy requirements of the mining and metallurgical industry in
South Africa,” Journal of the South African Institute of Mining and Metallurgy, pp.
331-343, Sept. 1980.
[58] Mahto, D and Pal, S, “Thermodynamic and thermo-economic analysis of simple
combined cycle with inlet fogging,” Applied Thermal Engineering, vol. 51, pp. 413-
424, 2013.
[59] Matsuda, K, Tanaka, S, Endou, M and Iiyoshi, T, “Energy saving study on a large
steel plant by total site based pinch technology,” Applied Thermal Engineering, vol.
43, pp. 14-19, 2012.
[60] Habashi, F, “Fire and the art of metals: A short history of pyrometallurgy,” Mineral
Processing and Extractive Metallurgy, vol. 114, C165-C171, Sept. 2005.
[61] Jegla, Z, “The conceptual design of a radiant chamber and preliminary optimization
of a process tubular furnace,” Heat Transfer Engineering, vol. 27, pp. 50-57, 2006.
[62] Sano, T, “Improving efficiency of thermal power generation in Japan,” Journal of
Power and Energy Systems, vol. 5, no. 2, pp.146-160, 2011.
[63] Riekkola-Vanhanen M, “Finnish expert report on best available techniques in nickel
production,” The Finnish Environment, Helsinki, Finnish Environment Institute
Report 317, ISBN 952-11-0507-0, 1999.
[64] Reverberi, A, Del Borghi, A and Dovi, V, “Optimal design of cogeneration systems in
industrial plants combined with district heating and thermal energy storage,”
Energies, pp. 2151-2165, 2011.
[65] Cau, G, Cocco, D and Serra F, “Energy and cost analysis of small-size integrated
coal gasification and syngas storage power plants,” Energy Conversion and
Management, vol. 56, pp. 121-129, 2012.
[66] Engelbrecht, AD, “Characterization and fluidized bed gasification of selected high-
ash South African Coals,” Dissertation for Masters of Engineering, North-West
University, Potchefstroom, South Africa, 2008.
[67] Vera, D, Jurado F, De Mena, B and Schories, G, “Comparison between externally
fired gas turbine and gasifier-gas turbine system for the olive oil industry,” Energy,
vol. 36, pp. 6720 -6730, 2011.
[68] MarketLine, “Industry profile: Electricity in South Africa,” MarketLine, Manchester,
UK, ML00004-379, Sept. 2012.
The conceptual design of an integrated energy efficient ore reduction plant 117
[69] Weisbach, D, Ruprecht, G, Huke, A, Czerski, K, Gottlieb S and Hussein, A, “Energy
intensities, EROIs (energy returned on investment), and energy payback times of
electricity generating power plants,” Energy, vol. 52, pp. 210-221, 2013.
[70] Akiyama, T, Shimada, T, Kasai, E and Yagi, J, “Feasibility of waste heat recovery
from molten slag,” presented at the China-Japan International Academic
Symposium: Environmental Problem in Chinese Iron-Steelmaking Industries,
Sendai, Japan, 6 Mar. 2000.
[71] Marrero, IO, Lefsaker, AM, Razani, A and Kim, KJ, “Second law analysis and
optimization of a combined triple power cycle,” Energy Conversion and
Management, vol. 43, pp. 557-573, 2002.
[72] Beloglazov, AA, Ivanof, PP and Medin, SA, “Thermodynamic analysis of coal fired
gas turbine power plant characteristics with water injection into compressor,” High
Energy Density Research Center, Associated Institute for High Temperatures,
Russian Academy of Sciences, Moscow, Russia, 2002.
[73] Horlock, JH, “Heat exchanger performance with water injection (with relevance to
evaporative gas turbine (EGT) cycles),” Energy Conversion Management, vol. 39,
no. 16-18, pp. 1621-1630, 1998.
[74] Tchanche, BF, Lambrinos, GR, Frangoudakis, A and Papadakis, G, “Low grade
heat conversion into power using organic Rankine cycles: A review of various
applications,” Renewable and Sustainable Energy Reviews, vol. 15, pp. 3963-3979,
2011.
[75] Kanthal. (n.d). APMT datasheet: Sandvik Material Technology. [Online]. Available:
http://www.kanthal.com/products/material-datasheets/tube/kanthal-apmt/. Accessed:
13 Mar. 2013.
[76] Davis, JR, ASM Speciality Handbook: Heat Resistant Materials, Novelty, OH: ASM
International, ISBN 0-87170-596-6, 1997.
[77] Athey, TH, Systematic Systems Approach, New Jersey: Prentice Hall, ISBN 0-13-
880914-3, 1982.
[78] The International Energy Agency. (2010). Technology Roadmap – Solar
photovoltaic energy. Available:
http://www.iea.org/publications/freepublications/publication/name,3902,en.html.
Accessed February 2014.
The conceptual design of an integrated energy efficient ore reduction plant 118
[79] Kunze, J and Degel, R, “New trends in submerged arc furnace technology,” in
Proceedings of the INFACON X Congress, Cape Town, South Africa, ISBN 0-
9584663-5-1, Feb. 2004.
[80] Energy Management Systems, ISO 50001, ISBN 978-92-67-10552-9, 2011.
[81] Jones, JB and Dugan, RE, Engineering Thermodynamics. New Jersey: Prentice
Hall, ISBN 0-13-320375-1, 1996.
[82] Faires, VM, Thermodynamics, 5th ed., New York: Macmillan, 1970.
[83] BusinessDictionary.com. (n.d). Scenario: Definition. [Online]. Available:
http://www.businessdictionary.com/definition/scenario.html. Accessed: 12 Nov.
2013.
[84] Herselman, M (Assore), private communication, Apr. 2013.
[85] Ackoff, RL, The Art of Problem Solving, New York: Wiley, ISBN 0-471-04289-7,
1978.
[86] Aflaki, S and Kleindorfer, PR. (26 May 2012). Finding and Implementing Energy
Efficiency Projects in Industrial Facilities. [Online]. Available:
http://www.insead.edu/facultyresearch/research/doc.cfm?did=44941. Accessed: 06
Aug. 2013.
[87] Billinton, R and Allan, RN, Reliability Evaluation of Engineering Systems: Concepts
and Techniques, London: Pitman, ISBN 0-273-08484-4, 1983.
[88] Allen, RL, “Machinery Safeguarding,” Professional Safety, vol. 57, no. 8, p. 66,
August 2012.
[89] Wikipedia. (26 Aug. 2010.). Gingsberg’s theorem. [Online]. Available:
http://en.wikipedia.org/wiki/Ginsberg's_theorem. Accessed: 12 Jul. 2011.
[90] Kern, DQ, Process Heat Transfer, New York: McGraw-Hill, 1950.
[91] European Committee of Manufacturers of Electrical Machines and Power
Electronics. (Feb. 2011). Electric motors and variable speed drives: Standards and
legal requirements for the energy efficiency of low-voltage three-phase motors.
[Online]. Available:
http://www.cemep.org/fileadmin/downloads/CEMEP_Motors_and_VSD.pdf.
Accessed: 10 Aug. 2013.
[92] WEG (www.weg.net/za), private communication, Oct. 2013
The conceptual design of an integrated energy efficient ore reduction plant 119
[93] SunbirdSkylights. (n.d). SunbirdSkylights: 100% Natural Lighting. [Online].
Available: http//www.sunbirdskylights.co.za. Accessed: 3 Oct. 2013.
[94] Verscheure, K, Kylo, AK, Filzwieser, A, Blanpain, B and Wollants, P, “Furnace
cooling technology in pyrometallurgical processes,” in Proceedings of the Sohn
International Symposium, Advanced Processing of Metals and Materials, vol. 4,
2006.
[95] Turboden. (Aug. 2013). Turboden Product Specification. [Online]. Available:
http://www.turboden.eu/en/public/downloads/Tabella%20Data%20HRS%20(large
%20sizes)%20-%20ING%20LR.pdf. Accessed: Sep. 2013.
[96] Duratherm. (n.d). Duratherm Data Sheet. [Online]. Available: http://www.heat-
transfer-fluid.com/pdf/productdata/heattransfer/duratherm-630.pdfn. Accessed: Jul.
2013.
[97] Cool Energy. (n.d.). Cool Energy Waste Heat Recovery System. [Online].
Available: http://www.coolenergyinc.com/PDFs/WHR_Economics05.23.12.pdf.
Accessed: 25 Sept. 2013.
[98] Martini, WR. (Jan. 1983). Stirling Engine Design Manual, DOE/NASA/3194-1,
NASA CR-168088. Online]. Available:
http://mac6.ma.psu.edu/stirling/reports/NasaStirlingEngineDesignManual_1983.pdf
. Accessed: 25 Sept. 2013.
[99] Flexenergy. (n.d). Flexenergy Website. [Online]. Available:
http://www.flexenergy.com/wp-content/uploads/2012/03/Flex-
MT250_G3_Product_312.pdf. Accessed: 25 Sept. 2013.
[100] Elliot Group, “Alloystream Study, South Africa; Elliott Ref. 119-13-011”
unpublished proposal, Elliot Group, Jeanette, Pennsylvania, 12 March 2013.
[101] Mayhew, R and Rogers, GFC, Thermodynamics and Transport Properties of
Fluids, Oxford: Blackwell, 1969.
[102] Northern Innovation. (Mar. 2010). Technical Investigation into Thermal Oil, Project
no. 1555. March 2010. [Online]. Available: http://www.docdatabase.net/more-
technical-investigation-into-thermal-oil-technology-1130036.html. Accessed: 04
Oct. 2013.
[103] Harding, V, “AlloyStream thermal harvesting off-gas cooling proposal,”
unpublished proposal, Vuselela (Pty) Ltd, Centurion, South Africa, Nov. 2010.
The conceptual design of an integrated energy efficient ore reduction plant 120
[104] Valdimarsson, P, “ORC and Kalina: Analysis and experience,” Washington State
University, Dec. 2003. [Online]. Available:
http://www.northwestchptap.org/NwChpDocs/ORC_and_Kalina_Analysis_and_exp
erience.pdf. Accessed: 26 Sept. 2013.
[105] Jumonville, J. (2010). Tutorial on Cryogenic Turboexpanders. Atlas Copco Mafi-
Trench Company LCC, Santa Maria, California. [Online]. Available:
http://edoqs.com/pdf/tutorial-on-cryogenic-turboexpanders-texas-aampm-
university-_4cee7ef824f0aa964fd45cac7f869700. Accessed: 26 Sept. 2013.
[106] FuelCell Energy. (n.d.). FuelCell Energy Website. [Online]. Available:
http://www.fuelcellenergy.com/assets/PID000155_FCE_DFC300_r1_hires.pdf.
Accessed: 31 Oct. 2013.
[107] Steinmann, L (Exxaro Resources), private communication, 23 Nov. 2013.
[108] Advanced Coal Technology (Pty) Ltd, “Results of coal analysis,” unpublished
document, Advanced Coal Technology, Roger Dyason Road, Pretoria, 15 Feb.
2005.
[109] Eskom. (n.d) Eskom Lethabo Power Station. [Online]. Available:
http://www.eskom.co.za/Whatweredoing/ElectricityGeneration/PowerStations/Page
s/Lethabo_Power_Station.aspx. Accessed: Sept. 2013.
[110] Eskom. (n.d) Eskom Duhva Power Station. [Online]. Available:
http://www.eskom.co.za/Whatweredoing/ElectricityGeneration/PowerStations/Page
s/Duvha_Power_Station.aspx. Accessed: Sept. 2013.
[111] Nylund, N and Erkkilä, K, “Heavy duty truck emissions and fuel consumption
simulating real-world driving in laboratory conditions,” presented at the DEER
Conference, Chicago Illinois, USA, 21- 25 August 2005.
[112] Eskom. (2012). Tariffs and charges booklet: 2012/13. [Online]. Available:
http://www.eskom.co.za/Whatweredoing/Documents/ESKOM_TarriffBook2012-
13.pdf. Accessed: 08 July 2013.
[113] US Energy Information Administration. (n.d). “How much electricity is lost in
transmission and distribution in the United States?” [Online] Available:
www.eia.gov/tools/faqs/faq.cfm?id=105&t=3. Accessed: 11 Sept. 2013.
The conceptual design of an integrated energy efficient ore reduction plant 121
[114] Universal Industrial Plants Manufacturing. (n.d). Air Separation Plants. [Online].
Available: http://www.oxygenplants.com/air-separation-plant.html. Accessed: 12
Sept. 2013.
[115] African Rainbow Minerals. (July 2013). 2013 Sustainability Report. [Online].
Available: http://arm.integrated-report.com/2013/download/ARM-SD13.pdf.
Accessed: 02 Dec. 2013.
[116] Sasol. (n.d). Natural Gas Technical Data Sheet. [Online]. Available:
www.sasol.co.za/products/gas/methane-rich-gas-. Accessed: Sept. 2013.
[117] Coetsee, T, “Letaba campaign 1 process report,” unpublished report, AlloyStream,
Pretoria, South Africa, Jan. 2013.
[118] Mikropul. (n.d). Product Brochure: High Temperature Filtration. [Online]. Available:
http://www.lochtec.dk/Soegning/High%20Temperature%20Filtration%20112000.pd
f. Accessed:19 Sept. 2013.
[119] Gottschling, R, “High temperature-dedusting with hot gas dry filters,” Theisen
GmbH Gas Cleaning Systems. [Online]. Available:
http://www.saimm.co.za/download/branches/Pretoria/2009%20May%20Gottschlin
g%20with%20text.pdf. 20 Nov. 2013.
[120] Cat Pumps. (n.d). Product brochure: Gas Turbine Inlet Fogging. [Online].
Available: www.catpumps.com/pumps-gas-turbine-inlet-cooling-fogging.asp.
Accessed: 20 Nov. 2013.
[121] Meher-Homji, CB and Mee, TR, “Gas turbine power augmentation by fogging of
inlet air,” in Proceedings of the 28th Turbomachinery Symposium, pp. 93-114.
1999. [Online]. Available:
http://turbolab.tamu.edu/proc/turboproc/T28/Vol28010.pdf. Accessed: 27 Oct.
2013.
[122] Giampaolo, T, The Gas Turbine Handbook: Principles and Practices, Lilburn, GA:
The Fairmont Press, Inc., ISBN 0-88173-243-5 FP, ISBN 013-776030-2 PH, 1997.
[123] Phillips, J. (n.d). Different Types of Gasifiers and their Integration with Gas
Turbines. [Online]. Available:
http://www.netl.doe.gov/technologies/coalpower/turbines/refshelf/handbook/1.2.1.p
df. Accessed: 1 Nov. 2013.

The conceptual design of an integrated energy efficient ore reduction plant 122
[124] IEA Clean Coal Centre. (Nov. 2002). Profiles: Matching Gasifiers to Coal. [Online].
Available: www.iea-coal.org/documents/81045/5377/Matching-gasifiers-to-coals.
Accessed: 2 Oct. 2013.
[125] Adsorptech. (n.d). ModCgenTM Oxygen VPSA Onsite Generator. [Online].
Available: http://www.adsorbtech.in/images/catalouge.pdf. Accessed: 6 Nov. 2013.
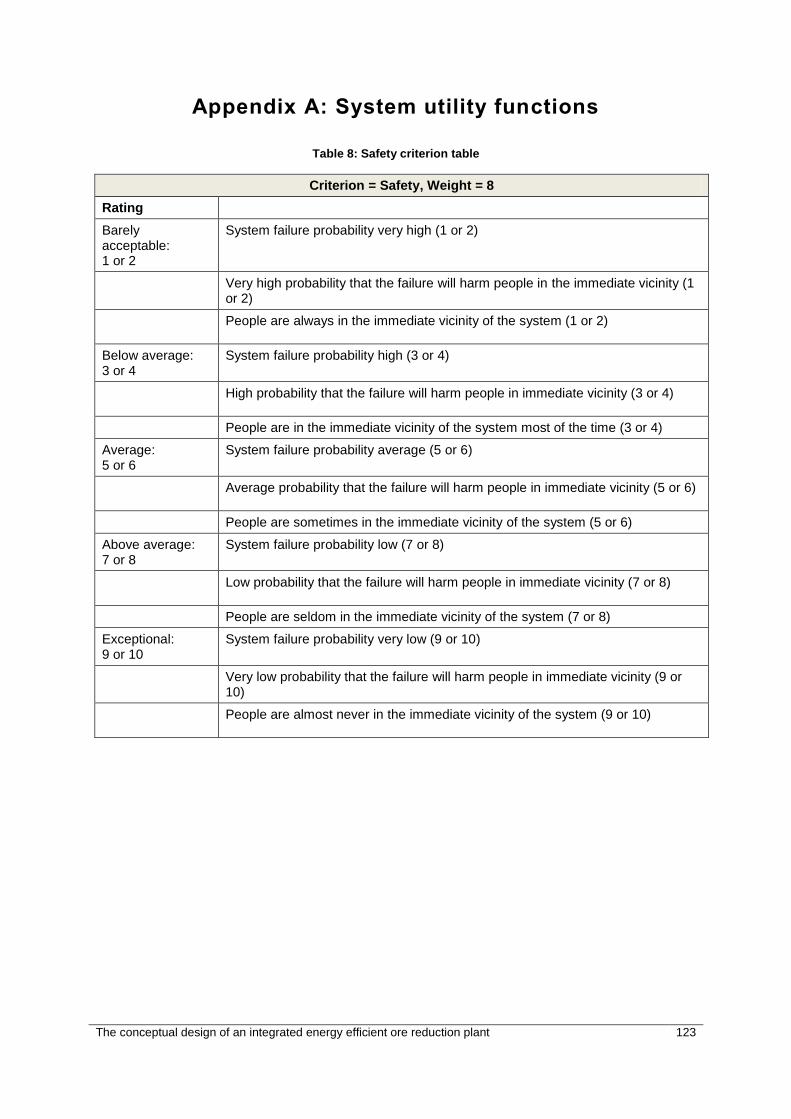
The conceptual design of an integrated energy efficient ore reduction plant 123
Appendix A: System utility functions
Table 8: Safety criterion table
Criterion = Safety, Weight = 8
Rating
Barely acceptable: 1 or 2
System failure probability very high (1 or 2)
Very high probability that the failure will harm people in the immediate vicinity (1 or 2)
People are always in the immediate vicinity of the system (1 or 2)
Below average: 3 or 4
System failure probability high (3 or 4)
High probability that the failure will harm people in immediate vicinity (3 or 4)
People are in the immediate vicinity of the system most of the time (3 or 4)
Average: 5 or 6
System failure probability average (5 or 6)
Average probability that the failure will harm people in immediate vicinity (5 or 6)
People are sometimes in the immediate vicinity of the system (5 or 6)
Above average: 7 or 8
System failure probability low (7 or 8)
Low probability that the failure will harm people in immediate vicinity (7 or 8)
People are seldom in the immediate vicinity of the system (7 or 8)
Exceptional: 9 or 10
System failure probability very low (9 or 10)
Very low probability that the failure will harm people in immediate vicinity (9 or 10)
People are almost never in the immediate vicinity of the system (9 or 10)
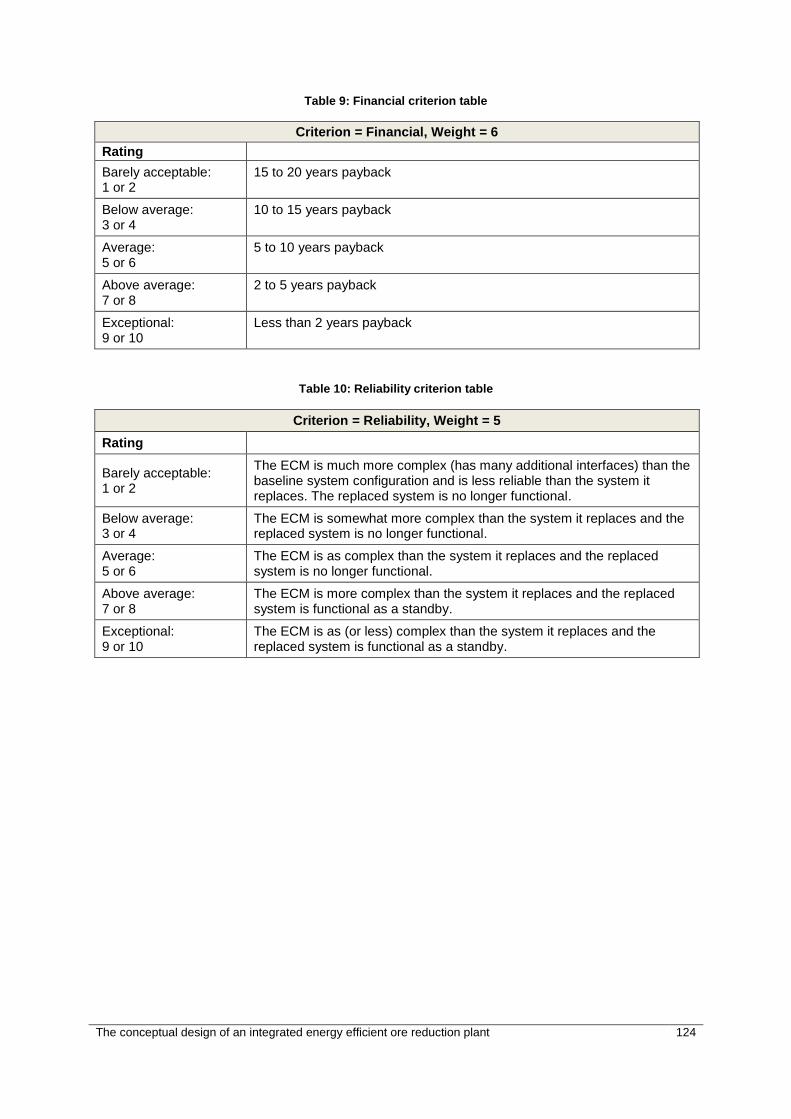
The conceptual design of an integrated energy efficient ore reduction plant 124
Table 9: Financial criterion table
Criterion = Financial, Weight = 6
Rating
Barely acceptable: 1 or 2
15 to 20 years payback
Below average: 3 or 4
10 to 15 years payback
Average: 5 or 6
5 to 10 years payback
Above average: 7 or 8
2 to 5 years payback
Exceptional: 9 or 10
Less than 2 years payback
Table 10: Reliability criterion table
Criterion = Reliability, Weight = 5
Rating
Barely acceptable: 1 or 2
The ECM is much more complex (has many additional interfaces) than the baseline system configuration and is less reliable than the system it replaces. The replaced system is no longer functional.
Below average: 3 or 4
The ECM is somewhat more complex than the system it replaces and the replaced system is no longer functional.
Average: 5 or 6
The ECM is as complex than the system it replaces and the replaced system is no longer functional.
Above average: 7 or 8
The ECM is more complex than the system it replaces and the replaced system is functional as a standby.
Exceptional: 9 or 10
The ECM is as (or less) complex than the system it replaces and the replaced system is functional as a standby.

The conceptual design of an integrated energy efficient ore reduction plant 125
Table 11: Social criterion table
Criterion = Social, Weight = 1
Rating
Barely acceptable: 1 or 2
No local job creation, no environmentally responsible marketing value (except for a small reduction in externally supplied energy) and high likelihood of significant pollution, no reduction in consumption of water.
Below average: 3 or 4
No local job creation, no environmentally responsible marketing value (except for a small reduction in externally supplied energy), insignificant reduction in consumption of water, medium likelihood of significant pollution.
Average: 5 or 6
Minor local job creation, no environmentally responsible marketing value, small reduction in the consumption of water, medium likelihood of significant pollution.
Above average: 7 or 8
Significant local job creation, significant environmentally responsible marketing value, significant decrease in consumption of water, low likelihood of significant pollution.
Exceptional: 9 or 10
Substantial local job creation, high environmentally responsible marketing value, substantial decrease in consumption of water, no likelihood of significant pollution.
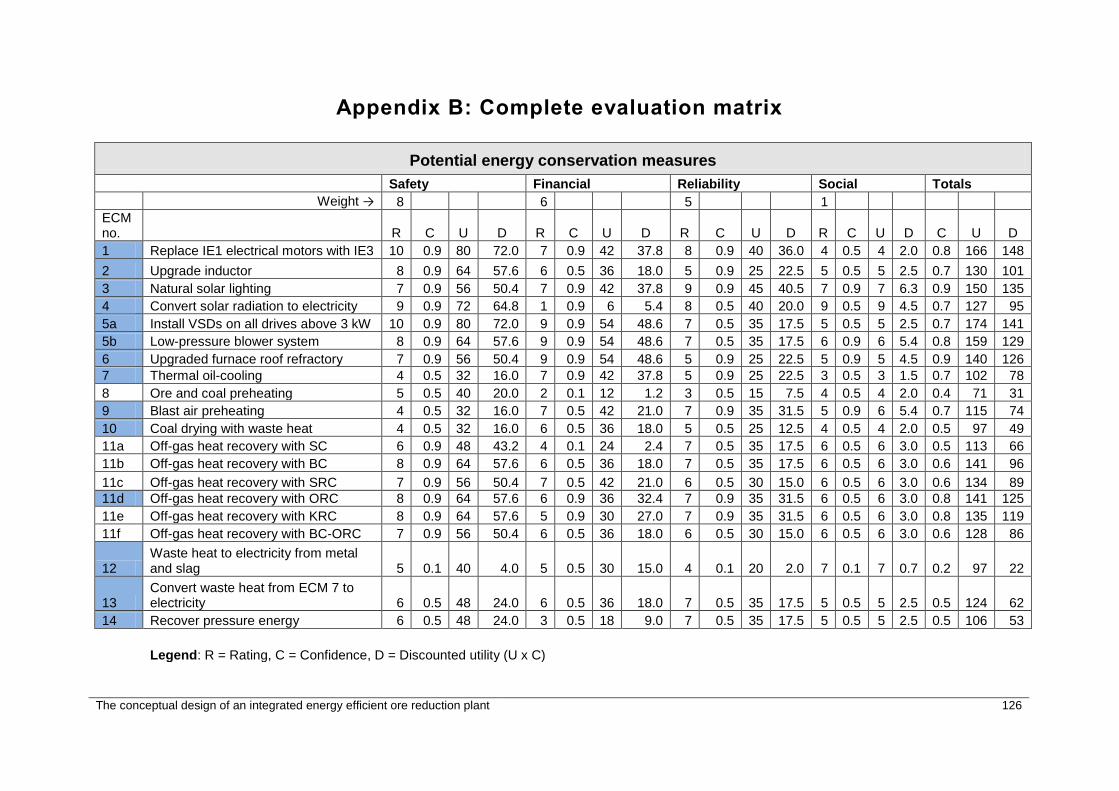
The conceptual design of an integrated energy efficient ore reduction plant 126
Appendix B: Complete evaluation matrix
Potential energy conservation measures
Safety Financial Reliability Social Totals
Weight → 8 6 5 1
ECM no. R C U D R C U D R C U D R C U D C U D
1 Replace IE1 electrical motors with IE3 10 0.9 80 72.0 7 0.9 42 37.8 8 0.9 40 36.0 4 0.5 4 2.0 0.8 166 148
2 Upgrade inductor 8 0.9 64 57.6 6 0.5 36 18.0 5 0.9 25 22.5 5 0.5 5 2.5 0.7 130 101
3 Natural solar lighting 7 0.9 56 50.4 7 0.9 42 37.8 9 0.9 45 40.5 7 0.9 7 6.3 0.9 150 135
4 Convert solar radiation to electricity 9 0.9 72 64.8 1 0.9 6 5.4 8 0.5 40 20.0 9 0.5 9 4.5 0.7 127 95
5a Install VSDs on all drives above 3 kW 10 0.9 80 72.0 9 0.9 54 48.6 7 0.5 35 17.5 5 0.5 5 2.5 0.7 174 141
5b Low-pressure blower system 8 0.9 64 57.6 9 0.9 54 48.6 7 0.5 35 17.5 6 0.9 6 5.4 0.8 159 129
6 Upgraded furnace roof refractory 7 0.9 56 50.4 9 0.9 54 48.6 5 0.9 25 22.5 5 0.9 5 4.5 0.9 140 126
7 Thermal oil-cooling 4 0.5 32 16.0 7 0.9 42 37.8 5 0.9 25 22.5 3 0.5 3 1.5 0.7 102 78
8 Ore and coal preheating 5 0.5 40 20.0 2 0.1 12 1.2 3 0.5 15 7.5 4 0.5 4 2.0 0.4 71 31
9 Blast air preheating 4 0.5 32 16.0 7 0.5 42 21.0 7 0.9 35 31.5 5 0.9 6 5.4 0.7 115 74
10 Coal drying with waste heat 4 0.5 32 16.0 6 0.5 36 18.0 5 0.5 25 12.5 4 0.5 4 2.0 0.5 97 49
11a Off-gas heat recovery with SC 6 0.9 48 43.2 4 0.1 24 2.4 7 0.5 35 17.5 6 0.5 6 3.0 0.5 113 66
11b Off-gas heat recovery with BC 8 0.9 64 57.6 6 0.5 36 18.0 7 0.5 35 17.5 6 0.5 6 3.0 0.6 141 96
11c Off-gas heat recovery with SRC 7 0.9 56 50.4 7 0.5 42 21.0 6 0.5 30 15.0 6 0.5 6 3.0 0.6 134 89
11d Off-gas heat recovery with ORC 8 0.9 64 57.6 6 0.9 36 32.4 7 0.9 35 31.5 6 0.5 6 3.0 0.8 141 125
11e Off-gas heat recovery with KRC 8 0.9 64 57.6 5 0.9 30 27.0 7 0.9 35 31.5 6 0.5 6 3.0 0.8 135 119
11f Off-gas heat recovery with BC-ORC 7 0.9 56 50.4 6 0.5 36 18.0 6 0.5 30 15.0 6 0.5 6 3.0 0.6 128 86
12 Waste heat to electricity from metal and slag 5 0.1 40 4.0 5 0.5 30 15.0 4 0.1 20 2.0 7 0.1 7 0.7 0.2 97 22
13 Convert waste heat from ECM 7 to electricity 6 0.5 48 24.0 6 0.5 36 18.0 7 0.5 35 17.5 5 0.5 5 2.5 0.5 124 62
14 Recover pressure energy 6 0.5 48 24.0 3 0.5 18 9.0 7 0.5 35 17.5 5 0.5 5 2.5 0.5 106 53
Legend: R = Rating, C = Confidence, D = Discounted utility (U x C)

The conceptual design of an integrated energy efficient ore reduction plant 127
Appendix D: Furnace blast gas flows (Campaign 1)
Figure 22: Furnace blast gas flows
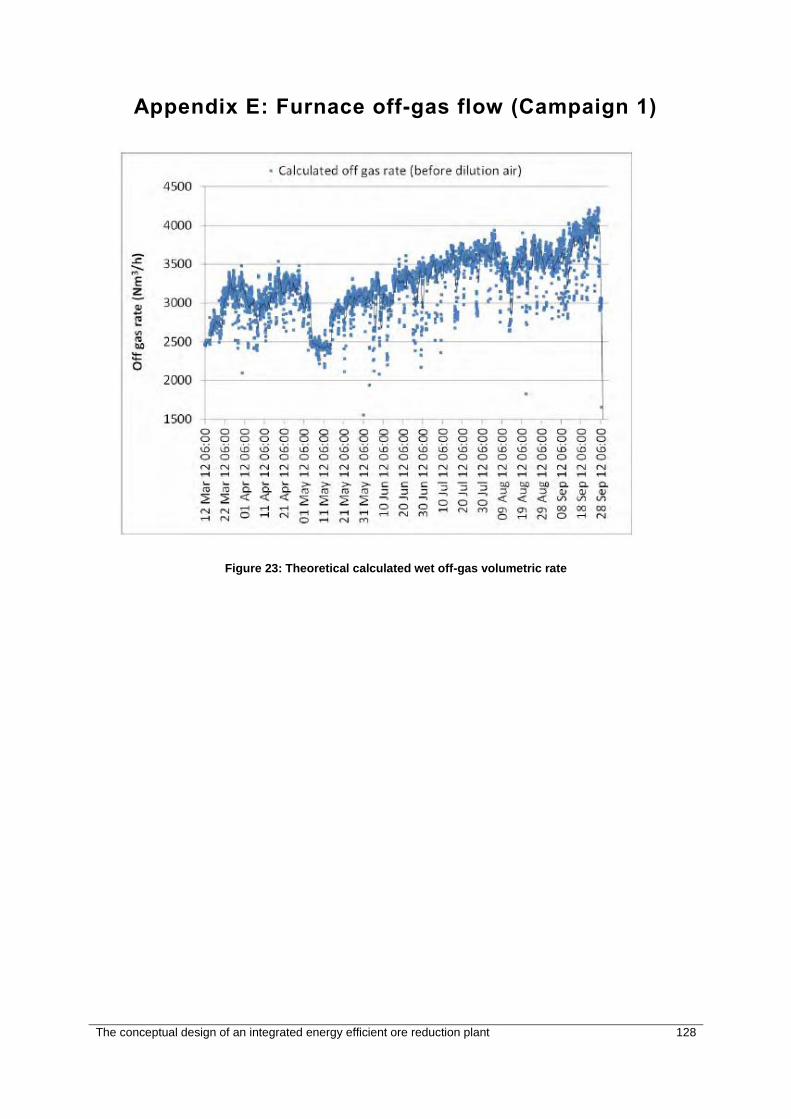
The conceptual design of an integrated energy efficient ore reduction plant 128
Appendix E: Furnace off-gas flow (Campaign 1)
Figure 23: Theoretical calculated wet off-gas volumetric rate

The conceptual design of an integrated energy efficient ore reduction plant 129
Appendix F: Furnace heat losses (Campaign 1)
Figure 24: Furnace heat losses
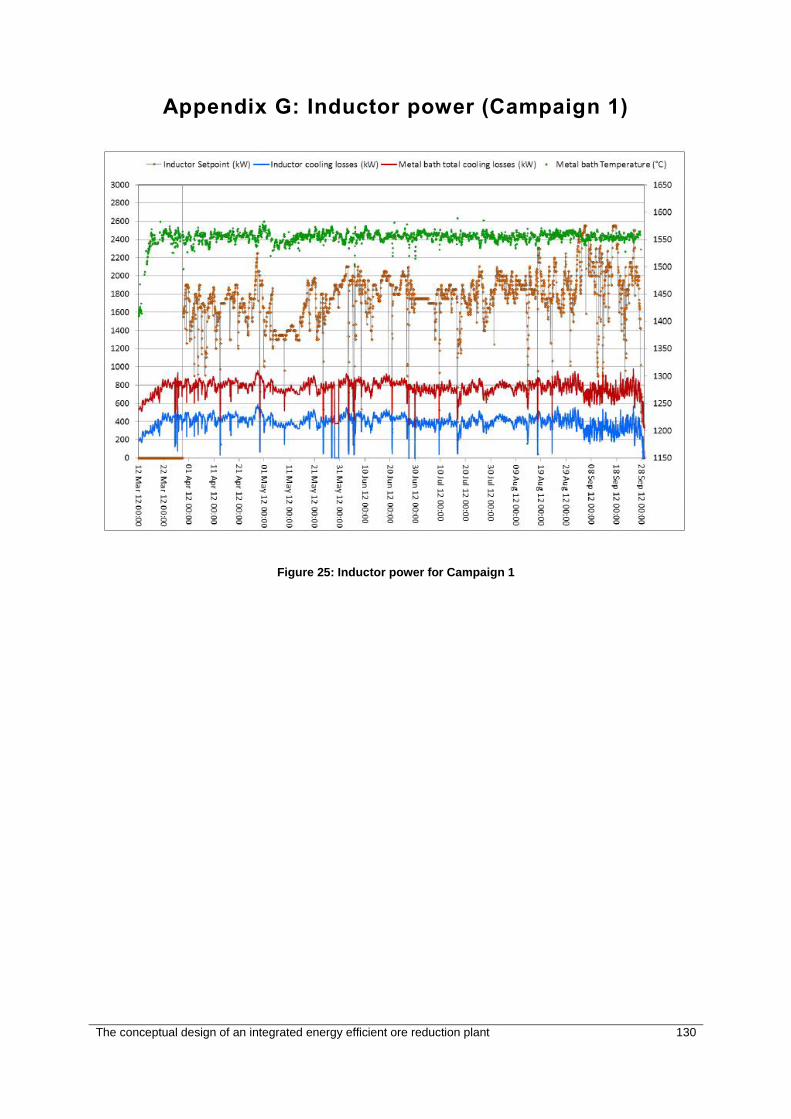
The conceptual design of an integrated energy efficient ore reduction plant 130
Appendix G: Inductor power (Campaign 1)
Figure 25: Inductor power for Campaign 1
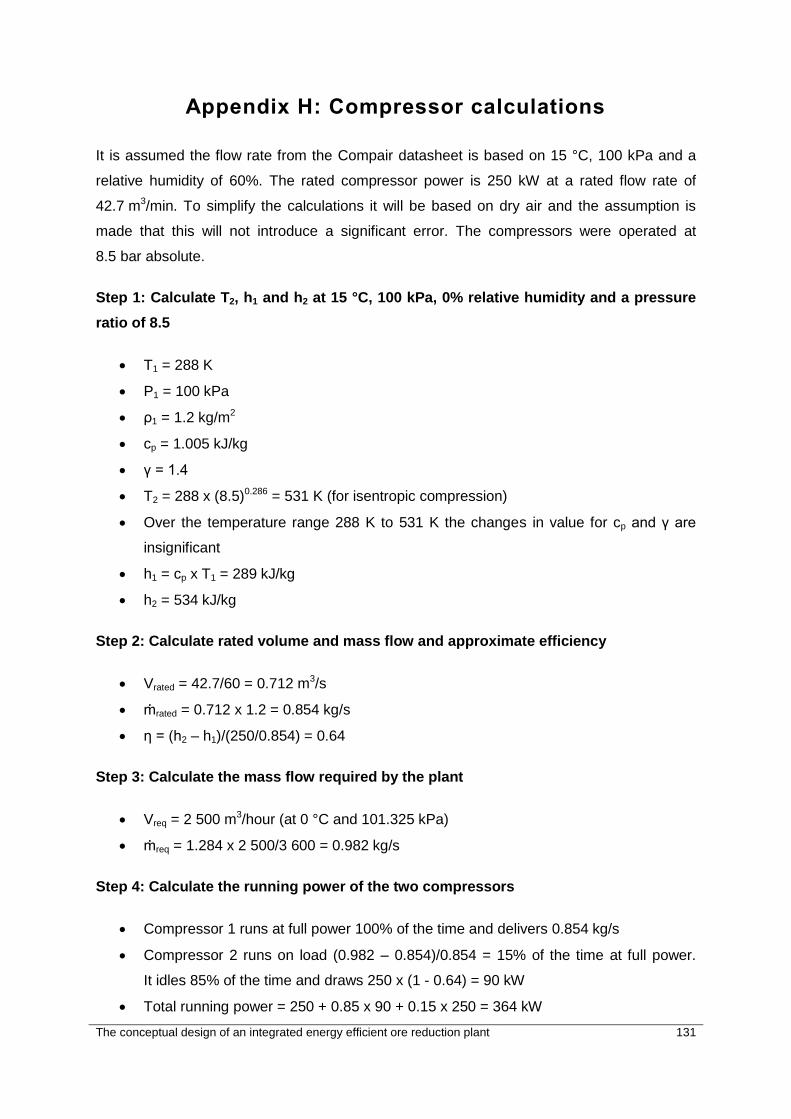
The conceptual design of an integrated energy efficient ore reduction plant 131
Appendix H: Compressor calculations
It is assumed the flow rate from the Compair datasheet is based on 15 °C, 100 kPa and a
relative humidity of 60%. The rated compressor power is 250 kW at a rated flow rate of
42.7 m3/min. To simplify the calculations it will be based on dry air and the assumption is
made that this will not introduce a significant error. The compressors were operated at
8.5 bar absolute.
Step 1: Calculate T2, h1 and h2 at 15 °C, 100 kPa, 0% relative humidity and a pressure
ratio of 8.5
T1 = 288 K
P1 = 100 kPa
ρ1 = 1.2 kg/m2
cp = 1.005 kJ/kg
γ = 1.4
T2 = 288 x (8.5)0.286 = 531 K (for isentropic compression)
Over the temperature range 288 K to 531 K the changes in value for cp and γ are
insignificant
h1 = cp x T1 = 289 kJ/kg
h2 = 534 kJ/kg
Step 2: Calculate rated volume and mass flow and approximate efficiency
Vrated = 42.7/60 = 0.712 m3/s
ṁrated = 0.712 x 1.2 = 0.854 kg/s
η = (h2 – h1)/(250/0.854) = 0.64
Step 3: Calculate the mass flow required by the plant
Vreq = 2 500 m3/hour (at 0 °C and 101.325 kPa)
ṁreq = 1.284 x 2 500/3 600 = 0.982 kg/s
Step 4: Calculate the running power of the two compressors
Compressor 1 runs at full power 100% of the time and delivers 0.854 kg/s
Compressor 2 runs on load (0.982 – 0.854)/0.854 = 15% of the time at full power.
It idles 85% of the time and draws 250 x (1 - 0.64) = 90 kW
Total running power = 250 + 0.85 x 90 + 0.15 x 250 = 364 kW
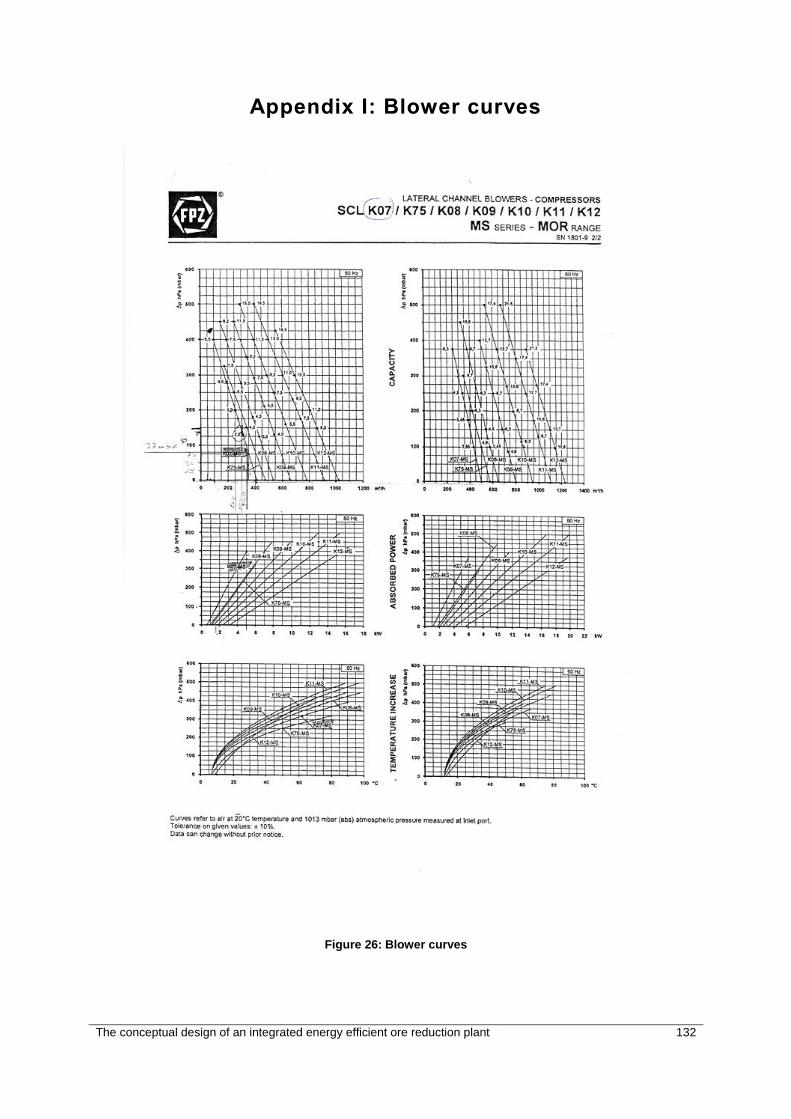
The conceptual design of an integrated energy efficient ore reduction plant 132
Appendix I: Blower curves
Figure 26: Blower curves
The conceptual design of an integrated energy efficient ore reduction plant 133
Appendix J: Verification of Spreadsheet Calculations
The verification is based on a top down check. The most significant factors are inspected
and logic applied to verify the claimed results.
LP1 is taken as the baseline since the values used were obtained from the AlloyStream
forward calculator results. The accuracy of the calculations has been confirmed not only
through repeated internal checks but also through campaigns 1 and 2.
The key values on which figures 20 and 21 are based are:
Source to gate energy efficiency and the energy, water and transport cost. These will now be
examined one by one, starting with the S2GEE.
S2GEE is calculated by dividing the reduction energy rate output from the plant with the total
energy rate input to the plant. The reduction energy rate for LP1 and LP2 is identical, as is
the reduction energy rate for FCP1 to FCP5 which is 10x the rate for LP1 and LP2.
For LP1 and LP2 the reduction energy is 2 303 kJ/s, calculated by multiplying the reduction
energy per ton with the ton per hour, i.e. 2 174 kWh/ton x 1.06 ton/hour = 2 303 kJ/s. For
FCP1 to FCP5 this is 23 030 kJ/s.
The total energy rate into the system is dominated by the coal energy rate. For LP1, LP2 and
FCP1 no coal is combusted in the plant to generate electricity.
Total energy rate into the system for LP1 is 22 678 kJ/s, for LP2 it is 16 808 kJ/s. The coal
mass flow to the plants are identical at 0.31 kg/s. However, since LP2 requires less
electricity due to the implementation of the ECMs the coal used by the CFPP for LP1 is 0.36
kg/s compared to 0.20 kg/s for LP2. This represents a difference of about 4 300 kJ/s. Fuel
gas use is also significant, for LP1 0.06 kg/s is used, LP2 uses 0.02 kg/s, a difference of
1 483 kJ/s. The remaining difference (406 kJ/s) is from PV solar, turbo-generator and
introduction of blowers in place of compressors for blast air.
It seems therefore that the S2GEE for LP1 of 2 303/22 678 = 10.15% and for LP2 2 303/16
808 = 13.7% is reasonable.
LP2 and FCP1 have a similar configuration. FCP1 however requires less system energy per
metal ton for the following reasons:

The conceptual design of an integrated energy efficient ore reduction plant 134
The coal dryer, raw material handling, inductor power, water cooling plant, forced air
cooling and other electrical loads did not increase by the factor 10 that metal output
increased with. This contributed to a reduction in coal to the CFPP. The electrical
load reduced by 9 616 kW compared to what it would have been if the load of LP2
was increased by a factor of 10 (from 2 768 kW x10 = 27 680 kW for LP2
extrapolated) to 18 064 kW for FCP1). Loads that were not increased by a factor of
10 are shown below.
Load LP2 FCP1 Comment
Coal dryer 12 kW 48 kW Scale up efficiency increase load by 400%
Raw material handling and furnace feed
41 kW 166 kW Scale up efficiency increase load by 400%
Inductor system feed
2 028 kW 13 289 kW Coil loss increases linearly with diameter, as does side-wall bath losses.
Water cooling plant 183 kW 1225 kW 20% reduction in energy use due to size increase – heat rejected/ton in FCP1 also less than LP1 and LP2 (4 688 kJ/ton vs 3 873 kJ/ton).
Other electrical loads
240 kw 960 kW Scale up efficiency increase load by 400%.
Oil pump power 62 kW 468 kW Scale up from LP2 to FCP1 by less than the ratio of thermal energy transported.
The increase in solar energy due to a plant area increase by a factor of 2 with the
added effect of the better conversion efficiency of the ORC further reducing the
electricity required from the CFPP by 525 kW.
The combined effect of the above reduces the energy input into the system by 34 734 kJ/s, a
reduction in coal use of approximately 1.5 kg/s. This explains the difference between 4.9
kg/s from the coal mine (extrapolated from LP2) and 3.9 kg/s predicted for FCP1.
Having reviewed the difference between LP2 and FCP1, the next step is to review the
differences between FCP1 and FCP2, FCP3, FCP4 and FCP5. The metal output of the
plants are identical, therefore only the differences in energy input rates will be examined.
Total energy input rate into the system: FCP1 = 114 888 kJ/s; FCP2 = 157 313 kJ/s; FCP3 =
129 029 kJ/s; FCP4 = 131 335 kJ/s; FCP5 = 123 422 kJ/s.
The main reason for the difference in energy rate can be found in the efficiency with which
the systems convert the chemical energy from coal to electricity. For FCP1 this conversion is
The conceptual design of an integrated energy efficient ore reduction plant 135
performed by the CFPP at an efficiency of 37.5% minus a 4.61% loss in the grid, or 32.9% of
the coal energy entering the CFPP is delivered to the plant as electrical power.
In FCP1 51 279 kJ/s thermal energy enters the ORC and is converted to electrical power at
a conversion efficiency of 20%. The ORC thus supplies 10 256 kW gross, or 56% of the
plant electrical power. The balance of 7 809 kW is supplied from the CFPP via the grid. The
power required internally to pump thermal oil is estimated as 468 kW.
In FCP2 the same amount of thermal (waste) energy enters the ORC from sources other
than coal burn, yielding the same result as with FCP1. The shortfall in electricity is 11 346
kW, slightly more than for FCP1 due to the higher water plant heat load requiring an
increase in pump power and the power required by the oxygen plant since oxygen
generation is internal in FCP2 to FCP5. Based on a combustion efficiency of 90% the overall
conversion efficiency (coal to power) is 0.9 x 0.2 = 0.18. Assuming the coal combusted is the
same as used in the furnace the coal mass flow to the combustion process is 2.28 kg/s and
the heat rejected from the coal burn is 51 686 kJ/s.
For FCP3 the off-gas thermal energy enters the top cycle, not the bottom cycle as with FCP1
and FCP2. This reduces the electrical power from the furnace waste heat stream to 3 978
kW from 10 256 kW for FCP1 and FCP2. The thermal energy from the off-gas combined with
the thermal energy from the coal burn results in the combined cycle generating the shortfall
of 16 706 kW at an estimated efficiency of 25.1%. The combined cycle efficiency was
calculated thus: combustion efficiency (A)= 90%, top cycle efficiency (B)= 25%, heat transfer
efficiency from combustion to top cycle (C)=82%, heat transfer efficiency from top cycle to
bottom cycle (D)=49%, bottom cycle efficiency (E)=20%. The overall cycle efficiency is A x
(C x B + (1 – B) x D x E) = 25.1%. Total thermal energy required is 66 608 kJ/s of which
31 400 kJ/s is from off-gas. 35 208 kJ/s has to be supplied from burning coal giving a coal
mass flow of 1.27 kg/s.
For FCP4 it is assumed, as for FCP1 and FCP2 that the off-gas heat enters the bottom
cycle. The coal to syngas efficiency is assumed as 80%, the top cycle efficiency is 35%,
other efficiencies as for FCP3. The combined cycle efficiency is calculated as 28.1%.
The FCP5 efficiencies are identical to those of FCP3 except for C = 0.91, midway between
the value assumed for FCP3 and 1 since there should be no loss in the IFGT but a 0.82 loss
for the EFGT. The combined cycle efficiency is calculated as 27.1%.