Embed Size (px)
Citation preview
British Journal of Educational Psychology (2017)
© 2017 The British Psychological Society
www.wileyonlinelibrary.com
The complexity of school racial climate: Reliabilityand validity of a new measure for secondarystudents
Christy M. Byrd*Psychology Department, University of California, Santa Cruz, California, USA
Background. The conceptualization of the role of race and culture in students’
experience of school has been limited. This study presents a more comprehensive and
multidimensional framework than previously conceptualized and includes the two
domains of (1) intergroup interactions (frequency of interaction, quality of interaction,
equal status, and support for positive interaction) and (2) school racial socialization
(cultural socialization, mainstream socialization, promotion of cultural competence,
colourblind socialization, critical consciousness socialization, and stereotyping) (Byrd,
2015, Journal of Educational Research, 108, 10).
Aims. The scale presents a measure of school racial climate for middle and high school
students and tests for evidence of reliability and validity in two independent, nationwide
samples.
Sample and method. Participants were 819 children aged 12–18 (M = 15.27,
SD = 1.58) who completed the School Climate for Diversity – Secondary Scale and a
number of validating measures: general school climate, perceived discrimination,
culturally responsive teaching, grades, and academic motivation.
Results andconclusions. Confirmatory factor analyses and reliability analyses showed
support for the 10-factor structure of the scale, and the subscales were associated with
the validating measures in expected ways.
Although there has been an increasing focus on the role of race and culture in students’
school experiences, conceptualizations of how race and culture matter are generally
limited to a focus on overt racial discrimination (e.g., Alfaro, Uma~na-Taylor, Gonzales-Backen, B�amaca, & Zeiders, 2009) or culturally relevant teaching (e.g., Bennett, 2001).
The goal of the current study was to present a more comprehensive and nuanced
framework of US school racial climate, along with evidence for the reliability and validity
of an associated measure. School racial climate refers to perceptions of interracial
interactions and the socialization around race and culture in a school. There is a long
history of examining the role of interracial interactions for the psychological well-being
and academic outcomes of students (e.g., Aronson & Others, 1978; Green, Adams, &
Turner, 1988; Hurtado, Milem, Clayton-Pedersen, & Allen, 1998). Unfortunately,however, thisworkhas tended to conflate perceptions of discriminationwithperceptions
*Correspondence should be addressed to Christy M. Byrd, Psychology Faculty Services, University of California, Santa Cruz, SantaCruz, 1156 High Street, Santa Cruz, CA 95064, USA (email: [email protected]).
DOI:10.1111/bjep.12179
1
of school racial climate (Byrd, 2015), andmuchof thiswork iswith college students rather
than a wider range of school levels (Mattison & Aber, 2007). Additionally, by focusing on
the role of race in interactions, researchers have ignored the degree to which race and
culture are also infused into school curricula and socialization messages. In theeducational literature,work has addressed issues of the development and implementation
of multicultural education but generally disregards individual differences (e.g., Howard,
2001; Sleeter, 2012; Sleeter & Grant, 2011). Furthermore, there are few frameworks or
measures that consider school racial climate as multidimensional. The current study
draws on both psychological and educational literatures to develop a comprehensive,
multidimensional framework and an associated scale to measure school interracial
interactions and school racial socialization. This measure is explored in two studies with
identical aims: (1) to examine the factor structure of the scale, (2) to examine the internalconsistency of the subscales, (3) to explore the correlations between the subscales and
validating measures, and (4) to explore correlations between the subscales and academic
outcomes.
Need for a comprehensive framework and measure
The existing literature on school racial climate for secondary students is limited in several
ways. First, the research is primarily concerned with (un)fair treatment, and racialdiscrimination in particular. Discrimination refers to individual perceptions of being
treated unfairly due to one’s race (Kessler, Mickelson, & Williams, 1999). Perceptions of
discrimination are not necessarily synonymous with perceptions of unfair treatment in
the school context – that is, students may perceive themselves as being discriminated
against but may feel that the school is generally fair. Nevertheless, many researchers
report on individual experiences with discrimination as indicators of the school racial
climate (e.g., Dotterer, McHale, & Crouter, 2009; Kotori & Malaney, 2003; Mattison &
Aber, 2007). Therefore, there is a need to distinguish between the two constructs. Thecurrent framework conceptualizes perceptions of unfair treatment (equal status) as
perceptions of the context, not individual experiences.
A second limitation is that, although there is a great deal of literature on school racial
composition, students’ perceptions of the formal curriculum and informal socialization
have largely been ignored. Furthermore, although racial socialization researchers
acknowledge the presence of messages within schools (Hughes, McGill, Ford, & Tubbs,
2011;Walton et al., 2014), very few studies have examined students’ perceptions of these
messages. By examining students’ phenomenological experiences, the current frame-work can better account for how students in the same classroom understand the same
content differently based on their individual experiences and attitudes. Similarly, the
literature onmulticultural education and culturally relevant teaching has been concerned
with classrooms and activities that are already identified as culturally relevant rather than
examining variation in students’ perceptions in typical classrooms and schools (Howard,
2001).
A third limitation is that school racial climate has been treated as a unidimen-
sional construct (e.g., Brand, Felner, Shim, Seitsinger, & Dumas, 2003; Chang & Le,2010; Simmons, Wittig, & Grant, 2010). Yet different aspects of racial climate may
affect students in different ways. For example, a negative quality of interaction is
likely to have a stronger effect on feelings of belonging because youth will find it
difficult to make friends at school. However, cultural socialization might have a
stronger effect on student’s identification with their ethnic–racial group because
2 Christy M. Byrd

they have more opportunity to learn about their group’s culture and history. A
multidimensional approach also moves away from simply labelling climate as
‘positive’ or ‘negative’ and is more appropriate from a phenomenological perspec-
tive because different features of the environment may be more salient to individualsdepending on their characteristics. Further, the associated scale is also multidimen-
sional and includes separate factors with no overarching factor.
Finally, it is important to note that the primary goal of the current research programme
is to outline a comprehensive framework of school racial climate, with a secondary goal of
providing a valid and reliable scale. Measures exist of some of the constructs explained
below, including equal status and quality of interaction. However, some existing
measures conflate constructs that are distinguished in the current framework. Of greater
importance is that most of the constructs outlined below do not have validated measuresassociated with them.
A framework of students’ perceptions of school racial climate
The framework has ten dimensions grouped into two domains: intergroup
interactions and school racial socialization. As the framework is concerned with
perceptions of school racial climate, it does not include objective school features
such as racial composition. The first domain draws on the intergroup relationsliterature (Allport, 1954; Chavous, 2005; Pettigrew, 2008) and considers the nature
of interactions across racial and cultural groups within a school. Interactions can be
described in terms of how frequently they occur (frequency of interaction) and by
how meaningful or positive/negative those interactions are (quality of interaction).
An additional dimension is equal status, which refers to how fairly different groups
are treated and whether students from different groups have similar opportunities
for recognition and participation. Although individuals’ perceptions of fair treatment
at school can be informed by their own experiences of discrimination, it isimportant to distinguish between the two constructs. For example, a Black student
may recognize that other Black students at their school are punished more
frequently than White students, even though the student has never been a target of
such punishment. Thus, equal status is more general than perceived discrimination.
Next, support for positive interaction describes the norms that govern
intergroup interactions. Intergroup contact theory highlights the importance of
authority support for contact (Allport, 1954; Pettigrew, 2008), and other work in
psychology also highlights the nature of school norms that can promote segregation(Tyson, Darity, & Castellino, 2005). Schools can convey support for positive
interaction in formal and informal ways, from schoolwide Mix It Up days (Southern
Poverty Law Center, 2010), which have students sitting with new classmates at
lunch, to teachers who use active learning practices that group students in different
ways, such as the jigsaw classroom Aronson & Patnoe (2011).
The final dimension in this domain is stereotyping, or perceptions that one’s group is
thought of or represented in stereotypical ways. Stereotyping is distinct from quality of
interaction or equal status in that it assesses perceptions of prejudicial thoughts and notbehaviours. Additionally, stereotyping includes stereotypical representations in the
school curriculum andmaterials. Both positive and negative stereotypes can be harmful to
student success as they limit the degree towhich a student is seen as an individual and can
unconsciously impair performance (e.g., Steele, 1997).
Complexity of school racial climate 3
School racial socialization
School racial socialization is messages about race and culture communicated at school
(Aldana &Byrd, 2015; Byrd, 2015). This area draws on the parental racial socialization and
multicultural education literatures (e.g., Bennett, 2001; Hughes et al., 2006) to focus onwhat students learn about their own and other groups in the formal curriculum as well as
informal messages. Many of these dimensions have been found to be associated with the
outcomes of African American youth in particular (Aldana & Byrd, 2015) but have less
often been studied for youth of different racial backgrounds.
The first dimension is cultural socialization, that is, what youth learn about their own
racial and cultural background. Theories of culturally relevant teaching (Aronson &
Laughter, 2016; e.g., Ladson-Billings, 1995; Morrison, Robbins, & Rose, 2008) and home–school dissonance (Arunkumar, Midgley, & Urdan, 1999; Tyler et al., 2008; Warzon &Ginsburg-Block, 2008) emphasize the importance of students’ cultures being acknowl-
edged and used as resources in classrooms. Similarly, Afrocentric education and other
forms of ethnic studies intentionally provide youthwith opportunities to learn about their
groups’ traditions and histories (e.g., Asante, 1991; Godina, 2003).
The alternative to cultural socialization ismainstream socialization, which refers to
learning aboutmainstreamUS norms, values, and traditions. This dimension also draws on
home–school dissonance frameworks (Arunkumar et al., 1999; Tyler et al., 2008) that
highlight Western/US values of individualism and competition, which sometimes clashwith values of minority groups such as communalism and familism (Schwartz et al.,
2010). Mainstream norms are observable in schools (e.g., Perry, 2001); however, no
studies of school racial climate have measured the extent to which students perceive
mainstream values, as existing home–school dissonance research rarelymeasures the two
conflicting cultures directly.
The third is promotion of cultural competence: learning about the histories and
traditions of other groups. Cultural competence includes skills such as comfort with
outgroupmembers, knowledge about outgroups, and an ability to interact positivelywitha wide range of people (Chang, 2002; Ponterotto, 2010). Learning about different racial
and cultural groups can range from limited exposure during multicultural fairs and
holidays to in-depth study of particular groups.
Fourth, colourblind socialization refers to messages that encourage youth to ignore
the importance of race. Educational researchers have long recognized the dangers of
overlooking the real-life significance of racial group difference in favour of minimizing
race or pretending that group-based inequalities do not exist (Apfelbaum, Pauker,
Sommers, & Ambady, 2010; Pollock, 2005). Colourblindness is associated with alienationand lower engagement for people of colour whose colour is ‘not seen’ (Plaut, Thomas, &
Goren, 2009) and can be counterproductive in school settings, for instance, by increasing
White students’ bias and limiting their ability to understand racial inequality (Apfelbaum
et al., 2010; Hughes, Bigler, & Levy, 2007; Richeson&Nussbaum, 2004; Schofield, 2006).
Nevertheless, few studies have measured students’ perceptions of the degree to which
those around them and the curriculum have colourblind views.
Finally, as opposed to colourblind socialization, critical consciousness socialization
teaches youth to recognize and address differences between racial groups in power andprivilege. Such teaching is less common in mainstream schools but is a foundation for
social justice pedagogy and prejudice reduction work (Aldana & Byrd, 2015; Aldana,
Rowley, Checkoway, & Richards-Schuster, 2012). This dimension is referred to as
‘preparation for bias’ in the parental racial socialization literature (Hughes et al., 2006).
4 Christy M. Byrd
Research questions and hypothesis justification
This study uses two independent, nationwide samples to test a scale, the School Climate
for Diversity – Secondary (SCD-S) Scale, that measures the dimensions described above.
The research questions for this study were: (1) Does the factor structure of the scalecorrespond to the theoretical framework? (2) Do the factors of the scale show good
reliability? (3) Are the factors of school racial climate associated with general school
climate, perceived discrimination, and culturally relevant teaching in expectedways? and
(4) Are the factors associated with academic outcomes in expected ways?
The first research questionwill determinewhether the surveymeasure corresponds to
the dimensions outlined above. A confirmatory factor analysis is expected to result in ten
factors with excellent fit, as measured by a CFI > .90 and a RMSEA < .05 (Browne &
Cudeck, 1993; Hu & Bentler, 1995). Second, I expected each subscale to have aCronbach’s a equal to or above .70.
The third question concerns relations between the factors and three validating
measures. School racial climate should have close associations with other aspects of the
school environment, such as general school climate, perceived discrimination, and
culturally relevant teaching:
General school climate
Existing frameworks of general school climate address racial climate in varying ways.
Some consider racial climate an aspect of general relationships and engagement (e.g.,
Thapa, Cohen,Guffey,&Higgins-D’Alessandro, 2013;USDepartment of Education,Office
of Safe andHealthy Students, 2016). Others do not consider aspects of diversity, including
race and culture, at all (e.g., Zullig, Koopman, Patton, & Ubbes, 2010). The current
framework conceptualizes school racial climate more broadly in that it both mirrors
aspects of general school climate with a racial dimension and introduces new ones. For
example, the quality of intergroup interaction can be considered a more specific versionof the more general quality of interpersonal interactions at a school. That is, interactions
across racial groupswould be heavily influenced by the overall tone of respectfulness and
caring. However, racial socialization dimensions such as critical consciousness socializa-
tion and colourblind socialization have no direct correspondence to other school climate
domains. For example, teaching and learning practices is a dimension of several major
models (e.g., Thapa et al., 2013), and it is possible but not necessarily the case that race-
aware racial socialization is more frequent in schools where teachers usemore innovative
practices. Nevertheless, they are not synonymous. Racial socialization is also likely morefrequent in schools that are more comfortable addressing other areas of diversity, such as
disability and sexual orientation; however, these areas are usually not included in models
of general school climate. Therefore, there is no reason to expect significant correlations
between general school climate and the dimensions of school racial socialization.
Expectations about correlations between the dimensions of school racial climate and
the dimensions of general school climate are as follows: Moderate correlations are
expected between the intergroup interactions dimensions and general school climate
dimensions relating to interactions and relationships, but low or non-significantcorrelations are expected between dimensions of school racial socialization and general
school climate. The general school climatemeasure in this study is the Inventory of School
Climate – Student (ISC-S) (Brand et al., 2003); thus, specifically, negativepeer interactionsand positive peer interactions will be strongly associated with quality of interaction
(inversely and directly, respectively). Furthermore, consistency and clarity of rules and
Complexity of school racial climate 5
disciplinary harshness will be moderately associated with equal status (directly and
inversely, respectively).
The ISC-S is onemeasure of general school climate that does include a subscale relating
to school racial climate. However, subscales such as these tend to combine multipleaspects of racial climate. For example, the support for cultural pluralism scale of the ISC-S
includes four items relating to positive interaction across race, fair treatment, and learning
about other cultures. Given that subscales such as these tap into a common feature of all of
the dimensions of school racial climate (i.e., race and culture), moderate-to-high
correlations between the factors of school racial climate and support for cultural
pluralism are expected.
Perceived discrimination
Asnoted, quality of intergroup interactions is oftenmeasured as perceived discrimination.
Therefore, the second validating measure is a discrimination measure. The next
hypothesis is the expectation ofmoderate negative correlationswith quality of interaction
and equal status, and a moderate positive correlation with stereotyping, which will
provide evidence that individuals’ experiences being treated unfairly themselves inform
their perceptions of the context. Nevertheless, those experiences are not the only
determining factor, so strong correlations are not expected. Additionally, discriminationwill have low correlations with the racial socialization dimensions, demonstrating
discriminant validity.
Culturally relevant teaching
Third, culturally relevant teaching (CRT) aims to bring students’ culture and background
into the classroom, promote critical consciousness, and set high expectations (Ladson-
Billings, 1995). The racial climate dimensions of cultural socialization and criticalconsciousness socialization are most similar to culturally relevant teaching. First, CRT is
similar to cultural socialization because CRT intentionally draws on students’ culture,
which may teach them about their culture and encourage them to learn more about it.
Second, the critical consciousness goals of CRT are directly alignedwith the racial climate
dimension of critical consciousness socialization. Therefore, I expectedmoderate-to-high
correlations between cultural socialization and critical consciousness socialization and a
measure of culturally relevant teaching.
The final research question will demonstrate predictive validity by showing that apositive school racial climate is associatedwith positive academic outcomes, as predicted
by existing research and theory (for reviews, see Aronson & Laughter, 2016; Bennett,
2001; Byrd, 2015; and Thapa et al., 2013). For example, lack of racial tension is associated
with greater feelings of belonging (Byrd & Chavous, 2011; Dotterer et al., 2009), and
equal status is associated with higher grades (Mattison & Aber, 2007). Additionally,
cultural socialization at school is associated with greater interest in school and higher
motivation (Aldana & Byrd, 2015). Finally, both quantitative research and qualitative
research suggest that stereotypes can negatively influence academic self-concepts(Dotterer et al., 2009; Rivas-Drake, 2011; Teranishi, 2002). The specific outcomes
evaluated in the current study are a range of achievement and motivational outcomes, in
particular grades, academic aspirations, interest in school, feelings of belonging, utility
value, importance of school, and academic self-concept. These outcomes were chosen
because they have validated scales associated with them and are easily measured.
6 Christy M. Byrd
STUDY 1
Method
Participants
Participantswere 315 6th- to 12th-grade students recruited through nationwide panels by
Qualtrics, an online survey company (Mage = 15.34, SD = 1.75). The sample was 62%
female, 25% White, 25% Latino, 25% African American, and 25% Asian. Chi-square tests
indicated that genderwas not balanced by race, as thereweremore Asian American (72%)and African American (68%) girls than expected, v2 (df = 3, N = 315) 10.76, p = .013.
Procedure
Procedures were approved by the Institutional Review Board at the principal investiga-
tor’s institution. The surveywas delivered to adolescents on select Qualtrics panels online
based on random assignment and the likelihood that they would meet the eligibility
criteria. The first page of the survey described the survey and asked participants to obtainparent consent before continuing. Participants then completed the demographic block of
questions. Thosewhowere between the ages of 12 and 18,whowere in 6th to 12th grade,
andwho identified asWhite, African American, Asian American, or Latinowere allowed to
continue; the restwere directed to the end of the survey. Participant datawere excluded if
they further completed the survey in < 5 min or failed two attention checks. Participants
were allowed to complete the survey until the quotas for their racial group were fulfilled.
Demographics were in the first survey section, followed by outcomes, racial climate,
general school climate and discrimination, and finally culturally relevant teaching. Itemswere randomized within section. Participants were compensated in credit worth
approximately $1.40 to $1.60.
Measures
The SCD-S was initially developed for dissertation research in 2012 based on existing
measures of school climate and related constructs. Themeasure was reviewed by experts
in the field and school officials for face validity. Some evidence of factor structure andreliability was shown in a small, homogenous sample of middle and high school students
(Byrd, 2015). Development continued with a college version that was validated in three
samples (see Byrd, under review). That scale was then modified to be appropriate for
secondary students, including the simplification of wording and removing an item about
institutional racism. The institutional racism item was removed due to concerns that
adolescents would be unfamiliar with the term.
Participants self-reported their age, gender, grade, and race. Academic aspirations was
measured with one item asking how often participants wanted to go in school, from 1(‘some high school’) to 6 (‘get a graduate degree (master’s, PhD)’). Participants also
indicated the grades they usually get in school with a single-item question ranging from 1
(‘all or mostly A’s’) to 6 (‘mostly F’s’).
Motivation was measured using three scales from Eccles and Wigfield (1995; Wigfield
et al., 1997), all on a response scale from 1 (not at all true) to 5 (completely true). First,
interest included three items about enjoying school (aStudy1 = .88, aStudy2 = .94). An
example was ‘I find school interesting’. Second, utility value consisted of three items
about how useful what was learned in school was for the future and daily life
Complexity of school racial climate 7
(aStudy1 = .86, aStudy2 = .88). An example itemwas ‘What I learn in school is useful for the
future’. Third, importance consisted of three items about how important being a good
student and getting good grades was to them (aStudy1 = .85, aStudy2 = .90). An example
item was ‘Being a good student is important to me’.School belonging (aStudy1 = .85, aStudy2 = .83) was measured with the relatedness
subscale of the Basic Needs Satisfaction Scale adapted for school (Deci & Ryan, 2000). The
scale includes eight items asking youth howmuch they like people at the school and how
much others at the school like them, and it was measured on a 1 (not at all true)-to-5
(completely true) scale. An example item was ‘I really like the people at my school’.
Adolescents’ perceptions of their academic competence were assessed with an
academic self-concept scale (aStudy1 = .87, aStudy2 = .90) based on a measure by Nicholls
(1978). The scale included eight items asking youth to rate themselves on a 1 (belowaverage)-to-5 (above average) scale in several academic subjects, grades, and overall
intelligence.
General school climate was measured using items from the Inventory of School
Climate – Student (ISC-S) (Brand et al., 2003). The scale has been validated in a large
sample and is commonly used in school climate research. All were on a scale of 1 (never)
to 5 (always). Support for cultural pluralism consisted of four items (aStudy1 = .74,
aStudy2 = .79). Teacher support (aStudy1 = .84, aStudy2 = .87) included six items about
how much teachers were willing to help students. Consistency and clarity of rules andexpectations (aStudy1 = .76, aStudy2 = .82) consisted of five items measuring the extent to
which students perceive that expectations are clear and enforced consistently. Student
commitment/achievement orientation (aStudy1 = .85, aStudy2 = .89) consisted of five
items measuring perceptions of how hard students worked to get good grades. Negative
peer interactions (aStudy1 = .87, aStudy2 = .88) consisted of five items asking how much
students in the school had trouble getting along. Positive peer interactions (aStudy1 = .84,
aStudy2 = .87) consisted of five itemsmeasuring howwell students got to knoweach other
and enjoyed participating in activities together. Disciplinary harshness (aStudy1 = .77,aStudy2 = .69) consisted of five items concerning perceptions that rules are too strict and
that it is easy to get in trouble. Student involvement in decision-making (aStudy1 = .86,
aStudy2 = .87) was measured with five items indicating how much students are able to
decide how thingswork in the classroom and school as awhole. Instructional innovation/
relevance (aStudy1 = .77, aStudy2 = .78) included four items asking about teachers trying
new and unusual ways of teaching. Finally, Safety Problems measured how often youth
were afraid of being a victim of violence or theft with six items (aStudy1 = .88,
aStudy2 = .89).Perceived discrimination was measured using the educational subscale of the
Adolescent Discrimination Distress Index (ADDI) (Fisher, Wallace, & Fenton, 2000). It
consists of four items (aStudy1 = .80, aStudy2 = .85), such as ‘Because of your race/
ethnicity, you were given a lower grade than you deserved’. The response scale was 1
(never) to 5 (always).
Finally, the Student Measure of Culturally Responsive Teaching (Dickson, Chun, &
Fernandez, 2015) contained two subscales: (1) diverse teaching practice: the degree to
which teachers use diverse methods and establish a respectful climate (11 items,aStudy1 = .92, aStudy2 = .92); and (2) cultural engagement: the degree to which teachers
bring students’ culture and home life into the classroom (seven items, aStudy1 = .91,
aStudy2 = .90). Items were on a scale of 1 (never) to 5 (always).
8 Christy M. Byrd
Results
Question 1First, I explored the factor structure of the SCD-S scale using confirmatory factor
analysis in MPlus 6.1. Each subscale was specified as a latent variable defined by its
component items. All of the latent variables were correlated, and individual items
were allowed to correlate if they were within the same subscale and the correlation
improved model fit. Two items were removed from the critical consciousness scale
for low loadings (<.3).The hypothesis of excellent fit was confirmed: v2 (df = 656, N = 309) = 941.961,
p < .001, CFI = .95, RMSEA = .038, SRMR = .050, TLI = .95. Table 1 shows thestandardized factor loadings, which ranged from .459 to .852. I conducted a post-hoc
power analysis for the CFA using a method based on RMSEA (MacCallum, Browne, &
Sugawara, 1996) and an online calculator (Preacher & Coffman, 2006) with a null
hypothesis of .05 and an alternative hypothesis of .038. The analysis indicated that the
observed power was .99.
Question 2To answer the second research question, I examined Cronbach’s alpha for each subscale,
with the expectation that they would be above .70. The alphas are given in Table 1. The
hypothesis was confirmed: All were equal to or above .70.
Question 3
Next, I examined bivariate correlations between the subscales and the validating
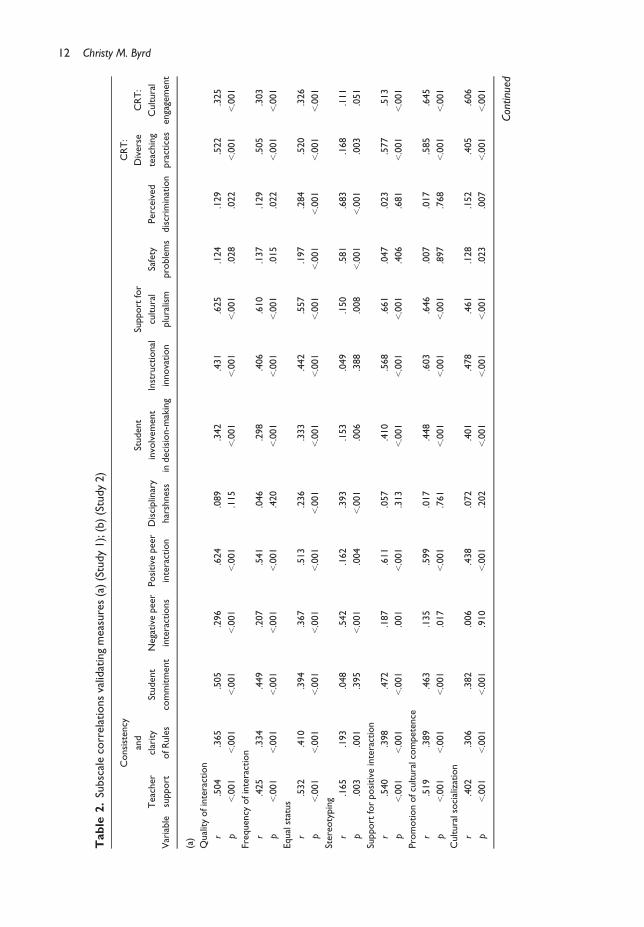
measures. Each subscale was computed as the average of the items from the factoranalysis. The correlations are shown in Table 2a. For the purpose of this study, low
correlations were defined as below .2, moderate were .2 to .5, and high were above .5.
Althoughmy hypotheses were primarily concerned with the strength of the correlations,
the significance level was set at .05.
General school climate
The first hypothesis was that negative peer interactions would be strongly negativelyassociated with quality of interaction and positive peer interactions would be
strongly positively associated with quality of interaction. This hypothesis was
partially confirmed: The correlation with negative peer interaction was moderate
(r = �.296, p < .001), but the correlation with positive peer interaction was strong
(r = .624, p < .001).
Second, I hypothesized that equal status would be moderately positively
associated with consistency and clarity of rules, and moderately negatively with
disciplinary harshness. The hypothesis was confirmed, as the correlation with rulesclarity and discipline was moderate (r = .410, p < .001; r = �.236, p < .001,
respectively).
Third, I proposed moderate-to-high correlations between each of the school racial
climate subscales and support for cultural pluralism. With the exception of stereotyping
(r = �.150, p = .008), all of the correlations were above .420.
Complexity of school racial climate 9
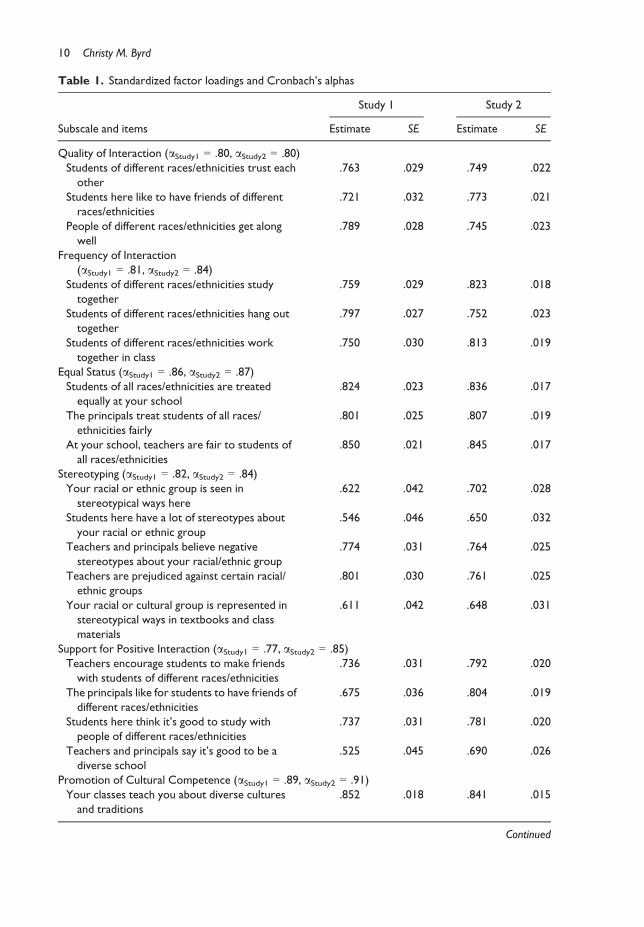
Table 1. Standardized factor loadings and Cronbach’s alphas
Subscale and items
Study 1 Study 2
Estimate SE Estimate SE
Quality of Interaction (aStudy1 = .80, aStudy2 = .80)
Students of different races/ethnicities trust each
other
.763 .029 .749 .022
Students here like to have friends of different
races/ethnicities
.721 .032 .773 .021
People of different races/ethnicities get along
well
.789 .028 .745 .023
Frequency of Interaction
(aStudy1 = .81, aStudy2 = .84)
Students of different races/ethnicities study
together
.759 .029 .823 .018
Students of different races/ethnicities hang out
together
.797 .027 .752 .023
Students of different races/ethnicities work
together in class
.750 .030 .813 .019
Equal Status (aStudy1 = .86, aStudy2 = .87)
Students of all races/ethnicities are treated
equally at your school
.824 .023 .836 .017
The principals treat students of all races/
ethnicities fairly
.801 .025 .807 .019
At your school, teachers are fair to students of
all races/ethnicities
.850 .021 .845 .017
Stereotyping (aStudy1 = .82, aStudy2 = .84)
Your racial or ethnic group is seen in
stereotypical ways here
.622 .042 .702 .028
Students here have a lot of stereotypes about
your racial or ethnic group
.546 .046 .650 .032
Teachers and principals believe negative
stereotypes about your racial/ethnic group
.774 .031 .764 .025
Teachers are prejudiced against certain racial/
ethnic groups
.801 .030 .761 .025
Your racial or cultural group is represented in
stereotypical ways in textbooks and class
materials
.611 .042 .648 .031
Support for Positive Interaction (aStudy1 = .77, aStudy2 = .85)
Teachers encourage students to make friends
with students of different races/ethnicities
.736 .031 .792 .020
The principals like for students to have friends of
different races/ethnicities
.675 .036 .804 .019
Students here think it’s good to study with
people of different races/ethnicities
.737 .031 .781 .020
Teachers and principals say it’s good to be a
diverse school
.525 .045 .690 .026
Promotion of Cultural Competence (aStudy1 = .89, aStudy2 = .91)
Your classes teach you about diverse cultures
and traditions
.852 .018 .841 .015
Continued
10 Christy M. Byrd
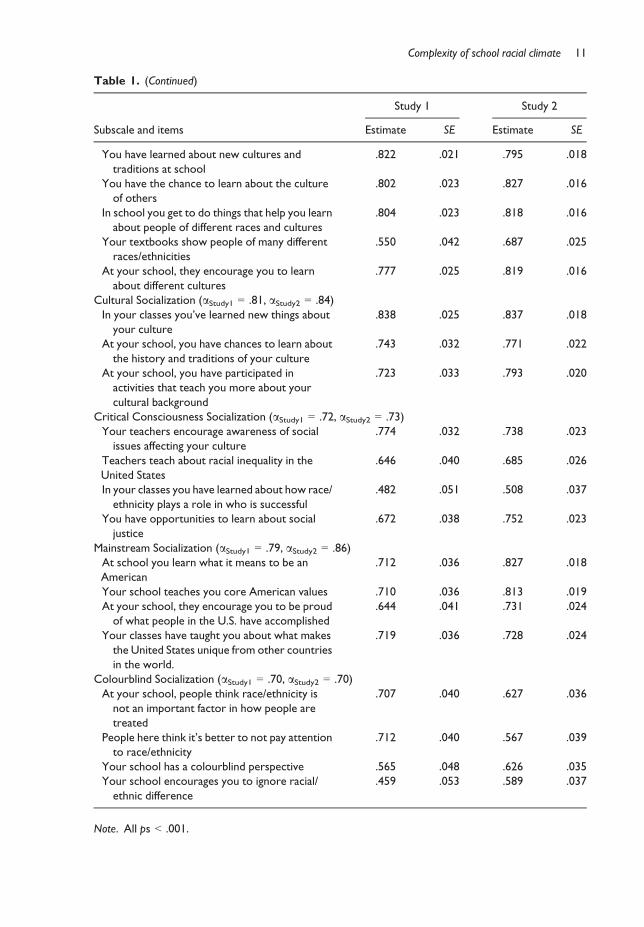
Table 1. (Continued)
Subscale and items
Study 1 Study 2
Estimate SE Estimate SE
You have learned about new cultures and
traditions at school
.822 .021 .795 .018
You have the chance to learn about the culture
of others
.802 .023 .827 .016
In school you get to do things that help you learn
about people of different races and cultures
.804 .023 .818 .016
Your textbooks show people of many different
races/ethnicities
.550 .042 .687 .025
At your school, they encourage you to learn
about different cultures
.777 .025 .819 .016
Cultural Socialization (aStudy1 = .81, aStudy2 = .84)
In your classes you’ve learned new things about
your culture
.838 .025 .837 .018
At your school, you have chances to learn about
the history and traditions of your culture
.743 .032 .771 .022
At your school, you have participated in
activities that teach you more about your
cultural background
.723 .033 .793 .020
Critical Consciousness Socialization (aStudy1 = .72, aStudy2 = .73)
Your teachers encourage awareness of social
issues affecting your culture
.774 .032 .738 .023
Teachers teach about racial inequality in the
United States
.646 .040 .685 .026
In your classes you have learned about how race/
ethnicity plays a role in who is successful
.482 .051 .508 .037
You have opportunities to learn about social
justice
.672 .038 .752 .023
Mainstream Socialization (aStudy1 = .79, aStudy2 = .86)
At school you learn what it means to be an
American
.712 .036 .827 .018
Your school teaches you core American values .710 .036 .813 .019
At your school, they encourage you to be proud
of what people in the U.S. have accomplished
.644 .041 .731 .024
Your classes have taught you about what makes
the United States unique from other countries
in the world.
.719 .036 .728 .024
Colourblind Socialization (aStudy1 = .70, aStudy2 = .70)
At your school, people think race/ethnicity is
not an important factor in how people are
treated
.707 .040 .627 .036
People here think it’s better to not pay attention
to race/ethnicity
.712 .040 .567 .039
Your school has a colourblind perspective .565 .048 .626 .035
Your school encourages you to ignore racial/
ethnic difference
.459 .053 .589 .037
Note. All ps < .001.
Complexity of school racial climate 11
Table
2.Subscalecorrelationsvalidatingmeasures(a)(Study1);(b)(Study2)
Variable
Teacher
support
Consistency
and
clarity
ofRules
Student
commitment
Negative
peer
interactions
Positive
peer
interaction
Disciplinary
harshness
Student
involvement
indecision-m
aking
Instructional
innovation
Supportfor
cultural
pluralism
Safety
problems
Perceived
discrimination
CRT:
Diverse
teaching
practices
CRT:
Cultural
engagement
(a)
Qualityofinteraction
r.504
.365
.505
�.296
.624
�.089
.342
.431
.625
�.124
�.129
.522
.325
p<.001
<.001
<.001
<.001
<.001
.115
<.001
<.001
<.001
.028
.022
<.001
<.001
Frequency
ofinteraction
r.425
.334
.449
�.207
.541
�.046
.298
.406
.610
�.137
�.129
.505
.303
p<.001
<.001
<.001
<.001
<.001
.420
<.001
<.001
<.001
.015
.022
<.001
<.001
Equalstatus
r.532
.410
.394
�.367
.513
�.236
.333
.442
.557
�.197
�.284
.520
.326
p<.001
<.001
<.001
<.001
<.001
<.001
<.001
<.001
<.001
<.001
<.001
<.001
<.001
Stereotyping
r�.165
�.193
�.048
.542
�.162
.393
.153
.049
�.150
.581
.683
�.168
.111
p.003
.001
.395
<.001
.004
<.001
.006
.388
.008
<.001
<.001
.003
.051
Supportforpositive
interaction
r.540
.398
.472
�.187
.611
�.057
.410
.568
.661
�.047
.023
.577
.513
p<.001
<.001
<.001
.001
<.001
.313
<.001
<.001
<.001
.406
.681
<.001
<.001
Promotionofculturalcompetence
r.519
.389
.463
�.135
.599
�.017
.448
.603
.646
.007
.017
.585
.645
p<.001
<.001
<.001
.017
<.001
.761
<.001
<.001
<.001
.897
.768
<.001
<.001
Culturalsocialization
r.402
.306
.382
�.006
.438
.072
.401
.478
.461
.128
.152
.405
.606
p<.001
<.001
<.001
.910
<.001
.202
<.001
<.001
<.001
.023
.007
<.001
<.001
Continued
12 Christy M. Byrd

Table
2.(Continued)
Variable
Teacher
support
Consistency
and
clarity
ofRules
Student
commitment
Negative
peer
interactions
Positive
peer
interaction
Disciplinary
harshness
Student
involvement
indecision-m
aking
Instructional
innovation
Supportfor
cultural
pluralism
Safety
problems
Perceived
discrimination
CRT:
Diverse
teaching
practices
CRT:
Cultural
engagement
Criticalconsciousness
r.355
.213
.295
.084
.371
.088
.415
.536
.420
.196
.264
.425
.583
p<.001
<.001
<.001
.138
<.001
.121
<.001
<.001
<.001
<.001
<.001
<.001
<.001
Mainstream
socialization
r.469
.361
.393
�.062
.473
.032
.397
.503
.465
.048
.053
.475
.512
p<.001
<.001
<.001
.276
<.001
.566
<.001
<.001
<.001
.393
.346
<.001
<.001
Colourblindsocialization
r.393
.264
.276
�.145
.416
.024
.356
.367
.416
.028
.051
.353
.303
p<.001
<.001
<.001
.010
<.001
.677
<.001
<.001
<.001
.627
.369
<.001
<.001
(b)
Qualityofinteraction
r.563
.446
.536
�.169
.656
.024
.371
.565
.638
�.012
�.040
.514
.410
p<.001
<.001
<.001
<.001
<.001
.596
<.001
<.001
<.001
.782
.373
<.001
<.001
Frequency
ofinteraction
r.494
.410
.494
�.148
.594
.035
.285
.508
.619
�.057
�.076
.488
.340
p<.001
<.001
<.001
.001
<.001
.433
<.001
<.001
<.001
.200
.087
<.001
<.001
Equalstatus
r.581
.507
.494
�.276
.569
�.121
.318
.471
.527
�.145
�.239
.554
.364
p<.001
<.001
<.001
<.001
<.001
.006
<.001
<.001
<.001
.001
<.001
<.001
<.001
Continued
Complexity of school racial climate 13

Table
2.(Continued)
Variable
Teacher
support
Consistency
and
clarity
ofRules
Student
commitment
Negative
peer
interactions
Positive
peer
interaction
Disciplinary
harshness
Student
involvement
indecision-m
aking
Instructional
innovation
Supportfor
cultural
pluralism
Safety
problems
Perceived
discrimination
CRT:
Diverse
teaching
practices
CRT:
Cultural
engagement
Stereotyping
r�.032
�.170
�.061
.631
�.081
.465
.314
.117
�.038
.676
.728
�.069
.214
p.474
<.001
.175
<.001
.069
<.001
<.001
.009
.397
<.001
<.001
.121
<.001
Supportforpositive
interaction
r.612
.491
.544
�.100
.644
.101
.456
.624
.702
.047
.040
.598
.543
p<.001
<.001
<.001
.025
<.001
.023
<.001
<.001
<.001
.288
.371
<.001
<.001
Promotionofculturalcompetence
r.633
.484
.526
�.058
.648
.088
.483
.666
.695
.093
.062
.622
.632
p<.001
<.001
<.001
.196
<.001
.048
<.001
<.001
<.001
.038
.165
<.001
<.001
Culturalsocialization
r.517
.327
.421
.074
.501
.181
.499
.606
.564
.233
.219
.487
.670
p<.001
<.001
<.001
.095
<.001
<.001
<.001
<.001
<.001
<.001
<.001
<.001
<.001
Criticalconsciousness
r.537
.340
.422
.130
.508
.220
.543
.634
.560
.256
.253
.534
.659
p<.001
<.001
<.001
.004
<.001
<.001
<.001
<.001
<.001
<.001
<.001
<.001
<.001
Mainstream
socialization
r.596
.479
.514
�.032
.603
.144
.438
.619
.610
.088
.077
.602
.556
p<.001
<.001
<.001
.476
<.001
.001
<.001
<.001
<.001
.048
.086
<.001
<.001
Colourblindsocialization
r.379
.254
.265
.029
.373
.062
.415
.388
.355
.166
.112
.343
.347
p<.001
<.001
<.001
.520
<.001
.168
<.001
<.001
<.001
<.001
.012
<.001
<.001
Note.
CRT=culturally
relevantteaching.
14 Christy M. Byrd
Perceived discrimination
I expected perceived discrimination to be moderately negatively correlated with quality
of interaction and equal status, and positively with stereotyping. These hypotheses were
partially confirmed: The correlation with quality of interaction was low (r = �.129,p = .022), with equal status was moderate (r = �.284, p < .001), and with stereotyping
was high (r = .683, p < .001). The next hypothesis was that perceived discrimination
would have low correlations with the racial socialization dimensions, and this was for the
most part confirmed (rs < .27).
Culturally relevant teaching
The final hypothesis about the validating measures was the expectation of moderate-to-
high correlations between CRT and cultural socialization and critical consciousness
socialization. This hypothesis was confirmed: The correlations with cultural socialization
were .405 (p < .001) and .606 (p < .001) for diverse teaching practices and cultural
engagement, respectively. For critical consciousness socialization, the correlations were
.425 (p < .001) and .583 (p < .001), respectively.
Question 4
To determine how the dimensions of school racial climatewere associatedwith academic
outcomes, I examined bivariate correlations between the subscales and good grades,
academic aspirations, interest, feelings of belonging, utility value, importance of
education, and academic self-concept. The correlations are shown in Table 3a. I expected
indicators of a positive racial climate to be associated with more positive outcomes, and
this was generally true. Most of the correlations were in the expected directions andwerestatistically significant (p < .05). Notably, however, colourblind socialization was
positively associated with interest, belonging, utility value, importance, and academic
self-concept, and stereotyping was positively associated with academic self-concept.
Discussion
The evidence from Study 1 supported the fit of the data with the theoretical framework
and strong reliability of the subscales. I also found expected correlations between the
subscales and measures of general school climate, perceived discrimination, culturally
relevant teaching, and academic outcomes. A second study was undertaken to replicate
the findings in an independent sample.
STUDY 2
Method
Participants were 504 6th- to 12th-grade students recruited by Qualtrics (Mage = 15.23,
SD = 1.46). For this data collection, quotas were set for race and gender such that the
sample was evenly balanced across both categories, such that there were 63 White boys,
White girls, Black boys, Black girls, Latino boys, Latina girls, Asian American boys, and AsianAmerican girls. The procedures, measures, and analyses were identical to Study 1, except
that participants were between the ages of 13 and 18. This change was made because
Qualtrics indicated that it was more difficult to recruit 12-year-old participants and obtain a
balanced sample. The research questions and analyses were identical to Study 1.
Complexity of school racial climate 15

Table 3. Subscale correlations with academic outcomes (a) (Study 1); (b) (Study 2)
Subscale Grades Aspirations Interest Belonging Utility value Importance
Academic
self-concept
(a)
Quality of interaction
r .188 .128 .241 .305 .259 .291 .223
p .001 .023 <.001 <.001 <.001 <.001 <.001Frequency of interaction
r .207 .120 .233 .252 .235 .351 .185
p <.001 .033 <.001 <.001 <.001 <.001 .001
Equal status
r .171 .081 .304 .353 .304 .284 .170
p .002 .153 <.001 <.001 <.001 <.001 .002
Stereotyping
r .017 .067 .048 �.261 .044 .067 .124
p .761 .235 .396 <.001 .435 .238 .027
Support for positive interaction
r .169 .129 .303 .258 .349 .332 .204
p .003 .022 <.001 <.001 <.001 <.001 <.001Promotion of cultural competence
r .164 .136 .392 .326 .460 .380 .203
p .004 .015 <.001 <.001 <.001 <.001 <.001Cultural socialization
r .101 .099 .337 .252 .374 .290 .176
p .074 .080 <.001 <.001 <.001 <.001 .002
Critical consciousness
r .119 .136 .280 .103 .331 .282 .174
p .035 .016 <.001 .068 <.001 <.001 .002
Mainstream socialization
r .059 .141 .363 .265 .405 .331 .181
p .292 .012 <.001 <.001 <.001 <.001 .001
Colourblind socialization
r .134 .045 .206 .214 .198 .126 .177
p .017 .428 <.001 <.001 <.001 .026 .002
(b)
Quality of interaction
r .217 .052 .439 .413 .384 .316 .291
p <.001 .248 <.001 <.001 <.001 <.001 <.001Frequency of interaction
r .157 .069 .415 .376 .374 .322 .286
p <.001 .124 <.001 <.001 <.001 <.001 <.001Equal status
r .143 .048 .354 .367 .342 .306 .186
p .001 .285 <.001 <.001 <.001 <.001 <.001Stereotyping
r .039 �.096 .158 �.117 .138 .045 .103
p .380 .032 <.001 .009 .002 .317 .021
Support for positive interaction
r .162 .059 .476 .397 .475 .346 .285
p <.001 .185 <.001 <.001 <.001 <.001 <.001
Continued
16 Christy M. Byrd
Results
Questions 1 and 2
The confirmatory factor analysis revealed excellent fit: v2 (df = 655,
N = 504) = 1138.394, p < .001, CFI = .96, RMSEA = .038, SRMR = .055, TLI = .95.
Table 1 shows the standardized factor loadings, which ranged from .508 to .845.Observed power was again .99. Cronbach’s alphas for each subscale were again all equal
to or above .70, as shown in Table 1.
Question 3
General school climate
Bivariate correlations for this question are shown in Table 2b. The first hypothesis was that
negative peer interactions and positive peer interactions would be strongly associated with
quality of interaction. This hypothesis was partially confirmed: The correlation with negative
peer interaction was low (r = �.169, p < .001), but the correlation with positive peer
interaction was strong (r = .656, p < .001). I also hypothesized that equal status would bemoderately positively associated with consistency and clarity of rules, and moderately
negativelywithdisciplinaryharshness.Thehypothesiswasnotconfirmed:Thecorrelationwith
rules clarity was strong (r = .507, p < .001) and disciplinary harshness, weak (r = �.121,
p = .006). Last, I proposed moderate-to-high correlations between each of the school racial
climate subscales andsupport for culturalpluralism.Thishypothesiswasagainconfirmed for all
except stereotyping (r = �.038, p = .397).
Perceived discrimination
I expected perceived discrimination to be moderately correlated with quality of
interaction, equal status, and stereotyping. This hypothesis was only partially confirmed.
Perceived discrimination had a strong correlation with stereotyping (r = .728, p < .001)
Table 3. (Continued)
Subscale Grades Aspirations Interest Belonging Utility value Importance
Academic
self-concept
Promotion of cultural competence
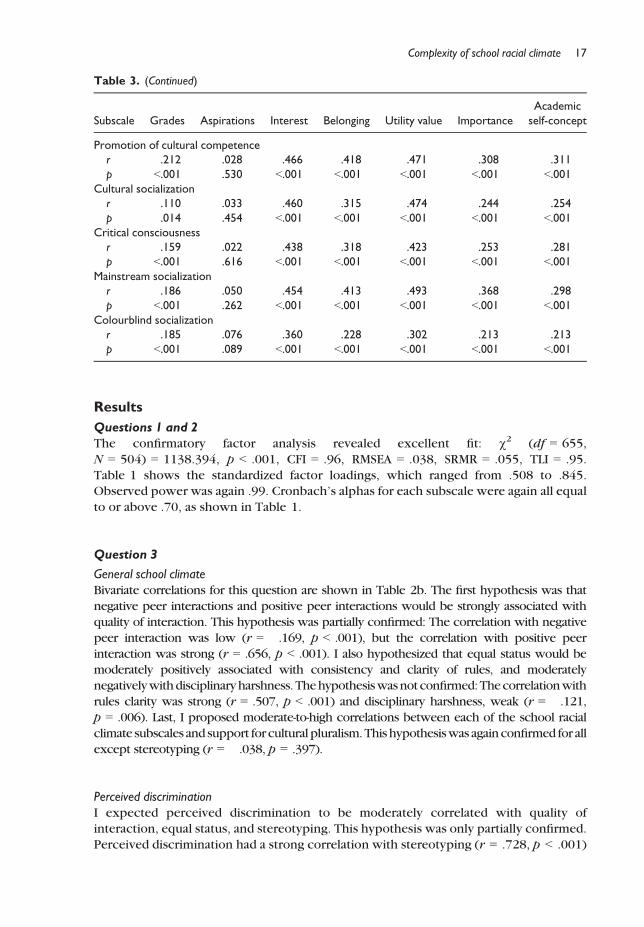
r .212 .028 .466 .418 .471 .308 .311
p <.001 .530 <.001 <.001 <.001 <.001 <.001Cultural socialization
r .110 �.033 .460 .315 .474 .244 .254
p .014 .454 <.001 <.001 <.001 <.001 <.001Critical consciousness
r .159 �.022 .438 .318 .423 .253 .281
p <.001 .616 <.001 <.001 <.001 <.001 <.001Mainstream socialization
r .186 .050 .454 .413 .493 .368 .298
p <.001 .262 <.001 <.001 <.001 <.001 <.001Colourblind socialization
r .185 �.076 .360 .228 .302 .213 .213
p <.001 .089 <.001 <.001 <.001 <.001 <.001
Complexity of school racial climate 17
and a moderate correlation with equal status (r = �.239, p < .001) and was not
significantly associated with quality of interaction (r = �.040, p = .373). These findings
are similar to Study 1. The next hypothesis was that perceived discrimination would have
low correlations with the racial socialization dimensions, and this was again confirmed(rs < .25).
Culturally relevant teaching
Finally, I expected moderate-to-high correlations between CRT and cultural socialization
and critical consciousness socialization. This was confirmed as all four correlations were
above .49.
Question 4
The fourth research question concerned predictive validity, and the bivariate correlations
are shown in Table 3b. The hypothesis was mostly confirmed, as most of the correlations
were in the expected directions. Again, however, colourblind socializationwas positively
associated with most of the outcomes.
GENERAL DISCUSSION
The goal of the current study was to provide evidence of the reliability and validity of the
School Climate for Diversity – Secondary Scale. A strength of this study was that the
participants were drawn from four racial groups from diverse settings and regions across
the United States. Thus, the findings are highly generalizable. A second strength was that
the findings were replicated in two independent samples.The SCD-S showed concordance with existing measures of general school climate,
school racial climate, and culturally relevant teaching. The scale also showed expected
positive correlations with academic outcomes. However, the scale did not show all
expected associations. First, a surprising finding was that quality of interaction was not
as strongly related to negative peer interactions and perceived discrimination as
expected. However, it was strongly related to positive peer interactions. Although the
subscale is intended to tap into both positive and negative interactions, all of the items
are positively worded, so there is a limitation to the subscale. At the same time,however, the equal status subscale also had all positively worded items and yet had
stronger correlations with negative peer interactions and perceived discrimination.
Second, although research has hypothesized negative outcomes due to colourblind
socialization, the vast majority of existing research is qualitative and based on
researcher evaluations of colourblindness. Few studies have examined adolescents’
perceptions of colourblind messages. Therefore, further research is needed to explore
the role of the messages for youths’ outcomes. It may be that White youth and youth of
colour interpret these messages differently, or the meaning of such messages dependson the racial composition of the school. The findings also revealed significant positive
correlations between mainstream socialization and most academic outcomes. Given the
lack of literature on students’ perceptions of these messages, the implications of these
findings are unclear, but they do highlight the need for future study of messages about
American values as an aspect of racial climate.
18 Christy M. Byrd
Some limitations of the study were that it is not known how many participants
attended the same schools. Names of schools were not collected to protect participant
privacy – future research could collect more specific information to conduct hierarchical
analyses or to examine variation in perceptions of school racial climate by school andcommunity demographics. Future work should also explore measurement invariance by
race and gender and include students from other racial groups.
Implications
Theprimary implication of the currentwork is that educators nowhave a framework and a
tool to understand the particular ways that race and culture are perceived in secondary
schools. As existing measures and research treat climate in a broad manner (e.g., Brandet al., 2003), schools can only describe their climates as positive or negative. However,
schools with a high number of colourblind messages will require different interventions
than schools with poor quality of interactions, for example. Thus, acknowledging the
multidimensionality of racial climate in conceptualization andmeasurementwill improve
research and intervention.
ConclusionThis study has contributed to the literature in educational psychology by recognizing both
intergroup interactions and the curriculum as components of school racial climate, by
disentangling the relationship between racial climate and perceived discrimination, and
by taking a phenomenological and individual differences viewpoint. School racial climate
is a complex and multidimensional construct, and the School Climate for Diversity –Secondary Scale is a reliable and valid measure of it.
References
Aldana, A., & Byrd, C. M. (2015). School ethnic–racial socialization: Learning about race and
ethnicity among African American students. The Urban Review, 47, 563–576. https://doi.org/10.1007/s11256-014-0319-0
Aldana, A., Rowley, S. J., Checkoway, B., & Richards-Schuster, K. (2012). Raising ethnic-racial
consciousness: The relationship between intergroup dialogues and adolescents’ ethnic-racial
identity and racism awareness. Equity & Excellence in Education, 45(1), 120–137. https://doi.org/10.1080/10665684.2012.641863
Alfaro,E.C.,Uma~na-Taylor, A. J.,Gonzales-Backen,M.A., B�amaca,M.Y.,&Zeiders,K.H. (2009). Latino
adolescents’ academic success: The role of discrimination, academic motivation, and gender.
Journal of Adolescence, 32, 941–962. https://doi.org/10.1016/j.adolescence.2008.08.007Allport, G. W. (1954). The nature of prejudice. Boston, MA: Addison-Wesley.
Apfelbaum, E. P., Pauker, K., Sommers, S. R., &Ambady,N. (2010). In blind pursuit of racial equality?
Psychological Science, 21, 1587. https://doi.org/10.1177/0956797610384741
Aronson, B., & Laughter, J. (2016). The theory and practice of culturally relevant education a
synthesis of research across content areas. Review of Educational Research, 86(1), 163–206.https://doi.org/10.3102/0034654315582066
Aronson, E., & Patnoe, S. (2011). Cooperation in the classroom: The Jigsaw method (3rd ed.).
London: Pinter & Martin.
Arunkumar, R., Midgley, C., & Urdan, T. (1999). Perceiving high or low home-school dissonance:
Longitudinal effects on adolescent emotional and academic well-being. Journal of Research on
Adolescence, 9(4), 441–466. https://doi.org/10.1207/s15327795jra0904_4
Complexity of school racial climate 19
Asante, M. K. (1991). The afrocentric idea in education. The Journal of Negro Education, 60(2),
170–180. https://doi.org/10.2307/2295608Bennett, C. (2001). Genres of research inmulticultural education.Reviewof Educational Research,
71(2), 171–217. https://doi.org/10.3102/00346543071002171Brand, S., Felner, R., Shim, M., Seitsinger, A., & Dumas, T. (2003). Middle school improvement and
reform: Development and validation of a school-level assessment of climate, cultural pluralism,
and school safety. Journal of Educational Psychology, 95, 570–588. https://doi.org/10.1037/0022-0663.95.3.570
Browne, M. W., & Cudeck, R. (1993). Alternative ways of assessing model fit. In K. A. Bollen & J. S.
Long (Eds.), Testing structural equation models (pp. 136–162). Newbury Park, CA: Sage.
Byrd, C. M. (2015). The associations of intergroup interactions and school racial socialization with
academic motivation. Journal of Educational Research, 108, 10–21. https://doi.org/10.1080/00220671.2013.831803
Byrd, C. M., & Chavous, T. (2011). Racial identity, school racial climate, and school intrinsic
motivation among African American youth: The importance of person–context congruence.Journal of Research on Adolescence, 21(4), 849–860. https://doi.org/10.1111/j.1532-7795.2011.00743.x
Chang, M. J. (2002). The impact of an undergraduate diversity course requirement on students’
racial views and attitudes. The Journal of General Education, 51(1), 21–42.Chang, J., & Le, T. N. (2010). Multiculturalism as a dimension of school climate: The impact on the
academic achievement of Asian American and Hispanic youth. Cultural Diversity and Ethnic
Minority Psychology, 16(4), 485–492. https://doi.org/10.1037/a0020654Chavous, T. M. (2005). An intergroup contact-theory framework for evaluating racial climate on
predominantly white college campuses. American Journal of Community Psychology, 36,
239–257. https://doi.org/10.1007/s10464-005-8623-1Deci, E. L., & Ryan, R. M. (2000). The” what” and” why” of goal pursuits: Human needs and the self-
determination of behavior. Psychological Inquiry, 11, 227–268. https://doi.org/10.1207/
S15327965PLI1104_01
Dickson, G. L., Chun, H., & Fernandez, I. T. (2015). The development and initial validation of the
student measure of culturally responsive teaching. Assessment for Effective Intervention, 41,
141–154. https://doi.org/10.1177/1534508415604879Dotterer, A. M., McHale, S. M., & Crouter, A. C. (2009). Sociocultural factors and school engagement
among African American youth: The roles of racial discrimination, racial socialization, and ethnic
identity. Applied Developmental Science, 13, 61–73. https://doi.org/10.1080/10888690902
801442
Eccles, J. S., & Wigfield, A. (1995). In the mind of the actor: The structure of adolescents’
achievement task values and expectancy-related beliefs. Personality and Social Psychology
Bulletin, 21(3), 215–225. https://doi.org/10.1177/0146167295213003Fisher, C. B., Wallace, S. A., & Fenton, R. E. (2000). Discrimination distress during adolescence.
Journal of Youth and Adolescence, 29, 679–695. https://doi.org/10.1023/A:1026455906512Godina, H. (2003). Mesocentrism and students of Mexican background: A community intervention
for culturally relevant instruction. Journal of Latinos and Education, 2, 141–157. https://doi.org/10.1207/S1532771XJLE0203_02
Green, C.W., Adams, A.M., &Turner, C.W. (1988). Development and initial validation of the school
interracial climate scale. American Journal of Community Psychology, 16, 241–259. https://doi.org/10.1007/BF00912525
Howard, T. C. (2001). Telling their side of the story: African-American students’ perceptions of
culturally relevant teaching. The Urban Review, 33(2), 131–149. https://doi.org/10.1023/A:1010393224120
Hu, L., & Bentler, P. M. (1995). Evaluating model fit. In R. H. Hoyle (Ed.), Structural
equationmodeling: Concepts, issues, and applications (pp. 76–99). Thousand Oaks, CA: Sage.
20 Christy M. Byrd
Hughes, J. M., Bigler, R. S., & Levy, S. R. (2007). Consequences of learning about historical racism
among European American and African American children. Child Development, 78(6), 1689–1705. https://doi.org/10.1111/j.1467-8624.2007.01096.x
Hughes, D. L., McGill, R. K., Ford, K. R., & Tubbs, C. (2011). Black youths’ academic success: The
contribution of racial socialization from parents, peers, and schools. In N. E. Hill, T. L. Mann&H.
E. Fitzgerald (Eds.), African American children andmental health, Vols 1 and 2: Development
and context, Prevention and social policy (pp. 95–124). Santa Barbara, CA: Praeger/ABC-CLIO.
Hughes,D. L., Rodriguez, J., Smith, E. P., Johnson,D. J., Stevenson,H.C.,& Spicer, P. (2006). Parents’
ethnic-racial socialization practices: A review of research and directions for future study.
Developmental Psychology, 42, 747–770. https://doi.org/10.1037/0012-1649.42.5.747Hurtado, S., Milem, J. F., Clayton-Pedersen, A. R., & Allen,W. R. (1998). Enhancing campus climates
for racial/ethnic diversity: Educational policy and practice. Review of Higher Education, 21(3),
279–302. https://doi.org/10.1353/rhe.1998.0003Kessler, R. C., Mickelson, K. D., & Williams, D. R. (1999). The prevalence, distribution, and mental
health correlates of perceived discrimination in the United States. Journal of Health and Social
Behavior, 40, 208–230.Kotori, C., & Malaney, G. D. (2003). Asian American students’ perceptions of racism, reporting
behaviors, and awareness of legal rights andprocedures.NASPA Journal,40, 56–76. https://doi.org/10.2202/1949-6605.1254
Ladson-Billings, G. (1995). Toward a theory of culturally relevant pedagogy.American Educational
Research Journal, 32, 465–491. https://doi.org/10.3102/00028312032003465MacCallum, R. C., Browne, M. W., & Sugawara, H. M. (1996). Power analysis and determination of
sample size for covariance structure modeling. Psychological Methods, 1(2), 130.
Mattison, E., & Aber, M. S. (2007). Closing the achievement gap: The association of racial climate
with achievement and behavioral outcomes.American Journal of Community Psychology, 40,
1–12. https://doi.org/10.1007/s10464-007-9128-xMorrison, K. A., Robbins, H. H., &Rose, D. G. (2008). Operationalizing culturally relevant pedagogy:
A synthesis of classroom-based research. Equity & Excellence in Education, 41, 433–452.https://doi.org/10.1080/10665680802400006
Nicholls, J. G. (1978). The development of the concepts of effort and ability, perception of academic
attainment, and the understanding that difficult tasks require more ability. Child Development,
49, 800–814. https://doi.org/10.2307/1128250Perry, P. (2001). White means never having to say You’re ethnic. Journal of Contemporary
Ethnography, 30(1), 56–91. https://doi.org/10.1177/089124101030001002Pettigrew, T. F. (2008). Future directions for intergroup contact theory and research. International
Journal of Intercultural Relations,32, 187–199. https://doi.org/10.1016/j.ijintrel.2007.12.002Plaut, V. C., Thomas, K. M., & Goren, M. J. (2009). Is multiculturalism or color blindness better for
minorities? Psychological Science, 20, 444–446. https://doi.org/10.1111/j.1467-9280.2009.
02318.x
Pollock, M. (2005). Colormute: Race talk dilemmas in an American school. Princeton, NJ:
Princeton University Press.
Ponterotto, J. G. (2010). Multicultural personality: An evolving theory of optimal functioning in
culturally heterogeneous societies. The Counseling Psychologist, 38, 714–758. https://doi.org/10.1177/0011000009359203
Preacher, K. J., & Coffman, D. L. (2006). Computing power andminimum sample size for RMSEA.
[Computer software]. Retrieved from http://quantpsy.org.
Richeson, J. A., & Nussbaum, R. J. (2004). The impact of multiculturalism versus color-blindness on
racial bias. Journal of Experimental Social Psychology, 40, 417–423. https://doi.org/10.1016/j.jesp.2003.09.002
Rivas-Drake, D. (2011). Public ethnic regard and academic adjustment among Latino adolescents.
Journal of Research on Adolescence, 21, 537–544. https://doi.org/10.1111/j.1532-7795.2010.00700.x
Complexity of school racial climate 21
Schofield, J. W. (2006). The colorblind perspective in school: Causes and consequences. In J. A.
Banks & C. A. McGee Banks (Eds.),Multicultural education: Issues and perspectives (pp. 271–295). Hoboken, NJ: John Wiley.
Schwartz, S. J., Weisskirch, R. S., Hurley, E. A., Zamboanga, B. L., Park, I. J. K., Kim, S. Y., . . .Greene,A. D. (2010). Communalism, familism, and filial piety: Are they birds of a collectivist feather?
Cultural Diversity and Ethnic Minority Psychology, 16, 548–560. https://doi.org/10.1037/a0021370
Simmons, S. J., Wittig, M. A., & Grant, S. K. (2010). A mutual acculturation model of multicultural
campus climate and acceptance of diversity. Cultural Diversity and Ethnic Minority
Psychology, 16(4), 468–475. https://doi.org/10.1037/a0020237Sleeter, C. E. (2012). Confronting the marginalization of culturally responsive pedagogy. Urban
Education, 47, 562–584. https://doi.org/10.1177/0042085911431472Sleeter, C. E., & Grant, C. A. (2011).Making choices for multicultural education: Five approaches
to race, class and gender (6th ed.). Hoboken, NJ: John Wiley.
Southern Poverty LawCenter (2010).What ismix it up at lunch day?Retrieved from https://www.
tolerance.org/mix-it-up?page=1
Steele, C. M. (1997). A threat in the air. How stereotypes shape intellectual identity and
performance. The American Psychologist, 52, 613–629. https://doi.org/10.1037/0003-066X.52.6.613
Teranishi, R. T. (2002). Asian Pacific Americans and critical race theory: An examination of school
racial climate. Equity & Excellence in Education, 35(2), 144–154. https://doi.org/10.1080/713845281
Thapa, A., Cohen, J., Guffey, S., & Higgins-D’Alessandro, A. (2013). A review of school climate
research. Review of Educational Research, 83, 357–385. https://doi.org/10.3102/0034654313483907
Tyler, K. M., Uqdah, A. L., Dillihunt, M. L., Beatty-Hazelbaker, R., Conner, T., Gadson, N., . . .Owens,
E. (2008). Cultural discontinuity: Toward a quantitative investigation of a major hypothesis in
education. Educational Researcher, 37, 280–297. https://doi.org/10.3102/0013189X08321459Tyson,K., Darity,W.,&Castellino, D. R. (2005). It’s not “a black thing”:Understanding the burdenof
actingwhite and other dilemmas of high achievement.American Sociological Review, 70, 582–605. https://doi.org/10.1177/000312240507000403
US Department of Education, Office of Safe and Healthy Students. (2016). Technical and
Administration User Guide for the ED School Climate Surveys (EDSCLS). Retrieved from
http://safesupportivelearning.ed.gov/
Walton, J., Priest, N., Kowal, E., White, F., Brickwood, K., Fox, B., & Paradies, Y. (2014). Talking
culture? Egalitarianism, color-blindness and racism in Australian elementary schools. Teaching
and Teacher Education, 39, 112–122. https://doi.org/10.1016/j.tate.2014.01.003Warzon, K. B., & Ginsburg-Block, M. (2008). Cultural continuity between home and school as a
predictor of student motivation: What we know, what we need to learn, and implications for
practice. InC.Hudley&A. E.Gottfried (Eds.),Academicmotivationand the culture of school in
childhood and adolescence (pp. 121–145). New York, NY: Oxford University Press.
Wigfield, A., Eccles, J. S., Yoon, K. S., Harold, R. D., Arbreton, A. J. A., Freedman-Doan, C., &
Blumenfeld, P. C. (1997). Change in children’s competence beliefs and subjective task values
across the elementary school years: A 3-year study. Journal of Educational Psychology,89, 451–469. https://doi.org/10.1037/0022-0663.89.3.451
Zullig, K. J., Koopman, T. M., Patton, J. M., & Ubbes, V. A. (2010). School climate: Historical review,
instrument development, and school assessment. Journal of Psychoeducational Assessment,
28, 139–152. https://doi.org/10.1177/0734282909344205
Received 13 July 2016; revised version received 4 April 2017
22 Christy M. Byrd