Embed Size (px)
Citation preview
THE COMPETITIVENESS AND ENTERPRISE CITIES PROJECTBABSON CONNECT, CARTAGENA, COLOMBIA, APRIL 26, 2015
POVERTY IN THE WORLD
Poverty Facts
More than 3 billion people live on less than $2.50 per day
5.6 billion people live on less than $10 per day
2.6 billion have no access to basic sanitation
45% of the world’s 2.2 billion children live in poverty, 29% have no shelter
25% of people live without access to electricity
600 million people lifted out of poverty in China in the past 20 years
The poverty rate in China fell from 85% to 15.9%
785 million people are illiterate; 2/3rd of these are women
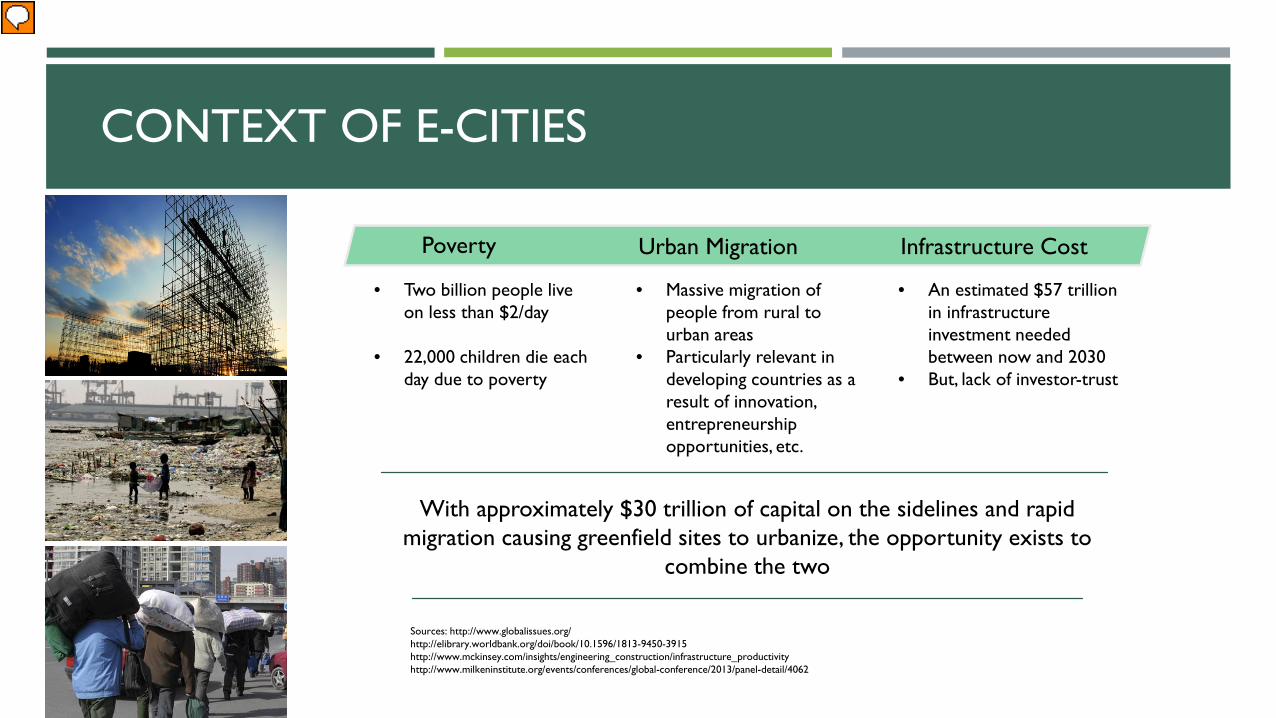
CONTEXT OF E-CITIES
Sources: http://www.globalissues.org/http://elibrary.worldbank.org/doi/book/10.1596/1813-9450-3915 http://www.mckinsey.com/insights/engineering_construction/infrastructure_productivityhttp://www.milkeninstitute.org/events/conferences/global-conference/2013/panel-detail/4062
Poverty Urban Migration Infrastructure Cost
• Two billion people live on less than $2/day
• 22,000 children die each day due to poverty
• Massive migration of people from rural to urban areas
• Particularly relevant in developing countries as a result of innovation, entrepreneurship opportunities, etc.
• An estimated $57 trillion in infrastructure investment needed between now and 2030
• But, lack of investor-trust
With approximately $30 trillion of capital on the sidelines and rapid migration causing greenfield sites to urbanize, the opportunity exists to
combine the two
THE PROBLEMS OF NATIONWIDE REFORM
90% of capital flows go to 12 countries, despite better returns in developing countries
Returns in developing countries are lowered by economic distortions
National-level reform is difficult to achieve
Beneficiaries from distortions tend to block reforms
Their power prevents the creation of a level playing field for competition and promotes “crony capitalism”
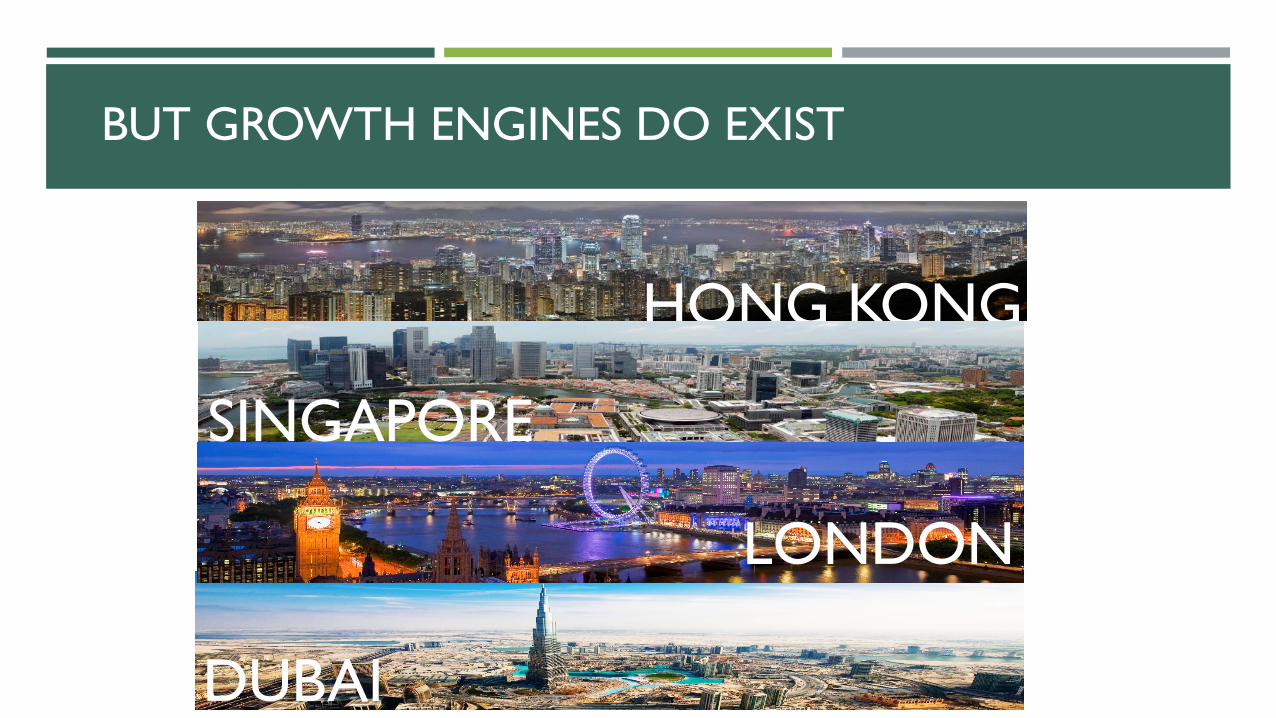
BUT GROWTH ENGINES DO EXIST
HONG KONG
SINGAPORE
DUBAI
LONDON
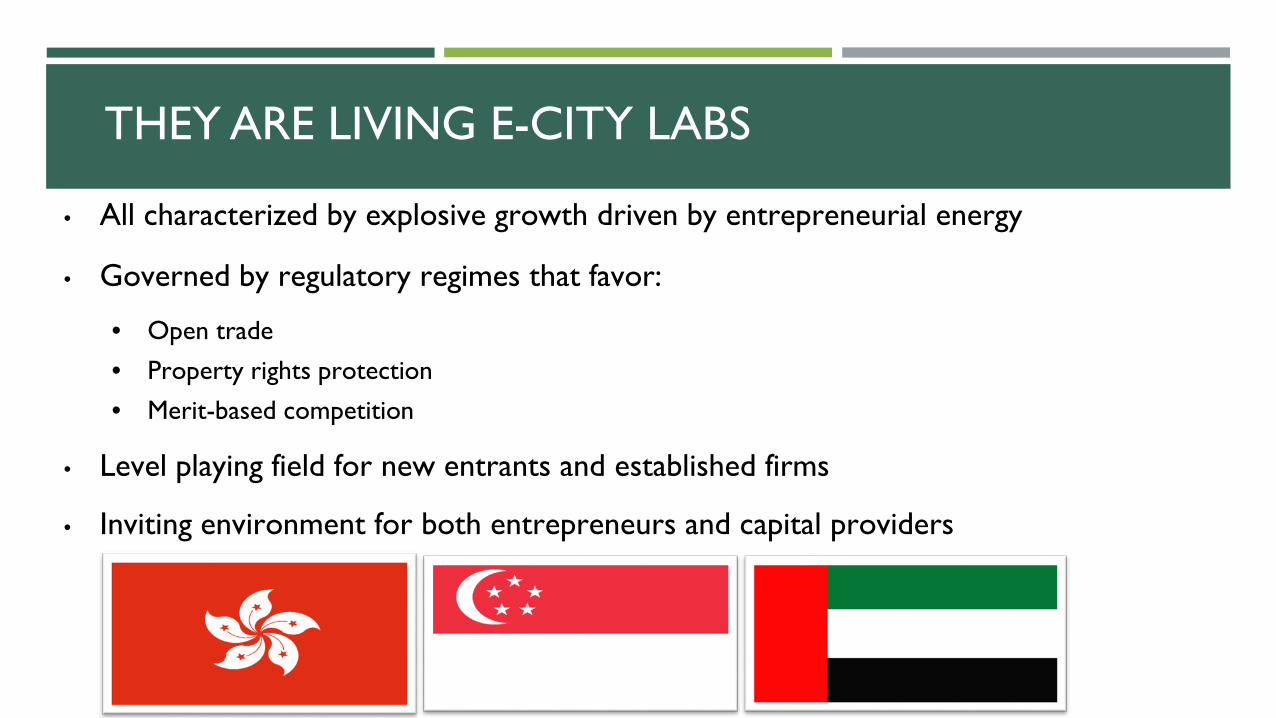
THEY ARE LIVING E-CITY LABS
• All characterized by explosive growth driven by entrepreneurial energy
• Governed by regulatory regimes that favor:
• Open trade• Property rights protection• Merit-based competition
• Level playing field for new entrants and established firms
• Inviting environment for both entrepreneurs and capital providers
WHAT IS THE PURPOSE OF THE PROJECT?
Connect governments with developer groups, and other stakeholders such as foundations or international development agencies who wish to alleviate global poverty and create opportunity for socially inclusive growth for people in developing countries and emerging markets:
By identifying the constraints to economic activity in these countries
By advising the elimination of these constraints
By facilitating the creation of merit-based competition systems
THE CECP WORKS WITH:
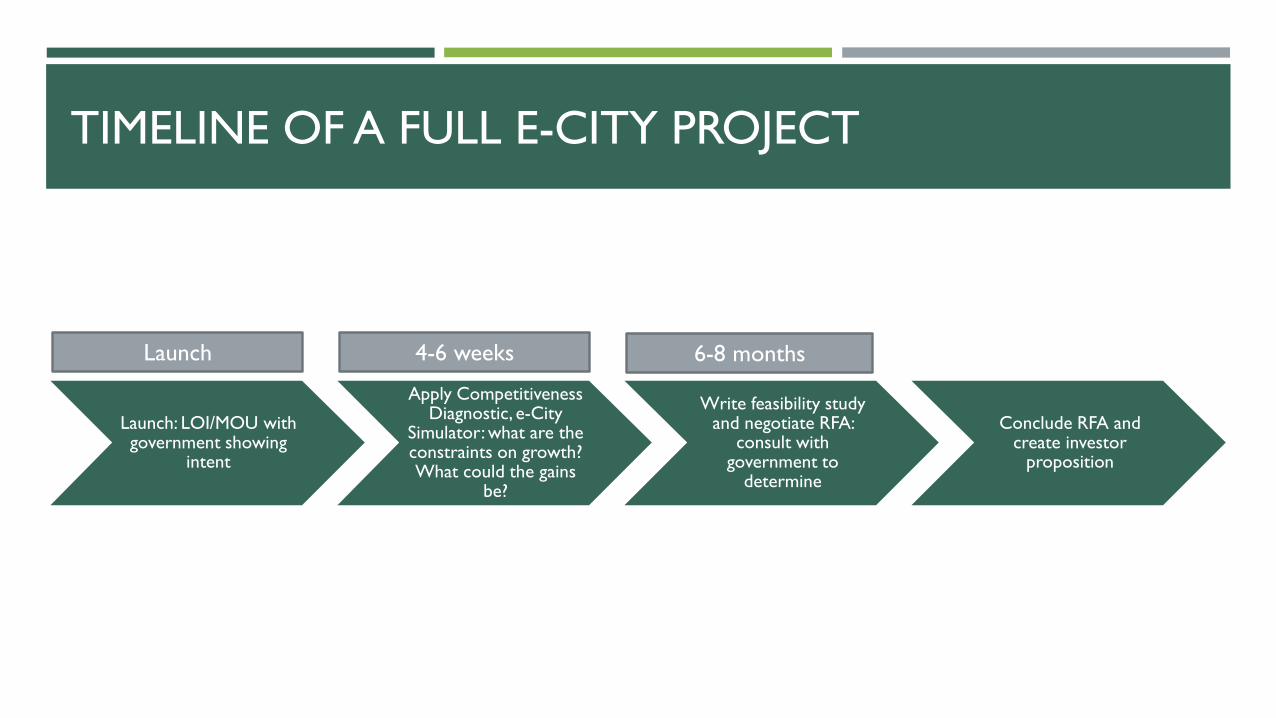
TIMELINE OF A FULL E-CITY PROJECT
Launch: LOI/MOU with government showing
intent
Apply Competitiveness Diagnostic, e-City
Simulator: what are the constraints on growth? What could the gains
be?
Write feasibility study and negotiate RFA:
consult with government to
determine
Conclude RFA and create investor
proposition
Launch 4-6 weeks 6-8 months
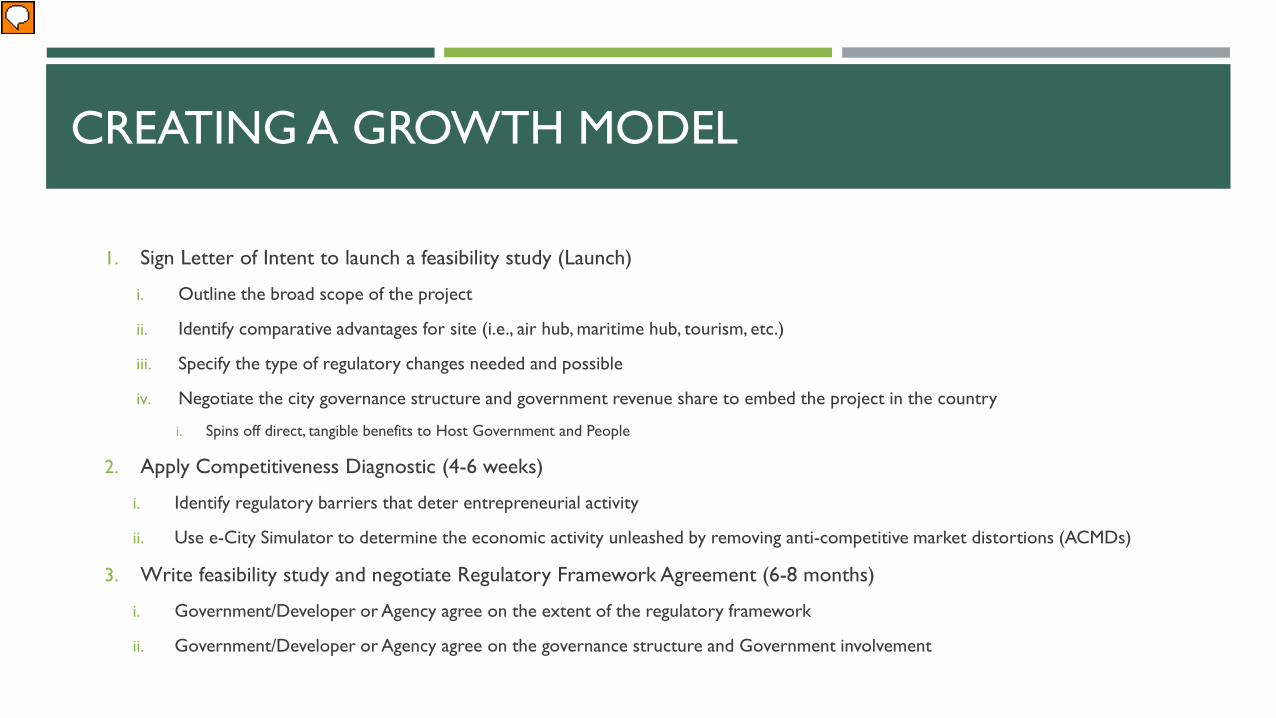
CREATING A GROWTH MODEL
1. Sign Letter of Intent to launch a feasibility study (Launch)
i. Outline the broad scope of the project
ii. Identify comparative advantages for site (i.e., air hub, maritime hub, tourism, etc.)
iii. Specify the type of regulatory changes needed and possible
iv. Negotiate the city governance structure and government revenue share to embed the project in the country
i. Spins off direct, tangible benefits to Host Government and People
2. Apply Competitiveness Diagnostic (4-6 weeks)
i. Identify regulatory barriers that deter entrepreneurial activity
ii. Use e-City Simulator to determine the economic activity unleashed by removing anti-competitive market distortions (ACMDs)
3. Write feasibility study and negotiate Regulatory Framework Agreement (6-8 months)
i. Government/Developer or Agency agree on the extent of the regulatory framework
ii. Government/Developer or Agency agree on the governance structure and Government involvement
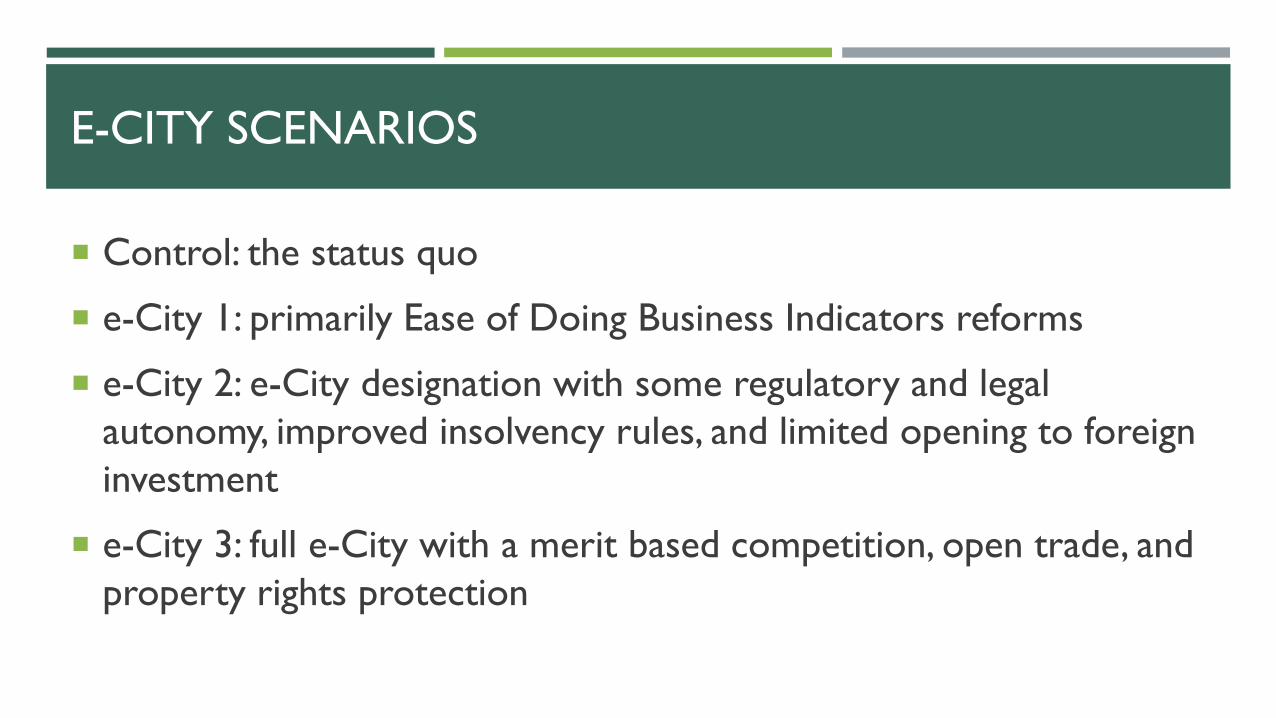
E-CITY SCENARIOS
Control: the status quo
e-City 1: primarily Ease of Doing Business Indicators reforms
e-City 2: e-City designation with some regulatory and legal autonomy, improved insolvency rules, and limited opening to foreign investment
e-City 3: full e-City with a merit based competition, open trade, and property rights protection
PRODUCTIVITY/E-CITY SIMULATOR
This tool enables us to estimate the result (in terms of economic activity) of solving for constraints across threedimensions: property rights, domestic competition, and international competition depending on which version of e-City is developed
This simulator is much more accurate than existing databases and indices, ie World Bank Doing Business, WEF GCI, etc.
It is more accurate because of its non-reliance on survey data and its precise sorting and weighting of categories and subcategories of data
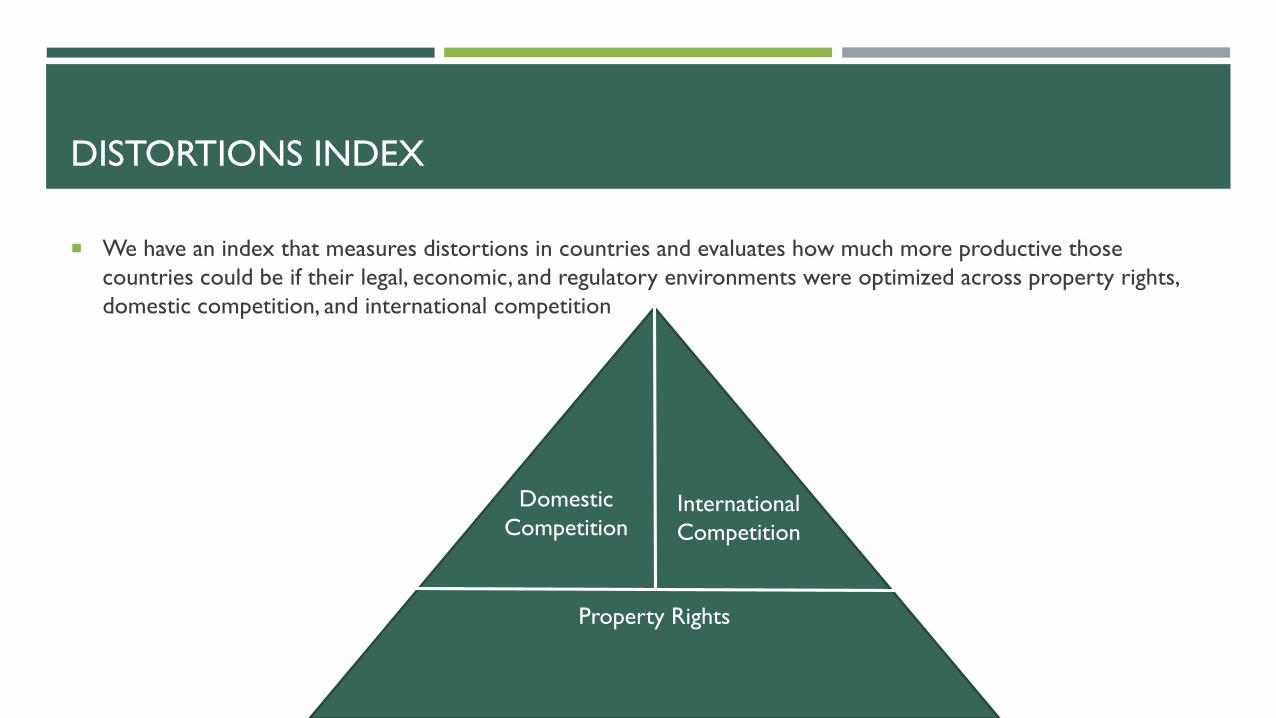
DISTORTIONS INDEX
We have an index that measures distortions in countries and evaluates how much more productive those countries could be if their legal, economic, and regulatory environments were optimized across property rights, domestic competition, and international competition
Property Rights
DomesticCompetition
InternationalCompetition
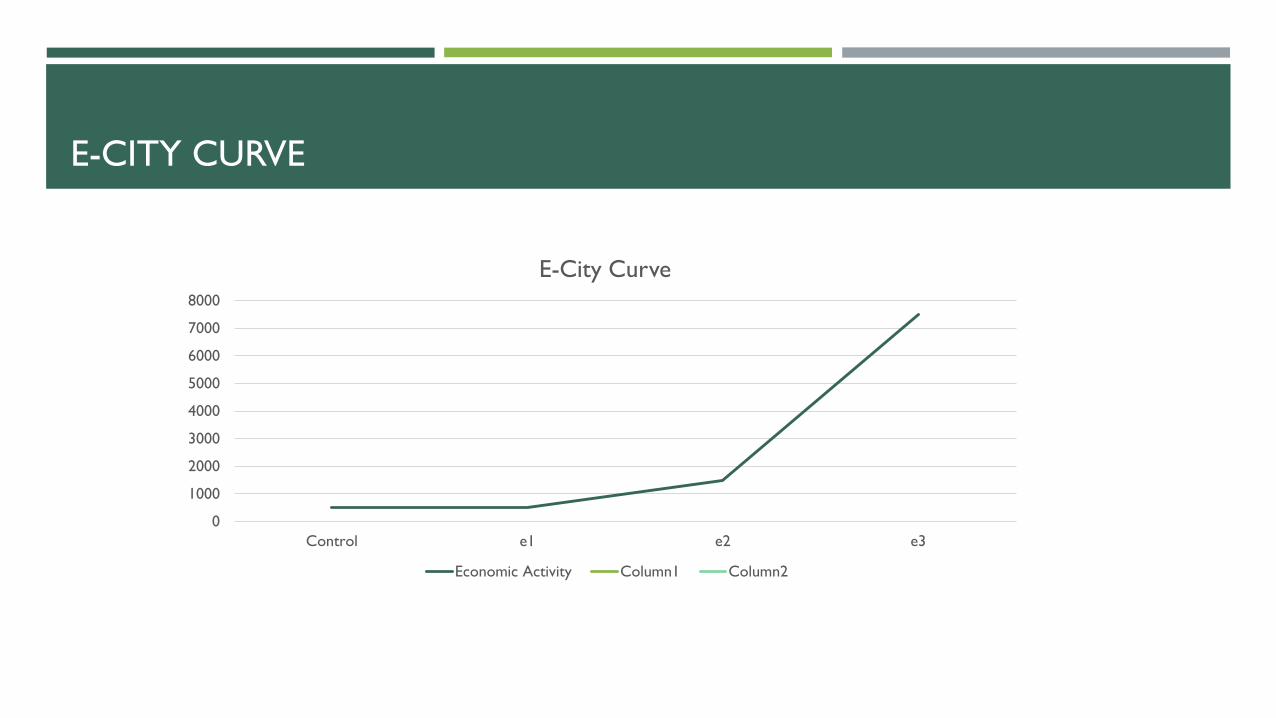
E-CITY CURVE
0
1000
2000
3000
4000
5000
6000
7000
8000
Control e1 e2 e3
E-City Curve
Economic Activity Column1 Column2
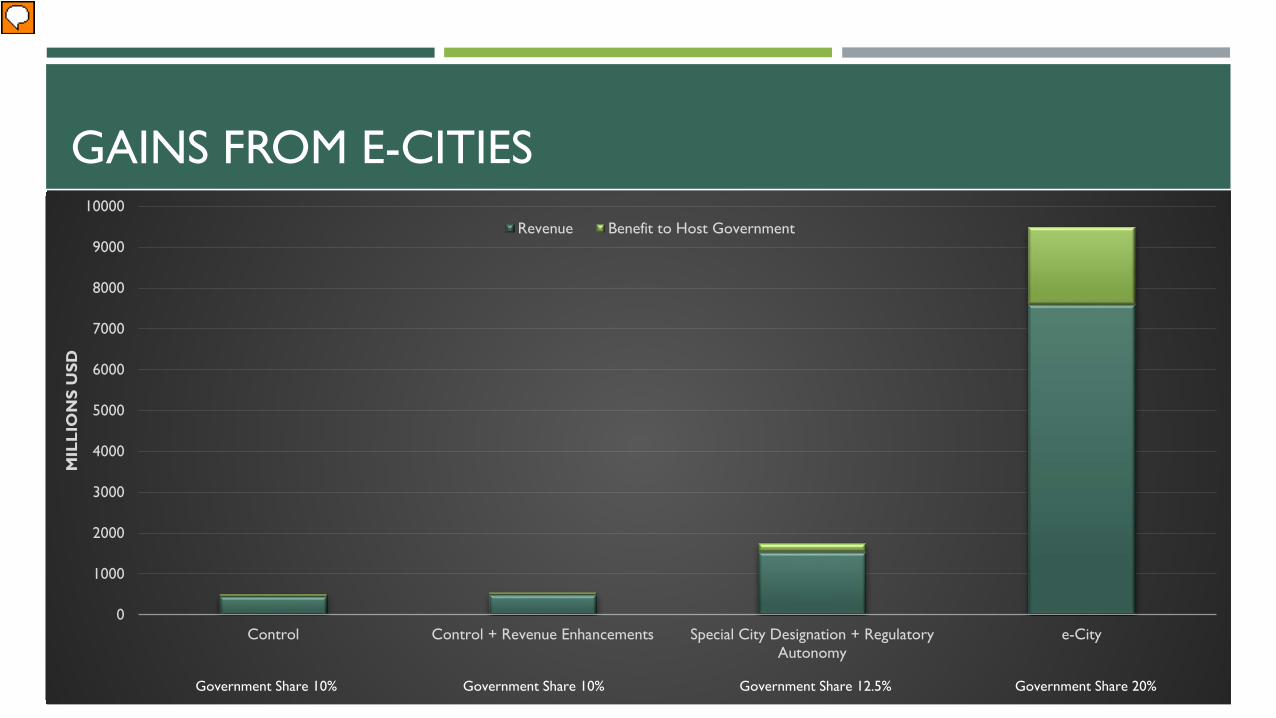
GAINS FROM E-CITIES
0
1000
2000
3000
4000
5000
6000
7000
8000
9000
10000
Control Control + Revenue Enhancements Special City Designation + RegulatoryAutonomy
e-City
MIL
LIO
NS
USD
Revenue Benefit to Host Government
Government Share 10% Government Share 10% Government Share 12.5% Government Share 20%
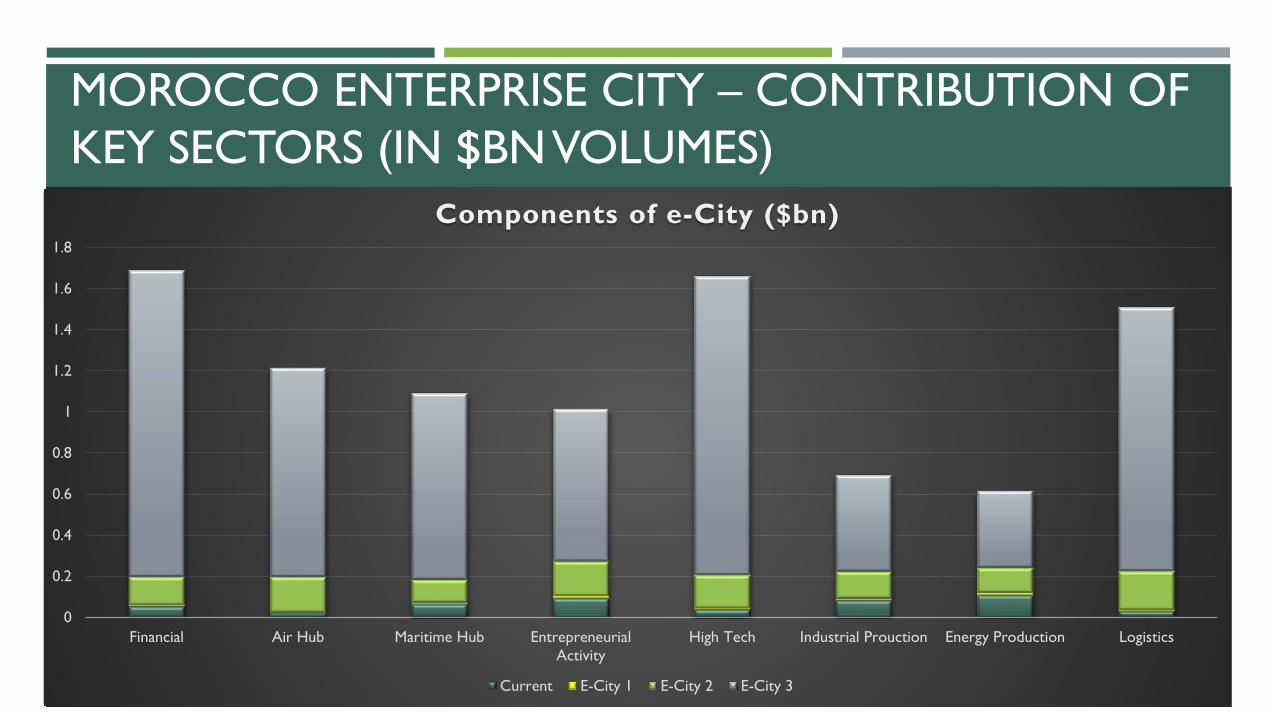
MOROCCO ENTERPRISE CITY – CONTRIBUTION OF KEY SECTORS (IN $BNVOLUMES)
Control E-City 1 E-City 2 E-City 3
Financial 0.05 0.06 0.20 1.69
Air Hub 0.02 0.02 0.20 1.22
Maritime Hub 0.07 0.07 0.18 1.09
Entrepreneurial Activity 0.09 0.10 0.27 1.02
High Tech 0.04 0.04 0.21 1.66
Industrial Production 0.08 0.09 0.22 0.69
Energy Production 0.11 0.12 0.24 0.62
Logistics 0.03 0.04 0.23 1.510
0.2
0.4
0.6
0.8
1
1.2
1.4
1.6
1.8
Financial Air Hub Maritime Hub EntrepreneurialActivity
High Tech Industrial Prouction Energy Production Logistics
Components of e-City ($bn)
Current E-City 1 E-City 2 E-City 3
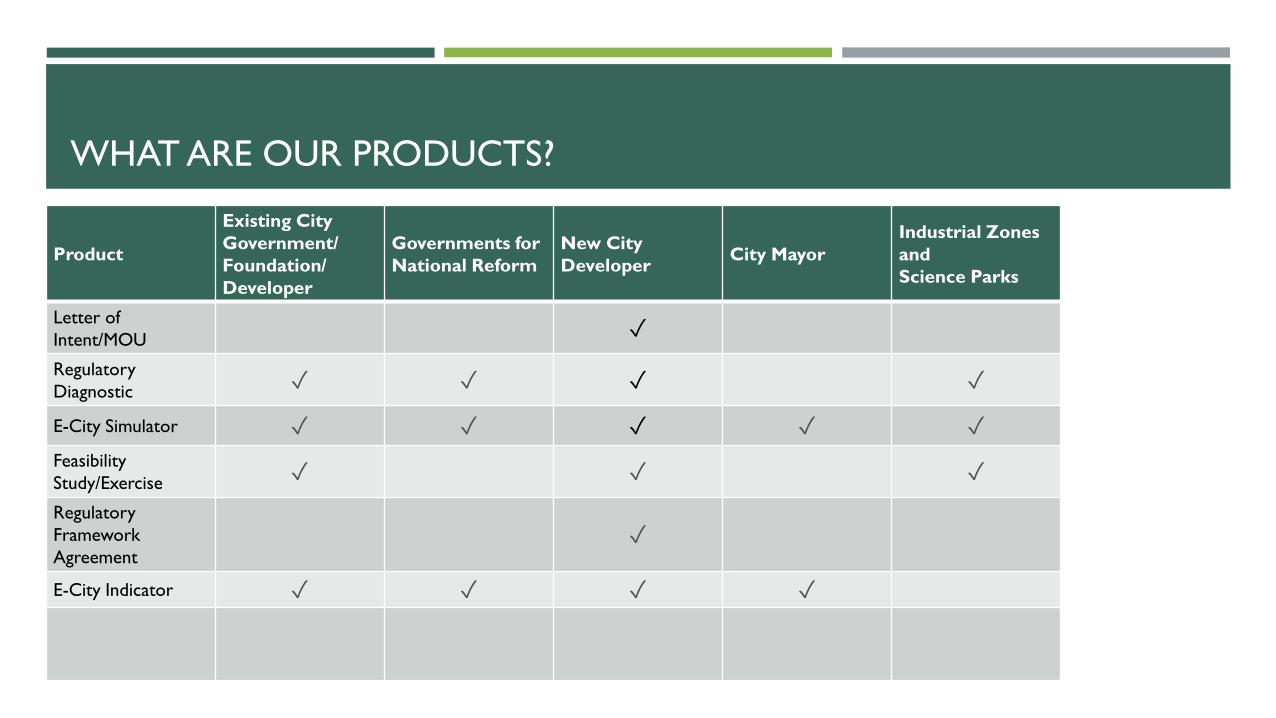
WHAT ARE OUR PRODUCTS?
Product
Existing City Government/Foundation/Developer
Governments for National Reform
New CityDeveloper City Mayor
Industrial Zonesand Science Parks
Letter of Intent/MOU ✓Regulatory Diagnostic ✓ ✓ ✓ ✓
E-City Simulator ✓ ✓ ✓ ✓ ✓FeasibilityStudy/Exercise ✓ ✓ ✓Regulatory Framework Agreement
✓
E-City Indicator ✓ ✓ ✓ ✓
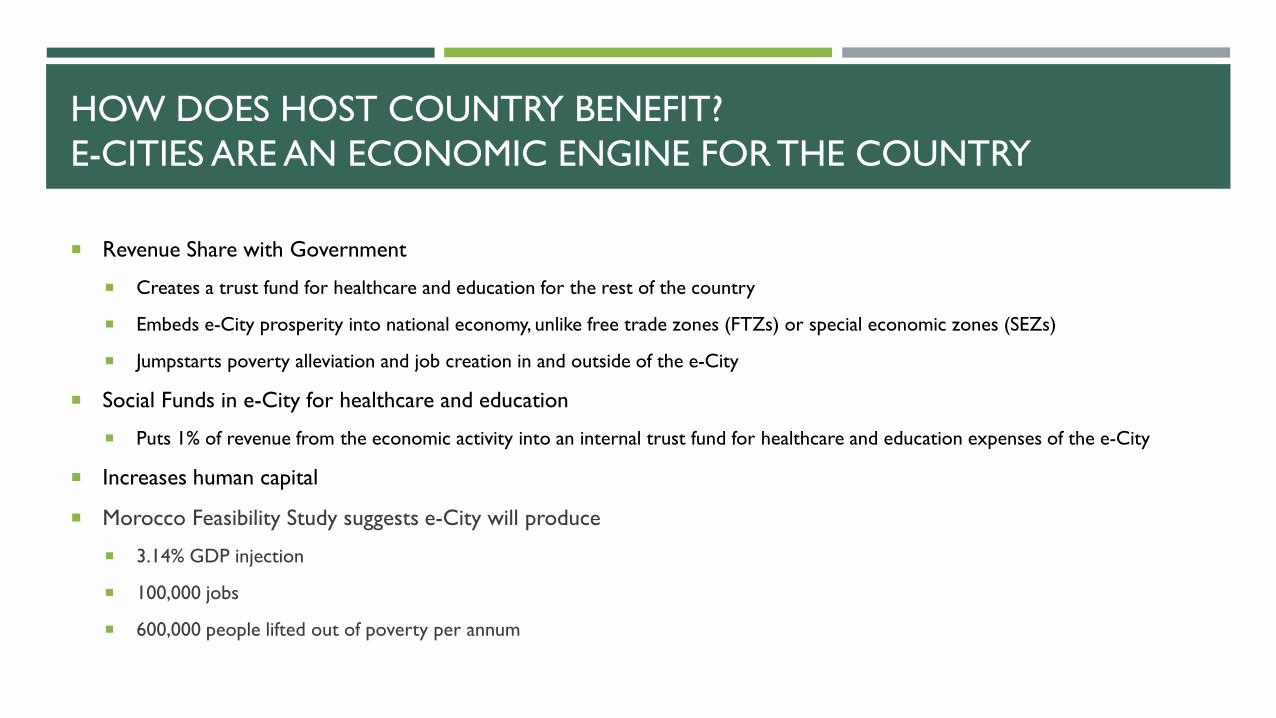
HOW DOES HOST COUNTRY BENEFIT?E-CITIES ARE AN ECONOMIC ENGINE FOR THE COUNTRY
Revenue Share with Government
Creates a trust fund for healthcare and education for the rest of the country
Embeds e-City prosperity into national economy, unlike free trade zones (FTZs) or special economic zones (SEZs)
Jumpstarts poverty alleviation and job creation in and outside of the e-City
Social Funds in e-City for healthcare and education
Puts 1% of revenue from the economic activity into an internal trust fund for healthcare and education expenses of the e-City
Increases human capital
Morocco Feasibility Study suggests e-City will produce
3.14% GDP injection
100,000 jobs
600,000 people lifted out of poverty per annum
ENTERPRISE CITIES DEVELOPMENT COUNCIL

ENTERPRISE CITIES ACADEMIC ADVISORY COUNCIL
Martin Anderson, Babson College
Philip Dover, Babson College
Beth Goldstein, Babson College
Christopher Hennessey, Babson College
James Hoopes, Babson College
Bala Iyer, Babson College
Kent Jones, Babson College
Donna Kelley, Babson College
Michael Mozill, Babson College
Srinivasa Rangan, Babson College
George Recck, Babson College
Alden Abbott, The Heritage Foundation
Eduardo Gamarra, Florida International University
John Macomber, Harvard Business School
Aaditya Mattoo, World Bank
Richard Miller, Olin College
Nikhil Rao, Wellesley College
S.P. Kothari, MIT