Embed Size (px)
Citation preview


The Company
PriceSmart, Inc. ("PriceSmart" or the "Company"), is a volume-driven merchandise and services provider,delivering quality, value and low prices to the rapidly emerging consumer class in Central America, theCaribbean and Asia. The Company delivers significant value to the member-customer through an effectiveand efficient pipeline that leverages economies of scale in aggressive buying, low-cost distribution andstreamlined operations.
As of November 30, 2001, the Company had twenty-three warehouse stores in operation (four in Panama;three each in Costa Rica, Dominican Republic, and Guatemala; two each in El Salvador, Honduras and thePhilippines; and one each in Trinidad, Aruba, Barbados, and the United States Virgin Islands). PriceSmart alsolicenses nine warehouses in China and one in Saipan, Micronesia.
Headquartered in San Diego, the Company is the largest and fastest-growing operator of warehouse mem-bership clubs in Central America and the Caribbean.
VisionTo become part of our members’ quality of life.
MissionA strategically focused, volume-driven and entrepreneurial membership, merchandise and services leader
delivering quality, value and low prices to the rapidly emerging consumer class in Central America, theCaribbean and Asia.
Table of Contents
Selected Financial Data........................................................................................................................................................4
Management’s Discussion and Analysis.......................................................................................................................5 - 8
Financial Statements.....................................................................................................................................................9 - 30
Market for Common Stock and Related Stockholder Matters........................................................................................31
Directors and Executive Officers of the Company ....................................................................................................32- 34

Financial Highlights
23 Stores in OperationAs of November 30, 2001
Central America # of Stores
Panama 4
Costa Rica 3
Guatemala 3
El Salvador 2
Honduras 2
Caribbean # of Stores
Dominican Republic 3
Trinidad 1
Aruba 1
Barbados 1
U.S. Virgin Islands 1
Asia # of Stores
Philippines 2
Licensees
China 9
Saipan 1
1
Warehouses in Operation
At Fiscal Year EndFY '02 23rd Store Opened November 8, 2001
25
20
15
10
5
01998 1999 2000 2001
2
5
16
22
Net Warehouse Sales
Fiscal Year
500
450
400
350
300
250
200
150
100
50
01998 1999 2000 2001
48
89
292
473
Total Revenues
Fiscal YearExcludes Discontinued Operations
500
400
300
200
100
01998 1999 2000 2001
8498
301
489
Memberships
Fiscal Year
600
500
400
300
200
100
01998 1999 2000 2001
42
148
414
524
Operating Income
Fiscal Year
10
5
0
-5
-10
-15
-201998 1999 2000 2001
-4.4
-12.7 -13.5
+6.6
Selling, General andAdministrative Expenses
Fiscal Year
50%
40%
30%
20%
10%
01998 1999 2000 2001
33.828.1
17.814.9
23 Stores in OperationAs of November 30, 2001
Central America # of Stores
Panama 4
Costa Rica 3
Guatemala 3
El Salvador 2
Honduras 2
Caribbean # of Stores
Dominican Republic 3
Trinidad 1
Aruba 1
Barbados 1
U.S. Virgin Islands 1
Asia # of Stores
Philippines 2
Licensees
China 9
Saipan 1

2
To Our Stockholders
Fiscal 2001 was an important year for our Company. We continued to grow rapidly by opening six newwarehouse clubs in existing and new markets, and we achieved our key goal of profitability. We fur-thered our position as the largest and fastest growing retailer in the Central American and the Caribbeanregions by opening our third stores in the Dominican Republic and Guatemala and our first stores inAruba, St. Thomas and Barbados. We are also quickly moving to establish a prominent position in thePhilippines, with our first store opening during fiscal 2001 and our second location opening in the firstquarter of fiscal 2002. In just over two and a half years, we have opened 21 new warehouse club stores,taking the Company from two owned and operated stores in one country to 23 owned and operatedstores in 11 countries. We believe we have validated the portability of our model. We also have ninelicensee-operated stores in China and Saipan. We closed the fiscal year with 524,000 membershipaccounts, up from 414,000 at the end of last year. We are building a solid, sustainable and growing busi-ness that we believe has significant growth potential for years to come. We are pleased with our accom-plishments for the year, and are also proud to be a part of our members’ “quality of life”.
At the beginning of fiscal 2001, our Company goals were to increase revenues to $500 million, opensix stores and transition the Company to profitability. For the year, we had revenues of $489 million, weopened six stores and, most importantly, we made a profit.
Our operating results for the fiscal year ended August 31, 2001 were impressive, particularly for ayoung and fast growing company. Annual revenues from our warehouse operations increased to $489million representing a 63% increase from $301 million in the previous year. We recorded a profit fromoperations for the first time, posting operating income of $6.6 million in fiscal year 2001 compared to anoperating loss of $13.5 million in the prior year. The leverage from strong store level economics andstrict expense controls allowed the Company to transition to profitability, ending the year with netincome of $3.4 million, or $0.51 per share compared to a loss of $5.4 million, or $1.01 per share last year.
For fiscal 2002, we are aiming to increase revenues to $650 million and open up to six new stores. InNovember 2001, we opened a new store in the Philippines, and we will soon open our second store inTrinidad, bringing our store count to 24 as of December 2001. We plan to open our first store in Guamand our third store in the Philippines by spring 2002. As a result of the worldwide economic slowdownand uncertainties subsequent to the tragic events of September 11, we may limit store openings to fourthis fiscal year and expect to make this decision by January 2002. We are pleased that as of the date ofthis letter, both sales and earnings have been running ahead of plan. Sales in our Caribbean storesremain as strong as sales in our Central American stores despite a slowdown in tourism. Our stores inthe Philippines are also performing well. Whether we open four or six new stores this fiscal year, weremain optimistic about achieving our revenue forecast of $650 million for the year. Looking furtherahead, we are aiming to reach $1.0 billion in annualized revenue two years from now.
Major financing projects for stores in Central America and the Caribbean with the InternationalFinance Corporation (IFC) and Overseas Private Investment Corporation (OPIC) were completed this pastyear, providing PriceSmart with access to longer term, lower cost financing generally unavailable inemerging markets.
Towards the end of fiscal 2001, we increased our ownership in our Trinidad joint venture from 62.5%to 90% and entered into a joint venture agreement to open two stores in Jamaica. Substantial improve-ments were also made during fiscal 2001 in the Company’s logistics and distribution system, which webelieve is now a "world class" system capable of simultaneously moving product efficiently and accu-rately through numerous different countries. We also significantly reduced shrink costs to under 0.4% ofsales during fiscal 2001.

3
The combination of our improved buying ability, inventory controls and increased revenues fromancillary businesses, allowed the Company to increase gross margins to 17.6% of sales in fiscal 2001from 15.1% the previous year. Through expense controls and sales leverage, we reduced selling, general and administrative costs to 14.9% of sales in fiscal 2001 from 17.8% in fiscal 2000. We continueto make expense improvement a priority as our stores mature, and we expect to further reduce ourSG&A expenses as a percent of sales as we grow.
We also take pride in noting that we quickly responded to the earthquakes in El Salvador in January2001 by providing support for the victims, opening our store to the public and reducing prices on basiccommodities. The community expressed its thanks and loyalty by helping us grow sales and marketshare after this tragic event.
PriceSmart has dramatically altered and improved the retail landscape throughout Central Americaand the Caribbean, and we plan to do the same in the Philippines during the next few years. We believethat we have developed a winning formula capable of successfully operating in many more marketsthroughout the world. We are enthusiastic about our Company’s business prospects, and on behalf ofPriceSmart’s management, employees and Board of Directors, we thank our shareholders for their con-tinued support and confidence.
Gil PartidaPresident andChief Executive Officer
November 30, 2001San Diego, California
Robert PriceChairman

4
Selected Financial Data (In Thousands, Except Per Share Data)
The following table sets forth selected consolidated financial data of the Company for the five fiscal yearsended August 31, 2001.
Selected Consolidated Financial Data (Amounts in Thousands, Except Earnings (Loss) Per Share)
Fiscal Years Ended August 31 (1)
2001 2000 1999 1998 1997 (2)
Income Statement Data:Net warehouse sales $ 473,127 $ 292,013 $ 89,184 $ 48,287 $ 21,750 Export sales 500 421 6,773 32,813 37,292 Membership fees and other 15,323 8,216 2,008 2,720 3,139 Travel and auto programs - 3,965 10,907 13,368 12,194
Total revenues 488,950 304,615 108,872 97,188 74,375
Cost of goods sold 405,721 256,652 84,638 74,684 55,947 Selling, general and administrative (3) 70,776 53,549 32,021 26,421 25,993 Goodwill amortization 998 223 - - -Preopening expenses 4,866 7,681 4,949 433 614
Operating income (loss) 6,589 (13,490) (12,736) (4,350) (8,179) Net interest and other income (expense) (4) (3,442) 7,927 9,034 7,492 1,237 Income (loss) before provision (benefit)
for income taxes and extraordinary items 3,147 (5,563) (3,702) 3,142 (6,942)
Net income (loss) $ 3,384 $ (5,444) $ (3,892) $ 3,028 $ (24,843)
Earnings (loss) per share:Basic (5) $ 0.54 $ (1.01) $ (0.76) $ 0.51 $ (4.20)Diluted (5) $ 0.51 $ (1.01) $ (0.76) $ 0.50 $ (4.20)
Balance Sheet Data:Cash and cash equivalents $ 26,280 $ 24,503 $ 14,957 $ 5,639 $ 58,383 Marketable securities - 5,482 17,627 56,133 -Total assets 324,080 261,400 152,074 124,576 125,885 Long-term debt 79,303 50,532 7,787 - -Stockholders' equity (6) 130,110 131,683 93,861 103,081 107,172
(1) Effective September 1, 1997, the Company changed its 52/53 week fiscal year which ends on the Sunday nearest August 31 to afiscal year end of August 31. For ease of presentation, all fiscal years in this report are referred to as having ended on August 31.
(2) Prior to fiscal year 1998, the Company operated as certain subsidiaries of Price Enterprises, Inc. ("PEI"). Accordingly, the finan-cial data of the Company prior to fiscal year 1998 has been prepared as though the Company had been a stand-alone business.
(3) Prior to fiscal year 1998, PEI provided administrative services to the Company. The amount allocated to theCompany for corporate administrative expenses for fiscal year 1997 was $1,065.
(4) Net interest and other income (expense) includes interest income, gains and losses on sale of assets, interest on bank bor-rowings and minority interest of shareholders in joint venture businesses.
(5) For fiscal year 1997, loss per share is based on the 5,908,235 shares issued in connection with the distribution (see Note 2).
(6) Prior to fiscal year 1998, stockholders' equity represents the net assets transferred and the earnings of the businesses andassets comprising PriceSmart, Inc. on a historical basis.

5
Management’s Discussion and Analysis of Financial Condition and Results of Operations
This Annual Report contains forward-looking statements concerning the Company's anticipated future rev-enues and earnings, adequacy of future cash flow and related matters. These forward-looking statementsinclude, but are not limited to, statements containing the words "expect", "believe", "will", "may", "should","project", "estimate", "scheduled", and like expressions, and the negative thereof. These statements are subjectto risks and uncertainties that could cause actual results to differ materially from the statements, including for-eign exchange risks, political or economic instability of host countries, and competition, as well as those risksdescribed in the Company's reports filed with the Securities and Exchange Commission, including theCompany's most recent Annual Report on Form 10-K filed pursuant to the Securities and Exchange Act of 1934.
The following discussion and analysis compares the results of operations for each of the three fiscal yearsended August 31, 2001 and should be read in conjunction with the consolidated financial statements and theaccompanying notes included elsewhere in this report.
In fiscal 2001, the Company opened six new US-style membership shopping warehouses operating inCentral America, the Caribbean and Asia, with one each in the Dominican Republic (October 2000), Aruba(March 2001), the US Virgin Islands (May 2001), the Philippines (May 2001), Guatemala (May 2001), andBarbados (August 2001) bringing the total number of warehouses in operation to twenty-two operating ineleven countries as of August 31, 2001. This compares to sixteen warehouses operating in seven countries atthe end of fiscal 2000 and five warehouses operating in four countries at the end of fiscal 1999. Subsequent tofiscal 2001, the Company opened one additional location in the Philippines in November 2001. Also, there werenine warehouse stores in operation licensed to and operated by local business people at the end of fiscal 2001,versus six licensed warehouse stores at the end of fiscal 2000 and four licensed warehouse stores at the endof fiscal 1999.
The Company seeks to establish significant market share in the metropolitan areas of emerging marketcountries by rapidly saturating these areas with second and third stores. Same-store-sales (where at least one-third of the Company’s stores have comparative prior period sales in metropolitan markets that have not hadadditional store openings), representing thirteen of the twenty-two warehouse stores in operation, increased4.8% in fiscal 2001. Same store sales, including stores in metropolitan markets with additional store openings,representing fourteen warehouses, in the past year decreased 5.9%. As of August 31, 2001, the average life ofthe twenty-two warehouses in operation was eighteen months.
Net warehouse sales increased 62% to $473.1 million in fiscal 2001 from $292.0 million in fiscal 2000. Theincrease was primarily a result of the six new warehouses opened throughout fiscal 2001 and a full year ofoperations from eleven new warehouses opened in the prior fiscal year. Net warehouse sales increased 227%to $292.0 million in fiscal 2000 from $89.2 million in fiscal 1999. The increase was primarily a result of elevennew warehouses opened during fiscal 2000 and a full year of operations related to three new warehousesopened in fiscal 1999.
The Company's warehouse gross profit margins (defined as net warehouse sales less associated cost ofgoods sold) for fiscal 2001 were 14.4% compared to 12.3% for fiscal 2000. The increase in gross profit marginsis a result of the Company’s increased purchasing power resulting in lower costs of purchased goods, anincrease in sales penetration of higher margin non-food items, lower shrink costs in fiscal 2001 and the plannedlower margins associated with the rapid expansion in fiscal 2000. The Company's warehouse gross profit mar-gins for fiscal 2000 were 12.3% compared to 12.4% for fiscal 1999. The change between fiscal 2000 and fiscal1999 is primarily a result of anticipated lower margins during the initial entry into a market, which resultedfrom the Company opening eleven new warehouses in fiscal 2000, compared to three in fiscal year 1999.
Export sales to the Company's licensee warehouses in Asia in fiscal 2001 were $500,000 compared to$421,000 and $6.8 million for fiscal years 2000 and 1999, respectively. The change between years is a factor ofthe number of licensees in operation and associated export sales. The Company anticipates export sales to itslicensees to be $1.5 million in fiscal 2002.
The Company's export sales gross margin for fiscal 2001 was 3.6% compared to 3.8% and 3.2% for fiscalyears 2000 and 1999, respectively. The gross margin percentages on export sales are based on the varying

6
agreements the Company has with its licensees and the gross margin amount that the Company can earnunder these agreements.
Membership fees and other, including royalties earned from licensees, increased 87% to $15.3 million in fis-cal 2001 from $8.2 million in fiscal 2000. Membership fees (which include rental income, advertising revenuesand vendor promotions) increased to $14.3 million, or 3.0% of net warehouse sales, from $7.4 million, or 2.5%of net warehouse sales, in fiscal year 2000. The increase was a result of the six new warehouses opened in fis-cal 2001, which resulted in an increase in the total memberships to 524,000 at the end of fiscal 2001 from414,000 at the end of fiscal 2000, and increases in rental and advertising revenues between the periods pre-sented. Royalties increased to $1.0 million in fiscal 2001 from $840,000 in fiscal 2000. The increase in royaltieswas primarily due to the increase in number of licensees in fiscal 2001 compared with fiscal 2000. Membershipfees and other, including royalties earned from licensees, increased 309% to $8.2 million in fiscal 2000 from$2.0 million in fiscal 1999. Membership fees (which include rental income, advertising revenues and vendorpromotions) increased to $7.4 million, or 2.5% of net warehouse sales, from $1.3 million, or 1.5% of net ware-house sales, in fiscal year 1999. The increase was a result of the eleven new warehouses opened in fiscal 2000,which resulted in an increase in the total memberships to 414,000 at the end of fiscal 2000 from 148,000 at theend of fiscal 1999. Royalties increased to $840,000 in fiscal 2000 from $674,000 in fiscal 1999. The increase inroyalties was primarily due to the increase in number of licensees in fiscal 2000 compared with fiscal 1999.
The Company sold its travel program in March 2000 (fiscal 2000) and its auto referral program in March 1999(fiscal 1999), accounting for the change in revenue for the periods presented.
Warehouse operating expenses increased to $53.2 million, or 11.2% of net warehouse sales, for fiscal 2001from $34.1 million, or 11.7% of net warehouse sales, for fiscal 2000. The increase in warehouse operatingexpenses is attributable to the six additional warehouses opened in fiscal 2001. The decrease in warehouseoperating expenses as a percentage of net warehouse sales in fiscal 2001 is attributable to the leveraging ofcentralized warehouse costs over additional warehouses. Warehouse operating expenses increased to $34.1million, or 11.7% of net warehouse sales, for fiscal 2000 from $9.6 million, or 10.8% of net warehouse sales, forfiscal 1999. The increase in warehouse operating expenses is attributable to the eleven additional warehousesopened in fiscal 2000. The increase in warehouse operating expenses as a percentage of net warehouse salesis primarily attributable to higher costs realized in the first year of operations of the eleven warehouses openedin fiscal 2000, and from cannibalization of sales from additional locations operating in the same metropolitanmarkets.
General and administrative expenses decreased to $17.6 million, or 3.7% of net warehouse sales, for fiscal2001 from $17.9 million, or 6.1% of net warehouse sales, for fiscal 2000, resulting primarily from operating costreduction initiatives. As a percentage of net warehouse sales, general and administrative expenses declined infiscal 2001 due to sales leverage from additional warehouse openings in fiscal 2001 and 2000. General andadministrative expenses increased to $17.9 million, or 6.1% of net warehouse sales, for fiscal 2000 from $15.5million, or 17.3% of net warehouse sales, for fiscal 1999. As a percentage of net warehouse sales, general andadministrative expenses declined in fiscal 2000 due to sales leverage from the additional warehouse openingsin fiscal 2000 and 1999.
Travel and auto selling, general and administrative expenses represent the respective operating expensesincurred by both the travel and auto programs. The travel program was sold in March 2000 (fiscal 2000) andthe auto referral program was sold in April 1999 (fiscal 1999), accounting for the change between the periodspresented.
Pre-opening expenses, which represent expenses incurred before a warehouse store is in operation,decreased to $4.9 million in fiscal 2001 from $7.7 million in fiscal 2000 and remained flat compared to fiscal1999. The changes between the periods presented are a result of opening six, eleven and three new ware-houses in fiscal 2001, 2000 and 1999, respectively.
Interest income reflects earnings on marketable securities, cash and cash equivalent balances, City Notes(see "Notes to Consolidated Financial Statements") and certain secured notes receivable from buyers of for-merly owned properties. Interest income decreased to $3.2 million in fiscal 2001 from $3.9 million and $5.3 mil-lion in fiscal 2000 and 1999, respectively. The change in interest income is due to the change in amounts

7
between interest-bearing instruments held by the Company between the periods presented and the interestrate earned on those instruments.
Interest expense primarily reflects borrowings by the Company's majority or wholly owned foreign sub-sidiaries to finance capital requirements of new warehouses, and was $7.7 million (net of capitalized interestof $730,000) for fiscal 2001 compared with $2.9 million (net of capitalized interest of $891,000) and $143,000 infiscal 2000 and 1999, respectively. The increases in interest expense are a result of increased borrowings bythe Company to finance the additional warehouses opened during each of the periods presented.
In fiscal 2001, the Company sold excess real estate properties owned by its wholly owned foreign sub-sidiaries in the Dominican Republic, Costa Rica and Panama, and its majority owned subsidiary in Trinidad. Thesale of the excess land resulted in a gain of $2.0 million, of which the Company’s share was $1.5 million.
During fiscal 2000, the Company sold its travel program and City Notes for $1.5 million and $22.5 million,respectively. The Company recognized gains arising from these transactions of $1.1 million and $3.9 millionfor the travel program and City Notes, respectively. In fiscal 1999, the Company sold its auto referral programand real estate properties resulting in gains of $798,000 and $1.8 million, respectively.
During fiscal 2001, the Company recognized foreign net deferred tax assets of $2,238,000 as a result of tran-sitioning most of the Company’s foreign operations to profitability in fiscal 2001. The Company also incurredcurrent income tax expense of $1,652,000 for a net tax benefit of $586,000.
Liquidity And Capital Resources
The Company's primary capital requirements are the financing of land, construction and equipment costsassociated with new warehouse stores, plus the cost of preopening and working capital requirements.
For fiscal 2002, the Company’s current intention is to spend an aggregate between $30 million to $44 mil-lion for land, construction and equipment for four to six new warehouses (one of which opened subsequent tothe fiscal year-end). Actual capital expenditures for new warehouse locations and operations may vary fromestimated amounts depending on the number of new warehouses actually opened, business conditions andother risks and uncertainties to which the Company and its businesses are subject. The Company, primarilythrough its foreign subsidiaries, intends to increase bank borrowings by $20 million to $27 million during fis-cal 2002, depending on the number of stores opened, and to use these proceeds, as well as excess cash andcash generated from existing operations, to finance these expenditures.
On April 5, 2001, the Company repurchased 242,144 shares of its common stock for an aggregate of approx-imately $11.4 million in cash. The Company repurchased these shares pursuant to its obligations under theStock Purchase Agreement, as amended, relating to the Company's acquisition in March 2000 of the 49%minority interest in its Panamanian subsidiaries which previously had been owned by BB&M InternationalTrading Group ("BB&M"). In exchange for BB&M's 49% interest, the Company issued to BB&M's principals306,748 shares of the Company's common stock and agreed to redeem the shares issued to BB&M at a priceof $46.86 per share following the one-year anniversary of the completion of the acquisition upon the requestof BB&M's principals. The Company has agreed to redeem the remaining 64,604 shares following the secondanniversary of the completion of the acquisition at the price of $46.86 per share upon the holders' request.
In April 2001, the Company sold 67,700 shares of common stock previously held as treasury stock in a pri-vate placement for $39.00 per share for total proceeds of approximately $2.6 million.
The Company believes that borrowings under its current and future credit facilities, together with its othersources of liquidity, will be sufficient to meet its working capital and capital expenditure requirements for theforeseeable future. However, if such sources of liquidity are insufficient to satisfy the Company's liquidityrequirements, the Company may need to sell equity or debt securities, obtain additional credit facilities orreduce the number of anticipated warehouse openings. Furthermore, the Company has and will continue toconsider sources of capital, including the sale of equity or debt securities to strengthen its financial positionand liquidity. There can be no assurance that such financing alternatives will be available under favorableterms, if at all.

8
Seasonality
Historically, the Company's merchandising businesses have experienced holiday retail seasonality in theirmarkets. In addition to seasonal fluctuations, the Company's operating results fluctuate quarter-to-quarter asa result of economic and political events in markets served by the Company, the timing of holidays, weather,timing of shipments, product mix, and currency effects on the cost of US-sourced products which may makethese products more expensive in local currencies and less affordable. Because of such fluctuations, the resultsof operations of any quarter are not indicative of the results that may be achieved for a full fiscal year or anyfuture quarter. In addition, there can be no assurance that the Company's future results will be consistent withpast results or the projections of securities analysts.
Quantitative And Qualitative Disclosures About Market Risk
The Company, through its majority or wholly owned subsidiaries, conducts foreign operations primarily inCentral America, the Caribbean and Asia, and as such is subject to both economic and political instabilities thatcause volatility in foreign currency exchange rates or weak economic conditions. At the end of fiscal 2001, theCompany had a total of twenty-two warehouses operating in eleven foreign countries. Fifteen of the twenty-two warehouses operate in foreign currencies other than the US dollar. For fiscal 2001, 70% of the Company'snet warehouse sales were in foreign currencies.
The Company plans to enter into additional foreign countries in the future, which may involve similar eco-nomic and political risks as well as challenges that are different from those currently encountered by theCompany. The Company believes that because its present operations and expansion plans involve numerouscountries and currencies, the effect from any one-currency devaluation may not significantly impact the over-all financial or operating results of the Company. However, there can be no assurance that the Company willnot experience a materially adverse effect on the Company's business, financial condition, operating results,cash flow or liquidity, as a result of the economic and political risks of conducting an international merchan-dising business.
In fiscal 2001, the foreign currency translation adjustment for the Company's non-US denominated majori-ty or wholly owned subsidiaries operating in Central America, the Caribbean and Asia increased to $962,000from $633,000 and $245,000 at the end of fiscal 2000 and fiscal 1999, respectively. Foreign currencies in mostof the countries where the Company operates have historically devalued against the US dollar and are expect-ed to continue to devalue. Managing foreign exchange is critical for operating successfully in these marketsand the Company manages its risks at times by hedging currencies through Non Deliverable ForwardExchange Contracts (NDF). As of August 31, 2001, the Company had $2.0 million in NDFs outstanding. As thereis no formal contemporaneous documentation for NDFs and no physical exchange of currency occurs at matu-rity (only the resulting gain or loss), they are not reflected on the balance sheet. If the NDFs were recordedbased on their fair values, the effect would be immaterial. The Company may continue to purchase NDFs inthe future to mitigate foreign exchange losses, but due to the volatility and lack of derivative financial instru-ments in the countries the Company operates, significant risk from unexpected devaluation of local currenciesexist. Foreign exchange transaction losses realized, which are included as a part of the costs of goods sold inthe consolidated statements of operations, for fiscal 2001, fiscal 2000 and fiscal 1999 (including the cost of theNDFs) were $718,000, $1.3 million and $538,000, respectively.
The Company is exposed to changes in interest rates on various bank loan facilities. A hypothetical 100basis point adverse change in interest rates along the entire interest rate yield curve would adversely affect theCompany's pretax net income by approximately $850,000.

9
Financial Statements PriceSmart, Inc.Index To Financial Statements
Report of Independent Auditors...........................................................................................................................10
Consolidated Balance Sheets as of August 31, 2001 and 2000.........................................................................11
Consolidated Statements of Operations for the three years endedAugust 31, 2001................................................................................................................................................12
Consolidated Statements of Stockholders' Equity for the three yearsended August 31, 2001....................................................................................................................................13
Consolidated Statements of Cash Flows for the three years endedAugust 31, 2001................................................................................................................................................14
Notes to Consolidated Financial Statements......................................................................................................15

10
Report of Ernst & Young LLP, Independent Auditors
The Board of Directors and StockholdersPriceSmart, Inc.
We have audited the accompanying consolidated balance sheets of PriceSmart, Inc. as of August 31, 2001and 2000 and the related consolidated statements of operations, stockholders' equity and cash flows for eachof the three years in the period ended August 31, 2001. These financial statements are the responsibility ofthe Company's management. Our responsibility is to express an opinion on these financial statements basedon our audits.
We conducted our audits in accordance with auditing standards generally accepted in the United States.Those standards require that we plan and perform the audit to obtain reasonable assurance about whetherthe financial statements are free of material misstatement. An audit includes examining, on a test basis, evi-dence supporting the amounts and disclosures in the financial statements. An audit also includes assessingthe accounting principles used and significant estimates made by management, as well as evaluating theoverall financial statement presentation. We believe that our audits provide a reasonable basis for our opin-ion.
In our opinion, the financial statements referred to above present fairly, in all material respects, the con-solidated financial position of PriceSmart, Inc. at August 31, 2001 and 2000 and the consolidated results of itsoperations and its cash flows for each of the three years in the period ended August 31, 2001 in conformitywith accounting principles generally accepted in the United States.
San Diego, CaliforniaNovember 2, 2001

11
PriceSmart, Inc.Consolidated Balance Sheets(Amounts in Thousands, Except Share Data)
August 31,
2001 2000AssetsCurrent assets
Cash and cash equivalents $ 26,280 $ 24,503 Marketable securities - 5,482 Receivables, net of allowance for doubtful accounts of
$58 and $41 in 2001 and 2000, respectively 6,134 1,732 Merchandise inventories 71,297 54,949 Prepaid expenses and other current assets 6,249 5,286 Properties held for sale 726 1,652
Total current assets 110,686 93,604
Restricted cash 24,207 12,698Property and equipment, net 163,200 128,985 Goodwill, net 20,128 19,178 Deferred tax asset 2,357 119Note receivable and other 3,502 6,816
Total Assets $ 324,080 $ 261,400
Liabilities and Stockholders‘ EquityCurrent liabilities:
Short-term borrowings $ 22,205 $ 9,493 Accounts payable 60,789 43,312 Accrued salaries and benefits 3,551 3,086 Deferred membership income 4,371 3,892 Income tax payable 1,643 -Other accrued expenses 7,073 5,946 Long-term debt, current portion 6,842 8,773
Total current liabilities 106,474 74,502
Long-term debt, less current portion 79,303 50,532
Total liabilities 185,777 125,034
Minority interest 8,193 4,683
Commitments and contingencies - -
Stockholders' equity:Preferred stock, $.0001 par value, 2,000,000 shares
authorized, none issued - -Common stock, $.0001 par value, 15,000,000 shares
authorized, 6,928,690 and 6,812,485 sharesissued and outstanding in 2001 and 2000, respectively 1 1
Additional paid-in capital 150,906 148,970 Notes receivable from stockholders (769) (1,000) Deferred compensation (307) (679) Accumulated other comprehensive loss (962) (695) Accumulated deficit (2,924) (6,308) Less: Treasury stock at cost
697,167 and 555,093 sharesin 2001 and 2000, respectively (15,835) (8,606)
Total stockholders' equity 130,110 131,683
Total Liabilities and Stockholders‘ Equity $ 324,080 $ 261,400
See accompanying notes.

12
PriceSmart, Inc.Consolidated Statements of Operations(Amounts in Thousands, Except Per Share Data)
Years Ended August 31,
2001 2000 1999Revenues:
Sales:Net warehouse $ 473,127 $ 292,013 $ 89,184 Export 500 421 6,773
Membership fees and other 15,323 8,216 2,008Travel and auto programs - 3,965 10,907
Total revenues 488,950 304,615 108,872
Expenses:Cost of goods sold:
Net warehouse 405,239 256,247 78,081 Export 482 405 6,557
Selling, general and administrative:Warehouse operations 53,215 34,133 9,588 General and administrative 17,561 17,896 15,469
Travel and auto expenses - 1,520 6,964 Goodwill amortization 998 223 -Preopening expenses 4,866 7,681 4,949
Total expenses 482,361 318,105 121,608
Operating income (loss) 6,589 (13,490) (12,736)
Other income (expense):Interest income 3,240 3,891 5,257 Interest expense (7,721) (2,866) (143) Other income (expense) (76) (61) 452Gain on sale:
Travel (related party) and auto - 1,133 798City Notes (related party) - 3,948 -Real estate 1,955 - 1,757
Minority interest (840) 1,882 913Total other income (expense) (3,442) 7,927 9,034
Income (loss) before provision (benefit)for income taxes and extraordinary items 3,147 (5,563) (3,702)
Provision (benefit) for income taxes (586) (119) 190Income (loss) before extraordinary items 3,733 (5,444) (3,892)
Extraordinary items, net of tax:Earthquake (120) - -Debt restructuring (229) - -
Net income (loss) $ 3,384 $ (5,444) $ (3,892)
Basic earnings (loss) per share:Income (loss) before extraordinary Items $ 0.60 $ (1.01) $ (0.76)Extraordinary items $ (0.06) $ - $ -
Net income (loss) $ 0.54 $ (1.01) $ (0.76)
Diluted earnings (loss) per share:Income (loss) before extraordinary items $ 0.56 $ (1.01) $ (0.76)Extraordinary items $ (0.05) $ - $ -
Net income (loss) $ 0.51 $ (1.01) $ (0.76)
Shares used in per share computation:Basic 6,254 5,386 5,120
Diluted 6,658 5,386 5,120
See accompanying notes.

13
PriceSmart, Inc.Consolidated Statements of Stockholders’ EquityFor the Three Years Ended August 31, 2001(Amounts in Thousands)
Balance at August 31, 1998 6,004 $ 1 $ 108,873 $ (697) $ - $ 519 $ 3,028 550 $ (8,643) $ 103,081
Issuance of common stock forcash and notes receivable 16 - 424 (387) - - - - - 37
Exercise of stock options 51 - 585 - - - - - - 585Purchase of treasury stock - - - - - - - 434 (6,605) (6,605)Cancellation of notes receivable
from stockholders (4) - (65) 126 - - - - - 61Payment on notes receivable
from stockholders - - - 8 - - - - - 8Deferred compensation related
to grant of stock options - - 2,355 - (2,355) - - - - -Amortization of deferred compensation - - - - 1,073 - - - - 1,073Compensation expense related to
the issuance of common stock - - 485 - - - - - - 485Retirement of common
stock held in treasury (76) - (1,174) - - - - (76) 1,174 -Net loss - - - - - - (3,892) - - (3,892)Net unrealized loss on
marketable securities - - - - - (727) - - - (727)Translation adjustment - - - - - (245) - - - (245)
Comprehensive loss - - - - - - - - - (4,864)
Balance at August 31, 1999 5,991 1 111,483 (950) (1,282) (453) (864) 908 (14,074) 93,861Issuance of common stock for
cash and notes receivable - - 92 (150) - - - (4) 58 -Exercise of stock options 142 - 1,616 - - - - (17) 265 1,881Issuance of stock in exchange for
minority interest 680 - 35,779 - - - - (332) 5,145 40,924Amortization of deferred compensation - - - - 603 - - - - 603Payment on notes receivable from
stockholders - - - 100 - - - - - 100Net loss - - - - - - (5,444) - - (5,444)Net unrealized gain on
marketable securities - - - - - 146 - - - 146Translation adjustment - - - - - (388) - - - (388)
Comprehensive loss - - - - - - - - - (5,686)
Balance at August 31, 2000 6,813 1 148,970 (1,000) (679) (695) (6,308) 555 (8,606) 131,683 Exercise of stock options 96 - 922 - - - - (32) 646 1,568
Repurchase of common stock – Panama acquisition - - (884) - - - - 242 (9,413) (10,297)
Sale of treasury stock - - 1,103 - - - - (68) 1,538 2,641Issuance of stock in exchange for
minority interest 20 - 795 - - - - - - 795Payment on notes receivables
from stockholders - - - 231 - - - - - 231Amortization of deferred compensation - - - - 372 - - - - 372Net income - - - - - - 3,384 - - 3,384Net unrealized gain on marketable
securities - - - - - 62 - - - 62Translation adjustment - - - - - (329) - - - (329)
Comprehensive income - - - - - - - - - 3,117
Balance at August 31, 2001 6,929 $ 1 $ 150,906 $ (769) $ (307) (962) $ (2,924) 697 $(15,835) $ 130,110
See accompanying notes.
Common stockShares Amount
Additionalpaid-in capital
Notesreceivable from
stockholdersDeferred
compensation
Other c o m p r e h e n s i v e
income(loss)
Retainedearnings(deficit)
Less:treasury stock
at costShares Amount
Total stockholders’
equity

14
PriceSmart, Inc.Consolidated Statements of Cash Flows(Amounts in Thousands) Years Ended August 31,
2001 2000 1999Operating ActivitiesNet income (loss) $ 3,384 $ (5,444) $ (3,892) Adjustments to reconcile net income (loss) to net cash used in operating activities:
Depreciation 9,414 4,610 1,622Goodwill amortization 998 223 -Allowance for doubtful accounts 17 (443) 30Gain on sale of City Notes (related party) - (3,948) -Gain on sale of travel program (related party) - (1,133) -Gain on sale of real estate (1,955) - -Extraordinary loss 349 - -Income tax provision (benefit) (586) (119) 190Minority interest 840 (1,882) (1,096) Compensation expense recognized for stock options 372 603 1,558 Change in operating assets and liabilities:
Restricted cash (11,509) (2,503) (7,191) Accounts receivable and other assets (25,227) (28,729) (18,778) Accounts payable and other liabilities 21,173 24,883 19,721 Other 62 146 (137)
Net cash flows used in operating activities (2,668) (13,736) (7,973)
Investing ActivitiesPurchase of marketable securities - - (44,638) Sale of marketable securities 5,482 12,145 82,417 Additions to property and equipment (45,421) (79,101) (37,156) Payment (disbursement) of notes receivable 3,768 (2,597) 2,027 Proceeds from sale of real estate 4,185 - -Proceeds from sale of City Notes (related party) - 22,534 -Proceeds from sale of travel program (related party) - 1,500 -Proceeds from sale of property held for sale 926 440 2,760 Panama acquisition – repurchase of common stock (11,347) - -
Net cash flows provided by (used in) investing activities (42,407) (45,079) 5,410
Financing ActivitiesProceeds from bank borrowings 75,342 62,653 8,912 Repayment of bank borrowings (35,789) (2,350) (4,200) Contributions by minority interest shareholders 3,188 6,465 14,547 Distributions to minority shareholders - - (1,029) Proceeds from exercise of stock options 1,568 1,881 585Issuance of common stock - - 37Payment on notes receivable from stockholders 231 100 8Sale (purchase) of treasury stock 2,641 - (6,605)Other - - (129)
Net cash flows provided by financing activities 47,181 68,749 12,126
Effect of exchange rate changes on cash and cash equivalents (329) (388) (245)
Net increase in cash and cash equivalents 1,777 9,546 9,318
Cash and cash equivalents at beginning of year 24,503 14,957 5,639
Cash and cash equivalents at end of year $ 26,280 $ 24,503 $ 14,957
Supplemental disclosure of cash flow informationCash paid during the period for:
Interest, net of amounts capitalized $ 6,801 $ 2,324 $ 143 Income taxes $ 1,739 $ 677 $ 129
See accompanying notes.
15
PriceSmart, Inc.Notes to Consolidated Financial Statements
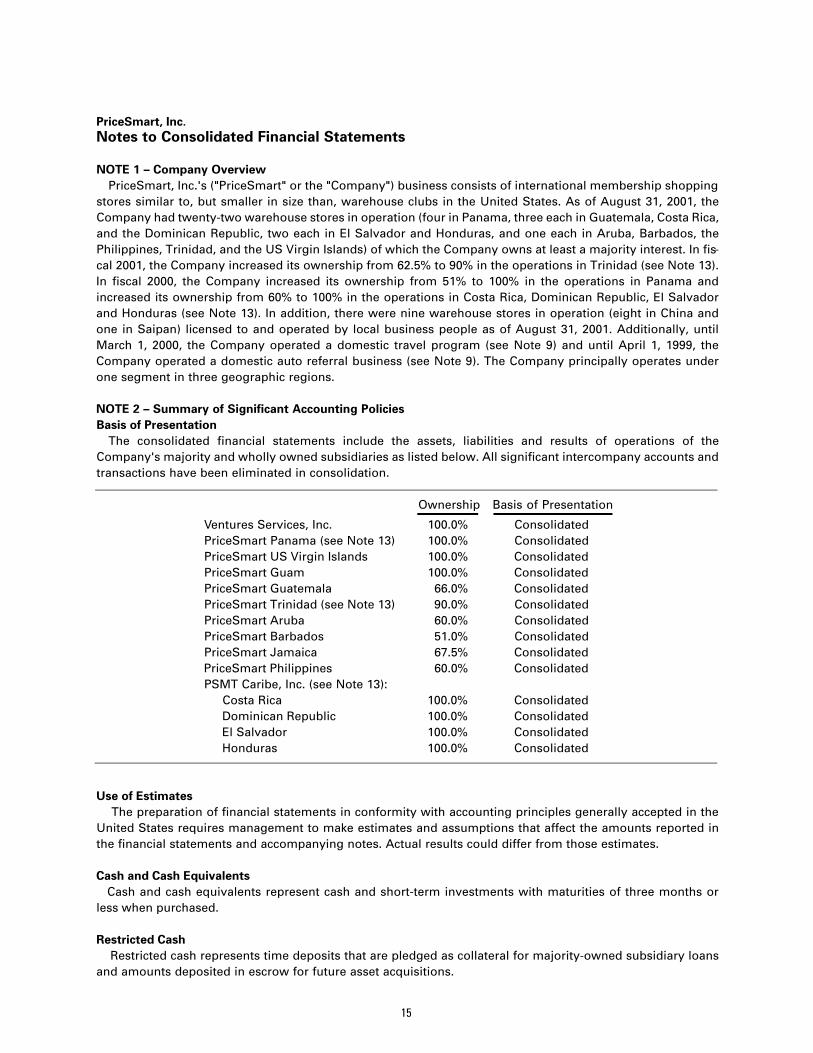
NOTE 1 – Company OverviewPriceSmart, Inc.'s ("PriceSmart" or the "Company") business consists of international membership shopping
stores similar to, but smaller in size than, warehouse clubs in the United States. As of August 31, 2001, theCompany had twenty-two warehouse stores in operation (four in Panama, three each in Guatemala, Costa Rica,and the Dominican Republic, two each in El Salvador and Honduras, and one each in Aruba, Barbados, thePhilippines, Trinidad, and the US Virgin Islands) of which the Company owns at least a majority interest. In fis-cal 2001, the Company increased its ownership from 62.5% to 90% in the operations in Trinidad (see Note 13).In fiscal 2000, the Company increased its ownership from 51% to 100% in the operations in Panama andincreased its ownership from 60% to 100% in the operations in Costa Rica, Dominican Republic, El Salvadorand Honduras (see Note 13). In addition, there were nine warehouse stores in operation (eight in China andone in Saipan) licensed to and operated by local business people as of August 31, 2001. Additionally, untilMarch 1, 2000, the Company operated a domestic travel program (see Note 9) and until April 1, 1999, theCompany operated a domestic auto referral business (see Note 9). The Company principally operates underone segment in three geographic regions.
NOTE 2 – Summary of Significant Accounting PoliciesBasis of Presentation
The consolidated financial statements include the assets, liabilities and results of operations of theCompany's majority and wholly owned subsidiaries as listed below. All significant intercompany accounts andtransactions have been eliminated in consolidation.
Ownership Basis of Presentation
Ventures Services, Inc. 100.0% ConsolidatedPriceSmart Panama (see Note 13) 100.0% ConsolidatedPriceSmart US Virgin Islands 100.0% ConsolidatedPriceSmart Guam 100.0% ConsolidatedPriceSmart Guatemala 66.0% ConsolidatedPriceSmart Trinidad (see Note 13) 90.0% ConsolidatedPriceSmart Aruba 60.0% ConsolidatedPriceSmart Barbados 51.0% ConsolidatedPriceSmart Jamaica 67.5% ConsolidatedPriceSmart Philippines 60.0% ConsolidatedPSMT Caribe, Inc. (see Note 13):
Costa Rica 100.0% ConsolidatedDominican Republic 100.0% ConsolidatedEl Salvador 100.0% ConsolidatedHonduras 100.0% Consolidated
Use of EstimatesThe preparation of financial statements in conformity with accounting principles generally accepted in the
United States requires management to make estimates and assumptions that affect the amounts reported inthe financial statements and accompanying notes. Actual results could differ from those estimates.
Cash and Cash EquivalentsCash and cash equivalents represent cash and short-term investments with maturities of three months or
less when purchased.
Restricted CashRestricted cash represents time deposits that are pledged as collateral for majority-owned subsidiary loans
and amounts deposited in escrow for future asset acquisitions.
16
PriceSmart, Inc.Notes to Consolidated Financial Statements (Continued)
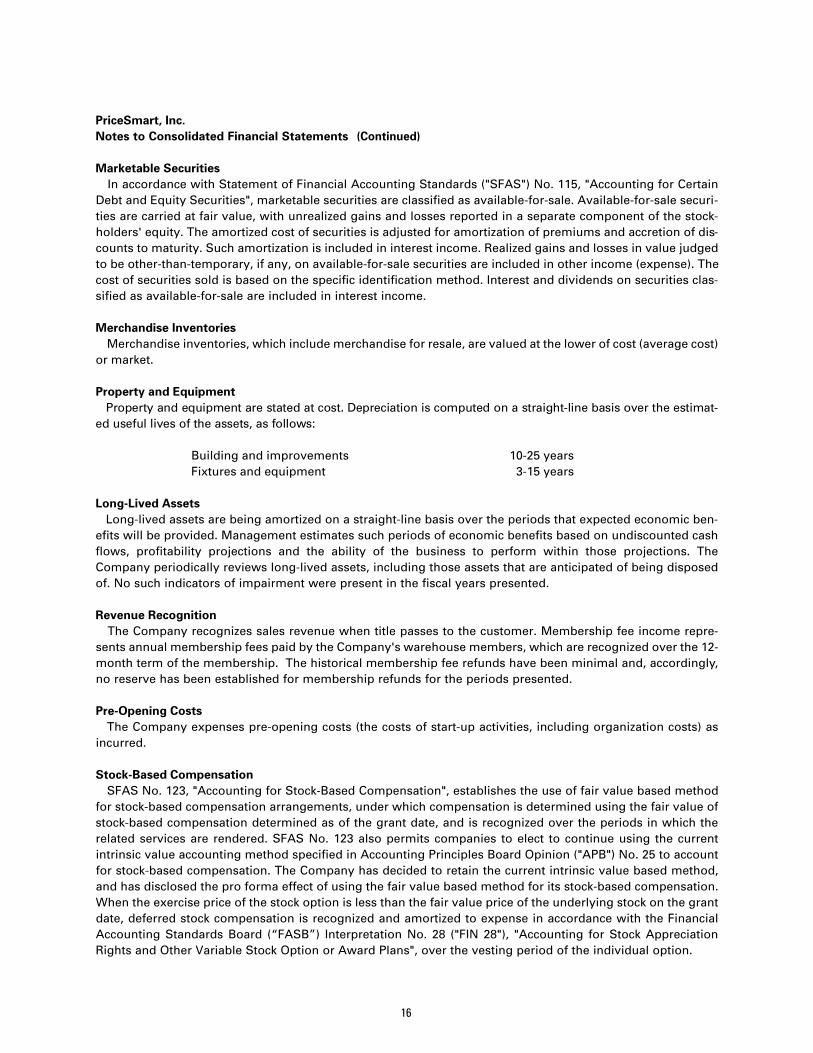
Marketable SecuritiesIn accordance with Statement of Financial Accounting Standards ("SFAS") No. 115, "Accounting for Certain
Debt and Equity Securities", marketable securities are classified as available-for-sale. Available-for-sale securi-ties are carried at fair value, with unrealized gains and losses reported in a separate component of the stock-holders' equity. The amortized cost of securities is adjusted for amortization of premiums and accretion of dis-counts to maturity. Such amortization is included in interest income. Realized gains and losses in value judgedto be other-than-temporary, if any, on available-for-sale securities are included in other income (expense). Thecost of securities sold is based on the specific identification method. Interest and dividends on securities clas-sified as available-for-sale are included in interest income.
Merchandise InventoriesMerchandise inventories, which include merchandise for resale, are valued at the lower of cost (average cost)
or market.
Property and EquipmentProperty and equipment are stated at cost. Depreciation is computed on a straight-line basis over the estimat-
ed useful lives of the assets, as follows:
Building and improvements 10-25 yearsFixtures and equipment 3-15 years
Long-Lived AssetsLong-lived assets are being amortized on a straight-line basis over the periods that expected economic ben-
efits will be provided. Management estimates such periods of economic benefits based on undiscounted cashflows, profitability projections and the ability of the business to perform within those projections. TheCompany periodically reviews long-lived assets, including those assets that are anticipated of being disposedof. No such indicators of impairment were present in the fiscal years presented.
Revenue RecognitionThe Company recognizes sales revenue when title passes to the customer. Membership fee income repre-
sents annual membership fees paid by the Company's warehouse members, which are recognized over the 12-month term of the membership. The historical membership fee refunds have been minimal and, accordingly,no reserve has been established for membership refunds for the periods presented.
Pre-Opening CostsThe Company expenses pre-opening costs (the costs of start-up activities, including organization costs) as
incurred.
Stock-Based CompensationSFAS No. 123, "Accounting for Stock-Based Compensation", establishes the use of fair value based method
for stock-based compensation arrangements, under which compensation is determined using the fair value ofstock-based compensation determined as of the grant date, and is recognized over the periods in which therelated services are rendered. SFAS No. 123 also permits companies to elect to continue using the currentintrinsic value accounting method specified in Accounting Principles Board Opinion ("APB") No. 25 to accountfor stock-based compensation. The Company has decided to retain the current intrinsic value based method,and has disclosed the pro forma effect of using the fair value based method for its stock-based compensation.When the exercise price of the stock option is less than the fair value price of the underlying stock on the grantdate, deferred stock compensation is recognized and amortized to expense in accordance with the FinancialAccounting Standards Board (“FASB”) Interpretation No. 28 ("FIN 28"), "Accounting for Stock AppreciationRights and Other Variable Stock Option or Award Plans", over the vesting period of the individual option.

17
PriceSmart, Inc.Notes to Consolidated Financial Statements (Continued)
The FASB issued Interpretation No. 44 ("FIN 44"), "Accounting of Certain Transactions involving StockCompensation, an interpretation of APB Opinion No. 25" ("APB 25"). FIN 44 clarifies the application of APB 25for: (a) the definition of employee for purposes of applying APB 25; (b) the criteria for determining whether aplan qualifies as a noncompensatory plan; (c) the accounting consequence of various modifications to theterms of a previously fixed stock option or award and (d) the accounting for an exchange of stock compensationawards in a business combination.
FIN 44 was effective July 1, 2000, and did not have a material effect on the Company’s financial position orresults of operations.
Foreign Currency TranslationIn accordance with SFAS No. 52 "Foreign Currency Translation", the assets and liabilities of the Company's
foreign operations are primarily translated to U.S. dollars using the exchange rates at the balance sheet dateand revenues and expenses are translated at average rates prevailing during the period. Related translationadjustments are recorded as a component of accumulated comprehensive income.
Business CombinationsFor business combinations accounted for under the purchase method of accounting, the Company includes
the results of operations of the acquired business from the date of acquisition. Net assets of the acquired busi-ness are recorded at their fair value at the date of acquisition. The excess of the purchase price over the fairvalue of tangible and intangible net assets acquired is included in goodwill in the accompanying consolidatedbalance sheets.
Accounting For Derivative Instruments And Hedging TransactionsIn fiscal 2001, the Company adopted FASB Statements No. 133 ("SFAS 133") pertaining to the accounting for
derivatives and hedging activities. SFAS 133 requires all derivatives to be recorded on the balance sheet at fairvalue and establishes accounting treatment for three types of hedges: hedges of changes in the fair value ofassets, liabilities, or firm commitments; hedges of the variable cash flows of forecasted transactions; andhedges of foreign currency exposures of net investments in foreign operations. The adoption of SFAS 133 didnot have a material impact on the Company’s consolidated financial statements.
Accounting PronouncementsIn June 2001, the FASB issued SFAS No. 141, "Business Combinations", and No. 142, "Goodwill and Other
Intangible Assets", effective for fiscal years beginning after December 15, 2001. Under the new rules, goodwilland intangible assets deemed to have indefinite lives will no longer be amortized but will be subject to annu-al impairment tests in accordance with the statements. Other intangible assets will continue to be amortizedover their useful lives.
The Company will apply the new rules on accounting for goodwill and other intangible assets beginning inthe first quarter of fiscal 2002. Application of the nonamortization provisions of the statement is expected toresult in an increase in net income of approximately $1.1 million per year. During fiscal 2002, the Company willperform the first of the required impairment tests of goodwill and indefinite lived intangible assets as ofFebruary 1, 2002 and has not yet determined what the effect of these tests will be on the earnings and finan-cial position of the Company.
Statement of Financial Accounting Standards No. 144 "Accounting for the Impairment or Disposal of Long-Lived Assets" (SFAS No. 144) was issued in August 2001 and will become effective for the Company beginningin fiscal 2003. Prior period financial statements will not be restated upon the adoption of this statement. Thisstatement establishes a number of rules for the recognition, measurement and display of long-lived assetswhich are impaired and either held for sale or continuing use within the business. In addition, the statementbroadly expands the definition of a discontinued operation to individual reporting units or asset groupings forwhich identifiable cash flows exist.

18
PriceSmart, Inc.Notes to Consolidated Financial Statements (Continued)
ReclassificationsCertain amounts in the prior period consolidated financial statements have been reclassified to conform to
current period presentation.
NOTE 3 – Property and EquipmentProperty and equipment consist of the following (amounts in thousands):
August 31,
2001 2000
Property and Equipment:Land $ 30,232 $ 29,779 Building and improvements 87,305 61,649 Fixtures and equipment 56,135 40,299 Construction in progress 7,396 5,712
181,068 137,439 Less: accumulated depreciation (17,868) (8,454)
Property and equipment, net $ 163,200 $ 128,985
Building includes capitalized interest of $730,000 and $891,000 as of August 31, 2001 and 2000, respectively.
NOTE 4 - Earnings (Loss) Per ShareBasic earnings (loss) per share are computed based on the weighted average shares outstanding in the peri-
od. Diluted earnings (loss) per share is computed based on the weighted average shares outstanding in theperiod and the effect of dilutive securities (options) except where their inclusion is antidilutive (amounts inthousands, except per share data):
Years Ended August 31,
2001 2000 1999Income (loss) before extraordinary loss $ 3,733 $ (5,444) $ (3,892)Extraordinary items (349) - -
Net income (loss) $ 3,384 $ (5,444) $ (3,892)
Determination of shares:Common shares outstanding 6,254 5,386 5,120 Assumed conversion of stock options 404 - -
Diluted average common shares outstanding 6,658 5,386 5,120
Basic earnings (loss) per share:Income (loss) before extraordinary items $ 0.60 $ (1.01) $ (0.76)Extraordinary items $ (0.06) $ - $ -Net income (loss) $ 0.54 $ (1.01) $ (0.76)
Diluted earnings (loss) per share:Income (loss) before extraordinary items $ 0.56 $ (1.01) $ (0.76)Extraordinary items $ (0.05) $ - $ -Net income (loss) $ 0.51 $ (1.01) $ (0.76)

19
PriceSmart, Inc.Notes to Consolidated Financial Statements (Continued)
NOTE 5 - Marketable SecuritiesThe following is a summary of marketable securities classified as available-for-sale as of August 31, 2000
(amounts in thousands):
G r o s s G r o s sA m o r t i z e d U n r e a l i z e d U n r e a l i z e d E s t i m a t e d
C o s t G a i n s L o s s e s Fair Va l u e s2000Commercial company bonds $ 5,544 $ - $ (62) $ 5,482
The fair value of the marketable securities is based on quoted market prices for the same or similar typeissues. For fiscal 2001, there were no gross realized gains or losses. Gross realized losses were $104,000 forfiscal 2000.
NOTE 6 - Retirement PlanPriceSmart offers a defined contribution retirement and 401(k) plans to employees. Employees become eli-
gible for these plans after one year of employment. Enrollment in these plans begins on the first of the monthfollowing the employee's one-year anniversary date. Prior to fiscal 2001, retirement contributions, if any, werebased on a discretionary amount determined by the Board of Directors and were allocated to each participantbased on the relative compensation of the participant, subject to certain limitations. During fiscal 2001, the planwas amended to eliminate discretionary contributions. Profit sharing contributions were $0, $321,000 and$361,000 for fiscal 2001, 2000 and 1999, respectively. The Company makes contributions that are nondiscre-tionary and equal to 100% of the participant’s contribution up to an anuual maximum of 4% of base compen-sation that a participant contributes to the plan. Employer contributions to the 401(k) plan were $178,000,$25,000, and $27,000 during fiscal 2001, 2000 and 1999, respectively.
NOTE 7 - Stock Option Plan and Equity Participation PlanOn August 6, 1997, the Company adopted the 1997 Stock Option Plan of PriceSmart, Inc. (the "1997 Plan")
for the benefit of its eligible employees, consultants and independent directors. Under the 1997 Plan, 700,000shares of the Company's common stock are authorized for issuance. The Compensation Committee of theBoard of Directors administers the 1997 Plan with respect to grants to employees or consultants of theCompany, and the full Company Board of Directors administers the Plan with respect to director options.Options issued under the 1997 Plan typically vest over five years and expire in six years.
In January 1999, the Company adopted the 1998 Equity Participation Plan (the "Equity Plan") for the benefitof its eligible employees, consultants and independent directors. The Equity Plan authorizes 700,000 shares ofthe Company's common stock for issuance. Options issued under the Equity Plan typically vest over five yearsand expire in six years. The Equity Plan also allows the Company to make loans to participants for the purchaseof shares. As of August 31, 2001, outstanding loans were $769,000. The loans are with full recourse and inter-est is payable semi-monthly at 5.85% with the principal due in six years.

20
PriceSmart, Inc.Notes to Consolidated Financial Statements (Continued)
Total stock option activity relating to the 1997 Plan and Equity Plan was as follows:
WeightedAverage
Shares Exercise Price
Balance at August 31, 1998 633,736 $ 13.94Granted 729,185 19.45Exercised (51,253) 11.43Cancelled (116,867) 15.17
Balance at August 31, 1999 1,194,801 $ 17.29Granted 111,900 38.17Exercised (158,891) 12.13Cancelled (114,429) 20.97
Balance at August 31, 2000 1,033,381 $ 19.94Granted 102,770 36.68 Exercised (138,882) 13.68Cancelled (60,346) 28.78
Balance at August 31, 2001 936,923 $ 22.93
As of August 31, 2001, options to purchase 413,819 shares were exercisable and there were 1,026,173shares, of Common Stock reserved for future issuance. The following table summarizes information aboutstock options outstanding at August 31, 2001:
Outstanding Weighted-Average Weighted- Exercisable Weighted-Range of as of Remaining Average as of Average
Exercise Prices 8/31/01 Contractual Life Exercise Price 8/31/01 Exercise Price$ 8.25 - $12.38 4,261 0.3 $ 11.64 4,261 $ 11.64
12.38 - 16.50 393,412 2.6 15.59 226,918 15.62 16.50 - 20.63 247,920 2.6 17.65 135,940 17.57 28.88 - 33.00 49,900 6.0 32.13 - -33.00 - 37.13 27,900 5.7 35.02 2,980 35.0037.13 - 41.25 213,530 4.9 39.06 43,720 38.33
$ 8.25 - $41.25 936,923 3.4 $ 22.93 413,819 $ 18.76
The weighted-average fair value of the stock options granted during 2001 and 2000 were $14.49 and $18.08,respectively.
The Company recorded deferred compensation of $2.4 million in connection with the grants of certain stockoptions to employees during fiscal 1999. A total of 552,291 options were issued at a price lower than marketon date of grant. On date of grant the market price was $20.25 while 81,250 options were issued with an exer-cise price of $16.25, 446,041 options were issued with an exercise price of $15.50 and 25,000 options wereissued with an exercise price of $14.75. The deferred compensation is being amortized ratably over the vest-ing period of the respective options in accordance with FIN 28.

21
PriceSmart, Inc.Notes to Consolidated Financial Statements (Continued)
Pro forma information regarding net income is required by SFAS No. 123, and has been determined as if theCompany had accounted for its employee stock options under the fair value method prescribed by SFAS No. 123.The fair value of each option grant is estimated on the date of grant using the "Black-Scholes" option-pricingmodel with the following weighted average assumptions used for grants in fiscal 2001, 2000, and 1999:
2001 2000 1999
Risk free interest rate 6% 6% 6% Expected life 5 years 6 years 6 years Expected volatility 42.5% 42.6% 42.7% Expected dividend yield 0% 0% 0%
For the purpose of pro forma disclosures, the estimated fair value of the options granted is amortized toexpense over the options' vesting period. The Company's pro forma information for the years ended August31, 2001, 2000, and 1999 were as follows:
2000 1999 1998Pro forma net income (loss)
(in thousands) $ 2,911 $ (6,715) $ (5,072)
Pro forma earnings (loss)per share diluted $ 0.44 $ (1.13) $ (0.99)
The pro forma effect on net income for 2001 and net losses for 2000 and 1999 is not likely to be representa-tive of the pro forma effect on reported earnings in future years.
NOTE 8 - City Notes ReceivableThe City Notes, with interest rates ranging from 8% to 10%, which were sold in April 2000 (see Note 9), rep-
resent amounts loaned to US municipalities and agencies to facilitate real property acquisition and improve-ments. Repayment of the majority of these notes were generally based on that municipality's allocation of salestax revenues generated by retail businesses located on the particular property associated with such City Note.City Note repayments were calculated in accordance with specific revenue sharing agreements, and, under theterms of most City Notes, the unpaid balance of the note was to be forgiven on its maturity date. Interest incomewas recognized based upon the stated interest rates and amounted to $948,000 and $1.7 million for the yearsended August 31, 2000 and 1999, respectively.
NOTE 9 - Sale of AssetsDuring fiscal 2001, the Company, through its majority and wholly owned subsidiaries, sold $2.2 million in
land. The properties were mainly excess land surrounding its warehouses. These sales resulted in a gain ofapproximately $2.0 million.
On April 5, 2000, the Company sold its City Notes for $22.5 million to the Price Family Charitable Trust("Trust"), a California trust (see Note 16). The Company recognized a gain of approximately $3.9 million arisingfrom this transaction.
On March 1, 2000, the Company sold its travel program for $1.5 million to Club-4U, Inc. (see Note 16) underan asset purchase agreement ("purchase agreement"). Under the purchase agreement, Club-4U, Inc. acquiredthe assets primarily used in connection with the travel program, subject to liabilities under the travel programexisting contracts, resulting in a gain of approximately $1.1 million.
In August 1998, the Company entered into an agreement to sell its auto referral business effective November1, 1999. On March 29, 1999, the Company entered into an amendment to the purchase agreement to change theclosing date of the sale to April 1, 1999. The Company operated the auto referral business through March 31,1999. The sale resulted in a net gain of approximately $798,000.
22
PriceSmart, Inc.Notes to Consolidated Financial Statements (Continued)
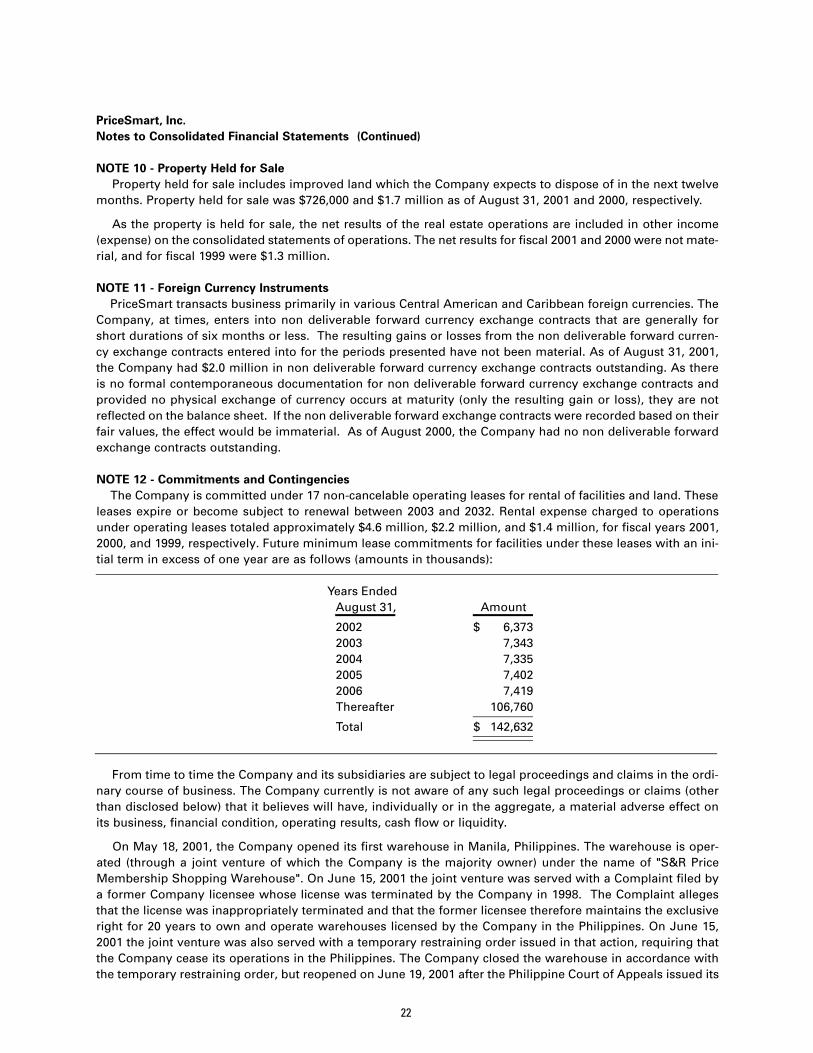
NOTE 10 - Property Held for SaleProperty held for sale includes improved land which the Company expects to dispose of in the next twelve
months. Property held for sale was $726,000 and $1.7 million as of August 31, 2001 and 2000, respectively.
As the property is held for sale, the net results of the real estate operations are included in other income(expense) on the consolidated statements of operations. The net results for fiscal 2001 and 2000 were not mate-rial, and for fiscal 1999 were $1.3 million.
NOTE 11 - Foreign Currency InstrumentsPriceSmart transacts business primarily in various Central American and Caribbean foreign currencies. The
Company, at times, enters into non deliverable forward currency exchange contracts that are generally forshort durations of six months or less. The resulting gains or losses from the non deliverable forward curren-cy exchange contracts entered into for the periods presented have not been material. As of August 31, 2001,the Company had $2.0 million in non deliverable forward currency exchange contracts outstanding. As thereis no formal contemporaneous documentation for non deliverable forward currency exchange contracts andprovided no physical exchange of currency occurs at maturity (only the resulting gain or loss), they are notreflected on the balance sheet. If the non deliverable forward exchange contracts were recorded based on theirfair values, the effect would be immaterial. As of August 2000, the Company had no non deliverable forwardexchange contracts outstanding.
NOTE 12 - Commitments and ContingenciesThe Company is committed under 17 non-cancelable operating leases for rental of facilities and land. These
leases expire or become subject to renewal between 2003 and 2032. Rental expense charged to operationsunder operating leases totaled approximately $4.6 million, $2.2 million, and $1.4 million, for fiscal years 2001,2000, and 1999, respectively. Future minimum lease commitments for facilities under these leases with an ini-tial term in excess of one year are as follows (amounts in thousands):
Years EndedAugust 31, Amount
2002 $ 6,3732003 7,3432004 7,3352005 7,4022006 7,419Thereafter 106,760
Total $ 142,632
From time to time the Company and its subsidiaries are subject to legal proceedings and claims in the ordi-nary course of business. The Company currently is not aware of any such legal proceedings or claims (otherthan disclosed below) that it believes will have, individually or in the aggregate, a material adverse effect onits business, financial condition, operating results, cash flow or liquidity.
On May 18, 2001, the Company opened its first warehouse in Manila, Philippines. The warehouse is oper-ated (through a joint venture of which the Company is the majority owner) under the name of "S&R PriceMembership Shopping Warehouse". On June 15, 2001 the joint venture was served with a Complaint filed bya former Company licensee whose license was terminated by the Company in 1998. The Complaint allegesthat the license was inappropriately terminated and that the former licensee therefore maintains the exclusiveright for 20 years to own and operate warehouses licensed by the Company in the Philippines. On June 15,2001 the joint venture was also served with a temporary restraining order issued in that action, requiring thatthe Company cease its operations in the Philippines. The Company closed the warehouse in accordance withthe temporary restraining order, but reopened on June 19, 2001 after the Philippine Court of Appeals issued its

23
PriceSmart, Inc.Notes to Consolidated Financial Statements (Continued)
own temporary restraining order staying enforcement of the restraining order that had closed the warehouse.The trial court judge subsequently issued an order lifting the restraining order. The parties currently are await-ing a decision from the Court of Appeals on the application, by the Company’s joint venture, to dismiss or abatethe lawsuit pending arbitration in Sydney, Australia, pursuant to a contractual arbitration clause previouslyagreed to by the parties.
The Company maintains that the factual allegations and legal claims asserted in the Complaint are without meritand intends to defend them vigorously. Nevertheless, adverse rulings by the Philippine courts or in the arbitrationproceedings, may suspend or shut-down current operations, delay or prevent future openings in the Philippines.
NOTE 13 - Acquisition of Minority InterestsOn July 24, 2001, the Company entered into agreements to acquire an additional 27.5% interest in the
PriceSmart Trinidad majority owned subsidiary, which previously had been 62.5% owned by the Company (seeNote 16). The purchase price of the 27.5% interest consisted of: (a) 20,115 shares of PriceSmart common stock;(b) a 9% interest in the PriceSmart Barbados subsidiary; (c) a 17.5% interest in the PriceSmart Jamaica sub-sidiary; (d) a promissory note of $314,000; (e) forgiveness of a note receivable due to the Company of $317,000and (f) assumption of remaining contributions of $340,000 shown net of minority interest acquired. As a resultof this additional interest acquired, the Company increased its guarantee proportionately for the outstandinglong term debt related to the Trinidad operations.
On March 27, 2000, the Company entered into an agreement to acquire the remaining interest in thePriceSmart Panama majority owned subsidiary, which previously had been 51% owned by the Company and49% owned by BB&M International Trading Group ("BB&M"), whose principals are several Panamanian busi-nessmen, including Rafael Barcenas, a director of PriceSmart (see Note 16). In exchange for BB&M's 49% inter-est, the Company issued to BB&M's principals 306,748 shares of PriceSmart common stock. As a result of thisacquisition, the Company increased its guarantee for the outstanding long term debt related to the Panamaoperations to 100%.
Under the Stock Purchase Agreement, as amended, related to the Panama Acquisition, the Company agreedto redeem the shares of the Company's common stock issued to BB&M at a price of $46.86 per share follow-ing the one-year anniversary of the completion of the acquisition upon the request of BB&M's principals. OnApril 5, 2001, the Company repurchased 242,144 shares of its common stock, par value $.0001 par value pershare, for an aggregate of approximately $11.4 million in cash, resulting in an incremental goodwill adjustmentof approximately $1.1 million. The Company has agreed to redeem, at its option for cash or additional stock,the remaining 64,604 shares following the second anniversary of the completion of the acquisition at the priceof $46.86 per share upon the holders' request.
On July 7, 2000, the Company agreed to acquire the 40% interest in PSMT Caribe, Inc. not held by theCompany. PSMT Caribe is the holding company formed by PriceSmart and PSC, S.A. (a Panamanian compa-ny with shareholders representing five Central American and Caribbean countries) to hold their respectiveinterests in the PriceSmart membership warehouse clubs operating in Costa Rica, El Salvador, Honduras andthe Dominican Republic. As consideration for the acquisition of the 40% interest, PriceSmart issued to PSC,S.A. 679,500 shares of PriceSmart common stock, half of which were restricted from sale for one year. As aresult of this acquisition, PriceSmart, Inc. has increased its guarantee for the outstanding long term debt relatedto the warehouses operating in Costa Rica, El Salvador, Honduras and the Dominican Republic to 100%.
Results from operations of the acquired minority interests have been included, based on sole ownership, inthe financial results of the Company from the date of the transactions, which occurred on July 24, 2001, March27, 2000 and July 7, 2000 for Trinidad, Panama and PSMT Caribe, Inc., respectively.
The acquisitions were accounted for as purchases under Accounting Principles Board Opinion No. 16 (“APBNo. 16”) and SFAS 141. In accordance with APB No. 16 and SFAS 141, the Company allocated the purchaseprices of the acquisitions based on the fair value of the assets acquired. The excess of the purchase price overthe fair value of assets acquired was $21.3 million and is reflected in goodwill, net of accumulated amortiza-tion of $1.2 million, in the accompanying consolidated balance sheets.

24
PriceSmart, Inc.Notes to Consolidated Financial Statements (Continued)
The components of the purchase prices and allocations, as adjusted, for the acquisitions are as follows(amounts in thousands):
PSMTTrinidad Panama Caribe, Inc. Total
Consideration and acquisition costs:Issuance of common stock $ 795 $ 2,617 $ 27,010 $ 30,422 Cash 314 11,347 - 11,661Forgiveness of note receivable 317 - - 317Interest in PriceSmart ventures 1,651 - - 1,651Acquisition costs 225 35 341 601
Total $ 3,302 $ 13,999 $ 27,351 $ 44,652
Allocation of purchase price:Land $ 423 $ 806 $ 3,093 $ 4,322Minority interest 2,167 6,234 10,580 18,981Goodwill 712 6,959 13,678 21,349
Total $ 3,302 $ 13,999 $ 27,351 $ 44,652
In connection with the acquisition of the Trinidad operations, the allocation of the purchase price is basedon preliminary data and may change when final valuation information is obtained.
The following unaudited pro forma data summarizes the results of operations for the periods presented asif the acquisitions of minority interests had been completed as of September 1, 1998. These pro forma amountsdo not purport to be indicative of the results that would have actually been obtained if the acquisitionsoccurred as of the beginning of the periods presented or that may be obtained in the future (amounts in thou-sands, except per share data).
2000 2000 1999Total revenue $ 488,950 $ 304,615 $ 108,872Operating income (loss) 6,589 (13,490) (12,736) Net income (loss) $ 4,070 $ (7,515) $ (4,341)
Basic earnings (loss) per share $ 0.65 $ (1.40) $ (0.85)
Diluted earnings (loss) per share $ 0.61 $ (1.40) $ (0.85)
NOTE 14 - Income TaxesSignificant components of the income tax provision (benefit) are as follows (amounts in thousands):
Years Ended August 31,
2001 2000 1999Current:
Domestic $ - $ - $ -Foreign 1,652 - 190
Total 1,652 - 190 Deferred:
Domestic (1,448) (2,484) (1,136)Foreign (679) (3,145) 15Valuation Allowance (111) 5,510 1,121
Total (2,238) (119) -
Total provision (benefit) $ (586) $ (119) $ 190

25
PriceSmart, Inc.Notes to Consolidated Financial Statements (Continued)
The reconciliation of income tax computed at the Federal statutory tax rate to the provision (benefit) forincome taxes is as follows (amounts in thousands):
Years Ended August 31,2001 2000 1999
Federal taxes at statutory rates $ 951 $ (1,891) $ (1,259) State taxes, net of Federal benefit 163 (334) (222) Difference in foreign tax rates and permanent items (627) (1,364) 650Increase (decrease) in valuation allowance
for deferred tax assets and other (1,098) 4,055 1,121All other, net 25 (585) (100)
Total provision (benefit) $ (586) $ (119) $ 190
The change in the valuation allowance for fiscal 2001 and fiscal 2000 includes the future tax benefit of stockoption deductions of approximately $987,000 and $1.5 million, respectively, which when recognized will beallocated to additional paid in capital.
Significant components of the Company's deferred tax assets as of August 31, 2001, and 2000 are shownbelow. A valuation allowance of $30.3 million at August 31, 2001, has been recognized to offset the deferredtax assets as realization of such assets, is uncertain (amounts in thousands).
August 31,
2001 2000Deferred tax assets:
Net operating loss carryforward $ 17,267 $ 16,185 Capital loss carryforward 10,137 10,137 International 3,936 3,257Deferred compensation 816 668All other, net 518 507
Total deferred tax assets 32,674 30,754
Deferred tax liabilities:Unrealized gains on marketable securities - (207)
Total deferred tax liabilities - (207)
Valuation allowance (30,317) (30,428)
Net deferred tax assets $ 2,357 $ 119
During fiscal 2001, management reassessed the valuation allowance recorded against net deferred taxassets generated in certain foreign jurisdictions. Based on the operating results of certain foreign entities,management believes it is more likely than not that the Company will realize deferred tax assets. Accordingly,the Company has recognized foreign net deferred tax assets of $2.2 million. As of August 31, 2001, theCompany has Federal and state net operating loss carry-forwards of approximately $46.5 million and $16.6 mil-lion, respectively. The Federal and state tax loss carry forwards will begin expiring in 2001 and 2010, respec-tively, unless previously utilized. In addition, the Company incurred a Federal and state capital loss on the saleof the City Notes in fiscal 2000 totaling $25.4 million. The associated tax loss carryforward will expire in 2006.

26
Pursuant to Section 382 of the Internal Revenue Code, annual use of $11.8 million of the Company's netoperating loss carry forwards will be limited because of cumulative changes in ownership of more than 50%which occurred during 1995. However, the Company does not believe such change will have a material impactupon utilization of these carryforwards.
NOTE 15 - DebtAs of August 31, 2001, the Company had $22.2 million outstanding in short-term bank borrowings as fol-
lows:
In April 2000, the Company, through its Dominican Republic subsidiary, entered into a line of credit for $2.0million, which was due in six months and subsequently renewed for another six months. Interest is payablemonthly at 9% per annum. In June and July 2001, the Company, through its Dominican Republic subsidiary,entered into two separate line of credit facilities of $2.0 million each, both of which are due in six months.Interest on both facilities is payable monthly at 10.5% and 9% per annum, respectively.
In June 2001, the Company, through its joint venture arrangement in Guatemala entered into a line of cred-it for approximately $1.9 million, which is due in twelve months. Interest is payable monthly at 15% per annum.In July 2001, the Company, through its joint venture arrangement in Guatemala, entered into a line of creditfor approximately $2.6 million, which is due in twelve months. Interest is payable monthly at 13% per annum.
In July 2001, the Company, through its Honduras subsidiary, entered into a line of credit for $2.0 million,which is due in six months. Interest is payable monthly at 11% per annum.
In March 2001, the Company, through its El Salvador subsidiary, entered into a line of credit for $1.0 million,which was due in six months and subsequently renewed for another six months. Interest is payable monthlyat 9% per annum. In March 2001, the Company, through its El Salvador subsidiary, entered into a line of cred-it for approximately $1.9 million, which is due in twelve months. Interest is payable monthly at 10% per annum.
In July 2001, the Company, through its Costa Rica subsidiary, entered into a line of credit for $2.0 million,which is due in six months. Interest is payable monthly at 7.75% per annum. In August 2001, the Companythrough its Costa Rica subsidiary, entered into a line of credit for $3.0 million, which is due in six months.Interest is payable monthly and based on the prime rate plus 2% (8.5% at August 31, 2001).
In May 2001, the Company, through its joint venture arrangement in the Philippines, entered into a line ofcredit for approximately $1.5 million, which is due in twelve months. Interest is payable monthly at 12.5% perannum.
As of August 31, 2001, the full amounts were drawn for each of the facilities listed above. Each of the facil-ities is secured by certain assets of the respective subsidiary and $19.8 million of the total are guaranteed bythe Company as of August 31, 2001.
In October 2000, the Company entered into a new line of credit for $10 million, which expires in July 2002.As of August 31, 2001, $314,000 is outstanding and $9.7 million is available under the revolving line of credit.Interest is based on the 30-day dealer commercial paper rate plus 1.65% (5.15% at August 31, 2001) and ispayable monthly.

27
PriceSmart, Inc.Notes to Consolidated Financial Statements (Continued)
Long-term debt consist of the following (amounts in thousands):
August 31,
2001 2000
7.45% Note due October 2004 (six-month LIBOR + 4.0%) $ 4,126 $ 5,255 8.50% Note due June 2005 (prime + 2.0%) - 3,9008.85% Note due May 2005 (six-month LIBOR + 5.4%) - 5,900
14.00% Note due May 2003 3,750 3,75011.25% Note due August 2003 3,750 3,75011.25% Note due May 2004 3,750 -
7.45% Note due September 2010 (six-month LIBOR + 4%) 22,000 -7.45% Note due September 2010 (six-month LIBOR + 4%) 5,000 -
11.50% Note due upon demand 3,750 3,7507.46% Note due December 2004 (three-month LIBOR + 4%) 3,688 4,560 5.45% Note due March 2011 (six-month LIBOR + 2%) 10,000 -8.59% Note due February 2005 (three-month LIBOR + 5.125%) 2,800 3,360 7.96% Note due November 2005 (three-month LIBOR+ 4.5%) - 7,000 9.11% Note due February 2005 (three-month LIBOR + 5.645%) 2,907 3,780 7.46% Note due June 2007 (six-month LIBOR + 4.0%) 5,357 3,000 5.21% Note due October 2005 (three-month LIBOR + 1.75%) 9,417 11,3007.46% Note due March 2011 (three-month LIBOR + 4.0%) 5,850 -
Total 86,145 59,305 Less: current portion 6,842 8,773
Long-term debt $ 79,303 $ 50,532
All of the notes are collateralized by certain land, building, fixtures and equipment of each respective sub-sidiary and guaranteed by the Company, except for approximately $24.0 million and $11.3 million at August31, 2001 and 2000, respectively, which are secured by a collateral deposit for the same amount and is includ-ed in restricted cash on the consolidated balance sheets. In addition, the Company drew on the $3.0 millionthat was available on one note at August 31, 2000.
Annual maturities of long-term debt during the next five years are as follows (amounts in thousands):
Years Ended AnnualAugust 31, Maturity
2002 $ 6,842 2003 16,0302004 10,2182005 14,9872006 5,209Thereafter 32,859
Total $ 86,145
Under the terms of each of its note agreements, the Company must comply with certain covenants whichinclude, among others, current ratio, debt service ratio, interest coverage ratio and leverage ratio. TheCompany is in compliance with most of these covenants and has obtained the necessary waivers from thelenders for the covenants for which the Company is out of compliance.

28
PriceSmart, Inc.Notes to Consolidated Financial Statements (Continued)
NOTE 16 – Related Party TransactionsMr. Edgar Zurcher is a director of the Company and has also been a director and officer of PSMT Caribe, Inc.,
a subsidiary of the Company. Mr. Zurcher is also the managing partner of the law firm Zurcher, Montoya andZurcher, in Costa Rica, which the Company has utilized in legal matters and incurred legal expenses of $20,000during fiscal 2001. Mr. Zurcher is also a director of a vendor from which the Company purchased approxi-mately $258,200 and $227,000 of product during fiscal 2001 and fiscal 2000 respectively. In November 2000,the Company’s subsidiary in the Dominican Republic sold to PSC, S.A., of which Mr. Zurcher is a director andminority shareholder, excess land at its Santo Domingo warehouse for approximately $249,000. In July 2001,the Company agreed to purchase a 5.0% interest in the PriceSmart Trinidad operations from PSC, S.A., inexchange for 7.5% of the Company’s interest in the PriceSmart Jamaica operations and the assumption of$100,000 in remaining equity contributions due to the Trinidad operations. Mr. Zurcher is also Chairman of theBoard of Banca Promerica (Costa Rica), which lent $900,000 as part of a $5.9 million syndicated loan to theCompany in fiscal 2000, of which $700,000 is outstanding as of August 31, 2001. Additionally, Mr. Zurcher is adirector of Banco Promerica (El Salvador), which entered into a $1 million short-term credit facility with theCompany during fiscal 2000 and was repaid in January 2001. During fiscal 2001, the Company entered into a$1.9 million short-term credit facility with Banco Promerica (El Salvador), that is due in March 2002.
Mr. Rafael Barcenas is a director of the Company and is also Vice President of Boyd, Barcenas, S.A., an adver-tising firm in Panama, to which the Company paid approximately $95,000 and $187,000 for services renderedduring fiscal 2001 and fiscal 2000, respectively. In July 2001, the Company agreed to purchase a 2.5% interestin the PriceSmart Trinidad operations from an affiliate of Mr. Barcenas in exchange for 6,490 shares of theCompany’s common stock and assume $40,000 in remaining equity contributions due to the Trinidad opera-tions. In November 2000, the Company sold excess land in Panama through its Panamanian subsidiary inDavid, Panama for approximately $471,000 to an affiliate of Mr. Barcenas. In March 2000, the Companyacquired sole ownership of the PriceSmart Panama business, which previously had been 51% owned by theCompany and 49% owned by BB&M International Trading Group ("BB&M"), whose principals are severalPanamanian businessmen, including Mr. Barcenas. In return for BB&M's 49% interest, PriceSmart conveyed toBB&M's principals 306,748 shares of PriceSmart common stock. In January 2000, the Company sold a five per-cent interest in PSMT Trinidad/Tobago Limited ("PSMT Trinidad"), which operates the Company's Trinidad andTobago business, to an affiliate of Mr. Barcenas for $400,000.
In April 2000 the Company sold its City Notes to the Price Family Charitable Trust ("Trust"), a California trust(see Note 9). Mr. Sol Price (a principal stockholder of PriceSmart, Inc.) and Mr. Robert Price (a principal stock-holder and Chairman of the Board of PriceSmart, Inc.) are trustee and successor trustee, respectively, of theTrust. The Company secured an independent appraisal and marketed the City Notes through a third-party bro-kerage firm before selling the City Notes to the Trust.
In March 2000 the Company sold its travel program to Club-4U, Inc. (see Note 9). Club-4U, Inc. is owned byMr. Sol Price (a principal stockholder of the Company) and its directors include Mr. James Cahill and Mr.Murray Galinson, who are also directors of the Company.
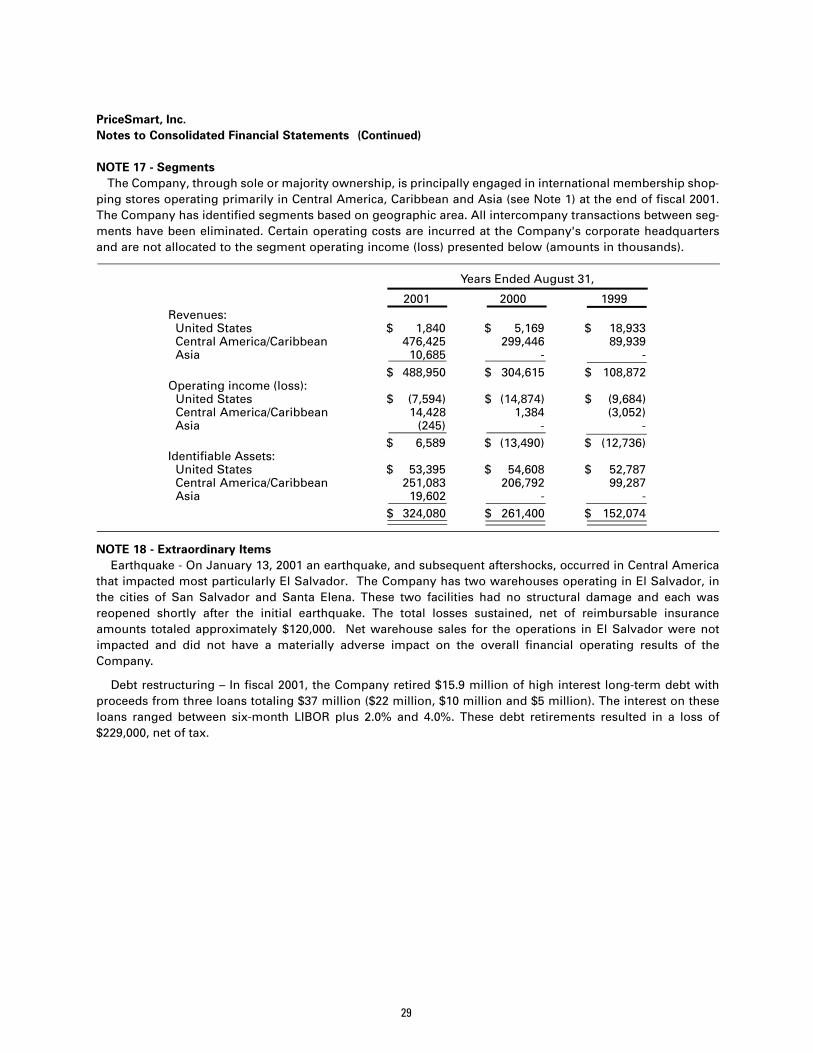
29
PriceSmart, Inc.Notes to Consolidated Financial Statements (Continued)
NOTE 17 - SegmentsThe Company, through sole or majority ownership, is principally engaged in international membership shop-
ping stores operating primarily in Central America, Caribbean and Asia (see Note 1) at the end of fiscal 2001.The Company has identified segments based on geographic area. All intercompany transactions between seg-ments have been eliminated. Certain operating costs are incurred at the Company's corporate headquartersand are not allocated to the segment operating income (loss) presented below (amounts in thousands).
Years Ended August 31,
2001 2000 1999Revenues:
United States $ 1,840 $ 5,169 $ 18,933 Central America/Caribbean 476,425 299,446 89,939 Asia 10,685 - -
$ 488,950 $ 304,615 $ 108,872 Operating income (loss):
United States $ (7,594) $ (14,874) $ (9,684) Central America/Caribbean 14,428 1,384 (3,052) Asia (245) - -
$ 6,589 $ (13,490) $ (12,736) Identifiable Assets:
United States $ 53,395 $ 54,608 $ 52,787Central America/Caribbean 251,083 206,792 99,287 Asia 19,602 - -
$ 324,080 $ 261,400 $ 152,074
NOTE 18 - Extraordinary ItemsEarthquake - On January 13, 2001 an earthquake, and subsequent aftershocks, occurred in Central America
that impacted most particularly El Salvador. The Company has two warehouses operating in El Salvador, inthe cities of San Salvador and Santa Elena. These two facilities had no structural damage and each wasreopened shortly after the initial earthquake. The total losses sustained, net of reimbursable insuranceamounts totaled approximately $120,000. Net warehouse sales for the operations in El Salvador were notimpacted and did not have a materially adverse impact on the overall financial operating results of theCompany.
Debt restructuring – In fiscal 2001, the Company retired $15.9 million of high interest long-term debt withproceeds from three loans totaling $37 million ($22 million, $10 million and $5 million). The interest on theseloans ranged between six-month LIBOR plus 2.0% and 4.0%. These debt retirements resulted in a loss of$229,000, net of tax.

30
PriceSmart, Inc.Notes to Consolidated Financial Statements (Continued)
NOTE 19 - Quarterly Financial Information (Unaudited) (amounts in thousands, except per share data)
3 Months 3 Months 3 Months 3 Months YearEnded Ended Ended Ended Ended
Nov. 30, 2000 Feb 28, 2001 May 31, 2001 Aug. 31, 2001 Aug. 31, 2001
Fiscal 2001Total net sales $ 108,163 $ 124,953 $ 119,660 $ 136,174 $ 488,950Gross profit 17,691 21,118 20,439 23,981 83,229Income (loss) before extraordinary items 846 2,634 (431) 684 3,733Net income (loss) 846 2,514 (431) 455 3,384Basic earnings (loss) per share before
extraordinary items 0.14 0.42 (0.07) 0.11 0.60Basic earnings (loss) per share 0.14 0.40 (0.07) 0.07 0.54Diluted earnings (loss) per share before
extraordinary items 0.13 0.39 (0.07) 0.10 0.56Diluted earnings (loss) per share 0.13 0.38 (0.07) 0.07 0.51
3 Months 3 Months 3 Months 3 Months Year
Ended Ended Ended Ended Ended
Nov. 30, 1999 Feb 29, 2000 May 31, 2000 Aug. 31, 2000 Aug. 31, 2000
Fiscal 2000Total net sales $ 53,715 $ 79,951 $ 74,348 $ 96,601 $ 304,615Gross profit 9,410 13,681 10,864 14,008 47,963Income (loss) before extraordinary items (2,768) 207 1,703 (4,586) (5,444)Net income (loss) (2,768) 207 1,703 (4,586) (5,444)Basic earnings (loss) per share beforeextraordinary items (0.54) 0.04 0.32 (0.77) (1.01)Basic earnings (loss) per share (0.54) 0.04 0.32 (0.77) (1.01)Diluted earnings (loss) per share beforeextraordinary items (0.54) 0.04 0.28 (0.77) (1.01)Diluted earnings (loss) per share (0.54) 0.04 0.28 (0.77) (1.01)

31
PriceSmart, Inc.Market for Common Stock and Related Stockholder Matters
The Company's common stock has been quoted and traded on the NASDAQ National market under thesymbol "PSMT" since September 2, 1997. As of November 9, 2001, there were approximately 430 holders ofrecord of the common stock.
Dates Stock Price
From To High Low2000 Calendar QuartersFirst Quarter 9/1/99 11/30/99 $ 42.750 $ 34.500Second Quarter 12/1/99 2/29/00 48.125 37.375 Third Quarter 3/1/00 5/31/00 49.250 32.688Fourth Quarter 6/1/00 8/31/00 44.000 35.250
2001 Calendar QuartersFirst Quarter 9/1/00 11/30/00 38.938 26.750Second Quarter 12/1/00 2/28/01 36.000 27.000Third Quarter 3/1/01 5/31/01 43.350 30.500Fourth Quarter 6/1/01 8/31/01 44.500 35.080
2002 Calendar QuartersFirst Quarter 9/1/01 11/9/01 43.930 28.750
The Company has never declared a cash dividend on its Common Stock and does not anticipate doing soin the foreseeable future.

32
DirectorsThe directors of the Company and their ages as of November 30, 2001 are as follows:
Name Position with the Company Age
Robert E. Price Chairman of the Board 59Gilbert A. Partida President, Chief Executive Officer and Director 39Rafael E. Barcenas Director 57James F. Cahill Director 46Murray L. Galinson Director 64Katherine L. Hensley Director 64Leon C. Janks Director 52Lawrence B. Krause Director 71Jack McGrory Director 52Edgar A. Zurcher Director 51
Robert E. Price has been Chairman of the Board of the Company since July 1994 and served as President andChief Executive Officer of the Company from July 1994 until January 1998. Mr. Price also served as Chairmanof the Board of Price Enterprises, Inc. ("PEI") from July 1994 until November 1999 and was President and ChiefExecutive Officer of PEI from July 1994 until September 1997. Mr. Price was Chairman of the Board ofPrice/Costco, Inc. ("Costco") from October 1993 to December 1994. From 1976 to October 1993, he was ChiefExecutive Officer and a director of The Price Company ("TPC"). Mr. Price served as Chairman of the Board ofTPC from January 1989 to October 1993, and as its President from 1976 until December 1990.
Gilbert A. Partida has been a director of the Company since July 1997 and has been President and ChiefExecutive Officer of the Company since January 1998. Mr. Partida was President and Chief Executive Officer ofthe Greater San Diego Chamber of Commerce from January 1993 until December 1997. Prior to joining theChamber of Commerce, Mr. Partida was an attorney with the law firm of Gray, Cary, Ames & Frye in San Diego,California from 1987 to 1992.
Rafael E. Barcenas has been a director of the Company since April 1998. Mr. Barcenas has also been a directorand officer of PriceSmart Panama, S.A.(formerly known as PriceCostco de Panama, S.A.) and PriceSmart RealEstate, S.A. (formerly known as PB Real Estate, S.A.), which are subsidiaries of the Company, since their for-mation in September 1995 and July 1997, respectively. Additionally, Mr. Barcenas has been a principal ofBB&M International Trading Group, a Panamanian company (which previously owned 49% of both PriceCostcode Panama, S.A. and PB Real Estate, S.A.) from March 1995 until March 2000. Mr. Barcenas has been GeneralDirector of Boyd, Barcenas, S.A., the largest advertising agency in Panama, since April 1971.
James F. Cahill has been a director of the Company since November 1999 and has served as a director of PEIsince August 1997. In September 2001, PEI completed a merger transaction with its former parent, ExcelLegacy Corporation, a Delaware corporation ("Legacy"), pursuant to which a subsidiary of PEI was merged withand into Legacy. Upon completion of the merger, Legacy became a wholly owned subsidiary of PEI, whichchanged its name to Price Legacy Corporation ("Price Legacy"), and Mr. Cahill continues to serve as a director.Additionally, Mr. Cahill has been Executive Vice President of Price Entities since January 1987. In this positionhe has been responsible for the oversight and investment activities of the financial portfolio of Sol Price,founder of TPC and related entities. Prior to 1987, Mr. Cahill was employed by TPC for ten years, with his lastposition being Vice President of Operations.
Murray L. Galinson has been a director of the Company since November 2000. Mr. Galinson served as a direc-tor of PEI from August 1994 until November 1999 and currently serves as director of Price Legacy. Additionally,Mr. Galinson has been Chairman of the Board of San Diego National Bank since May 1996 and has served asa director of San Diego National Bank since its inception in 1981. Mr. Galinson also served as President andChief Executive Officer of San Diego National Bank from September 1984 to September 1997 and wasChairman of the Board and Chief Executive Officer of SDNB Financial Corporation from 1985 to 1997.

33
Katherine L. Hensley has been a director of the Company since July 1997 and served as a director of PEI fromDecember 1994 until July 1997. She is a lawyer and a retired partner of the law firm of O'Melveny & Myers inLos Angeles, California. Ms. Hensley joined O'Melveny & Myers in 1978 and was a partner from 1986 toFebruary 1992. From 1994 to 2000, Ms. Hensley served as a trustee of Security First Trust, an open-end invest-ment management company registered under the Investment Company Act of 1940.
Leon C. Janks has been a director of the Company since July 1997 and served as a director of PEI from March1995 until July 1997. He has been a partner in the accounting firm of Green, Hasson & Janks LLP in LosAngeles, California since 1980. Mr. Janks also serves on the board of directors of Expert Ease Software, Inc., aprivately held corporation. Mr. Janks has extensive experience in domestic and international business servinga wide variety of clients in diverse businesses and is a Certified Public Accountant.
Lawrence B. Krause has been a director of the Company since July 1997. Mr. Krause has been a Professor andthe Director of the Korea-Pacific Program at the Graduate School of International Relations and Pacific Studiesat the University of California, San Diego since 1986. He became a Professor Emeritus in 1997. Mr. Krause alsoserves on advisory boards for a number of institutions including the Institute for International Economics, theKorea Economic Institute, the Committee on Asian Economic Studies and the U.S. National Committee forPacific Economic Cooperation.
Jack McGrory has been a director of the Company since November 2000. Mr. McGrory serves as Chairman ofthe Board of Price Legacy, and was President and Chief Executive Officer of PEI from September 1997 untilNovember 1999. Mr. McGrory also serves as a director of the San Diego Padres, L.P. and was its Executive VicePresident and Chief Operating Officer from September 1999 until August 2000. He is also President ofDowntown Development, Inc., which is responsible for coordinating construction of the new San Diego Padresballpark and the San Diego Padres' commercial real estate activities. From March 1991 through August 1997,Mr. McGrory served as City Manager of San Diego.
Edgar A. Zurcher has been a director of the Company since November 2000. Mr. Zurcher has also been a direc-tor and officer of PSMT Caribe, Inc., a subsidiary of the Company, since its inception in December 1998.Additionally, Mr. Zurcher has been a director of PSC, S.A. (which previously owned 49% of PSMT Caribe, Inc.)since its inception in September 1998. Mr. Zurcher is also the managing partner of the law firm Zurcher,Montoya and Zurcher in Costa Rica. Additionally, he is Chairman of Banca Promerica (Costa Rica) and is adirector of Banco Promerica (El Salvador) and a director of Banco Promerica (Honduras).

34
Executive Officers of the CompanyThe executive officers of the Company and their ages as of November 30, 2001 are as follows:
Name Position with the Company Age
Gilbert A. Partida President, Chief Executive Officer and Director 39Kevin C. Breen Executive Vice President-Operations 41Robert M. Gans Executive Vice President, Secretary and General Counsel 52John D. Hildebrandt Executive Vice President–Central American & Caribbean Operations 43Thomas D. Martin Executive Vice President-Merchandising 45William J. Naylon Executive Vice President-Merchandising 39Allan C. Youngberg Executive Vice President and Chief Financial Officer 49
Gilbert A. Partida has been a director of the Company since July 1997 and has been President and ChiefExecutive Officer of the Company since January 1998. Mr. Partida was President and Chief Executive Officerof the Greater San Diego Chamber of Commerce from January 1993 until December 1997. Prior to joining theChamber of Commerce, Mr. Partida was an attorney with the law firm of Gray, Cary, Ames & Frye in San Diego,California from 1987 to 1992.
Kevin C. Breen has been Executive Vice President of the Company since September 1999 and served as SeniorVice President of the Company from August 1997 to August 1999. Mr. Breen previously served as ExecutiveVice President of Price Ventures, Inc., a subsidiary of PEI, from February 1997 until August 1997, overseeingoperational and construction management areas for the international merchandising business. Prior to joiningPEI as Vice President in August 1994, Mr. Breen served as Vice President of Costco from October 1993 toDecember 1994 and previously served in various management roles for TPC.
Robert M. Gans has been Executive Vice President, General Counsel and Secretary of the Company sinceAugust 1997 and was Executive Vice President and General Counsel of PEI from October 1994 until July 1997.Mr. Gans graduated from the UCLA School of Law in 1975 and actively practiced law in private practice from1975 until 1994. From 1988 until October 1994, Mr. Gans was the senior member of the law firm of Gans,Blackmar & Stevens, A.P.C., of San Diego, California.
John D. Hildebrandt has been Executive Vice President-Central American and Caribbean Operations of theCompany since July 2001 and served as Senior Vice President of the Company from September 2000 until July2001. Mr. Hildebrandt previously served as Vice President of the Company from September 1998 until August2000, overseeing operations in Central America. Mr. Hildebrandt served as the Company’s Country Managerin the Philippines and Panama from 1996 until August 1998. Prior to joining PEI as Country Manager in 1996,Mr. Hildebrandt was a Senior Operations Manager of Costco from 1994 through 1996, and had served in vari-ous management roles for TPC since 1979.
Thomas D. Martin has been Executive Vice President of the Company since October 1998 and served as SeniorVice President of the Company from August 1997 to September 1998. Mr. Martin previously served as VicePresident of PEI from August 1994 until July 1997, directing merchandising strategies and product sourcing forits international merchandising business, in addition to managing its trading company activities. Prior to join-ing PEI as Vice President in August 1994, Mr. Martin served as Vice President of Costco from October 1993 toDecember 1994 and had served in various management roles for TPC.
William J. Naylon has been Executive Vice President-Merchandising of the Company since July 2001 andserved as Senior Vice President of the Company from March 1998 until July 2001. From September 1995through February 1998, Mr. Naylon was Managing Director for PriceSmart’s licensee warehouse club operationin Indonesia. Prior to joining PriceSmart, Mr. Naylon was a General Manager for Costco and had served in var-ious management roles for TPC.
Allan C. Youngberg has been Executive Vice President and Chief Financial Officer of the Company since July1999. From January 1993 until July 1999, Mr. Youngberg had been Executive Vice President, Chief FinancialOfficer, Secretary and Treasurer of Cost-U-Less, Inc. Prior to joining Cost-U-Less, Mr. Youngberg was Presidentand shareholder of Youngberg & Schumacher, P.S., a certified public accounting firm in Bellevue, Washington,which Mr. Youngberg founded in 1984 and sold in December 1992. Mr. Youngberg is a Certified PublicAccountant.