Embed Size (px)
Citation preview
Scott W. Tinker, BEG, 2002
Gas Well Deliquification WorkshopMarch 1, 2004
The Coming Natural Gas Economy
Scott W. Tinker
Bureau of Economic GeologyJohn A. and Katherine G. Jackson School of Geosciences
The University of Texas at Austin
Scott W. Tinker, BEG, 2002
Scott W. Tinker, BEG, 2002
Scott W. Tinker, BEG, 2002
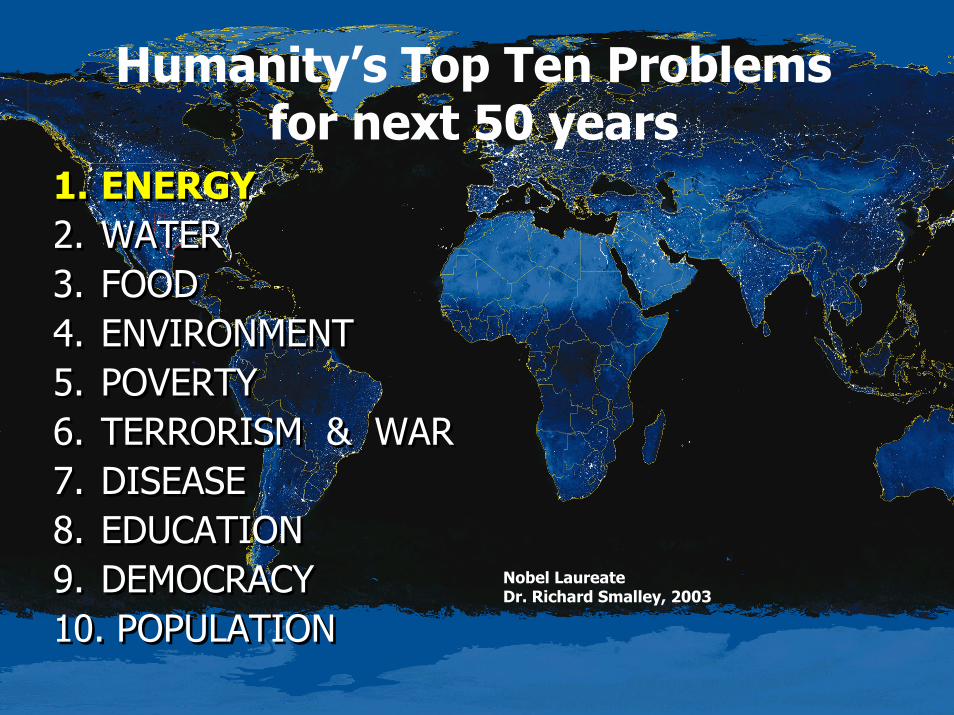
1. ENERGY2. WATER3. FOOD4. ENVIRONMENT 5. POVERTY6. TERRORISM & WAR7. DISEASE8. EDUCATION9. DEMOCRACY10. POPULATION
1. ENERGY2. WATER3. FOOD4. ENVIRONMENT 5. POVERTY6. TERRORISM & WAR7. DISEASE8. EDUCATION9. DEMOCRACY10. POPULATION
Humanity’s Top Ten Problemsfor next 50 years
Nobel LaureateDr. Richard Smalley, 2003
Scott W. Tinker, BEG, 2002 QAd1023
Outline
•• Global DecarbonizationGlobal Decarbonization•• The Trend Towards Natural GasThe Trend Towards Natural Gas•• Creating a Global Gas IndustryCreating a Global Gas Industry•• Summary and OpportunitiesSummary and Opportunities
Scott W. Tinker, BEG, 2002 QAd1023
GlobalDecarbonization
Scott W. Tinker, BEG, 2002
Scott W. Tinker, BEG, 2002
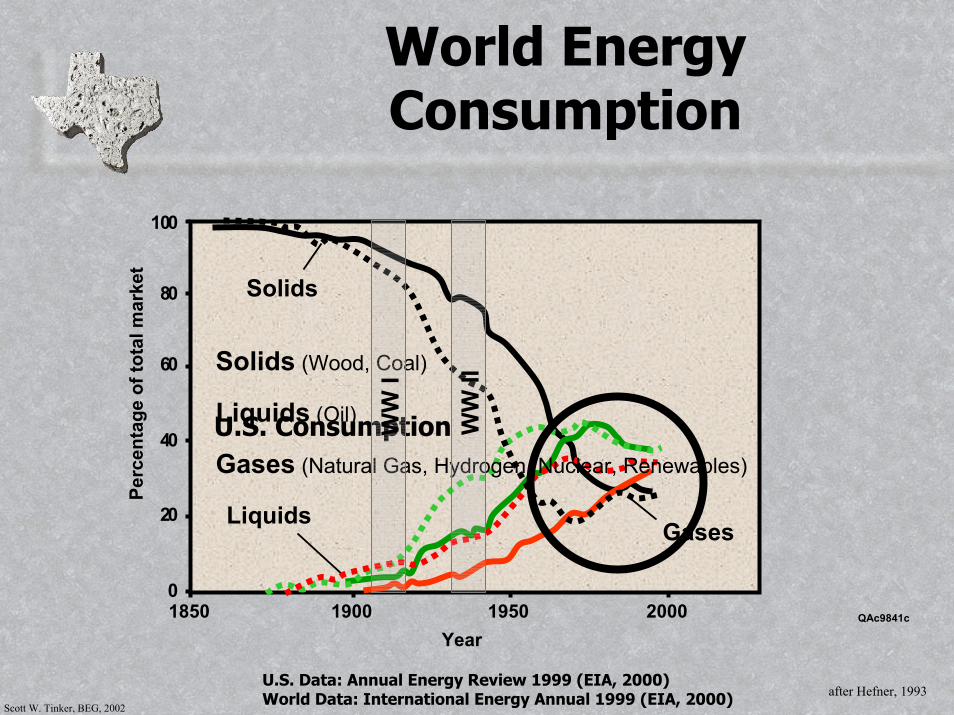
World Energy Consumption
QAc9841c
after Hefner, 1993
100
80
60
40
20
0
Perc
enta
ge o
f tot
al m
arke
t
Year1850 1900 1950 2000
Solids
GasesLiquids
U.S. ConsumptionGases (Natural Gas, Hydrogen, Nuclear, Renewables)
Solids (Wood, Coal)
Liquids (Oil)
U.S. Data: Annual Energy Review 1999 (EIA, 2000)World Data: International Energy Annual 1999 (EIA, 2000)
WW
I
WW
II
Scott W. Tinker, BEG, 2002
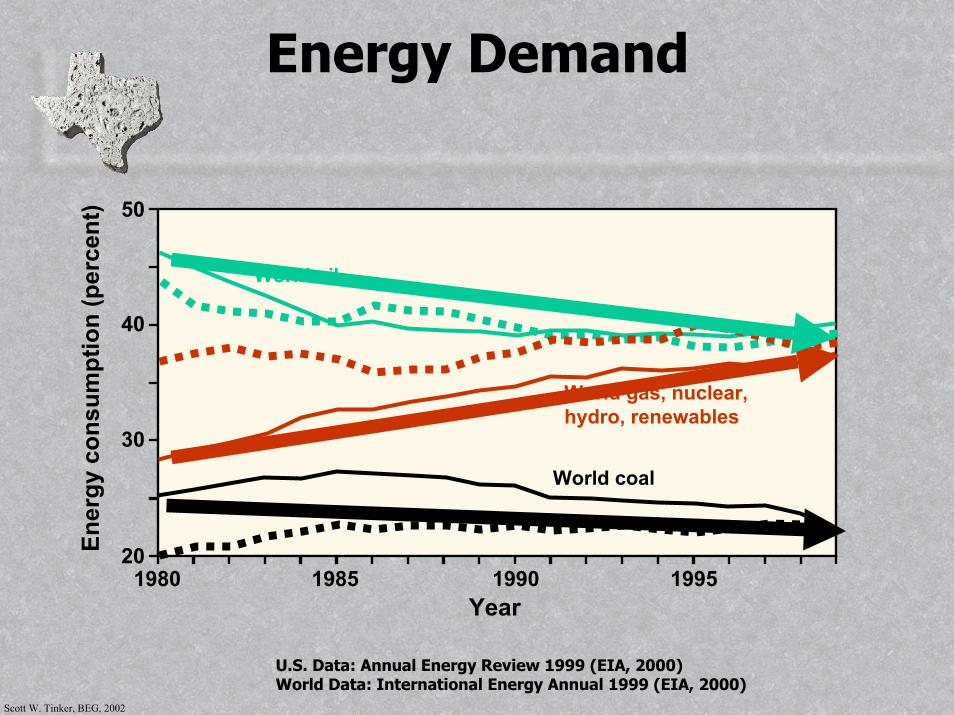
Energy Demand
U.S. Data: Annual Energy Review 1999 (EIA, 2000)World Data: International Energy Annual 1999 (EIA, 2000)
20
30
40
50
1980 1985 1990 1995
Ener
gy c
onsu
mpt
ion
(per
cent
)
Year
World oil
World coal
World gas, nuclear,hydro, renewables
Scott W. Tinker, BEG, 2002
1910191519201925193019351940194519501955196019651970
197519801985199019952000
U.S. Energy Consumption
100
90
80
70
60
50
40
30
20
10
100
90
80
70
60
50
40
30
20
10
100 90 80 70 60 50 40 30 20 10
Liquids (Oil)
Solids (Wood, Coal) Gases (Natural Gas, Hydrogen, Nuclear, Renewables)
Historical U.S. Energy Consumption
0%
20%
40%
60%
80%
100%
1845 1850 1855 1860 1865 1870 1875 1880 1885 1890 1895 1900 1905 1910 1915 1920 1925 1930 1935 1940 1945 1950 1955 1960 1965 1970 1975 1980 1985 1990 1995 2000
Per
cen
tag
e o
f M
arke
t S
har
e
Solids
Liquids
Gases + Renewables
D t EIA
Data: EIA
1973
Price VolatilitySupply InstabilityGovernmental PolicyTechnology
1973
U.S. Energy Consumption
0
20
40
60
80
100
120
1845
1870
1895
1920
1945
1953
1958
1963
1968
1973
1978
1983
1988
1993
1998
Qua
d B
TU
Renewable Energy
Hydroelectric
Nuclear Energy
Natural Gas
Oil Imported
Oil Produced
Coal
Wood and Waste
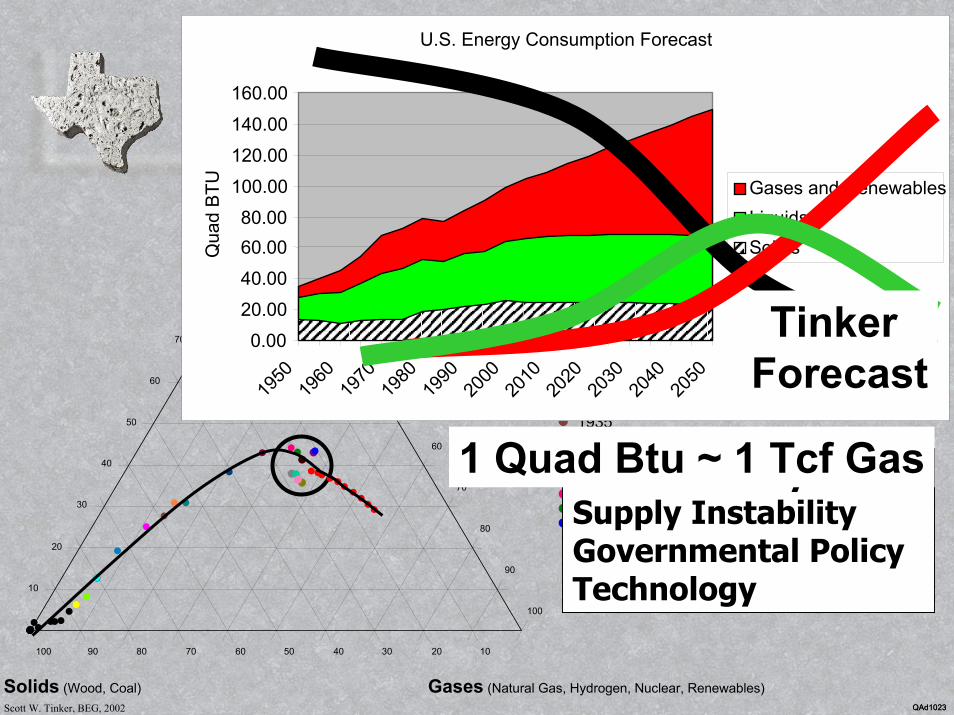
U.S. Energy Consumption Forecast
00.10.20.30.40.50.60.70.80.9
1
1845
1860
1875
1890
1905
1920
1935
1950
1965
1980
1995
2010
2025
2040
% o
f Tot
al M
arke
tGases and RenewablesLiquidsSolids
U.S. Energy Consumption Forecast
00.10.20.30.40.50.60.70.80.9
1
1845
1860
1875
1890
1905
1920
1935
1950
1965
1980
1995
2010
2025
2040
% o
f Tot
al M
arke
tGases and RenewablesLiquidsSolids
U.S. Energy Consumption Forecast
0.00
20.00
40.00
60.0080.00
100.00
120.00
140.00
160.00
1950
1960
1970
1980
1990
2000
2010
2020
2030
2040
2050
Qua
d B
TU Gases and RenewablesLiquidsSolids
1 Quad Btu ~ 1 Tcf Gas
Tinker Forecast
QAd1023QAd1023
Scott W. Tinker, BEG, 2002 QAd1023
Why the Long-Term Trend Towards Natural Gas?
•• EfficiencyEfficiency•• EconomyEconomy•• EnvironmentEnvironment•• AvailabilityAvailability
Scott W. Tinker, BEG, 2002
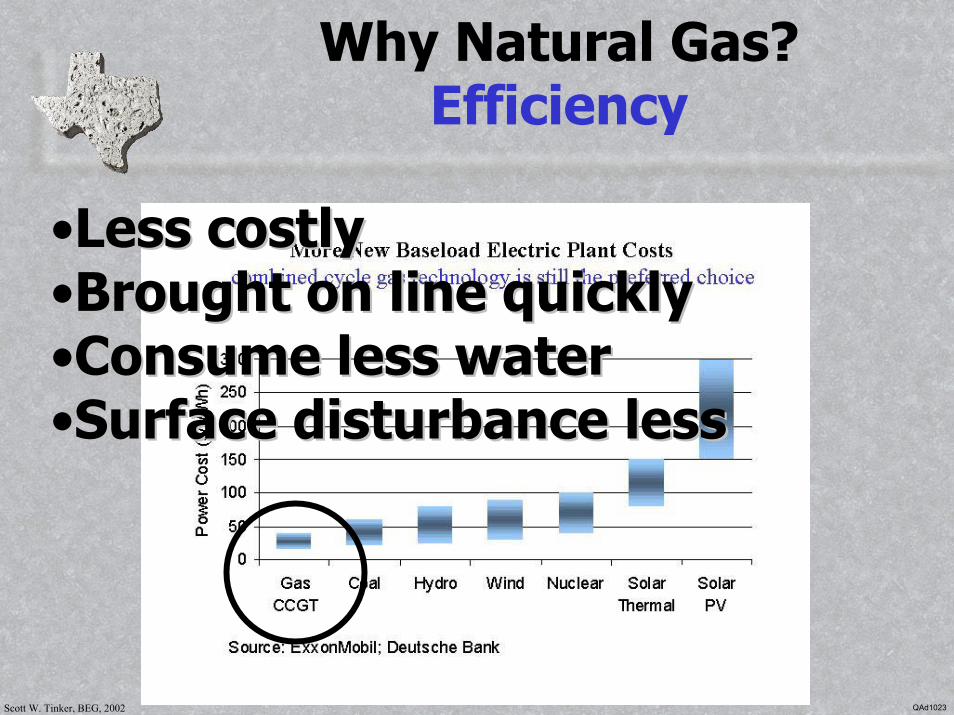
Why Natural Gas?Efficiency
••Less costlyLess costly••Brought on line quicklyBrought on line quickly••Consume less waterConsume less water••Surface disturbance lessSurface disturbance less
QAd1023
Scott W. Tinker, BEG, 2002
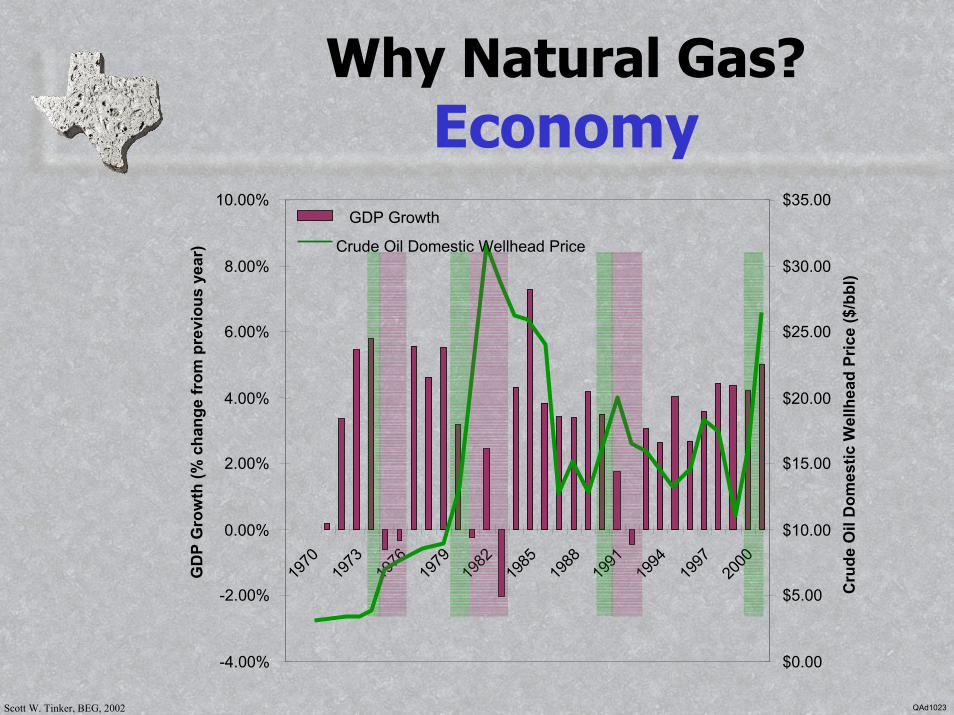
Why Natural Gas?Economy
-4.00%
-2.00%
0.00%
2.00%
4.00%
6.00%
1970
19
73
1976
19
79
1982
19
85
1988
19
91
1994
19
97
2000
G
DP
Gro
wth
(% c
hang
e fr
om p
revi
ous
year
)
$0.00
$5.00
$10.00
$15.00
$20.00
$25.00
$30.00
$35.00
8.00%
10.00%GDP Growth
Crude Oil Domestic Wellhead Price
Cru
de O
il D
omes
tic W
ellh
ead
Pric
e ($
/bbl
)
QAd1023
Scott W. Tinker, BEG, 2002
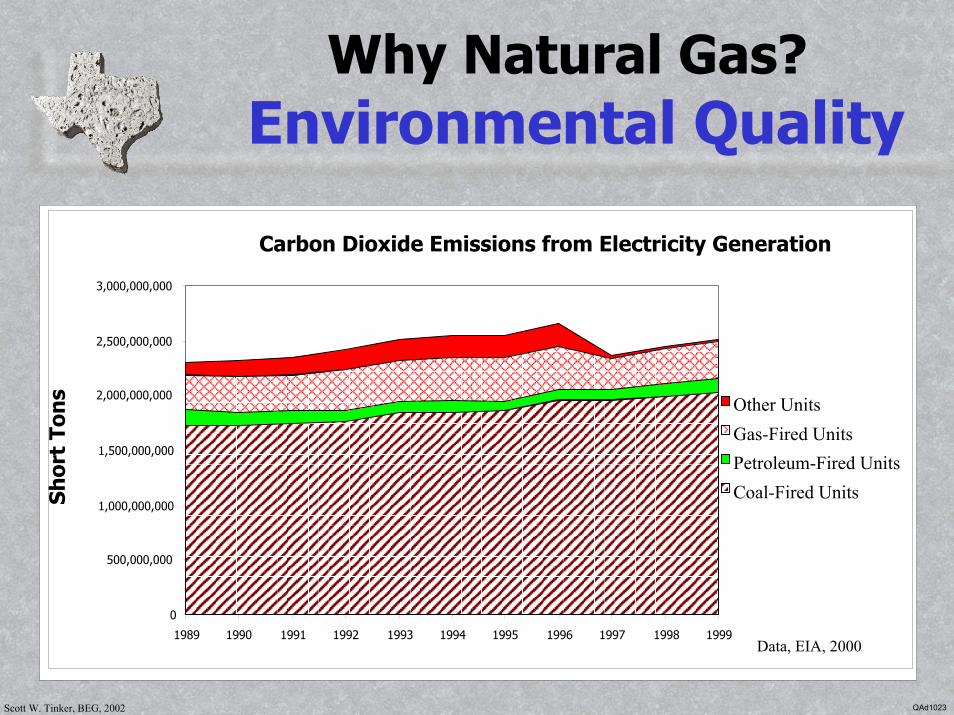
Why Natural Gas?Environmental Quality
U.S. Carbon Dioxide Emissions from Energy Consumption by End-Use Sector
0
400
800
1,200
1,600
1949 1954 1959 1964 1969 1974 1979 1984 1989 1994 1999
Non-Electricity Generation in Residential, Commercial and IndustrialTransportationElectricity Generation
Data: EIA, 2002
MM
Met
ric
Ton
s of
Coa
l
U.S. Electricity Generation by Fuel Source
0
500,000,000
1,000,000,000
1,500,000,000
2,000,000,000
2,500,000,000
3,000,000,000
3,500,000,000
Mkw
h
Other Renewables
Hydro
Nuclear
Natural Gas
Petroleum
Coal
Data, EIA, 2000
1950 1960 1970 1980 1990 2000
Carbon Dioxide Emissions from Electricity Generation
0
500,000,000
1,000,000,000
1,500,000,000
2,000,000,000
2,500,000,000
3,000,000,000
1989 1990 1991 1992 1993 1994 1995 1996 1997 1998 1999
Other UnitsGas-Fired UnitsPetroleum-Fired UnitsCoal-Fired Units
Data, EIA, 2000
Shor
t To
ns
QAd1023
Scott W. Tinker, BEG, 2002
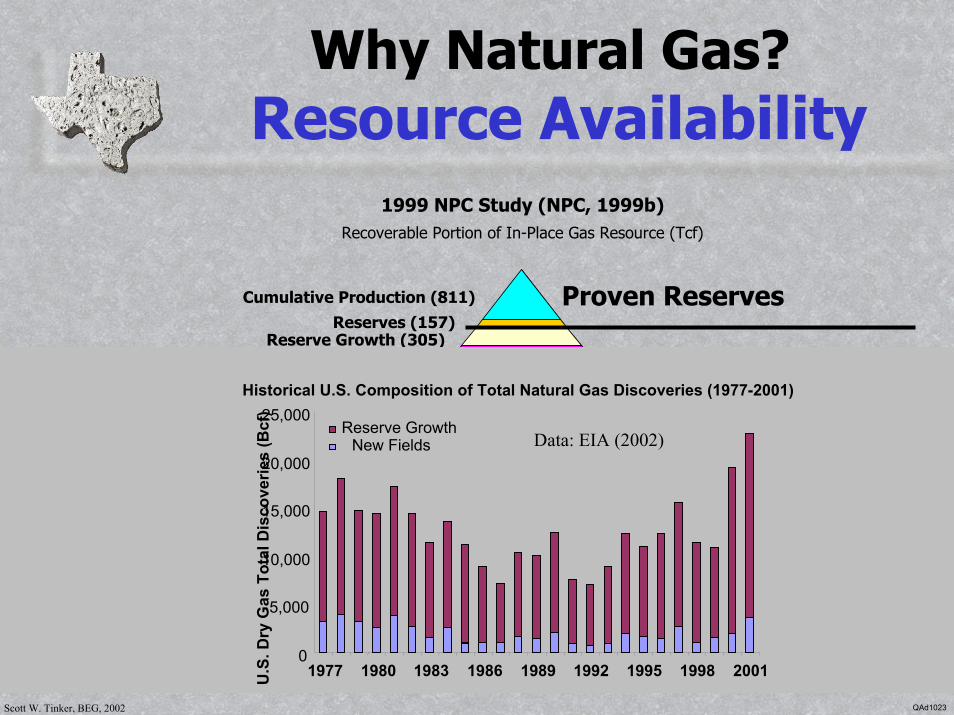
Why Natural Gas?Resource Availability
1999 NPC Study (NPC, 1999b)Recoverable Portion of In-Place Gas Resource (Tcf)
Reserves (1,004)
Reserve Growth (305)
Undiscovered, Unconventional
Unassessed Unconventional Reserves (400)
Geopressured Brine (Up to 24,000)
Gas Hydrate (Up to 300,000) Not Assessed by NPC
Increasing developmentcosts, technology needs,
uncertainty, and decreasing concentration
Cumulative Production (811)Reserves (157)
Proven Reserves
Reserve GrowthNew Fields
Historical U.S. Composition of Total Natural Gas Discoveries (1977-2001)
0
5,000
10,000
15,000
20,000
25,000
1977 1980 1983 1986 1989 1992 1995 1998 2001U.S
. Dry
Gas
Tot
al D
isco
verie
s (B
cf)
Data: EIA (2002)
QAd1023
Scott W. Tinker, BEG, 2002 QAd1023
•• Enhance ReservesEnhance Reserves•• Create ResourcesCreate Resources•• TransportTransport•• SequesterSequester
Creating a Global Gas Industry
Scott W. Tinker, BEG, 2002
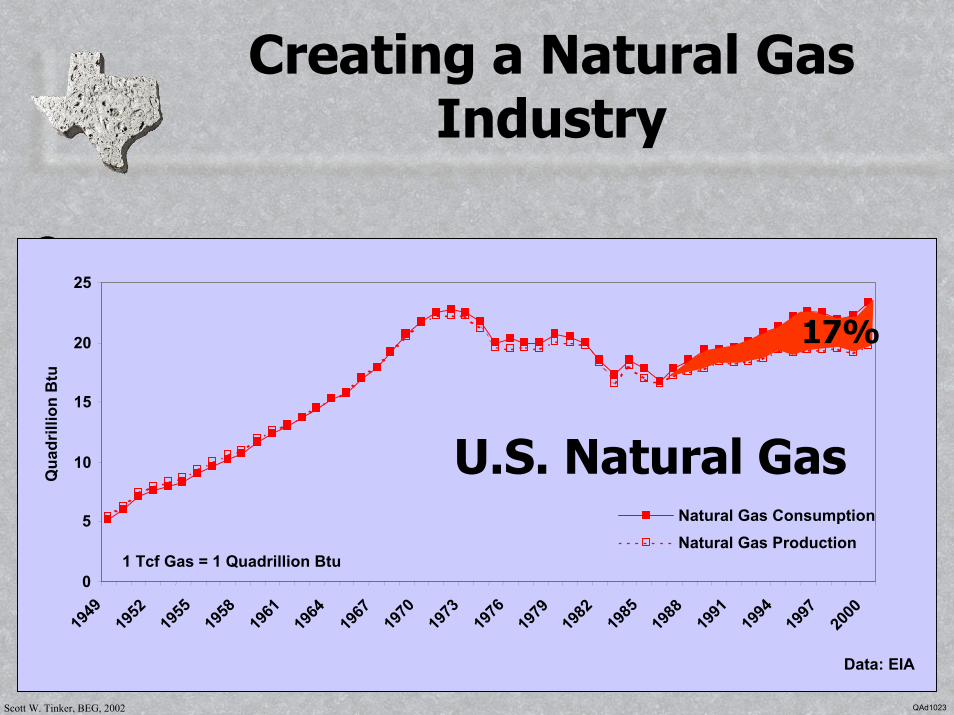
Creating a Natural Gas Industry
EIA (1949-1990) and NPC (1991-2015)
L48 Conventional Onshore
Associated and High-Perm Gas
Shallow OffshoreL48 Unconventional Onshore Tight Gas, Shale Gas, CBMDeepwater+Subsalt Offshore
0
5,000
10,000
15,000
20,000
25,000
30,000
1949 1953 1957 1961 1965 1969 1973 1977 1981 1985 1989 1993 1997 2001 2005 2009 2013
Year
Ann
ual N
atur
al G
as P
rodu
ctio
n (B
cf)
$2
$3
$1 Wel
lhea
d Pr
ice
($/m
cf)Demand
0
5
10
15
20
25
1949
1952
1955
1958
1961
1964
1967
1970
1973
1976
1979
1982
1985
1988
1991
1994
1997
2000
Qua
drill
ion
Btu
Natural Gas ConsumptionNatural Gas Production
1 Tcf Gas = 1 Quadrillion Btu
Data: EIA
17%
U.S. Natural Gas
QAd1023
Scott W. Tinker, BEG, 2002
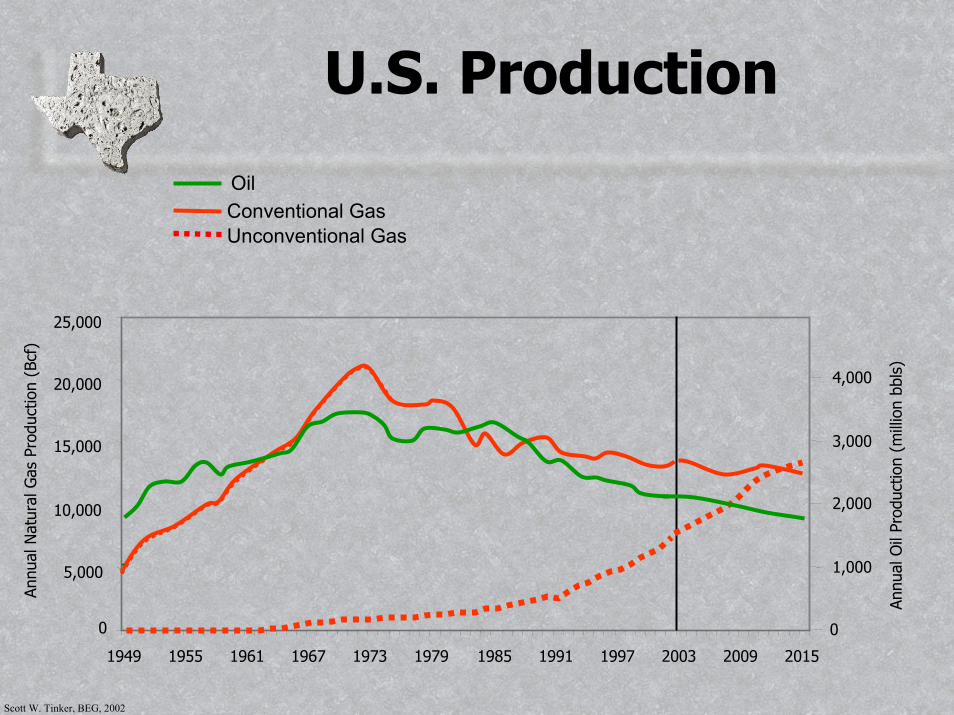
U.S. Production
Conventional GasUnconventional Gas
1949 1955 1961 1967 1973 1979 1985 1991 1997 2003 2009 2015
Annu
al N
atur
al G
as P
rodu
ctio
n (B
cf)
0
1,000
2,000
3,000
4,000
Annu
al O
il Pr
oduc
tion
(mill
ion
bbls
)
Oil
25,000
20,000
15,000
10,000
5,000
0
Scott W. Tinker, BEG, 2002
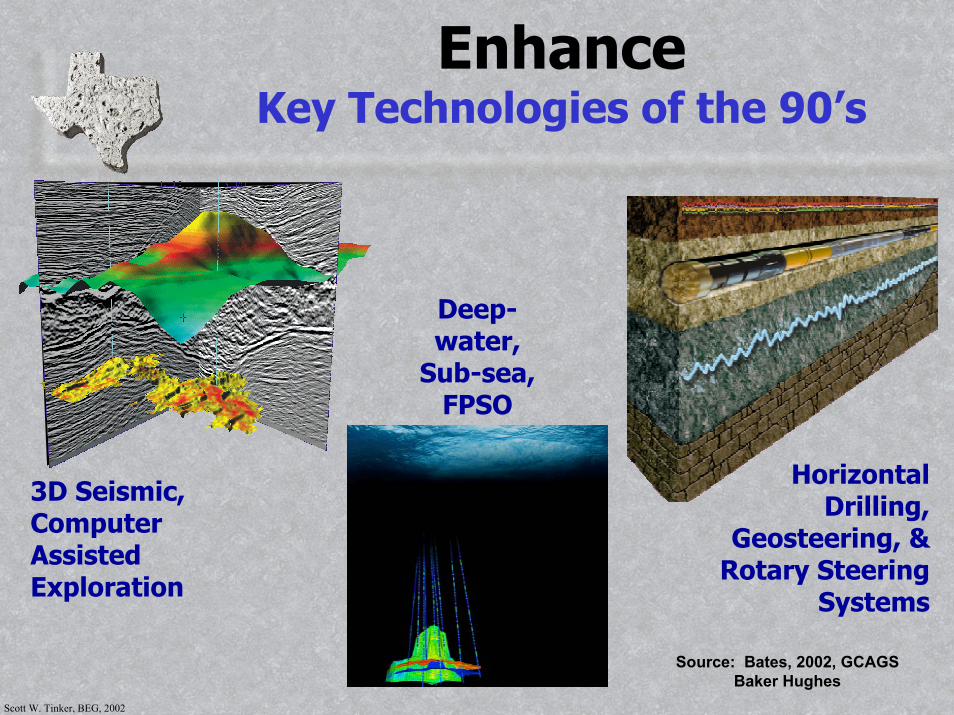
EnhanceKey Technologies of the 90’s
Horizontal Drilling,
Geosteering, &Rotary Steering
Systems
Source: Bates, 2002, GCAGS Baker Hughes
Deep-water,
Sub-sea,FPSO
3D Seismic,Computer Assisted Exploration
Scott W. Tinker, BEG, 2002
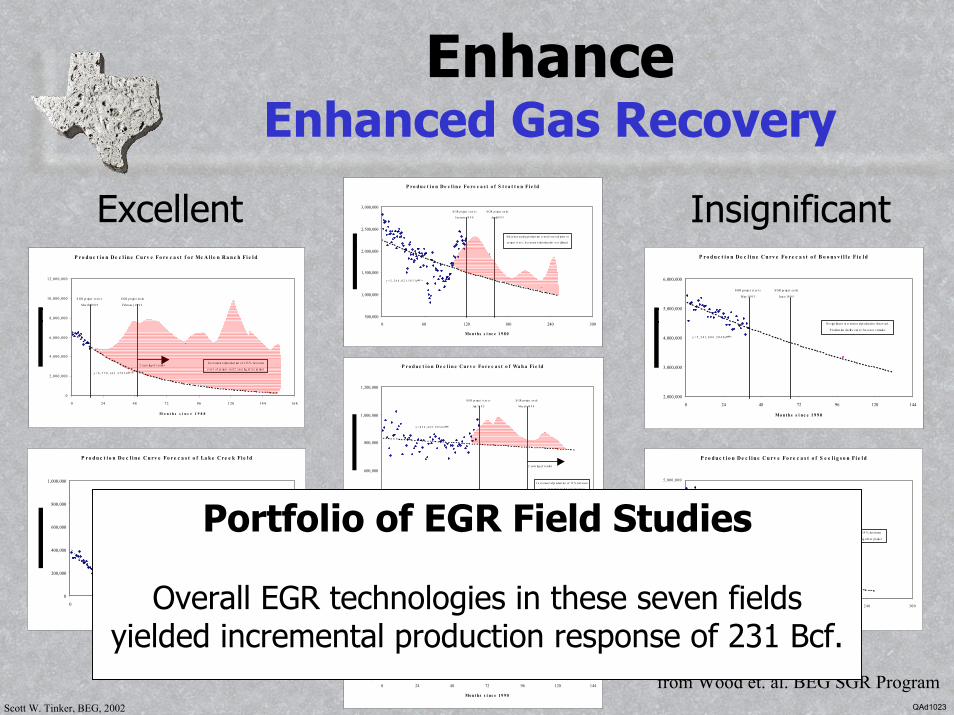
EnhanceEnhanced Gas Recovery
from Wood et. al. BEG SGR Program
P r o d u c t i o n D e c l i n e C u r v e Fo r e c a s t o f Wa h a Fi e l d
y = 8 3 2 , 4 2 5 . 9 9 3 6 e-0.0008 x
400,000
600,000
800,000
1,000,000
1,200,000
0 24 48 72 96 120 144
Mo nt hs s i nc e 1 9 9 0
S GR pr oject s t ar t s
July 19 9 5
S GR pr oject en ds
Mar ch 19 9 8
2 year lag of r esult s
I n cr emen t al pr oduct ion of 12 % bet ween
s t ar t of pr oject an d 2 year lag af t er
Production Decline Curve Forecast of Lockridge Field
y = 821, 265. 2536e -0.004 2 x
400,000
600,000
800,000
1,000,000
0 24 48 72 96 120 144
Mo nt hs s i nc e 1 9 9 0
SGR pr oje c t s t a r t s
J uly 1995
SGR pr oje c t e nds
Ma r c h 1998
2 year lag of r esult s
I n cr emen t al pr oduct ion of 4 % bet ween
s t ar t of pr oject an d 2 year lag af t er
P r o d u c t i o n D e c l i n e C u rv e Fo r e c a s t o f B o o n s v i l l e Fi e l d
y = 5 , 2 4 1, 6 0 6 . 2 8 6 8 e-0.004 6 x
2,000,000
3,000,000
4,000,000
5,000,000
6,000,000
0 24 48 72 96 120 144
Mo nt hs s i nc e 1 9 9 0
S GR pr oject st ar t s
M ay 19 9 3
S GR pr oject en ds
Jun e 19 9 5
No s ign if ican t in cr emen t al pr oduct ion obser ved.
P r oduct ion declin e cur ve f or ecas t r emain s
P r o d u c t i o n D e c l i n e Fo r e c a s t o f S t r a t t o n Fi e l d
y = 2 , 2 6 6 , 0 2 1. 5 6 3 1e-0.003 3 x
500,000
1,000,000
1,500,000
2,000,000
2,500,000
3,000,000
0 60 120 180 240 300
Mo nt hs s i nc e 1 9 8 0
S GR pr oject s t ar t s
J an uar y 19 9 0
S GR pr oject en ds
Apr il 19 9 3
S in ce in cr eas in g pr oduct ion t r en d s t ar t ed pr ior t o
pr oject s t ar t , in cr emen t al pr oduct ion n ot claimed.
P ro d u c t i o n D e c l i n e C u rv e Fo re c a s t o f S e e l i g s o n Fi e l d
y = 4 , 0 8 8 , 9 8 4 . 0 16 6 e-0.01 02 x
0
1, 000, 000
2, 000, 000
3, 000, 000
4, 000, 000
5, 000, 000
0 60 120 180 240 300
M o n t h s s i n c e 1 9 8 0
S GR pr oject s t ar t s
S ept ember 19 8 8
S GR pr oject en ds
December 19 9 1
2 year lag of r esult s
I n cr emen t al pr oduct ion of 19 % bet ween
st ar t of pr oject an d 2 year lag af t er pr oject
P r o d u c t i o n D e c l i n e C u r v e Fo r e c a s t f o r Mc A l l e n R a n c h Fi e l d
y = 6 , 7 7 0 , 14 3 . 3 7 0 3 e-0.01 9 5 x
0
2 , 000, 000
4, 000, 000
6, 000, 000
8, 000, 000
10, 000, 000
12, 000, 000
0 24 48 72 96 120 144 168
M o n t h s s i n c e 1 9 8 8
S GR pr oject s t ar t s
Mar ch 19 8 9
S GR pr oject en ds
Febr uar y 19 9 2
2 year lag of r esult sI n cr emen t al pr oduct ion of 113 % bet ween
s t ar t of pr oject an d 2 year lag af t er pr oject
P r o d u c t i o n D e c l i n e C u rv e Fo r e c a s t o f La k e C re e k Fi e l d
y = 4 0 2 , 5 7 1. 4 7 0 6 e-0.03 1 9 x
0
200,000
400,000
600,000
800,000
1,000,000
0 24 48 72 96 120 144 168
Mo nt hs s i nc e 1 9 8 8
S GR pr oject s t ar t s
S ept ember 19 8 9
S GR pr oject en ds
December 19 9 2
2 year lag of r esult s
I n cr emen t al pr oduct ion of 15 9 %
bet ween st ar t of pr oject an d 2 year lag
Portfolio of EGR Field Studies
Overall EGR technologies in these seven fields yielded incremental production response of 231 Bcf.
Excellent Insignificant
QAd1023
Scott W. Tinker, BEG, 2002
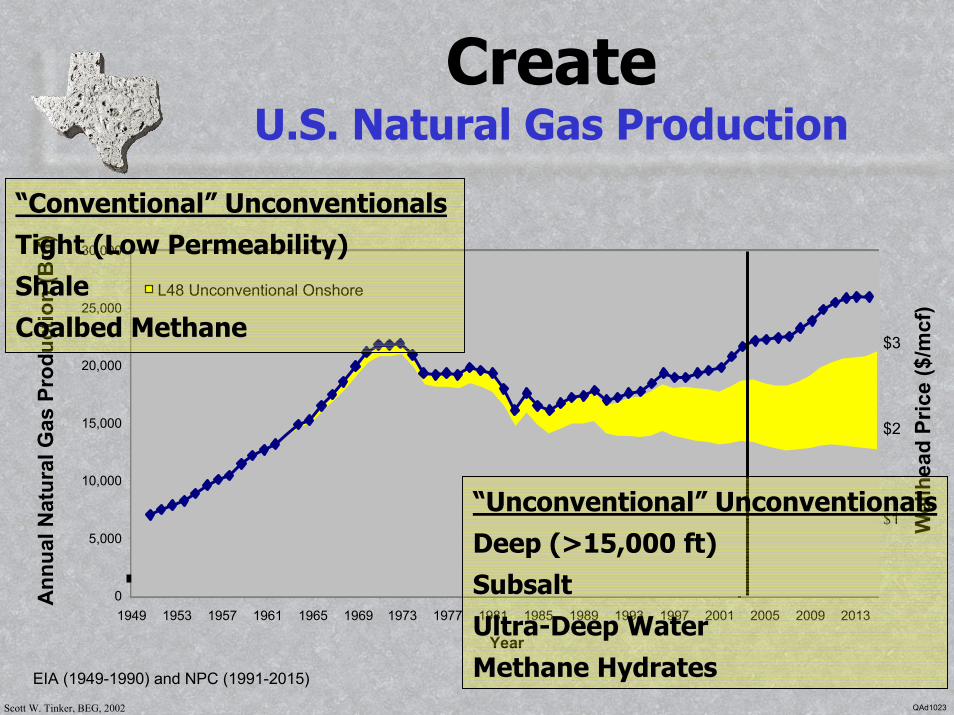
CreateU.S. Natural Gas Production
EIA (1949-1990) and NPC (1991-2015)
L48 Conventional Onshore
Associated and High-Perm Gas
Shallow OffshoreL48 Unconventional Onshore Tight Gas, Shale Gas, CBMDeepwater+Subsalt Offshore
0
5,000
10,000
15,000
20,000
25,000
30,000
1949 1953 1957 1961 1965 1969 1973 1977 1981 1985 1989 1993 1997 2001 2005 2009 2013
Year
Ann
ual N
atur
al G
as P
rodu
ctio
n (B
cf)
$2
$3
$1 Wel
lhea
d Pr
ice
($/m
cf)
>50%
L48 Unconventional Onshore
“Conventional” UnconventionalsTight (Low Permeability) ShaleCoalbed Methane
“Unconventional” UnconventionalsDeep (>15,000 ft)SubsaltUltra-Deep Water Methane Hydrates
QAd1023
Scott W. Tinker, BEG, 2002
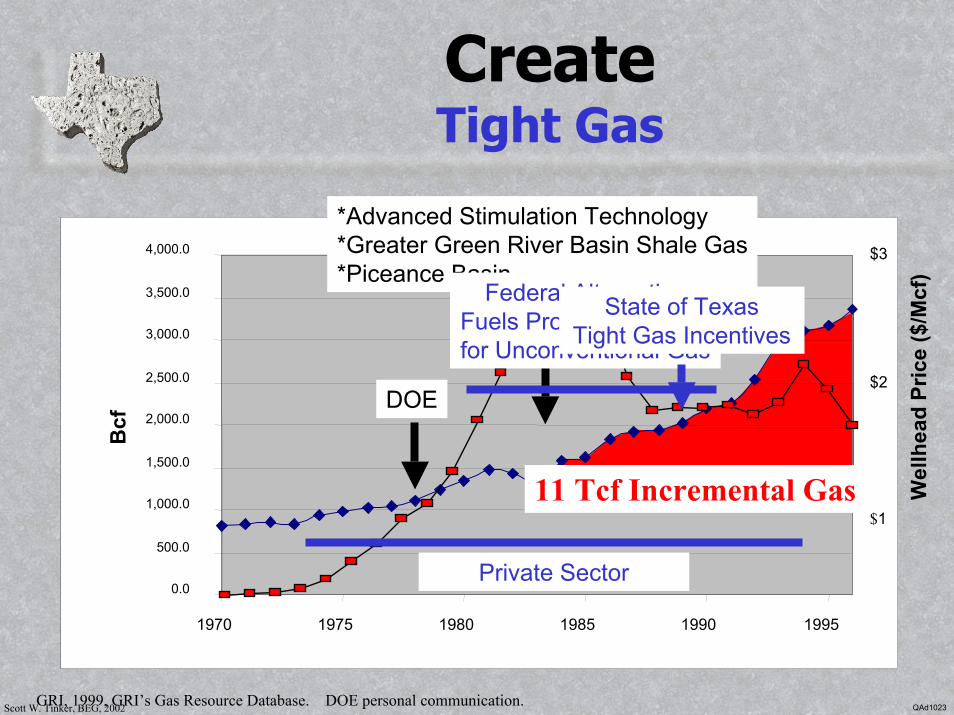
CreateTight Gas
0.0
500.0
1,000.0
1,500.0
2,000.0
2,500.0
3,000.0
3,500.0
4,000.0
1970 1975 1980 1985 1990 1995
Bcf
11 Tcf Incremental Gas
$2
$3
$1
Wel
lhea
d Pr
ice
($/M
cf)
*Advanced Stimulation Technology*Greater Green River Basin Shale Gas*Piceance Basin
DOE
GRI
Federal Alternative Fuels Production Credit for Unconventional Gas
State of Texas Tight Gas Incentives
Private Sector
GRI, 1999, GRI’s Gas Resource Database. DOE personal communication. QAd1023
Scott W. Tinker, BEG, 2002
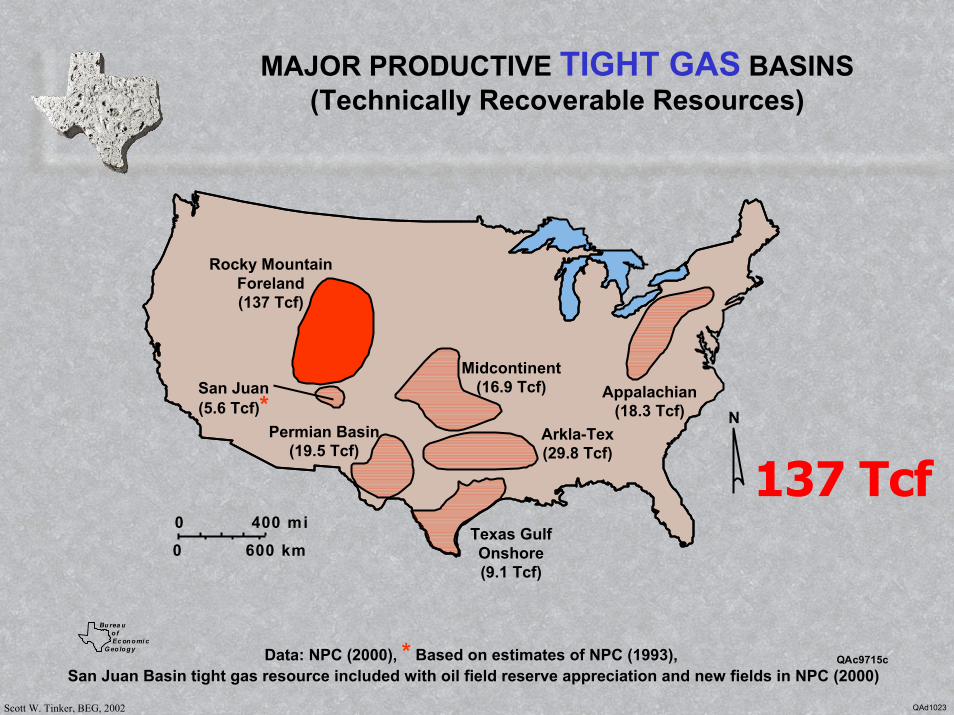
MAJOR PRODUCTIVE TIGHT GAS BASINS(Technically Recoverable Resources)
600 km0
400 mi0
N
Rocky MountainForeland(137 Tcf)
Midcontinent(16.9 Tcf)
Arkla-Tex(29.8 Tcf)
Appalachian(18.3 Tcf)
Permian Basin(19.5 Tcf)
Texas GulfOnshore(9.1 Tcf)
San Juan(5.6 Tcf)*
137 Tcf
QAc9715c
Burea uofEc onomi c
Geo logy Data: NPC (2000), * Based on estimates of NPC (1993), San Juan Basin tight gas resource included with oil field reserve appreciation and new fields in NPC (2000)
QAd1023
Scott W. Tinker, BEG, 2002
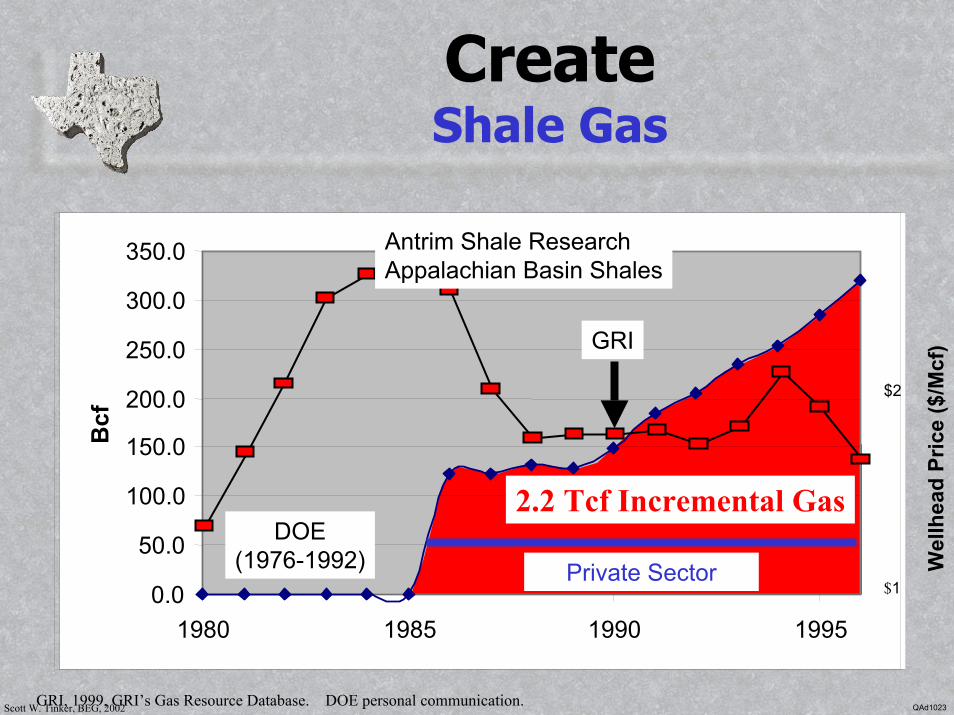
CreateShale Gas
0.0
50.0
100.0
150.0
200.0
250.0
300.0
350.0
1980 1985 1990 1995
Bcf
2.2 Tcf Incremental Gas
$2
$1
Wel
lhea
d Pr
ice
($/M
cf)
Antrim Shale ResearchAppalachian Basin Shales
DOE(1976-1992)
GRI
Private Sector
GRI, 1999, GRI’s Gas Resource Database. DOE personal communication. QAd1023
Scott W. Tinker, BEG, 2002
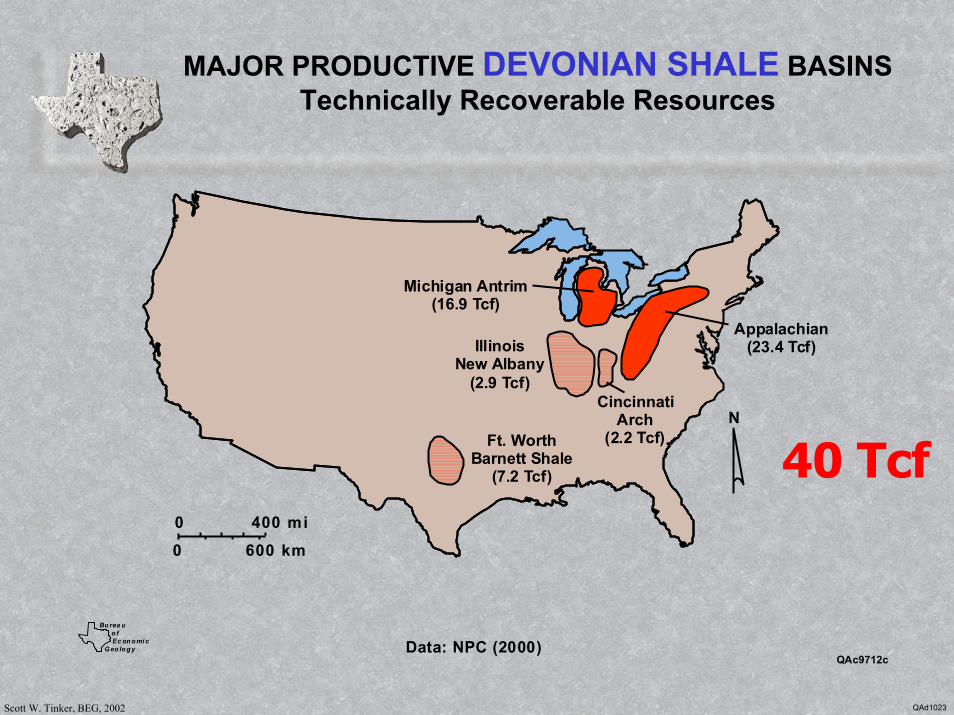
MAJOR PRODUCTIVE DEVONIAN SHALE BASINSTechnically Recoverable Resources
600 km0
400 mi0
NFt. Worth
Barnett Shale(7.2 Tcf)
IllinoisNew Albany
(2.9 Tcf)Cincinnati
Arch(2.2 Tcf)
Appalachian(23.4 Tcf)
Michigan Antrim(16.9 Tcf)
40 Tcf
Burea uofEc onomi c
Geo logy Data: NPC (2000)QAc9712c
QAd1023
Scott W. Tinker, BEG, 2002
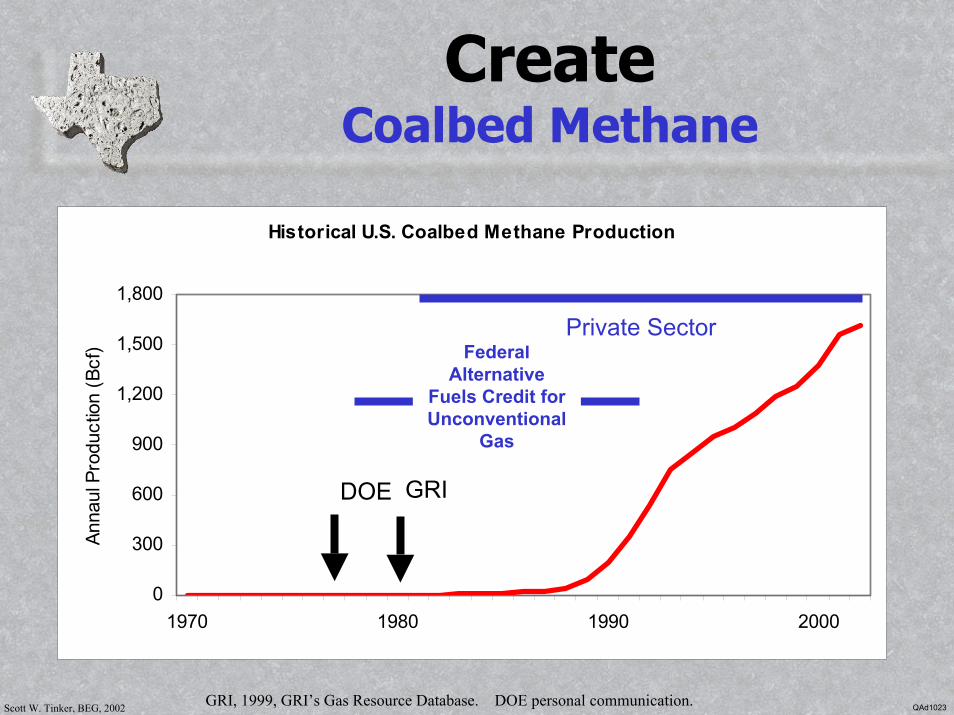
CreateCoalbed Methane
Historical U.S. Coalbed Methane Production
0
300
600
900
1,200
1,500
1,800
1970 1980 1990 2000
Anna
ul P
rodu
ctio
n (B
cf)
DOE GRI
Federal Alternative
Fuels Credit for Unconventional
Gas
Private Sector
GRI, 1999, GRI’s Gas Resource Database. DOE personal communication. QAd1023
Scott W. Tinker, BEG, 2002
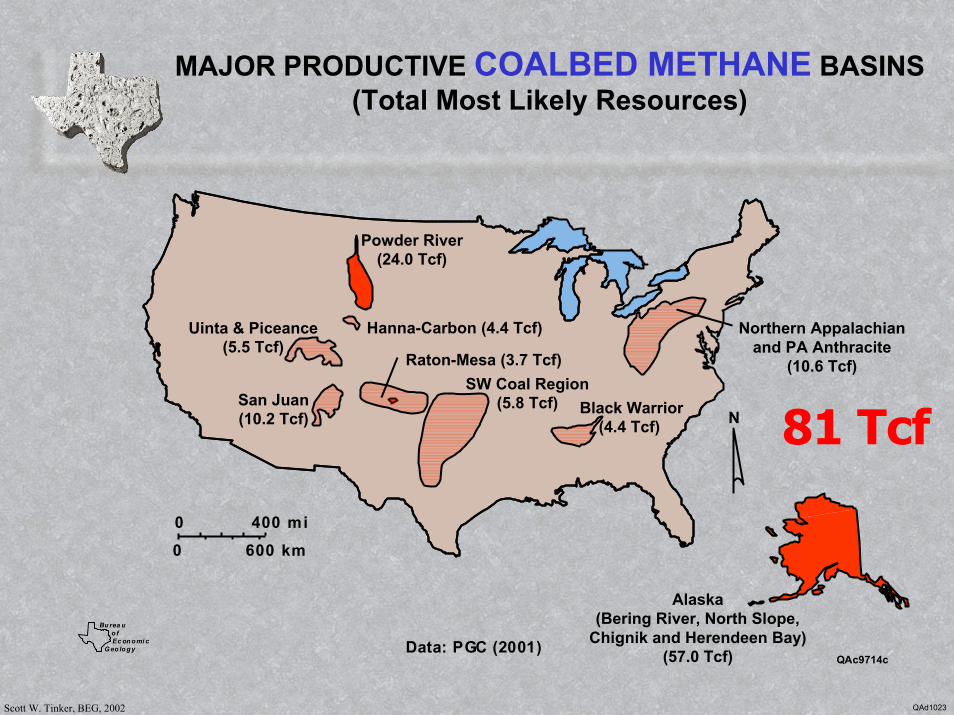
MAJOR PRODUCTIVE COALBED METHANE BASINS(Total Most Likely Resources)
600 km0
400 mi0
N
QAc9714c
Burea uofEc onomi c
Geo logy
Powder River(24.0 Tcf)
Hanna-Carbon (4.4 Tcf)Uinta & Piceance(5.5 Tcf)
San Juan(10.2 Tcf)
Northern Appalachianand PA Anthracite
(10.6 Tcf)
Black Warrior(4.4 Tcf)
Raton-Mesa (3.7 Tcf)
Alaska(Bering River, North Slope,
Chignik and Herendeen Bay)(57.0 Tcf)
SW Coal Region(5.8 Tcf)
Data: PGC (2001)
81 Tcf
QAd1023
Scott W. Tinker, BEG, 2002
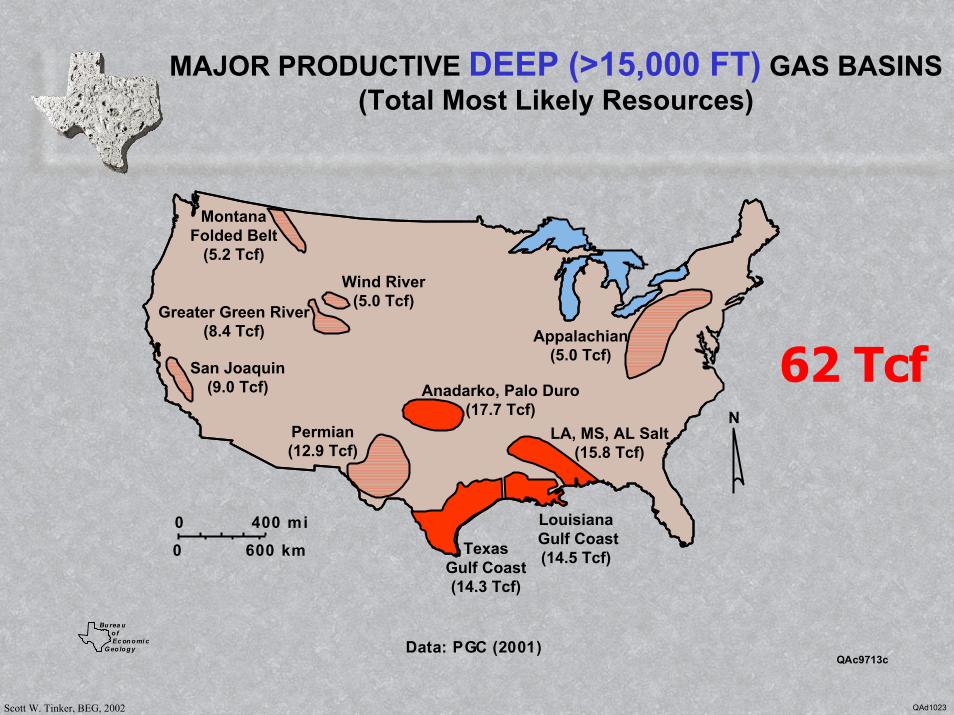
MAJOR PRODUCTIVE DEEP (>15,000 FT) GAS BASINS(Total Most Likely Resources)
600 km0
400 mi0
N
MontanaFolded Belt
(5.2 Tcf)Wind River
(5.0 Tcf)Greater Green River
(8.4 Tcf)
San Joaquin(9.0 Tcf) Anadarko, Palo Duro
(17.7 Tcf)Permian(12.9 Tcf)
Appalachian(5.0 Tcf)
LA, MS, AL Salt(15.8 Tcf)
LouisianaGulf Coast(14.5 Tcf)Texas
Gulf Coast(14.3 Tcf)
62 Tcf
Burea uofEc onomi c
Geo logy Data: PGC (2001)QAc9713c
QAd1023
Scott W. Tinker, BEG, 2002
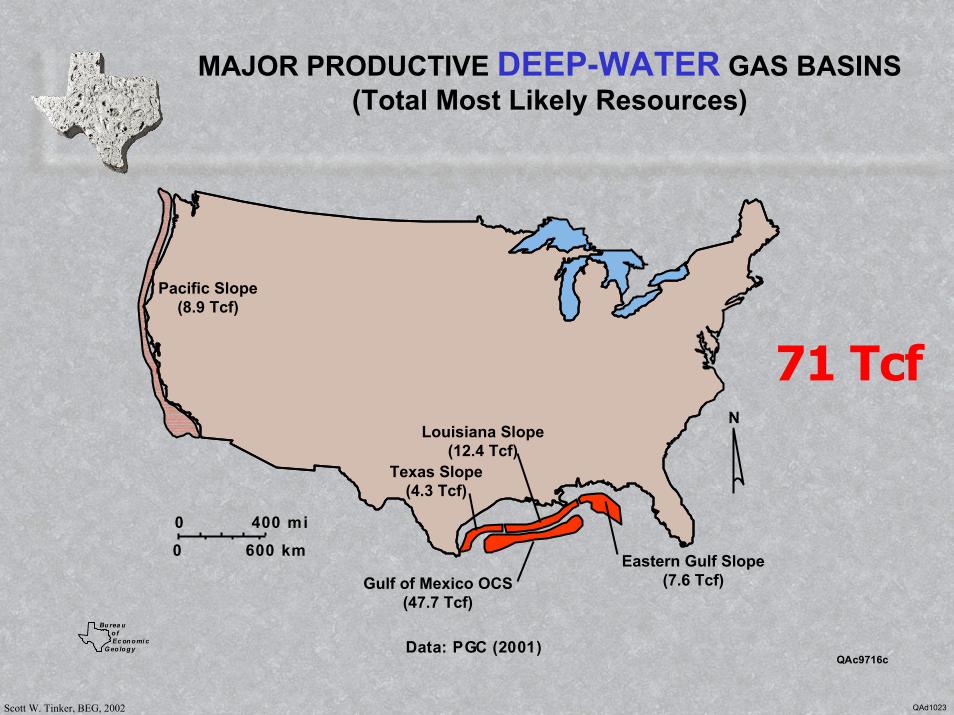
MAJOR PRODUCTIVE DEEP-WATER GAS BASINS(Total Most Likely Resources)
600 km0
400 mi0
N
Pacific Slope(8.9 Tcf)
Louisiana Slope(12.4 Tcf)
Texas Slope(4.3 Tcf)
Eastern Gulf Slope(7.6 Tcf)Gulf of Mexico OCS
(47.7 Tcf)
71 Tcf
Burea uofEc onomi c
Geo logy Data: PGC (2001)QAc9716c
QAd1023
Scott W. Tinker, BEG, 2002
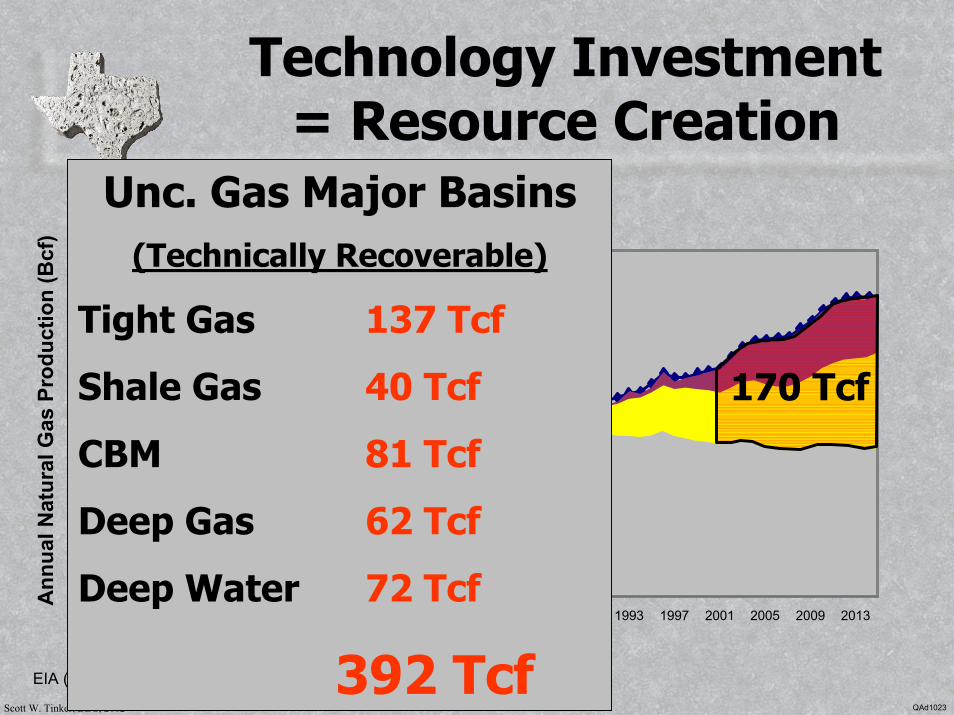
Technology Investment = Resource Creation
L48 Unconventional OnshoreDeepwater+Subsalt Offshore
EIA (1949-1990) and NPC (1991-2015)
0
5,000
10,000
15,000
20,000
25,000
30,000
1949 1953 1957 1961 1965 1969 1973 1977 1981 1985 1989 1993 1997 2001 2005 2009 2013
Year
Ann
ual N
atur
al G
as P
rodu
ctio
n (B
cf)
170 Tcf
Unc. Gas Major Basins (Technically Recoverable)
Tight Gas 137 Tcf
Shale Gas 40 Tcf
CBM 81 Tcf
Deep Gas 62 Tcf
Deep Water 72 Tcf
392 TcfQAd1023
Scott W. Tinker, BEG, 2002
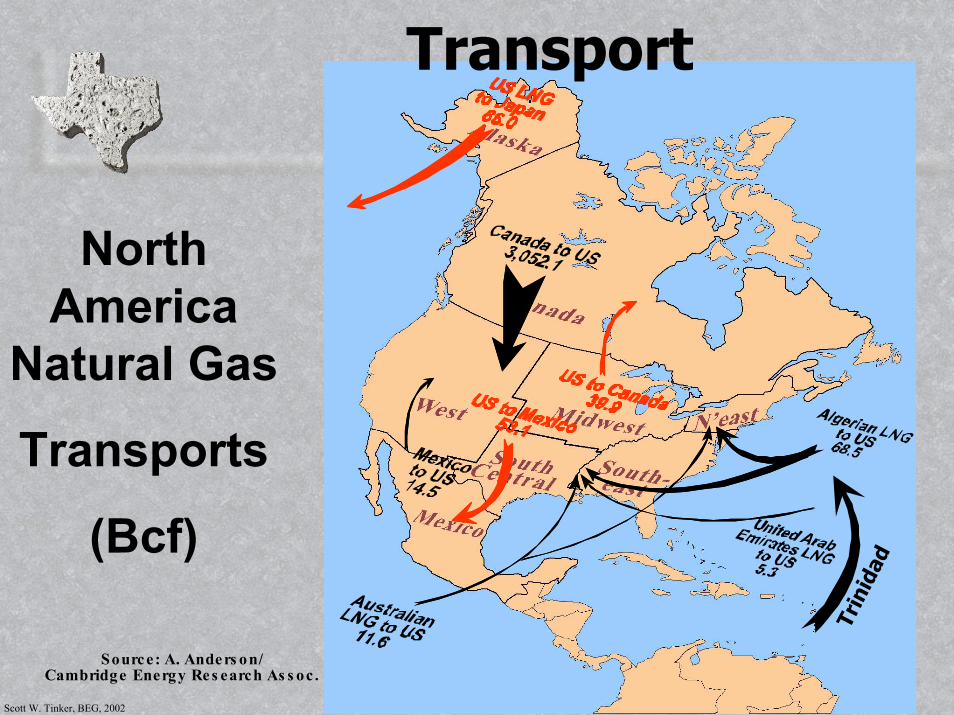
Source: A. Anders on/Cambridge Energy Res earch As s oc .
Trin
idad
Transport
North America
Natural Gas
Transports
(Bcf)
Scott W. Tinker, BEG, 2002
Scott W. Tinker, BEG, 2002
Sequester
The sustainability of a hydrocarbon-fueled economy requires that we support an
environment and energy win-win.
Capture carbon dioxide and return it to the subsurface for the economic benefit of
enhanced hydrocarbon recovery and the environmental benefit of reduced
atmospheric carbon dioxide.
Scott W. Tinker, BEG, 2002
#
#
#
#
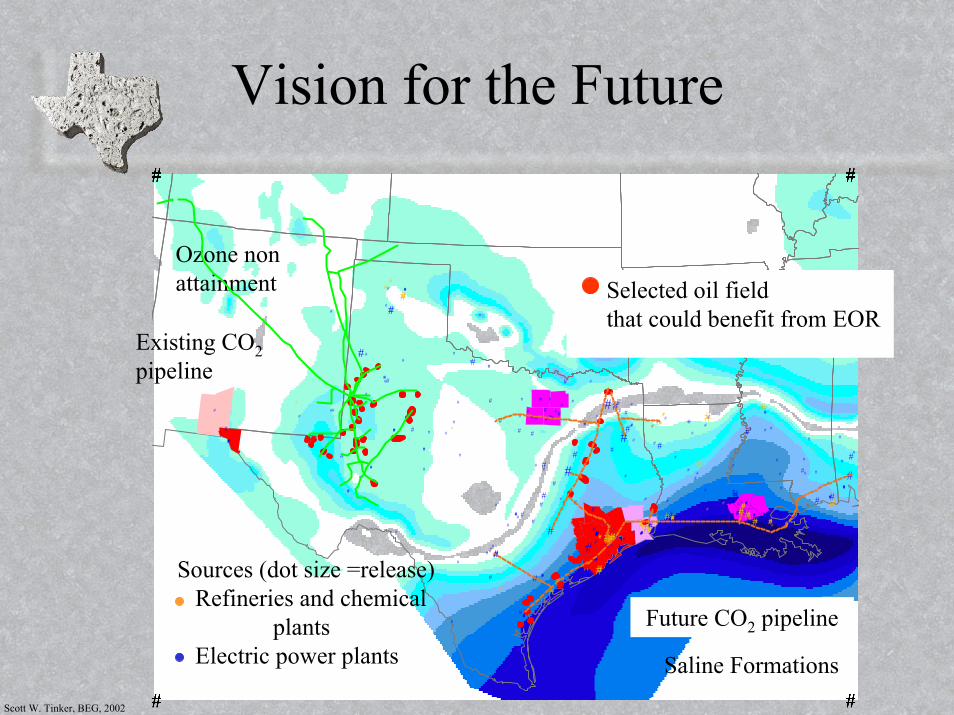
Saline Formations
Vision for the Future#
#
#
#
#
#
#
#
Ozone nonattainment
#
#
#
#
##
#
#
##
##
##
#
#
#
###
# #
#
##
#
##
#
#
#
#
#
#
#
#
###
#
##
#
## #
#
# #
#
# # #
#
## #
#
#
##
#
#
#
#
##
##
##
#
#
###
#
#
#####
##
##
#
#
#
#
#
#
# ##
#
#
#
#
# #
#
#
#
# #
#
#
#
#
##
#
##
##
#
## ##
#
#
#
#
###
#
####
##
#
#
##
##
##
# #
##
#
# #
#
#
#
#
#
##
#
##
#
# #
#
#
#
#
#
#
#
#
#
##
# ##
#
#
#
#
#
##
#
#
#
#
#
#
#
#
#
#
##
#
###
#
#
#
#
#
#
#
#
#
#
#
##
#
#
#
#
###
#
#
##
##
# #
#
#
#
#
### # ###
#
#
##
#
#
#
#
#
#
#
#
#
##
#
#
#
#
#
#
#
#
#
#
#
#
#
#
#
#
#
#
#
#
#
#
#
#
#
#
#
#
##
# #
#
#
#
#
#
#
#
#
#
#
#
#
#
#
#
#
#
#
#
#
#
#
#
#
#
#
#
#
##
#
#
#
##
#
#
#
#
#
#
#
#
#
#
#
#
#
#
#
#
#
#
##
#
##
#
##
#
##
##
##
##
##
###
# #
#
#
#
##
###
#
#
##
##
#
#
#
##
#
#
#
##
#
## # ##
#
## #
#
#
#
#
# #
## #
#
#
#
#
#
##
##
#
#
##
#
#
#
#
#
#
#
#
#
Sources (dot size =release)Refineries and chemical
plantsElectric power plants
#
#
#
#
Selected oil fieldthat could benefit from EOR
#
#
#
#
Existing CO2pipeline
#
#
#
#
Future CO2 pipeline
Scott W. Tinker, BEG, 2002 QAd1023
Summary and Opportunities
Scott W. Tinker, BEG, 2002
Summary
0.00
20.00
40.00
60.00
80.00
100.00
120.00
140.00
160.00
1950
1960
1970
1980
1990
2000
2010
2020
2030
2040
2050
Qua
d B
TU
Gases and Renewables
Liquids
Solids
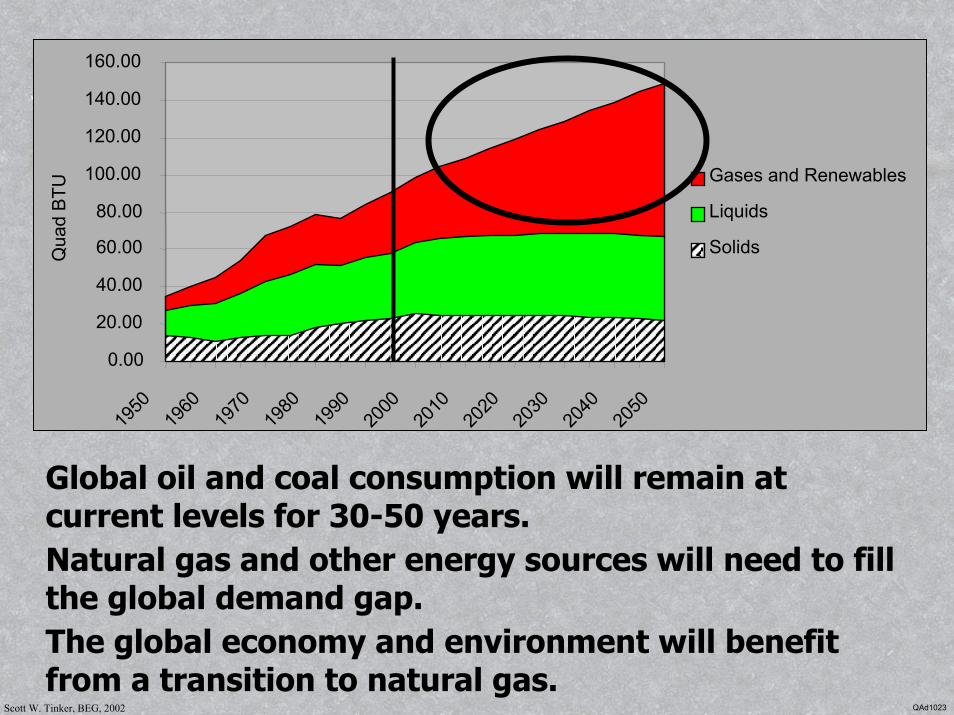
Global oil and coal consumption will remain at current levels for 30-50 years.Natural gas and other energy sources will need to fill the global demand gap.The global economy and environment will benefit from a transition to natural gas.
QAd1023
Scott W. Tinker, BEG, 2002
Opportunities
Research and technology for a natural gas industry are different than for an oil industry.Unconventional sources will require significantgeoscience and engineering advancements and talent. Sequestration of greenhouse gases should impact atmospheric emissions, and represents a new industry opportunity.The Private-Federal model must evolve, and will represent new partnership opportunities.
QAd1023
Scott W. Tinker, BEG, 2002
Thank You!


![Soft Artificial Life, Artificial Agents and Artificial ... Life-springer... · Soft Artificial Life, Artificial Agents and Artificial ... Introduction Artificial ... Stillings [22]](https://img.pdfslide.us/doc/110x75/5b0b2db47f8b9ae61b8d59e8/soft-artificial-life-artificial-agents-and-artificial-life-springersoft.jpg)