Embed Size (px)
Citation preview
A World of Solutions
The Collier County Beach Management Program
Over Two Decades Gary McAlpin, P.E., Coastal Zone Management Director, Collier County, FL
Thomas Pierro, P.E., D.CE, Director of Coastal Restoration, CB&I, Boca Raton, FL
Brett Moore, P.E., D. CE, President, Humiston & Moore Engineers, Naples, FL
Acknowledgments
Stephen Keehn P.E., Tara Brenner P.G., Lauren Floyd (CB&I)
FSBPA 59th Annual Conference September 14-16, 2016; Naples, FL
A World of Solutions
1
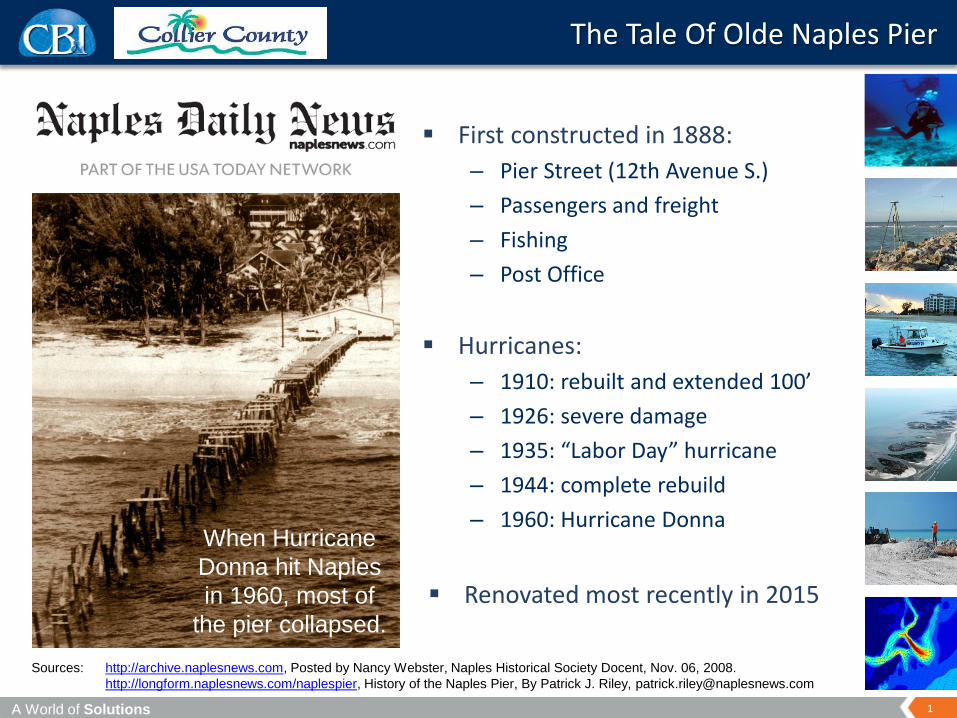
The Tale Of Olde Naples Pier
When Hurricane
Donna hit Naples
in 1960, most of
the pier collapsed.
Sources: http://archive.naplesnews.com, Posted by Nancy Webster, Naples Historical Society Docent, Nov. 06, 2008.
http://longform.naplesnews.com/naplespier, History of the Naples Pier, By Patrick J. Riley, [email protected]
First constructed in 1888:
– Pier Street (12th Avenue S.)
– Passengers and freight
– Fishing
– Post Office
Hurricanes:
– 1910: rebuilt and extended 100’
– 1926: severe damage
– 1935: “Labor Day” hurricane
– 1944: complete rebuild
– 1960: Hurricane Donna
Renovated most recently in 2015

2 A World of Solutions
Characteristics that shape the beach management program:
– Beach community
– Generally narrow and low elevation
– Small (or no) vegetated dunes
– Shallow waters extend far offshore
– Miles of nearshore hardbottom
– Challenging offshore sand sources
– Low longshore sand transport rates
Collier County's Unique Beaches
A World of Solutions
3
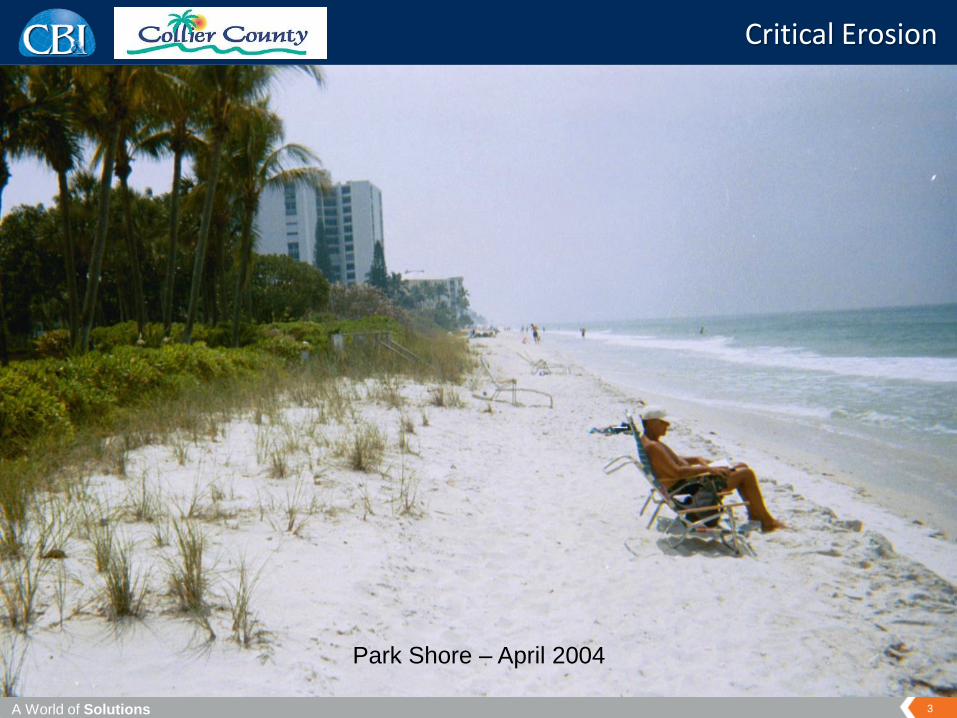
Critical Erosion
Park Shore – April 2004
A World of Solutions
4
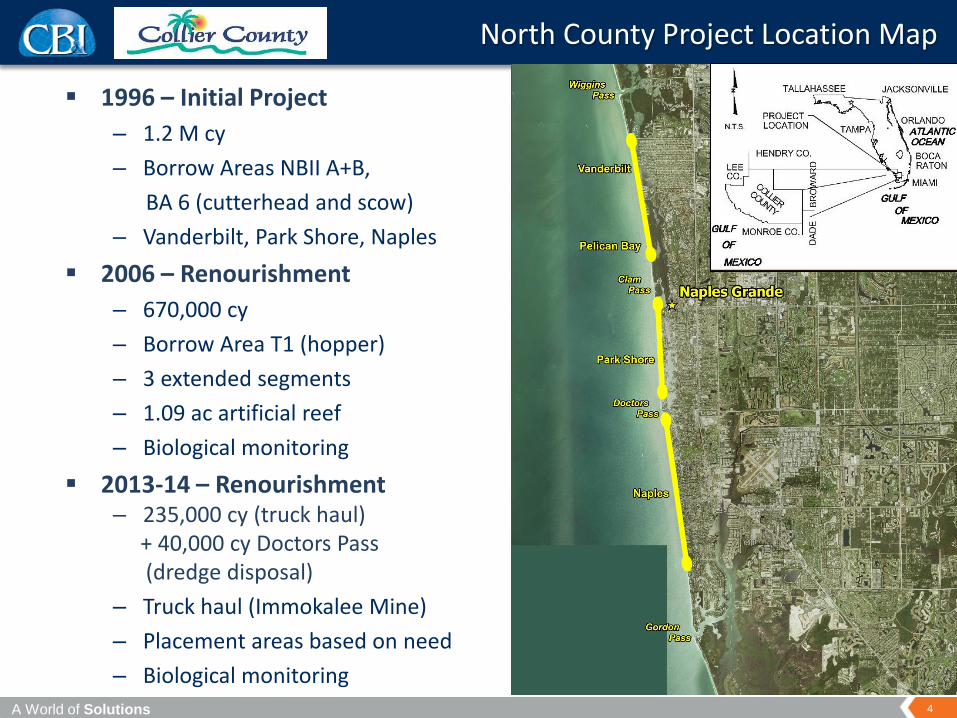
1996 – Initial Project
– 1.2 M cy
– Borrow Areas NBII A+B,
BA 6 (cutterhead and scow)
– Vanderbilt, Park Shore, Naples
2006 – Renourishment
– 670,000 cy
– Borrow Area T1 (hopper)
– 3 extended segments
– 1.09 ac artificial reef
– Biological monitoring
2013-14 – Renourishment – 235,000 cy (truck haul) + 40,000 cy Doctors Pass (dredge disposal)
– Truck haul (Immokalee Mine)
– Placement areas based on need
– Biological monitoring
North County Project Location Map
A World of Solutions
5
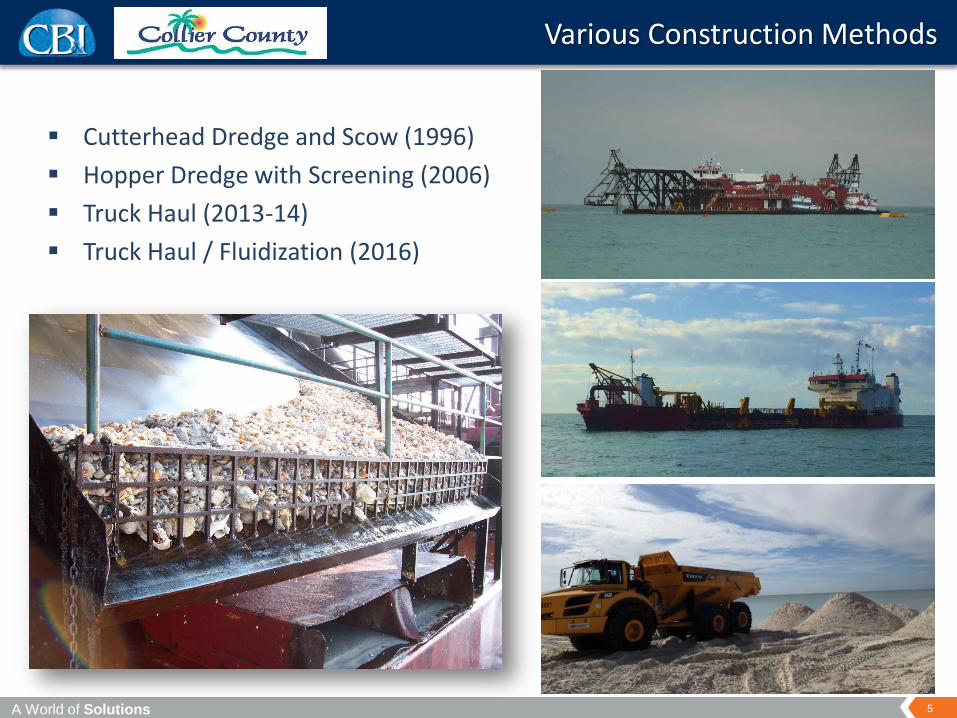
Cutterhead Dredge and Scow (1996)
Hopper Dredge with Screening (2006)
Truck Haul (2013-14)
Truck Haul / Fluidization (2016)
Various Construction Methods
A World of Solutions
6
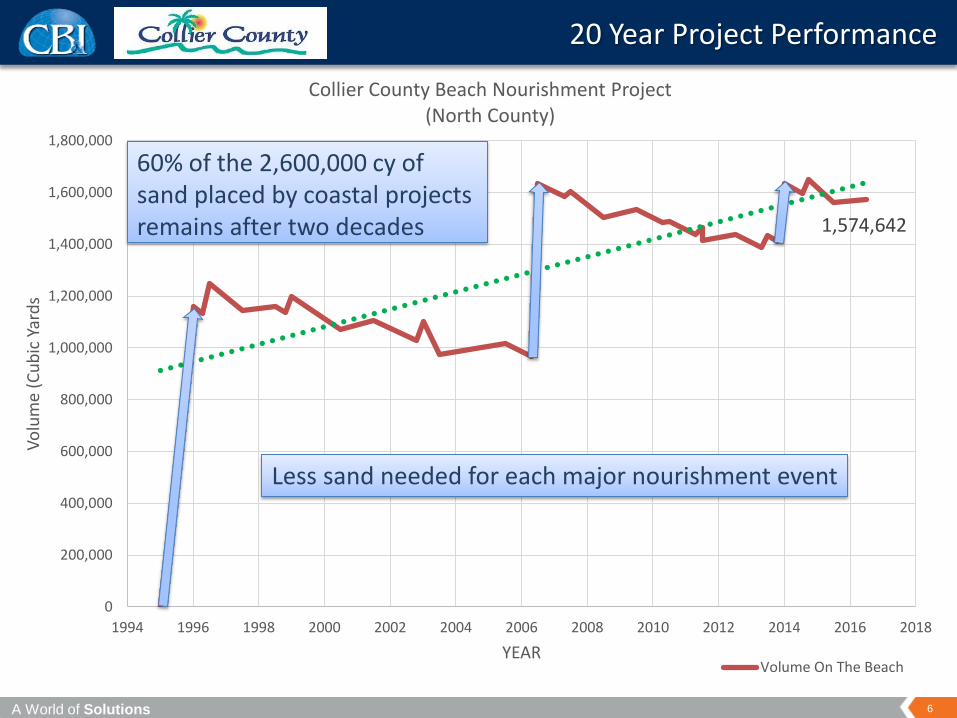
20 Year Project Performance
1,574,642
0
200,000
400,000
600,000
800,000
1,000,000
1,200,000
1,400,000
1,600,000
1,800,000
1994 1996 1998 2000 2002 2004 2006 2008 2010 2012 2014 2016 2018
Vo
lum
e (C
ub
ic Y
ard
s
YEAR
Collier County Beach Nourishment Project (North County)
Volume On The Beach
60% of the 2,600,000 cy of sand placed by coastal projects remains after two decades
Less sand needed for each major nourishment event
A World of Solutions
7
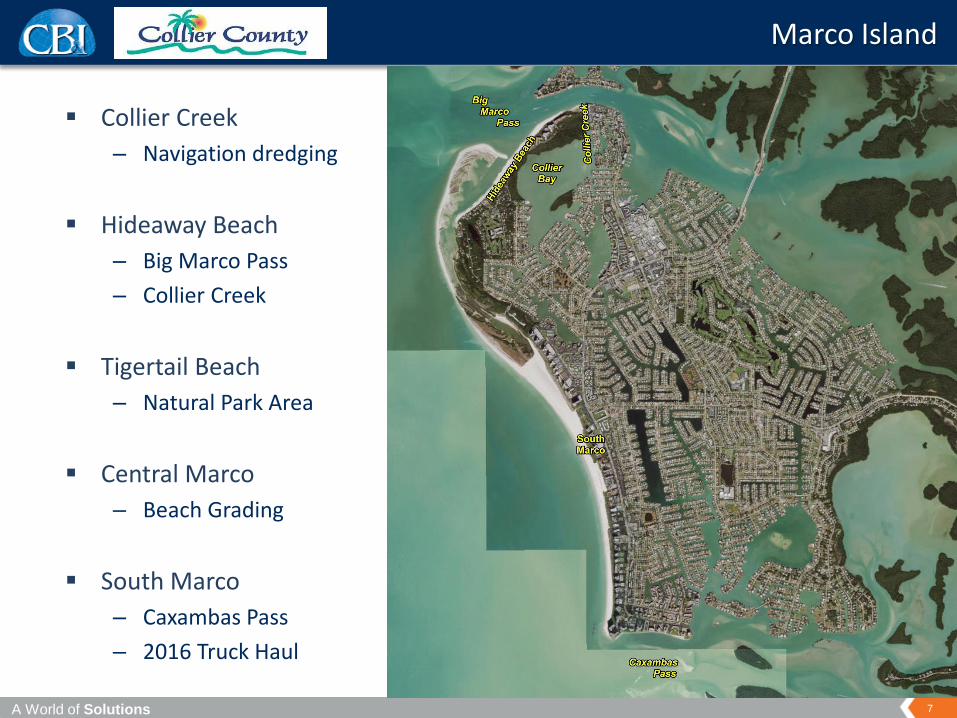
Collier Creek
– Navigation dredging
Hideaway Beach
– Big Marco Pass
– Collier Creek
Tigertail Beach
– Natural Park Area
Central Marco
– Beach Grading
South Marco
– Caxambas Pass
– 2016 Truck Haul
Marco Island
A World of Solutions
8
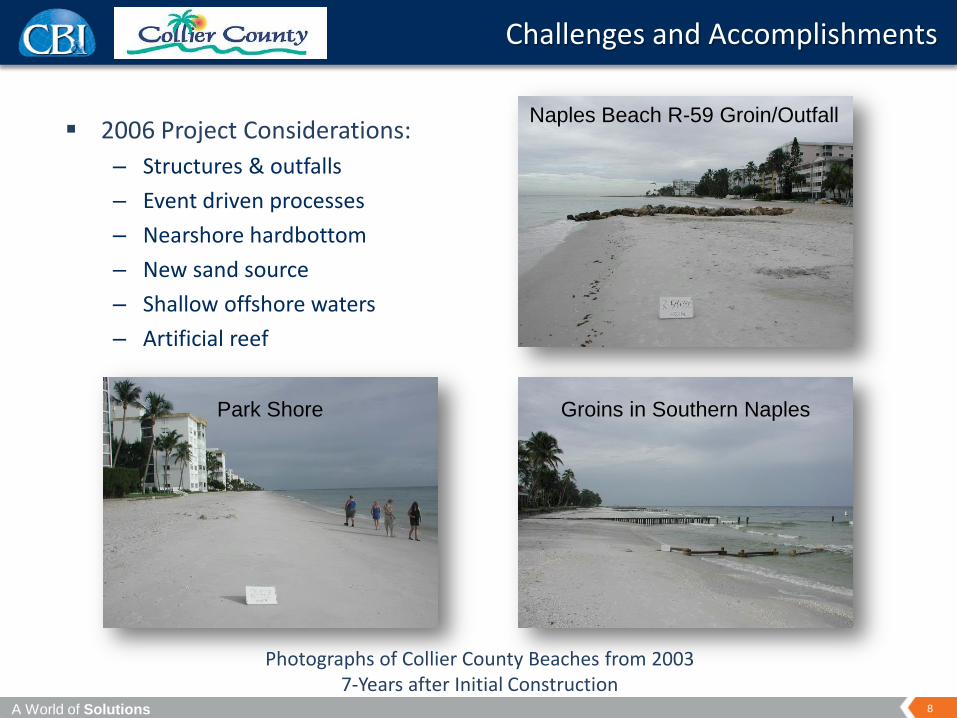
2006 Project Considerations:
– Structures & outfalls
– Event driven processes
– Nearshore hardbottom
– New sand source
– Shallow offshore waters
– Artificial reef
Challenges and Accomplishments
Naples Beach R-59 Groin/Outfall
Groins in Southern Naples Park Shore
Photographs of Collier County Beaches from 2003 7-Years after Initial Construction
A World of Solutions
9
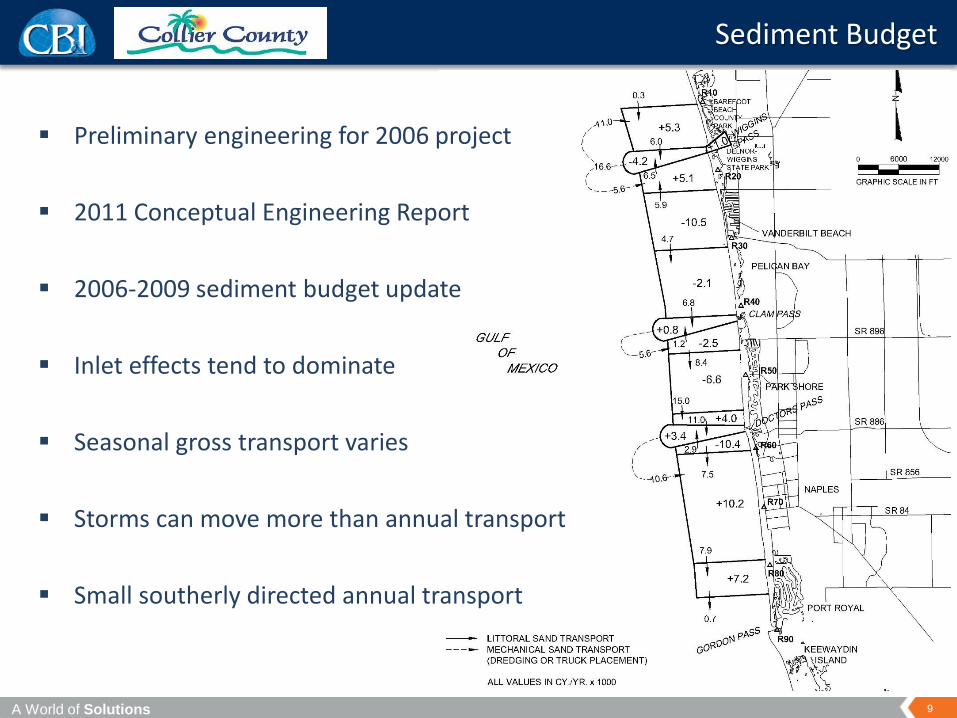
Preliminary engineering for 2006 project
2011 Conceptual Engineering Report
2006-2009 sediment budget update
Inlet effects tend to dominate
Seasonal gross transport varies
Storms can move more than annual transport
Small southerly directed annual transport
Sediment Budget
A World of Solutions
10
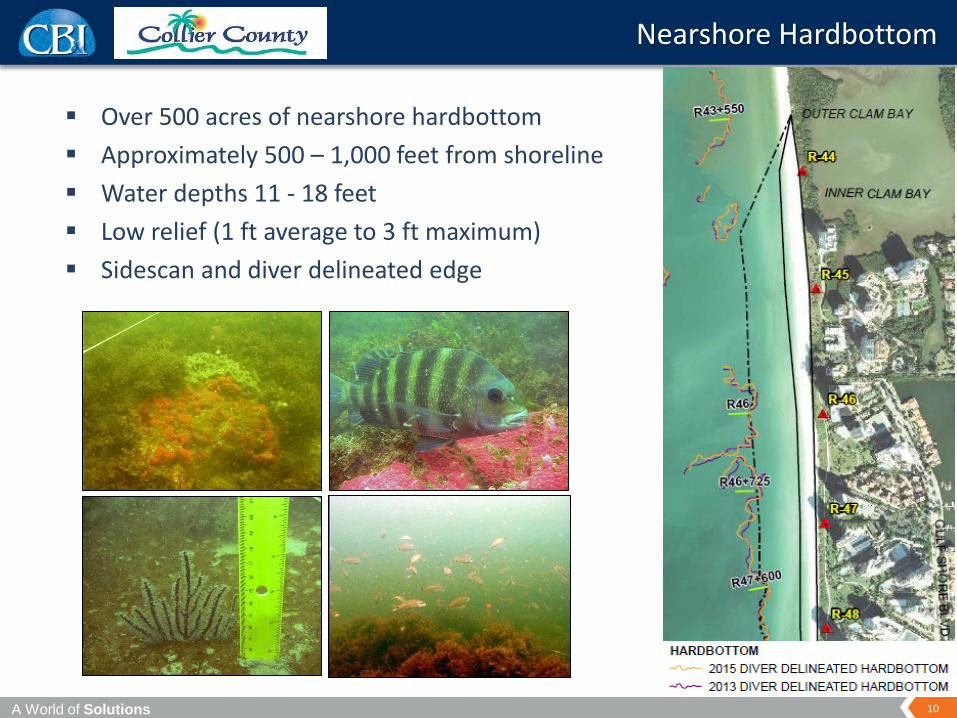
Over 500 acres of nearshore hardbottom
Approximately 500 – 1,000 feet from shoreline
Water depths 11 - 18 feet
Low relief (1 ft average to 3 ft maximum)
Sidescan and diver delineated edge
Nearshore Hardbottom
A World of Solutions
11
Potential Hardbottom Impacts
-12
-10
-8
-6
-4
-2
0
2
4
6
8
10
50 100 150 200 250 300 350 400 450 500 550 600 650 700 750
EL
EV
AT
ION
(F
T-N
GV
D)
DISTANCE (FT)
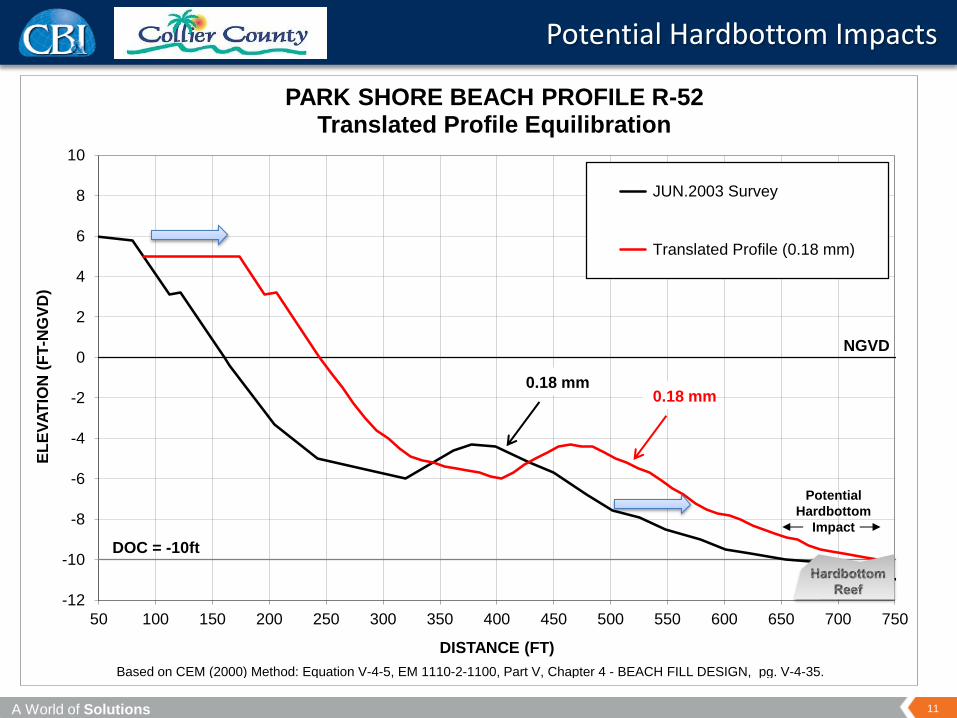
PARK SHORE BEACH PROFILE R-52 Translated Profile Equilibration
JUN.2003 Survey
Translated Profile (0.18 mm)
NGVD
DOC = -10ft
Based on CEM (2000) Method: Equation V-4-5, EM 1110-2-1100, Part V, Chapter 4 - BEACH FILL DESIGN, pg. V-4-35.
0.18 mm
Potential
Hardbottom
Impact
0.18 mm
A World of Solutions
12
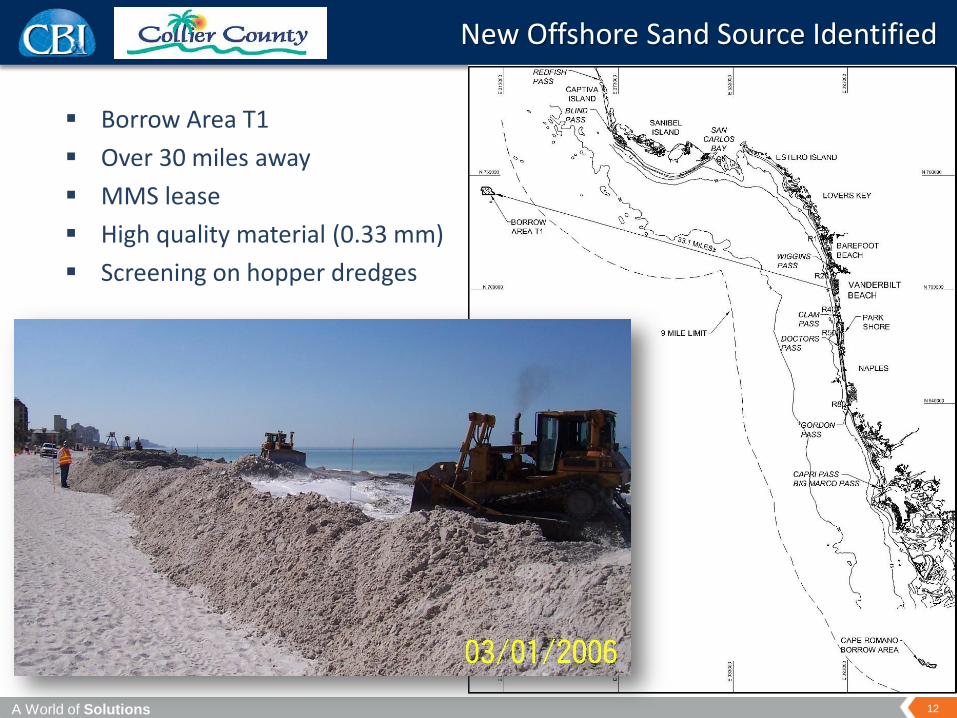
Borrow Area T1
Over 30 miles away
MMS lease
High quality material (0.33 mm)
Screening on hopper dredges
New Offshore Sand Source Identified
A World of Solutions
13
Coarse Sand Adjustment
-12
-10
-8
-6
-4
-2
0
2
4
6
8
10
50 100 150 200 250 300 350 400 450 500 550 600 650 700 750
EL
EV
AT
ION
(F
T-N
GV
D)
DISTANCE (FT)
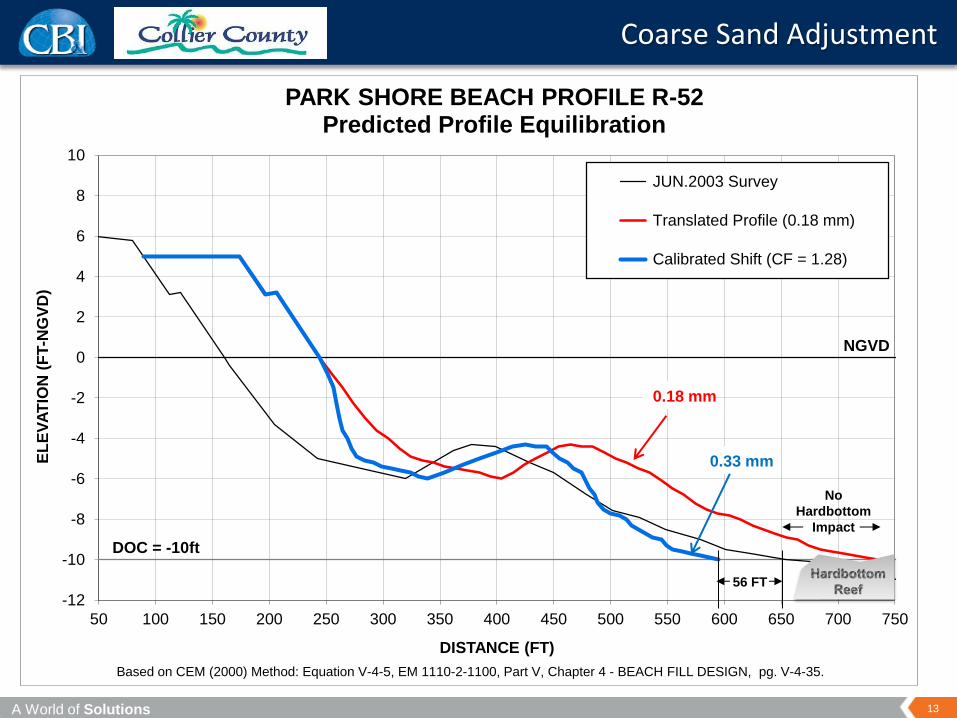
PARK SHORE BEACH PROFILE R-52 Predicted Profile Equilibration
JUN.2003 Survey
Translated Profile (0.18 mm)
Calibrated Shift (CF = 1.28)
NGVD
DOC = -10ft
Based on CEM (2000) Method: Equation V-4-5, EM 1110-2-1100, Part V, Chapter 4 - BEACH FILL DESIGN, pg. V-4-35.
56 FT
0.33 mm
0.18 mm
No
Hardbottom
Impact
A World of Solutions
14
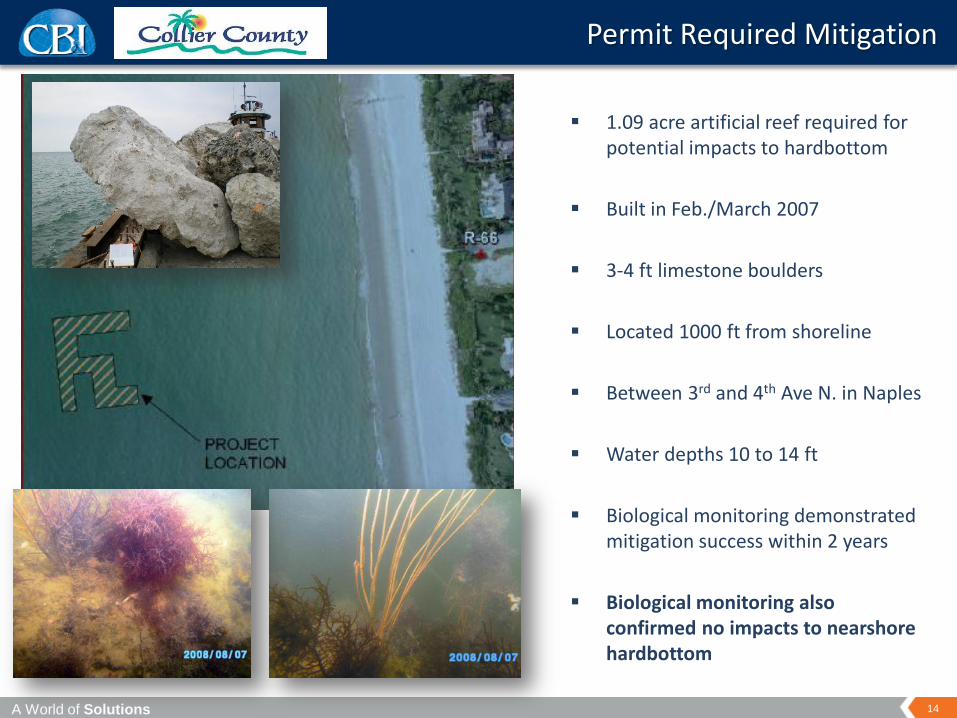
1.09 acre artificial reef required for potential impacts to hardbottom
Built in Feb./March 2007
3-4 ft limestone boulders
Located 1000 ft from shoreline
Between 3rd and 4th Ave N. in Naples
Water depths 10 to 14 ft
Biological monitoring demonstrated mitigation success within 2 years
Biological monitoring also confirmed no impacts to nearshore hardbottom
Permit Required Mitigation
A World of Solutions
15
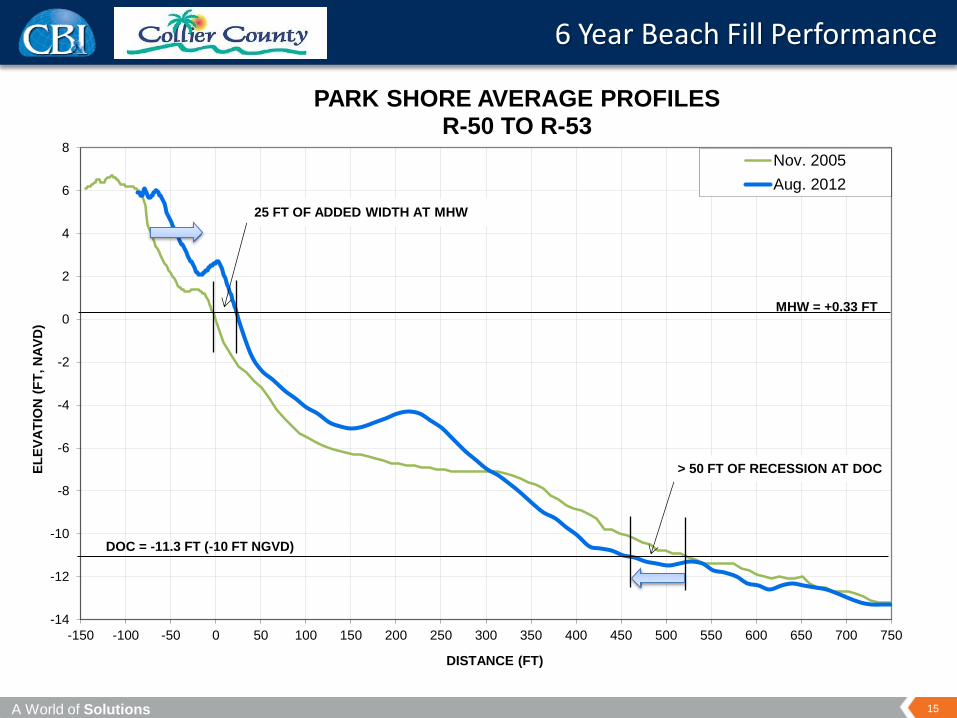
6 Year Beach Fill Performance
-14
-12
-10
-8
-6
-4
-2
0
2
4
6
8
-150 -100 -50 0 50 100 150 200 250 300 350 400 450 500 550 600 650 700 750
EL
EV
AT
ION
(F
T, N
AV
D)
DISTANCE (FT)
PARK SHORE AVERAGE PROFILES R-50 TO R-53
Nov. 2005
Aug. 2012
25 FT OF ADDED WIDTH AT MHW
> 50 FT OF RECESSION AT DOC
MHW = +0.33 FT
DOC = -11.3 FT (-10 FT NGVD)
A World of Solutions
16
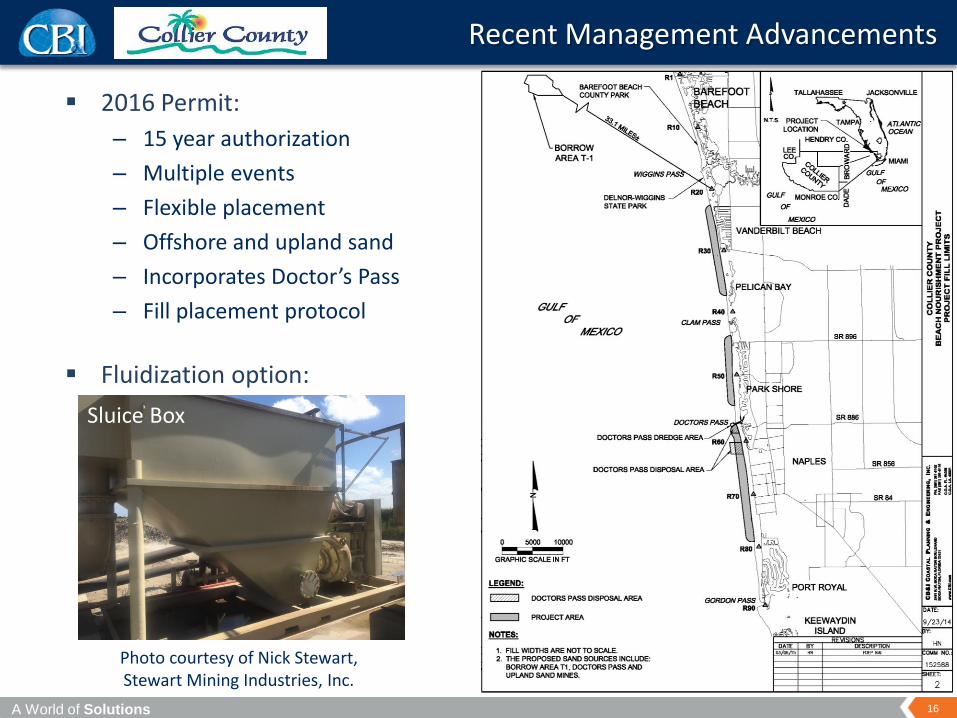
2016 Permit:
– 15 year authorization
– Multiple events
– Flexible placement
– Offshore and upland sand
– Incorporates Doctor’s Pass
– Fill placement protocol
Fluidization option:
Recent Management Advancements
Sluice Box
Photo courtesy of Nick Stewart, Stewart Mining Industries, Inc.
17 A World of Solutions
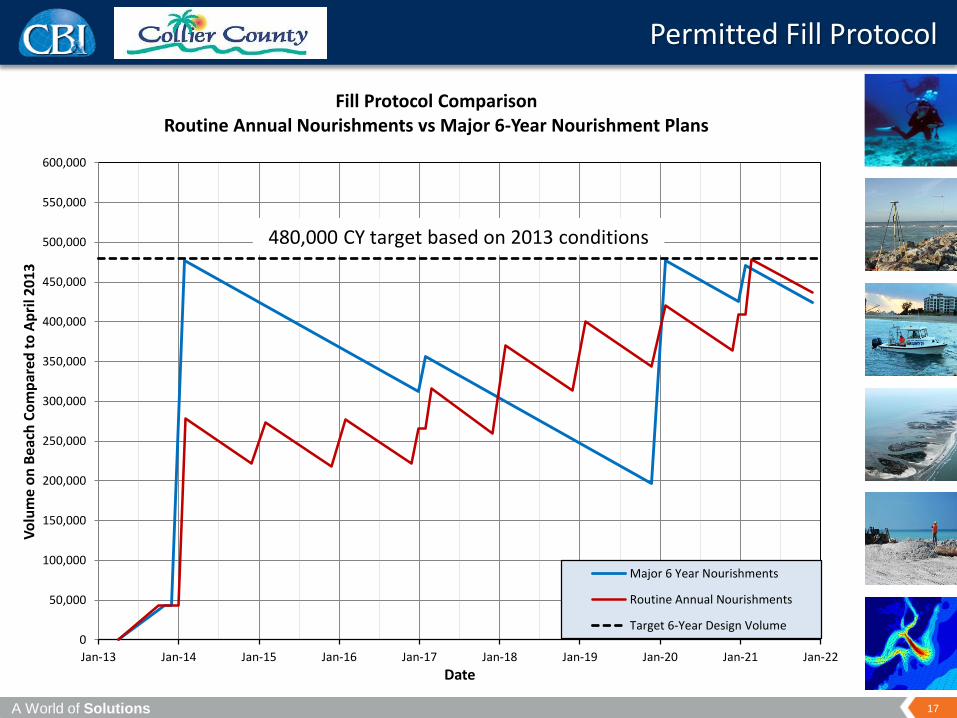
Permitted Fill Protocol
0
50,000
100,000
150,000
200,000
250,000
300,000
350,000
400,000
450,000
500,000
550,000
600,000
Jan-13 Jan-14 Jan-15 Jan-16 Jan-17 Jan-18 Jan-19 Jan-20 Jan-21 Jan-22
Vo
lum
e o
n B
each
Co
mp
ared
to
Ap
ril 2
01
3
Date
Fill Protocol Comparison Routine Annual Nourishments vs Major 6-Year Nourishment Plans
Major 6 Year Nourishments
Routine Annual Nourishments
Target 6-Year Design Volume
480,000 CY target based on 2013 conditions
18 A World of Solutions
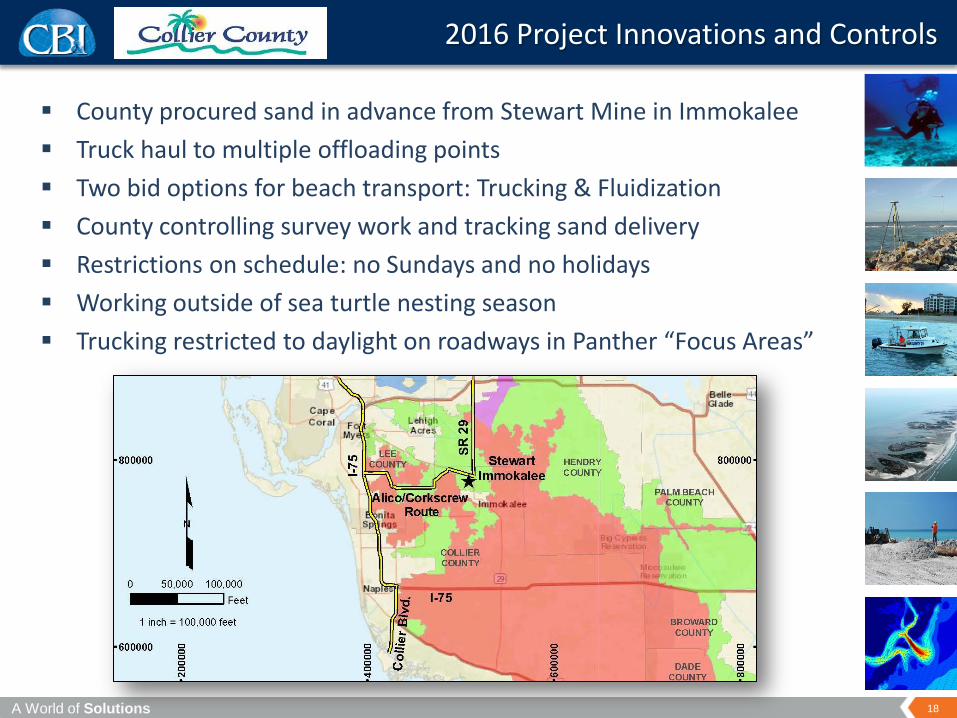
2016 Project Innovations and Controls
County procured sand in advance from Stewart Mine in Immokalee
Truck haul to multiple offloading points
Two bid options for beach transport: Trucking & Fluidization
County controlling survey work and tracking sand delivery
Restrictions on schedule: no Sundays and no holidays
Working outside of sea turtle nesting season
Trucking restricted to daylight on roadways in Panther “Focus Areas”
19 A World of Solutions
For The Next Two Decades …
Sand staying in the system and decreasing renourishment needs
No additional mitigation
Monitor and address needs with annual maintenance program
Flexibility in approach
Cost considerations for dredging vs. truck haul
Public safety is paramount
A World of Solutions
20
Thank You!
CB&I Contact:
Thomas P. Pierro, P.E., D.CE
(561) 391-8102 office
(561) 361-3150 direct
(561) 756-2535 cell
(561) 391-9116 fax
Gary McAlpin, P.E.
Coastal Zone Management Director
Collier County, FL
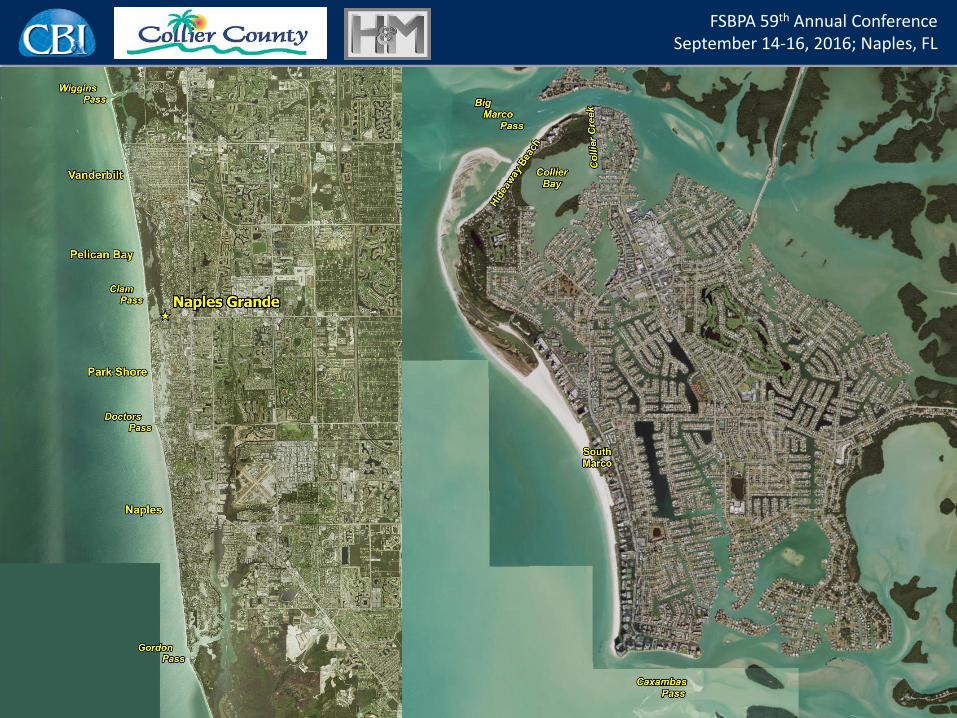
FSBPA 59th Annual Conference
September 14-16, 2016; Naples, FL