Embed Size (px)
Citation preview

IMPACT OF CLIMATE CHANGE ON WATER RESOURCES OF
THE COASTAL WETLANDS IN LEBANON
International Hydrological Programme
United NationsEducational, Scientific and
Cultural Organization
IMPACT OF CLIMATE CHANGE ON WATER RESOURCES OF
THE COASTAL WETLANDS IN LEBANON

Note
The views expressed in this document do not necessarily represent the official views of UNEP, UNESCO,
GEF and MAP. This document does not put in question international frontiers or boundaries, or the legal
status of any territory, city or area presented. The cited institutions fully disclaim any liability that is in any
way related to the use of the contents of this document.
The preparation of this document was initiated by UNESCO-IHP and coordinated and published under its
leadership.
Photos : © CNRS Lebanon
©2015 UNESCO-IHP, Paris
For bibliographic purposes this document may be cited as:
UNEP-MAP, UNESCO-IHP, CNRS Lebanon (2015). Impact of climate change on water resources of the
coastal wetlands in Lebanon, Strategic Partnership for the Mediterranean Sea Large Marine Ecosystem
(MedPartnership), Paris.

3
PREFACE
Water is still the major issue in many regions around the world, and is the priority for discussions in local, regional and global assemblies. This is the status quo, since the significance of and need for water has remained constant since humans evolved. Water is vital to life, and ancient populations settled around water resources.
There are different aspects to water resources depending on whether they are found on the surface or in the subsurface of the land, resulting in rivers, springs, lakes and groundwater reservoirs among rocks. These are conventional and well known, but there is also a spectrum of non-conventional water resources. This includes invisible water resources (e.g. offshore groundwater springs) and intermittently visible resources, such as wetlands.
The Lebanese National Council for Scientific Research (CNRS) constantly monitors water resources, whether in terms of research or in application of new technologies to explore and assess them. As a result numerous water studies and projects have been produced by CNRS and these make a substantial contribution to water management and polices in Lebanon.
The United Nations Educational, Scientific and Cultural Organization (UNESCO)-International Hydrological Programme (IHP) is an intentional entity concerned with sustainable development of natural resources, including water, and contributes to a number of development studies and projects on water resource management. There has been marked bilateral
coordination between CNRS and UNESCO-IHP in the last 2 years and the present study is a typical example of their cooperative scientific work.
In the framework of the Global Environment Facility (GEF) United Nations Environment Programme (UNEP)/Mediterranean Action Plan (MAP) Strategic Partnership for the Mediterranean Sea Large Marine Ecosystem (the “MedPartnership project”) and UNESCO-IHP’s sub-component 1.1 on the “Management of Coastal Aquifers and Groundwater”, this work was carried out under my supervision to implement the activity related to “Eco-hydrology and Coastal Wetlands”. CNRS carried out this activity, investigating two coastal wetlands with different hydrological regimes. The study aimed at highlighting the physical stresses on the existing wetlands, with a special focus on the impact of climate change. The resulting research document will benefit decision makers, and promote better monitoring and management of these unique water bodies and landscapes in Lebanon.
Project Team:
Amin Shaban – Hydrology & Climate Change (Project Coordinator)
Ghaleb Faour – Land Cover/Use Mapping
Carla Khater – Ecosystem
Talal Darwich -- Soil

4
LIST OF TABLES
Table 1.1. Wetlands identified wetlands in Lebanon* (Shaban, 2013) 10
Table 5.1. Hydrologic characteristics of the different rock formations in the Ras Ech-Chekkaa site and surroundings 35
Table 5.2. Hydrologic characteristics of the different rock formations at the Tyre Beach site and the adjacent mountainous regions 37
Table 5.3. Physicochemical characteristics of the eutric leptosols 39
Table 5.4. Physicochemical characteristics of the lithic leptosols 40
Table 5.5. Physicochemical characteristics of the gleyic luvisols 40
Table 5.6. Physicochemical characteristics of the hypocalcaric fluvisols 41
Table 5.7. Physicochemical characteristics of the haplic vertisols 41
Table 5.8. Physicochemical characteristics of the hypocalcaric fluvisols 42
Table 5.9. Numbers of bird species in the Cliffs of Ras Ech-Chekkaa between 1994 and 2014 43
Table 5.10. Numbers of bird species at the Tyre Beach site between 1994 and 2014 44
Table 5.11. Areas of major land cover components of Ras Ech-Chekkaa site (2014) 45
Table 5.12. Changing areas of major land cover components of the Ras Ech-Chekkaa site (2005-2014) 46
Table 5.13. Areas of major land cover components of Tyre Beach site (2014) 46
Table 5.14. Changing areas of major land cover components of Tyre Beach site (2005-2014) 47
LIST OF FIGURES
Figure 1.1. Wetlands identified in Lebanon 11
Figure 2.1. Location of Deir El-Nouriyeh-Cliffs of Ras Ech-Chekkaa (Ramsar site) 14
Figure 2.2. Location of Tyre Beach Nature Reserve (Ramsar site) 14
Figure 2.3. Rainfall distribution over Ras Ech-Chekkaa site and surroundings 15
Figure 2.4. Rainfall distribution over Tyre Beach site and surroundings 16
Figure 2.5. Geological map of Ras Ech-Chekkaa and surroundings (Dubertret, 1953) 17
Figure 2.6. Stratigraphic sequence of Ras Ech-Chekkaa site 18
Figure 2.7. Geological map of Tyre Beach site and surroundings (Dubertret, 1953) 18
Figure 2.8. Stratigraphic sequence of Tyre Beach site 19
Figure 3.1. IKONOS satellite image (0.83 m resolution) showing Tyre wetland where different water bodies exist 22
Figure 5.1. Average monthly rainfall trend for the Ras Ech-Chekkaa region 30
Figure 5.2. Average monthly rainfall trend for the Tyre Beach region 31
Figure 5.3. Average monthly temperature trend for the Ras Ech-Chekkaa region 31
Figure 5.4. Average monthly temperature trend for the Tyre Beach region 32
Figure 5.5. The general stream flow in the northern channel in the Tyre Beach region 33
Figure 5.6. The general stream flow in the leakage channel in the Tyre Beach region 34
Figure 5.7. The general stream flow at the sea mouth of the Tyre Beach region 34
Figure 5.8. Hydrogeological cross-section in the Ramsar site of Ras Ech-Chekkaa Cliffs and surroundings 36
Figure 5.9. Faults identified after processing of Aster satellite images 37
Figure 5.10. Hydrogeological cross-section of the Ramsar site of Tyre Beach and surroundings 38
Figure 5.11. Soil type map of the Ras Ech-Chekkaa Ramsar site 39
Figure 5.12. Soil type map of the Tyre Beach Ramsar site 40
Figure 5.13. Land cover maps (2005 and 2014) for the Ras Ech-Chekkaa site, as identified from Geo-Eye-1 satellite images 45
Figure 5.14. Land cover maps of 2005 and 2014 for Tyre Beach site, as identified from satellite images 47
Figure 6.1. Characterization of Ras Ech-Chekkaa wetland site 51
Figure 6.2. Characterization of Tyre Beach wetland site 51
Figure 6.3. Scheme showing groundwater flow mechanism in the Ras Ech-Chekkaa site 52
Figure 6.4. Scheme showing groundwater flow mechanism in Tyre Beach site 53
LIST OF PHOTOS
Photo 3.1. Flow meter fixed in the leakage channel in Tyre Beach wetland 22
Photo 5.1. A major water pond at the Tyre Beach site 33
Photo 5.2. Water pond with a conveying channel at the Tyre Beach site 33
Photo 5.3. Profile of eutric leptosols 39
Photo 5.4. Haplic vertisols irrigated by the furrow method 41
Photo 5.5. Spartium junceum (Spanish broom) 42
Photo 5.6. Caretta caretta, loggerhead turtle 44
Photo 6.1. Overgrazing in the Ras Ech-Chekkaa area 52
Photo 6.2. Landfill in the proximity (< 250 m) of Tyre Beach site 53

5
TABLE OF CONTENTS
PREFACE 3
TABLE OF CONTENTS 5
ABSTRACT 7
1. INTRODUCTION 9
1.1 General overview 10
1.2 Wetlands of Lebanon 10
1.3 Motivations 11
1.4 Objectives 11
2. STUDY AREAS 13
2.1 Geographic setting 142.1.1 Ras Ech-Chekkaa Cliffs site 142.1.2 Tyre Beach site 14
2.2 Climate 15
2.3 Geomorphology 162.3.1 Geomorphology of Ras Ech-Chekkaa Cliffs 162.3.2 Geomorphology of Tyre Beach 17
2.4 Geology 172.4.1 Geology of Ras Ech-Chekkaa Cliffs 172.4.2 Geology of Tyre Beach 18
3. TOOLS FOR ANALYSIS 21
3.1 Climatic data 22
3.2 Hydrologic data 22
3.3 Satellite images and software 23
3.4 Thematic maps 23
3.5 Field surveys 23
4. METHODS FOR ANALYSIS 25
4.1 Climatic data analysis 26
4.2 Hydrologic data analysis 26

6
4.3 Groundwater investigation 274.3.1 Hydrostratigraphy 274.3.2 Hydrostructure 27
4.4 Soil classification 27
4.5 Ecosystem analysis 28
4.6 Land cover map and its classification 28
5. RESULTS 29
5.1 Climatic trends 305.1.1 Rainfall trends in Ras Ech-Chekkaa 305.1.2 Rainfall trends in Tyre Beach 305.1.3 Temperature trends in Ras Ech-Chekkaa 305.1.4 Temperature trends in Tyre Beach 30
5.2 Water resources 325.2.1 Water resources at the Ras Ech-Chekkaa site 325.2.2 Changing water volume at the Tyre Beach site 32
5.3 Hydrogeology 355.3.1 Hydrogeology of the Ras Ech-Chekkaa Cliffs region 355.3.2 Hydrogeology of the Tyre Beach region 36
5.4 Soil 395.4.1 Soil types of the Ras Ech-Chekkaa region 395.4.2 Soil types of the Tyre Beach region 40
5.5 Ecosystem 425.5.1 Ecosystem of Ras Ech-Chekkaa region 425.5.2 Ecosystem of Tyre Beach 43
5.6 Land cover map 455.6.1 Land cover of Ras Ech-Chekkaa 455.6.2 Land cover of Tyre Beach 46
6. DISCUSSION, CONCLUSION AND RECOMMENDATIONS 49
6.1 Wetland criteria 50
6.2 Physical and anthropogenic stresses on the Ras Ech-Chekkaa site 52
6.3 Physical and anthropogenic stresses on the Tyre Beach region 53
6.4 Proposed recommendations 536.4.1 Individual level 546.4.2 Institutional level 546.4.3 Legal level 54
REFERENCES 55

7
ABSTRACT
A “wetland” often occurs where there are considerable water resources, and there is a defined hydrologic regime that discriminates it from other water bodies. The unique landscape where wetlands are located needs to be monitored and preserved, since wetland continuity depends on a balanced input-output water system. The hydrologic setting of a wetland always creates unique ecosystems for flora (e.g. pollen) and fauna (e.g. birds), and this implies terrestrial and marine environments. In Lebanon, wetlands are well defined, and can range in size from hundreds of square metres to a few square kilometres. These typical landforms are mostly considered from the point of view of their reliable appearance and the saturated ground that surrounds them. Lately, the Lebanon’s wetlands have been subjected to physical and anthropogenic stresses that have put them under real threat. Their water supply becomes critically low, and some wetlands (e.g. Ras Ech-Chekkaa Cliffs) lose their hydrologic characterization. Changing climatic conditions,
with a special emphasis on the changing rainfall patterns and temperature increase, have a primary role in affecting Lebanese wetlands, notably those with a fragile hydrologic balance. This has been also reflected in the major terrain components (i.e. land cover/use) which have also changed over the last few decades. As a result, the area covered by these wet landforms has reduced because of the decreased volume of water inflow, and this has been exacerbated by uncontrolled human interference. In this study, two wetlands along the Lebanese coast were investigated using different tools and approaches for analysis. Although both selected wetlands extend along the coast, they have different hydrologic regimes, and so have been affected at different levels. This study introduces typical example accounting for a comparative analysis between wetlands in Lebanon with different hydrologic and aquifer characteristics.
Keywords: water body, saturated soil, climate change, coastal aquifer, ecosystem, Lebanon.

9
1. INTRODUCTION

10
IMPACT OF CLIMATE CHANGE ON WATER RESOURCES OF THE COASTAL WETLANDS IN LEBANON
1.1 GENERAL OVERVIEW
Water is a primary natural resource that merits considerable attention. It is becoming exhausted because of a number of natural processes, which are exacerbated by interference from human activities. There are several definitions for “wetland”, but they agree in describing water bodies with defined hydrologic regimes that result in water almost on the surface of the land, and whose ecosystems are distinguished from those around them. They are also identified as landforms where saturation with water is the dominant factor determining the nature of soil development and the types of plant and animal communities (Cowardin et al., 1992).
Lebanon encompasses a number of landforms saturated with water which represent additional water sources, making it a region with characteristic features, landscapes and ecosystems. These typical landforms are considered mainly from the frequent existence of water bodies on the land surface and the saturated substratum, and many physical elements contribute to the existence of wetlands.
Wetlands in Lebanon are found in regions with defined geomorphology and water inflow mechanisms, which are governed mainly by the geological setting and the hydrology and hydrogeology where they occur. They are mostly characterized by lowlands and depressions, long rainy seasons (November-April) and the existence of aquifers.
In Lebanon, wetlands are used for different purposes, but mainly for tourism, agronomical production and water supply. They are also known as localities for unique species of flora and fauna, and represent substantial sites where birds from Africa (e.g. Pernis apivorus, the European honey buzzard) congregate en route to Europe. These water-saturated landforms should be preserved with care as they constitute an integral part of the ecosystem in the region.
However, Lebanese wetlands are considered to be fragile ecosystems, and are greatly threatened by urban expansion, which has limited the ability of wildlife to flourish. Their preservation is important not only for ecological and economic reasons, but also because they constitute a valuable asset in the country’s natural heritage (El-Khouri, 2012).
Given more attention, the coastal wetlands could have considerable significance, since they represent remarkable natural sites along the extended Lebanese coastal zone. However, they are vulnerable since more than 70% of the country’s population occupies that zone, and thus uncontrolled activities have an exaggerated impact there.
Studies on Lebanese wetlands are still rare, compared with their natural importance at the national and regional level; in many cases they apply only to specific themes (Shaban, 2013; Hassan, 2015), or sometimes to regional projects (Ministry of Environment, 2006). Comprehensive knowledge of the wetlands is still lacking.
Recently, water resources in these wetlands have been substantially affected by changing climatic conditions (Shaban, 2014), with a special emphasis on changing rainfall patterns and temperature increase. As a result the major terrain components of the land cover have also changed in recent decades. The impact on water resources is marked and has resulted in an obvious loss in the natural value
of their essential components. The area of these wet landforms has reduced following a decrease in the volume of inflow water, and this has been exacerbated by uncontrolled human interference.
1.2 WETLANDS OF LEBANON
There may be more saturated regions in Lebanon that are almost wetlands, and these need to be identified. However, two major features are always considered as defining the existence of a wetland:
· The duration of water saturation (i.e. considerations of water volume)
· The spatial distribution of the saturated land (i.e. scale).
Nevertheless, there are many localities where water remains for a considerable time, but is of a relatively small areal extent. This is well known in lowland regions and depressions where a humid climate is dominant, such as in several geographic regions in the mountainous areas of Lebanon.
Seven wetlands have been identified in Lebanon (Shaban, 2013). They comprise three coastal wetlands (Palm Islands, Deir El-Nouriyeh-Cliffs of Ras Ech-Chekkaa and Tyre Beach) and four inland wetlands (Ayoun Orghosh, Aamiq, Chamsine/Anjar and Aiha) (Table 1.1; Figure 1.1). They amount to an area of about 16 km2. These wetlands are distinguished from each other by their different geomorphologies, hydrologies, hydrogeologies and ecosystems, and can be characterized as shallow lakes and ponds, estuaries and coastal wetlands; some (e.g. Tyre Beach) can be attributed to more than one of these at the same time.
Table 1.1. Wetlands identified wetlands in Lebanon* (Shaban, 2013)
No. Name Area (km2)
Description
1 Palm island 4.1 Three islands almost covered by saline water, notably among the karstic ponds
2 Cliffs of Ras Ech-Chekkaa
0.85 Jointed cliffs (~200 m) of carbonate rocks adjacent to the sea
3 Tyre Coast 3.8 Elongated watercourse from a number of artesian springs running to the coast
4 Ayoun Orghosh 0.47 Surface water in a depression in the land. It seeps from adjacent mountains and is fed mainly by snowmelt
5 Aamiq 2.8 Several natural ponds of freshwater in the carbonate rocks
6 Chamsine/Anjar 0.85 Watercourses of running water from Chamssine and Anjar spring that feed Litani River
7 Aaiha 3.2 Lowlands where water seeps from the neighbouring mountain chains
*Numbers are referenced in Figure 1.1.

11
1.IntroductIon
Only four wetlands were mentioned in the 2015 Ramsar list (http://www.ramsar.org/library/field_date/2014?search_api_views_fulltext=list&items_per_page=20). These are: Palm Islands, Deir El-Nouriyeh-Cliffs of Ras Ech-Chekkaa, Tyre Beach and Aamiq wetlands; the last three are also considered to be nature reserves.
There is, however, a debate about the Deir El-Nouriyeh-Cliffs of Ras Ech-Chekkaa wetland. It was reported in the preliminary field observations that the investigated region was not consistent with the criteria of wetlands. In addition, the exact location of the presumed wetland has not been determined precisely since the Ramsar list was compiled in 1994, and two sites have been proposed: one to the north of Deir El-Nouriyeh-Hamat villages and the other to the west of these villages. The latter has been considered in this study because it encompasses a defined region with minimal soil saturation. The northern site can almost be described as a bad-land; it has an irregular topography and many landslides with no defined area.
Figure 1.1. Wetlands identified in Lebanon
1.3 MOTIVATIONS
This study was undertaken within the framework of the MedPartnership project, in the sub-component “Management of Coastal Aquifers and Groundwater” and the activity related to “Eco-hydrology and Coastal Wetlands”. Many motivations prompted choice of topics selected:
1. Wetland value: wetlands in Lebanon, notably the coastal ones, are losing their natural value. It is, therefore, necessary
to carry out research to highlight the negative aspects that exist. These can be summarized as:
- imbalance in the hydrological system: this includes the impact of climate change, as well as direct and indirect water pumping from wetlands and their inflow zones. This reduces water saturation and then affects the habitats and disrupts the breeding cycles of water birds
- human interference: this is a sort of urban encroachment and is a very well-defined phenomenon. It acts even if the human practices are carried out in the context of the wetland, and influences the entire hydrologic system. It is represented by detrimental behaviour, widening roads and not practising environmentally friendly behaviour, and can be assessed through land cover/use maps
- loss of vegetation cover: this is also a common feature often observed in or near coastal wetlands. It is attributed mainly to forest fires, over-grazing and wood logging
- over-fishing: this has a negative role in reducing the numbers of the fish population and also causes a decline in the birdlife feeding on these fish
- unwise use of the surroundings: this includes various forms of eutrophication such as disposal of sewage, agricultural run-off, extensive algal blooms and use of chemicals and pesticides.
2. Wetland sustainability: to place wetlands, as distinguished landforms, under control and investigation to assure their sustainability and to prompt alerts when threats exist. This was motivated by:
- lack of creditable and comprehensive studies on the coastal wetlands in Lebanon and aspects of their sustainability
- lack of monitoring systems in the coastal wetlands in Lebanon, although they are obviously subject to continuous deterioration
- insufficient environmental legislation and laws to mitigate human interference in wetlands and surrounding areas.
1.4 OBJECTIVES
A main goal of this study was to assess the impact of climate change and related human interference on existing surface water or groundwater sources, and on related land cover/use components in the coastal wetlands of Lebanon. The investigation was based on field observations and preliminary measures.
New management approaches were to be proposed to mitigate the physical and anthropogenic challenges to the coastal wetlands and to manage the sustainability of their natural resources – notably water – in the two coastal wetlands identified.

12
IMPACT OF CLIMATE CHANGE ON WATER RESOURCES OF THE COASTAL WETLANDS IN LEBANON
The specific objectives in studying the two coastal wetlands selected (Deir El-Nouriyeh-Cliffs of Ras Ech-Chekkaa and Tyre Beach Natural Reserve) can be summarized as:
1. illustrating their fundamental physical and anthropogenic characteristics, to be achieved by obtaining field surveys, desk studies, and data (and information) manipulation and analysis
2. identifying the major aspects of water resources (i.e. surface and subsurface), inflow mechanism and flow regime
3. investigating climatic and hydrologic trends over the past few decades and deducing the impact of fluctuating rainfall and increased temperature on the major habitats of the wetlands (including wet zones, water volume, degraded lands and existing ecosystem)
4. applying proposed criteria, including the principal components required, to categorize the studied site as wetlands
5. proposing preliminary elements of the most appropriate legislation to be applied in order to conserve the wetlands.

13
2. STUDY AREAS
This chapter presents the major physical elements of the selected sites. These elements govern the behaviour and surface components of the wetlands.

14
IMPACT OF CLIMATE CHANGE ON WATER RESOURCES OF THE COASTAL WETLANDS IN LEBANON
2.1 GEOGRAPHIC SETTING
Both are coastal sites, according to the scope of the MedPartnership project. Of the three coastal Lebanese wetlands, these two were chosen because they are terrestrial land forms dominated by fresh water and in direct contact with the marine system, so the groundwater study fulfilled the requirements of the MedPartnership project.
2.1.1 Ras Ech-Chekkaa Cliffs site
This site is located on the northern coast of Lebanon, about 20 km from Tripoli, 45 km from Beirut and 50 km from the northern Lebanese border. It is situated between the following geographic coordinates (Figure 2.1):
· Latitude: 34° 17′ 38″ N and 34° 18′ 43″ N
· Longitude: 35° 40′ 10″ E and 35° 40′ 48″ E.
Figure 2.1. Location of Deir El-Nouriyeh-Cliffs of Ras Ech-Chekkaa (Ramsar site)
The site, which is about 0.85 km2 in area, represents a plain surrounded by mountains on all sides except on the west, where it is bounded by the Mediterranean. Its shape is that of an elongated triangle whose base extends to about 600 m on the southern side of the study area; in the north the limbs of the triangle join at a width of a few metres (Figure 2.1).
2.1.2 Tyre Beach site
It is difficult to identify the exact boundary of this site, because there are no remarkable limits between the nature reserve and refugee camp, and the wetland. However, from the hydrological point of view, the refugee camp and the nature reserve are included within the wetland hydrologic system.
This site is located on the southern coast of Lebanon, about 3 km from Tyre, 70 km from Beirut and less than 15 km from the southern Lebanese border. It is situated between the following geographic coordinates (Figure 2.2):
· Latitude: 33° 11′ ″ N and 33° 14′ 59″ N
· Longitude: 35° 12′ 13″ E and 35° 13′ 27″ E.
Figure 2.2. Location of Tyre Beach Nature Reserve (Ramsar site)
The site, which is about 3.8km2 in area, represents a coastal plain with gently sloping mountains a few kilometres to the east and the Mediterranean limiting its western side. The site is almost rectangular in shape and is about 4 km in length and 800 m wide (Figure 2.2).

15
2. Study areaS
2.2 CLIMATE
The two selected sites are typical of the Mediterranean climate of coastal Lebanon, in being humid in the wet season and semi-humid in the dry season. The Lebanese mountain chains, with the highest mountain peaks in the Middle East (3088 m), serve as climatic barriers that capture cold air masses from the west and condense them as considerable amounts of rain and snow (Shaban, 2011).
The wet season coincides with the winter period, which lasts from October to May. In winter, atmospheric pressure perturbations cause abundant rainfall at the coast and on the mountains parallel to it. The dry season coincides with the summer period, which lasts until September (SNCR, 2011). During this period, no rain is recorded and a state of high pressure dominates the whole country. A typical average transect crossing the country consists of a subtropical coastal climate, a semi-arid continental climate in the Bekaa Valley and a typical continental Mediterranean climate (Chaigneau et al., 2008) in the northern range of the Anti-Lebanon Mountains.
The National Meteorological Service defined eight eco-climatic zones for Lebanon, depending mainly on rainfall. The coastal strip, including the northern, central and southern zones, comprises one major eco-climatic zone (CAL, 1980).
About 90-95% of the precipitation takes place between October and April, and the average rainfall in Lebanon is about 920 mm. This varies between the coastal and mountainous regions. Thus, the estimated precipitation on the mountains is about 1350 mm, and only 650-700 mm along the coast. It ranges between 650 mm and 850 mm in the Ras Ech-Chekkaa site, and between 550 mm and 650 mm in the Tyre Beach site and its surroundings (Figures 2.3 and 2.4).
The mean annual temperature varies on the coast between 19.5°C and 21.5°C. It decreases approximately 3°C for each 500 m in elevation. At 1000 m altitude, the mean annual temperature is around 15°C and it decreases to 9°C at 2000 m. Often, the lowest temperatures are recorded in January and the highest in August, where maximum daily temperatures exceed 35°C in the Bekaa Valley (ICARDA, 2010).
Figure 2.3. Rainfall distribution over Ras Ech-Chekkaa site and surroundings

16
IMPACT OF CLIMATE CHANGE ON WATER RESOURCES OF THE COASTAL WETLANDS IN LEBANON
Figure 2.4. Rainfall distribution over Tyre Beach site and surroundings
The changing climatic conditions are well defined in the sites studied and are typical of the climate of the entire Lebanon. There has been a remarkable decrease in the rainfall rate, estimated to be between 35 mm and 40 mm annually according to analysed climatic records over the last five decades. Shaban (2011) considered this decline in rainfall as negligible since it represents only about 4% of the average rainfall rate. However, there is an obvious change in the precipitation patterns, and there is often torrential rain. In addition, shifting seasons have been reported (Shaban, 2014).
There has been a remarkable increase in the temperature rate as it was estimated at 1.9°C over the last five decades. This has been well reflected in agriculture, hydrology and in newly created natural phenomena (desertification, etc.).
Recently, an investigation of the aridity index for long-term rainfall and temperature data series indicated that the Lebanon’s coastal zone (including the coastal plain and the adjacent mountains chains) is still characterized by semi-humid to humid climatic conditions, where the studied sites (Ras Ech-Chekkaa and Tyre Beach) are most affected by the increased aridity.
2.3 GEOMORPHOLOGY
Lebanon is located in the central part of the eastern Mediterranean basin, and forms a junction between Africa, Europe and Asia. Although Lebanon is divided into three physiographic units, two major components shape its terrain and essentially constitute the two plates across the Levantine boundary. These are Mount Lebanon, which is represented by the coastal plain joined with
the western mountain chains, and the Anti-Lebanon, which comprises the Bekaa Valley and eastern mountain ranges.
Ras Ech-Chekkaa Cliffs are almost on the northern coast (~50 km from the northern border); and the other site, Tyre Beach, is on the southern coast (~20 km from the southern border). The geomorphological attributes of these two wetlands are discussed in the following sections.
2.3.1 Geomorphology of Ras Ech-Chekkaa Cliffs
The geomorphology of this site comprises two major topographic units: the mountainous unit to the east; and the confined coastal plain (a narrow ribbon of less than 700 m), where the presumed wetland is located, to the west and along the shoreline.
The mountainous unit comprises a miscellany of hills composing a mountain ridge, with average altitudes of about 160 m.
The interface between the two units is represented by acute cliffs of carbonate rocks. These rocks are always subject to failure and collapse due to intensive fractures and joints. In addition, eroded materials from the mountainous ridges are found along slopes and extend to the plain, and thus the hydraulic erosion is well pronounced.
Three streams run from the mountain ridge at Hamat and Deir El-Nouriyeh villages and along the cliffs before reaching the wetland on the plain. One stream delimits the site exactly in the north; one is approximately in the middle and the third (Wadi Es-Souri) delimits the site in the south. Sanlaville (1977) summarized some data and information about the geomorphology of the Lebanese coastal zones.

17
2. Study areaS
2.3.2 Geomorphology of Tyre Beach
This site is also composed of two major morphological units, the mountainous and the adjacent coastal plain, but its geomorphology is totally different from the previous site. This is because the mountains, which comprise a vast region of plateaux, are far away from the plain which slopes gradually from the plateaux. In addition the coastal plain, where the wetland is located, is a wide coastal ribbon more than 2.5 km wide.
The average altitude of the plateau is not well defined, but it can be about 200 m, while the plain averages about 20-25 m.
A number of streams cut from the plateaux towards the plain and they transport tremendous alluvial and fluvial deposits into and adjacent to the coastal plain.
2.4 GEOLOGY
The eastern Mediterranean, particularly Lebanon, constitutes a part of the unstable shelf of the Middle East region, which is affected by plate tectonic movements. The three physiographic units of Lebanon are uplifted blocks, resulting in folded mountain ranges separated by a structural depression, the Bekaa Valley. All three units trend NNE-SSW (Beydoun, 1988).
The western flank of Lebanon is marked by a well-defined rock deformation boundary (the Yammounah Fault), but the eastern flank often shows a sharp flexure thought to be formed in parts by en-echelon faults (Beydoun, 1972). The Bekaa Depression is an extension of the Jordan Dead Sea-Gulf of Aqaba rift system, a continuation of the East African-Red Sea system.
The exposed stratigraphic succession in Lebanon, starting from the Middle Jurassic, exhibits sedimentation in a marine environment until the Middle Eocene, with carbonate rocks building up the largest part of the stratigraphic column separated by continental sands and other clastics at the base of the Cretaceous (Nubian sandstone) and some intercalated volcanics up to the Pliocene. The exposed succession totals a thickness of about 5650 m (Shaban, 2010).
The geology of the studies sites cannot be described separately as the most dominant are the coastal plains, because the existing sediments in these plains derive from the surrounding elevated regions which have different geological settings. In addition, the surface and groundwater resources are completely controlled by the surrounding rock formations. The geology of the selected sites and the surroundings are described in the following subsections.
2.4.1 Geology of Ras Ech-Chekkaa Cliffs
Three major geological rock formations constitute the stratigraphic sequence of Ras Ech-Chekkaa Cliffs. They include the coastal plain (where the Ramsar site exists) extending upward through the adjacent cliffs to include the entire region of
Hamat and Dier En-Nourieh villages (Figure 2.5). These geologic rock formations are indicated below in chronological order, from younger to older.
2.4.1.1 Quaternary deposits (Q)
These comprise a sequence of less than 15 m in thickness (Figure 2.6). The sequence includes a mixture of unconsolidated sediments with alluvial and colluviual deposits where red, sandy soil is dominant as the major aspect, plus some sandy terraces. Movable dunes also exist in different patches.
2.4.1.2 Miocene marly limestone (m2)
This is less than 150 m in thickness (Figure 2.6). It is almost massive, moderately hard, thick-bedded yellowish-beige marly limestone with an extensive local fissure and joint system. It constitutes a mountainous ridge extending from Daher Al-Mahhatta in the south to Dier En-Nourieh in the north.
Figure 2.5. Geological map of Ras Ech-Chekkaa and surroundings (Dubertret, 1953)
There are high cliffs around the massive ridge. These cliffs can be attributed to a fault alignment on the eastern side, facing the Ramsar site over the Mazra’at Hanoush area. The cliffs at the northern part of the massive ridge are mostly attributed to rotational landslides, which constitute movable terrain. This fault, which is of the normal type, has a vertical displacement of about 100-120 m and extends in a N-S direction, constituting the Cliffs of Ras Ech-Chekkaa themselves.
In addition, fissure systems also dominate the entire study area. These are well developed in in the massive marly limestone, notably when the carbonate content increases. Moreover, joints of the two-sets type feature at different depths, and with a general orientation of N-S, which indicates the impact of the fault alignment.

18
IMPACT OF CLIMATE CHANGE ON WATER RESOURCES OF THE COASTAL WETLANDS IN LEBANON
Figure 2.6. Stratigraphic sequence of Ras Ech-Chekkaa site
2.4.1.3 Senonian marl (C6)
This sequence is characterized by variable thickness from 80 m to 100 m in the study area and is composed of friable, unconsolidated and movable beige marl (Figure 2.6). The friability and softness of these rocks makes the region a badland with little uniformity. This rock formation completely shapes the geographic extent of the Miocene formation from the east.
2.4.2 Geology of Tyre Beach
The geographic extent of the geological rock formations in this site extends to remote areas and the water resources in the Ramsar site are totally governed by these formations. However, their extent is not well defined, and so the limits of the Ramsar site are the peaks of the mountain ridges in the east, along the villages of Kafer Sir, Sir El-Gharbieh, Shehour and Arzon (Figure 2.7).
Figure 2.7. Geological map of Tyre Beach site and surroundings (Dubertret, 1953)
There are four main geological rock formations in the studied site. These are, in chronological order (from younger to older):
2.4.2.1 Quaternary deposits (Q)
This sequence has variable thickness, but is less than 25 m. It includes unconsolidated sediments, mainly of alluvial deposits. Silty soil and sandy terraces are the most dominant in this sequence (Figure 2.8). There are also movable dunes in different places.
2.4.2.2 Eocene limestone (e2)
This relates to the Middle Eocene when chalky limestone was the principal rock component (Figure 2.8). It is known for its extensive fracture systems and joints over the whole sequence, which is about 180 m in the studied area and surroundings.
2.4.2.3 Senonian marl (C6)
This sequence is characterized by variable thickness from 150 m to 160 m (Figure 2.8). The major lithology is well bedded, moderately thick marl and marly limestone of an almost beige to yellowish-white colour. It comprises dense fissure systems and vertical joints at several localities.
2.4.2.4 Cenomanian limestone (C4-5)
This upper rock formation comprises more than 130-150 m in the area of interest (Figure 2.8). It comprises mainly massive, thick-bedded, karstified and fractured limestone and dolomitic limestone of a grey, yellowish-white colour. This formation encompasses a miscellany of fault systems and fractures at different scales and orientations.

19
2. Study areaS
Figure 2.8. Stratigraphic sequence of Tyre Beach site
There are large-scale fault systems (i.e. several tens of kilometres) that span the mountainous regions from the east towards the sea. Most are of the strike-slip type, where lateral displacement is dominant (Figure 2.7). Fissures have a dominant deformation aspect where they are well developed in the hard rocks of dolomite and dolomitic limestone. Joints are also observed in many localities and are almost of multiple sets where they clearly occur in the marly limestone horizons.
21
3. TOOLS FOR ANALYSIS
Different themes were analysed in this study, and this led us to use a miscellany of data for analysis. The principal data sets are discussed below.

22
IMPACT OF CLIMATE CHANGE ON WATER RESOURCES OF THE COASTAL WETLANDS IN LEBANON
3.1 CLIMATIC DATA
Most data on the climate in Lebanon are usually found in records on rainfall and temperature, as these are the major two meteorological parameters usually measured by the available ground stations. Unfortunately, there is no defined institute for climatic data in Lebanon, even though there are some institutes that measure climatic data, but these data are for limited geographic areas and have incomplete time series.
The data used to illustrate rainfall and temperature trends in this study were collected on a monthly basis, with measuring units of millimetres for rainfall and degrees Celsius for temperature. Two stations were used:
1. Tripoli station, about 20 km from the investigated site, but on the same longitude. The data sets used were collected between 1984 and 2013 for rainfall and between 1981 and 2013 for temperature (i.e. maximum and minimum)
2. Tyre station, which is only about 4 km from the investigated site. The analysed data sets are between 1985 and 2013 for rainfall and between 1988 and 2013 for temperature (i.e. maximum and minimum).
The records for rainfall and temperature for these two stations were taken from a variety of sources to provide the most comprehensive data sets, namely:
· Lebanon’s climate atlas, Atlas Climatique du Liban (CAL, 1971, 1973, 1980)
· General Directorate of Civil Aviation (Direction Générale de l’Aviation Civile) (DGAC, 1999)
· Lebanese Agriculture Research Institute (LARI, 2003) with data on Bekaa region from 1954 to1974 and from 1997 to 2003
· National Oceanic and Atmospheric Administration (NOAA) climatic data, available until the year 1971 (NOAA, 2012)
· Miscellaneous data from different works and on different geographic locations.
However, the majority of rainfall data from 1998 to date relied on remotely sensed data extracted from the Tropical Rainfall Mapping Mission. This is a joint mission between NASA and the Japan Aerospace Exploration Agency. The data are acquired globally.
3.2 HYDROLOGIC DATA
The majority of the hydrologic data came from the Litani River Authority (LRA, 1970-2012). These data usually include stream flow in rivers and springs. However, in this study, the hydrological data are only for the springs on the Tyre Beach site, as the Ras Ech-Chekkaa site has no defined source of water.
The Tyre site has three springs, two major ponds to collect water from dug wells (as shown in Figure 3.1) and there are also conveying channels for irrigation purposes.
Figure 3.1. IKONOS satellite image (0.83 m resolution) showing Tyre wetland where different water bodies exist
These water sources are monitored by three flow meters (Photo 3.1), which are under the supervision of the LRA. The meters measure the stream flow at three locations:
· The northern channel (daily data between 1998 and 2014)
· The leakage channel to the sea (daily data between 1998 and 2014)
· The sea mouth at the outlet (daily data between 1998 and 2014).
Photo 3.1. Flow meter fixed in the leakage channel in tyre Beach wetland
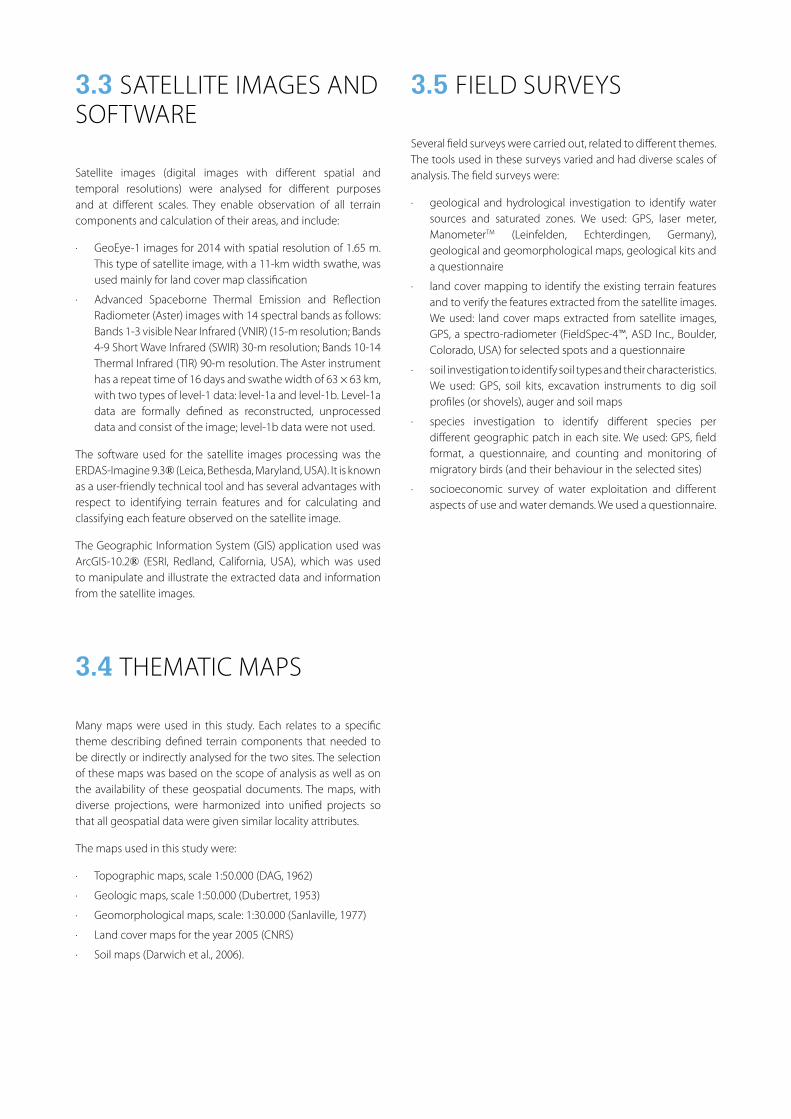
3.3 SATELLITE IMAGES AND SOFTWARE
Satellite images (digital images with different spatial and temporal resolutions) were analysed for different purposes and at different scales. They enable observation of all terrain components and calculation of their areas, and include:
· GeoEye-1 images for 2014 with spatial resolution of 1.65 m. This type of satellite image, with a 11-km width swathe, was used mainly for land cover map classification
· Advanced Spaceborne Thermal Emission and Reflection Radiometer (Aster) images with 14 spectral bands as follows: Bands 1-3 visible Near Infrared (VNIR) (15-m resolution; Bands 4-9 Short Wave Infrared (SWIR) 30-m resolution; Bands 10-14 Thermal Infrared (TIR) 90-m resolution. The Aster instrument has a repeat time of 16 days and swathe width of 63 × 63 km, with two types of level-1 data: level-1a and level-1b. Level-1a data are formally defined as reconstructed, unprocessed data and consist of the image; level-1b data were not used.
The software used for the satellite images processing was the ERDAS-Imagine 9.3® (Leica, Bethesda, Maryland, USA). It is known as a user-friendly technical tool and has several advantages with respect to identifying terrain features and for calculating and classifying each feature observed on the satellite image.
The Geographic Information System (GIS) application used was ArcGIS-10.2® (ESRI, Redland, California, USA), which was used to manipulate and illustrate the extracted data and information from the satellite images.
3.4 THEMATIC MAPS
Many maps were used in this study. Each relates to a specific theme describing defined terrain components that needed to be directly or indirectly analysed for the two sites. The selection of these maps was based on the scope of analysis as well as on the availability of these geospatial documents. The maps, with diverse projections, were harmonized into unified projects so that all geospatial data were given similar locality attributes.
The maps used in this study were:
· Topographic maps, scale 1:50.000 (DAG, 1962)
· Geologic maps, scale 1:50.000 (Dubertret, 1953)
· Geomorphological maps, scale: 1:30.000 (Sanlaville, 1977)
· Land cover maps for the year 2005 (CNRS)
· Soil maps (Darwich et al., 2006).
3.5 FIELD SURVEYS
Several field surveys were carried out, related to different themes. The tools used in these surveys varied and had diverse scales of analysis. The field surveys were:
· geological and hydrological investigation to identify water sources and saturated zones. We used: GPS, laser meter, ManometerTM (Leinfelden, Echterdingen, Germany), geological and geomorphological maps, geological kits and a questionnaire
· land cover mapping to identify the existing terrain features and to verify the features extracted from the satellite images. We used: land cover maps extracted from satellite images, GPS, a spectro-radiometer (FieldSpec-4™, ASD Inc., Boulder, Colorado, USA) for selected spots and a questionnaire
· soil investigation to identify soil types and their characteristics. We used: GPS, soil kits, excavation instruments to dig soil profiles (or shovels), auger and soil maps
· species investigation to identify different species per different geographic patch in each site. We used: GPS, field format, a questionnaire, and counting and monitoring of migratory birds (and their behaviour in the selected sites)
· socioeconomic survey of water exploitation and different aspects of use and water demands. We used a questionnaire.

25
4. METHODS FOR ANALYSIS
Since this study had several diverse objectives in characterizing the two selected sites, with special concern for the impact of changing climatic condition on water resources and related themes, several different analyses were applied.

26
IMPACT OF CLIMATE CHANGE ON WATER RESOURCES OF THE COASTAL WETLANDS IN LEBANON
4.1 CLIMATIC DATA ANALYSIS
The climatic data available for the two sites were found to have some gaps, whether in rainfall or in measurement of temperature. As it was necessary to have complete climatic records to illustrate the trends of rainfall and temperature for the last few decades, a statistical analysis based on detailed climatic records for rainfall and temperature had to be applied. This analysis was able to assess the changing behaviour of these climatic parameters.
For the sites in this study, the most readily available and convenient data were:
· Ras Ech-Chekkaa site:
- Rainfall = 30 years
- Temperature = 33 years
· Tyre Beach site:
- Rainfall = 29 years
- Temperature = 26 years
The gaps in the records were treated by using the “Time Series Forecasting Method”, which represents an advanced statistical approach used to interpolate the missing data among a long-term time series. This method depends on calculating the Moving Average (MAt) values for the available recorded years (Yt). Hence, in this study, MAt was calculated using the following formula as an example (showing rainfall in the Ras Ech-Chekkaa site):
MAt = (Y t-15 +……. + Y t-3 + Y t-2 + Y t-1 + Y t + Y t+1 +Y t+2 + Y t+3 …….. + Y t+15)/30
Having determined the MAt, the Central Moving Average (CMAt) can be calculated according to the following formula:
CMAt = ∑ MAt/6
Irregular and seasonal variations were calculated by dividing available readings (Yt) on the CMAt. To calculate the seasonal variations (St), however, the irregular and seasonal variations should be calculated quarterly. Therefore, a simple linear regression method can be used to identify the general trend, where statistical interloping is applied to represent the seasonal variation on the Y axis and the time variable (t) on the X axis. The results will be represented in coefficients ά for the intersection variable and ἅ for the (t) variable.
Therefore, the general trend can be assessed from the simple linear regression method by interloping the seasonal variation on the Y axis and the time variable t on the X axis. This results in two coefficients: ά for the intersection variable and ἅ for the t variable. The two coefficients can be substituted as in the following formula:
Tt = ά + ἅ x t
Hence, the predication for each time interval can be calculated as:
Ft = St × Tt
This resulted in optimal, comprehensive time series data for the rainfall and temperature of the Ras Ech-Chekkaa and Tyre Beach sites, and these data can be used for statistical illustrations by use of Microsoft Excel® software. The result will enable us to identify the general trend in these two climatic parameters, as well as to deduce their ascending or descending behaviour over the investigated time period for each parameter.
4.2 HYDROLOGIC DATA ANALYSIS
The hydrological data obtained in this study were applied only to the Tyre Beach site since the Ras Ech-Chekkaa site does not have obvious surface water sources. Therefore, hydrological l data analysis included the data obtained from the three fixed flow meters in the Tyre Beach site in the northern channel, the leakage channel and at the sea mouth.
The daily data series was simply converted into a monthly series to facilitate manipulation, as well as to enable us to view the trending behaviour clearly.
To manage the gaps in the available records, the same approach used for the climatic data sets was also applied here. Thus, the “Time Series Forecasting Method” and similar statistical tasks were employed to allow us to have a complete time series of data.
In addition to making a numerical analysis of the hydrological data, we were able to identify water estimates by interviewing the owners of the agricultural lands in both sites. Farmers were able to provide general information about water behaviour and an estimate of the volume of surface water in each site, since they had been observing the water regime for several decades. Queries relating to these aspects were integrated into the dedicated questionnaire, which broadly included:
· sources of water and different aspects relating to consumption
· if the farmers followed specific approaches for making measurements
· how the farmers (and inhabitants) judged the general trend of water discharge
· what were the alternative water supply sources in case of water shortage
· if there were any estimates or discussion mentioned in the media.

27
4. MethodS For analySIS
4.3 GROUNDWATER INVESTIGATION
The investigation of groundwater, as an invisible water source, is totally different from that of surface water. This is because water-transport routes and accumulation localities cannot be directly identified. We conducted a detailed hydrogeological investigation at the two sites, based mainly on recognition of the geological elements, including stratigraphy and structures. Hence, when these two geological attributes are correlated to groundwater, they will be described as hydrostratigraphy and hydrostructure, respectively.
In an optimal hydrogeological investigation, it would be erroneous to deal with the sites separately. In other words, the major existing geological system should be completely identified and classified according to different groundwater characterizations. In this study, we used the following approaches:
4.3.1 Hydrostratigraphy
We analysed the hydrogeological setting of each site from the lithological (i.e. rock type) point of view, including the stratification of rock beds. Primarily, the geological maps (scale 1:50.000) were analysed, and accompanied by surveys to:
· identify the rock types (i.e. lithology) and their overlying order
· attribute each lithology to the water-bearing property. This implies mainly the identification of “aquiferous” rock formations
· identify the controlling geologic system that governs water flow and accumulation
· identify the correlation between the issuing surface water sources (i.e. springs) and the hydrostratigraphic setting.
The hydrostratigraphy identified above should be tightly integrated with the hydrostructure.
4.3.2 Hydrostructure
Hydrostructural analysis is significant in an investigation of the groundwater flow/storage regime. It proved to be a much more effective factor than hydrostratigraphy, particularly in a region such as Lebanon where tectonic activities are well pronounced. Hydrostructural analysis treats different aspects of rock deformations such as faults, fractures, joints and folding.
This study used geological maps (scale 1:50.000) and satellite images. The latter included Aster satellite images, which can provide information on the fracture systems at different scales and with diverse orientations.
The Aster images, with 14 spectral bands, were processed using ERDAS-Imagine 9.3®. The images were subjected to a sub-setting procedure to include the areas of interest (i.e. wetland
sites) in one scene. To accomplish this, all images first had to be converted to TIFF format.
The presence of thermal bands in Aster images was very useful to identify wet longitudinal horizons (i.e. indicators for fault alignments). In this regard, Bands 10-14 (TIR) with 90 m resolution were utilized. Consequently, and for better discrimination, a number of optical and digital procedures were carried out in the ERDAS-Imagine software. This included band combination, enhancing, filtering, colour slicing and edge detection.
Moreover, the identification of the hydrostructure elements was implemented using several field geological tools, such as the Incline-meter, Range-meter, HCl (10% diluted), etc.
Most hydrostructure analysis implies:
· identifying the major controlling fault systems (i.e. geographic extent, orientation), and their role in groundwater flow/storage
· identifying the fracture systems and their significance in water recharge
· recognizing the tilting of bedding planes and their role in groundwater flow along different stratums.
The combination of geologic maps and satellite image analysis with field verification helped us to identify the major hydrogeological controls.
4.4 SOIL CLASSIFICATION
The creation of soil maps starts by collecting other data from previous maps (geological, topographic, land cover, etc.). After undertaking reconnaissance field visits and work, each geographic soil unit is labelled with the corresponding soil type. An index map created by the Lebanese Army at a scale of 1:20.000 was followed in creating the soil maps. ArcView® and ArcGIS® version 10.1 (ESRI, Redlands, California, USA) were used to create the final 1:20.000 soil maps, and the legend colour was derived from the FAO digital soil map of the world (http://worldmap.harvard.edu/data/geonode:DSMW_RdY). The map projection is Lambert Conformal Conic, Datum Clarke 1880.
Soil classification is based on descriptive and measurable soil features such as diagnostic horizons and related characteristics. These are directly connected with the soil-forming processes. The soil horizon is divided into epipedon (0-50 cm) and endopedon (100 cm). The organic matter accumulation, colour changes and textural differentiation are among major criteria for the upper soil layers. In general, clay accumulation, mottling and secondary calcium carbonate accumulations serve as criteria for the designation of lower horizons. The soil maps in this report use the legends of the World Reference Base for Soil Information (WRB, 2014).
Horizon development and differentiation were considered as the first criteria for soil classification, except where lithology plays the major role in soil formation.

28
IMPACT OF CLIMATE CHANGE ON WATER RESOURCES OF THE COASTAL WETLANDS IN LEBANON
4.5 ECOSYSTEM ANALYSIS
The two study areas of Ras Ech-Chekkaa and Tyre Beach were evaluated by carrying out a detailed field survey to verify:
· observed activities
· observed pressures on the ecosystem
· expected pressure trends
· expected changes/impacts in view of climate change.
This study enabled an evaluation of the potential response of ecosystems to the expected change in climate trends. The assessment was supported by available published information relating to both sites, as well as by site visits to approximate their current status and the expected impacts.
4.6 LAND COVER MAP AND ITS CLASSIFICATION
Images have been collected from the GeoEye-1 satellite, which was successfully launched on 6 September 2008. It collects images at nadir with 0.41-m panchromatic (black and white) and 1.65-m multispectral resolution. This satellite has the most advanced technology ever used in a commercial remote sensing system. In attempting to develop a classification system for use with remote sensing techniques that will provide a framework to satisfy the needs of the majority of users, certain guidelines of criteria for evaluation (surface colour, brightness, stoniness and signs of erosion) have been established.
Field checking was also carried out to test the accuracy of image interpretation at selected sites and to clarify interpretation assumptions. GPS were used to precisely locate and delineate the ground sites investigated.
The main software program used for digitizing the satellite images and building the supporting database was ArcMap 10.3®. ArcInfo® (both programs from ESRI, Redlands, California, USA), available at the CNRS, was used for map joining and later for map editing.
The hierarchical classification used in the national land cover/land use has been applied. It covers 72 sub-categories and four levels. For instance, level 1 covers artificial areas, agricultural areas, wooded lands, grasslands, wetlands, unproductive areas and water bodies.
Ortho-rectification has been made, followed by a mosaicking of the different images over the Lebanese territories. Field visits were undertaken to collect information and keys for image interpretation.
The satellite image processing of extrapolation was based on iterative controls. This process consists of marking the boundaries of areas representing single cover units on the false-colour
images, using interpretation keys, ancillary documentation or aerial photographs to assign nomenclature headings, as well as extrapolating the established delineation and identification to different parts showing similar characteristics.
A visual interpretation, to identify the changes in land cover, was carried out on images at a scale of 1:5000 and 1:10000 for the years 2014 and 2005, respectively. The minimum mappable unit (100 m2 for the reserve areas and 625 m2 for the others) was then defined based on the following two basic requirements:
· They facilitated the legibility of the printed map or easy digitization from the interpretation manuscripts
· They provided a representation of the essential features of the terrain in terms that served the thematic objectives of the project.

29
5. RESULTS
Application of the methods discussed in chapters 3 and 4 provided analysis of climatic conditions and trends, surface and subsurface water sources and their flow/accumulation regime, soil characteristics, the existing ecosystem and the changing land cover components.

30
IMPACT OF CLIMATE CHANGE ON WATER RESOURCES OF THE COASTAL WETLANDS IN LEBANON
5.1 CLIMATIC TRENDS
5.1.1 Rainfall trends in Ras Ech-Chekkaa
The analysed rainfall records, after applying statistical approaches to fill data gaps for the Ras Ech-Chekkaa region, show a slight decrease in the overall rate by about 12 mm over the last 30 years (1984-2013) as shown in Figure 5.1, which reveals the annual rainfall data set.
The average rainfall in the Ras Ech-Chekkaa region, where the Ramsar site is located, is about 686 mm. However, the entire trend shows considerable more oscillations before the year 2004 (Figure 5.1), where some rainfall peaks exist (i.e. 1986, 1991 and 2003) after which a remarkable stability was noticed. However, the dates between these peaks represented more or less similar time intervals, which could be interpreted as cyclonic intervals.
5.1.2 Rainfall trends in Tyre Beach
The analysed rainfall record for Tyre Beach, also obtained after statistical approaches provided a continuous record, show a slight decrease in the overall rate by about 38 mm over the last 29 years (1985-2013). Figure 5.2 reveals the annual variation in rainfall.
The estimated average rainfall in the Tyre Beach region, where the Ramsar site is located, is about 648 mm. While the general trend is similar to that in Ras Ech-Chekkaa, it shows oscillations before the year 2003 (Figure 5.2), where a number of rainfall peaks appear (i.e. 1986, 1991 and 2001) after which a remarkable stability occurs.
5.1.3 Temperature trends in Ras Ech-Chekkaa
The temperature data sets were elaborated for both the maximum and minimum records since both can influence the behaviour of their significant metrological parameter and thus impact on different water-related sectors. Illustration of the overall trend of average temperature (i.e. maximum and minimum) was based on manipulation of the available records, as discussed previously.
The maximum temperature in the Ras Ech-Chekkaa region is seen to have increased by about 1.25°C. The minimum temperature also increased, by about 0.81°C, and the average temperature in this region has increased by about 1.0°C over the last 33 years, as shown in Figure 5.3.
The average monthly temperature was estimated at about 21.03°C for the time interval between 1981 and 2013, which is above the average temperature of the whole of Lebanon (i.e. 19.18°C).
5.1.4 Temperature trends in Tyre Beach
The calculated maximum temperature in the Tyre Beach region has increased by about 1.6°C; there has also been an increase in the minimum value, which is about 1.0°C. Thus, the average temperature in the Tyre Beach region has increased by about 1.4°C over the last 26 years, as shown in Figure 5.4.
The average monthly temperature was estimated at about 21.2°C for the time interval between 1988 and 2013, and this is also above the average temperature of the whole country.
Figure 5.1. Average monthly rainfall trend for the Ras Ech-Chekkaa region
0
200
400
600
800
1000
1200
Precipitations (mm)
201320122011201020092008200720062005200420032002200120001999199819971996199519941993199219911990198919881987198619851984

31
5. reSultS
Figure 5.2. Average monthly rainfall trend for the Tyre Beach region
0
200
400
600
800
1000
1200
Precipitations (mm)
20132012201120102009200820072006200520042003200220012000199919981997199619951994199319921991199019891988198719861985
Figure 5.3. Average monthly temperature trend for the Ras Ech-Chekkaa region
15
16
17
18
19
20
21
22
23
24
Temprature C°
201320122011201020092008200720062005200420032002200120001999199819971996199519941993199219911990198919881987198619851984198319821981

32
IMPACT OF CLIMATE CHANGE ON WATER RESOURCES OF THE COASTAL WETLANDS IN LEBANON
Figure 5.4. Average monthly temperature trend for the Tyre Beach region
10
12
14
16
18
20
22
24
Temprature C°
20132012201120102009200820072006200520042003200220012000199919981997199619951994199319921991199019891988
5.2 WATER RESOURCES
The volume of water is the principal aspect of wetland formation, and thus a terrain without water cannot be considered a wetland. Consequently, there is considerable concern about the volume of water in wetland zones, and monitoring is usually carried out to estimate the discharge of water or its retention in these landforms.
5.2.1 Water resources at the Ras Ech-Chekkaa site
We found, as previously mentioned, that there is no obvious source of fresh water at the Ras Ech-Chekkaa site, although it was designated as a wetland in the Ramsar list of 2014. The credibility of this designation merits some attention. Nevertheless, there are two considerations that might provide the reason why this has been accounted a Ramsar site:
· There is saltwater interaction along the shorelines where several clusters of saline ponds occur. In addition, there are some patches of land directly on the coast which are flooded by tidal water, but they are very limited in terms of areal extent
· The cliffs, which are composed of carbonate rocks and have an altitude of about 50 m at a range of 600 m from the sea, show frequent water seepages (i.e. slow and intermittent sheet flow) along the bedding planes of the limestone and dolomite rock. This limited and non-continuous water flow feeds the adjacent sediments located in the plain of this site.
The three streams extending from the mountain ridge at Hamat and Deir Deir El-Nouriyeh villages cut the cliffs towards the coastal plain. They also contribute to the saturation of sediments in this plain, but to a limited degree.
There are well-known sources of submarine freshwater discharge into the sea facing the Ras Ech-Chekkaa region. These were detected by airborne thermal infrared survey (CNRS, 1999).
Despite the designation of the Cliffs of Ras Ech-Chekkaa as a Ramsar wetland site, we did not find any considerable source of water; therefore, we did not apply any measurement for the water volume in this site. Nevertheless, the results collected from the inhabitants in the region of the Mazra’at Hanoush indicated that the coastal plain (i.e. the Ramsar site) witnessed soil saturation in the past, but this has not taken place in the past few decades.
5.2.2 Changing water volume at the Tyre Beach site
As discussed earlier, the Tyre Beach site has several water sources, both on the surface and in the subsurface. These are:
· three water wells
· three springs
· two ponds (Photo 5.1)
· two major conveying channels (Photo 5.2)
· a number of small artificial tributaries.

33
5. reSultS
Photo 5.1. a major water pond at the tyre Beach site
Photo 5.2. Water pond with a conveying channel at the tyre Beach site
Hydrologic analysis to assess the changing volume in water resources at this site was applied to the data sets of the three flow meters fixed at the northern channel (deriving from water from wells), at the leakage channel to the sea and at the sea mouth. The results can be summarized as follows:
· Northern channel: this extends about 5 km from the ponds of Ras Al-Ain towards Al-Ma’ashouk in the north. The average discharge from this channel is about 12.4 million m3 per year. The general trend (resulting from the stream flow time series analysis of the available data sets) shows an overall increase in the discharge volume at about 3% over the last 16 years (Figure 5.5)
· Leakage channel: this extends less than 1 km from the ponds of Ras Al-Ain towards the sea as an outlet channel to be used by farmers for irrigation. However, there is also some pumping from this channel for irrigations. The average discharge from this channel is about 0.86 million m3 per year. The general trend (resulting from the stream flow of the analysed data sets) shows an overall decrease in the discharge volume at about 72% over the last 16 years (Figure 5.6). This abrupt decrease is mainly artificial, and is attributed to the control applied from the water wells pumping stations managed by the Litani River Authority (LRA), and thus LRA regulating water outlet to the sea for several supply considerations
· Discharge at sea mouth: at this locality the flow meter is fixed at the sea mouth, and the average discharge is about 16.3 million m3 per year. The general discharge trend has risen at about 9% over the last 16 years, as observed from the stream flow analysis (Figure 5.7).
Figure 5.5. The general stream flow in the northern channel in the Tyre Beach region
0
2
4
6
8
10
12
14
ANNUAL VOLUME M.M3MEAN FLOW M3/S
2013-20142012-20132011-20122010-20112009-20102008-20092007-20082006-20072005-20062004-20052003-20042002-20032001-20022000-20011999-20001998-1999
9.998
8.088
8.272 8.618
14.129 12.67412.254 12.050
8.186
10.271
8.601
8.435
10.463
11.588
9.863
12.658

34
IMPACT OF CLIMATE CHANGE ON WATER RESOURCES OF THE COASTAL WETLANDS IN LEBANON
Figure 5.6. The general stream flow in the leakage channel in the Tyre Beach region
0,0
0,2
0,4
0,6
0,8
1,0
1,2
1,4
1,6
1,8
2,0
ANNUAL VOLUME M.M3MEAN FLOW M3/S
2013-20142012-20132011-20122010-20112009-20102008-20092007-20082006-20072005-20062004-20052003-20042002-20032001-20022000-2001
1.750
1.651
1.835
1.621
1.629
1.055
0.952 0.838
0.617
0.642
0.230
0.3170.241 0.233
Figure 5.7. The general stream flow at the sea mouth of the Tyre Beach region
0
5
10
15
20
25
ANNUAL VOLUME M.M3MEAN FLOW M3/S
2013-20142012-20132011-20122010-20112009-20102008-20092007-20082006-20072005-20062004-20052003-20042002-20032001-20022000-20011999-20001998-1999
10 10.29
8.20
10.89
13.16
15.63
17.35
12.75
7.316.64
9.48
14.71
13.26
23.9823.08
11.49
35
5. reSultS
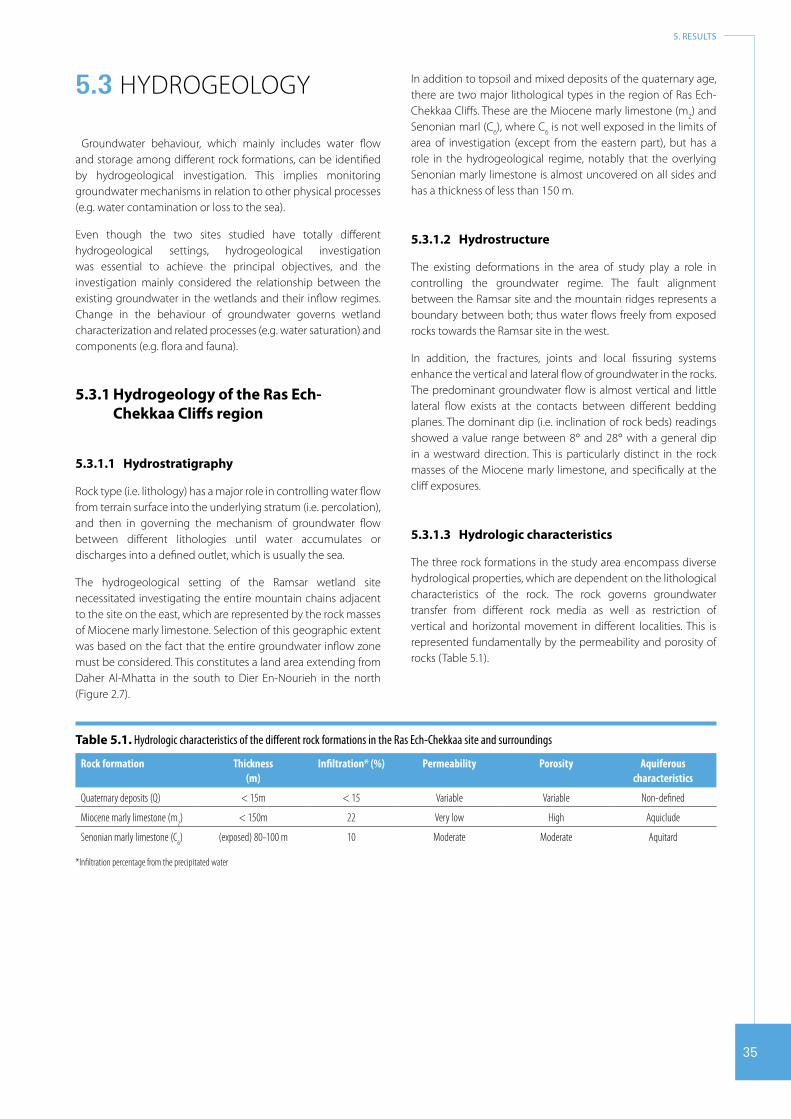
5.3 HYDROGEOLOGY
Groundwater behaviour, which mainly includes water flow and storage among different rock formations, can be identified by hydrogeological investigation. This implies monitoring groundwater mechanisms in relation to other physical processes (e.g. water contamination or loss to the sea).
Even though the two sites studied have totally different hydrogeological settings, hydrogeological investigation was essential to achieve the principal objectives, and the investigation mainly considered the relationship between the existing groundwater in the wetlands and their inflow regimes. Change in the behaviour of groundwater governs wetland characterization and related processes (e.g. water saturation) and components (e.g. flora and fauna).
5.3.1 Hydrogeology of the Ras Ech-Chekkaa Cliffs region
5.3.1.1 Hydrostratigraphy
Rock type (i.e. lithology) has a major role in controlling water flow from terrain surface into the underlying stratum (i.e. percolation), and then in governing the mechanism of groundwater flow between different lithologies until water accumulates or discharges into a defined outlet, which is usually the sea.
The hydrogeological setting of the Ramsar wetland site necessitated investigating the entire mountain chains adjacent to the site on the east, which are represented by the rock masses of Miocene marly limestone. Selection of this geographic extent was based on the fact that the entire groundwater inflow zone must be considered. This constitutes a land area extending from Daher Al-Mhatta in the south to Dier En-Nourieh in the north (Figure 2.7).
In addition to topsoil and mixed deposits of the quaternary age, there are two major lithological types in the region of Ras Ech-Chekkaa Cliffs. These are the Miocene marly limestone (m2) and Senonian marl (C6), where C6 is not well exposed in the limits of area of investigation (except from the eastern part), but has a role in the hydrogeological regime, notably that the overlying Senonian marly limestone is almost uncovered on all sides and has a thickness of less than 150 m.
5.3.1.2 Hydrostructure
The existing deformations in the area of study play a role in controlling the groundwater regime. The fault alignment between the Ramsar site and the mountain ridges represents a boundary between both; thus water flows freely from exposed rocks towards the Ramsar site in the west.
In addition, the fractures, joints and local fissuring systems enhance the vertical and lateral flow of groundwater in the rocks. The predominant groundwater flow is almost vertical and little lateral flow exists at the contacts between different bedding planes. The dominant dip (i.e. inclination of rock beds) readings showed a value range between 8° and 28° with a general dip in a westward direction. This is particularly distinct in the rock masses of the Miocene marly limestone, and specifically at the cliff exposures.
5.3.1.3 Hydrologic characteristics
The three rock formations in the study area encompass diverse hydrological properties, which are dependent on the lithological characteristics of the rock. The rock governs groundwater transfer from different rock media as well as restriction of vertical and horizontal movement in different localities. This is represented fundamentally by the permeability and porosity of rocks (Table 5.1).
Table 5.1. Hydrologic characteristics of the different rock formations in the Ras Ech-Chekkaa site and surroundings
Rock formation Thickness (m)
Infiltration* (%) Permeability Porosity Aquiferous characteristics
Quaternary deposits (Q) < 15m < 15 Variable Variable Non-defined
Miocene marly limestone (m2) < 150m 22 Very low High Aquiclude
Senonian marly limestone (C6) (exposed) 80-100 m 10 Moderate Moderate Aquitard
*Infiltration percentage from the precipitated water

36
IMPACT OF CLIMATE CHANGE ON WATER RESOURCES OF THE COASTAL WETLANDS IN LEBANON
5.3.1.4 Groundwater recharge and flow mechanism
If the mountain chains adjacent to the Ramsar site on the east are considered to be the only surface and subsurface catchment source of water, the annual estimated water volume captured (Vc) in this area can be calculated as follows:
Captured water volume = Catchment area × Average annual rainfallVc = Ac × Ra
= 26 (km2) × 686 (mm) = 26 x 10–6 × 686/1000 = 1.78million m3
About 50% of this water volume, which is received from rainfall, is returned back to the atmosphere as evapotranspiration, and the remainder (about 900 × 10–3m3) will be surface run-off or infiltrates downward in the rock stratum. According to UNDP (1970) estimates, the infiltration rate of Miocene marly limestone (m2) is 22%; therefore, the estimated recharged groundwater is about:
1.78 ×–6 × 10–3 × 22/100 = 0.391 million m3/year
The water enters the exposed rock of the Miocene marly limestone (m2) and percolates (infiltrates) among its rocks, mainly through the dominant vertical fractures and joints. Water continues to infiltrate between different bedding planes. These bedding planes are well marked in this rock formation.
Since the general inclination of the bedding planes in the exposed Miocene rock formation is westward, the general groundwater flow will be to the west, as shown in Figure 5.8. This flow will continue vertically and horizontally until groundwater reaches the Senonian marl formation (C6), which is a geologic formation with very low permeability. Groundwater will thus flow almost horizontally along the contact between the two formations (m2 and C6). There will be seepage along the bedding planes, which appears as slow and sheet flow from the cliff, as well as a higher flow rate at the bottom of the cliff at the point of contact with C6.
Figure 5.8. Hydrogeological cross-section in the Ramsar site of Ras Ech-Chekkaa Cliffs and surroundings
5.3.2 Hydrogeology of the Tyre Beach region
5.3.2.1 Hydrostratigraphy
Study of the hydrogeology of the Ramsar wetland site included all the mountains located to the east of the site. In terms of hydrogeological boundary, this comprises a relatively large area with unidentified limits. The area extends to the most elevated mountains, representing an alignment from north to south, and joining the villages of Kfar Sir, Baflay and Deir Ntar (Figure 2.9). This geographic extent was built on the concept that the entire groundwater inflow zone must be considered.
The quaternary deposits of mixed fluvial sediments are dissipated at different localities in the area, notably in depressions. Hence, three major lithological types exist. These are (from newer to older):
· Eocene limestone (e2)
· Senonian marl (C6)
· Cenomanian limestone (C4-5).
Nevertheless, the altitude of these overlying rock formations is opposite to their chronology: the newer rock is at a lower altitude and the older rock is at a higher altitude.
The Cenomanian limestone (C4-5) constitutes the principal recharge zone at the top of the mountain region; the Senonian marl (C6) has very little recharge; and the recharge becomes more developed in the exposed Eocene Limestone (e2).

37
5. reSultS
A changing percolation rate exists in regions adjacent to the coastal plains where the Ramsar site is located. However, the accumulation of colluvial, alluvial and fluvial deposits at the foot of the mountain slopes (where they make contact with the plain) creates a groundwater storage/flow zone where groundwater flows out from different sources in this zone.
5.3.2.2 Hydrostructure
Rock deformations were dominant in this study, where they displayed different aspects and dimensions, and hence governed the entire groundwater regime. They were mainly represented by the strike-slip fault systems which run from the high altitudes of the recharge zones, where Cenomanian limestone (C4-5) is well developed, reaching the coastal plain as shown in Figure 2.9.
Although the geological maps published by Dubertret in 1953 show a number of fault systems, the processing of Aster satellite images (notably the use of thermal bands) identified the geographic extent oxf many faults in the area, as shown in Figure 5.9. The satellite images enabled us to recognize the exact extent
of the fault, notably in the areas where friable and quaternary deposits exist.
Fractures systems also exist, and make an essential contribution to the groundwater regime. They include a variety of fissures at different scales and orientations. As a result, these fissures – in combination with the existing joints – increase the vertical and horizontal recharge property of the exposed rocks. They are better developed in the hard rocks than in those with marly content.
Karsitfication is another hydrostructure phenomenon which is predominant in the carbonate rocks in the area, and is increased where dolomite content is found. As a result, the karstified rocks show several aspects related to carbonate dissolution. These appear mainly as caves and conduits, and the latter may extend to depths of several hundreds of metres, with irregular orientations. Their excavations can found along the surfaces of weakness (e.g. contact between rock beds or fracture alignments).
The predominance of bedding plane inclination (between 12° and 24°) westward governs the general groundwater flow seaward. The dip is found to increase in the hard carbonates (i.e. C4-5).
Figure 5.9. Faults identified after processing of Aster satellite images
5.3.2.3 Hydrologic characteristics
As a result of the diverse lithological characteristics of the exposed rocks, different groundwater regimes exist, notably near zones with marked hydrostructural features. The area of study
has diverse hydrological features, such as the contact between high permeability rocks (i.e. limestone and dolomite) and low permeability (i.e. marl).
The major hydrological and aquiferous characteristics of the rock formations in the study area are summarized in Table 5.2.
Table 5.2. Hydrologic characteristics of the different rock formations at the Tyre Beach site and the adjacent mountainous regions
Rock formation Thickness (m)
Infiltration* (%) Permeability Porosity Aquiferous characteristics
Quaternary deposits (Q) < 25 < 15 Variable Variable Non-defined
Eocene limestone (e2) 180 23 Moderate-high Moderate Aquiclude
Senonian marly limestone (C6) 150-160 10 Moderate Moderate Aquitard
Cenomanian limestone (C4-5) (exposed) 130-150 35 High High** Aquifer
*Infiltration percentage from the precipitated water. **High is due to secondary porosity as a result of extensive fractures.
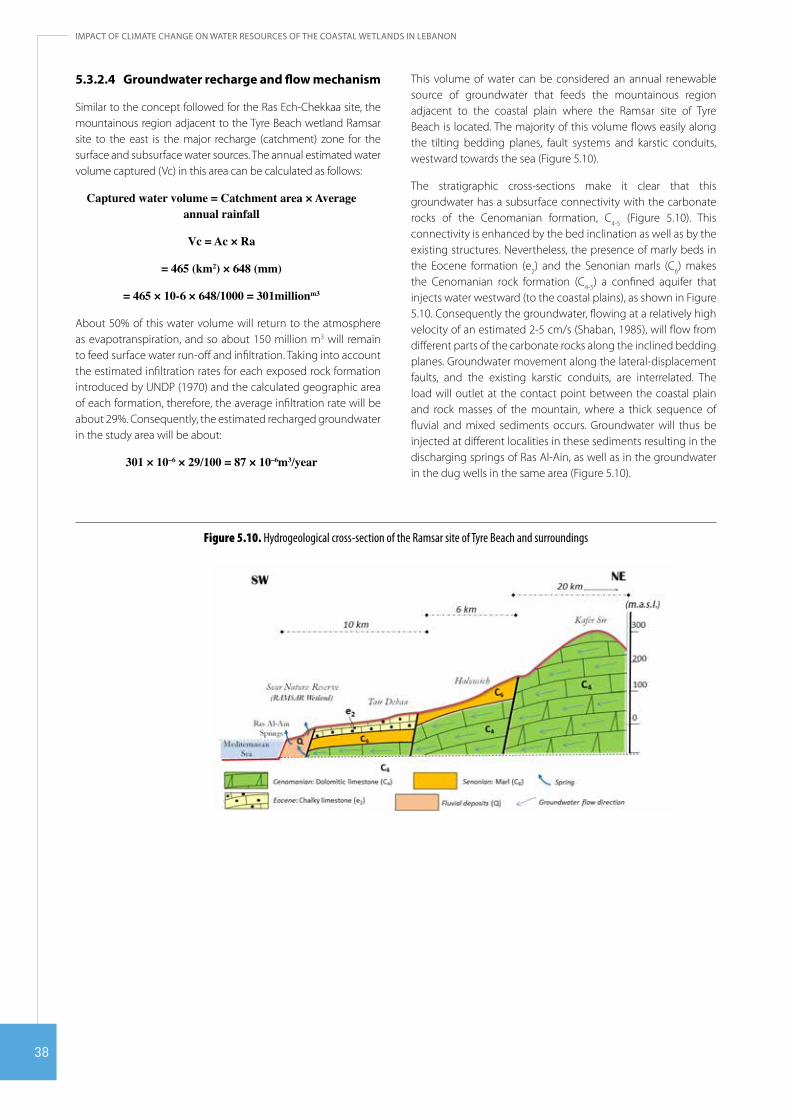
38
IMPACT OF CLIMATE CHANGE ON WATER RESOURCES OF THE COASTAL WETLANDS IN LEBANON
5.3.2.4 Groundwater recharge and flow mechanism
Similar to the concept followed for the Ras Ech-Chekkaa site, the mountainous region adjacent to the Tyre Beach wetland Ramsar site to the east is the major recharge (catchment) zone for the surface and subsurface water sources. The annual estimated water volume captured (Vc) in this area can be calculated as follows:
Captured water volume = Catchment area × Average annual rainfall
Vc = Ac × Ra
= 465 (km2) × 648 (mm)
= 465 × 10-6 × 648/1000 = 301millionm3
About 50% of this water volume will return to the atmosphere as evapotranspiration, and so about 150 million m3 will remain to feed surface water run-off and infiltration. Taking into account the estimated infiltration rates for each exposed rock formation introduced by UNDP (1970) and the calculated geographic area of each formation, therefore, the average infiltration rate will be about 29%. Consequently, the estimated recharged groundwater in the study area will be about:
301 × 10–6 × 29/100 = 87 × 10–6m3/year
This volume of water can be considered an annual renewable source of groundwater that feeds the mountainous region adjacent to the coastal plain where the Ramsar site of Tyre Beach is located. The majority of this volume flows easily along the tilting bedding planes, fault systems and karstic conduits, westward towards the sea (Figure 5.10).
The stratigraphic cross-sections make it clear that this groundwater has a subsurface connectivity with the carbonate rocks of the Cenomanian formation, C4-5 (Figure 5.10). This connectivity is enhanced by the bed inclination as well as by the existing structures. Nevertheless, the presence of marly beds in the Eocene formation (e2) and the Senonian marls (C6) makes the Cenomanian rock formation (C4-5) a confined aquifer that injects water westward (to the coastal plains), as shown in Figure 5.10. Consequently the groundwater, flowing at a relatively high velocity of an estimated 2-5 cm/s (Shaban, 1985), will flow from different parts of the carbonate rocks along the inclined bedding planes. Groundwater movement along the lateral-displacement faults, and the existing karstic conduits, are interrelated. The load will outlet at the contact point between the coastal plain and rock masses of the mountain, where a thick sequence of fluvial and mixed sediments occurs. Groundwater will thus be injected at different localities in these sediments resulting in the discharging springs of Ras Al-Ain, as well as in the groundwater in the dug wells in the same area (Figure 5.10).
Figure 5.10. Hydrogeological cross-section of the Ramsar site of Tyre Beach and surroundings
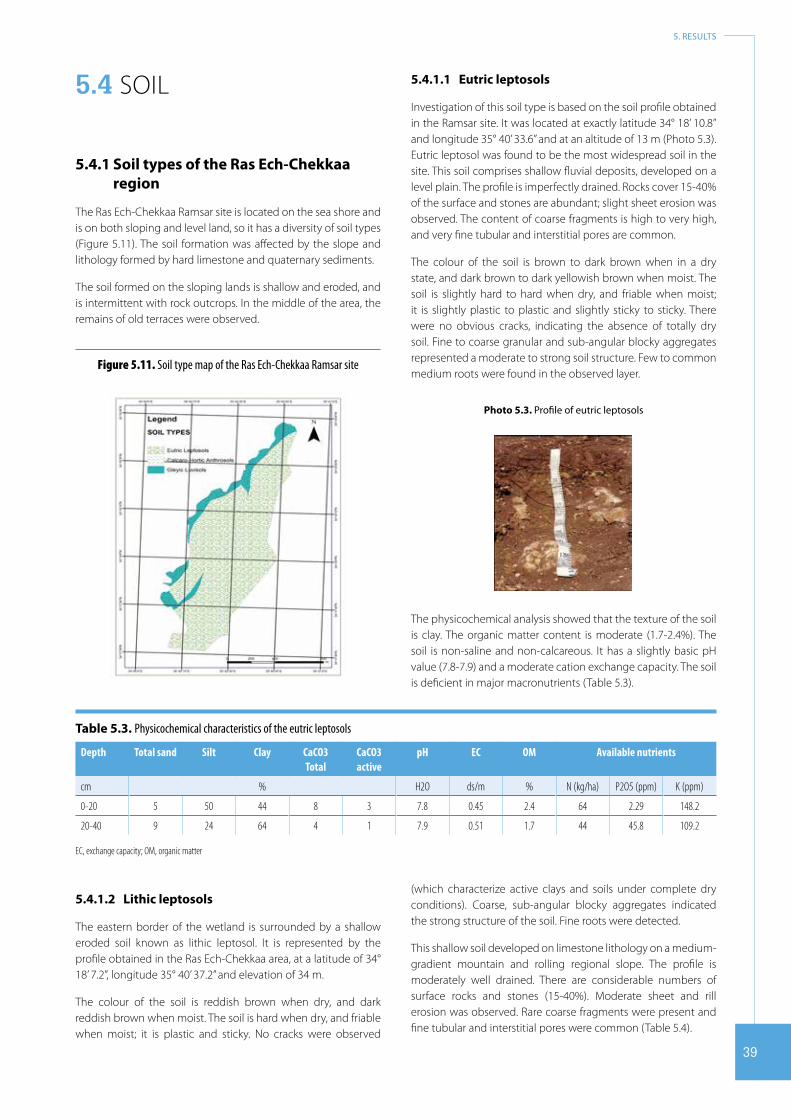
39
5. reSultS
5.4 SOIL
5.4.1 Soil types of the Ras Ech-Chekkaa region
The Ras Ech-Chekkaa Ramsar site is located on the sea shore and is on both sloping and level land, so it has a diversity of soil types (Figure 5.11). The soil formation was affected by the slope and lithology formed by hard limestone and quaternary sediments.
The soil formed on the sloping lands is shallow and eroded, and is intermittent with rock outcrops. In the middle of the area, the remains of old terraces were observed.
Figure 5.11. Soil type map of the Ras Ech-Chekkaa Ramsar site
5.4.1.1 Eutric leptosols
Investigation of this soil type is based on the soil profile obtained in the Ramsar site. It was located at exactly latitude 34° 18’ 10.8” and longitude 35° 40’ 33.6” and at an altitude of 13 m (Photo 5.3). Eutric leptosol was found to be the most widespread soil in the site. This soil comprises shallow fluvial deposits, developed on a level plain. The profile is imperfectly drained. Rocks cover 15-40% of the surface and stones are abundant; slight sheet erosion was observed. The content of coarse fragments is high to very high, and very fine tubular and interstitial pores are common.
The colour of the soil is brown to dark brown when in a dry state, and dark brown to dark yellowish brown when moist. The soil is slightly hard to hard when dry, and friable when moist; it is slightly plastic to plastic and slightly sticky to sticky. There were no obvious cracks, indicating the absence of totally dry soil. Fine to coarse granular and sub-angular blocky aggregates represented a moderate to strong soil structure. Few to common medium roots were found in the observed layer.
Photo 5.3. Profile of eutric leptosols
The physicochemical analysis showed that the texture of the soil is clay. The organic matter content is moderate (1.7-2.4%). The soil is non-saline and non-calcareous. It has a slightly basic pH value (7.8-7.9) and a moderate cation exchange capacity. The soil is deficient in major macronutrients (Table 5.3).
Table 5.3. Physicochemical characteristics of the eutric leptosols
Depth Total sand Silt Clay CaCO3 Total
CaCO3 active
pH EC OM Available nutrients
cm % H2O ds/m % N (kg/ha) P2O5 (ppm) K (ppm)
0-20 5 50 44 8 3 7.8 0.45 2.4 64 2.29 148.2
20-40 9 24 64 4 1 7.9 0.51 1.7 44 45.8 109.2
EC, exchange capacity; OM, organic matter
5.4.1.2 Lithic leptosols
The eastern border of the wetland is surrounded by a shallow eroded soil known as lithic leptosol. It is represented by the profile obtained in the Ras Ech-Chekkaa area, at a latitude of 34° 18’ 7.2”, longitude 35° 40’ 37.2” and elevation of 34 m.
The colour of the soil is reddish brown when dry, and dark reddish brown when moist. The soil is hard when dry, and friable when moist; it is plastic and sticky. No cracks were observed
(which characterize active clays and soils under complete dry conditions). Coarse, sub-angular blocky aggregates indicated the strong structure of the soil. Fine roots were detected.
This shallow soil developed on limestone lithology on a medium-gradient mountain and rolling regional slope. The profile is moderately well drained. There are considerable numbers of surface rocks and stones (15-40%). Moderate sheet and rill erosion was observed. Rare coarse fragments were present and fine tubular and interstitial pores were common (Table 5.4).

40
IMPACT OF CLIMATE CHANGE ON WATER RESOURCES OF THE COASTAL WETLANDS IN LEBANON
Table 5.4. Physicochemical characteristics of the lithic leptosols
Depth Total sand Silt Clay CaCO3 Total
CaCO3 active
pH EC OM Available nutrients
cm % H2O ds/m % N (kg/ha) P2O5 (ppm) K (ppm)
0-30 9 32 56 5 2 7.8 0.43 2.5 67 2.29 128.7
EC, exchange capacity; OM, organic matter
5.4.1.3 Gleyic luvisols
The third soil type in the Ras Ech-Chekkaa site is the gleyic luvisol which spreads along the sea shore. The profile of this soil type was obtained at latitude 34° 16› 58.8”, longitude 35° 40’ 22.8 and 9 m elevation.
This very deep soil has developed on limestone on a level plain and flat slope (gradient < 5%). The profile is very poorly drained. There are few surface rocks but stones are common. No surface erosion features could be observed. Rare coarse fragments were present, and fine tubular and interstitial pores were common.
The colour of the soil is dark yellowish brown when dry and dark yellowish brown to dark reddish brown when moist. The soil is
hard when dry and friable to firm when moist; it is slightly plastic to plastic and sticky. No cracks were observed. Medium to coarse sub-angular blocky and angular blocky aggregates represented the strong structure of the soil. Common to frequent fine to medium roots were found.
Physicochemical analysis showed that the texture of the soil is clay. The organic matter (OM) content was moderate in the two upper horizons (1.5%-1.6%) but low in the lower horizon at 0.1%. The soil is non-saline and non-calcareous. It has a neutral pH value (6.8-7.2) and a low cation exchange capacity. The soil is only deficient in nitrogen and has an adequate value of potassium and phosphorus (Table 5.5) which indicates agricultural land use for some annual crops.
Table 5.5. Physicochemical characteristics of the gleyic luvisols
Depth Total sand Silt Clay CaCO3 Total
CaCO3 active
pH EC OM Available nutrients
cm % H2O ds/m % N (kg/ha) P2O5 (ppm) K (ppm)
0-10 7 40 52 3 1 6.8 0.51 1.6 41 36.64 358.8
10-70 6 28 64 2 1 7.1 0.28 1.5 40.00 18.32 101.4
70-130 5 22 70 2 1 7.2 0.29 0.1 28.00 2.29 81.9
EC, exchange capacity; OM, organic matter
5.4.2 Soil types of the Tyre Beach region
The soils in the Tyre Beach site are mainly deep and developed over a long period in the course of agricultural and other human activities. There is high human pressure and considerable agricultural activity, and excess irrigation caused by two main factors:
· Unharvested water
· Primitive methods of surface irrigation known for their low efficiency and large amounts of water infiltrated into the groundwater, which can enrich the water table with soluble nutrients.
The high level of nutrients found in the soils of the area supports the hypothesis of large soil-groundwater contamination with nitrates and possibly other harmful chemicals.
There are three main soil types in the site. From the east to the west, a narrow strip of hypocalcaric fluvisols and haplic vertisols can be found in association with quaternary sediments (Figure
5.12). The first is usually located on undulating micro-relief and is better drained. The vertisol type is found on most flat areas.
Figure 5.12. Soil type map of the Tyre Beach Ramsar site

41
5. reSultS
5.4.2.1 Hypocalcaric fluvisols
The investigation is based on the soil profile obtained in the Ramsar site, which is located exactly at latitude 33°13′30″ N, longitude 35°13′15″ E, elevation: 28 masl.
This very deep soil developed on fluvial deposits on a level plain and flat regional slope. The profile is very poorly drained. There are few surface rocks but many stones (15-40%). No erosion was observed. Few to common coarse fragments are present with few to many micro- to fine tubular and interstitial pores (Table 5.6).
The colour of the soil is dark yellowish brown to very dark greyish brown, and dark brown under dry conditions. It becomes dark
brown to very dark brown when moist. The soil is slightly hard to hard when dry, and friable when moist; it is slightly plastic to plastic and slightly sticky to sticky. Very small cracks are observed. Medium to coarse sub-angular blocky aggregates represented the moderate to strong structure of the soil. Very few to frequent fine roots are found.
The physicochemical analysis showed that the texture of the soil is clay. The OM content is moderate (1.2-2.8%). The soil is non-saline and slightly calcareous with 11-30% CaCO3 of which 3-5% were active. It has a slightly basic pH value (7.7) and a low to moderate cation exchange capacity. The upper horizon is only deficient in nitrogen but the two lower horizons are deficient in nitrogen major macronutrients (Table 5.6).
Table 5.6. Physicochemical characteristics of the hypocalcaric fluvisols
Depth Total sand Silt Clay CaCO3 Total
CaCO3 active
pH EC OM Available nutrients
cm % H2O ds/m % N (kg/ha) P2O5 (ppm) K (ppm)
0-30 19 20 58 30 3 7.7 0.2 2.8 75.00 96.18 400.14
30-70 15 18 62 14 4 7.7 0.58 1.3 35.00 9.16 230.10
70-130 17 20 58 11 5 7.7 0.62 1.2 32.00 6.87 69.81
EC, exchange capacity; OM, organic matter
5.4.2.2 Haplic vertisols
This soil is found in the profile in the investigated site, which is located at latitude 33°13′15″ N, longitude 35°12′59″ E and at 17 m elevation. This deep soil developed on fluvial deposits in the plain and flat slope (Photo 5.4). Few coarse fragments are present, with few micro-tubular and interstitial pores (Table 5.7).
The colour of the soil is very dark greyish brown under dry conditions and very dark brown under moist conditions. It is slightly hard to very hard when dry, and loose to very firm when moist; it is plastic and sticky. No cracks are observed. Coarse sub-angular blocky aggregates represent the moderate to strong structure of the soil. Very few to very fine roots are found.
Photo 5.4. haplic vertisols irrigated by the furrow method
Table 5.7. Physicochemical characteristics of the haplic vertisols
Depth Total sand Silt Clay CaCO3 Total
CaCO3 active
pH EC OM Available nutrients
cm % H2O ds/m % N (kg/ha) P2O5 (ppm) K (ppm)
0-45 32 20 48 7 2 7.7 0.44 2.1 54.00 137.40 639.99
45-80 21 20 58 2 1 7.6 0.54 0.9 23.00 66.41 510.12
80-110 18 20 58 3 1 7.6 0.59 0.7 18.00 9.16 170.04
EC, exchange capacity; OM, organic matter
The physicochemical analysis shows that the texture of the soil is clay. The organic matter (OM) content is moderate to low (0.7-2.1%). The soil is non-saline and non-calcareous, with a neutral pH value (7.6-7.7) and a high cation exchange capacity. The
soil is deficient in nitrogen and has extremely high levels of phosphorus and potassium (Table 5.7).

42
IMPACT OF CLIMATE CHANGE ON WATER RESOURCES OF THE COASTAL WETLANDS IN LEBANON
5.4.2.3 Haplic fluvisols
These results depended on the data from the profile obtained at latitude 33°13′47″ N, longitude 35°12′″53 E, elevation 10 m. This moderately deep soil developed on fluvial deposits on a level plain and flat regional slope. The profile is moderately well drained. There are no rocks on the surface rockiness but many stones. Many to abundant coarse fragments are present and very fine to fine tubular and interstitial pores are common (Table 5.8).
The colour of the soil is dark yellowish-brown, and moist. The soil is very friable to friable when moist; it is plastic and sticky.
No cracks were observed. Very fine to medium granular and sub-angular blocky aggregates represent the weak to moderate structure of the soil. Few to very frequent very fine to fine roots are found.
The physicochemical analysis shows that the texture of the soil is clay. The OM content is moderate (1.1-2.5%). The soil is non-saline and calcareous (23-29% CaCO3) of which 5% is active. It has a slightly basic pH value (7.7-7.9) and a moderate cation exchange capacity. The soil is deficient in nitrogen and has adequate levels of phosphorus and potassium (Table 5.8).
Table 5.8. Physicochemical characteristics of the hypocalcaric fluvisols
Depth Total sand Silt Clay CaCO3 Total
CaCO3 active
pH EC OM Available nutrients
cm % H2O ds/m % N (kg/ha) P2O5 (ppm) K (ppm)
0-25 16 18 64 23 5 7.9 0.48 2.5 66 25.19 500
25-100 22 18 58 29 5 7.7 0.19 1.1 29 13.74 250
EC, exchange capacity; OM, organic matter.
The sandy area near the beach was also partly used for agricultural production under low plastic tunnels. This left a very narrow sandy strip little used by people that could just be considered a wildlife area for aquatic animals, given the high disturbance and compaction of the ground.
5.5 ECOSYSTEM
5.5.1 Ecosystem of Ras Ech-Chekkaa region
The site is characterized by hills; an undisturbed maquis covers the steep escarpments of limestone, and woodland and scrubland grow on the plateau. These types of ecosystems form just 6% of the land area in Lebanon, and 6-10% of the Batroun district (AECID/MOE/IUCN, 2011), revealing the significance and rarity value of the investigated site.
5.5.1.1 Conservation status and recognition
The site can be considered a sensitive hotspot, preserved but threatened, requiring protection (AECID/MOE/IUCN, 2011). It is ill-defined and has no management or conservation plan. Additionally, the concerned area is located on a significant Middle Eastern migratory bird route and embraces habitats for migrating passerines, which classifies it ultimately as an important bird area (IBA).
Such wooded landscapes are increasingly rare and have natural beauty. They are also important for biodiversity and are of historical interest, and so their current status needs to be preserved and protected from possible challenges and impacts. Because of these concerns, there is a proposal for this site to be
classified as a nature reserve, under category IV of “Protected area with sustainable use of natural resources”, according to the International Union for Conservation of Nature (IUCN).
5.5.1.2 Ecological evaluation
5.5.1.2.1 Description of flora
The site is a habitat for a diverse flora, notably species of cyclamen and narcissus (AECID/MOE/IUCN, 2011). With a dense growth of Quercus calliprinos (Palestine oak), the woodland reaches a height of 3 m, along with an abundant understory of shrubby species including Pistacia lentiscus (mastic tree), Calycotome villosa (spiny broom), Spartium junceum (Spanish broom) (Photo 5.5) and Sarcopoterium spinosum (thorny burnet), with a few scattered Ceratonia siliqua (carob trees) at lower altitudes. This zone is thus a dazzling junction of two vegetation series: the thermophilous series of Palestine oak and the carob-lentiscus series dominated by the lentisc. An aquatic species, Arundo donax (giant cane) is also found and is a characteristic plant of wetlands. Field surveys performed by AECID/MOE/IUCN (2011) and EcoMed (2012) identified the existing communities of trees, shrubs, climbers and herbs recorded in the Ras Ech-Chekkaa ecosystem.
Photo 5.5. Spartium junceum (Spanish broom)

43
5. reSultS
5.5.1.2.2 Description of fauna
There is an assemblage of numerous marine species in this littoral area, which is a representative site of the marine environment and biogeographic region. Supra-, medio- and infra-littoral zones have been described in the Ras Ech-Chekkaa marine ecosystem (RAC/SPA-UNEP/MAP, 2014), which has submarine freshwater springs that amplify the marine diversity. Sixteen fish species have been recorded and, notably, some endangered sea turtles: the green turtle (Chelonia mydas) and the loggerhead turtle (Caretta caretta). The site is a sensitive coastal habitat for vermitid platform species and for two commercial sponges: Hippospongia communis and Spongia officinalis adriatica, all of which have been given high levels of protection (AECID/MOE/IUCN, 2011).
The terrestrial fauna is diverse and sometimes characteristic of the site. Some of the species found include a few individuals of Vulpes vulpes (red fox), Hyena hyena hyena (feral dog), Canis lupus (wolf ) and Canis aureus (golden jackal).
Reptile species are limited in distribution and variety: Laudakia stellio (hardun) is the dominant species and Cyrtopodion kotschyi (Kotschy’s gecko) is found among the bare rocks and soils. The
Middle-Eastern Testudo terrestris (Middle-Eastern tortoise) is recorded in the scrublands of the region at low densities and two very common species of skinks – Ablepharus budaki (Budak’s snake-eyed skink) and Trachylepis vittata (bridled skink) – are also encountered.
5.5.1.2.3 Migratory birds
There are five dominant bird species in and around the cliffs of the Ras Ech-Chekkaa site. The lowering of water levels and intrusion of salt water in place of fresh water, which leads to the water becoming saline, has played a major role in the decreasing abundance of visiting birds and the decrease in time spent there by migratory birds.
Between 1994 and 2014 there was a decrease in the numbers of four species out of five (equivalent to 80%) visiting Ras Ech-Chekkaa in their yearly migration (Table 5.9). However, Hirundo daurica (the red-rumped swallow) seems to have increased in number over this period. This increase has been explained by the beneficial effects of conservation efforts taken by the countries through which that species passes yearly.
Table 5.9. Numbers of bird species in the Cliffs of Ras Ech-Chekkaa between 1994 and 2014
Years & number per species
Pelecanus onocrotalus White pelican
Hirundo daurica Red-rumped swallow
Delichon urbica House martin
Troglodytes troglodytes Wren
Turdus merula Blackbird
1994 Stable Stable Stable Stable Stable
2014 Decreased Increased Decreased Decreased Decreased
5.5.2 Ecosystem of Tyre Beach
This marine/coastal wetland is characterized by the value of its ecological, marine and coastal ecosystems. Five types of habitats are found: Mediterranean coastal sand dunes; coastal freshwater land; agricultural land; sandy beaches; and pebble and stony beaches. This wonderful site has considerable aesthetic, conservation and recreational values and comprises a mosaic of habitats in the country’s unique coastal dunes and the wide sandy beach.
5.5.2.1 Conservation status and recognition
The Tyre Beach site has been considered a nature reserve since November 1998, and in 1999 it was designated Site 980 in the Ramsar Convention. The reserve is part of the city of Tyre, which in 1984 was designated by UNESCO as a World Heritage Site, emphasizing the reserve’s archaeological importance. Under the Special Protected Area (SPA) convention, to which Lebanon adhered in 1994, the reserve was classified as an SPA in 2011 and Schéma Directeur d’Aménagement du Territoire Libanais (SDTAL) considers it part of the littoral regional natural park perimeter.
Internationally, the site has attracted wide interest as it is:
· an important nesting site for globally threatened sea turtles, and is on the IUCN Red List
· a wide beach with important sand dunes diversity (Riddiford, N. pers. comm., 2003)
· a wetland of international significance (Ramsar site number 980)
· an important resting site for water birds and waders
· an important remaining coastal agriculture site, where open field crops are planted along with field crops.
5.5.2.2 Ecological evaluation
5.5.2.2.1 Description of flora
The Tyre Beach Reserve is classified as “Sand Dunes of Mediterranean Coast” according to Corine’s classification (CORINE, 1991), and belongs to the “White Sand Dunes of the Mediterranean dominated by Ammophilia arenaria” habitat (code 16.2122) with Echinophora spinosa (prickly parsnip), Eryngium maritimum (seaside eryngo), Euphorbia paralias (sea spurge), Cutandia maritima (cutandia grass), Medicago marina (sea medick) and Anthemis maritima (seaside chamomile). The mixture of marine and terrestrial ecosystems composed of the agricultural lands, coastal sand dunes, wide sandy beaches, marshes and springs found in the reserve results in a diversified flora assembled along the shift from one type of habitat to another (UNEP, 2011).

44
IMPACT OF CLIMATE CHANGE ON WATER RESOURCES OF THE COASTAL WETLANDS IN LEBANON
The site has 275 species distributed over 50 families. Notably, it is home to seven regionally and nationally threatened species and four endemics (one of which is Astragalus betrytheus, the Beirut milk-vetch) and ten rare species (including Ficus sycomorus, the sycamore fig; and Pancratimum maritimum, the sea daffodil); while 59 species are restricted to the eastern Mediterranean area. The presence of 50 bioindicator species has been noted among the list of Tyre plants, as well as 25 medicinal species (MOE/UNDP, LU, 2004).
5.5.2.2.2 Description of fauna
Thirteen mammal species have been counted in the region, distributed over eight families (Jaradi and Jaradi, 2014). Two of them, Meles meles canescens (European badger) and Acomys dimidiatu (Arabian spiny mouse), were recorded to be globally threatened and nationally susceptible in Lebanon (Jaradi and Jaradi, 2012). However, two pest species were identified in the site, the domestic rat (Rattus rattus) and mouse (Mus musculus), which are usually indicators of organic waste accumulation. Field surveys performed by MOE/UNDP/LU (2004) identified the mammal species found at the site concerned.
Additionally, 18 herptile species were recorded on previous assessment of the reserve. The three marine turtles Chelonia mydas (green turtle), Caretta caretta (loggerhead sea turtle) and Dermochelys coriacea (leatherback sea turtle) constitute the only globally threatened species in this reserve. Acanthodactylus shreiberi (Schreiber’s fringe-fingered lizard) is endemic and all the others are regionally threatened herptile species (UNEP, 2011).
The site is a stronghold for nesting turtles, notably the nesting concentrations of the threatened Caretta caretta (Photo 5.6).
Photo 5.6. Caretta caretta, loggerhead turtle
5.5.2.2.3 Migratory birds
Several species of birds can be observed around Tyre Coast, including warblers, waders, stilts, passerines, raptors, kingfisher, gulls and terns. There are 28 dominant species, and 23 of these are of high concern and importance. These can be classified as:
· four globally threatened species
· 12 regionally threatened species
· seven partially restricted species in the Middle East.
Of the most dominant 23 species, four have been affected by the consequences of climate change on the Tyre Coast, equivalent to about 17% of the most dominant species (Table 5.10).
Table 5.10. Numbers of bird species at the Tyre Beach site between 1994 and 2014
Years /number per species
Phalacrocora × pygmeus
Pygmy cormorant
Pelecanus crispus
Dalmatian pelican
Falco naummani
Lesser kestrel
Crex crexCorn crake
Botaurus stellaris
Eurasian bittern
Ciconia ciconiaWhite stork
Aythya nyrocaFerruginous
duck
Elanus coeruleus
Black-winged kite
1994 Stable Stable Stable Stable Stable Stable Stable Stable
2014 Stable Stable Stable Stable Stable Stable Stable Stable
Years /number per species
Gyps fulvusGriffon vulture
Accipiter brevipesLevant
sparrowhawk
Aquila pomarina
Lesser spotted eagle
Falco cherrugSaker falcon
Falco biarmicus
Lanner falcon
Gallinago media
Great snipe
Larus hemprichiiSooty gull
Glareola nordmani
Black-winged pratincole
1994 Stable Stable Stable Stable Stable Stable Stable Stable
2014 Stable Stable Decreasing Stable Stable StableDecreasing
Stable
Years /number per species
Pernis apivorusEuropean
honey buzzard
Pycnonotus xanthopygos
White-spectacled
bulbul
Irania gutturalis
White-throated robin
Neophron percnopterus
Egyptian vulture
Hippolais languidaUpcher’s warbler
Sylvia mystacea
Menetries’s warbler
Serinus syriacus
Syrian serin
1994 Stable Stable Stable Stable Stable Stable Stable
2014 Stable Stable Stable Stable StableDecreasing Decreasing

45
5. reSultS
5.6 LAND COVER MAP
5.6.1 Land cover of Ras Ech-Chekkaa
A level 4 Land cover map was obtained for the Ras Ech-Chekkaa site, which is represented mainly by the flat coastal plain and the adjacent mountains. The flat area is mainly covered by bare soils and some patches of human activity patches (e.g. urban areas and cultivation). However, the mountainous area is characterized by bare rocks and shrubs.
5.6.1.1 Major terrain components
According to the processed images from the GeoEye-1 satellite, which were verified in the field surveys, eight major terrain components are recognized. These are listed in Table 5.11, where each component has a measured area, according to the satellite images processed in 2014.
It is clear that the principal component is dense forests in the flat area of the Ramsar site; shrubs and trees are also found. However, Table 5.11 and Figure 5.13 show that several components, mainly for the agricultural areas and lands, have totally disappeared.
Table 5.11. Areas of major land cover components of Ras Ech-Chekkaa site (2014)
Land cover component
Area % of the total area of the studied site(km2) (ha)
Field crops as small field and terraces
0.0434 4.34 5.1
Agricultural units 0 0 0
Material extraction site 0 0 0
Dense forests of Quercus (oaks) 0.2557 25.27 30.08
Beach areas 0 0 0
Protected agriculture 0 0 0
Shrubs and trees 0.0644 6.44 7.57
Grasslands of medium density 0.4918 49.18 57.85
Figure 5.13. Land cover maps (2005 and 2014) for the Ras Ech-Chekkaa site, as identified from Geo-Eye-1 satellite images

46
IMPACT OF CLIMATE CHANGE ON WATER RESOURCES OF THE COASTAL WETLANDS IN LEBANON
5.6.1.2 Changing land cover 2005-2014
As a monitoring approach, comparative analysis of two satellite images with different dates enables us to identify land cover change. In other words, the changing terrain components can be geographically recognized including the area and changing direction, as shown in Figure 5.13.
The analysed satellite images for the years 2005 and 2014 allow us to calculate the increase or decrease in each component (Table 5.12). It was found that there was a remarkable change in the area of sites for extracted materials (these were totally absent by 2014); likewise, many other components completely disappeared between 2005 and 2014.
Table 5.12. Changing areas of major land cover components of the Ras Ech-Chekkaa site (2005-2014)
Land cover component
Area
(km2)Changing
area (km2)
% change
2005 2014
Field crops as small field and terraces
0.0539 0.0434 −0.0105 19.5
Agricultural units 0.0043 0 −0.0043 100
Material extraction site 2.6960 0 −2.6960 100
Dense forests of Quercus (oaks)
0.3126 0.2557 −0.0569 18.20
Beach areas 0.0833 0 −0.0833 100
Protected agriculture 0.0095 0 −0.0095 100
Shrubs and trees 0.0685 0.0644 −0.0041 5.9
Grasslands of medium density
0.5818 0.4918 −0.09 15.47
5.6.2 Land cover of Tyre Beach
A level 4 Land cover map was produced for the Tyre Beach Ramsar site, which is represented mainly by a relatively wide coastal plain adjacent to gradually sloping terrain to the east. Hence, the majority of the plain is a sandy beach where a number of other terrain components exist, mainly the cultivated areas of field crops. The adjacent slopes are also occupied by cultivated areas, primarily planted with fruit trees.
Urban settlements and a miscellany of human activities are dissipated in different patches in the site and its area of proximity, but these are concentrated mainly along the Tyre-Naquora highway, which represents the contact between the coastal plain and the sloping areas.
5.6.2.1 Major terrain components
The processed GeoEye-1 satellite images were verified in the field surveys to ensure the reliability of the obtained results. It was found that there were 18 main terrain components in the investigated site in 2014, as listed in Table 5.13. It was obvious that the majority of the terrain components in the Tyre Beach site were represented by banana and citrus trees, and by field crops.
Table 5.13. Areas of major land cover components of Tyre Beach site (2014)
Land cover component
Area % of the total area of the studied
site(km2) (ha)
Citrus trees 0.7114 71.14 18.38
Deciduous fruit trees 0 0 0
Leafy, low-density forest 0 0 0
Banana lands 1.4882 148.82 38.45
Harbour basin 0 0 0
Resort complex 0 0 0
Field crops a(small fields and terraces)
1.0013 100.13 25.87
Open fields 0 0 0
Lakes 0.0036 0.36 0093
Urban sprawl or field crops 0.1729 17.29 4.46
Urban sprawl or permanent crops 0.0109 1.09 0.28
Olives 0 0
Beach sand 0.3851 38.51 9.95
Protected agriculture 0.0540 5.4 1.39
Urban vacant land 0 0 0
Dense urban fabric 0 0 0
Shrublands 0.0113 1.13 0.29
Grasslands of medium density 0.0397 3.97 1.02
5.6.2.2 Changing land cover (2005-2014)
Applied comparative analysis for the two satellite images for 2005 and 2014 enable us to identify changing land cover over the last 10 years. Therefore, the changing terrain components can be identified to presume the areal change, as shown in Figure 5.14.

47
5. reSultS
Figure 5.14. Land cover maps of 2005 and 2014 for Tyre Beach site, as identified from satellite images
It is obvious that the main change has been in the citrus-growing lands which have decreased by about 2.4km2, equivalent to 77%, over the last 10 years. There has also been a decrease in land for banana, which represents about 81%. Table 5.14 shows the changes in area of the major terrain components in the Tyre Beach site.
Table 5.14. Changing areas of major land cover components of Tyre Beach site (2005-2014)
Land cover component
Area (km2)
Changing area
(km2)
% change
2005 2014
Citrus trees 3.1281 0.7114 –2.4167 77.25
Deciduous fruit trees 0.0091 0 –0.0091 100
Leafy, low-density forest 0.0032 0 –0.0032 100
Banana lands 1.8261 1.4882 –0.3379 81.49
Harbour basin 0.0010 0 –0.0010 100
Resort complex 0.0319 0 –0.0319 100
Field crops (small fields and terraces)
0.1650 1.0013 +0.8363 83.52
Open fields 0.0109 0 –0.0109 100
Lakes 0.0053 0.0036 –0.0017 32.07
Urban sprawl or field crops 0.0056 0.1729 +0.1673 96.76
Urban sprawl or permanent crops
0.0462 0.0109 –0.0353 76.40
Olives 0.0039 0 –0.0039 100
Beach sand 0.1924 0.3851 +0.1927 50.03
Protected agriculture 0.0799 0.0540 _0.0259 32.41
Vacant urban land 0.0291 0 –0.0291 100
Dense urban fabric 0.4992 0 –0.4992 100
Shrublands 0.0121 0.0113 –0.0008 6.61
Grasslands of medium density
0.0420 0.0397 –0.0023 5.47

49
6. DISCUSSION, CONCLUSION AND RECOMMENDATIONS

50
IMPACT OF CLIMATE CHANGE ON WATER RESOURCES OF THE COASTAL WETLANDS IN LEBANON
6.1 WETLAND CRITERIA
Wetland, as mentioned earlier, should be characterized by the presence of sufficient amounts of surface or subsurface water so that it becomes a water-saturated zone which attracts flora and fauna species different from those in the surrounding areas.
The data and information obtained on the two sites in Lebanon are comparable to those relating to other wetlands subjected to physical and anthropogenic stresses that result in them losing their criteria as water-saturated terrains, and so experience a decline in their unique flora and fauna.
In this study, three major pillars, with subheadings, were adopted to characterize the existing wetlands in Lebanon. The criteria used can be summarized as:
1. Water availability:
- Existence of visible water sources:
(i) river (in the proximity of the wetland, and water recharging the land for a considerable period as overland flow or as interflow)
(ii) spring (spring outlets into a water-storage terrain)
(iii) natural lake (continuation of water bodies in the proximity of natural lake)
- Existence of groundwater inflow:
(i) water seepages along rock stratum (groundwater flow along bedding planes)
(ii) rising piezometric level (continuation of water table above terrain surface)
- Saturated soil:
(i) level of water retention (soil saturated following rainfall)
(ii) duration of water retention (long-term saturation of soil following rainfall)
2. Species uniqueness:
- Unique flora
(i) species type (species different from the surrounding regions)
(ii) species number (species number exceeds that in surrounding regions)
- Unique fauna
(i) Species type (species different from the surrounding regions)
(ii) Species number (species number exceeds that in surrounding regions)
3. State of knowledge:
- reserved area (at the local level)
- Ramsar site (at regional or international level)
- nature reserve (at the national level)
- proposed area (to be reserved and adopted as a reserved site).
Each component was assigned a criterion priority (i.e. primary, secondary and proposed criterion). In addition, each item in a priority was given a score, as follows:
· Water availability = 10
· Species uniqueness = 5
· State of knowledge = 2.5.
Within each item, there are three zones of ranking, where each zone is accounted 33% of the item score. These zones are:
· well exists
· well normally exists
· well has limited viability.
Therefore, the full cumulative score that can numerically characterize each of the Ramsar sites investigated is 100. The results were as follows (Figures 6.1 and 6.2):
1. Ras Ech-Chekkaa site = (Primary) 2 limited viability + (Secondary) 1 limited viability; 1 normally exists + (Proposed) 1 well exists
= 10 (2 × 0.33) + 5 (1 × 0.33 + 1 × 0.66) + 2.5 (1 × 1) = 14.1/100
2. Tyre Beach site = (Primary) 2 well exists; 4 normally exists + (Secondary) 4 well exists; 1 normally exists + (Proposed) 3 well exists
= 10 (2 × 1 + 4 × 0.66) + 5 (4 × 1) + 2.5 (3 × 1) = 73.9/100
It is quite obvious that the designation of the Ras Ech-Chekkaa site as a wetland does not accord with the above criteria, since its score is low (~14/100). In contrast, the Tyre Beach site is clearly a wetland site since its score is high (~74/100).

51
6. dIScuSSIon, concluSIon and recoMMendatIonS
Figure 6.1. Characterization of Ras Ech-Chekkaa wetland site
Figure 6.2. Characterization of Tyre Beach wetland site

52
IMPACT OF CLIMATE CHANGE ON WATER RESOURCES OF THE COASTAL WETLANDS IN LEBANON
6.2 PHYSICAL AND ANTHROPOGENIC STRESSES ON THE RAS ECH-CHEKKAA SITE
In this study, the components of the Ras Ech-Chekkaa site were investigated from different points of view to identify it as a wet landform. The change in these components was apparent from the comparison in land cover maps, but water bodies – whether on the surface or subsurface – are not well defined in this site. This raises the question of how it was designated a wetland in the Ramsar wetlands list of 2014. Several experts and researchers demonstrated that this site, including both the terrestrial and marine environments, has patches that are saturated with water, namely: saturated soil, saline ponds, marshes and offshore freshwater springs. However, if these criteria are sufficient to characterize this site as a wetland, this will raise the fact that several similar localities along the Lebanese coast meet these criteria. In other words, there are many sites along the coast of Lebanon that have saturated soil, saline ponds, marshes and offshore freshwater springs.
The non-existence of obvious water bodies in this site did not mean it was not a wetland, as demonstrated by observations made by the local inhabitants. Nevertheless, there is no considerable soil saturation either in space or time.
The hydrological and hydrogeological investigations show poor inflow mechanisms, so surface water along the three existing streams is limited since these streams are relatively short and have very low water capacity. In addition, groundwater is restricted to seepages along the cliffs of Miocene carbonate rocks, which outlet sheet water low along these cliffs and presumably feed the coastal plain where the Ramsar site is located.
Therefore, the groundwater reservoir is of limited extent and capacity (391,000 m3/year); this is seen in the continuity of water flow to the site (Figure 6.3). This is reflected by the negligible decrease in rainfall rate, which was estimated at 12 mm over the last 30 years; it was also influenced by the increased temperature (1.25°C).
It is quite obvious that any change in climatic conditions in the investigated site and the surrounding hydrological and hydrogeological system will be critical and have an abrupt influence on water inflow towards the Ramsar site, and this is the current case. This, in turn, has reflected on the presumed wetland components such as the limited number of flora and fauna, notably the remarkable decrease in the numbers of migratory birds, which was estimated at 80% of the known species in the site.
Figure 6.3. Scheme showing groundwater flow mechanism in the Ras Ech-Chekkaa site
Human interference is commonly observed in the Ras Ech-Chekkaa site. This is not limited to negative activities in the site itself, but extends to neighbouring areas, from where water is captured. These activities include:
1. chaotic groundwater pumping
2. wood logging and forest fires
3. overgrazing (Photo 6.1).
4. uncontrolled excavation of rocks
5. fragmentation of arable land, mainly by roads
6. uncontrolled urban expansion
7. marine pollution by contaminated effluents
8. hunting.
Photo 6.1. overgrazing in the ras ech-chekkaa area
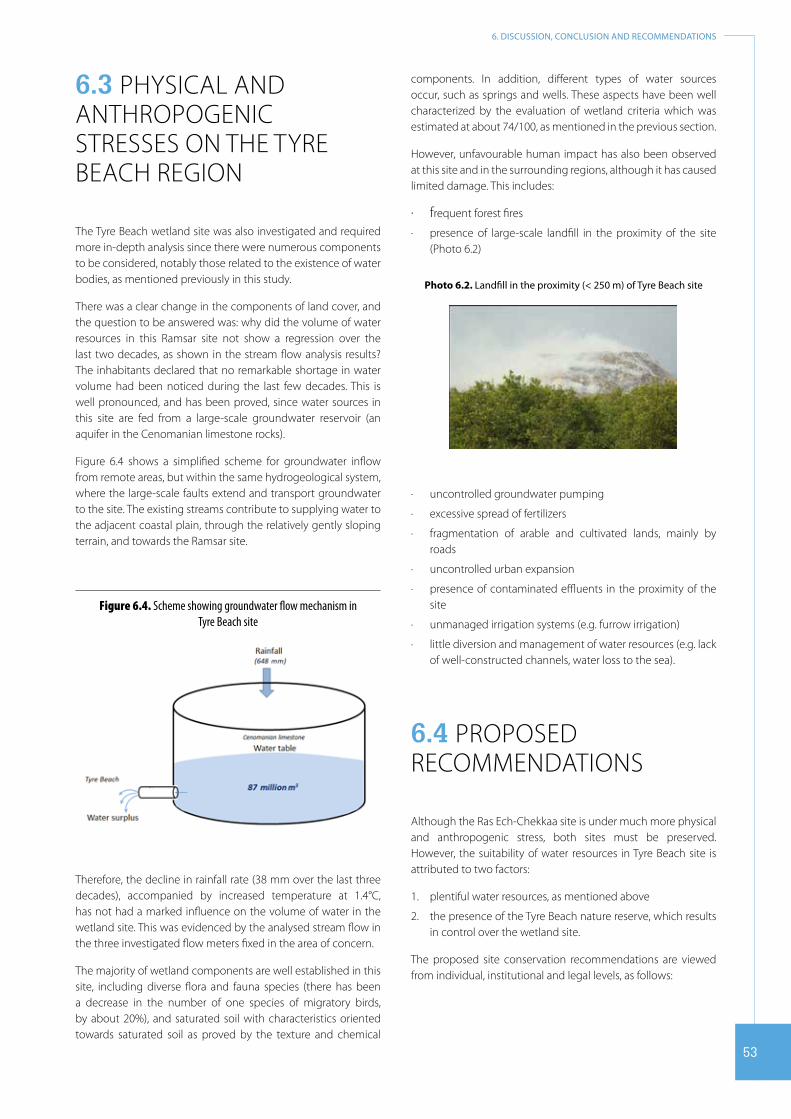
53
6. dIScuSSIon, concluSIon and recoMMendatIonS
6.3 PHYSICAL AND ANTHROPOGENIC STRESSES ON THE TYRE BEACH REGION
The Tyre Beach wetland site was also investigated and required more in-depth analysis since there were numerous components to be considered, notably those related to the existence of water bodies, as mentioned previously in this study.
There was a clear change in the components of land cover, and the question to be answered was: why did the volume of water resources in this Ramsar site not show a regression over the last two decades, as shown in the stream flow analysis results? The inhabitants declared that no remarkable shortage in water volume had been noticed during the last few decades. This is well pronounced, and has been proved, since water sources in this site are fed from a large-scale groundwater reservoir (an aquifer in the Cenomanian limestone rocks).
Figure 6.4 shows a simplified scheme for groundwater inflow from remote areas, but within the same hydrogeological system, where the large-scale faults extend and transport groundwater to the site. The existing streams contribute to supplying water to the adjacent coastal plain, through the relatively gently sloping terrain, and towards the Ramsar site.
Figure 6.4. Scheme showing groundwater flow mechanism in Tyre Beach site
Therefore, the decline in rainfall rate (38 mm over the last three decades), accompanied by increased temperature at 1.4°C, has not had a marked influence on the volume of water in the wetland site. This was evidenced by the analysed stream flow in the three investigated flow meters fixed in the area of concern.
The majority of wetland components are well established in this site, including diverse flora and fauna species (there has been a decrease in the number of one species of migratory birds, by about 20%), and saturated soil with characteristics oriented towards saturated soil as proved by the texture and chemical
components. In addition, different types of water sources occur, such as springs and wells. These aspects have been well characterized by the evaluation of wetland criteria which was estimated at about 74/100, as mentioned in the previous section.
However, unfavourable human impact has also been observed at this site and in the surrounding regions, although it has caused limited damage. This includes:
· frequent forest fires
· presence of large-scale landfill in the proximity of the site (Photo 6.2)
Photo 6.2. landfill in the proximity (< 250 m) of tyre Beach site
· uncontrolled groundwater pumping
· excessive spread of fertilizers
· fragmentation of arable and cultivated lands, mainly by roads
· uncontrolled urban expansion
· presence of contaminated effluents in the proximity of the site
· unmanaged irrigation systems (e.g. furrow irrigation)
· little diversion and management of water resources (e.g. lack of well-constructed channels, water loss to the sea).
6.4 PROPOSED RECOMMENDATIONS
Although the Ras Ech-Chekkaa site is under much more physical and anthropogenic stress, both sites must be preserved. However, the suitability of water resources in Tyre Beach site is attributed to two factors:
1. plentiful water resources, as mentioned above
2. the presence of the Tyre Beach nature reserve, which results in control over the wetland site.
The proposed site conservation recommendations are viewed from individual, institutional and legal levels, as follows:

54
IMPACT OF CLIMATE CHANGE ON WATER RESOURCES OF THE COASTAL WETLANDS IN LEBANON
6.4.1 Individual level
1. Awareness must be raised through different dissemination sources (e.g. workshops, awareness campaigns and media)
2. Ethics towards natural resources preservation, with special concern for water resources and the unique flora and fauna
3. Water management at the individual level must be adopted, such as wise use of water, mini-projects for water harvesting and following efficient irrigation systems.
6.4.2 Institutional level
1. Aspects of protection must be considered for the designated sites, including (but not limited to): building fences, water channels and water ponds.
2. Water supply management approaches to reduce the stresses on the existing groundwater sources
3. Adopting site guards for the wetlands and the surrounding regions
4. Controlling different aspects of human activities in and around the proximity of the wetland sites
5. Applying detailed studies on wetlands of the Lebanon, with special emphasis on groundwater regime assessment and climate change impact
6. Including wetland areas in water strategies at the national level
7. Re-empowering efforts to include Lebanon’s wetlands in global and regional projects and conventions.
6.4.3 Legal level
1. Establishing specified environmental and water legislation for the Lebanon’s wetlands, including the proximity regions
2. Activating proposed laws for hunting
3. Establishing water tariffs to mitigate the misuse of water resources.

REFERENCES
AECID/MOE/IUCN (2011). Supporting the Management of Im-portant Marine Habitats and Species in Lebanon. Survey of the Proposed Marine Protected Area at Chekka, Leba-non. Project draft.
Beydoun, Z. (1972). A new evaluation of the petroleum prospects of Lebanon with special reference to the Pre-Jurassic. 18th Arab Pet. Cong., Algeria, 80(B-3).
Beydoun, Z. (1988). The Middle East: Regional Geology and Petrole-um Resources. Scientific Press Ltd, London, pp. 296.
CAL (1971). Atlas Climatique du Liban Tome 1. Beirut, Lebanon: Service Météorologique, Ministère des Travaux Publics et Transports, pp. 45.
CAL (1973). Atlas Climatique du Liban Tome 1. Beirut, Lebanon: Service Météorologique, Ministère des Travaux Publics et Transports, pp. 31.
CAL (1980). Atlas Climatique du Liban Tome 2. Beirut, Lebanon: Service Météorologique, Ministère des Publics et Trans-ports, pp. 40.
Chaigneau, A., A. Gizolme, C. Grados (2008). Mesoscale eddies off Peru in altimeter records: identification algorithms and eddy spatio-temporal patterns. Progress in Oceanogra-phy, vol. 79, pp. 106-119.
CNRS (1999). TIR survey for freshwater sources in the marine en-vironment. Beirut, Lebanon: National Center for Remote Sensing, final report. LNCSR and NCRS, pp. 103.
CNRS (2005). Land cover map of Lebanon. Beirut, Lebanon: CNRS.
CORINE (1991). Biotopes Manual, Habitats of the European Com-munity. EUR 12587/3. Luxembourg: Office for Official Publications of the European Communities.
Cowardin, L. and others (1992). Classification of Wetlands and Deep Water Habitats of the United States. WS/OBS-79/31. Washington D.C.: Fish and Wildlife Service, Office of Bio-logical Services, US Department of the Interior, pp. 181.
DAG (1962). Untitled document. Beirut, Lebanon: Direction des Affaires Géographiques, Institution et Rattachement au Ministère de la Défense Nationale-Commandement de l’Armée Libanaise.
Darwich, T. and others (2006). Soil Map of Lebanon 1/50000. Mon-ograph Series 4. Beirut, Lebanon: CNRS-Lebanon, pp. 367.
DGAC (Direction Générale de l’Aviation Civile) (1999). Rapport An-nuel. Beyrouth, Liban: DGAC, pp. 32.
Dubertret, L. (1953). Carte Géologique de la Syrie et du Liban
au 1/50000me. 21 feuilles avec notices explicatrices. Bey-routh, Liban: Ministère des Travaux Publics, L’imprimerie Catholique, pp. 66.
EcoMed (Ecology and Mediation International) (2012). Green Belt Project Preliminary Biodiversity Assessment Report. Beirut, Lebanon: La Cimenterie Nationale SAL Chekka.
El-Khouri, T. (2012). Conservation Needs for Mediterranean Wet-lands (with a focus on the Aammiq Wetland). Stable In-stitutional Structure for Protected Areas Management. Beirut, Lebanon: Ministry of Environment.
Hassan, Z. (2015). Impacts of climate change on Lebanese wet-lands and their migratory soaring birds/legislative frame-work. Master’s dissertation. Lebanon: Lebanese Univer-sity, pp. 78.
ICARDA (2010). Food security and climate change in dry areas. Conference Proceedings. 1-4 February 2010. Amman, Jordan.
Jaradi, G.R. and Jaradi, M.R. (2012). Introduced, captive, caged and escaped exotic and native bird species in the littoral area of Lebanon. Lebanese Science Journal, vol. 13, No. 2, pp. 27-36.
LARI (Lebanese Agricultural Research Center) (2003). Climatic Data. Monthly bulletin. Beirut, Lebanon: LARI.
LRA (Litani River Authority) (1970-2012). Untitled documents. Un-published reports, LRA.
Ministry of Environment (2006). Aammiq Wetland Management Plan. MedWetCoast. Beirut, Lebanon: United Nations De-velopment Programme & Fonds Français pour l’Environ-nement Mondial.
MOE/UNDP/LU (Lebanese University) (2004). Biodiversity As-sessment and Monitoring in the Protected Areas/Lebanon Leb/95/G31 Tyre Beach Nature Reserve. Final Report. Beirut, Lebanon: MOE/UNDP/LU, pp. 144.
NOAA (2012). National Oceanographic Data Center. NOAA Cen-tral Library, http://docs.lib.noaa.gov/rescue/data_res-cue_lebanon.html#o48764368.
RAC/SPA-UNEP/MAP (2014). Ecological Characterization of Sites of Interest for Conservation in Lebanon: Enfeh Peninsula, Ras Chekaa Cliffs, Raoucheh, Saida, Tyre and Makoura. Ramos-Espla, A.A. and others, eds. Tunis, Tunisia: RAC/SPA-MedMPAnet Project, pp. 168 + annexes.
Sanlaville, P. (1977). Etude Géomorphologique de la Région Litto-rale du Liban. Tome I. Beyrouth, Liban: Section des études

géographiques, publications de l’Université Libanaise, pp. 405.
Shaban, A. (1985). Geology and Hydrogeology of the Nabatieh area. Master’s dissertation. American University of Beirut, pp. 78.
Shaban, A. (2010). Support of space techniques for groundwater exploration in Lebanon. Journal of Water Resource and Protection, vol. 2, pp. 469-477.
Shaban, A. (2011). Analyzing climatic and hydrologic trends in Lebanon. Journal of Environmental Science and Engineer-ing, vol. 5, No. 3, pp. 483-492.
Shaban, A. (2013). Geomorphological and geological aspects of wetlands in Lebanon. 3rd International Geography Symposium (Geo-Med 2013), June 10-13 2013. Antalya, Turkey.
Shaban, A. (2014). Physical and anthropogenic challenges of water resources in Lebanon. Journal of Scientific Research and Reports, vol. 3, No. 3, pp. 164-179.
SNCR (2011). Second National Communication to the UNFCCC. Climate Change Vulnerability and Adaptation. Beirut, Leb-anon: Ministry of Environment & GEF & UNDP, pp. 288.
UNDP (United Nations Development Programme) (1970). Liban: Etude des Eaux Souterraines. DP/SF/UN, 44. New York: Pro-gramme des Nations Unies pour le Développement, pp. 185.
UNEP (United Nations Environment Programme) (2011). Propos-al for Inclusion in the SPAMI List: Tyre Coast Nature Reserve. Mediterranean Action Plan. Beirut, Lebanon: Regional Ac-tivity Centre for Specially Protected Areas (RAC/SPA), pp. 51.
WRB (World Reference Base for Soil Resources) (2014). Interna-tional soil classification system for naming soils and cre-ating legends for soil maps. World Soil Resources Reports 106. Rome: FAO, pp. 181.
IMPACT OF CLIMATE CHANGE ON WATER RESOURCES OF
THE COASTAL WETLANDS IN LEBANON
In the frame of the GEF/UNEP-MAP Strategic Partner-ship for the Mediterranean Sea Large Marine Ecosys-tem, UNESCO-IHP executed a component on “Manage-ment of coastal aquifers and groundwater”, including an activity on “Implementation of eco-hydrogeology applications for management and protection of coast-al wetlands”. UNESCO-IHP cooperated with CNRS Leba-non to carry out a case study on two coastal wetlands in Lebanon, the results of which are documented in this report.
The results of this case study demonstrate the magni-tude of the impacts, in space and time, of altered wa-ter regimes in the selected coastal wetlands, resulting from human activities and climate change. The find-ings of this report are based on a diagnostic that evalu-ated historical weather and climate data, hydrological processes and water volumes, and species that were influenced by the environmental changes studied.
This report can serve as a tool to inform decision mak-ers about the current status of Lebanese wetlands and the challenges they face, in view of taking actions to ensure their preservation and to consider fully the role of sustainable water management approaches in these efforts.