Embed Size (px)
Citation preview

Mon. Not. R. Astron. Soc. 000, 1–14 (0000) Printed 23 March 2017 (MN LaTEX style file v2.2)
The clustering of galaxies in the completed SDSS-III BaryonOscillation Spectroscopic Survey: tomographic BAO analysis ofDR12 combined sample in configuration space
Yuting Wang1,2?, Gong-Bo Zhao1,2†, Chia-Hsun Chuang3,4, Ashley J. Ross5, WillJ. Percival2, Héctor Gil-Marín2, Antonio J. Cuesta6, Francisco-Shu Kitaura4, SergioRodriguez-Torres3,7,8, Joel R. Brownstein9, Daniel J. Eisenstein10, Shirley Ho11,12,13,Jean-Paul Kneib14, Matthew D. Olmstead15, Francisco Prada7, Graziano Rossi16, ArielG. Sánchez17, Salvador Salazar-Albornoz18,17, Daniel Thomas2, Jeremy Tinker19, RitaTojeiro20, Mariana Vargas-Magaña21, Fangzhou Zhu22
1 National Astronomy Observatories, Chinese Academy of Science, Beijing, 100012, P. R. China2 Institute of Cosmology & Gravitation, University of Portsmouth, Dennis Sciama Building, Portsmouth, PO1 3FX, UK3 Instituto de Física Teórica, (UAM/CSIC), Universidad Autónoma de Madrid, Cantoblanco, E-28049 Madrid, Spain4 Leibniz-Institut für Astrophysik Potsdam (AIP), An der Sternwarte 16, 14482 Potsdam, Germany5 Center for Cosmology and AstroParticle Physics, The Ohio State University, Columbus, OH 43210, USA6 Institut de Ciències del Cosmos (ICCUB), Universitat de Barcelona (IEEC- UB), Martí i Franquès 1, E-08028 Barcelona, Spain7 Campus of International Excellence UAM+CSIC, Cantoblanco, E-28049 Madrid, Spain8 Departamento de Física Teórica, Universidad Autónoma de Madrid, Cantoblanco, E-28049, Madrid, Spain9 Department of Physics and Astronomy, University of Utah, 115 S 1400 E, Salt Lake City, UT 84112, USA10 Harvard-Smithsonian Center for Astrophysics, 60 Garden St., Cambridge, MA 02138, USA11 McWilliams Center for Cosmology, Department of Physics, Carnegie Mellon University, 5000 Forbes Ave., Pittsburgh, PA 1521312 Lawrence Berkeley National Laboratory, 1 Cyclotron Rd, Berkeley, CA 9472013 Department of Physics, University of California, Berkeley, CA 9472014 Laboratoire d’Astrophysique, Ecole Polytechnique Fédérale de Lausanne (EPFL), Observatoire de Sauverny, CH-1290 Versoix, Switzerland15 Department of Chemistry and Physics, King’s College, 133 North River St, Wilkes Barre, PA 18711, USA16 Department of Astronomy and Space Science, Sejong University, Seoul 143-747, Korea17 Max-Planck-Institut für extraterrestrische Physik, Postfach 1312, Giessenbachstr., 85741 Garching, Germany18 Universität Sternwarte Muänchen, Ludwig Maximilian Universität, Munich, Germany19 Center for Cosmology and Particle Physics, Department of Physics, New York University, 4 Washington Place, New York, NY 10003, USA20 School of Physics and Astronomy, University of St Andrews, North Haugh, St Andrews KY16 9SS, UK21 Instituto de Fisica, Universidad Nacional Autonoma de Mexico, Apdo. Postal 20-364, Mexico22 Department of Physics, Yale University, New Haven, CT 06511, USA
23 March 2017
c© 0000 RAS
arX
iv:1
607.
0315
4v2
[as
tro-
ph.C
O]
22
Mar
201
7

2 Wang et al.
ABSTRACT
We perform a tomographic baryon acoustic oscillations analysis using the two-pointgalaxy correlation function measured from the combined sample of BOSS DR12, which cov-ers the redshift range of 0.2 < z < 0.75. Splitting the sample into multiple overlapping red-shift slices to extract the redshift information of galaxy clustering, we obtain a measurementof DA(z)/rd and H(z)rd at nine effective redshifts with the full covariance matrix calibratedusing MultiDark-Patchy mock catalogues. Using the reconstructed galaxy catalogues, we ob-tain the precision of 1.3% − 2.2% for DA(z)/rd and 2.1% − 6.0% for H(z)rd. To quantifythe gain from the tomographic information, we compare the constraints on the cosmologicalparameters using our 9-bin BAO measurements, the consensus 3-bin BAO and RSD measure-ments at three effective redshifts in Alam et al. (2016), and the non-tomographic (1-bin) BAOmeasurement at a single effective redshift. Comparing the 9-bin with 1-bin constraint result,it can improve the dark energy Figure of Merit by a factor of 1.24 for the Chevallier-Polarski-Linder parametrisation for equation of state parameter wDE. The errors of w0 and wa from9-bin constraints are slightly improved when compared to the 3-bin constraint result.
Key words:baryon acoustic oscillations, distance scale, dark energy
1 INTRODUCTION
The accelerating expansion of the Universe was discovered by theobservation of type Ia supernovae (Riess et al. 1998; Perlmutteret al. 1999). Understanding the physics of the cosmic accelerationis one of the major challenges in cosmology. In the framework ofgeneral relatively (GR), a new energy component with a negativepressure, dubbed dark energy (DE), can be the source driving thecosmic acceleration. Observations reveal that the DE componentdominates the current Universe (Weinberg et al. 2013). However,the nature of DE remains unknown. Large cosmological surveys,especially for galaxy redshift surveys, can provide key observa-tional support for the study of DE.
Galaxy redshift surveys are used to map the large scale struc-ture of the Universe, and extract the signal of baryon acoustic os-cillation (BAO). The BAO, produced by the competition betweengravity and radiation due to the couplings between baryons andphotons before the cosmic recombination, leave an imprint on thedistribution of galaxies at late times. After the photons decouple,the acoustic oscillations are frozen and correspond to a charac-teristic scale, determined by the comoving sound horizon at thedrag epoch, rd ∼ 150 Mpc. This feature corresponds to an ex-cess on the 2-point correlation function, or a series of wiggleson the power spectrum. The acoustic scale is regarded as a stan-dard ruler to measure the cosmic expansion history, and to con-strain cosmological parameters (Eisenstein et al. 2005). If assum-ing an isotropic galaxies clustering, the combined volume distance,DV (z) ≡
[cz(1 + z)2DA(z)2H−1(z)
]1/3, where H(z) is theHubble parameter and DA(z) is the angular diameter distance, canbe measured using the angle-averaged 2-point correlation function,ξ0(s) (Eisenstein et al. 2005; Kazin et al. 2010; Beutler et al. 2011;Blake et al. 2011) or power spectrum P0(k) (Tegmark et al. 2006;Percival et al. 2007; Reid et al. 2010). However, in principle theclustering of galaxies is anisotropic, the BAO scale can be mea-sured in the radial and transverse directions to provide the Hubbleparameter, H(z), and angular diameter distance, DA(z), respec-
? Email: [email protected]† Email: [email protected]
tively. As proposed by Padmanabhan & White 2008, the “multi-pole” projection of the full 2D measurement of power spectrum,P`(k), were used to break the degeneracy of H(z) and DA(z).This multipole method was applied into the correlation function(Chuang & Wang 2012, 2013; Xu et al. 2013). Alternative “wedge”projection of correlation function, ξ∆µ(s), was used to constrainparameters, H(z) and DA(z) (Kazin et al. 2012, 2013). In An-derson et al. (2014), the anisotropic BAO analysis was performedusing these two projections of correlation function from SDSS-IIIBaryon Oscillation Spectroscopic Survey (BOSS) DR10 and DR11samples.
The BOSS (Dawson et al. 2013), which is part of SDSS-III(Eisenstein et al. 2011), has provided the Data Release 12 (Alamet al. 2015). With a redshift cut, the whole samples are split intothe ‘low-redshift’ samples (LOWZ) in the redshift range 0.15 <z < 0.43 and ‘constant stellar mass’ samples (CMASS) in the red-shift range 0.43 < z < 0.7. Using these catalogues, the BAOpeak position was measured at two effective redshifts, zeff = 0.32and zeff = 0.57, in the multipoles of correlation function (Cuestaet al. 2016) or power spectrum (Gil-Marín et al. 2016). Chuanget al. 2016 proposed to divide each sample of LOWZ and CMASSinto two independent redshift bins, thus to test the extraction ofredshift information from galaxy clustering. They performed themeasurements on BAO and growth rate at four effective redshifts,zeff = 0.24, 0.37, 0.49 and 0.64 (Chuang et al. 2016).
The completed data release of BOSS will provide a combinedsample, covering the redshift range from 0.2 to 0.75. The sample isdivided into three redshift bins, i.e., two independent redshift bins,0.2 < z < 0.5 and 0.5 < z < 0.75, and an overlapping redshiftbin, 0.4 < z < 0.6. The BAO signal is measured at the three effec-tive redshifts, zeff = 0.38, 0.51 and 0.61 using the configuration-space correlation function (Ross et al. 2016; Vargas-Magaña et al.2016) or Fourier-space power spectrum (Beutler et al. 2016a).
As the tomographic information of galaxy clustering is impor-tant to constrain the property of DE (Salazar-Albornoz et al. 2014;Zhao et al. 2017), we will extract the information of redshift evolu-tion from the combined catalogue as much as possible. To achievethis, we adopt the binning method. The binning scheme is deter-mined through the forecasting result using Fisher matrix method.
c© 0000 RAS, MNRAS 000, 1–14

Tomographic BAO analysis of BOSS DR12 sample 3
We split the whole sample into nine overlapping redshift bins tomake sure that the measurement precision of the isotropic BAOsignal is better than 3% in each bin. We perform the measurementson the an/isotropic BAO positions in the nine overlapping binsusing the correlation functions of the pre- and post-reconstructioncatalogues. To test the constraining power of our tomographic BAOmeasurements, we perform the fitting of cosmological parameters.
The analysis is part of a series of papers analysing the clus-tering of the completed BOSS DR12 (Alam et al. 2016; Zhaoet al. 2016; Beutler et al. 2016a,b; Ross et al. 2016; Sanchez et al.2016b,a; Salazar-Albornoz et al. 2016a; Vargas-Magaña et al. 2016;Grieb et al. 2016; Chuang et al. 2016; Salazar-Albornoz et al.2016b). The same tomographic BAO analysis is performed usinggalaxy power spectrum in Fourier space (Zhao et al. 2016). An-other tomographic analysis is performed using the angular cor-relation function in many thin redshift shells and their angularcross-correlations in the companion paper, Salazar-Albornoz et al.(2016a), to extract the time evolution of the clustering signal.
In Section 2, we introduce the data and mocks used in thispaper. We present the forecast result in Section 3. In Section 4,we describe the methodology to measure the BAO signal usingmultipoles of correlation function. In Section 5, we constrain cos-mological models using the BAO measurement from the post-reconstructed catalogues. Section 6 is devoted to the conclusion.In this paper, we use a fiducial ΛCDM cosmology with the pa-rameters: Ωm = 0.307,Ωbh
2 = 0.022, h = 0.6777, ns =0.96, σ8 = 0.8288. The comoving sound horizon in this cosmol-ogy is rfid
d = 147.74 Mpc.
2 DATA AND MOCKS
We use the completed catalogue of BOSS DR12, which covers theredshift range from 0.2 to 0.75. In the North Galactic Cap (NGC),864, 923 galaxies over the effective coverage area of 5923.90 deg2
are observed and the South Galactic Cap (SGC) contains 333, 081with the effective coverage area of 2517.65 deg2. The volume den-sity distribution from observation is shown in solid curves of Figure1.
In oder to correct for observational effects, the catalogue isgiven a set of weights, including weights for the redshift failure,wzf , close pair due to fiber collisions, wcp and for systematics,wsys. In addition, the FKP weight to achieve a balance betweenthe regions of high density and low density (Feldman et al. 1994)is added
wFKP =1
1 + n(z)P0, (1)
where n(z) is the number density of galaxies, and P0 is set to10, 000h−3Mpc3. Thus each galaxy is counted by adding a totalweight as below
wtot = wFKPwsys(wcp + wzf − 1). (2)
The details about the observational systematic weights are de-scribed in Ross et al. (2016).
The correlation function is measured by comparing the galaxydistribution to a randomly distributed catalogue, which is recon-structed with the same radial selection function as the real cata-logue, but without clustering structure. We use a random catalogueconsisting of 50 times random galaxies of the observed sample.
During the cosmic evolution, non-linear structure formationand redshift space distortions (RSD) can weaken the significance
of the BAO peak thus degrade the precision of BAO measurements.The BAO signal can be boosted to some extent by the reconstruc-tion procedure, which effectively moves the galaxies to the posi-tions as if there was no RSD and nonlinear effects (Eisenstein et al.2007a). We will also present BAO measurements using the cata-logue, which is reconstructed through the reconstruction algorithmas described in Padmanabhan et al. (2012).
Mock galaxy catalogues are required to determine the datacovariance matrix, and to test the methodology. We use theMultiDark-Patchy mock catalogues (Kitaura et al. 2016). The mockcatalogues are constructed to match the observed data on the an-gular selection function, redshift distribution, and clustering statis-tics (e.g. 2-point and 3-point correlation functions). We utilise 2045mock catalogues for the pre-reconstruction, and 1000 mocks for thepost-reconstruction. We perform the measurement for each mockcatalogue, then estimate the covariance matrix of data correlationfunction using the method proposed in Percival et al. (2014).
3 BAO FORECASTS
We first determine the binning scheme through the Fisher matrixmethod. We use the Fisher matrix formulism in (Tegmark 1997;Seo & Eisenstein 2007) to predict the BAO distance parameters.Starting with the galaxy power spectrum, P (k, µ), the fisher matrixis
Fij =
∫ 1
−1
∫ kmax
kmin
∂ lnP (k, µ)
∂pi
∂ lnP (k, µ)
∂pjVeff(k, µ)
k2dkdµ
8π2, (3)
here we set kmin = 2π/V1/3sur hMpc−1 and kmax = 0.3hMpc−1.
In order to ensure that the isotropic BAO measurement pre-cision in each bin is better than 3%, we split the whole redshiftrange, i.e. [0.2, 0.75] into 9 overlapping bins. The width of thefirst and last bins is 0.19, and other bins have the same bin width,i.e. ∆z = 0.15.
In Table 1, we present the 9 overlapping redshift ranges, the ef-fective redshifts and numbers of the samples in the NGC and SGC.In Figure 1, the overlapping histograms denote the average numberdensity in each bin.
Combining the results of NGC and SGC samples as,
FNGC+SGCij = FNGC
ij + F SGCij , (4)
we present the forecast result on the precision of the BAO dis-tance parameters, including the angular diameter distance DA(z),Hubble parameter H(z) and volume distance DV (z) in Table 2.It is seen that the isotropic BAO prediction in each bin can reach,σDV /DV < 3%. With the “50%” reconstructed efficiency, whichmeans that the nonlinear damping scales, Σ⊥ and Σ‖, are reducedby a factor 0.5 and there is the remaining 50% nonlinearity, theisotropic BAO precision is within 0.8%− 1.2%.
The predictions on the precision of anisotropic BAO parame-ters are within 1.8%− 2.9% for the angular diameter distance and4.2% − 7.1% for the Hubble parameter without the reconstruc-tion. Considering the “50%” reconstruction, the best prediction canreach 1.1% for DA(z) and 2.1% for H(z). The contour plot ofDA(z) and H(z) within 2σ error is displayed in Figure 2, wherethe black points are the fiducial values. The left panel in Figure 2shows the forecast result without reconstruction, and the right panelpresents the “50%” reconstructed result.
c© 0000 RAS, MNRAS 000, 1–14

4 Wang et al.
z bins zeff NGC SGC
0.20 < z < 0.39 0.31 208517 892420.28 < z < 0.43 0.36 194754 815390.32 < z < 0.47 0.40 230388 938250.36 < z < 0.51 0.44 294749 1150290.40 < z < 0.55 0.48 370429 1361170.44 < z < 0.59 0.52 423716 1544860.48 < z < 0.63 0.56 410324 1493640.52 < z < 0.67 0.59 331067 1211450.56 < z < 0.75 0.64 243763 91170
Table 1. The 9 overlapping redshift bins, the effective redshift and the num-ber of samples in each bin.
0.2 0.3 0.4 0.5 0.6 0.70.0000
0.0001
0.0002
0.0003
0.0004
0.0005
n(z)
[h3 /M
pc3 ]
redshift z
NGC
0.2 0.3 0.4 0.5 0.6 0.7
SGC
redshift z
Figure 1. The overlapping histograms in different colours are the averagenumber densities in 9 redshift bins, which is used to do the forecasts. Thesolid lines are the number densities for the NGC/SGC samples.
4 BAO MEASUREMENTS
4.1 The estimator for the 2-pt correlation function
We measure the correlation function of the combined sample usingthe Landy & Szalay (1993) estimator:
ξ(s, µ) =DD(s, µ)− 2DR(s, µ) +RR(s, µ)
RR(s, µ), (5)
where DD, DR and RR are the weighted data-data pair counts, data-random pair counts and random-random pair counts with the sepa-ration, s and the cosine of the angle of the pair to the line of sight,µ.
Table 2. The forecast results on the BAO distance parameters without re-construction (and “50%” reconstruction) using the combination of NGC andSGC samples.
zeff σDA/DA σH/H σDV
/DV
0.31 0.0289 (159) 0.0705 (309) 0.0236 (114)0.36 0.0281 (159) 0.0681 (307) 0.0229 (113)0.40 0.0254 (145) 0.0616 (281) 0.0207 (104)0.44 0.0226 (130) 0.0553 (253) 0.0185 (093)0.48 0.0203 (118) 0.0502 (230) 0.0167 (085)0.52 0.0188 (110) 0.0464 (214) 0.0155 (079)0.56 0.0180 (108) 0.0441 (208) 0.0147 (077)0.59 0.0183 (113) 0.0436 (214) 0.0147 (080)0.64 0.0187 (122) 0.0418 (222) 0.0144 (085)
H
(z) [
km/s
Mpc
-1]
Pre-recon
"50%" recon
DA(z)[Mpc]
Figure 2. The 68 and 95% CL contour plots of the transverse and radial dis-tance parameters,DA(z) andH(z), in 9 redshift bins are shown one by onefrom left to right. The left panel shows the result without the reconstruction,and the right panel is the result with “50%” reconstructed efficiency.
The multipole projections of the correlation function can becalculated through
ξl(s) =2l + 1
2
∫ 1
−1
dµ ξ(s, µ)L`(µ), (6)
where L`(µ) is the Legendre Polynomial.We also measure the correlation function of the reconstructed
catalogue using the Landy & Szalay (1993) estimator:
ξ(s, µ) =DD(s, µ)− 2DS(s, µ) + SS(s, µ)
RR(s, µ), (7)
here we used the shifted data and randoms for DD, DS, and SS.The measured monopole and quadruple of correlation func-
tion from data and mocks in each redshift bin are shown in Fig-ure 3 for the pre-reconstruction measurements, and in Figure 4 forthe post-reconstruction measurements, where the red squares with1σ error bar are the measurements of monopole from data. Thered shaded regions correspond to the standard deviation from themocks around the average. The blue points with 1σ error bar arethe data measurements of quadrupole, and the blue shaded regionsdenote the average with a standard deviation from the mocks.
The 2D correlation functions measured in 9 redshift bins usingthe pre-reconstructed and post-reconstructed catalogues are plottedin Figure 5, where the BAO ring in each redshift slice is visualised.As expected, the BAO ring becomes clear after reconstruction.
4.2 The template
The isotropic BAO position is parameterised by the scale dilationparameter,
α ≡ DV (z)rd,fid
DfidV (z)rd
. (8)
We adopt the template for the correlation function in theisotropic case (Eisenstein et al. 2007b),
ξmod(s) =
∫k2dk
2π2Pmod
dw (k)F (k,Σs)j0(ks) , (9)
c© 0000 RAS, MNRAS 000, 1–14

Tomographic BAO analysis of BOSS DR12 sample 5
- 1 0 0- 5 0
05 0
1 0 0 0 . 2 < z < 0 . 3 9
0 . 2 8 < z < 0 . 4 3
0 . 3 2 < z < 0 . 4 7
- 1 0 0- 5 0
05 0
1 0 0 0 . 3 6 < z < 0 . 5 1
0 . 4 0 < z < 0 . 5 5
0 . 4 4 < z < 0 . 5 9
5 0 1 0 0 1 5 0- 1 0 0- 5 0
05 0
1 0 0 0 . 4 8 < z < 0 . 6 3
5 0 1 0 0 1 5 0
0 . 5 2 < z < 0 . 6 7
5 0 1 0 0 1 5 0
0 . 5 6 < z < 0 . 7 5
s2 ξ 0(2)[h
-2 Mpc2 ]
s [ h - 1 M p c ]
Figure 3. The measured monopole and quadrupole of correlation functionusing the pre-reconstructed catalogue in each redshift bin: in each panel thered square with 1σ error bar is the measured monopole and the red shadedband is the average of monopoles from mocks with a standard deviation.The blue point with 1σ error bar is the measured quadrupole and the blueshaded band is the average of quadruples from mocks with a standard devi-ation. The solid lines show the fitting results.
- 1 0 0- 5 0
05 0
1 0 0 0 . 2 < z < 0 . 3 9
0 . 2 8 < z < 0 . 4 3
0 . 3 2 < z < 0 . 4 7
- 1 0 0- 5 0
05 0
1 0 0 0 . 3 6 < z < 0 . 5 1
0 . 4 0 < z < 0 . 5 5
0 . 4 4 < z < 0 . 5 9
5 0 1 0 0 1 5 0- 1 0 0- 5 0
05 0
1 0 0 0 . 4 8 < z < 0 . 6 3
5 0 1 0 0 1 5 0
0 . 5 2 < z < 0 . 6 7
5 0 1 0 0 1 5 0
0 . 5 6 < z < 0 . 7 5
s2 ξ 0(2)[h
-2 Mpc2 ]
s [ h - 1 M p c ]
Figure 4. The measured monopole and quadrupole of correlation functionusing the post-reconstructed catalogue in each redshift bin: in each panelthe red square with 1σ error bar is the measured monopole and the redshaded band is the average of monopoles from mocks with a standard devi-ation. The blue point with 1σ error bar is the measured quadrupole and theblue shaded band is the average of quadruples from mocks with a standarddeviation. The solid lines show the fitting results.
where the damping term is given by
F (k,Σs) =1
(1 + k2Σ2s/2)2
. (10)
Here we set the parameter Σs = 4h−1 Mpc, which is the sameas used in (Ross et al. 2016). The de-wiggled power spectrum,Pmod
dw (k), is given by
Pmoddw (k) = P nw(k) +
[P lin(k)− P nw(k)
]e−
12k2Σ2
nl , (11)
where P nw(k) is the “no-wiggle” power spectrum, where the BAOfeature is erased, which is obtained using the fitting formulae inEisenstein & Hu (1998). The linear power spectrum P lin(k) is cal-
culated by CAMB1 (Lewis et al. 2000). Σnl in the Gaussian termis a damping parameter.
Then, allowing an unknown bias factorBξ, which rescales theamplitude of the input template, the correlation function is given by
ξfit(s) = B2ξξ
mod(αs) +Aξ(s) , (12)
which includes the polynomial terms for systematics
Aξ(s) =a1
s2+a2
s+ a3 . (13)
Before doing the fitting, we normalise the model to the data atthe scale s = 50h−1 Mpc, as done in Xu et al. (2013); Ander-son et al. (2014) . While performing the fitting, we add a Gaus-sian prior on log(B2
ξ) = 0 ± 0.4 (Xu et al. 2013; Anderson et al.2014). So in the isotropic case, we have 5 free parameter, i.e.[log(B2
ξ ), α, a1, a2, a3].The BAO feature can be measured in both the transverse and
line-of-sight directions. This can be parametrised by α⊥ and α||,respectively
α⊥ =DA(z)rfid
d
DfidA (z)rd
, α‖ =Hfid(z)rfid
d
H(z)rd. (14)
The anisotropic correlation function is modelled as a trans-form of the 2D power spectrum,
P (k, µ) = (1 + βµ2)2F (k, µ,Σs)Pdw(k, µ), (15)
where the (1 + βµ2)2 term corresponds to the Kaiser model forlarge-scale RSD (Kaiser 1987). For the reconstruction, this term isreplaced by [1 + βµ2(1 − S(k))]2 with the smoothing, S(k) =
e−k2Σ2
r/2 and Σr = 15h−1 Mpc (Seo et al. 2015). The term
F (k, µ,Σs) =1
(1 + k2µ2Σ2s/2)2
(16)
is introduced to model the small-scale FoG effect. The 2D de-wiggled power spectrum, compared to Eq. 11, becomes
Pdw(k, µ) = [Plin(k)− Pnw(k)]
· exp
[−k2µ2Σ2
‖ + k2(1− µ2)Σ2⊥
2
]+ Pnw(k),
(17)
here the Gaussian damping term is also anisotropic. Σ‖ and Σ⊥are the line-of-sight and transverse components of Σnl, i.e. Σ2
nl =(Σ2‖ + 2Σ2
⊥)/3. Here we set Σ‖ = 4h−1 Mpc and Σ⊥ =
2.5h−1 Mpc for the post-reconstruction and Σ‖ = 10h−1 Mpcand Σ⊥ = 6h−1 Mpc for the pre-reconstruction (Ross et al. 2016).
Given the 2D power spectrum P (k, µ), which can be decom-posed into Legendre moments, then the multipoles of power spec-trum are
P`(k) =2`+ 1
2
∫ 1
−1
P (k, µ)L`(µ)dµ, (18)
which can be transformed to the multipoles of correlation functionby
ξ`(s) =i`
2π2
∫k2P`(k)j`(ks)dk. (19)
Using the Legendre polynomials, we have
ξ(s, µ) =∑`
ξ`(s)L`(µ). (20)
1 http://camb.info
c© 0000 RAS, MNRAS 000, 1–14

6 Wang et al.
-150
-100
-50
0
50
100
150
-100
-80
-60
-40
-20
0.0
20
40
60
80
100
-150
-100
-50
0
50
100
150
s || [h-1
Mpc
]
corre
latio
n fu
nctio
n s2
-150 -100 -50 0 50 100 150-150
-100
-50
0
50
100
150
-150 -100 -50 0 50 100 150
s [h-1Mpc]
-150 -100 -50 0 50 100 150
- 1 5 0- 1 0 0- 5 0
05 0
1 0 01 5 0
- 1 0 0
- 8 0
- 6 0
- 4 0
- 2 0
0 . 0
2 0
4 0
6 0
8 0
1 0 0
- 1 5 0- 1 0 0- 5 0
05 0
1 0 01 5 0
s || [h-1 Mp
c]
correl
ation f
unctio
n s2 ξ
- 1 5 0 - 1 0 0 - 5 0 0 5 0 1 0 0 1 5 0- 1 5 0- 1 0 0- 5 0
05 0
1 0 01 5 0
- 1 5 0 - 1 0 0 - 5 0 0 5 0 1 0 0 1 5 0
s ⊥ [ h - 1 M p c ]
- 1 5 0 - 1 0 0 - 5 0 0 5 0 1 0 0 1 5 0
Figure 5. The 2D pre-reconstruction correlation functions (left panel) and post-reconstruction correlation functions (right panel) in 9 redshift bins, which isassembled using the measured monopole and quadruple from the NGC and SGC samples, i.e. ξ(s, µ) = ξ0(s)L0(µ) + ξ2(s)L2(µ), here s‖ = sµ and
s⊥ = s√
1− µ2.
Then the model multipoles of correlation function are
ξ`(s, α⊥, α‖) =2`+ 1
2
∫ 1
−1
ξ(s′, µ′)L`(µ)dµ, (21)
where s′ = s√µ2α2
‖ + (1− µ2)α2⊥ and µ′ =
µα‖/√µ2α2
‖ + (1− µ2)α2⊥ are respectively the separation
between two galaxies and the cosine of the angle of the pair to theline of sight in the true cosmology, .
In addition, we use a bias parameterB0 to adjust the amplitudeof the input template and include the model for systematics usingthe polynomial terms
A`(s) =a`,1s2
+a`,2s
+ a`,3. (22)
So we fit the data using the model multipoles
ξmod0 (s) = B0ξ0(s, α⊥, α‖) +A0(s), (23)
ξmod2 (s) = ξ2(s, α⊥, α‖) +A2(s). (24)
As in the isotropic case, the monopole template is normalised tothe measurement at s = 50h−1 Mpc. So in the anisotropic case,we have 10 free parameter, i.e. [α⊥, α||, log(B2
0), β, a`,1−3]. Whileperforming the fitting, a Gaussian prior on log(B2
0) = 0 ± 0.4 isapplied. We also add a Gaussian prior for the RSD parameter, i.e.β = 0.4± 0.2 (Anderson et al. 2014).
4.3 Covariance matrix
When fitting the BAO parameters, p, we use the MCMC to searchfor the minimum χ2,
χ2(p) ≡`,`′∑i,j
[ξth` (si,p)− ξ`(si)
]F `,`
′
ij
[ξth`′ (sj ,p)− ξ`′(sj)
].
where F `,`′
ij is the inverse of the covariance matrix, C`,`′
ij , which isestimated using mock catalogues,
C`,`′
ij =1
N − 1
∑k
[ξk` (si)− ξ`(si)
] [ξk`′(sj)− ξ`′(sj)
], (25)
where the average multipoles is given by
ξ`(si) =1
N
∑k
ξk` (si), (26)
here N is the number of mocks: N = 2045 in the pre-reconstruction case and N = 1000 in the post-reconstruction case.The unbiased estimation for the inverse covariance matrix is givenby
C−1ij =
N −Nb − 2
N − 1C−1ij . (27)
where Nb is the number of the scale bins. In order to include theerror propagation from the error in the covariance matrix into thefitting parameters (Percival et al. 2014) we rescale the covariancematrix, Cij , by
M =
√1 +B(Nb −Np)
1 +A+B(Np + 1)(28)
here Np is the number of the fitting parameters, and
A =2
(N −Nb − 1)(N −Nb − 4), (29)
B =N −Nb − 2
(N −Nb − 1)(N −Nb − 4). (30)
The normalised covariance matrix showing the correlationsbetween monopole, quadrupole and their cross correlation in eachbin is plotted in Figure 6 in the pre-reconstruction case and Fig-ure 7 in the post-reconstruction case. From Figure 6 and Figure 7,it is seen that after reconstruction, there is less auto-correlation ofmultipoles and cross-correlation between multipoles.
5 TESTS ON MOCK CATALOGUES
We present the mock tests for the BAO analysis using 1000pre-reconstructed and post-reconstructed mocks. We perform theisotropic and anisotropic BAO measurements using each individ-ual mock catalogue in both cases. The results are shown in Table 3,where we list the average of fitting value from each mock, standardderivations, and the average of 1σ error for the parameters, α, α⊥
c© 0000 RAS, MNRAS 000, 1–14

Tomographic BAO analysis of BOSS DR12 sample 7
10
20
30
40
0.2<z<0.39
C2C2 C0
C0
0.28<z<0.43
0.32<z<0.47
10
20
30
40
0.36<z<0.51
0.40<z<0.55
0.44<z<0.59
10 20 30 40
10
20
30
40
0.48<z<0.63
10 20 30 40 0.52<z<0.67
10 20 30 40 0.56<z<0.75
-1.0
-0.75
-0.50
-0.25
0.0
0.25
0.50
0.75
1.0
Figure 6. The correlations between monopole, C0, quadrupole, C2 andtheir cross correlation, C0 × C2 for the pre-reconstruction.
1 0
2 0
3 0
4 0
0 . 2 < z < 0 . 3 9
C 2C 2 × C 0
C 0
0 . 2 8 < z < 0 . 4 3
0 . 3 2 < z < 0 . 4 7
1 0
2 0
3 0
4 0
0 . 3 6 < z < 0 . 5 1
0 . 4 0 < z < 0 . 5 5
0 . 4 4 < z < 0 . 5 9
1 0 2 0 3 0 4 0
1 0
2 0
3 0
4 0
0 . 4 8 < z < 0 . 6 3
1 0 2 0 3 0 4 0 0 . 5 2 < z < 0 . 6 7
1 0 2 0 3 0 4 0 0 . 5 6 < z < 0 . 7 5
- 1 . 0
- 0 . 7 5
- 0 . 5 0
- 0 . 2 5
0 . 0
0 . 2 5
0 . 5 0
0 . 7 5
1 . 0
Figure 7. The correlations between monopole, C0, quadrupole, C2 andtheir cross correlation, C0 × C2 for the post-reconstruction.
and α‖. The fiducial cosmology we use here corresponds to the in-put cosmology of the mocks, therefore we expect that the averagevalues of parameters α, α⊥ and α‖ are equal to 1.
Our recovered parameter values in nine redshift bins are wellconsistent with the input cosmology. For the isotropic results, wefind that the greatest bias in α for the pre-reconstruction result isless than 0.4%, and is less than 0.2% in the post-reconstructioncase. The 1D distribution of the parameter α from mocks is shownin the histograms of Figure 8, where the blue histograms are thepre-reconstruction results, and the red histograms are the post-reconstruction results. As expected, the BAO signals measuredfrom the post-reconstructed mocks are more significant, as shownin the scatter plots of Figure 9, where each point in the plot corre-sponds to the 1σ error value from each pre- and post-reconstructedmock. For the anisotropic results, on average the biases in theanisotropic parameters are less than 0.5%. We display the 1D distri-butions of the parameters,α⊥ andα‖ from mocks in the histograms
0 . 0
0 . 5
1 . 0 0 . 2 < z < 0 . 3 9
0 . 2 8 < z < 0 . 4 3
0 . 3 2 < z < 0 . 4 7
0 . 0
0 . 5
1 . 0 0 . 3 6 < z < 0 . 5 1
0 . 4 0 < z < 0 . 5 5
0 . 4 4 < z < 0 . 5 9
0 . 9 1 . 0 1 . 10 . 0
0 . 5
1 . 0 0 . 4 8 < z < 0 . 6 3
0 . 9 1 . 0 1 . 1
0 . 5 2 < z < 0 . 6 7
0 . 9 1 . 0 1 . 1
0 . 5 6 < z < 0 . 7 5
α
Figure 8. The 1D distribution of the parameterα from the pre-reconstructedmock catalogue (blue histograms), galaxy catalogue (blue curves) and fromthe post-reconstructed mock catalogue (red histograms), galaxy catalogue(red curves).
0 . 0 0
0 . 0 5
0 . 1 0
0 . 0 0
0 . 0 5
0 . 1 0
0 . 0 0 0 . 0 5 0 . 1 00 . 0 0
0 . 0 5
0 . 1 0
0 . 0 0 0 . 0 5 0 . 1 0 0 . 0 0 0 . 0 5 0 . 1 0
0 . 2 < z < 0 . 3 9
0 . 2 8 < z < 0 . 4 3
0 . 3 2 < z < 0 . 4 7
0 . 3 6 < z < 0 . 5 1
post-re
constru
ction σ
α
0 . 4 0 < z < 0 . 5 5
0 . 4 4 < z < 0 . 5 9
0 . 4 8 < z < 0 . 6 3
0 . 5 2 < z < 0 . 6 7
p r e - r e c o n s t r u c t i o n σα
0 . 5 6 < z < 0 . 7 5
Figure 9. The scatter plot of error of α using pre- and post reconstructionmock catalogue. Each magenta point denotes the 1σ error of α from eachmock (totally 1000 mocks) and the cross (blue) is the error measured bydata.
of Figure 10. The scatter plots for the parameters, α⊥ and α‖ areshown in Figure 11.
6 RESULTS
6.1 Isotropic BAO measurements
The correlation functions are measured with the bin width of 5h−1 Mpc bins, as shown in Figure 3 and Figure 4. We performthe fitting in the range 50− 150h−1 Mpc.
We present the constraints on the isotropic BAO scale in allredshift bins in Table 4. Using the values of Dfid
V (z)/rfidd for the
fiducial cosmology, we derive the constraint on DV (z)/rd, aslisted in the last two columns of Table 4. The measurement preci-
c© 0000 RAS, MNRAS 000, 1–14
8 Wang et al.
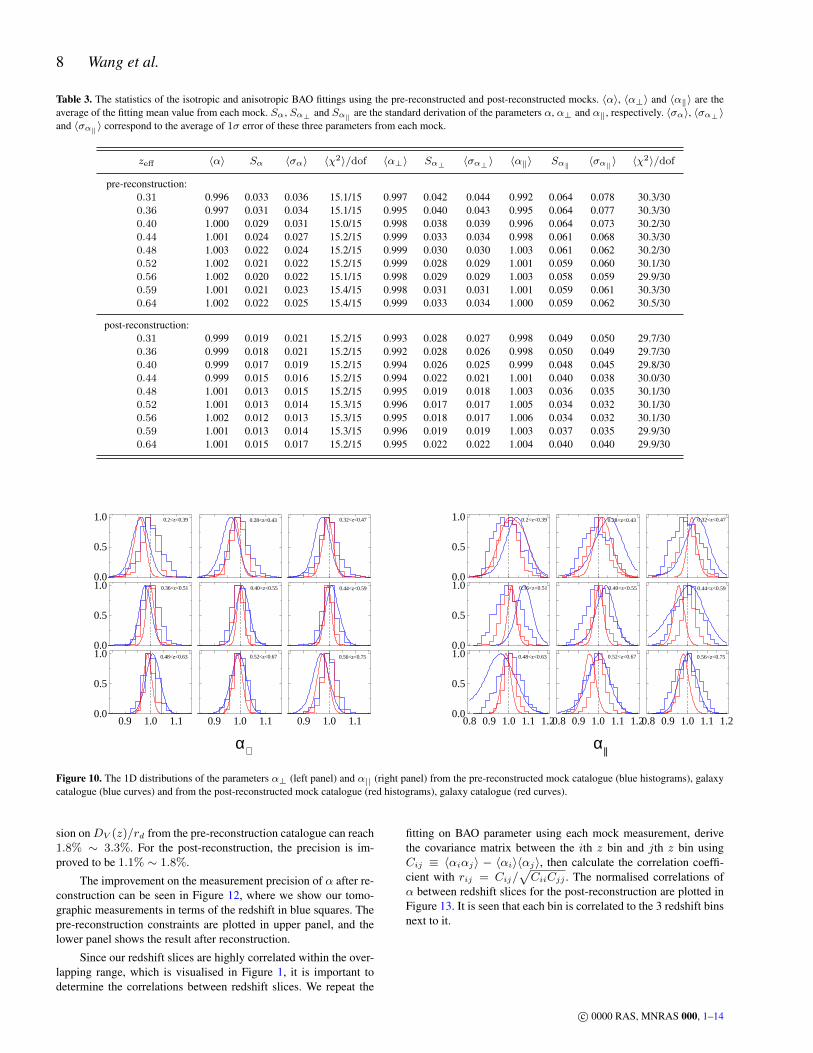
Table 3. The statistics of the isotropic and anisotropic BAO fittings using the pre-reconstructed and post-reconstructed mocks. 〈α〉, 〈α⊥〉 and 〈α‖〉 are theaverage of the fitting mean value from each mock. Sα, Sα⊥ and Sα‖ are the standard derivation of the parameters α, α⊥ and α‖, respectively. 〈σα〉, 〈σα⊥ 〉and 〈σα‖ 〉 correspond to the average of 1σ error of these three parameters from each mock.
zeff 〈α〉 Sα 〈σα〉 〈χ2〉/dof 〈α⊥〉 Sα⊥ 〈σα⊥ 〉 〈α‖〉 Sα‖ 〈σα‖ 〉 〈χ2〉/dof
pre-reconstruction:0.31 0.996 0.033 0.036 15.1/15 0.997 0.042 0.044 0.992 0.064 0.078 30.3/300.36 0.997 0.031 0.034 15.1/15 0.995 0.040 0.043 0.995 0.064 0.077 30.3/300.40 1.000 0.029 0.031 15.0/15 0.998 0.038 0.039 0.996 0.064 0.073 30.2/300.44 1.001 0.024 0.027 15.2/15 0.999 0.033 0.034 0.998 0.061 0.068 30.3/300.48 1.003 0.022 0.024 15.2/15 0.999 0.030 0.030 1.003 0.061 0.062 30.2/300.52 1.002 0.021 0.022 15.2/15 0.999 0.028 0.029 1.001 0.059 0.060 30.1/300.56 1.002 0.020 0.022 15.1/15 0.998 0.029 0.029 1.003 0.058 0.059 29.9/300.59 1.001 0.021 0.023 15.4/15 0.998 0.031 0.031 1.001 0.059 0.061 30.3/300.64 1.002 0.022 0.025 15.4/15 0.999 0.033 0.034 1.000 0.059 0.062 30.5/30
post-reconstruction:0.31 0.999 0.019 0.021 15.2/15 0.993 0.028 0.027 0.998 0.049 0.050 29.7/300.36 0.999 0.018 0.021 15.2/15 0.992 0.028 0.026 0.998 0.050 0.049 29.7/300.40 0.999 0.017 0.019 15.2/15 0.994 0.026 0.025 0.999 0.048 0.045 29.8/300.44 0.999 0.015 0.016 15.2/15 0.994 0.022 0.021 1.001 0.040 0.038 30.0/300.48 1.001 0.013 0.015 15.2/15 0.995 0.019 0.018 1.003 0.036 0.035 30.1/300.52 1.001 0.013 0.014 15.3/15 0.996 0.017 0.017 1.005 0.034 0.032 30.1/300.56 1.002 0.012 0.013 15.3/15 0.995 0.018 0.017 1.006 0.034 0.032 30.1/300.59 1.001 0.013 0.014 15.3/15 0.996 0.019 0.019 1.003 0.037 0.035 29.9/300.64 1.001 0.015 0.017 15.2/15 0.995 0.022 0.022 1.004 0.040 0.040 29.9/30
0 . 0
0 . 5
1 . 0 0 . 2 < z < 0 . 3 9
0 . 2 8 < z < 0 . 4 3
0 . 3 2 < z < 0 . 4 7
0 . 0
0 . 5
1 . 0 0 . 3 6 < z < 0 . 5 1
0 . 4 0 < z < 0 . 5 5
0 . 4 4 < z < 0 . 5 9
0 . 9 1 . 0 1 . 10 . 0
0 . 5
1 . 0 0 . 4 8 < z < 0 . 6 3
0 . 9 1 . 0 1 . 1
0 . 5 2 < z < 0 . 6 7
0 . 9 1 . 0 1 . 1
0 . 5 6 < z < 0 . 7 5
α⊥
0 . 0
0 . 5
1 . 0 0 . 2 < z < 0 . 3 9
0 . 2 8 < z < 0 . 4 3
0 . 3 2 < z < 0 . 4 7
0 . 0
0 . 5
1 . 0 0 . 3 6 < z < 0 . 5 1
0 . 4 0 < z < 0 . 5 5
0 . 4 4 < z < 0 . 5 9
0 . 8 0 . 9 1 . 0 1 . 1 1 . 20 . 0
0 . 5
1 . 0 0 . 4 8 < z < 0 . 6 3
0 . 8 0 . 9 1 . 0 1 . 1 1 . 2
0 . 5 2 < z < 0 . 6 7
0 . 8 0 . 9 1 . 0 1 . 1 1 . 2
0 . 5 6 < z < 0 . 7 5
α||
Figure 10. The 1D distributions of the parameters α⊥ (left panel) and α|| (right panel) from the pre-reconstructed mock catalogue (blue histograms), galaxycatalogue (blue curves) and from the post-reconstructed mock catalogue (red histograms), galaxy catalogue (red curves).
sion onDV (z)/rd from the pre-reconstruction catalogue can reach1.8% ∼ 3.3%. For the post-reconstruction, the precision is im-proved to be 1.1% ∼ 1.8%.
The improvement on the measurement precision of α after re-construction can be seen in Figure 12, where we show our tomo-graphic measurements in terms of the redshift in blue squares. Thepre-reconstruction constraints are plotted in upper panel, and thelower panel shows the result after reconstruction.
Since our redshift slices are highly correlated within the over-lapping range, which is visualised in Figure 1, it is important todetermine the correlations between redshift slices. We repeat the
fitting on BAO parameter using each mock measurement, derivethe covariance matrix between the ith z bin and jth z bin usingCij ≡ 〈αiαj〉 − 〈αi〉〈αj〉, then calculate the correlation coeffi-cient with rij = Cij/
√CiiCjj . The normalised correlations of
α between redshift slices for the post-reconstruction are plotted inFigure 13. It is seen that each bin is correlated to the 3 redshift binsnext to it.
c© 0000 RAS, MNRAS 000, 1–14

Tomographic BAO analysis of BOSS DR12 sample 9
0 . 0 0
0 . 0 5
0 . 1 0
0 . 0 0
0 . 0 5
0 . 1 0
0 . 0 0 0 . 0 5 0 . 1 00 . 0 0
0 . 0 5
0 . 1 0
0 . 0 0 0 . 0 5 0 . 1 0 0 . 0 0 0 . 0 5 0 . 1 0
0 . 2 < z < 0 . 3 9
0 . 2 8 < z < 0 . 4 3
0 . 3 2 < z < 0 . 4 7
0 . 3 6 < z < 0 . 5 1
post-re
constru
ction σ
α ⊥
0 . 4 0 < z < 0 . 5 5
0 . 4 4 < z < 0 . 5 9
0 . 4 8 < z < 0 . 6 3
0 . 5 2 < z < 0 . 6 7
p r e - r e c o n s t r u c t i o n σα⊥
0 . 5 6 < z < 0 . 7 5
0 . 0 0
0 . 0 5
0 . 1 0
0 . 1 5
0 . 0 0
0 . 0 5
0 . 1 0
0 . 1 5
0 . 0 0 0 . 0 5 0 . 1 0 0 . 1 50 . 0 0
0 . 0 5
0 . 1 0
0 . 1 5
0 . 0 0 0 . 0 5 0 . 1 0 0 . 1 5 0 . 0 0 0 . 0 5 0 . 1 0 0 . 1 5
0 . 2 < z < 0 . 3 9
0 . 2 8 < z < 0 . 4 3
0 . 3 2 < z < 0 . 4 7
0 . 3 6 < z < 0 . 5 1
post-re
constru
ction σ
α ||
0 . 4 0 < z < 0 . 5 5
0 . 4 4 < z < 0 . 5 9
0 . 4 8 < z < 0 . 6 3
0 . 5 2 < z < 0 . 6 7
p r e - r e c o n s t r u c t i o n σα||
0 . 5 6 < z < 0 . 7 5
Figure 11. The scatter plots of errors of α⊥ (left panel) and α|| (right panel) using pre- and post reconstruction mock catalogue. Each magenta point denotesthe 1σ error from each mock (totally 1000 mocks) and the cross (blue) is the error measured by data.
Table 4. The measurements on the isotropic BAO parameters and the re-duced χ2 using the pre- and post-reconstruction catalogues, respectively.
pre-reconstruction :zeff α DV /rd χ2/dof
0.31 0.9916± 0.0251 8.31± 0.21 12.6/150.36 0.9825± 0.0320 9.40± 0.31 13.2/150.40 1.0000± 0.0288 10.47± 0.30 20.9/150.44 1.0155± 0.0178 11.56± 0.20 16.5/150.48 1.0234± 0.0198 12.48± 0.24 22.3/150.52 1.0074± 0.0214 13.04± 0.28 21.9/150.56 0.9924± 0.0226 13.55± 0.31 22.1/150.59 0.9906± 0.0202 14.21± 0.29 21.0/150.64 0.9770± 0.0212 14.82± 0.32 15.1/15
post-reconstruction :0.31 0.9771± 0.0172 8.18± 0.14 16.8/150.36 0.9925± 0.0172 9.50± 0.16 12.5/150.40 1.0074± 0.0149 10.54± 0.16 22.0/150.44 1.0050± 0.0116 11.44± 0.13 24.8/150.48 1.0051± 0.0109 12.26± 0.13 39.0/150.52 0.9824± 0.0108 12.72± 0.14 13.8/150.56 0.9887± 0.0112 13.50± 0.15 10.6/150.59 0.9808± 0.0141 14.07± 0.20 13.9/150.64 0.9764± 0.0159 14.81± 0.24 20.7/15
6.2 Anisotropic BAO measurements
We present the fitting result on the anisotropic BAO parameters inTable 5 before and after reconstruction. Our measurements on α⊥and α‖ are plotted in terms of redshift in blue squares of Figure 14and 15, respectively.
Based on the input fiducial values for DfidA /rfid
d and Hfidrfidd ,
we can obtain the constraints on the transverse and radial distanceparameters, DA(z)/rd and H(z)rd, as listed in Table 6. The mea-surement precisions are within 2.3% − 3.5% for DA(z)/rd and3.9% − 8.1% for H(z)rd before the reconstruction. Using thereconstructed catalogues, the precisions are improved, which canreach 1.3%− 2.2% for DA(z)/rd and 2.1%− 6.0% for H(z)rd.
0 . 9 5
1 . 0 0
1 . 0 5
0 . 2 0 . 3 0 . 4 0 . 5 0 . 6 0 . 7 0 . 80 . 9 5
1 . 0 0
1 . 0 5
α
α
p r e - r e c o n T o m o g r a p h i c R o s s e t a l ξ( s ) C o m p r e s s e d
p o s t - r e c o n
r e d s h i f t zFigure 12. The fitting results on the isotropic BAO parameter, α using thepre- and post-reconstruction catalogues, respectively.
We determine the correlations between overlapping redshiftslices using the measurements from mock catalogue. The calcula-tion procedure has described in Section 6.1. The normalised corre-lated matrix of the parameters, α⊥ and α‖, between different red-shift slices for the post-reconstruction are plotted in Figure 16.
6.3 Result comparisons
We compare our pre-reconstructed results on the isotropic andanisotropic BAO parameters with the tomographic measurementsusing the power spectrum in Fourier space (Zhao et al. 2016). Thecomparison is plotted in Figure 17. We can see that the isotropic re-sults (blue points) agree well with each other. Because of the highcorrelations between anisotropic parameters, the comparison looksscattered, especially for the parameter α‖. Within the 1σ error,the results are consistent. The main difference is that Zhao et al.
c© 0000 RAS, MNRAS 000, 1–14

10 Wang et al.
Table 5. The fitting results on the anisotropic BAO parameters,α⊥ andα‖, and their correlation coeffecient r using the pre- and post-reconstruction catalogues,respectively.
pre-reconstruction post-reconstructionzeff α⊥ α‖ r χ2/dof α⊥ α‖ r χ2/dof
0.31 0.9596± 0.0334 1.0378± 0.0597 −0.40 26.0/30 0.9566± 0.0212 1.0203± 0.0614 −0.47 38.2/30
0.36 0.9584± 0.0334 1.0464± 0.0704 −0.30 29.0/30 0.9762± 0.0218 1.0275± 0.0438 −0.36 35.3/300.40 0.9706± 0.0321 1.0414± 0.0631 −0.27 41.7/30 0.9924± 0.0200 1.0250± 0.0253 −0.39 34.0/30
0.44 0.9798± 0.0228 1.0788± 0.0426 −0.41 34.8/30 0.9971± 0.0153 1.0168± 0.0217 −0.36 27.5/30
0.48 1.0104± 0.0259 1.0341± 0.0496 −0.42 38.0/30 1.0020± 0.0130 1.0050± 0.0235 −0.39 35.6/300.52 1.0114± 0.0272 0.9962± 0.0810 −0.57 38.7/30 0.9935± 0.0139 0.9560± 0.0270 −0.49 12.1/30
0.56 1.0083± 0.0276 0.9560± 0.0718 −0.51 40.2/30 0.9878± 0.0156 0.9877± 0.0247 −0.43 16.1/30
0.59 0.9926± 0.0293 0.9982± 0.0601 −0.53 37.3/30 0.9896± 0.0180 0.9564± 0.0307 −0.41 26.1/300.64 0.9656± 0.0334 1.0014± 0.0457 −0.43 25.7/30 0.9744± 0.0219 0.9794± 0.0294 −0.45 33.3/30
1 2 3 4 5 6 7 8 9123456789
00 . 10 . 20 . 30 . 40 . 50 . 60 . 70 . 80 . 91
Figure 13. The normalized correlation of the parameters, α, between dif-ferent redshift slices.
(2016) use the monopole, quadrupole and hexadecapole in powerspectrum, while we do not include the hexadecapole in our pre-reconstruction case. The role of the hexadecapole on anisotropicBAO constraints is discussed in detail (Zhao et al. 2016) .
In order to test the consistency between our measurements andthe measurements in 3 redshift bins (Ross et al. 2016), we com-pressed our measurements into 3 redshift bins. Namely, we com-pressed the first 4 redshift bins, which covers the redshift rangefrom 0.2 to 0.51, into one measurement. The compression is per-formed by introducing a parameter and fitting it to the measure-ments in these 4 redshift bins with their covariance matrix. The5th and 6th bins (0.4 < z < 0.59) are compressed as the secondmeasurement value. The last compressed measurement are fromthe remaining bins (0.48 < z < 0.75). The compression resultsare shown in red triangles of Figure 12, 14 and 15. In these figures,the green points denote the results within 3 redshift bins from ξ(s)measurements in Ross et al. (2016), i.e. two bins without overlap-ping between each other, [0.2, 0.5] and [0.5, 0.75], and an overlap-ping bin, [0.4, 0.6]. It is seen that with less redshift bins, more pre-cise measurements and much tighter constraints can be obtained.In contrast, dividing more redshift bins in the tomographic casecan capture the redshift information of galaxy clustering with moremeasurements at different effective redshifts. The comparison isplotted in Figure 18. We can see that our results are consistent withthe measurements in Ross et al. (2016).
Table 6. The fitting results on the anisotropic BAO parameters,DA/rd andHrd using the pre- and post-reconstruction catalogues, respectively.
pre-reconstruction:zeff DA/rd Hrd ∗ 103[km/s]
0.31 6.31± 0.22 11.35± 0.650.36 6.96± 0.24 11.60± 0.78
0.40 7.53± 0.25 11.93± 0.72
0.44 8.06± 0.19 11.81± 0.470.48 8.71± 0.22 12.61± 0.60
0.52 9.06± 0.24 13.38± 1.09
0.56 9.35± 0.26 14.25± 1.070.59 9.48± 0.28 13.94± 0.84
0.64 9.53± 0.33 14.28± 0.65
post-reconstruction:zeff DA/rd Hrd ∗ 103[km/s]
0.31 6.29± 0.14 11.55± 0.700.36 7.09± 0.16 11.81± 0.50
0.40 7.70± 0.16 12.12± 0.30
0.44 8.20± 0.13 12.53± 0.270.48 8.64± 0.11 12.97± 0.30
0.52 8.90± 0.12 13.94± 0.39
0.56 9.16± 0.14 13.79± 0.340.59 9.45± 0.17 14.55± 0.47
0.64 9.62± 0.22 14.60± 0.44
The comparisons of our anisotropic BAO measurements withthe three bins consensus measurements in Alam et al. (2016) areshown in Figure 19 and 20, where the black squares are our mea-surements, and the red points are the consensus result, which arethe combined constraints from the correlation function and powerspectrum in (Alam et al. 2016). The blue bands correspond to the68 and 95% CL constraints in the ΛCDM using the Planck data as-suming a ΛCDM model (Planck Collaboration et al. 2016). We cansee these results are consistent.
7 CONSTRAINTS ON COSMOLOGICAL MODELS
Using our tomographic measurements on Hubble parameters, wedo theOm diagnostic, proposed by Sahni et al. (2008). It is definedby the Hubble parameter
Om(z) ≡ [H(z)/H0]2 − 1
(1 + z)3 − 1. (31)
c© 0000 RAS, MNRAS 000, 1–14

Tomographic BAO analysis of BOSS DR12 sample 11
0 . 9
1 . 0
1 . 1
0 . 2 0 . 3 0 . 4 0 . 5 0 . 6 0 . 7 0 . 80 . 9
1 . 0
1 . 1
α ⊥
T o m o g r a p h i c R o s s e t a l ξ( s ) C o m p r e s s e d
p r e - r e c o n
α ⊥
p o s t - r e c o n
r e d s h i f t zFigure 14. The fitting results on the anisotropic BAO parameter, α⊥ usingthe pre- and post-reconstruction catalogues, respectively.
0 . 91 . 01 . 11 . 2
0 . 2 0 . 3 0 . 4 0 . 5 0 . 6 0 . 7 0 . 80 . 91 . 01 . 11 . 2
α ||
p r e - r e c o n
α ||
T o m o g r a p h i c R o s s e t a l ξ( s ) C o m p r e s s e d
p o s t - r e c o n
r e d s h i f t zFigure 15. The fitting results on the anisotropic BAO parameter, α‖ usingthe pre- and post-reconstruction catalogues, respectively.
2 4 6 8 1 0 1 2 1 4 1 6 1 82468
1 01 21 41 61 8
- 1
- 0 . 8
- 0 . 6
- 0 . 4
- 0 . 2
0
0 . 2
0 . 4
0 . 6
0 . 8
1
Figure 16. The normalised correlation of the parameters, α⊥ and α‖, be-tween different redshift slices.
α||
α P
α⊥
αξ
0 . 9 1 . 0 1 . 1
0 . 9
1 . 0
1 . 1 α
Figure 17. The comparison of our result on isotropic and anisotropic BAOparameters from the pre-reconstructed data with that in Zhao et al. (2016),measured in Fourier space.
α||
α ξ (Ross
et al) α⊥
αξ ( W a n g e t a l )0 . 9 1 . 0 1 . 10 . 9
1 . 0
1 . 1
α
Figure 18. The comparison of our result on isotropic and anisotropic BAOparameters from the post-reconstructed data in the compressed 3 redshiftbins with that in Ross et al. (2016), also measured in configuration space.
P l a n c k L C D M T o m o g r a p h i c D R 1 2 C o n s e n s u s
0 . 2 0 . 3 0 . 4 0 . 5 0 . 6 0 . 71 0 0 0
1 5 0 0
2 0 0 0
2 5 0 0
(DMrfid d
)/r d [Mpc]
r e d s h i f t zFigure 19. Our tomographic measurements onDMrfid
d /rd (black squares)in terms of redshift, compared with the consensus result (red points) inAlam et al. (2016) and the prediction from Planck assuming a ΛCDM model(blue bands). Here DM = (1 + z)DA.
c© 0000 RAS, MNRAS 000, 1–14

12 Wang et al.
P l a n c k L C D M T o m o g r a p h i c D R 1 2 C o n s e n s u s
0 . 2 0 . 3 0 . 4 0 . 5 0 . 6 0 . 77 0
8 0
9 0
1 0 0
Hr
d/rfid d [k
m/s M
pc-1 ]
r e d s h i f t zFigure 20. Our tomographic measurements on H(z)rd/r
fidd (black
squares) in terms of redshift, compared with the consensus result (redpoints) in Alam et al. (2016) and the prediction from Planck assuming aΛCDM model (blue bands).
In ΛCDM, Om(z) = Ωm. Using our measurements of H(z)rdand combining the fiducial values of rd = 147.74 Mpc andH0 = 67.8 km/s/Mpc, we convert our measurements to Om(z),as shown in Figure 21, where the blue squares are the pre-reconstruction tomographic measurements, the red points are thepost-reconstruction tomographic measurements, and the black tri-angles are the consensus result in Alam et al. (2016).
To quantify the possible deviation from ΛCDM, we make afit to the Om(z) values with the covariance matrix between dif-ferent redshift slices using a single parameter. As shown in Figure21, the black dashed line with the grey band are the best-fit valuewith 1σ error using the “3 zbin" consensus result, the blue dashedline with the blue band are the “9 zbin" pre-reconstruction tomo-graphic result and the red dashed line with the red band are the “9zbin" post-reconstruction tomographic result. We obtain the fittingvalue, Ωm = 0.32 ± 0.025, with χ2 = 1.73 from the consensusresult. Therefore, within 2σ regions there is no deviation from aconstant Ωm(z). Using our pre-reconstruction tomographic result,the fitting result is Ωm = 0.266± 0.036. The Om(z) values in thepre-reconstruction case deviate from the fitting constant Ωm(z) atabout 2.01σ level. From our post-reconstruction result, theOm(z)values deviate from the fitting result, Ωm = 0.307±0.021, at about2.78σ.
We present the cosmological implications with our tomo-graphic BAO measurements. We use the Cosmomc2 (Lewis & Bri-dle 2002) code to perform the fittings on dark energy parameters ina time-varying dark energy with EoS, wDE(a) = w0 +wa(1− a)(Chevallier & Polarski 2001; Linder 2003).
We are using the combined data set, including the tempera-ture and polarization power spectra from Planck 2015 data release(Planck Collaboration et al. 2016), the “Joint Light-curve Aalysis"(JLA) sample of type Ia SNe (Sako et al. 2014), the BOSS DR12BAO distance measurements. We compare the constraining powerof different BAO measurements, i.e. tomographic “9 zbin" BAOmeasurements from the post-reconstructed catalogues, consensus“3 zbin" measurements on BAO and RSD in Alam et al. (2016), andthe compressed “1 zbin" BAO result from the post-reconstructiontomographic measurements.
2 http://cosmologist.info/cosmomc/
0 . 2 0 . 3 0 . 4 0 . 5 0 . 6 0 . 70 . 1
0 . 2
0 . 3
0 . 4
0 . 5 p r e - r e c o n p o s t - r e c o n D R 1 2 c o n s e n s u s
Om(z)
r e d s h i f t zFigure 21. The Om(z) values converted by our measurements on Hubbleparameter in 9 redshift bins.
Table 7. Joint data constraints on dark energy EoS parameters w0 and wain the w0waCDM. Here we compare the constraining power of the BOSSDR12 BAO measurements, i.e. the tomographic “9 zbin" measurements inthis work, consensus “3 zbin" measurements in Alam et al. (2016), and thecompressed “1 zbin" result from tomographic measurements.
Planck+JLA+BOSS w0 wa
Tomographic (9 zbin) −0.957± 0.097 −0.389± 0.358
DR12 Consensus (3 zbin) −0.942± 0.101 −0.288± 0.359
Compressed (1 zbins) −0.917± 0.103 −0.589± 0.414
The results of the parametersw0 andwa are presented in Table7. We can see the uncertainties of parameters are improved with the“9 zbin" BAO measurements in our work.
In w0waCDM, comparing the tomographic “9 zbin" with thenon-tomographic “1 zbin" results, the errors of w0 and wa are im-proved by 6% and 16%, respectively. Using the Figure of Merit(FoM) (Albrecht et al. 2009), which is inversely proportional tothe area of the contour as shown in Figure 22, to quantify this im-provement, the FoM is improved by a factor of 1.24 (FoM=49 forthe grey contour from the “1 zbin" result and FoM=61 for the bluecontour from the “9 zbin" result in Figure 22). Comparing the “9zbin" with “3 zbin" results, the “9 zbin" BAO measurement givethe slightly tighter constraints.
8 CONCLUSION
Measurements of the BAO distance scales have become a robustway to map the expansion history of the Universe. A precise BAOdistance measurement at a single effective redshift can be achievedusing the entire galaxies in the survey, covering a wide redshiftrange. However, the tomographic information is largely lost. To ex-tract the redshift information from the samples, one possible wayis to use overlapping redshift slices.
Using the combined sample of BOSS DR12, we perform atomographic baryon acoustic oscillations analysis using the two-point galaxy correlation function. We split the whole redshift rangeof sample, 0.2 < z < 0.75, into multiple overlapping redshiftslices, and measured correlation functions in all the bins. Withthe full covariance matrix calibrated using MultiDark-Patchy mock
c© 0000 RAS, MNRAS 000, 1–14

Tomographic BAO analysis of BOSS DR12 sample 13
2.4 1.6 0.8 0.0 0.8
wa
1.20 1.05 0.90 0.75 0.60
w
2.4
1.6
0.8
0.0
0.8
wa
1zbin
3zbin
9zbin
Figure 22. The 1D posterior distribution of w and wa and their 2D contourplots in the CPL model from the compressed “1 zbin" BAO (grey line andcontour), consensus “3 zbin" BAO and RSD (red line and contour), andtomographic “9 zbin" BAO (blue line and contour).
catalogues, we obtained the isotropic and anisotropic BAO mea-surements.
In the isotropic case, the measurement precision onDV (z)/rdfrom the pre-reconstruction catalogue can reach 1.8% ∼ 3.3%.For the post-reconstruction, the precision is improved, and becomes1.1% ∼ 1.8%. In the anisotropic case, the measurement precisionis within 2.3%−3.5% forDA(z)/rd and 3.9%−8.1% forH(z)rdbefore the reconstruction. Using the reconstructed catalogues, theprecision is improved, which can reach 1.3%−2.2% forDA(z)/rdand 2.1%− 6.0% for H(z)rd.
We present the comparison of our measurements with that in acompanion paper (Zhao et al. 2016), where the tomographic BAOis measured using multipole power spectrum in Fourier space. Wefind an agreement within the 1σ confidence level. The derived 3-bin results from our tomographic measurements are also comparedto the 3-bin measurements in Ross et al. (2016), and a consistencyis found.
We perform cosmological constraints using the tomographic9-bin BAO measurements, the consensus 3-bin BAO and RSD mea-surements, and the compressed 1-bin BAO measurement. Compar-ing the constraints on w0waCDM from 9-bin and 1-bin BAO dis-tance measurements, the uncertainties of the parameters, w0 andwa are improved by 6% and 16%, respectively. The dark energyFoM is improved by a factor of 1.24. Comparing the “9 zbin" with“3 zbin" results, the “9 zbin" BAO measurement give the slightlytighter constraints.
The future galaxy surveys will cover a larger and larger cos-mic volume, and there is rich tomographic information in redshiftsto be extracted. The method developed in this work can be easilyapplied to the upcoming galaxy surveys and the gain in the tempo-ral information is expected to be more significant.
ACKNOWLEDGEMENTS
YW is supported by the NSFC grant No. 11403034. GBZ and YWare supported by National Astronomical Observatories, ChineseAcademy of Sciences, and by University of Portsmouth.
Funding for SDSS-III has been provided by the Alfred P.Sloan Foundation, the Participating Institutions, the National Sci-ence Foundation, and the US Department of Energy Office of Sci-ence. The SDSS-III web site is http://www.sdss3.org/.SDSS-III is managed by the Astrophysical Research Consortiumfor the Participating Institutions of the SDSS-III Collaborationincluding the University of Arizona, the Brazilian ParticipationGroup, Brookhaven National Laboratory, Carnegie Mellon Univer-sity, University of Florida, the French Participation Group, the Ger-man Participation Group, Harvard University, the Instituto de As-trofisica de Canarias, the Michigan State/Notre Dame/JINA Par-ticipation Group, Johns Hopkins University, Lawrence BerkeleyNational Laboratory, Max Planck Institute for Astrophysics, MaxPlanck Institute for Extraterrestrial Physics, New Mexico StateUniversity, New York University, Ohio State University, Pennsyl-vania State University, University of Portsmouth, Princeton Uni-versity, the Spanish Participation Group, University of Tokyo, Uni-versity of Utah, Vanderbilt University, University of Virginia, Uni-versity of Washington, and Yale University.
This research used resources of the National Energy ResearchScientific Computing Center, which is supported by the Office ofScience of the U.S. Department of Energy under Contract No. DE-AC02-05CH11231, the SCIAMA cluster supported by Universityof Portsmouth, and the ZEN cluster supported by NAOC.
REFERENCES
Alam S. et al., 2015, ApJS, 219, 12Alam S. et al., 2016, ArXiv e-prints:1607.03155Albrecht A. et al., 2009, ArXiv e-prints:0901.0721Anderson L. et al., 2014, MNRAS, 441, 24Beutler F. et al., 2011, MNRAS, 416, 3017Beutler F. et al., 2016a, ArXiv e-prints:1607.03149Beutler F. et al., 2016b, ArXiv e-prints:1607.03150Blake C. et al., 2011, MNRAS, 418, 1707Chevallier M., Polarski D., 2001, International Journal of Modern
Physics D, 10, 213Chuang C.-H. et al., 2016, ArXiv e-prints:1607.03151Chuang C.-H., Wang Y., 2012, MNRAS, 426, 226Chuang C.-H., Wang Y., 2013, MNRAS, 431, 2634Cuesta A. J. et al., 2016, MNRAS, 457, 1770Dawson K. S. et al., 2013, AJ, 145, 10Eisenstein D. J., Hu W., 1998, ApJ, 496, 605Eisenstein D. J., Seo H.-J., White M., 2007a, ApJ, 664, 660Eisenstein D. J., Seo H.-J., White M., 2007b, ApJ, 664, 660Eisenstein D. J. et al., 2011, AJ, 142, 72Eisenstein D. J. et al., 2005, ApJ, 633, 560Feldman H. A., Kaiser N., Peacock J. A., 1994, ApJ, 426, 23Gil-Marín H. et al., 2016, MNRAS, 460, 4210Grieb J. N. et al., 2016, ArXiv e-prints:1607.03143Kaiser N., 1987, MNRAS, 227, 1Kazin E. A. et al., 2010, ApJ, 710, 1444Kazin E. A., Sánchez A. G., Blanton M. R., 2012, MNRAS, 419,
3223Kazin E. A. et al., 2013, MNRAS, 435, 64Kitaura F.-S. et al., 2016, MNRAS, 456, 4156
c© 0000 RAS, MNRAS 000, 1–14

14 Wang et al.
Landy S. D., Szalay A. S., 1993, ApJ, 412, 64Lewis A., Bridle S., 2002, Phys. Rev. D, 66, 103511Lewis A., Challinor A., Lasenby A., 2000, ApJ, 538, 473Linder E. V., 2003, Physical Review Letters, 90, 091301Padmanabhan N., White M., 2008, Phys. Rev. D, 77, 123540Padmanabhan N., Xu X., Eisenstein D. J., Scalzo R., Cuesta A. J.,
Mehta K. T., Kazin E., 2012, MNRAS, 427, 2132Percival W. J., Cole S., Eisenstein D. J., Nichol R. C., Peacock
J. A., Pope A. C., Szalay A. S., 2007, MNRAS, 381, 1053Percival W. J. et al., 2014, MNRAS, 439, 2531Perlmutter S. et al., 1999, ApJ, 517, 565Planck Collaboration et al., 2016, A&A, 594, A11Reid B. A. et al., 2010, MNRAS, 404, 60Riess A. G. et al., 1998, AJ, 116, 1009Ross A. J. et al., 2016, ArXiv e-prints:1607.03145Sahni V., Shafieloo A., Starobinsky A. A., 2008, Phys. Rev. D, 78,
103502Sako M. et al., 2014, ArXiv e-prints:1401.3317Salazar-Albornoz S. et al., 2016a, ArXiv e-prints:1607.03144Salazar-Albornoz S. et al., 2016b, ArXiv e-prints:1607.03144Salazar-Albornoz S., Sánchez A. G., Padilla N. D., Baugh C. M.,
2014, MNRAS, 443, 3612Sanchez A. G. et al., 2016a, ArXiv e-prints:1607.03146Sanchez A. G. et al., 2016b, ArXiv e-prints:1607.03147Seo H.-J., Beutler F., Ross A. J., Saito S., 2015, ArXiv e-
prints:1511.00663Seo H.-J., Eisenstein D. J., 2007, ApJ, 665, 14Tegmark M., 1997, Physical Review Letters, 79, 3806Tegmark M. et al., 2006, Phys. Rev. D, 74, 123507Vargas-Magaña M. et al., 2016, ArXiv e-prints:1610.03506Weinberg D. H., Mortonson M. J., Eisenstein D. J., Hirata C.,
Riess A. G., Rozo E., 2013, Phys. Rep., 530, 87Xu X., Cuesta A. J., Padmanabhan N., Eisenstein D. J., McBride
C. K., 2013, MNRAS, 431, 2834Zhao G.-B. et al., 2017, ArXiv e-prints:1701.08165Zhao G.-B. et al., 2016, ArXiv e-prints:1607.03153
c© 0000 RAS, MNRAS 000, 1–14
![The clustering of galaxies in the SDSS-III Baryon ... · arXiv:1203.6641v1 [astro-ph.CO] 29 Mar 2012 Mon. Not. R. Astron. Soc. 000, 1–1 (0000) Printed 30 March 2012 (MN LATEX style](https://img.pdfslide.us/doc/110x75/5fd0bc4f6b9452536212bda5/the-clustering-of-galaxies-in-the-sdss-iii-baryon-arxiv12036641v1-astro-phco.jpg)