Embed Size (px)
Citation preview

THE CLIMATE AND WEATHER OF
SOUTHLAND2nd edition G.R. Macara
Note to Second EditionThis publication replaces the first edition of New Zealand Meteorological Service Miscellaneous Publication 115 (15), written in 1984 by J. Sansom. It was considered necessary to update the first edition, incorporating more recent data and updated methods of climatological variable calculation.
NIWA SCIENCE AND TECHNOLOGY SERIES NUMBER 63
ISSN 1173-0382
© 2013. All rights reserved. The copyright for this report, and for the data, maps, figures and other information (hereafter collectively referred to as “data”) contained in it, is held by NIWA. This copyright extends to all forms of copying and any storage of material in any kind of information retrieval system.
While NIWA uses all reasonable endeavours to ensure the accuracy of the data, NIWA does not guarantee or make any representation or warranty (express or implied) regarding the accuracy or completeness of the data, the use to which the data may be put or the results to be obtained from the use of the data. Accordingly, NIWA expressly disclaims all legal liability whatsoever arising from, or connected to, the use of, reference to, reliance on or possession of the data or the existence of errors therein. NIWA recommends that users exercise their own skill and care with respect to their use of the data and that they obtain independent professional advice relevant to their particular circumstances.
THE CLIMATE AND WEATHER OF SOUTHLAND2nd edition G. R. Macara
5
CONTENTSSUMMARY 6
INTRODUCTION 7
TYPICAL WEATHER SITUATIONS IN SOUTHLAND 9Disturbed westerlies 9Passage of a major trough 10Low index situations 11
CLIMATIC ELEMENTS 13Wind 13Rainfall 16
Rainfall distribution 16Rainfall frequency and intensity 18Recent extreme events in Southland 21Periods of low rainfall 21
Temperature 22Sea surface temperature 22Air temperature 23Earth temperatures 27Frosts 27
Sunshine and Solar Radiation 30Sunshine 30Solar radiation 31UV (Ultra-violet radiation) 31
Other elements 32Snow 32Thunderstorms 33Hail 33Fog 33
DERIVED CLIMATOLOGICAL PARAMETERS 35Vapour pressure and relative humidity 35Evapotranspiration and soil water balance 36Degree-day totals 38
ACKNOWLEDGEMENTS 40
REFERENCES 40
6
SUMMARYSouthland is both the most southerly and most westerly part of New Zealand and generally is the first to be influenced by weather systems moving onto the country from the west or south. It is well exposed to these systems, although western parts of Fiordland are sheltered from the south and the area east of the western ranges is partially sheltered from the north or northwest. The region is in the latitudes of prevailing westerlies, and areas around Foveaux Strait frequently experience strong winds, but the winds are lighter inland. Winter is typically the least windy time of year, as well as for many but not all areas, the driest. The western ranges, with annual falls exceeding 8000 mm in some parts, are among the rainiest places on earth. The drier eastern lowlands and hills form a complete contrast, with annual falls predominantly between 1200 mm and 800 mm. Dry spells of more than two weeks are not common. Temperatures are on average lower than over the rest of the country with frosts and snowfalls occurring relatively frequently each year. On average, Southland receives less sunshine than the remainder of New Zealand.
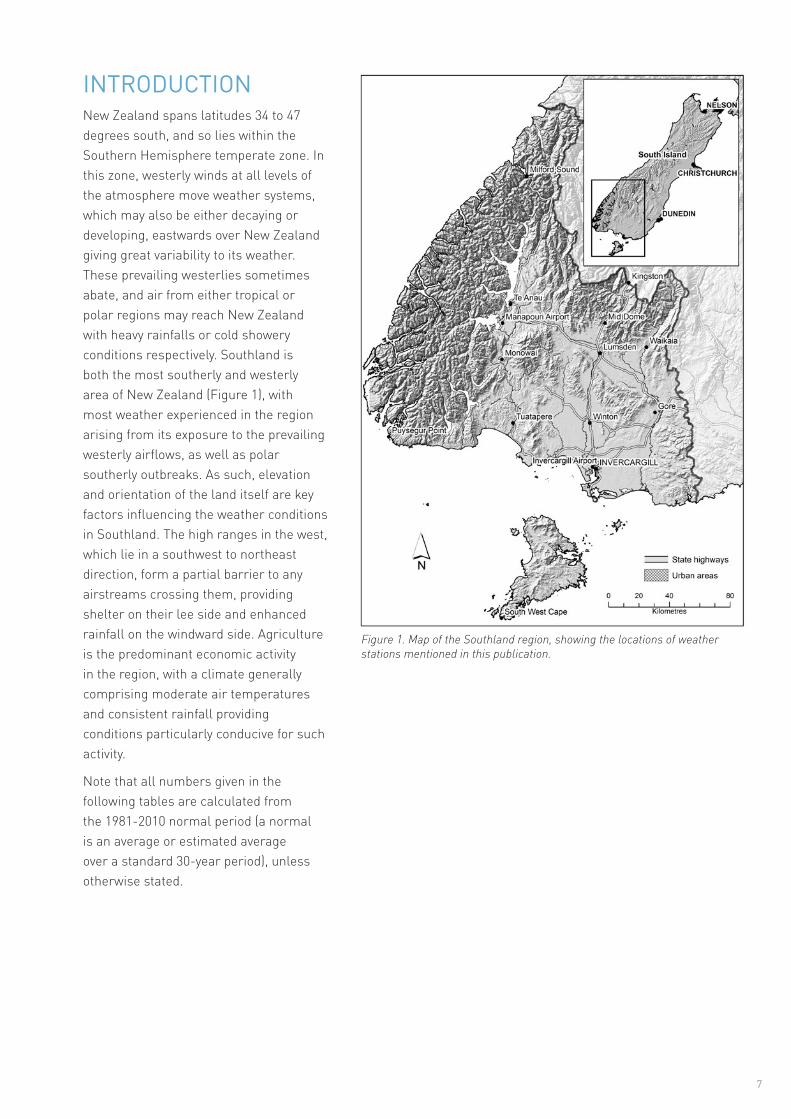
Figure 1. Map of the Southland region, showing the locations of weather stations mentioned in this publication.
7
INTRODUCTIONNew Zealand spans latitudes 34 to 47 degrees south, and so lies within the Southern Hemisphere temperate zone. In this zone, westerly winds at all levels of the atmosphere move weather systems, which may also be either decaying or developing, eastwards over New Zealand giving great variability to its weather. These prevailing westerlies sometimes abate, and air from either tropical or polar regions may reach New Zealand with heavy rainfalls or cold showery conditions respectively. Southland is both the most southerly and westerly area of New Zealand (Figure 1), with most weather experienced in the region arising from its exposure to the prevailing westerly airflows, as well as polar southerly outbreaks. As such, elevation and orientation of the land itself are key factors influencing the weather conditions in Southland. The high ranges in the west, which lie in a southwest to northeast direction, form a partial barrier to any airstreams crossing them, providing shelter on their lee side and enhanced rainfall on the windward side. Agriculture is the predominant economic activity in the region, with a climate generally comprising moderate air temperatures and consistent rainfall providing conditions particularly conducive for such activity.
Note that all numbers given in the following tables are calculated from the 1981-2010 normal period (a normal is an average or estimated average over a standard 30-year period), unless otherwise stated.

8

9
TYPICAL WEATHER SITUATIONS IN SOUTHLANDThe air temperature, wind, rain, fog, frost etc. are the elements comprising the weather at a particular moment while the climate is their integrated effect over a longer period of time. The types and sequence of weather elements affecting Southland are determined by large-scale synoptic situations consisting of the distribution of pressure and fronts over a large part of the Southern Hemisphere. Although many different situations are possible, they tend to fall into only a few characteristic categories:
1. Disturbed westerlies, when a persistent westerly flow is interrupted for short periods by fast moving and usually weak fronts;
2. The passage of a major trough with perhaps several frontal zones. Its approach turns the flow over Southland northerly, whereas behind the trough southerly airstreams prevail; and
3. The low index situation. Here, the usual pressure distribution is reversed, with depressions north of 40 degrees south latitude and anticyclones to the south of New Zealand. In these situations, easterly airstreams flow over Southland.
Disturbed westerliesThe synoptic-scale flow over Southland is westerly when pressures are high to the north and depressions lie to the south of New Zealand. The depressions are usually moved rapidly eastwards by strong westerly winds in the upper atmospheric flow, and similar upper flows in sub-tropical latitudes (the subtropical jet streams) often intensify mid-latitude anticyclones. These circumstances combine to give periods of strong westerlies over Southland. The annual
Figure 2. Mean sea level pressure analysis for 0000 hours NZDT on 15 November 1980.
Figure 3. Mean sea level pressure analysis for 0000 hours NZST on 5 October 1982.
Figure 4. Mean sea level pressure analysis for 0000 hours NZST on 18 September 1982.

Figure 6. Mean sea level pressure analysis for 0000 hours NZST on 25 October 1982.
Figure 7. Mean sea level pressure analysis for 0000 hours NZST on 8 September 1976.
10
Passage of a major troughAs troughs of large amplitude approach from the west, the flow over Southland tends northwesterly (Figure 4). Northwesterly wind directions are still onshore in western areas, resulting in rain (which may be persistent and heavy) there. However, eastern areas are sheltered by the rain-shadow effect of the western ranges and remain fine. Additionally, air temperatures may become relatively high due to foehn winds, especially in the summer months. Although these major troughs are typically slow-moving, they are often accompanied by faster moving frontal zones which pass through them, bringing periods of rain throughout Southland.
Figure 5. Mean sea level pressure analysis for 0000 hours NZDT on 14 December 1982.
cycle of changes in the upper atmospheric flow is such that there is a minimum in the frequency of westerly winds over the South Island in winter (Reid, 1980) and a maximum in spring.
For strong westerlies, air pressures of 1020 hPa or more are required in the 30 to 40 degrees south latitude belt, extending longitudinally from about 130 degrees east to 170 degrees west, while air pressures in the Macquaire/Campbell Island region should be about 980 hPa (Figure 2). Such strong westerlies will persist over Southland while weak fronts pass with only minor wind speed and direction changes. However, with more active fronts pressures to the north will not be so high and, therefore, the strength of the westerly flow will decrease. Additionally, if the high pressure belt is much less extensive, then only moderate wind speeds will prevail (Figure 3). These westerly flows are onshore, bringing showers which are usually frequent and heavy about the western coast and ranges, but scattered about the south coast and isolated inland. As a front approaches, rain develops in the west and this spreads elsewhere with the frontal passage.
11
The amplitude of the trough and ridge to the west may be such that the flow turns to the southwest, but not any more southerly, before another trough approaches or the westerlies are re-established (Figure 5). In this case, showery conditions prevail in most areas. However, with a larger amplitude system when the ridge extends well to the south (Figure 6) a cold south to southeast flow covers Southland. In this case, western areas are sheltered and fine but the east and south are subject to periods of rain and drizzle. This latter case is more frequent in winter than any other season.
Low index situationsA low index situation can develop from the passage of a major trough if the trough becomes slow-moving over New Zealand; the southern part of it
becoming very weak or disappearing as the ridge in the south intensifies, and the northern part of the trough develops into a depression over the northern Tasman Sea or the North Island. Other processes can also result in a low index situation, such as a depression near the North Island and an intense anticyclone to the south of the South Island (Figure 7). This situation is slow-moving, and once established usually persists for some days. The flow over Southland is easterly and so western areas are sheltered and fine. The east will also be fine on many occasions, and as such this type of situation can cause extended dry spells in Southland. However, the east can be subject to low cloud and drizzle, especially about coastal areas in winter, which is the season when this situation occurs most frequently. Also, if an active front is associated with the depression in the north, and this moves sufficiently far south, then periods of rain are likely.

12
13
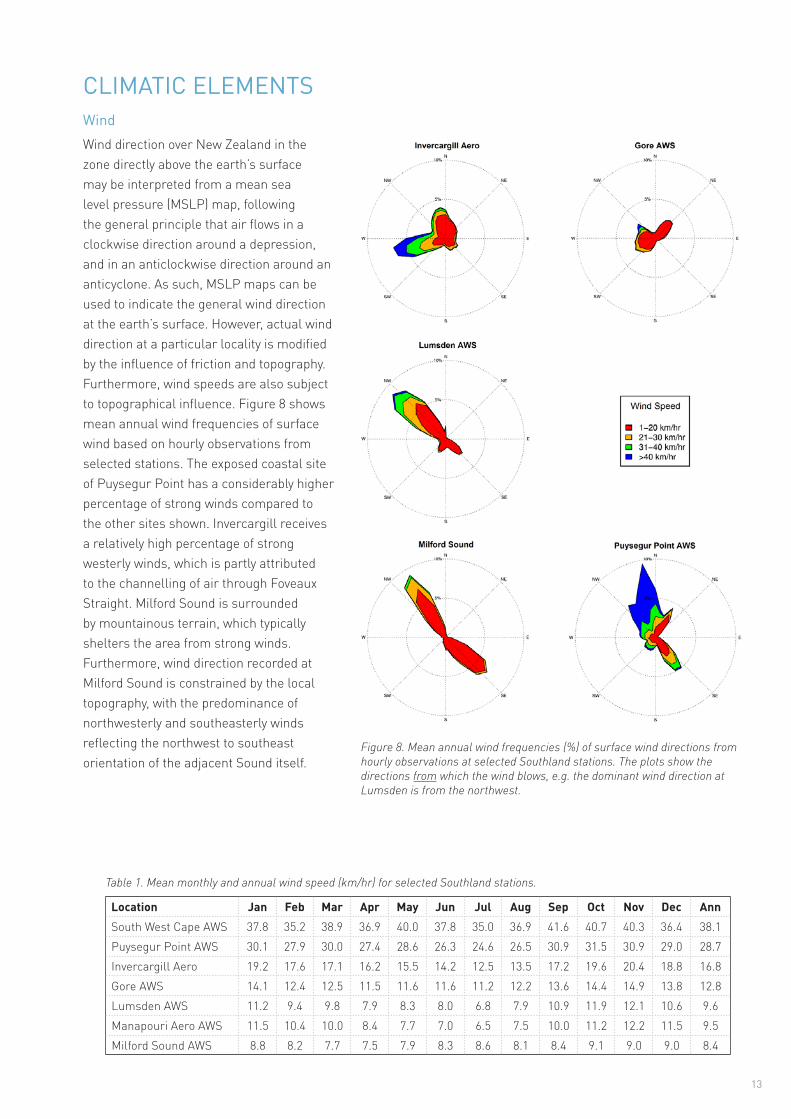
CLIMATIC ELEMENTSWindWind direction over New Zealand in the zone directly above the earth’s surface may be interpreted from a mean sea level pressure (MSLP) map, following the general principle that air flows in a clockwise direction around a depression, and in an anticlockwise direction around an anticyclone. As such, MSLP maps can be used to indicate the general wind direction at the earth’s surface. However, actual wind direction at a particular locality is modified by the influence of friction and topography. Furthermore, wind speeds are also subject to topographical influence. Figure 8 shows mean annual wind frequencies of surface wind based on hourly observations from selected stations. The exposed coastal site of Puysegur Point has a considerably higher percentage of strong winds compared to the other sites shown. Invercargill receives a relatively high percentage of strong westerly winds, which is partly attributed to the channelling of air through Foveaux Straight. Milford Sound is surrounded by mountainous terrain, which typically shelters the area from strong winds. Furthermore, wind direction recorded at Milford Sound is constrained by the local topography, with the predominance of northwesterly and southeasterly winds reflecting the northwest to southeast orientation of the adjacent Sound itself.
Table 1. Mean monthly and annual wind speed (km/hr) for selected Southland stations.
Location Jan Feb Mar Apr May Jun Jul Aug Sep Oct Nov Dec AnnSouth West Cape AWS 37.8 35.2 38.9 36.9 40.0 37.8 35.0 36.9 41.6 40.7 40.3 36.4 38.1Puysegur Point AWS 30.1 27.9 30.0 27.4 28.6 26.3 24.6 26.5 30.9 31.5 30.9 29.0 28.7Invercargill Aero 19.2 17.6 17.1 16.2 15.5 14.2 12.5 13.5 17.2 19.6 20.4 18.8 16.8Gore AWS 14.1 12.4 12.5 11.5 11.6 11.6 11.2 12.2 13.6 14.4 14.9 13.8 12.8Lumsden AWS 11.2 9.4 9.8 7.9 8.3 8.0 6.8 7.9 10.9 11.9 12.1 10.6 9.6Manapouri Aero AWS 11.5 10.4 10.0 8.4 7.7 7.0 6.5 7.5 10.0 11.2 12.2 11.5 9.5Milford Sound AWS 8.8 8.2 7.7 7.5 7.9 8.3 8.6 8.1 8.4 9.1 9.0 9.0 8.4
Figure 8. Mean annual wind frequencies (%) of surface wind directions from hourly observations at selected Southland stations. The plots show the directions from which the wind blows, e.g. the dominant wind direction at Lumsden is from the northwest.
14
Mean wind speed data (average wind speeds are taken over the 10 minute period preceding each hour) are available for a number of sites in Southland, and these illustrate the several different wind regimes of the region (Table 1). Mean wind speeds are highest at the exposed coastal sites of South West Cape and Puysegur Point, and lower at the inland sites of Gore, Lumsden and Manapouri. Lowest mean wind speeds are recorded at Milford Sound, due to the aforementioned sheltering from strong winds by the surrounding mountains.
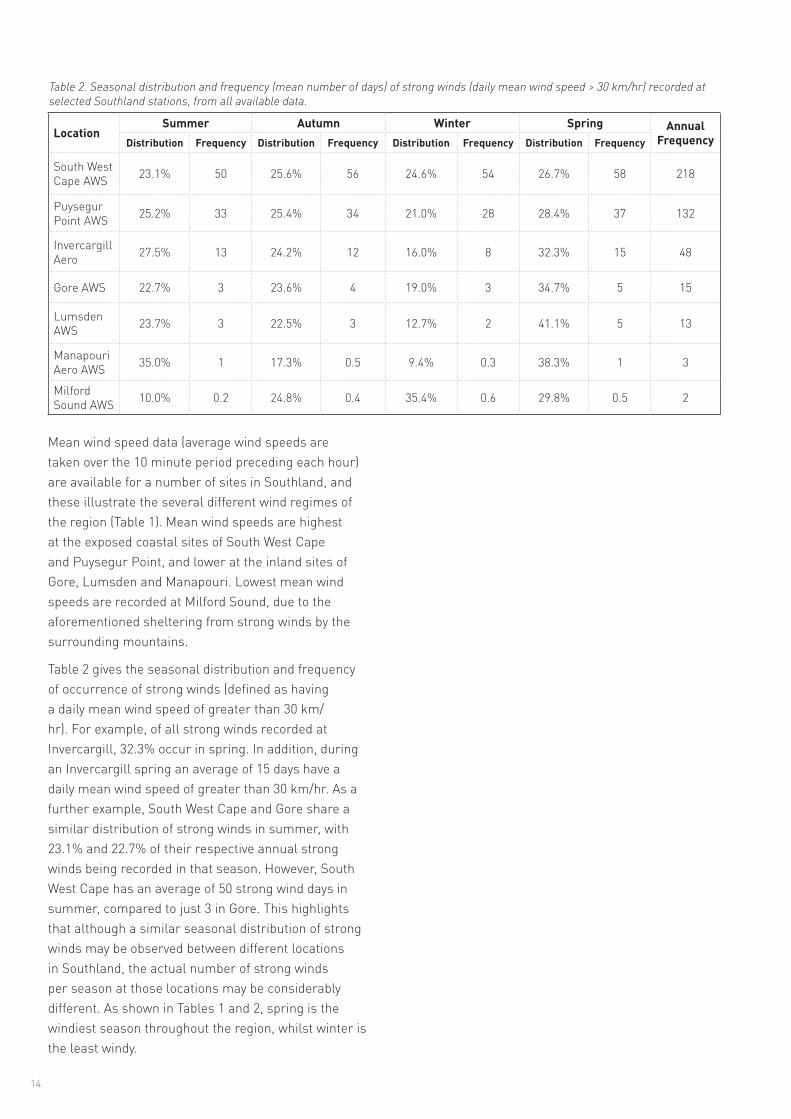
Table 2 gives the seasonal distribution and frequency of occurrence of strong winds (defined as having a daily mean wind speed of greater than 30 km/hr). For example, of all strong winds recorded at Invercargill, 32.3% occur in spring. In addition, during an Invercargill spring an average of 15 days have a daily mean wind speed of greater than 30 km/hr. As a further example, South West Cape and Gore share a similar distribution of strong winds in summer, with 23.1% and 22.7% of their respective annual strong winds being recorded in that season. However, South West Cape has an average of 50 strong wind days in summer, compared to just 3 in Gore. This highlights that although a similar seasonal distribution of strong winds may be observed between different locations in Southland, the actual number of strong winds per season at those locations may be considerably different. As shown in Tables 1 and 2, spring is the windiest season throughout the region, whilst winter is the least windy.
Table 2. Seasonal distribution and frequency (mean number of days) of strong winds (daily mean wind speed > 30 km/hr) recorded at selected Southland stations, from all available data.
LocationSummer Autumn Winter Spring Annual
FrequencyDistribution Frequency Distribution Frequency Distribution Frequency Distribution Frequency
South West Cape AWS 23.1% 50 25.6% 56 24.6% 54 26.7% 58 218
Puysegur Point AWS 25.2% 33 25.4% 34 21.0% 28 28.4% 37 132
Invercargill Aero 27.5% 13 24.2% 12 16.0% 8 32.3% 15 48
Gore AWS 22.7% 3 23.6% 4 19.0% 3 34.7% 5 15
Lumsden AWS 23.7% 3 22.5% 3 12.7% 2 41.1% 5 13
Manapouri Aero AWS 35.0% 1 17.3% 0.5 9.4% 0.3 38.3% 1 3
Milford Sound AWS 10.0% 0.2 24.8% 0.4 35.4% 0.6 29.8% 0.5 2
15
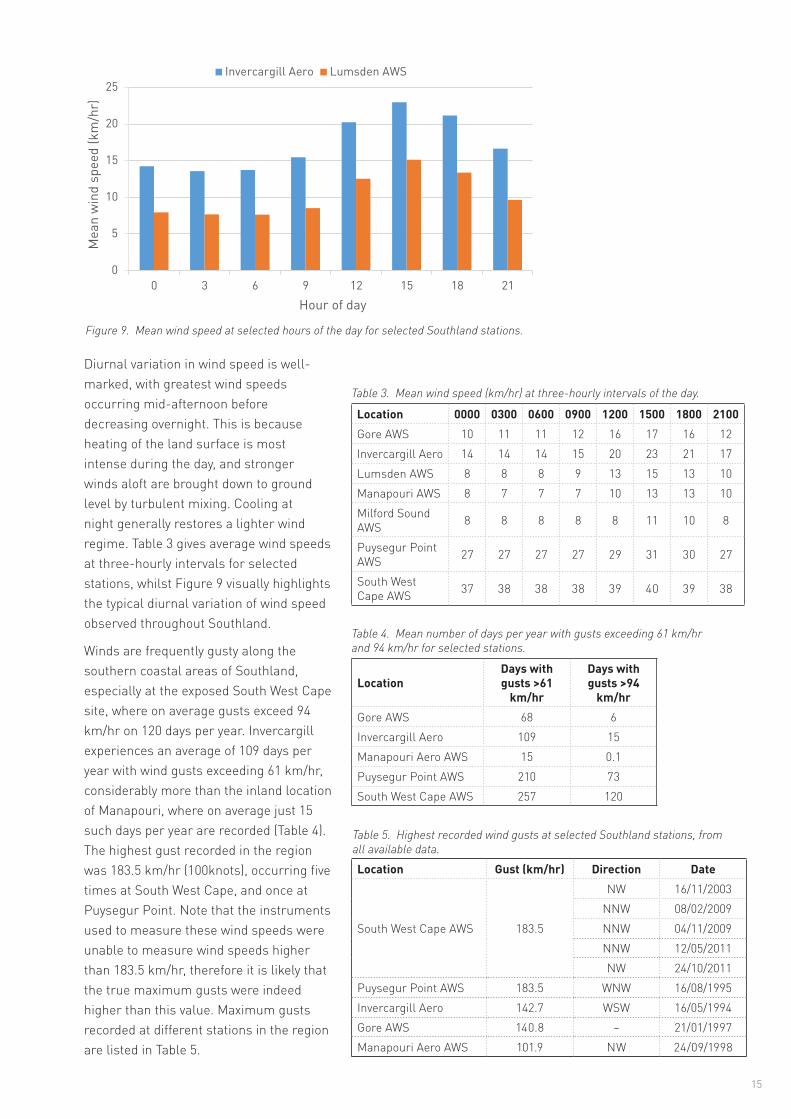
Figure 9. Mean wind speed at selected hours of the day for selected Southland stations.
Table 3. Mean wind speed (km/hr) at three-hourly intervals of the day.
Table 4. Mean number of days per year with gusts exceeding 61 km/hr and 94 km/hr for selected stations.
Table 5. Highest recorded wind gusts at selected Southland stations, from all available data.
Diurnal variation in wind speed is well-marked, with greatest wind speeds occurring mid-afternoon before decreasing overnight. This is because heating of the land surface is most intense during the day, and stronger winds aloft are brought down to ground level by turbulent mixing. Cooling at night generally restores a lighter wind regime. Table 3 gives average wind speeds at three-hourly intervals for selected stations, whilst Figure 9 visually highlights the typical diurnal variation of wind speed observed throughout Southland.
Winds are frequently gusty along the southern coastal areas of Southland, especially at the exposed South West Cape site, where on average gusts exceed 94 km/hr on 120 days per year. Invercargill experiences an average of 109 days per year with wind gusts exceeding 61 km/hr, considerably more than the inland location of Manapouri, where on average just 15 such days per year are recorded (Table 4). The highest gust recorded in the region was 183.5 km/hr (100knots), occurring five times at South West Cape, and once at Puysegur Point. Note that the instruments used to measure these wind speeds were unable to measure wind speeds higher than 183.5 km/hr, therefore it is likely that the true maximum gusts were indeed higher than this value. Maximum gusts recorded at different stations in the region are listed in Table 5.
0
5
10
15
20
25
0 3 6 9 12 15 18 21
Mea
n w
ind
spee
d (k
m/h
r)
Hour of day
Invercargill Aero Lumsden AWS
Location 0000 0300 0600 0900 1200 1500 1800 2100Gore AWS 10 11 11 12 16 17 16 12Invercargill Aero 14 14 14 15 20 23 21 17Lumsden AWS 8 8 8 9 13 15 13 10Manapouri AWS 8 7 7 7 10 13 13 10Milford Sound AWS 8 8 8 8 8 11 10 8
Puysegur Point AWS 27 27 27 27 29 31 30 27
South West Cape AWS 37 38 38 38 39 40 39 38
LocationDays with gusts >61
km/hr
Days with gusts >94
km/hrGore AWS 68 6Invercargill Aero 109 15Manapouri Aero AWS 15 0.1Puysegur Point AWS 210 73South West Cape AWS 257 120
Location Gust (km/hr) Direction Date
South West Cape AWS 183.5
NW 16/11/2003NNW 08/02/2009NNW 04/11/2009NNW 12/05/2011NW 24/10/2011
Puysegur Point AWS 183.5 WNW 16/08/1995Invercargill Aero 142.7 WSW 16/05/1994Gore AWS 140.8 ~ 21/01/1997Manapouri Aero AWS 101.9 NW 24/09/1998
16
Rainfall
Rainfall distribution
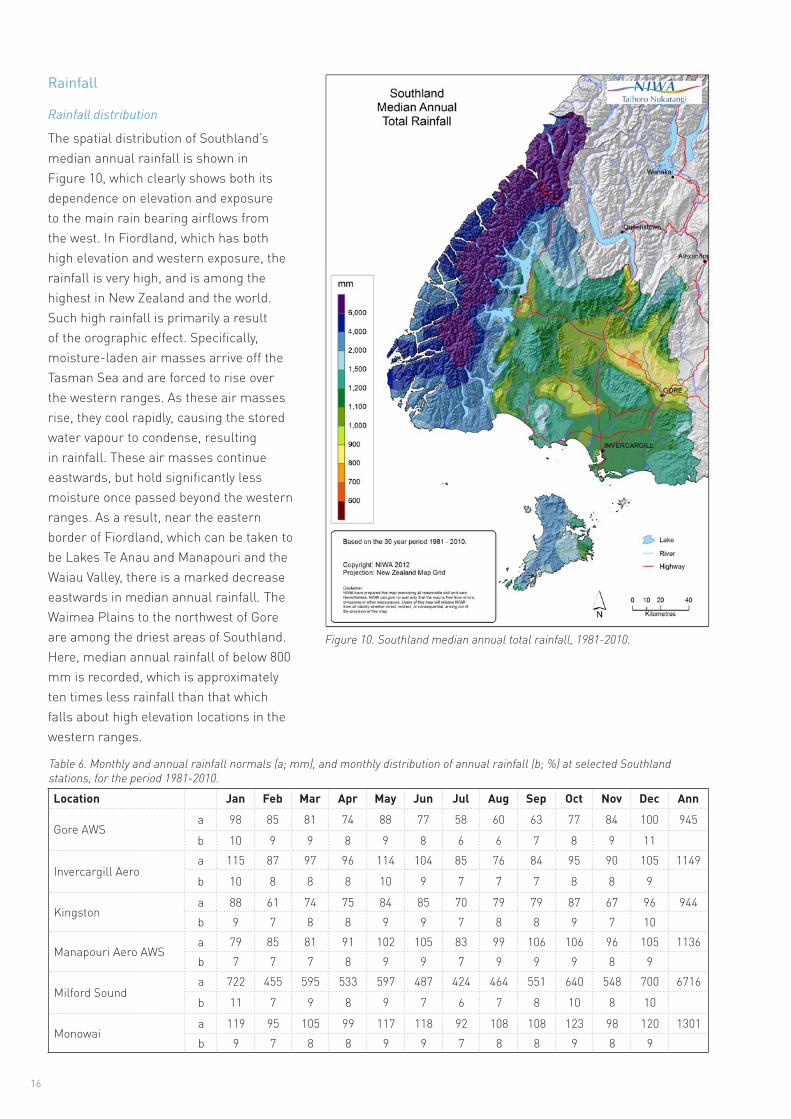
The spatial distribution of Southland’s median annual rainfall is shown in Figure 10, which clearly shows both its dependence on elevation and exposure to the main rain bearing airflows from the west. In Fiordland, which has both high elevation and western exposure, the rainfall is very high, and is among the highest in New Zealand and the world. Such high rainfall is primarily a result of the orographic effect. Specifically, moisture-laden air masses arrive off the Tasman Sea and are forced to rise over the western ranges. As these air masses rise, they cool rapidly, causing the stored water vapour to condense, resulting in rainfall. These air masses continue eastwards, but hold significantly less moisture once passed beyond the western ranges. As a result, near the eastern border of Fiordland, which can be taken to be Lakes Te Anau and Manapouri and the Waiau Valley, there is a marked decrease eastwards in median annual rainfall. The Waimea Plains to the northwest of Gore are among the driest areas of Southland. Here, median annual rainfall of below 800 mm is recorded, which is approximately ten times less rainfall than that which falls about high elevation locations in the western ranges.
Table 6. Monthly and annual rainfall normals (a; mm), and monthly distribution of annual rainfall (b; %) at selected Southland stations, for the period 1981-2010.
Location Jan Feb Mar Apr May Jun Jul Aug Sep Oct Nov Dec Ann
Gore AWSa 98 85 81 74 88 77 58 60 63 77 84 100 945
b 10 9 9 8 9 8 6 6 7 8 9 11
Invercargill Aeroa 115 87 97 96 114 104 85 76 84 95 90 105 1149
b 10 8 8 8 10 9 7 7 7 8 8 9
Kingstona 88 61 74 75 84 85 70 79 79 87 67 96 944b 9 7 8 8 9 9 7 8 8 9 7 10
Manapouri Aero AWSa 79 85 81 91 102 105 83 99 106 106 96 105 1136b 7 7 7 8 9 9 7 9 9 9 8 9
Milford Sounda 722 455 595 533 597 487 424 464 551 640 548 700 6716
b 11 7 9 8 9 7 6 7 8 10 8 10
Monowaia 119 95 105 99 117 118 92 108 108 123 98 120 1301b 9 7 8 8 9 9 7 8 8 9 8 9
Figure 10. Southland median annual total rainfall, 1981-2010.
Gore AWS
Rain
fall
(mm
)Ra
infa
ll (m
m)
Rain
fall
(mm
)Ra
infa
ll (m
m)
Rain
fall
(mm
)
050
100
150
200
250
300
Invercargill Aero
050
100
150
200
250
300
Kingston
050
100
150
200
250
300
Manapouri Aero AWS
050
100
150
200
250
300
Milford Sound
040
080
012
0016
0020
00
J F M A M J J A S O DN J F M A M J J A S O DN J F M A M J J A S O DN
J F M A M J J A S O DN J F M A M J J A S O DN
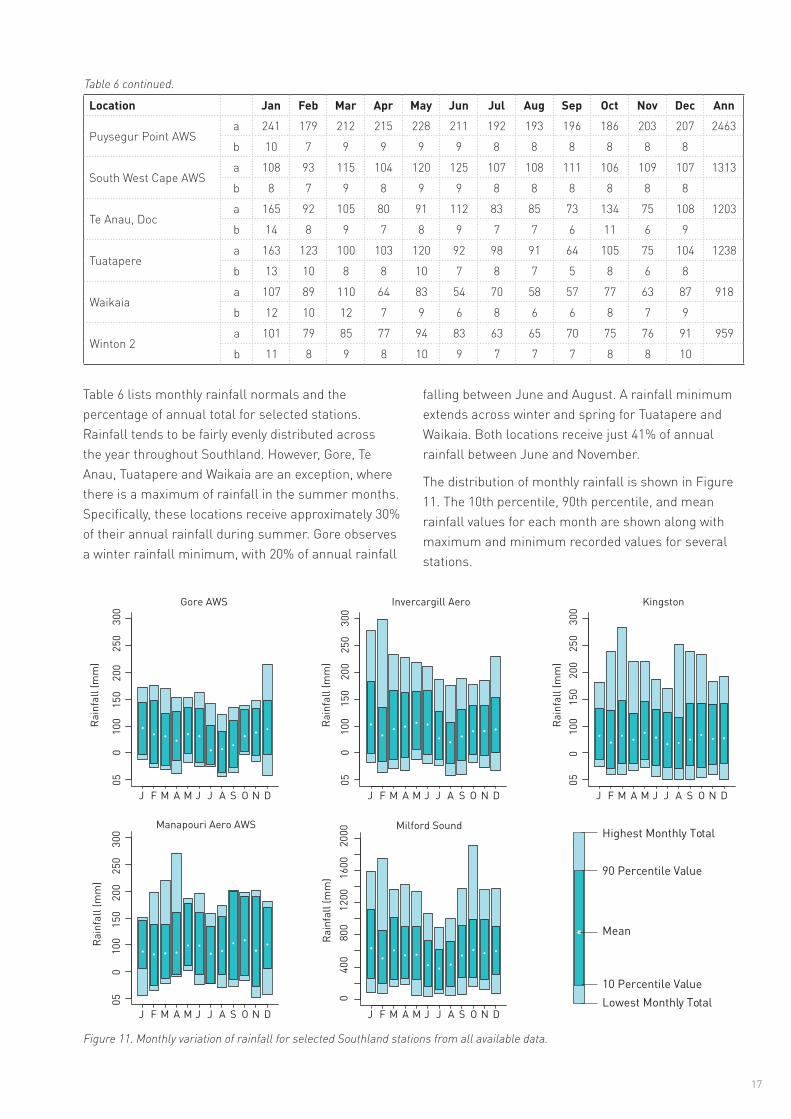
Table 6 lists monthly rainfall normals and the percentage of annual total for selected stations. Rainfall tends to be fairly evenly distributed across the year throughout Southland. However, Gore, Te Anau, Tuatapere and Waikaia are an exception, where there is a maximum of rainfall in the summer months. Specifically, these locations receive approximately 30% of their annual rainfall during summer. Gore observes a winter rainfall minimum, with 20% of annual rainfall
Mean
Lowest Monthly Total
90 Percentile Value
10 Percentile Value
Highest Monthly Total
falling between June and August. A rainfall minimum extends across winter and spring for Tuatapere and Waikaia. Both locations receive just 41% of annual rainfall between June and November.
The distribution of monthly rainfall is shown in Figure 11. The 10th percentile, 90th percentile, and mean rainfall values for each month are shown along with maximum and minimum recorded values for several stations.
17
Table 6 continued.
Location Jan Feb Mar Apr May Jun Jul Aug Sep Oct Nov Dec Ann
Puysegur Point AWSa 241 179 212 215 228 211 192 193 196 186 203 207 2463
b 10 7 9 9 9 9 8 8 8 8 8 8
South West Cape AWSa 108 93 115 104 120 125 107 108 111 106 109 107 1313
b 8 7 9 8 9 9 8 8 8 8 8 8
Te Anau, Doca 165 92 105 80 91 112 83 85 73 134 75 108 1203
b 14 8 9 7 8 9 7 7 6 11 6 9
Tuataperea 163 123 100 103 120 92 98 91 64 105 75 104 1238
b 13 10 8 8 10 7 8 7 5 8 6 8
Waikaiaa 107 89 110 64 83 54 70 58 57 77 63 87 918
b 12 10 12 7 9 6 8 6 6 8 7 9
Winton 2a 101 79 85 77 94 83 63 65 70 75 76 91 959
b 11 8 9 8 10 9 7 7 7 8 8 10
Figure 11. Monthly variation of rainfall for selected Southland stations from all available data.
Rainfall frequency and intensity
The average number of days each year on which 0.1 mm or more of rain is recorded (a rain day) varies from 116 days at Kingston to 269 days at South West Cape. Kingston also exhibits the lowest number of wet days (> 1.0 mm of rain) in the region, with 97 wet days recorded there on average, compared with in excess of 200 at South West Cape and Puysegur Point. Table 10 lists the average number of days per month with 0.1 mm and 1 mm of rain for selected stations. The number of rain and wet days recorded at a given station tends to increase as distance to the coast decreases. As such, inland locations experience fewer rain and wet days than coastal locations. The seasonal variation of rain days and wet days in Southland is relatively small. Therefore, the winter minimum of rainfall observed in some areas of Southland may be largely attributed to there being fewer heavy falls of rain, as opposed to fewer actual days of rain.
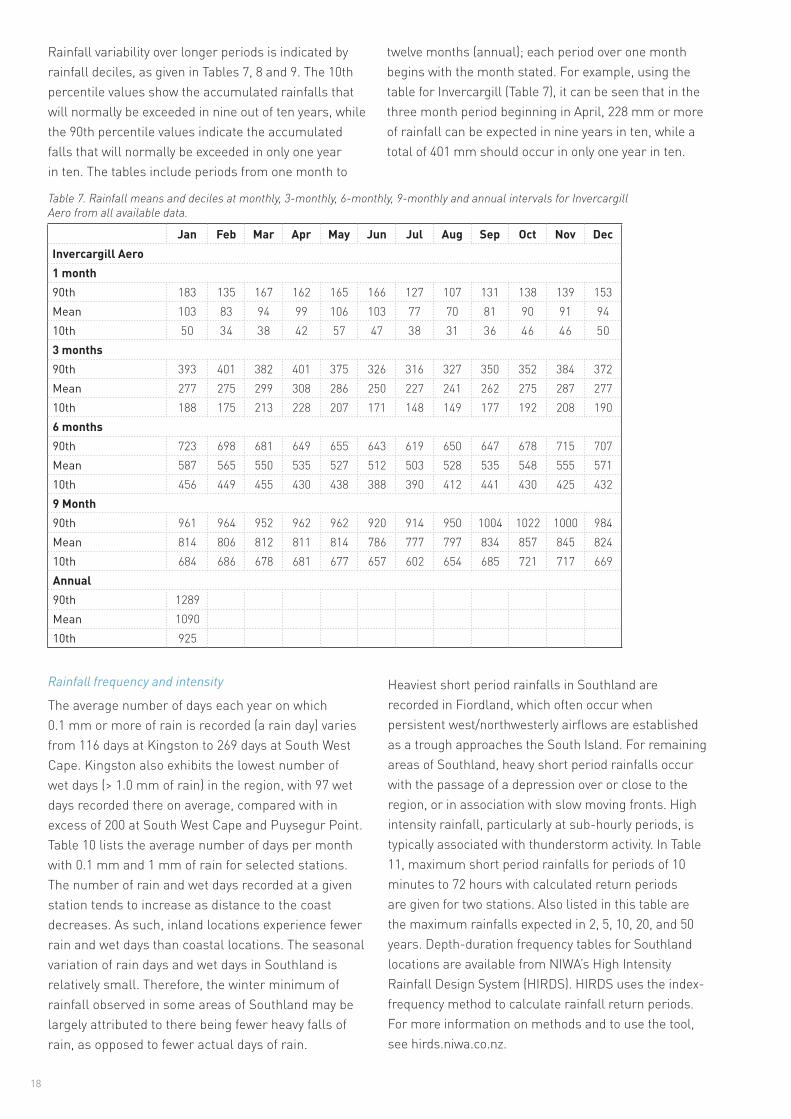
Rainfall variability over longer periods is indicated by rainfall deciles, as given in Tables 7, 8 and 9. The 10th percentile values show the accumulated rainfalls that will normally be exceeded in nine out of ten years, while the 90th percentile values indicate the accumulated falls that will normally be exceeded in only one year in ten. The tables include periods from one month to
twelve months (annual); each period over one month begins with the month stated. For example, using the table for Invercargill (Table 7), it can be seen that in the three month period beginning in April, 228 mm or more of rainfall can be expected in nine years in ten, while a total of 401 mm should occur in only one year in ten.
Heaviest short period rainfalls in Southland are recorded in Fiordland, which often occur when persistent west/northwesterly airflows are established as a trough approaches the South Island. For remaining areas of Southland, heavy short period rainfalls occur with the passage of a depression over or close to the region, or in association with slow moving fronts. High intensity rainfall, particularly at sub-hourly periods, is typically associated with thunderstorm activity. In Table 11, maximum short period rainfalls for periods of 10 minutes to 72 hours with calculated return periods are given for two stations. Also listed in this table are the maximum rainfalls expected in 2, 5, 10, 20, and 50 years. Depth-duration frequency tables for Southland locations are available from NIWA’s High Intensity Rainfall Design System (HIRDS). HIRDS uses the index-frequency method to calculate rainfall return periods. For more information on methods and to use the tool, see hirds.niwa.co.nz.
18
Table 7. Rainfall means and deciles at monthly, 3-monthly, 6-monthly, 9-monthly and annual intervals for Invercargill Aero from all available data.
Jan Feb Mar Apr May Jun Jul Aug Sep Oct Nov DecInvercargill Aero1 month90th 183 135 167 162 165 166 127 107 131 138 139 153Mean 103 83 94 99 106 103 77 70 81 90 91 9410th 50 34 38 42 57 47 38 31 36 46 46 503 months90th 393 401 382 401 375 326 316 327 350 352 384 372Mean 277 275 299 308 286 250 227 241 262 275 287 27710th 188 175 213 228 207 171 148 149 177 192 208 1906 months90th 723 698 681 649 655 643 619 650 647 678 715 707Mean 587 565 550 535 527 512 503 528 535 548 555 57110th 456 449 455 430 438 388 390 412 441 430 425 4329 Month90th 961 964 952 962 962 920 914 950 1004 1022 1000 984Mean 814 806 812 811 814 786 777 797 834 857 845 82410th 684 686 678 681 677 657 602 654 685 721 717 669Annual90th 1289Mean 109010th 925
19
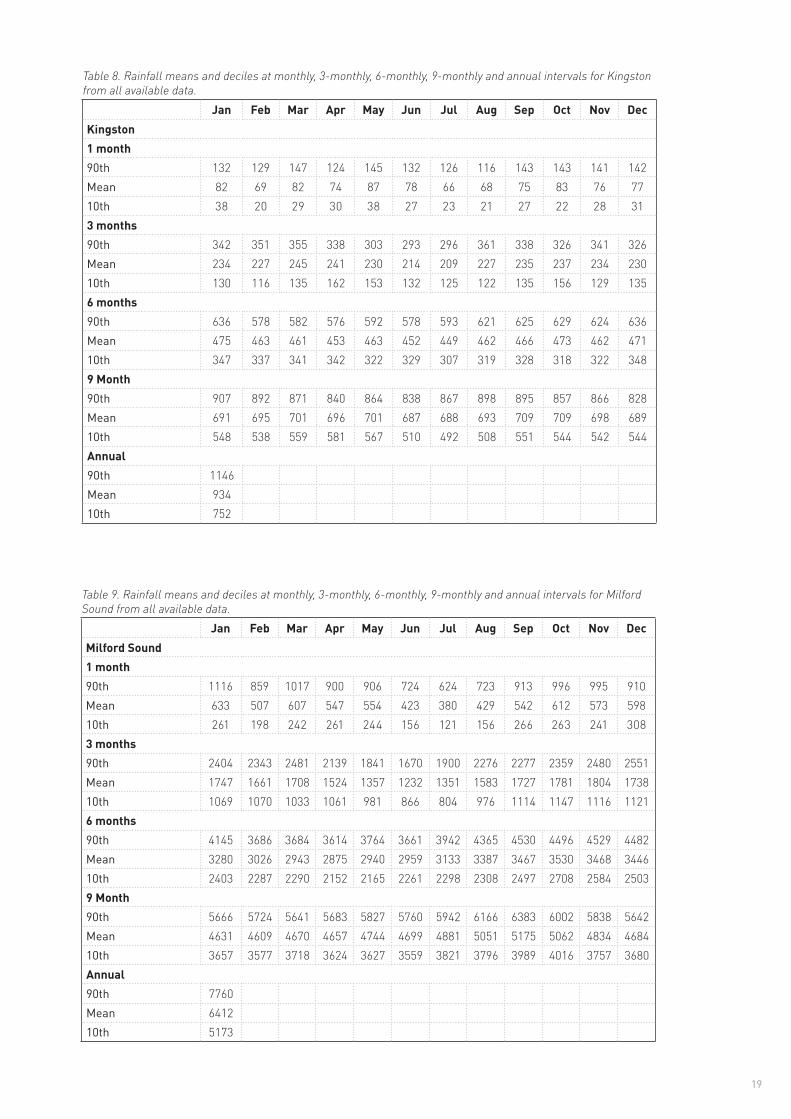
Table 8. Rainfall means and deciles at monthly, 3-monthly, 6-monthly, 9-monthly and annual intervals for Kingston from all available data.
Table 9. Rainfall means and deciles at monthly, 3-monthly, 6-monthly, 9-monthly and annual intervals for Milford Sound from all available data.
Jan Feb Mar Apr May Jun Jul Aug Sep Oct Nov DecKingston1 month90th 132 129 147 124 145 132 126 116 143 143 141 142Mean 82 69 82 74 87 78 66 68 75 83 76 7710th 38 20 29 30 38 27 23 21 27 22 28 313 months90th 342 351 355 338 303 293 296 361 338 326 341 326Mean 234 227 245 241 230 214 209 227 235 237 234 23010th 130 116 135 162 153 132 125 122 135 156 129 1356 months90th 636 578 582 576 592 578 593 621 625 629 624 636Mean 475 463 461 453 463 452 449 462 466 473 462 47110th 347 337 341 342 322 329 307 319 328 318 322 3489 Month90th 907 892 871 840 864 838 867 898 895 857 866 828Mean 691 695 701 696 701 687 688 693 709 709 698 68910th 548 538 559 581 567 510 492 508 551 544 542 544Annual90th 1146Mean 93410th 752
Jan Feb Mar Apr May Jun Jul Aug Sep Oct Nov DecMilford Sound1 month90th 1116 859 1017 900 906 724 624 723 913 996 995 910Mean 633 507 607 547 554 423 380 429 542 612 573 59810th 261 198 242 261 244 156 121 156 266 263 241 3083 months90th 2404 2343 2481 2139 1841 1670 1900 2276 2277 2359 2480 2551Mean 1747 1661 1708 1524 1357 1232 1351 1583 1727 1781 1804 173810th 1069 1070 1033 1061 981 866 804 976 1114 1147 1116 11216 months90th 4145 3686 3684 3614 3764 3661 3942 4365 4530 4496 4529 4482Mean 3280 3026 2943 2875 2940 2959 3133 3387 3467 3530 3468 344610th 2403 2287 2290 2152 2165 2261 2298 2308 2497 2708 2584 25039 Month90th 5666 5724 5641 5683 5827 5760 5942 6166 6383 6002 5838 5642Mean 4631 4609 4670 4657 4744 4699 4881 5051 5175 5062 4834 468410th 3657 3577 3718 3624 3627 3559 3821 3796 3989 4016 3757 3680Annual90th 7760Mean 641210th 5173

20
Table 10. Average monthly rain days (a; days where at least 0.1 mm rainfall is measured) and wet days (b; days where at least 1 mm rainfall recorded is measured) at selected Southland stations.
Table 11. Maximum recorded short period rainfalls and calculated return periods from HIRDS.
Location 10min 20min 30min 1hr 2hrs 6hrs 12hrs 24hrs 48hrs 72hrsInvercargill Aero a 13.9 21.1 22.5 26.6 36.5 53.1 96.8 134.4 142.6 143.2
b Feb 1989
Feb 1989
Feb 1989
Dec 1993
Nov 1962
Jan 1984
Jan 1984
Jan 1984
Jan 1984
Jan 1984
c 67 94 60 36 45 42 100+ 100+ 100+ 100d 4.7 6.5 7.8 10.8 15 25.5 35.6 49.7 61.9 70.3e 6.5 8.9 10.8 14.9 20.2 32.7 44.4 60.2 74.9 85.1f 8 11.1 13.3 18.4 24.5 38.5 51.3 68.3 84.9 96.5g 9.8 13.6 16.4 22.6 29.5 45.1 58.9 77 95.8 108.9h 12.8 17.7 21.3 29.4 37.5 55.3 70.6 90.1 112.1 127.4
Milford Sound a 30.8 33.3 43.9 53 89.9 234.9 368.1 537.5 651.4 741.4
bJan 1991
Jan 1991
Sep 1991
Sep 1991
Mar 1978
Mar 1978
Mar 1978
Jan 1994
Jan 1994
Jan 1983
c 97 22 21 8 10 37 44 37 24 21d 10.5 16.8 22.1 35.2 57.2 123.6 200.9 326.5 421.5 489.4e 14.1 22.4 29.5 47.1 74.6 155 245.7 389.6 502.9 583.9f 17 27.2 35.8 57.1 89 180 280.8 437.9 565.3 656.3g 20.5 32.7 43 68.6 105.3 207.8 319.1 489.9 632.4 734.2h 26 41.5 54.6 87.1 131 250.3 376.5 566.4 731.1 848.9
Location Jan Feb Mar Apr May Jun Jul Aug Sep Oct Nov Dec Ann
Gore AWSa 16 13 15 16 19 20 17 16 16 19 18 17 202
b 12 10 11 11 12 14 10 10 11 13 13 13 141
Invercargill Aeroa 17 15 17 18 20 20 19 17 17 18 18 18 213b 13 11 13 13 15 15 14 12 13 13 13 13 157
Kingstona 9 8 10 9 11 11 9 9 9 10 10 10 116b 8 7 8 8 9 9 7 8 8 9 9 9 97
Lumsden AWSa 14 12 14 15 18 20 18 17 15 17 15 16 192b 10 8 9 10 11 12 9 10 11 13 11 12 126
Manapouri Aero AWSa 12 11 12 16 19 21 20 20 17 16 14 14 192b 9 8 9 10 12 13 11 11 13 12 10 11 129
Milford Sounda 17 15 16 16 17 16 16 17 18 19 18 18 203b 16 13 15 15 15 14 14 15 17 18 16 16 184
Monowaia 13 12 13 14 15 16 15 15 15 15 14 14 170b 10 9 10 11 12 13 11 11 12 12 11 11 134
Puysegur Point AWSa 20 18 21 22 25 24 22 24 23 24 23 20 265b 17 15 18 19 21 21 19 21 20 21 20 17 228
South West Cape AWSa 20 17 21 22 25 25 25 25 23 23 23 20 269b 15 13 16 15 19 20 19 19 17 18 17 15 203
Te Anau, Doca 13 10 11 11 13 14 14 13 12 14 11 13 149b 11 8 9 9 11 11 11 10 10 11 10 10 120
Winton 2a 14 11 14 15 17 16 15 14 15 16 14 14 175b 11 9 11 11 13 13 11 10 12 12 11 12 136
a: highest fall recorded (mm)b: month and year of occurrencec: calculated return period of a (years)d: max fall calculated with ARI 2 years (mm)e: max fall calculated with ARI 5 years (mm)f: max fall calculated with ARI 10 years (mm)g: max fall calculated with ARI 20 years (mm)h: max fall calculated with ARI 50 years (mm)
21
Recent extreme events in Southland
Southland has experienced numerous extreme weather events, with significant damage and disruption caused by heavy rain and flooding. The events listed below are some of the most severe rainfall and flooding events to have affected the Southland region between 1983 and 2013.
26 – 28 January 1984: A deep depression of 980 hPa centred to the southwest of the South Island and a high pressure system of 1020 hPa centred over the north of the North Island created a northwesterly flow over Southland, which was noted as being particularly humid given Southland’s latitude (Riddell, 1984). Continuous rainfall lasted between 12 and 18 hours across Southland, with peak intensities recorded between 1 a.m. and 4 a.m. on Friday 27 January (Riddell, 1984). Many areas in Southland recorded at least 100 mm of rain, with 24 hour rainfall totals exceeding 130 mm for 13 sites on the Southland plains. Parts of Southland experienced severe flooding, causing the evacuation of about 5000 people from their homes. A state of emergency was declared in Invercargill at 4.00 a.m. on Friday 27 January, which was extended to cover the entire province later that day. Flooding caused severe disruption to transport, phone and power services, and for a brief time, the province’s only link to the rest of the country was by air. Invercargill airport was closed, with floodwaters there in excess of 2.5 m deep. The Waihopai River reached 112 times its mean flow at 280 cumecs, four to five times higher than any flood previously witnessed (Riddell, 1984). There was considerable loss of livestock and damage to infrastructure across the region. Approximately $55 million was paid out in insurance claims, which at that time was the costliest natural disaster in New Zealand since the 1931 Napier earthquake.
14 – 18 November 1999: Heavy rain was caused by a front that stalled over the area as a broad, active trough approached from the Tasman Sea. A blocking ridge lay over and east of the North Island. The original frontal cloud band remained almost stationary over Fiordland for two-and-a-half days. The Oreti and Mataura Rivers reached record levels. Surface flooding and slips closed more than 50 roads throughout the region. Milford Sound recorded a peak rainfall of 326 mm in 24 hours, and 651 mm of rain in three days.
24 – 27 April 2010: Heavy rainfall caused flooding on all major Southland rivers. Rainfall totals in parts of northern Southland from early on 25 April to midday on 26 April were around 200 mm. Southland’s Civil Defence emergency operations centre was activated. Numerous road closures occurred due to surface flooding. The Telecom fibre-optic connection out of Te Anau was severed when part of the road near Whitestone Bridge was washed away. Dumpling Hut, on the Milford Track, received 739 mm of rain in three days ending 8 a.m. on 26 April. 120 trampers were evacuated from the Milford Track by helicopter. The trampers (40 each at three separate huts) had spent two nights safely inside huts but food was running low, prompting the evacuation.
Periods of low rainfall
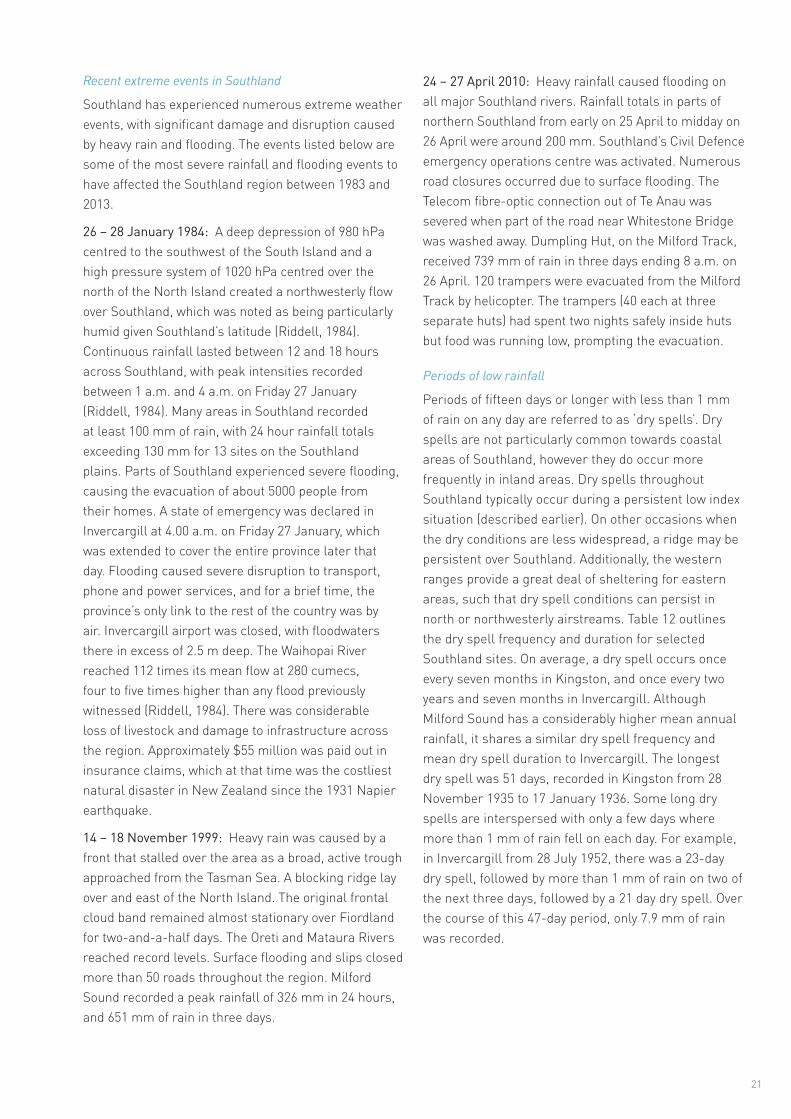
Periods of fifteen days or longer with less than 1 mm of rain on any day are referred to as ‘dry spells’. Dry spells are not particularly common towards coastal areas of Southland, however they do occur more frequently in inland areas. Dry spells throughout Southland typically occur during a persistent low index situation (described earlier). On other occasions when the dry conditions are less widespread, a ridge may be persistent over Southland. Additionally, the western ranges provide a great deal of sheltering for eastern areas, such that dry spell conditions can persist in north or northwesterly airstreams. Table 12 outlines the dry spell frequency and duration for selected Southland sites. On average, a dry spell occurs once every seven months in Kingston, and once every two years and seven months in Invercargill. Although Milford Sound has a considerably higher mean annual rainfall, it shares a similar dry spell frequency and mean dry spell duration to Invercargill. The longest dry spell was 51 days, recorded in Kingston from 28 November 1935 to 17 January 1936. Some long dry spells are interspersed with only a few days where more than 1 mm of rain fell on each day. For example, in Invercargill from 28 July 1952, there was a 23-day dry spell, followed by more than 1 mm of rain on two of the next three days, followed by a 21 day dry spell. Over the course of this 47-day period, only 7.9 mm of rain was recorded.
0
2
4
6
8
10
12
14
16
Jan Feb Mar Apr May Jun Jul Aug Sep Oct Nov Dec
Tem
pera
ture
(°C)
Month
Manapouri air temp Invercargill air temp Sea surface temp
22
Table 12. Dry spell (at least 15 consecutive days with less than 1 mm rainfall per day) frequency and duration for selected Southland stations, from all available data.
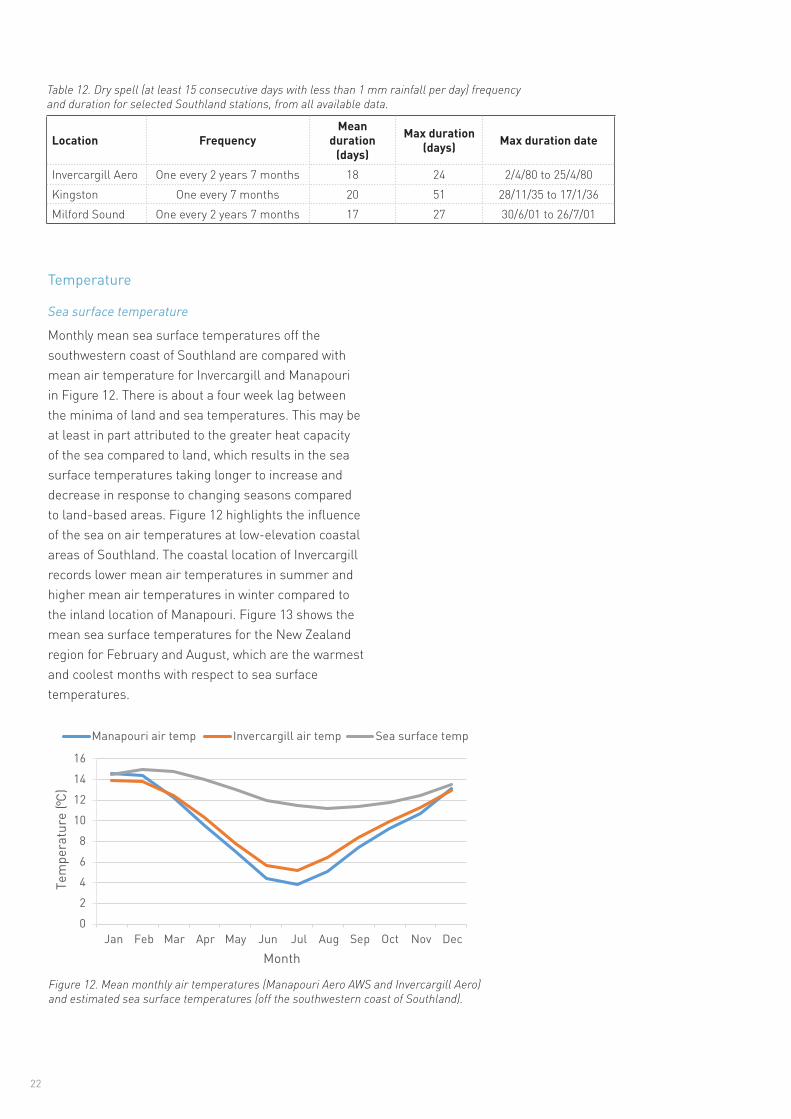
Figure 12. Mean monthly air temperatures (Manapouri Aero AWS and Invercargill Aero) and estimated sea surface temperatures (off the southwestern coast of Southland).
Location FrequencyMean
duration (days)
Max duration (days) Max duration date
Invercargill Aero One every 2 years 7 months 18 24 2/4/80 to 25/4/80Kingston One every 7 months 20 51 28/11/35 to 17/1/36Milford Sound One every 2 years 7 months 17 27 30/6/01 to 26/7/01
Temperature
Sea surface temperature
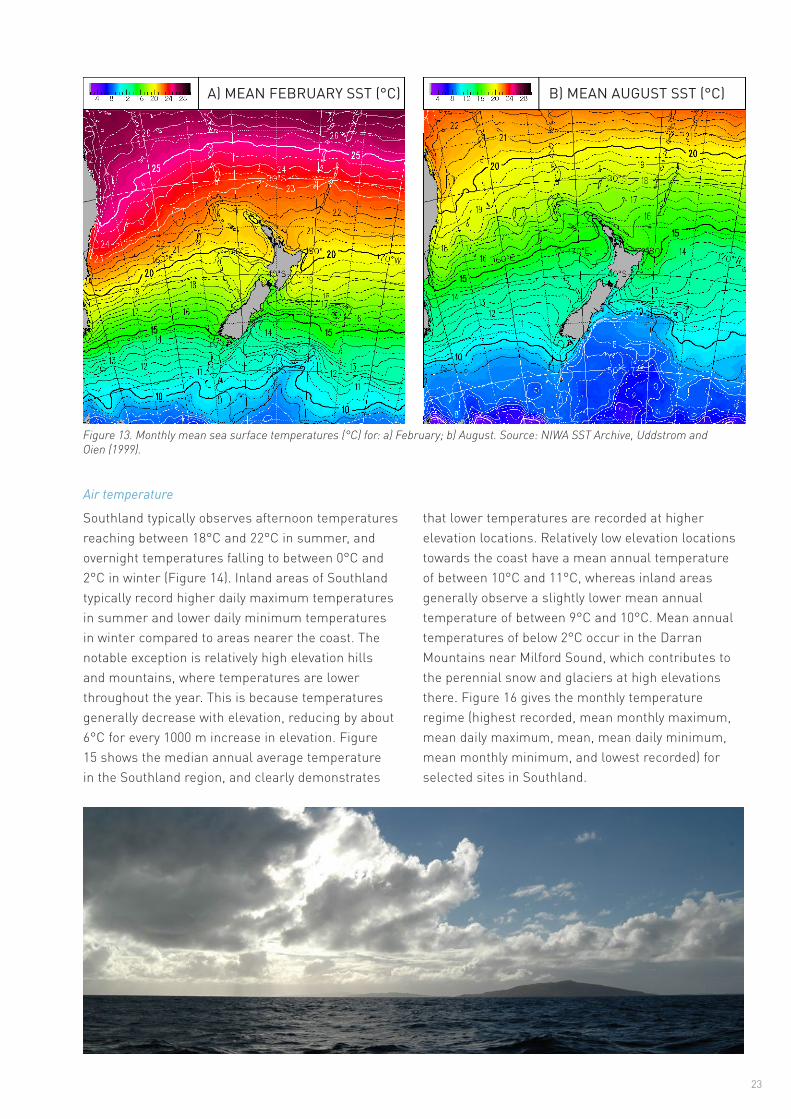
Monthly mean sea surface temperatures off the southwestern coast of Southland are compared with mean air temperature for Invercargill and Manapouri in Figure 12. There is about a four week lag between the minima of land and sea temperatures. This may be at least in part attributed to the greater heat capacity of the sea compared to land, which results in the sea surface temperatures taking longer to increase and decrease in response to changing seasons compared to land-based areas. Figure 12 highlights the influence of the sea on air temperatures at low-elevation coastal areas of Southland. The coastal location of Invercargill records lower mean air temperatures in summer and higher mean air temperatures in winter compared to the inland location of Manapouri. Figure 13 shows the mean sea surface temperatures for the New Zealand region for February and August, which are the warmest and coolest months with respect to sea surface temperatures.
23
Figure 13. Monthly mean sea surface temperatures (°C) for: a) February; b) August. Source: NIWA SST Archive, Uddstrom and Oien (1999).
A) MEAN FEBRUARY SST (°C) B) MEAN AUGUST SST (°C)
Air temperature
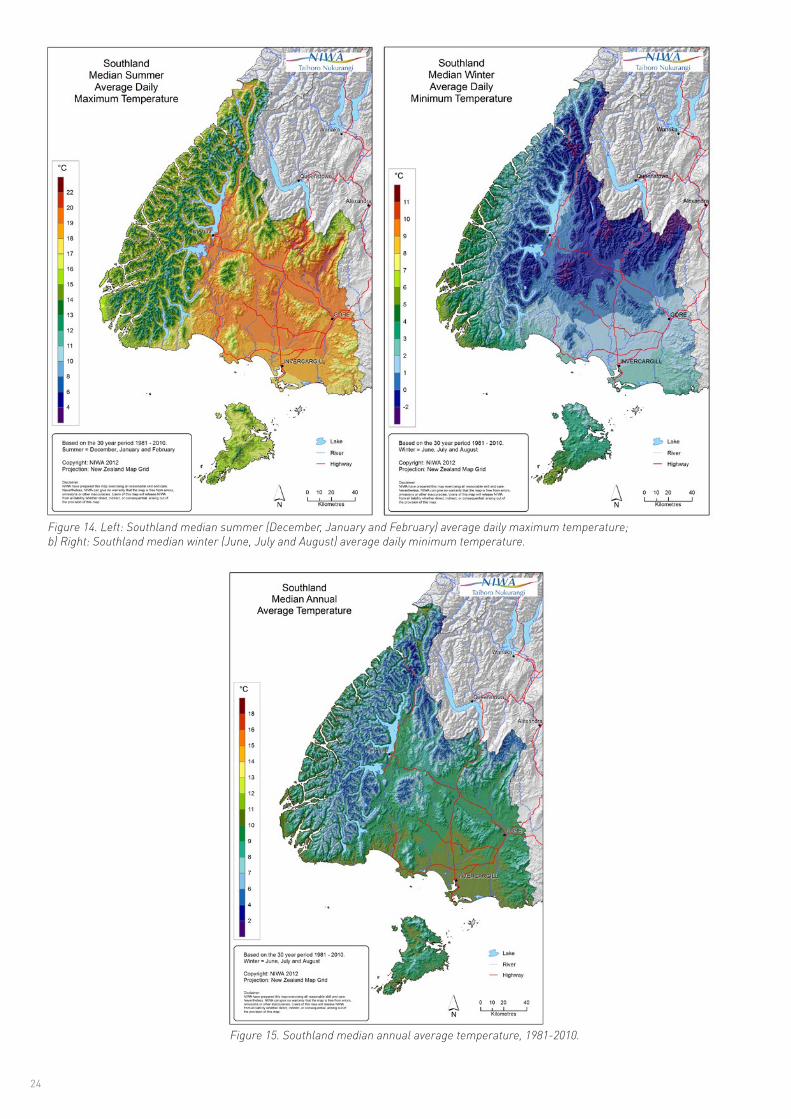
Southland typically observes afternoon temperatures reaching between 18°C and 22°C in summer, and overnight temperatures falling to between 0°C and 2°C in winter (Figure 14). Inland areas of Southland typically record higher daily maximum temperatures in summer and lower daily minimum temperatures in winter compared to areas nearer the coast. The notable exception is relatively high elevation hills and mountains, where temperatures are lower throughout the year. This is because temperatures generally decrease with elevation, reducing by about 6°C for every 1000 m increase in elevation. Figure 15 shows the median annual average temperature in the Southland region, and clearly demonstrates
that lower temperatures are recorded at higher elevation locations. Relatively low elevation locations towards the coast have a mean annual temperature of between 10°C and 11°C, whereas inland areas generally observe a slightly lower mean annual temperature of between 9°C and 10°C. Mean annual temperatures of below 2°C occur in the Darran Mountains near Milford Sound, which contributes to the perennial snow and glaciers at high elevations there. Figure 16 gives the monthly temperature regime (highest recorded, mean monthly maximum, mean daily maximum, mean, mean daily minimum, mean monthly minimum, and lowest recorded) for selected sites in Southland.
24
Figure 14. Left: Southland median summer (December, January and February) average daily maximum temperature; b) Right: Southland median winter (June, July and August) average daily minimum temperature.
Figure 15. Southland median annual average temperature, 1981-2010.
Gore AWS
−10
50
1015
2025
3035
−10
50
1015
2025
3035
−10
50
1015
2025
3035
−10
50
1015
2025
3035
−10
50
1015
2025
3035
Invercargill Aero Lumsden AWS
Manapouri Aero AWS Milford Sound
Tem
pera
ture
(0 C)
Tem
pera
ture
(0 C)
Tem
pera
ture
(0 C)
Tem
pera
ture
(0 C)
Tem
pera
ture
(0 C)
J F M A M J J A S O DN J F M A M J J A S O DN J F M A M J J A S O DN
J F M A M J J A S O DNJ F M A M J J A S O DN
25
Highest Recorded
Mean
Mean Daily Maximum
Mean Daily Minimum
Mean Monthly Minimum
Mean Monthly Maximum
Lowest Recorded
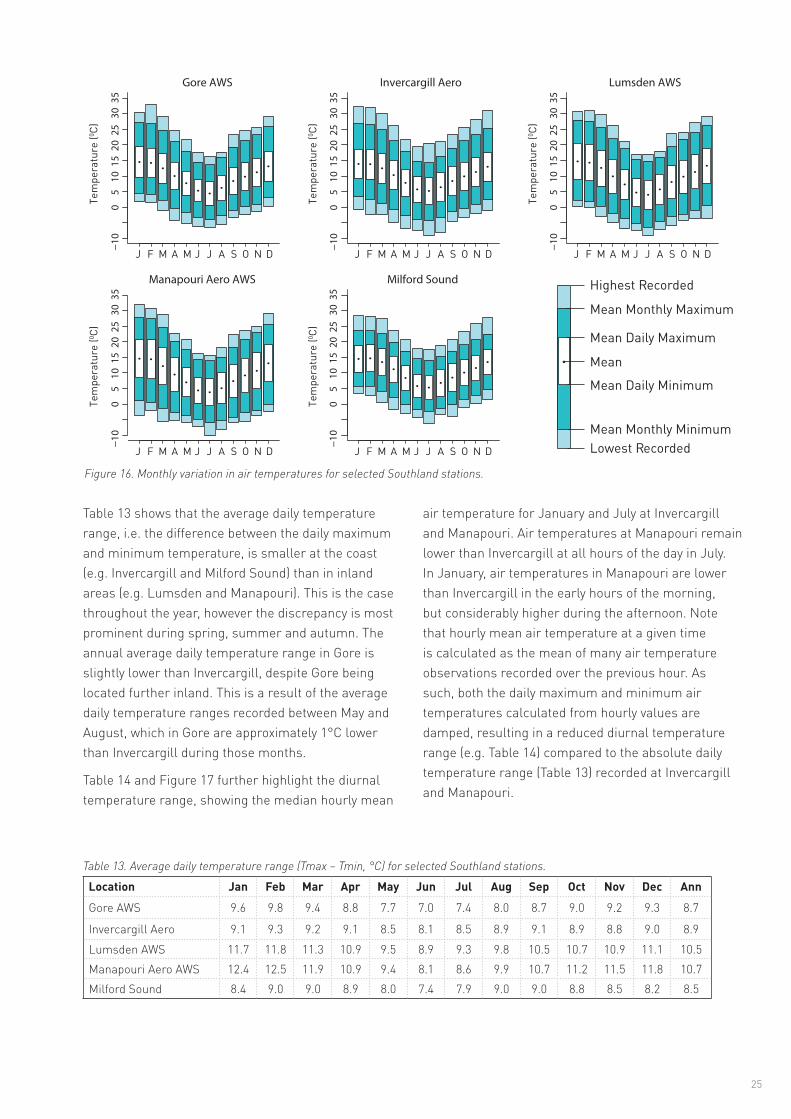
Figure 16. Monthly variation in air temperatures for selected Southland stations.
Table 13. Average daily temperature range (Tmax – Tmin, °C) for selected Southland stations.
Table 13 shows that the average daily temperature range, i.e. the difference between the daily maximum and minimum temperature, is smaller at the coast (e.g. Invercargill and Milford Sound) than in inland areas (e.g. Lumsden and Manapouri). This is the case throughout the year, however the discrepancy is most prominent during spring, summer and autumn. The annual average daily temperature range in Gore is slightly lower than Invercargill, despite Gore being located further inland. This is a result of the average daily temperature ranges recorded between May and August, which in Gore are approximately 1°C lower than Invercargill during those months.
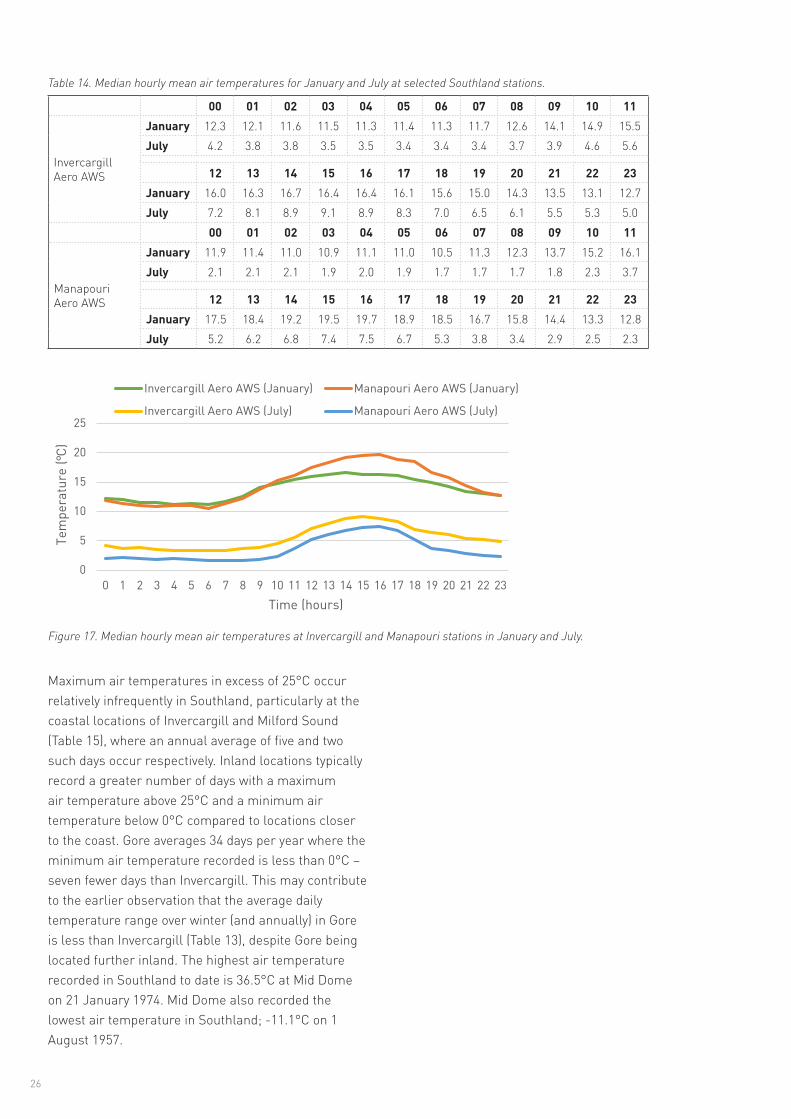
Table 14 and Figure 17 further highlight the diurnal temperature range, showing the median hourly mean
air temperature for January and July at Invercargill and Manapouri. Air temperatures at Manapouri remain lower than Invercargill at all hours of the day in July. In January, air temperatures in Manapouri are lower than Invercargill in the early hours of the morning, but considerably higher during the afternoon. Note that hourly mean air temperature at a given time is calculated as the mean of many air temperature observations recorded over the previous hour. As such, both the daily maximum and minimum air temperatures calculated from hourly values are damped, resulting in a reduced diurnal temperature range (e.g. Table 14) compared to the absolute daily temperature range (Table 13) recorded at Invercargill and Manapouri.
Location Jan Feb Mar Apr May Jun Jul Aug Sep Oct Nov Dec AnnGore AWS 9.6 9.8 9.4 8.8 7.7 7.0 7.4 8.0 8.7 9.0 9.2 9.3 8.7
Invercargill Aero 9.1 9.3 9.2 9.1 8.5 8.1 8.5 8.9 9.1 8.9 8.8 9.0 8.9Lumsden AWS 11.7 11.8 11.3 10.9 9.5 8.9 9.3 9.8 10.5 10.7 10.9 11.1 10.5Manapouri Aero AWS 12.4 12.5 11.9 10.9 9.4 8.1 8.6 9.9 10.7 11.2 11.5 11.8 10.7Milford Sound 8.4 9.0 9.0 8.9 8.0 7.4 7.9 9.0 9.0 8.8 8.5 8.2 8.5
26
Figure 17. Median hourly mean air temperatures at Invercargill and Manapouri stations in January and July.
Table 14. Median hourly mean air temperatures for January and July at selected Southland stations.
00 01 02 03 04 05 06 07 08 09 10 11
Invercargill Aero AWS
January 12.3 12.1 11.6 11.5 11.3 11.4 11.3 11.7 12.6 14.1 14.9 15.5July 4.2 3.8 3.8 3.5 3.5 3.4 3.4 3.4 3.7 3.9 4.6 5.6
12 13 14 15 16 17 18 19 20 21 22 23January 16.0 16.3 16.7 16.4 16.4 16.1 15.6 15.0 14.3 13.5 13.1 12.7July 7.2 8.1 8.9 9.1 8.9 8.3 7.0 6.5 6.1 5.5 5.3 5.0
00 01 02 03 04 05 06 07 08 09 10 11
Manapouri Aero AWS
January 11.9 11.4 11.0 10.9 11.1 11.0 10.5 11.3 12.3 13.7 15.2 16.1July 2.1 2.1 2.1 1.9 2.0 1.9 1.7 1.7 1.7 1.8 2.3 3.7
12 13 14 15 16 17 18 19 20 21 22 23January 17.5 18.4 19.2 19.5 19.7 18.9 18.5 16.7 15.8 14.4 13.3 12.8July 5.2 6.2 6.8 7.4 7.5 6.7 5.3 3.8 3.4 2.9 2.5 2.3
0
5
10
15
20
25
0 1 2 3 4 5 6 7 8 9 10 11 12 13 14 15 16 17 18 19 20 21 22 23
Tem
pera
ture
(°C)
Time (hours)
Invercargill Aero AWS (January) Manapouri Aero AWS (January)
Invercargill Aero AWS (July) Manapouri Aero AWS (July)
Maximum air temperatures in excess of 25°C occur relatively infrequently in Southland, particularly at the coastal locations of Invercargill and Milford Sound (Table 15), where an annual average of five and two such days occur respectively. Inland locations typically record a greater number of days with a maximum air temperature above 25°C and a minimum air temperature below 0°C compared to locations closer to the coast. Gore averages 34 days per year where the minimum air temperature recorded is less than 0°C – seven fewer days than Invercargill. This may contribute to the earlier observation that the average daily temperature range over winter (and annually) in Gore is less than Invercargill (Table 13), despite Gore being located further inland. The highest air temperature recorded in Southland to date is 36.5°C at Mid Dome on 21 January 1974. Mid Dome also recorded the lowest air temperature in Southland; -11.1°C on 1 August 1957.

27
Earth temperatures
Earth (soil) temperatures are measured once daily at 9 a.m. at several Southland locations. Earth temperatures are measured at varying depths and are important, amongst other things, for determining the growth and development of plants. Different plants have different rooting depths and as such, earth temperatures are routinely monitored at 10, 20, 30, 50, and 100 cm depths. Table 16 lists mean monthly earth temperatures for a number of standard depths. At the coastal Invercargill location, lower summer earth temperatures and higher winter earth temperatures are observed when compared to the more inland locations of Gore and Winton.
Figure 18 shows how earth temperatures change throughout the year at Invercargill, compared with mean air temperature. Except during the summer, the 10 cm earth temperatures are lower than the mean air temperature. The annual earth temperature cycle at 100 cm depth is more dampened and lagged than at shallower depths. As a result, earth temperatures at 100 cm remain above mean air temperatures throughout winter, but fall slightly below mean air temperatures during spring, before returning to higher temperatures than the mean air temperature in summer. Diurnal variation of earth temperatures (not shown) decreases with increasing depth, such that earth temperatures may show very small variation at 100 cm depth, with daily variation of up to 8°C observed at 10 cm depth
Table 15. Highest and lowest recorded air temperatures, average number of days per year where maximum air temperature exceeds 25°C, and average number of days per year where the minimum air temperature is less than 0°C, for selected Southland stations from all available data.
LocationHighest
recorded (°C)Annual days
max temp > 25°CLowest
recorded (°C)Annual days
min temp < 0°C
Gore AWS 32.9 9 -6.5 34
Invercargill Aero 32.2 5 -9.0 41
Lumsden AWS 31.0 11 -9.0 62Manapouri Aero AWS 32.0 11 -10.2 79Milford Sound 28.3 2 -6.1 29
Frosts
Frost is a local phenomenon and both its frequency of occurrence and intensity can vary widely over small areas. Frosts occur most frequently in winter during periods of anticyclonic conditions, primarily for two reasons. Firstly, clear skies associated with anticyclones enhance the rate of radiative cooling during the night. Secondly, anticyclones are associated with light winds, which reduces the amount of turbulent mixing of air. Cold air is relatively dense, so when there is a lack of turbulent mixing it tends to sink towards the earth surface. Therefore, areas most likely to experience frost are flat areas, where relatively cold air is not able to drain away on calm nights, and in valleys, where relatively cold air pools after descending from higher elevation areas nearby. Under such conditions, temperature inversions (where the air temperature increases with elevation) are common.
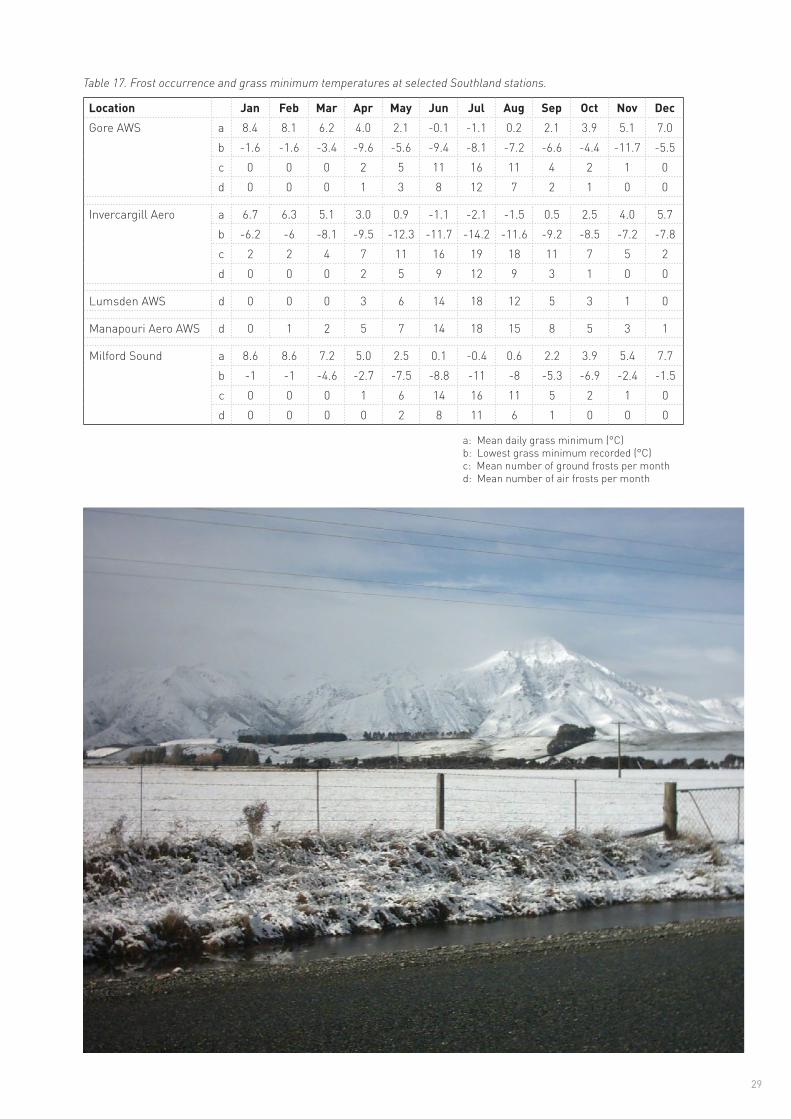
There are two types of frost recorded. Air frosts occur when air temperature measured in a screen by a thermometer 1.3 m above the ground falls below 0°C. Ground frosts are recorded when the air temperature 2.5 cm above a closely cut grass surface falls to -1.0°C or lower. Both types of frost are common in Southland in the cooler months. Table 17 lists for selected sites the mean daily grass minimum and extreme grass minimum temperatures, and the average number of days each month with ground and air frosts. Ground frosts occur more frequently than air frosts, and air frosts occur most frequently at the inland locations of Lumsden and Manapouri.
A particularly severe episode of frosts occurred in Southland during the first two weeks of July 1996. A snowfall to sea level on 1 July was followed by an anticyclone, which became stationary to the southeast of the South Island. This resulted in a two week period

28
Table 16. Monthly and annual mean 9 a.m. earth temperatures (°C) at varying depths from the ground surface for selected Southland stations.
Figure 18. Monthly mean 9 a.m. earth temperature at different depths from the ground surface, and monthly mean air temperature, from all available data at Invercargill Aero.
Location Jan Feb Mar Apr May Jun Jul Aug Sep Oct Nov Dec AnnGore AWS10 cm 13.9 13.6 11.5 9.0 6.5 4.3 3.1 4.2 6.5 8.5 10.6 12.9 8.720 cm 14.8 14.8 12.6 10.1 7.5 5.1 3.8 4.9 7.0 9.2 11.4 13.6 9.650 cm 15.3 15.6 14.1 11.9 9.3 6.9 5.4 6.0 7.9 9.8 11.9 14.0 10.7100 cm 14.1 14.8 14.0 12.4 10.5 8.5 7.0 6.7 7.8 9.3 11.1 12.8 10.8Invercargill Aero10 cm 14.0 13.6 12.0 9.6 7.1 4.9 3.8 4.6 6.7 9.0 11.1 13.2 9.120 cm 15.0 14.8 13.3 11.0 8.3 6.0 4.8 5.6 7.6 9.8 11.9 14.0 10.230 cm 15.2 15.2 13.9 11.7 9.1 6.7 5.4 6.2 8.1 10.2 12.3 14.2 10.7100 cm 14.0 14.4 14.0 12.8 11.0 9.0 7.4 7.2 8.1 9.6 11.2 12.8 10.9Winton 210 cm 14.7 14.2 12.2 9.4 6.7 4.1 3.3 4.4 6.5 8.8 11.4 13.8 9.020 cm 15.9 15.7 13.6 10.8 7.9 5.3 4.3 5.5 7.6 9.8 12.5 14.9 10.330 cm 16.4 16.2 14.4 11.7 8.7 6.1 5.0 6.1 8.2 10.4 13.0 15.3 10.9100 cm 15.1 15.5 14.8 13.2 11.0 8.8 7.3 7.4 8.5 10.0 11.9 13.8 11.4
of fine weather, during which significant radiative cooling (enhanced by the snow which lay on the ground) occurred. It was during this time that Invercargill recorded both its heaviest ground frost (-14.2°C) and lowest air temperature (-9.0°C) on record. The prolonged spell of heavy frosts caused thick ice to form on ponds, streams, and the outer margins of the Invercargill Estuary, whilst considerable mortality of ground-feeding birds occurred as frozen paddocks were inaccessibly hard (Wood, 1998). The event was reported to have cost insurance companies $8.1 million, mostly associated with burst water pipes.
0
2
4
6
8
10
12
14
16
Jan Feb Mar Apr May Jun Jul Aug Sep Oct Nov Dec
Tem
pera
ture
(°C)
Month
10 cm 100 cm Air temp
29
Table 17. Frost occurrence and grass minimum temperatures at selected Southland stations.
Location Jan Feb Mar Apr May Jun Jul Aug Sep Oct Nov DecGore AWS a 8.4 8.1 6.2 4.0 2.1 -0.1 -1.1 0.2 2.1 3.9 5.1 7.0
b -1.6 -1.6 -3.4 -9.6 -5.6 -9.4 -8.1 -7.2 -6.6 -4.4 -11.7 -5.5c 0 0 0 2 5 11 16 11 4 2 1 0d 0 0 0 1 3 8 12 7 2 1 0 0
Invercargill Aero a 6.7 6.3 5.1 3.0 0.9 -1.1 -2.1 -1.5 0.5 2.5 4.0 5.7b -6.2 -6 -8.1 -9.5 -12.3 -11.7 -14.2 -11.6 -9.2 -8.5 -7.2 -7.8c 2 2 4 7 11 16 19 18 11 7 5 2d 0 0 0 2 5 9 12 9 3 1 0 0
Lumsden AWS d 0 0 0 3 6 14 18 12 5 3 1 0
Manapouri Aero AWS d 0 1 2 5 7 14 18 15 8 5 3 1
Milford Sound a 8.6 8.6 7.2 5.0 2.5 0.1 -0.4 0.6 2.2 3.9 5.4 7.7b -1 -1 -4.6 -2.7 -7.5 -8.8 -11 -8 -5.3 -6.9 -2.4 -1.5c 0 0 0 1 6 14 16 11 5 2 1 0d 0 0 0 0 2 8 11 6 1 0 0 0
a: Mean daily grass minimum (°C)b: Lowest grass minimum recorded (°C)c: Mean number of ground frosts per monthd: Mean number of air frosts per month

Brig
ht S
unsh
ine
(hou
rs)
Brig
ht S
unsh
ine
(hou
rs)
Brig
ht S
unsh
ine
(hou
rs)
010
020
030
0
010
020
030
0
010
020
030
0
Invercargill Aero
Winton 2
Te Anau, Doc
J F M A M J J A S O DN
J F M A M J J A S O DN
J F M A M J J A S O DN
30
Sunshine and Solar Radiation
Sunshine
Southland receives relatively low annual sunshine hours compared to the rest of New Zealand. Southwestern areas are particularly cloudy, and these areas receive less than 1300 hours of bright sunshine annually. Most of the populated areas of Southland receive between 1600 hours and 1750 hours of bright sunshine annually. Sunshine hours typically increase as distance from the coast increases (Figure 19), with the notable exception of some mountainous areas (e.g. the Takitimu and Eyre Mountains), where increased cloudiness reduces sunshine totals experienced there. Figure 20 shows the monthly mean, maximum, and minimum recorded bright sunshine hours for selected sites in Southland. Note that the lower sunshine hours recorded in the winter months tends to reflect the northerly declination of the sun, as opposed to signalling an increase in cloudiness during those times.
Figure 20. Mean, highest, and lowest recorded monthly bright sunshine hours for selected stations in Southland.
Highest Recorded
Mean
Lowest Recorded
Figure 19. Median annual sunshine hours for Southland, 1981-2010.

31
Table 18. Mean daily global solar radiation (MJ/m2/day) for selected Southland stations.
Solar radiation
Solar radiation records of greater than 10 years are available for a few sites in Southland. Table 18 presents the mean daily solar radiation (global) for Gore, Invercargill and Manapouri. Insolation is at a maximum in December and a minimum in June.
Location Jan Feb Mar Apr May Jun Jul Aug Sep Oct Nov Dec AnnGore AWS 20.4 17.5 13.3 8.7 5.2 4.0 4.9 7.4 11.5 15.8 19.6 21.2 12.5Invercargill Aero 20.6 17.9 12.7 8.0 4.8 3.6 4.4 7.2 11.4 15.9 20.0 21.9 12.4Manapouri Aero AWS 22.0 19.0 13.8 9.0 5.2 3.8 4.4 7.4 11.4 16.6 20.8 22.6 13.0
UV (Ultra-violet radiation)
The mean daily ultra violet radiation (UV) index recorded at Invercargill Airport is compared to that recorded at Leigh (a site in northern Auckland) in Figure 21. Invercargill records lower UV levels than Leigh due to its southern location. Both sites record significantly higher UV levels in summer than in winter, with maximum UV levels recorded in January and minimum UV levels recorded in June. Figure 22 shows an example of a UV forecast for Invercargill, indicating the UV levels and times of the day where sun protection is required.
Figure 21. Mean monthly maximum UV Index at Invercargill and Leigh.
0
2
4
6
8
10
12
14
Jan Feb Mar Apr May Jun Jul Aug Sep Oct Nov Dec
UV
Inde
x
Month
Invercargill Aero Leigh (Auckland)

32
Figure 22. UV Index forecast for Invercargill, January and July. Source: https://www.niwa.co.nz/our-services/online-services/uv-ozone
Table 19. Average number of days each year with snow, thunder, hail and fog recorded at selected Southland stations, from all available data. The elevation of each station above mean sea level is also shown.
Other elements
Snow
Snowfalls occur frequently in Southland relative to other parts of New Zealand. Table 19 shows the average number of days each year that snowfall occurs at selected Southland stations. Snow doesn’t tend to settle for longer than a day or two at a time, except after particularly heavy snowfall events. The exception is mountainous terrain, where extensive seasonal snowfields typically begin to accumulate in late autumn, and persist through to early summer. Considerable snowfalls occur in the mountains of Fiordland, where a single winter storm cycle can deposit 2 - 3 m of snow (Conway et al., 2000). The Milford Road passes through such mountainous areas, and heavy snowfall combined with steep terrain necessitates a sophisticated avalanche control programme along the transport route.
In September 2010, a destructive and costly snow event struck Southland. Snow began falling on the evening of 17 September in Invercargill, with approximately 14 cm of relatively dense snow accumulating by midday 18 September. The weight of snow overloaded a number of structures – most notably, Stadium Southland’s roof collapsed, with collapsed or sagging roofs reported at six other businesses in Invercargill. The accepted insurance claim for Stadium Southland alone was
Location Snow Thunder Hail Fog
Invercargill Aero (0 m) 5 11 30 41Mid Dome (386 m) 13 No data 2 60Milford Sound (3 m) 4 22 6 2Winton 2 (44 m) 3 2 5 11
around $20 million. In addition, extensive stock losses were experienced by farmers in the wider Southland region.

33
Fog
The most common type of fog in Southland is radiation fog, formed when the air cools to its dew-point on clear nights, allowing the water vapour in the air to condense. The average number of days per year with fog for selected stations in Southland is listed in Table 19. The frequency of fog varies widely over the Southland region, ranging from an average of two days with fog per year at Milford Sound to an average of 60 days per year at Mid Dome. Although fog can occur at any time of the year in Southland, it is recorded most frequently during autumn. For example, of the annual average of 41 days of fog at Invercargill, 15 days (36%) are recorded in autumn.
Thunderstorms
Thunder is most frequent in the west of the region, with an average of 22 days of occurrence per year at Milford Sound (Table 19). Thunder occurs about half as frequently around the south coast compared to the west coast, with Invercargill recording an average of 11 days of thunder occurrence per year. Due to the localised nature of thunderstorm occurrence, it is possible that not all thunderstorms are detected at each station. Thunderstorms in Southland are associated with bouts of high intensity rainfall, lightning, hail, and wind squalls which sometimes cause considerable localised flooding and damage to vegetation and buildings.
On 17 January 2009, a spectacular thunderstorm over Invercargill struck shortly after 6 p.m., bringing thunder, lightning and torrential rain. Invercargill received approximately 19 mm of rain in 30 minutes from 6 p.m., which caused widespread flooding across the city. Both the Invercargill and Kingswell fire services dealt with 26 storm-related calls, mainly to flooded basement garages. 160 lightning strikes were recorded, with many centred over the city. One woman reported seeing Invercargill’s landmark water tower struck by forked lightning.
Hail
Table 19 gives the average number of days per year on which hail is reported at selected stations. Hail occurs considerably more often in Invercargill than any of the other stations shown. As with thunder, hail can be a localised event, meaning some falls may escape detection at some stations. Severe hailstorms may be classified as those which cause damage and/or have hailstones of at least 0.5 cm in diameter. One such severe hailstorm occurred in Invercargill on 7 January 2010. Hailstones of 0.5 cm to 0.8 cm in diameter were measured, with the New Zealand Fire Service fielding nearly 40 flooding related callouts in a single 45 minute period. Air temperatures plummeted in association with the passage of the storm, dropping from 15.6°C to 7.8°C in one hour. 7.6 mm of rainfall was recorded at Invercargill Airport during that same hour, and the mean relative humidity increased rapidly from 73% to 99% as a result of the storm’s passage.
DERIVED CLIMATOLOGICAL PARAMETERSApart from elements such as temperature and rainfall which can be measured directly, it has been found that parameters calculated from several elements have some important uses, especially in industry. Parameters which define the overall suitability of the climate for agriculture, horticulture, architectural and structural designs, and contracting, etc., are vapour pressure, relative humidity, evapotranspiration (leading to soil water balance), degree-days (thermal time), and rainfall extremes. Some of these and their uses are discussed in the following paragraphs. Note that short-term high intensity rainfalls have already been covered.
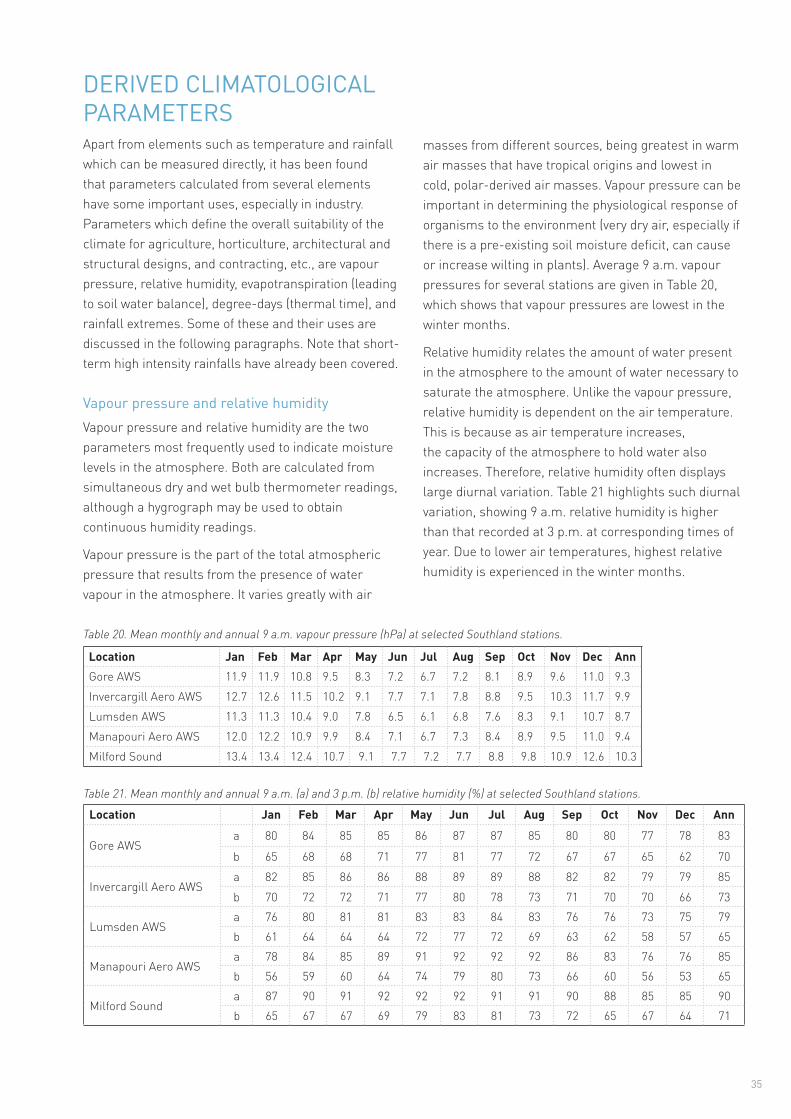
Vapour pressure and relative humidityVapour pressure and relative humidity are the two parameters most frequently used to indicate moisture levels in the atmosphere. Both are calculated from simultaneous dry and wet bulb thermometer readings, although a hygrograph may be used to obtain continuous humidity readings.
Vapour pressure is the part of the total atmospheric pressure that results from the presence of water vapour in the atmosphere. It varies greatly with air
Location Jan Feb Mar Apr May Jun Jul Aug Sep Oct Nov Dec AnnGore AWS 11.9 11.9 10.8 9.5 8.3 7.2 6.7 7.2 8.1 8.9 9.6 11.0 9.3Invercargill Aero AWS 12.7 12.6 11.5 10.2 9.1 7.7 7.1 7.8 8.8 9.5 10.3 11.7 9.9Lumsden AWS 11.3 11.3 10.4 9.0 7.8 6.5 6.1 6.8 7.6 8.3 9.1 10.7 8.7Manapouri Aero AWS 12.0 12.2 10.9 9.9 8.4 7.1 6.7 7.3 8.4 8.9 9.5 11.0 9.4Milford Sound 13.4 13.4 12.4 10.7 9.1 7.7 7.2 7.7 8.8 9.8 10.9 12.6 10.3
masses from different sources, being greatest in warm air masses that have tropical origins and lowest in cold, polar-derived air masses. Vapour pressure can be important in determining the physiological response of organisms to the environment (very dry air, especially if there is a pre-existing soil moisture deficit, can cause or increase wilting in plants). Average 9 a.m. vapour pressures for several stations are given in Table 20, which shows that vapour pressures are lowest in the winter months.
Relative humidity relates the amount of water present in the atmosphere to the amount of water necessary to saturate the atmosphere. Unlike the vapour pressure, relative humidity is dependent on the air temperature. This is because as air temperature increases, the capacity of the atmosphere to hold water also increases. Therefore, relative humidity often displays large diurnal variation. Table 21 highlights such diurnal variation, showing 9 a.m. relative humidity is higher than that recorded at 3 p.m. at corresponding times of year. Due to lower air temperatures, highest relative humidity is experienced in the winter months.
35
Table 20. Mean monthly and annual 9 a.m. vapour pressure (hPa) at selected Southland stations.
Table 21. Mean monthly and annual 9 a.m. (a) and 3 p.m. (b) relative humidity (%) at selected Southland stations.
Location Jan Feb Mar Apr May Jun Jul Aug Sep Oct Nov Dec Ann
Gore AWSa 80 84 85 85 86 87 87 85 80 80 77 78 83
b 65 68 68 71 77 81 77 72 67 67 65 62 70
Invercargill Aero AWSa 82 85 86 86 88 89 89 88 82 82 79 79 85b 70 72 72 71 77 80 78 73 71 70 70 66 73
Lumsden AWSa 76 80 81 81 83 83 84 83 76 76 73 75 79b 61 64 64 64 72 77 72 69 63 62 58 57 65
Manapouri Aero AWSa 78 84 85 89 91 92 92 92 86 83 76 76 85b 56 59 60 64 74 79 80 73 66 60 56 53 65
Milford Sounda 87 90 91 92 92 92 91 91 90 88 85 85 90b 65 67 67 69 79 83 81 73 72 65 67 64 71
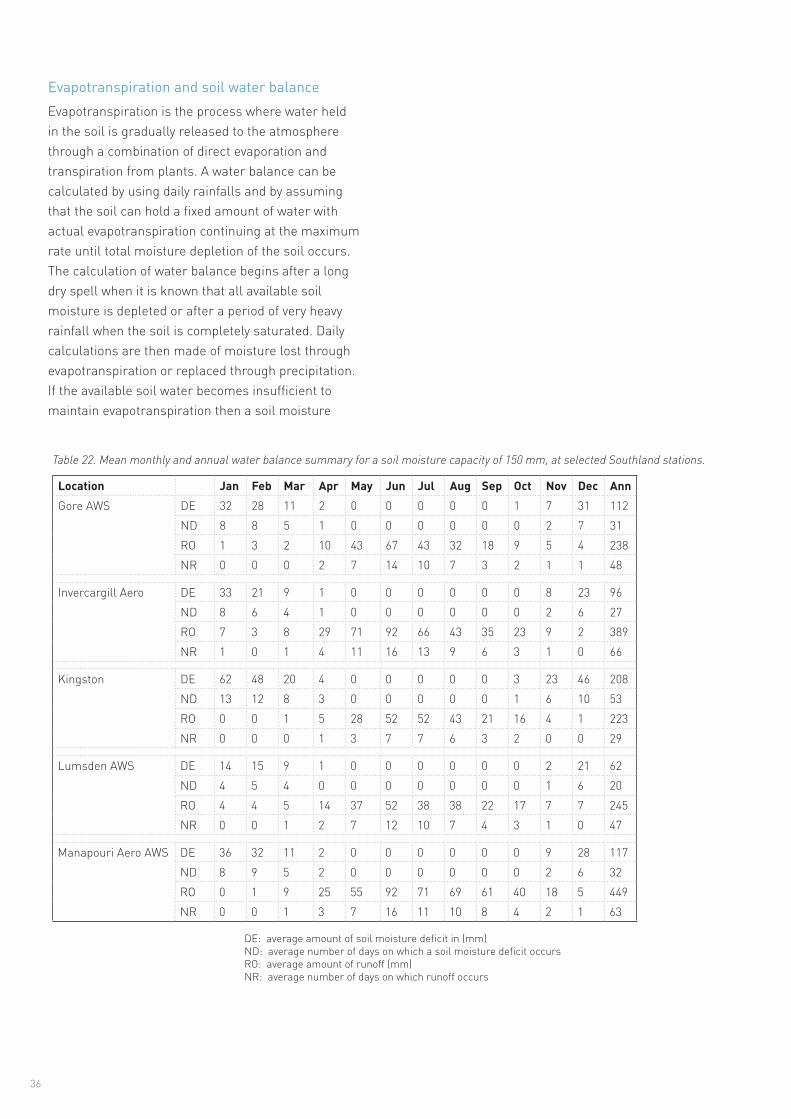
Evapotranspiration and soil water balanceEvapotranspiration is the process where water held in the soil is gradually released to the atmosphere through a combination of direct evaporation and transpiration from plants. A water balance can be calculated by using daily rainfalls and by assuming that the soil can hold a fixed amount of water with actual evapotranspiration continuing at the maximum rate until total moisture depletion of the soil occurs. The calculation of water balance begins after a long dry spell when it is known that all available soil moisture is depleted or after a period of very heavy rainfall when the soil is completely saturated. Daily calculations are then made of moisture lost through evapotranspiration or replaced through precipitation. If the available soil water becomes insufficient to maintain evapotranspiration then a soil moisture
36
Location Jan Feb Mar Apr May Jun Jul Aug Sep Oct Nov Dec AnnGore AWS DE 32 28 11 2 0 0 0 0 0 1 7 31 112
ND 8 8 5 1 0 0 0 0 0 0 2 7 31RO 1 3 2 10 43 67 43 32 18 9 5 4 238NR 0 0 0 2 7 14 10 7 3 2 1 1 48
Invercargill Aero DE 33 21 9 1 0 0 0 0 0 0 8 23 96ND 8 6 4 1 0 0 0 0 0 0 2 6 27RO 7 3 8 29 71 92 66 43 35 23 9 2 389NR 1 0 1 4 11 16 13 9 6 3 1 0 66
Kingston DE 62 48 20 4 0 0 0 0 0 3 23 46 208ND 13 12 8 3 0 0 0 0 0 1 6 10 53RO 0 0 1 5 28 52 52 43 21 16 4 1 223NR 0 0 0 1 3 7 7 6 3 2 0 0 29
Lumsden AWS DE 14 15 9 1 0 0 0 0 0 0 2 21 62ND 4 5 4 0 0 0 0 0 0 0 1 6 20RO 4 4 5 14 37 52 38 38 22 17 7 7 245NR 0 0 1 2 7 12 10 7 4 3 1 0 47
Manapouri Aero AWS DE 36 32 11 2 0 0 0 0 0 0 9 28 117ND 8 9 5 2 0 0 0 0 0 0 2 6 32RO 0 1 9 25 55 92 71 69 61 40 18 5 449NR 0 0 1 3 7 16 11 10 8 4 2 1 63
DE: average amount of soil moisture deficit in (mm)ND: average number of days on which a soil moisture deficit occursRO: average amount of runoff (mm)NR: average number of days on which runoff occurs
Table 22. Mean monthly and annual water balance summary for a soil moisture capacity of 150 mm, at selected Southland stations.

deficit occurs and irrigation becomes necessary to maintain plant growth. Runoff occurs when the rainfall exceeds the soil moisture capacity (assumed to be 150 mm for most New Zealand soils). The Southland region is typically well served by frequent rainfalls throughout the year, but due to high evapotranspiration, irrigation or watering may be necessary from late spring to early autumn.
Mean monthly and annual water balance values for a number of stations in Southland are given in Table 22. Soil moisture deficit peaks in summer throughout Southland, whereas runoff peaks in the winter months. Compared to the remainder of New Zealand, mean soil moisture deficit observed throughout the year in Southland is relatively low. Figure 23 shows region-wide variability in days of soil moisture deficit per year.
Potential evapotranspiration (PET) has been calculated for Gore, Invercargill and Manapouri using the Penman method (Penman, 1948). The monthly mean, minimum, and maximum PET values for these locations are listed in Table 23.
37
Table 23. Penman calculated maximum, mean, and minimum monthly potential evapotranspiration (mm), as well as mean annual total potential evapotranspiration, for selected Southland stations.
Location Jan Feb Mar Apr May Jun Jul Aug Sep Oct Nov Dec AnnGore AWS Max 148 116 79 52 35 19 17 37 66 97 127 150
Mean 125 92 73 38 20 10 13 29 54 84 106 123 768Min 100 75 60 30 11 4 8 21 45 74 82 93
Invercargill Aero AWS Max 148 113 80 45 34 19 20 36 62 96 116 145Mean 125 94 72 39 20 13 15 28 53 83 106 126 772Min 104 80 61 32 13 6 8 22 45 68 91 101
Manapouri Aero AWS Max 159 120 86 42 23 19 21 30 50 92 123 159Mean 130 97 69 32 13 5 7 19 42 78 104 126 723Min 112 82 56 25 9 1 3 14 35 70 92 103
Figure 23. Median annual days of soil moisture deficit for Southland, 1981-2010.

38
Table 24. Average growing degree-day totals above base 5°C and 10°C for selected Southland stations.
Degree-day totalsThe departure of mean daily temperature above a base temperature which has been found to be critical to the growth or development of a particular plant is a measure of the plant’s development on that day. The sum of these departures then relates to the maturity or harvestable state of the crop. Thus, as the plant grows, updated estimates of harvest time can be made. These estimates have been found to be very valuable for a variety of crops with different base temperatures. Degree-day totals indicate the overall effects of temperature for a specified period, and can be applied to agricultural and horticultural production. Growing degree-days express the sum of daily temperatures above a selected base temperature that represent a threshold of plant growth. Table 24 lists the monthly totals of growing degree-day totals above base temperatures of 5°C and 10°C for sites in Southland.
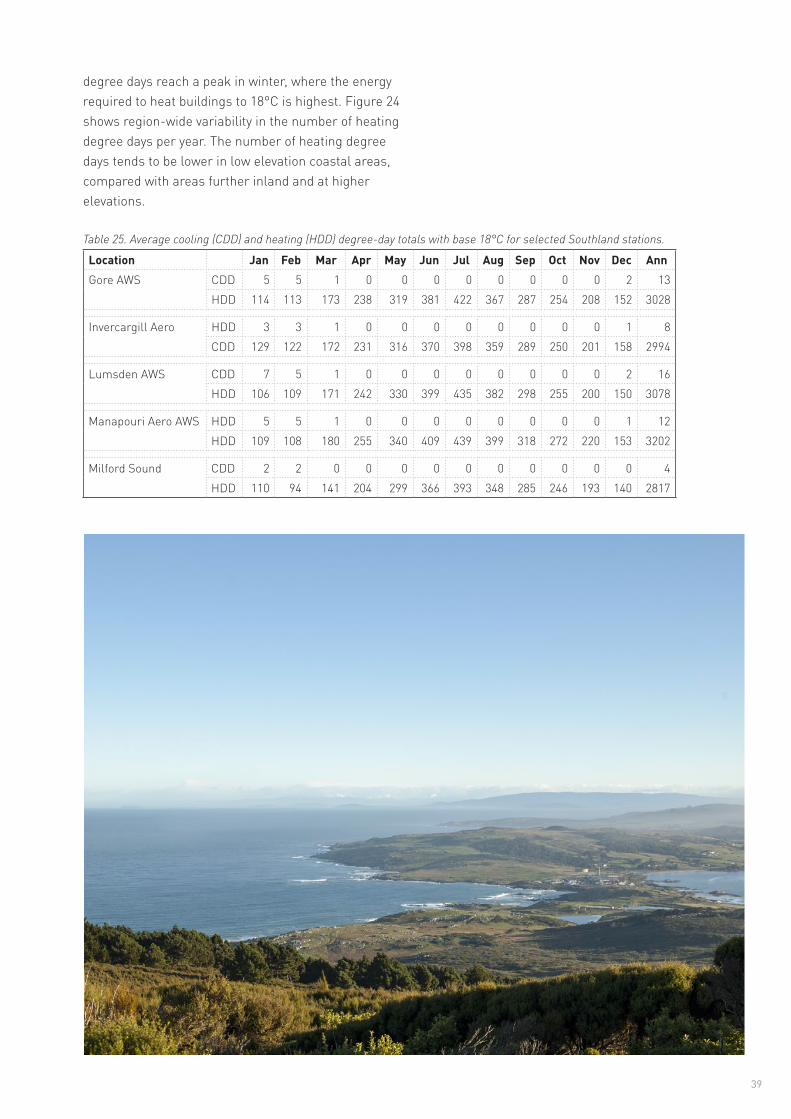
Cooling and heating degree days are measurements that reflect the amount of energy that is required to cool or heat buildings to a comfortable base temperature, which in this case is 18°C. Table 25 shows that the number of cooling degree days reach a peak in mid-late summer in Southland, when energy required to cool building interiors to 18°C is highest. Conversely, heating
Location Jan Feb Mar Apr May Jun Jul Aug Sep Oct Nov Dec AnnGore AWS 5°C 294 259 231 152 91 35 23 50 106 150 183 253 1827
10°C 140 119 83 32 9 1 0 2 13 30 53 103 586
Invercargill Aero 5°C 277 248 232 159 91 40 30 54 103 153 189 247 182210°C 123 108 83 34 7 1 0 2 10 29 53 96 545
Lumsden AWS 5°C 303 264 234 149 84 33 21 44 97 149 190 255 182310°C 150 124 87 34 10 2 1 2 13 32 60 105 619
Manapouri Aero AWS 5°C 298 264 224 137 75 23 17 32 79 132 171 251 170310°C 144 126 80 27 7 1 0 0 8 23 45 102 564
Milford Sound 5°C 295 275 263 186 107 42 33 61 106 157 197 264 198610°C 140 135 110 49 12 2 1 2 7 27 56 111 651
Figure 24. Median annual heating degree days for Southland, 1981-2010.
39
Table 25. Average cooling (CDD) and heating (HDD) degree-day totals with base 18°C for selected Southland stations.
Location Jan Feb Mar Apr May Jun Jul Aug Sep Oct Nov Dec AnnGore AWS CDD 5 5 1 0 0 0 0 0 0 0 0 2 13
HDD 114 113 173 238 319 381 422 367 287 254 208 152 3028
Invercargill Aero HDD 3 3 1 0 0 0 0 0 0 0 0 1 8CDD 129 122 172 231 316 370 398 359 289 250 201 158 2994
Lumsden AWS CDD 7 5 1 0 0 0 0 0 0 0 0 2 16HDD 106 109 171 242 330 399 435 382 298 255 200 150 3078
Manapouri Aero AWS HDD 5 5 1 0 0 0 0 0 0 0 0 1 12HDD 109 108 180 255 340 409 439 399 318 272 220 153 3202
Milford Sound CDD 2 2 0 0 0 0 0 0 0 0 0 0 4HDD 110 94 141 204 299 366 393 348 285 246 193 140 2817
degree days reach a peak in winter, where the energy required to heat buildings to 18°C is highest. Figure 24 shows region-wide variability in the number of heating degree days per year. The number of heating degree days tends to be lower in low elevation coastal areas, compared with areas further inland and at higher elevations.
40
ACKNOWLEDGEMENTSThe following people from NIWA are acknowledged for their contribution to the preparation of this publication: Dr Andrew Tait, Petra Chappell, James Sturman, Dr Elizabeth Somervell, Dr Michael Uddstrom and Erika Mackay.
Photo credits:Contents page, page 6, 8, 11, 12, 23, 34, 39, Alan Blacklock, NIWAPage 29, Wikipedia:Public domainPage 31, Erika Mackay, NIWA
REFERENCESNIWA databases used:
The National Climate Database cliflo.niwa.co.nz
HIRDS (High Intensity Rainfall Design System) hirds.niwa.co.nz
New Zealand Historic Weather Events Catalogue hwe.niwa.co.nz
NIWA Sea Surface Temperature Database
References:
CONWAY, H., CARRAN, W. & CARRAN, A. 2000. The timing, size and impact of avalanches on the Milford Highway, New Zealand. Proceedings of the International Snow Science Workshop, Big Sky, Montana USA, 167-172.
PENMAN, H. L. 1948. Natural evaporation from open water, bare soil, and grass. Proceedings of the Royal Society of London A, 193, 120-145.
REID, S. J. 1980. Frequencies of Low Level Free Atmospheric Wind Flows in Northern and Southern New Zealand. New Zealand Meteorological Service Technical Note 240.
RIDDELL, D. C. 1984. The Southland Flood of January 1984 (Note). Journal of Hydrology (N.Z.), 23:2, 120-129.
UDDSTROM, M. J. & OIEN, N. A. 1999. On the use of high resolution satellite data to describe the spatial and temporal variability of sea surface temperatures in the New Zealand Region. Journal of Geophysical Research (Oceans), 104, 20729-20751.
WOOD, J. 1998. Short Note; The effects of an abnormally cold winter spell on Southland Birds. Notornis, 45, 126-128
Phot
o: ©
myc
hilly
bin.
co.n
z/M
ark
Mer
edith


Phot
o: ©
myc
hilly
bin.
co.n
z/M
ichi
Kra
uss