Embed Size (px)
Citation preview

The City of Richmond, CaliforniaFiscal Year 2017-18 OPERATING BUDGET
ADOPTED June 27, 2017
City of Richmond, California
City of Pride and Purpose
FY 2017-18 Adopted Budget Presented by
Bill Lindsay, City Manager And
Belinda Warner, Finance Director/Treasurer

i
CITY OF RICHMOND
FISCAL YEAR 2017-18
ADOPTED OPERATING BUDGET
TABLE OF CONTENTS PAGE
INTRODUCTION: RICHMOND CITY COUNCIL .................................................................................................................................. 7 CITY OFFICIALS ................................................................................................................................................. 9 ACKNOWLEDGEMENTS ...................................................................................................................................... 11
MISSION, VISION, AND VALUES .......................................................................................................................... 13 BUDGET AWARDS ............................................................................................................................................. 15 BUDGET MESSAGE ............................................................................................................................................ 18 RESOLUTIONS .................................................................................................................................................. 33 BUDGET CALENDAR .......................................................................................................................................... 40 OVERVIEW OF THE CITY ..................................................................................................................................... 43 OVERVIEW OF FINANCIAL OPERATIONS ................................................................................................................ 49 ANNUAL APPROPRIATIONS LIMIT ......................................................................................................................... 67 BUDGET SUMMARIES: CITYWIDE ORGANIZATIONAL CHART……………………………………………………………………………………...68 BUDGETED FUNDS – SOURCES AND USES…………………………………………………………………………….....69 BUDGET SUMMARIES ......................................................................................................................................... 79 SUMMARY OF REVENUE BY FUND ...................................................................................................................... 139 SUMMARY OF EXPENDITURES BY FUND BY TYPE ................................................................................................ 144 SUMMARY OF EXPENDITURES BY FUND BY DEPARTMENT .................................................................................... 160 FINANCIAL FORECAST ..................................................................................................................................... 170
ii
CITYWIDE GRANTS LISTING .............................................................................................................................. 172 CITYWIDE POSITION LISTING ........................................................................................................................... 175 TRANSFERS SCHEDULE ................................................................................................................................... 190
DEPARTMENT SUMMARIES GENERAL GOVERNMENT: OFFICE OF THE MAYOR................................................................................................................................... 191 CITY COUNCIL ............................................................................................................................................... 197 CITY CLERK ................................................................................................................................................... 203 CITY MANAGER’S OFFICE ................................................................................................................................. 209 OFFICE OF NEIGHBORHOOD SAFETY................................................................................................................ 222 CITY ATTORNEY ............................................................................................................................................. 229 POLICE COMMISSION ....................................................................................................................................... 235 FINANCE DEPARTMENT ................................................................................................................................... 241 HUMAN RESOURCES ...................................................................................................................................... 250 INFORMATION TECHNOLOGY ........................................................................................................................... 257 PUBLIC SAFETY: POLICE DEPARTMENT ..................................................................................................................................... 268 FIRE DEPARTMENT ......................................................................................................................................... 280 PUBLIC WORKS: INFRASTRUCTURE MAINTENANCE AND OPERATIONS ........................................................................................... 296
COMMUNITY DEVELOPMENT: WATER RESOURCE RECOVERY ........................................................................................................................ 308 CAPITAL IMPROVEMENT .................................................................................................................................. 318
PLANNING AND BUILDING SERVICES ................................................................................................................. 326

iii
CULTURAL AND RECREATIONAL: LIBRARY AND CULTURAL SERVICES: ................................................................................................................ 338 COMMUNITY SERVICES .................................................................................................................................... 346 HOUSING AND REDEVELOPMENT: COMMUNITY AND ECONOMIC DEVELOPMENT: HOUSING DEPARTMENT ........................................................................................................................ 354 EMPLOYMENT AND TRAINING ................................................................................................................ 364
RICHMOND HOUSING AUTHORITY ......................................................................................................... 374 RENT CONTROL ................................................................................................................................... 383
PORT OF RICHMOND: PORT OF RICHMOND ............................................................................................................................ 385 NON-DEPARTMENTAL: GENERAL GOVERNMENT ................................................................................................................................. 393 MARINA OPERATIONS ..................................................................................................................................... 394 DEBT SUMMARY ............................................................................................................................................. 395 CAPITAL PROJECTS: CAPITAL EXECUTIVE SUMMARY…………………………………………………………………………………………401 CAPITAL REVENUE SOURCES…………………………………………………………………………………………...416 CAPITAL EXPENDITURES BY FUND……………………………………………………………………………………...418 CAPITAL EXPENDITURES BY TYPE………………………………………………………………………………………424 CAPITAL EXPENDITURES BY PROJECT……………………………………………………………………………….....428 OPERATIONS AND MAINTENANCE COSTS……………………………………………………………………………....431 PROJECTS FUNDED DEBT ISSUANCE…………………………………………………………………………………...432 CAPITAL UNFUNDED REQUESTS………………………………………………………………………………………..433
iv
APPENDICES: EMPLOYEE COMPENSATION AND BENEFITS……………………………………..………………………………….......435
FINANCIAL POLICIES………………………………………………………………………………………………..........438 GLOSSARY OF TERMS……………………………………………………………………………………………….......480
LIST OF ACRONYMS…………………………………………………………………………………………………......508
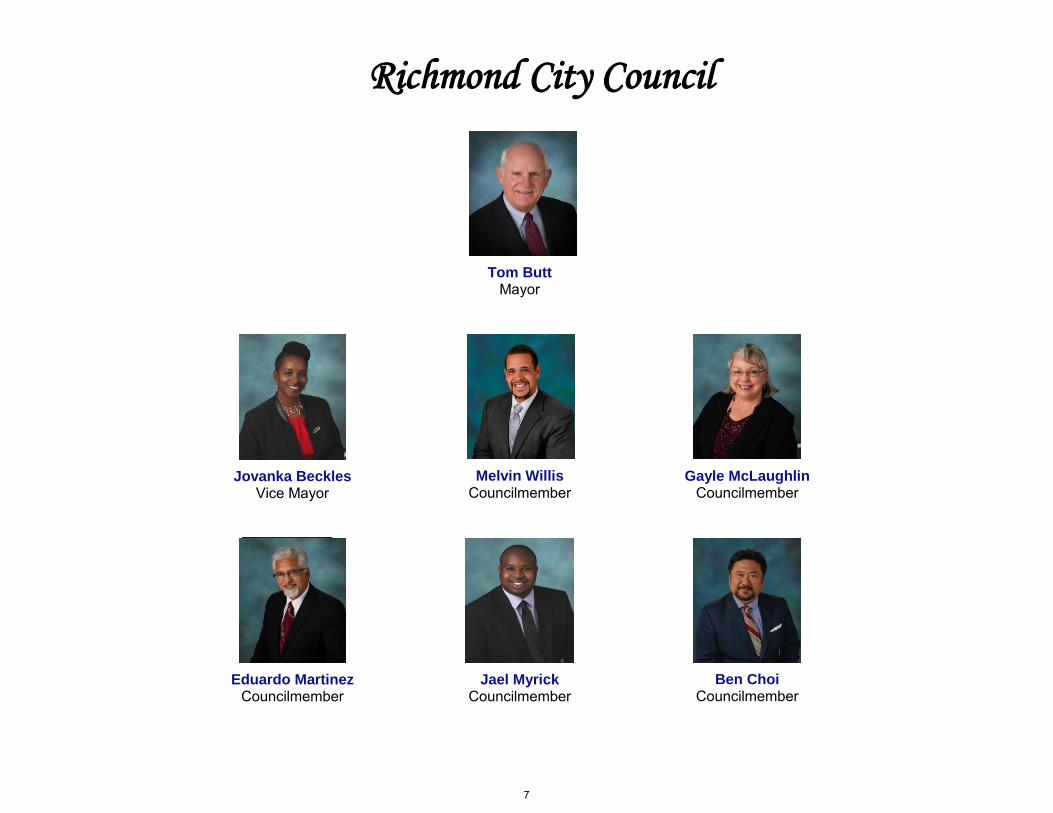
Richmond City Council
Tom Butt Mayor
Jovanka Beckles Vice Mayor
Melvin Willis Councilmember
Gayle McLaughlin Councilmember
Eduardo Martinez Councilmember
Jael Myrick Councilmember
Ben Choi Councilmember
7

This page is intentionally left blank
8
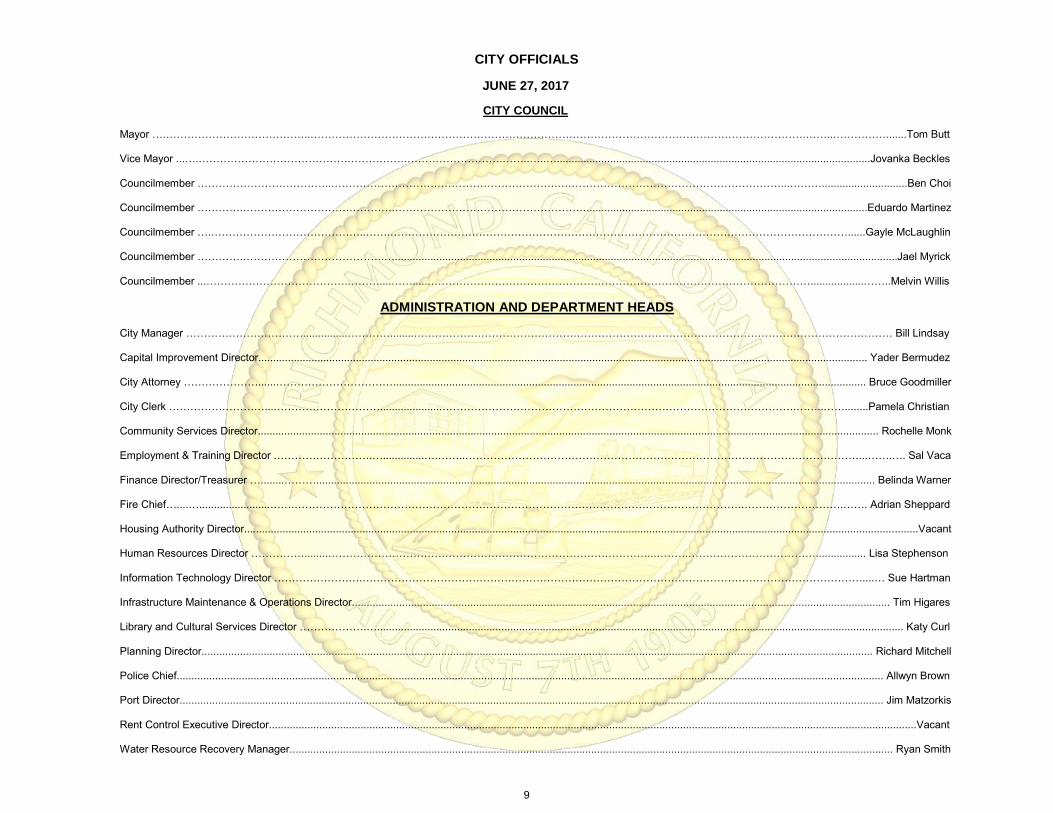
CITY OFFICIALS
JUNE 27, 2017
CITY COUNCIL
Mayor ….…………………………………..……………………………………………………………………………………………….………………………….……..…………….......Tom Butt
Vice Mayor ...….………………………………………………….……………………….……..…..…..........................................................................................................Jovanka Beckles
Councilmember ………………………………..……………………………………………………….………………………………………………………...……….............................Ben Choi Councilmember ………….…………………………………….………………………………………………...............................................................................................Eduardo Martinez Councilmember ….……………………………………..…….…………………………………………………………………………………………………………………......Gayle McLaughlin Councilmember ………….………………………………….…..........................................................................................................................................................................Jael Myrick Councilmember ...………………………………….………....…….....………………………………………………………………………………………………..................……..Melvin Willis
ADMINISTRATION AND DEPARTMENT HEADS
City Manager ……………………………...............…………........……………………………………………………………………………………………………………………… Bill Lindsay Capital Improvement Director.............................................................................................................................................................................................................. Yader Bermudez City Attorney …………………......……………………………................................................................................................................................................................ Bruce Goodmiller City Clerk ………………………...………………………….....................……………………………………………………………………………………….……..……........Pamela Christian Community Services Director.................................................................................................................................................................................................................. Rochelle Monk Employment & Training Director ……………………….…..............….……..…………………………………………………………………………………………………...…….…. Sal Vaca Finance Director/Treasurer …........………............................................................................................................................................................................................. Belinda Warner Fire Chief…....…........................…….……………………………………………………………………………………………………………….……………………….……. Adrian Sheppard Housing Authority Director....................................................................................................................................................................................................................................Vacant Human Resources Director ……………........………………………………………………………………………………..……….………………………………................. Lisa Stephenson Information Technology Director …………………….……………………………………………………………………………………………………………………………....… Sue Hartman Infrastructure Maintenance & Operations Director...................................................................................................................................................................................... Tim Higares Library and Cultural Services Director ……………….….................................................................................................................................................................................. Katy Curl Planning Director................................................................................................................................................................................................................................... Richard Mitchell Police Chief............................................................................................................................................................................................................................................... Allwyn Brown Port Director.............................................................................................................................................................................................................................................. Jim Matzorkis Rent Control Executive Director...........................................................................................................................................................................................................................Vacant Water Resource Recovery Manager............................................................................................................................................................................................................ Ryan Smith
9

This page is intentionally left blank
10
CITY OF RICHMOND
FISCAL YEAR 2017-18 ADOPTED BUDGET
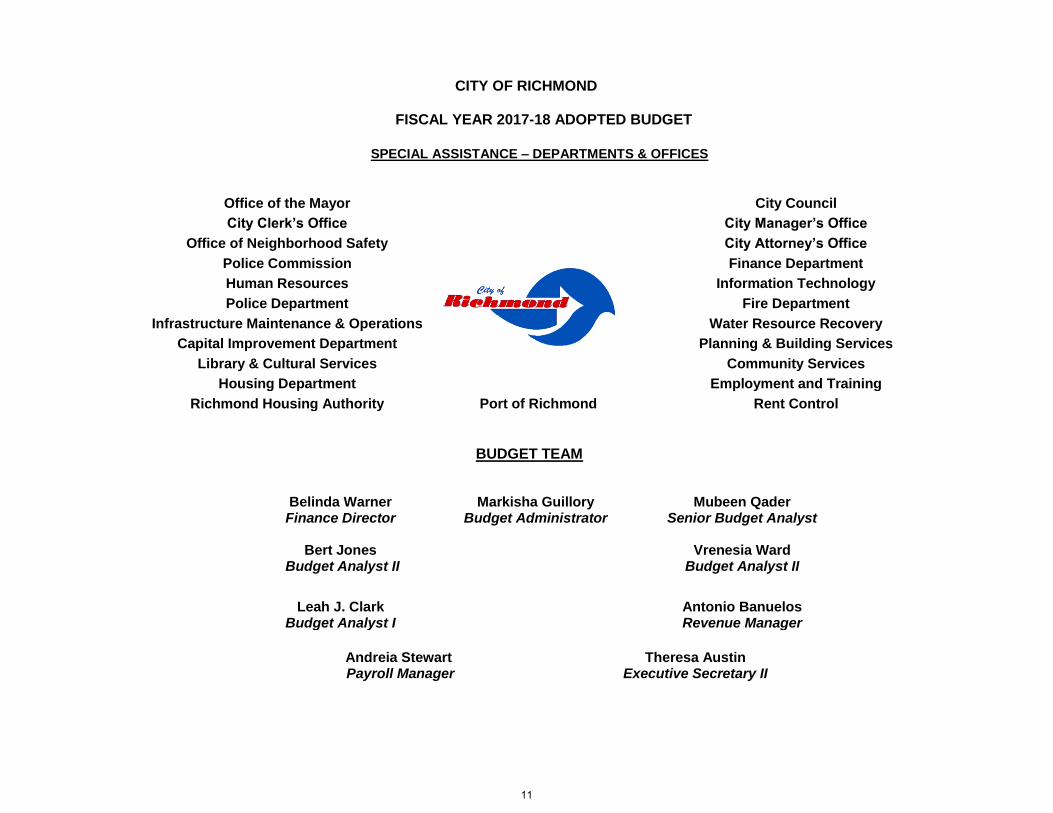
SPECIAL ASSISTANCE – DEPARTMENTS & OFFICES
Office of the Mayor City Council
City Clerk’s Office City Manager’s Office
Office of Neighborhood Safety City Attorney’s Office
Police Commission Finance Department
Human Resources Information Technology
Police Department Fire Department
Infrastructure Maintenance & Operations Water Resource Recovery
Capital Improvement Department Planning & Building Services
Library & Cultural Services Community Services
Housing Department Employment and Training
Richmond Housing Authority Port of Richmond Rent Control
BUDGET TEAM
Belinda Warner Finance Director
Markisha Guillory Budget Administrator
Mubeen Qader Senior Budget Analyst
Bert Jones
Budget Analyst II Vrenesia Ward
Budget Analyst II
Leah J. Clark Budget Analyst I
Antonio Banuelos Revenue Manager
Andreia Stewart Payroll Manager
Theresa Austin Executive Secretary II
11

This page is intentionally left blank
12
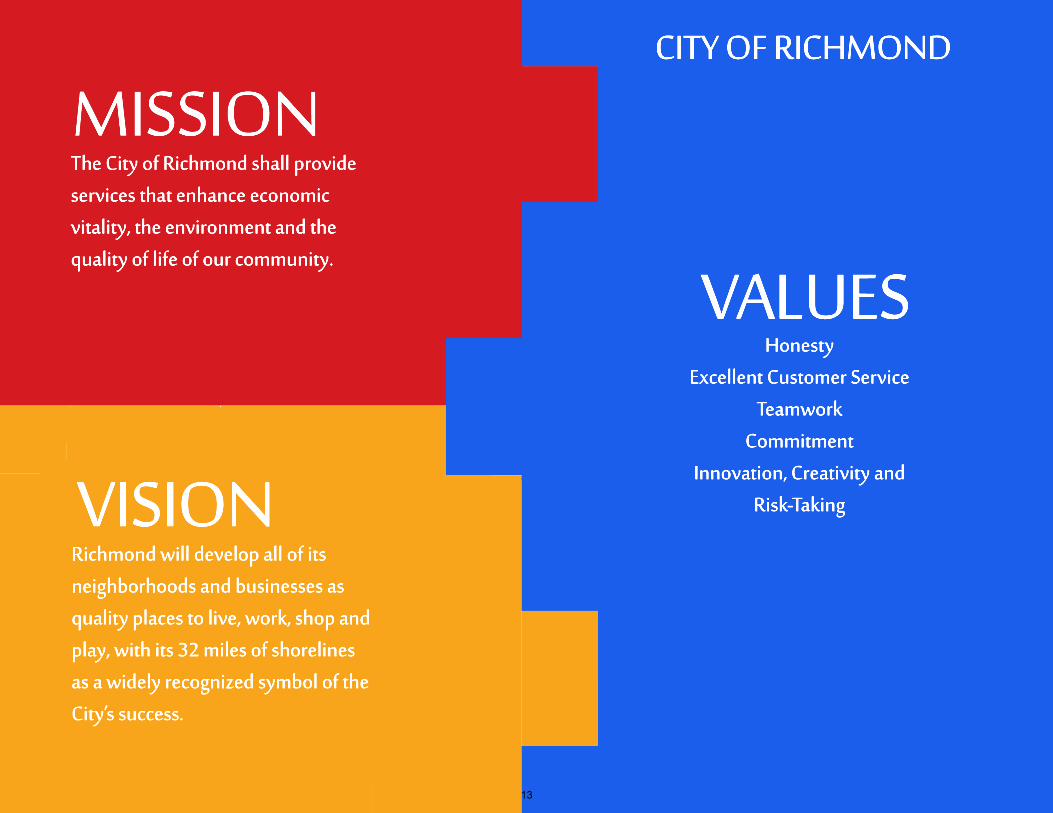
The City of Richmond shall provide services that enhance economic vitality, the environment and the quality of life of our community.
HonestyExcellent Customer Service
TeamworkCommitment
Innovation, Creativity and Risk-Taking
Richmond will develop all of its neighborhoods and businesses as quality places to live, work, shop and play, with its 32 miles of shorelines as a widely recognized symbol of the City’s success.
VISION
CITY OF RICHMOND
VALUES
13

This page is intentionally left blank
14

California Society of
Municipal Finance Officers
Certificate of Award
Operating Budget Excellence Award Fiscal Year 2016-2017
Presented to the
City of Richmond
For meeting the criteria established to achieve the Operating Budget Excellence Award.
January 31, 2017
John Adams Craig Boyer, Chair CSMFO President Professional Standards and Recognition Committee Dedicated Excellence in Municipal Financial Reporting
15
California Society of
Municipal Finance Officers
Certificate of Award
Capital Budget Excellence Award Fiscal Year 2016-2017
Presented to the
City of Richmond
For meeting the criteria established to achieve the Capital Budget Excellence Award.
January 31, 2017
John Adams Craig Boyer, Chair CSMFO President Professional Standards and Recognition Committee Dedicated Excellence in Municipal Financial Reporting
16

This page is intentionally left blank
17
FINANCE DEPARTMENT
DATE: June 27, 2017
TO: Mayor Butt and Members of the City Council
FROM: Bill Lindsay, City ManagerBelinda Warner, Finance Director
SUBJECT: Proposed Fiscal Year 2017-18 Operating Budget and Proposed Fiscal Years 2017-18 to 2021-22 Capital
Improvement Plan
STATEMENT OF THE ISSUE:
Staff has completed development of the Fiscal Year 2017-18 Annual Operating Budget and the Fiscal Years 2017-22 Five-Year
Capital Improvement Plan Budget based on City Council direction, and is submitting these for adoption.
RECOMMENDED ACTION:
ADOPT resolutions approving: (1) Fiscal Year 2017-18 Annual Operating Budget and (2) Fiscal Years 2017-22 Five-Year
Capital Improvement Plan Budget.
FINANCIAL IMPACT OF RECOMMENDATION:
There is no financial impact as a result of this item.
AGENDA
REPORT
1818
DISCUSSION:
Overview
In February 2017, the City began developing its operating and capital improvement budget. This process began with a kick-off
meeting during which departments received the budget message and directions for preparing their budgets. Departments
entered their operating and capital improvement budgets in the City’s financial system. Budget hearings were held with
departments individually during which budgets were reviewed, discussed, and modified where necessary.
After budget hearings, the draft operating and capital improvement budget was prepared and submitted to the City Council at its
meeting on May 2, 2017. At that time, the General Fund budget reflected a shortfall of $866,000. Staff worked to reduce the
budget gap by making several adjustments including increases and decreases to both revenues and expenditures. At its
meeting on June 6, 2017, the City Council received the updated draft budget which reflected a deficit of $30,000 in the General
Fund. Since then, additional adjustments were made to expenditures to close the gap. The proposed General Fund budget is
balanced with a surplus of $442 with revenue and expenditures both budgeted at $160.3 million.
Operating Budget
General Fund Revenue
The General Fund revenue budget totals $160.3 million for FY 2017-18. The City’s principal revenue sources are property
taxes, sales and use taxes, utility user taxes (including a tax settlement), and other taxes. For FY 2017-18, these sources total
$138.6 million, or 86.4% of the General Fund revenue budget. The revenue budget is developed based on financial indicators
and analyses, including the Consumer Price Index (CPI), trend analyses, and reports provided by Contra Costa County and the
City’s sales tax consultant.
1919
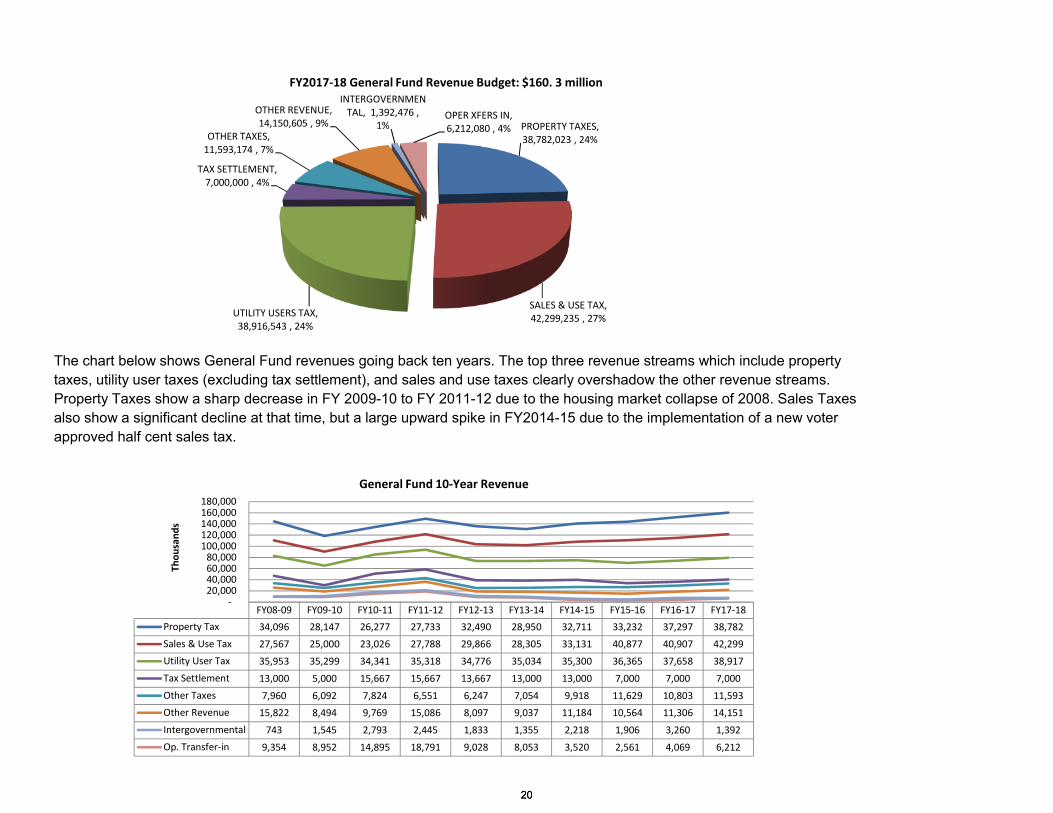
The chart below shows General Fund revenues going back ten years. The top three revenue streams which include property
taxes, utility user taxes (excluding tax settlement), and sales and use taxes clearly overshadow the other revenue streams.
Property Taxes show a sharp decrease in FY 2009-10 to FY 2011-12 due to the housing market collapse of 2008. Sales Taxes
also show a significant decline at that time, but a large upward spike in FY2014-15 due to the implementation of a new voter
approved half cent sales tax.
PROPERTY TAXES,38,782,023 , 24%
SALES & USE TAX,42,299,235 , 27%UTILITY USERS TAX,
38,916,543 , 24%
TAX SETTLEMENT,7,000,000 , 4%
OTHER TAXES,11,593,174 , 7%
OTHER REVENUE,14,150,605 , 9%
INTERGOVERNMENTAL, 1,392,476 ,
1%OPER XFERS IN,6,212,080 , 4%
FY2017-18 General Fund Revenue Budget: $160. 3 million
FY08-09 FY09-10 FY10-11 FY11-12 FY12-13 FY13-14 FY14-15 FY15-16 FY16-17 FY17-18
Property Tax 34,096 28,147 26,277 27,733 32,490 28,950 32,711 33,232 37,297 38,782
Sales & Use Tax 27,567 25,000 23,026 27,788 29,866 28,305 33,131 40,877 40,907 42,299
Utility User Tax 35,953 35,299 34,341 35,318 34,776 35,034 35,300 36,365 37,658 38,917
Tax Settlement 13,000 5,000 15,667 15,667 13,667 13,000 13,000 7,000 7,000 7,000
Other Taxes 7,960 6,092 7,824 6,551 6,247 7,054 9,918 11,629 10,803 11,593
Other Revenue 15,822 8,494 9,769 15,086 8,097 9,037 11,184 10,564 11,306 14,151
Intergovernmental 743 1,545 2,793 2,445 1,833 1,355 2,218 1,906 3,260 1,392
Op. Transfer-in 9,354 8,952 14,895 18,791 9,028 8,053 3,520 2,561 4,069 6,212
-20,00040,00060,00080,000
100,000120,000140,000160,000180,000
Th
ou
san
ds
General Fund 10-Year Revenue
2020
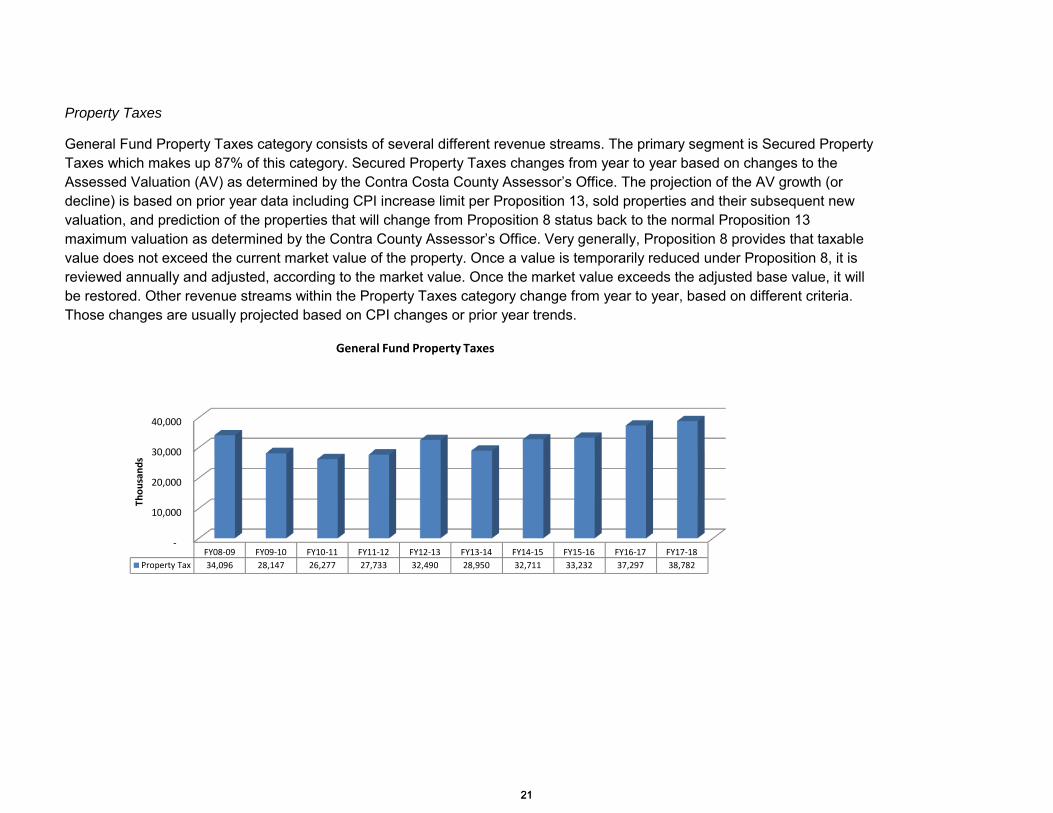
Property Taxes
General Fund Property Taxes category consists of several different revenue streams. The primary segment is Secured Property
Taxes which makes up 87% of this category. Secured Property Taxes changes from year to year based on changes to the
Assessed Valuation (AV) as determined by the Contra Costa County Assessor’s Office. The projection of the AV growth (or
decline) is based on prior year data including CPI increase limit per Proposition 13, sold properties and their subsequent new
valuation, and prediction of the properties that will change from Proposition 8 status back to the normal Proposition 13
maximum valuation as determined by the Contra County Assessor’s Office. Very generally, Proposition 8 provides that taxable
value does not exceed the current market value of the property. Once a value is temporarily reduced under Proposition 8, it is
reviewed annually and adjusted, according to the market value. Once the market value exceeds the adjusted base value, it will
be restored. Other revenue streams within the Property Taxes category change from year to year, based on different criteria.
Those changes are usually projected based on CPI changes or prior year trends.
-
10,000
20,000
30,000
40,000
FY08-09 FY09-10 FY10-11 FY11-12 FY12-13 FY13-14 FY14-15 FY15-16 FY16-17 FY17-18
Property Tax 34,096 28,147 26,277 27,733 32,490 28,950 32,711 33,232 37,297 38,782
Tho
usa
nd
s
General Fund Property Taxes
2121
Property Tax revenue has seen large swings, both up and down, based on changes to the valuation of the Chevron Refinery
and the valuation of residential properties. Other economic factors impacting the future of this revenue stream include:
Future changes to the price of crude oil which will continue to affect the valuation of the refinery. Furthermore, thevaluation of the refinery will be impacted by the current modernization project taking place there. In brief, the valuation isbased on the profitability of the refinery as determined by the County Assessor.
The housing crash from the previous decade had a long lasting effect on Property Tax revenue in Richmond. Afterseveral years, most of the valuation lost during the housing market crash, and the subsequent re-valuation by the CountyAssessor under the Proposition 8 framework, has been regained – although not all. Many factors will affect this segmentof the revenue stream going forward including new housing construction, of which there are several large projects in theinitial stages throughout Richmond. Also, sale prices during the previous year will impact the Assessed Valuation (AV).
The sale of warehouses in Richmond which have taken place in recent months. It is assumed that this has happenedbecause investors are speculating that these will be good locations for marijuana growths with the passage ofProposition 64.
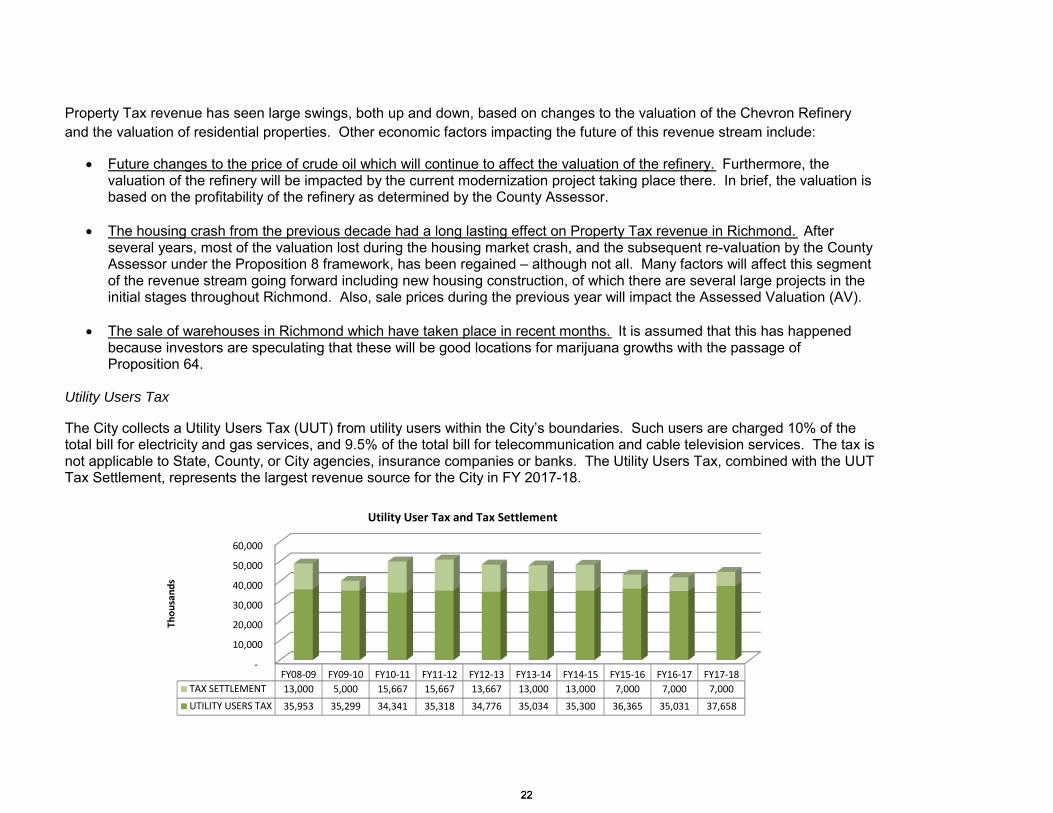
Utility Users Tax
The City collects a Utility Users Tax (UUT) from utility users within the City’s boundaries. Such users are charged 10% of thetotal bill for electricity and gas services, and 9.5% of the total bill for telecommunication and cable television services. The tax isnot applicable to State, County, or City agencies, insurance companies or banks. The Utility Users Tax, combined with the UUTTax Settlement, represents the largest revenue source for the City in FY 2017-18.
-
10,000
20,000
30,000
40,000
50,000
60,000
FY08-09 FY09-10 FY10-11 FY11-12 FY12-13 FY13-14 FY14-15 FY15-16 FY16-17 FY17-18
TAX SETTLEMENT 13,000 5,000 15,667 15,667 13,667 13,000 13,000 7,000 7,000 7,000
UTILITY USERS TAX 35,953 35,299 34,341 35,318 34,776 35,034 35,300 36,365 35,031 37,658
Tho
usa
nd
s
Utility User Tax and Tax Settlement
2222

As mentioned above, UUT consists of taxes to utilities, and now includes prepaid wireless cards – new revenue as approved bythe State of California in 2014 with the passage Assembly Bill 1717. Stemming from these taxes, the City has two revenuestreams related to the Chevron Refinery. The refinery opts to use the maximum UUT provision on a consistent basis.Additionally, within the UUT category the City has settlement payments related to litigation with the refinery. These two Chevronrelated streams account for over 62% of UUT as a whole. Each segment is analyzed independently based on prior year dataand trends happening locally and legislation or changes happening at the state level. For example, for both cable television andtelecommunications, there are less people subscribing to these services (i.e. landlines), often opting for non-taxed services(dish services).
For many years, this revenue stream was the steadiest of Richmond’s major revenue streams. With ever changing
technologies, there have been significant declines in two of the categories that make up UUT. Other economic factors
impacting the future of this revenue stream include:
Telecommunications: The City has experienced significant decreases in this segment. The decreases stem from manyconsumers moving away from landlines or using prepaid cards which were previously not taxed. Last year, the Stateapproved AB1717 which imposed UUT on prepaid cards. This means cities will be able to recoup some of the UUT thatwas being lost.
Cable TV: The City has also seen stagnation and decreases to UUT from cable subscribers. This is the result ofconsumers switching over to dish providers, which are exempt from UUT, and from consumers using over the top TV(OTT) such as Netflix, Hulu and YouTube which are currently not taxed. Many California cities are looking at possiblystarting to charge UUT on such services.
Gas and Electricity: Because of increased rates charged by the utility company, corresponding UUT revenues will alsoreflect an increase in collections.
Operation: This segment of UUT revenue stems from a provision in the City’s Municipal Code that allows any party inRichmond to opt to pay a Maximum Tax without having to disclose actual utility usage. The rate changes from year toyear based on changes to the CPI.
Settlements: The City has one settlement related to UUT and that stems from various litigations with Chevron. Thesettlement in place goes through FY 2024-25 with specific payment amounts stipulated for each year.
2323
-
5,000
10,000
15,000
20,000
25,000
30,000
35,000
40,000
45,000
FY08-09 FY09-10 FY10-11 FY11-12 FY12-13 FY13-14 FY14-15 FY15-16 FY16-17 FY17-18
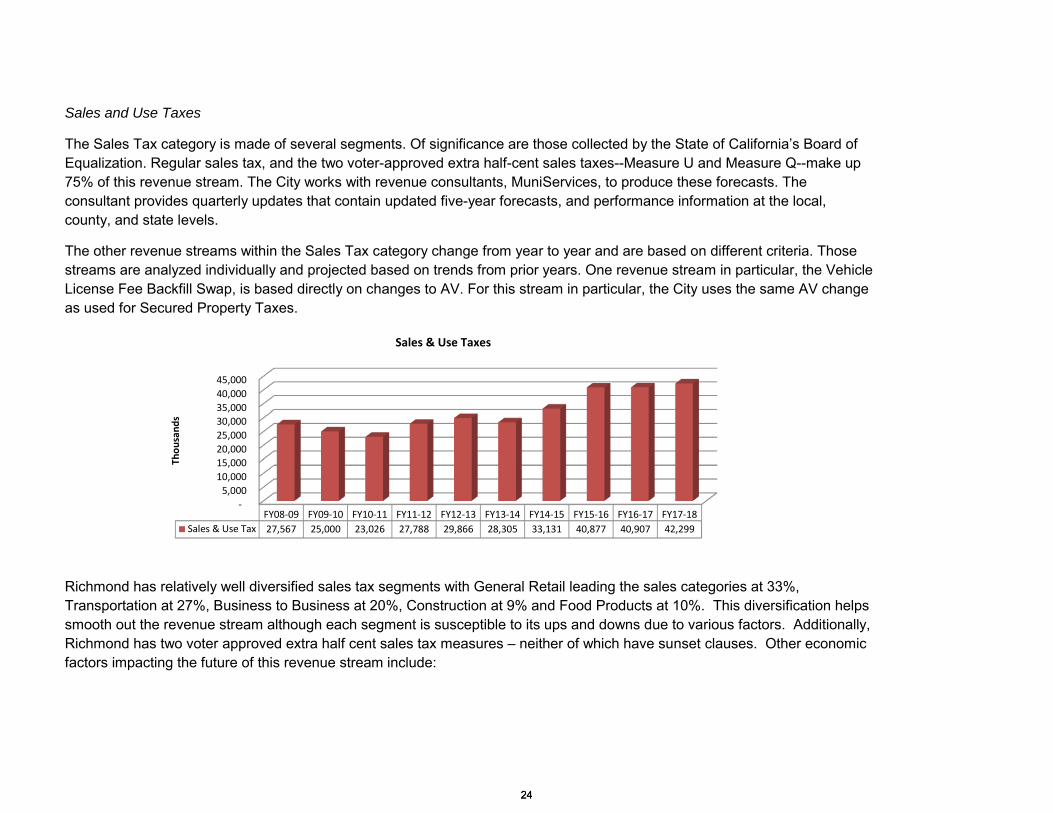
Sales & Use Tax 27,567 25,000 23,026 27,788 29,866 28,305 33,131 40,877 40,907 42,299
Th
ou
san
ds
Sales & Use Taxes
Sales and Use Taxes
The Sales Tax category is made of several segments. Of significance are those collected by the State of California’s Board of
Equalization. Regular sales tax, and the two voter-approved extra half-cent sales taxes--Measure U and Measure Q--make up
75% of this revenue stream. The City works with revenue consultants, MuniServices, to produce these forecasts. The
consultant provides quarterly updates that contain updated five-year forecasts, and performance information at the local,
county, and state levels.
The other revenue streams within the Sales Tax category change from year to year and are based on different criteria. Those
streams are analyzed individually and projected based on trends from prior years. One revenue stream in particular, the Vehicle
License Fee Backfill Swap, is based directly on changes to AV. For this stream in particular, the City uses the same AV change
as used for Secured Property Taxes.
Richmond has relatively well diversified sales tax segments with General Retail leading the sales categories at 33%,
Transportation at 27%, Business to Business at 20%, Construction at 9% and Food Products at 10%. This diversification helps
smooth out the revenue stream although each segment is susceptible to its ups and downs due to various factors. Additionally,
Richmond has two voter approved extra half cent sales tax measures – neither of which have sunset clauses. Other economic
factors impacting the future of this revenue stream include:
2424
General Retail: Richmond has several big box retailers including Costco, Wal-Mart and Target; and also a large regional
mall with anchor tenants Macy’s and Sears.
Transportation: This segment includes car sales and gasoline sales. It is affected by oil prices and interest rates as well
as the overall regional economy. With a large auto plaza in Richmond, the number of sales to customers from outside of
Richmond boosts the regular Sales Tax. The extra half cent sales taxes are only applied to car sales to Richmond
residents whether in Richmond or somewhere else in the State.
Construction: This segment is highly influenced by the housing market, especially new construction.
Marijuana: Richmond currently has three permitted medical marijuana dispensaries. With Proposition 64—which
legalizes recreational use of marijuana-- this segment may realize significant increases soon.
Other Taxes
Other taxes include franchise fees, transient occupancy tax, and documentary transfer tax which is the largest amount collected
under this revenue source. The City collects a tax (the “Documentary Transfer Tax”) on all transfers by deeds, instruments,
writings or any other document by which lands, tenements, or other interests in real property are sold at a rate of $7.00 for each
$1,000 or fractional part thereof of the consideration.
Other Revenue
Other revenue sources include Licenses, Permits & Fees, Charges for Services, Intergovernmental (Grants), and Transfers in.
These revenue streams are received mostly at the department level for services provided directly to the public except for
Transfers in. Each category is analyzed individually and forecasted based on historical trends and other known factors, such as
fee increases and grant stipulations.
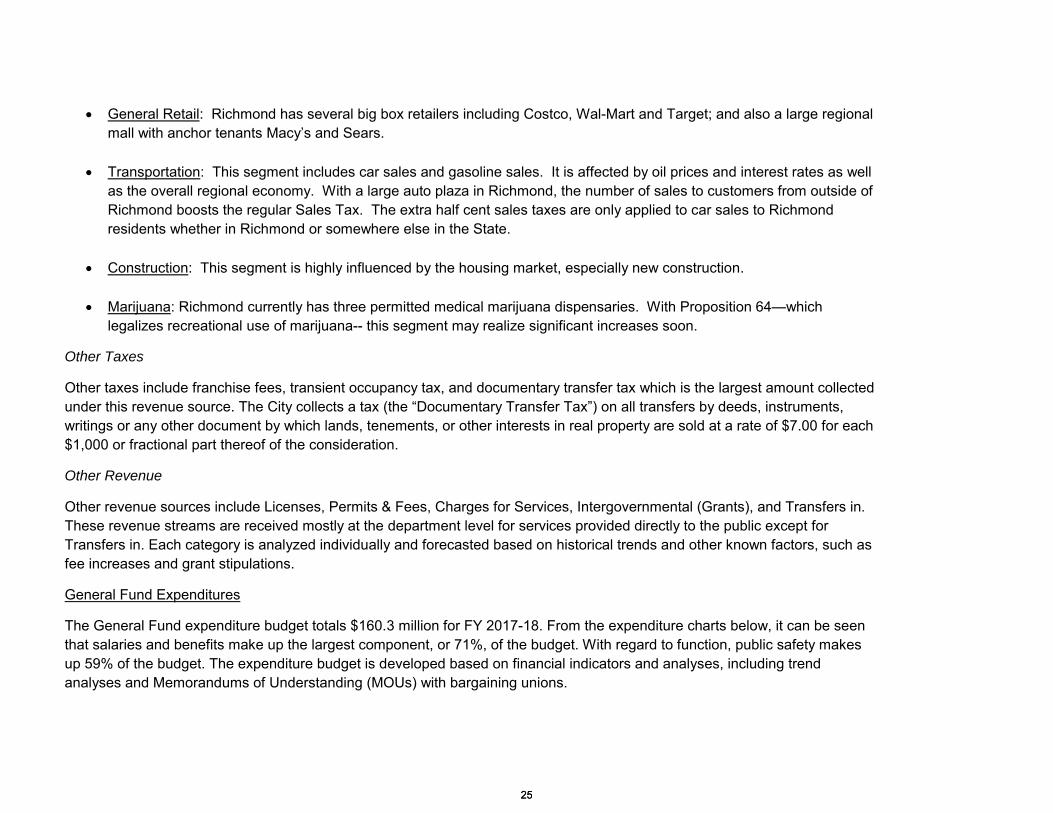
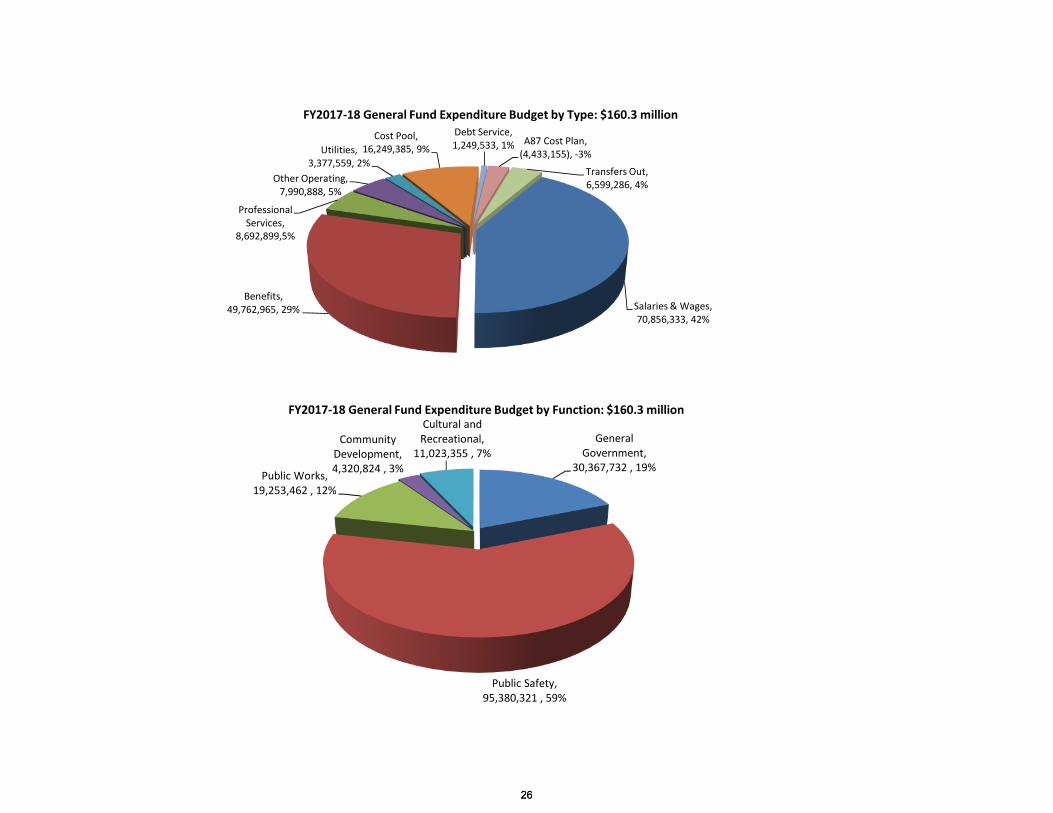
General Fund Expenditures
The General Fund expenditure budget totals $160.3 million for FY 2017-18. From the expenditure charts below, it can be seen
that salaries and benefits make up the largest component, or 71%, of the budget. With regard to function, public safety makes
up 59% of the budget. The expenditure budget is developed based on financial indicators and analyses, including trend
analyses and Memorandums of Understanding (MOUs) with bargaining unions.
2525
Salaries & Wages,70,856,333, 42%
Benefits,49,762,965, 29%
ProfessionalServices,
8,692,899,5%
Other Operating,7,990,888, 5%
Utilities,3,377,559, 2%
Cost Pool,16,249,385, 9%
Debt Service,1,249,533, 1% A87 Cost Plan,
(4,433,155), -3%
Transfers Out,6,599,286, 4%
FY2017-18 General Fund Expenditure Budget by Type: $160.3 million
GeneralGovernment,
30,367,732 , 19%
Public Safety,95,380,321 , 59%
Public Works,19,253,462 , 12%
CommunityDevelopment,4,320,824 , 3%
Cultural andRecreational,
11,023,355 , 7%
FY2017-18 General Fund Expenditure Budget by Function: $160.3 million
2626
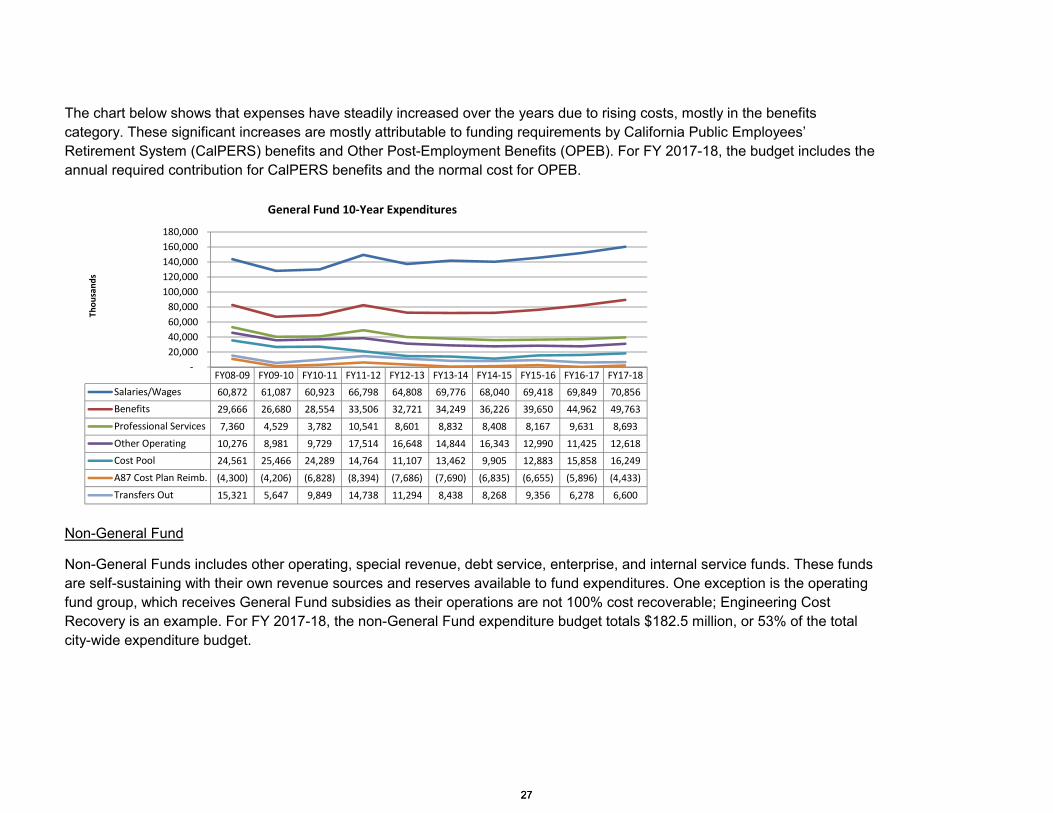
The chart below shows that expenses have steadily increased over the years due to rising costs, mostly in the benefits
category. These significant increases are mostly attributable to funding requirements by California Public Employees’
Retirement System (CalPERS) benefits and Other Post-Employment Benefits (OPEB). For FY 2017-18, the budget includes the
annual required contribution for CalPERS benefits and the normal cost for OPEB.
Non-General Fund
Non-General Funds includes other operating, special revenue, debt service, enterprise, and internal service funds. These funds
are self-sustaining with their own revenue sources and reserves available to fund expenditures. One exception is the operating
fund group, which receives General Fund subsidies as their operations are not 100% cost recoverable; Engineering Cost
Recovery is an example. For FY 2017-18, the non-General Fund expenditure budget totals $182.5 million, or 53% of the total
city-wide expenditure budget.
FY08-09 FY09-10 FY10-11 FY11-12 FY12-13 FY13-14 FY14-15 FY15-16 FY16-17 FY17-18
Salaries/Wages 60,872 61,087 60,923 66,798 64,808 69,776 68,040 69,418 69,849 70,856
Benefits 29,666 26,680 28,554 33,506 32,721 34,249 36,226 39,650 44,962 49,763
Professional Services 7,360 4,529 3,782 10,541 8,601 8,832 8,408 8,167 9,631 8,693
Other Operating 10,276 8,981 9,729 17,514 16,648 14,844 16,343 12,990 11,425 12,618
Cost Pool 24,561 25,466 24,289 14,764 11,107 13,462 9,905 12,883 15,858 16,249
A87 Cost Plan Reimb. (4,300) (4,206) (6,828) (8,394) (7,686) (7,690) (6,835) (6,655) (5,896) (4,433)
Transfers Out 15,321 5,647 9,849 14,738 11,294 8,438 8,268 9,356 6,278 6,600
-
20,000
40,000
60,000
80,000
100,000
120,000
140,000
160,000
180,000
General Fund 10-Year Expenditures
Th
ou
san
ds
2727
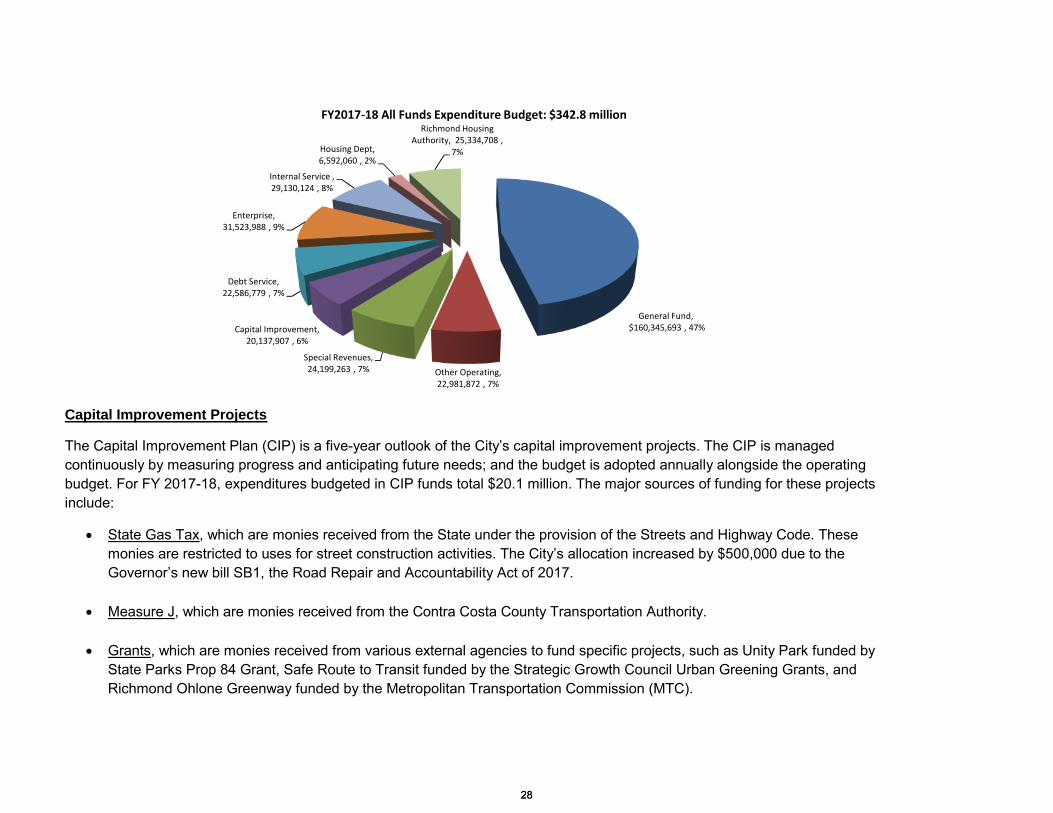
Capital Improvement Projects
The Capital Improvement Plan (CIP) is a five-year outlook of the City’s capital improvement projects. The CIP is managed
continuously by measuring progress and anticipating future needs; and the budget is adopted annually alongside the operating
budget. For FY 2017-18, expenditures budgeted in CIP funds total $20.1 million. The major sources of funding for these projects
include:
State Gas Tax, which are monies received from the State under the provision of the Streets and Highway Code. These
monies are restricted to uses for street construction activities. The City’s allocation increased by $500,000 due to the
Governor’s new bill SB1, the Road Repair and Accountability Act of 2017.
Measure J, which are monies received from the Contra Costa County Transportation Authority.
Grants, which are monies received from various external agencies to fund specific projects, such as Unity Park funded by
State Parks Prop 84 Grant, Safe Route to Transit funded by the Strategic Growth Council Urban Greening Grants, and
Richmond Ohlone Greenway funded by the Metropolitan Transportation Commission (MTC).
General Fund,$160,345,693 , 47%
Other Operating,22,981,872 , 7%
Special Revenues,24,199,263 , 7%
Capital Improvement,20,137,907 , 6%
Debt Service,22,586,779 , 7%
Enterprise,31,523,988 , 9%
Internal Service ,29,130,124 , 8%
Housing Dept,6,592,060 , 2%
Richmond HousingAuthority, 25,334,708 ,
7%
FY2017-18 All Funds Expenditure Budget: $342.8 million
2828

Other capital projects are funded by operating funds, including enterprise and internal services funds. For FY 2017-18, these
expenditures total $9.8 million. On-going operations and maintenance costs of capital projects are budgeted in the operating
budget.
Priority capital projects for FY 2017-18 include Street Paving - $3 million; Carlson Boulevard - $1.9 million; I-80 Central
Interchange - $2.5 million; Richmond Greenway Ohlone Gap Closure – 405,000. The CIP document contains detailed
information on projects and sources/uses of funding.
Long-Range Financial Planning
In 2015, the City began working with the PFM Group, Inc. through the National Resource Network to develop and implement its
five-year financial model. The model projects General Fund revenue and expenditures five years into the future based on five
years of historical audited actuals and a comprehensive set of assumptions. It serves as a budgeting and decision-making tool
that enables the City to proactively address future issues, such as budget deficits.
Prior to the development of the FY 2017-18 budget, the City anticipated a potential budget gap of at least $4.5 million based on
application of the financial model. With that, departments were directed to prepare baseline budgets with no increases to
discretionary operating expenditures, and with these and other measures, the projected budget gap was eliminated. The
balanced budget for FY 2017-18 provides a new baseline which should serve to eliminate the budget shortfalls going forward
that had been forecast in the financial model.
1.70.2
(4.5) (4.6) (4.3)(5.9)
8.9 9.1
4.6
(0.0)
(4.3)
(10.2)(15)
(10)
(5)
0
5
10
15
2016 2017 2018 2019 2020 2021
$(i
nm
illi
on
s)
FY Surplus /(Deficit)
FY EndingFund Balance
2929

Operating Highlights/Accomplishments
Below are some key accomplishments that fulfilled core strategic goals of the City in FY 2016-17:
1. Maintain and enhance the physical environment
The Nevin Avenue Streetscape improvements were completed--bringing new lights, landscaping, and furniture along withan installed round-a-bout on 24th Street and Nevin Avenue.
A new “PLAYce” sprung up at Mathieu Court in Richmond. The project was collaboration among the City of Richmond,Richmond Art Center, the Trust for Public Land, Pogo Park, and the Iron Triangle Neighborhood Council.
2. Promote a safe and secure community
The Richmond Fire Department completed training for expanded medical services to the citizens of Richmond.Emergency Medical Technicians (EMT) are now able to administer Naloxone Hydrochloride for opioid treatment, andEpinephrine to treat life-threatening allergic reactions. Additionally, the department is now trained to establish advancedairway devices in patients with failed or compromised airways.
The Office of Professional Accountability (OPA) was formally established in March, coinciding with the hiring of thecivilian manager of the reengineered internal affairs function. The office operates at City Hall, 440 Civic Center.
The Richmond Police Department held its first Community Safety Academy, a program of instruction designed to betteracquaint residents with their police department and some of the measures that help the community work together moreeffectively to make Richmond safer.
Richmond Promise hosted its second annual Scholars Celebration. At the event, 440 local students were awardedRichmond Promise scholarships worth $6,000 each, for a total of $2.6 million.
3. Promote economic vitality
The San Francisco Business Times published a supplemental issue featuring Richmond. The issue highlighted theassets and amenities that make Richmond one of the best options for business in Bay Area, and profiled a variety ofcompanies that call Richmond home.
The United States Environmental Protection Agency (EPA) announced the selection of RichmondBUILD to receive agrant award of $200,000 to provide environmental job training programs for Richmond residents.
YouthWORKS had 35 businesses employ 29 youth for the summer youth employment program.
The State of California Employment Development Department (EDD) selected RichmondBUILD Solar Project andRichmondWORKS On-The-Job Training (OJT) programs for the 2016 Labor Day campaign, “Training Dollars at Work”.The campaign showcases successful local programs that help participants find employment.
3030
4. Promote sustainable communities
The Richmond City Council unanimously approved an ambitious and innovative Climate Action Plan (CAP) to addressthe impacts of climate change and lower greenhouse gas emissions in Richmond.
The Department of Housing and Urban Development (HUD) released the Richmond Housing Authority’s (RHA’s) SectionEight Management Assessment Program (SEMAP) for the fiscal year ending June 30, 2016. The SEMAP score for theRHA was 100%, with a “High Performer” designation, which represents a significant achievement for the RichmondHousing Authority.
The City received an “A” grade in the Annual State of Tobacco Control Report.
Freshest Cargo Mobile Farmers’ Market, the non-profit Farmers Market on Wheels, added a new stop to its establishedRichmond route. In July 2016, the program began its weekly visit to the Richmond Civic Center each Wednesday from10:45 AM to 11:45 AM. Freshest Cargo sells low-cost, high quality, California-grown fresh fruits and vegetables inunderserved communities, to improve healthy food access for families and individuals across the Bay Area.
5. Promote effective government
For the ninth consecutive year, the City was awarded the Certificate of Achievement for Excellence in FinancialReporting by the Government Finance Officers Association of the United States and Canada (GFOA) for itscomprehensive annual financial report (CAFR) ending June 30, 2015.
The City was awarded the Operating Budget Excellence Award and the Capital Budget Excellence Award by theCalifornia Society of Municipal Finance Officers (CSMFO) for the FY 2016-17.
The City received the State of Our Schools award for partnering with the WCCUSD to improve internet connections forthe students in Richmond.
Goals for Upcoming Fiscal Year
Department sections in the FY 2017-18 Operating Budget document contain details on departmental goals that align with the
City’s strategic business goals.
Conclusion
Over the last several fiscal years, it has been a challenge to prepare balanced budgets while still trying to meet the growing
needs of the community. Average annual growth in the City’s top three revenue sources has averaged less than 1.5% per year
during the past nine years – a level well below inflation. It was only in fiscal year 2016-17 that the City’s property taxes finally
exceeded pre-recession levels that existed eight years earlier. These revenue struggles were against the backdrop of
significantly higher costs, especially pension-related costs, an aging infrastructure. Achieving budget balances and favorable
operating results during the past three fiscal years has created difficult policy choices for the City Council, but these difficult
3131

choices were successfully made. And, while fiscal year 2017-18 was, in many ways, no less difficult in achieving financial goals,
staff was able to work closely with the various City departments to craft a budget that we believe offers a stable baseline for the
coming years.
DOCUMENTS ATTACHED:
1. Resolution – FY2017-18 Operating Budget2. Resolution – FY2017-18 to FY2021-22 Capital Improvement Plan Budget3. Complete Operating Budget (under separate cover)4. Complete Capital Improvement Plan (under separate cover)
3232
33
34
35

36
37

38
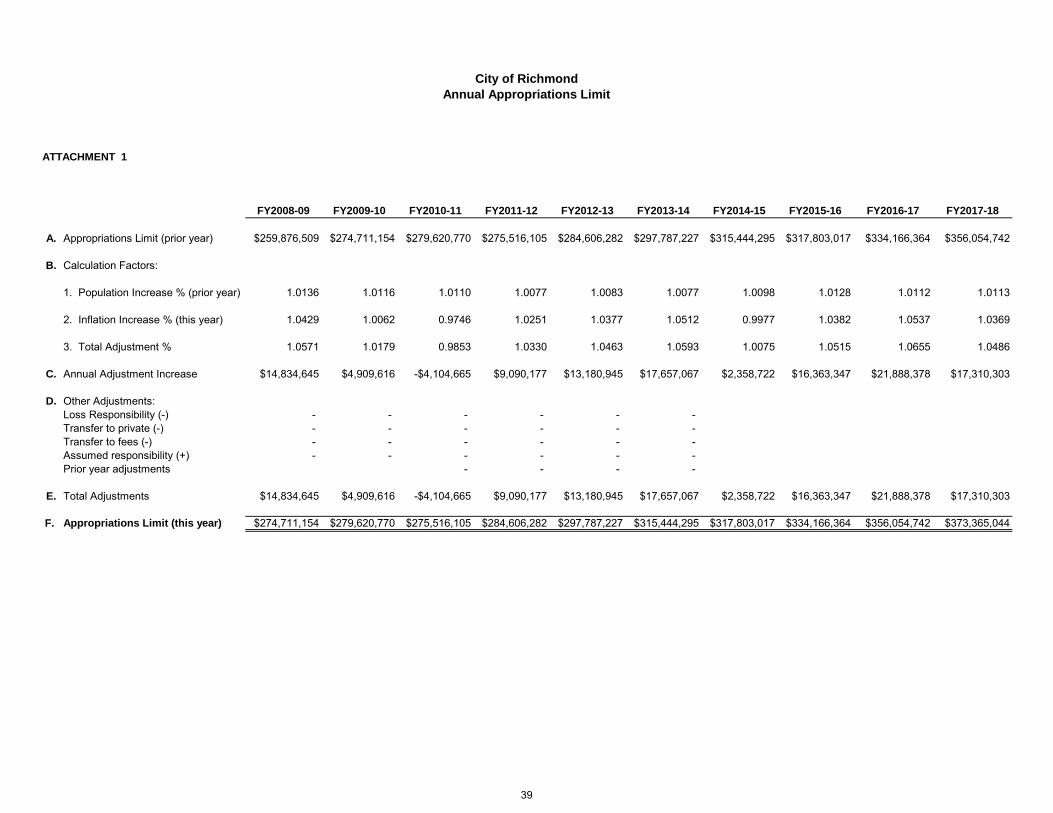
City of Richmond
Annual Appropriations Limit
ATTACHMENT 1
FY2008-09 FY2009-10 FY2010-11 FY2011-12 FY2012-13 FY2013-14 FY2014-15 FY2015-16 FY2016-17 FY2017-18
A. Appropriations Limit (prior year) $259,876,509 $274,711,154 $279,620,770 $275,516,105 $284,606,282 $297,787,227 $315,444,295 $317,803,017 $334,166,364 $356,054,742
B. Calculation Factors:
1. Population Increase % (prior year) 1.0136 1.0116 1.0110 1.0077 1.0083 1.0077 1.0098 1.0128 1.0112 1.0113
2. Inflation Increase % (this year) 1.0429 1.0062 0.9746 1.0251 1.0377 1.0512 0.9977 1.0382 1.0537 1.0369
3. Total Adjustment % 1.0571 1.0179 0.9853 1.0330 1.0463 1.0593 1.0075 1.0515 1.0655 1.0486
C. Annual Adjustment Increase $14,834,645 $4,909,616 -$4,104,665 $9,090,177 $13,180,945 $17,657,067 $2,358,722 $16,363,347 $21,888,378 $17,310,303
D. Other Adjustments:
Loss Responsibility (-) - - - - - -
Transfer to private (-) - - - - - -
Transfer to fees (-) - - - - - -
Assumed responsibility (+) - - - - - -
Prior year adjustments - - - -
E. Total Adjustments $14,834,645 $4,909,616 -$4,104,665 $9,090,177 $13,180,945 $17,657,067 $2,358,722 $16,363,347 $21,888,378 $17,310,303
F. Appropriations Limit (this year) $274,711,154 $279,620,770 $275,516,105 $284,606,282 $297,787,227 $315,444,295 $317,803,017 $334,166,364 $356,054,742 $373,365,044
39
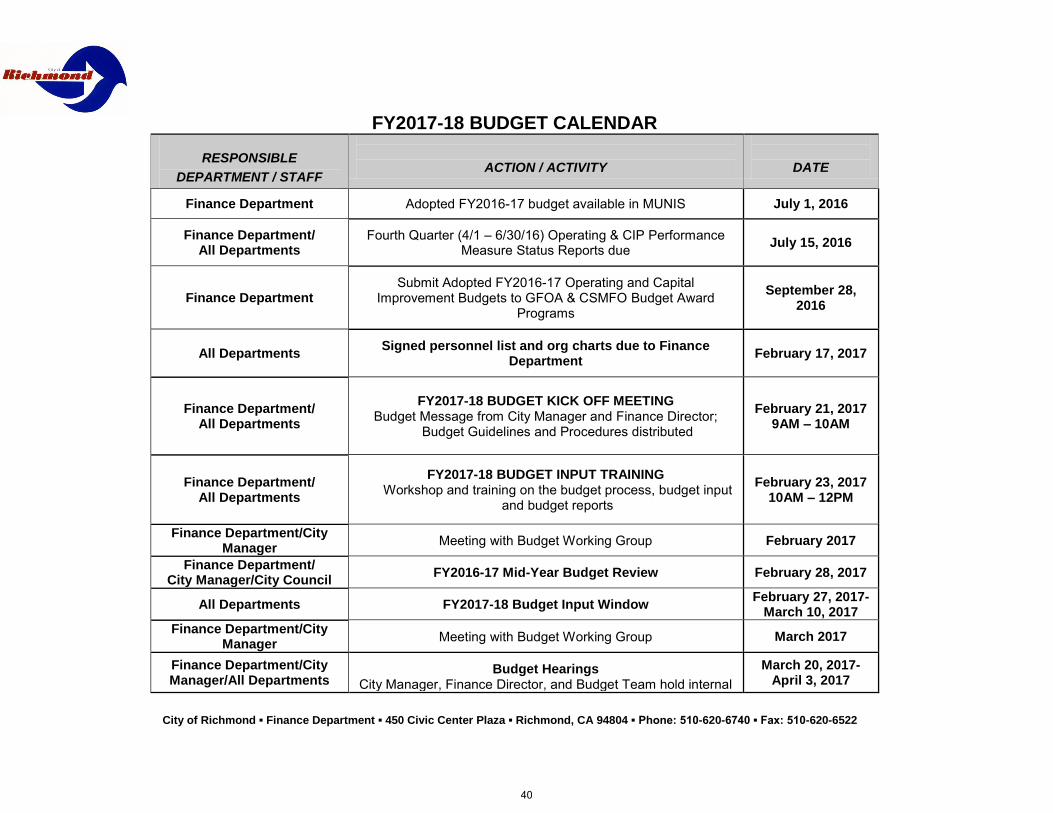
FY2017-18 BUDGET CALENDAR
City of Richmond ▪ Finance Department ▪ 450 Civic Center Plaza ▪ Richmond, CA 94804 ▪ Phone: 510-620-6740 ▪ Fax: 510-620-6522
RESPONSIBLE
DEPARTMENT / STAFF
ACTION / ACTIVITY
DATE
Finance Department Adopted FY2016-17 budget available in MUNIS July 1, 2016
Finance Department/ All Departments
Fourth Quarter (4/1 – 6/30/16) Operating & CIP Performance Measure Status Reports due
July 15, 2016
Finance Department Submit Adopted FY2016-17 Operating and Capital
Improvement Budgets to GFOA & CSMFO Budget Award Programs
September 28, 2016
All Departments Signed personnel list and org charts due to Finance
Department February 17, 2017
Finance Department/ All Departments
FY2017-18 BUDGET KICK OFF MEETING
Budget Message from City Manager and Finance Director; Budget Guidelines and Procedures distributed
February 21, 2017
9AM – 10AM
Finance Department/ All Departments
FY2017-18 BUDGET INPUT TRAINING Workshop and training on the budget process, budget input
and budget reports
February 23, 2017
10AM – 12PM
Finance Department/City Manager
Meeting with Budget Working Group February 2017
Finance Department/ City Manager/City Council
FY2016-17 Mid-Year Budget Review February 28, 2017
All Departments FY2017-18 Budget Input Window February 27, 2017-
March 10, 2017
Finance Department/City Manager
Meeting with Budget Working Group March 2017
Finance Department/City Manager/All Departments
Budget Hearings City Manager, Finance Director, and Budget Team hold internal
March 20, 2017- April 3, 2017
40

FY2017-18 BUDGET CALENDAR
City of Richmond ▪ Finance Department ▪ 450 Civic Center Plaza ▪ Richmond, CA 94804 ▪ Phone: 510-620-6740 ▪ Fax: 510-620-6522
budget hearings with departments to review proposed FY2017-18 Operating & Capital Improvement Budgets
Finance Department/City Manager
Meeting with Budget Working Group April 2017
Finance Department/ City Manager/City Council
Study Session with City Manager and City Council Transmit to Council proposed Operating Budget for FY2017-18
and FY2017-18 to 2021-22 Capital Improvement Plan
May 2, 2017
Finance Department/ City Manager/City Council Departmental Budget Presentations May 16, 2017
Finance Department/ City Manager/City Council
Departmental Budget Presentations continued; Budget Checklist created
May 23, 2017
Finance Department/ City Manager/City Council
City Council review and direction on Budget Checklist and changes to proposed budget
June 6, 2017
Finance Department/City Manager/City Council
City Council review and direction on Budget Checklist and changes to proposed budget continued
June 20, 2017
Finance Department/ City Manager/City Council
Council to adopt 2017-18 Operating Budget, FY2017-18 to FY2021-22 Capital Improvement Plan, and GANN Limit
June 27, 2017
Finance Department Adopted FY2017-18 budget available in MUNIS July 1, 2017
Finance Department Submit Adopted Operating and Capital Improvement Budgets to
GFOA & CSMFO Budget Award Programs September 27,
2017
41

This page is intentionally left blank
42

CITY OF RICHMOND, CALIFORNIA
The City of Richmond is located in the nine-county San Francisco Bay Area
in West Contra Costa County. Major nearby Bay Area cities and
employment centers include: the City of Oakland, 9 miles south; the City of
San Francisco, 17 miles west; and the City of San Jose, 50 miles south.
Richmond’s land mass forms a promontory that stretches into the San
Francisco and San Pablo bays. This shoreline defines a significant portion
of the City’s borders to the north, west and south. Neighboring San
Francisco and Marin County provide attractive backdrops from Richmond
across the Bay. The cities of El Cerrito, San Pablo and Pinole as well as
unincorporated areas of Contra Costa County border Richmond to the north
and east; and the Berkeley Hills, San Pablo and Sobrante ridges frame the
eastern edge of the City.
Richmond is known for its unique history and role in the World War II home
front effort. Richmond is home to the Rosie the Riveter/World War II Home
Front National Historical Park. Between 1940 and 1945 tens-of-thousands
of workers from all over the country streamed into the City to support
wartime industries. The City was home to four Kaiser shipyards which
housed the most productive wartime shipbuilding operations of World War
II, launching 747 ships during the war. The City was also home to
approximately five war-related industries - more than any other city of its
size in the United States.
Today, the City is an important oil refining, industrial, commercial,
transportation, shipping and government center. Active redevelopment
projects in the downtown and waterfront areas and commercial expansion
in the City’s Hilltop area, along the Interstate 80 and Interstate 580
corridors, and along the Richmond Parkway have added to the tax base of
the City in recent years.
43
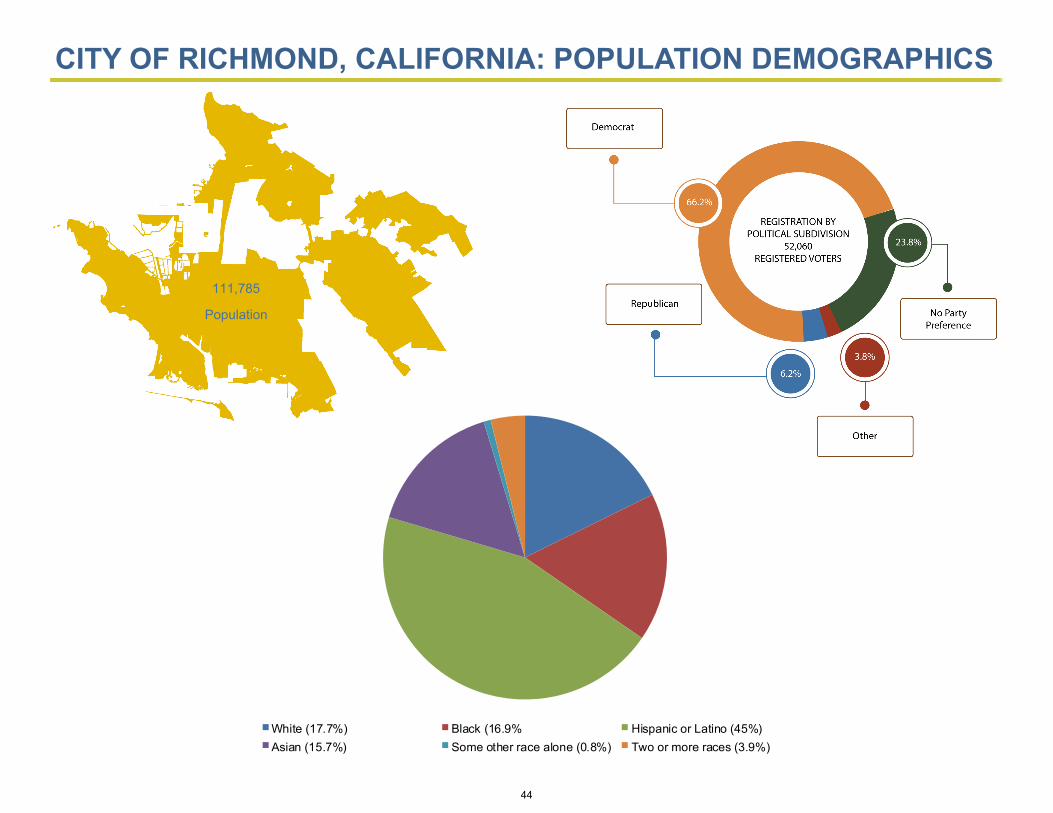
CITY OF RICHMOND, CALIFORNIA: POPULATION DEMOGRAPHICS
White (17.7%) Black (16.9% Hispanic or Latino (45%)
Asian (15.7%) Some other race alone (0.8%) Two or more races (3.9%)
111,785
Population
44

CITY OF RICHMOND, CALIFORNIA: ECONOMICS
$ 0.28510 - MISC
$ 0.00307 - OTHER COUNTY
$ 0.05907 - COMMUNITY COLLEGE
$ 0.02509 - EBRPD
$ 0.04628 - AC TRANSIT
$ 0.01279 - WEST COUNTY HEALTH CARE
$ 0.12157 - COUNTY GENERAL
$ 0.13834 - K-12 SCHOOLS ERAF
$ 0.27557 - WCCUSD
$ 0.28510 - RICHMOND GENERAL
PROPERTY TAX BREAKDOWN
$423,775
AVERAGE LIST PRICE OF NEW AND EXISTING
DETACHED, SINGLE FAMILY HOMES IN RICHMOND
$390,000
MEDIAN SALES PRICE OF NEW AND EXISTING
DETACHED, SINGLEFAMILY HOMES IN RICHMOND
4.8%
5.2%
RICHMOND
UNEMPLOYMENT
RATE
STATE
UNEMPLOYMENT
RATE
TOP CITY OF RICHMOND EMPLOYERS
CHEVRON REFINERY
WEST CONTRA COSTA UNIFIED SCHOOL DISTRICT
SOCIAL SECURITY ADMINISTRATION
BLUE APRON, INC.
U.S. POSTAL SERVICE
CONTRA COSTA COUNTY
CITY OF RICHMOND
THE PERMANENTE MEDICAL GROUP
KAISER FOUNDATION HOSPITALS
COSTCO WHOLESALE
MEDIAN HOUSEHOLD
INCOME
RICHMOND - $61,814
CALIFORNIA - $67,739
45
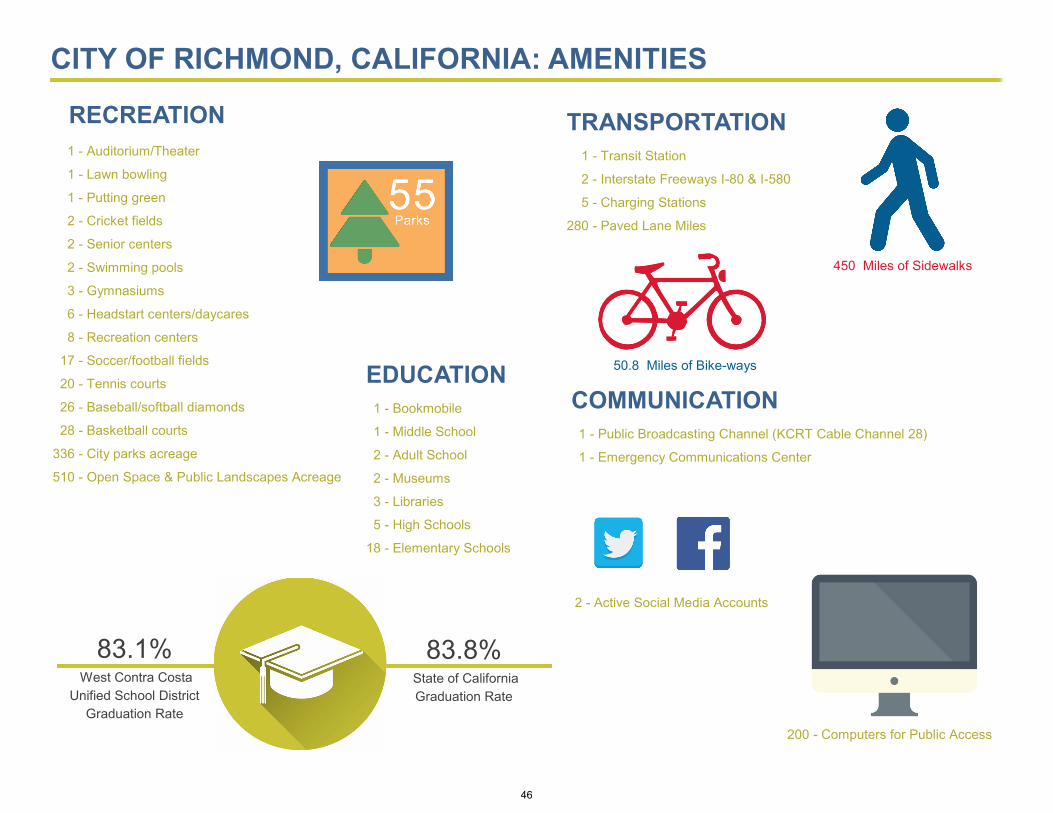
CITY OF RICHMOND, CALIFORNIA: AMENITIES
83.1% West Contra Costa
Unified School District
Graduation Rate
83.8% State of California
Graduation Rate
1 - Auditorium/Theater
1 - Lawn bowling
1 - Putting green
2 - Cricket fields
2 - Senior centers
2 - Swimming pools
3 - Gymnasiums
6 - Headstart centers/daycares
8 - Recreation centers
17 - Soccer/football fields
20 - Tennis courts
26 - Baseball/softball diamonds
28 - Basketball courts
336 - City parks acreage
510 - Open Space & Public Landscapes Acreage
EDUCATION
1 - Bookmobile
1 - Middle School
2 - Adult School
2 - Museums
3 - Libraries
5 - High Schools
18 - Elementary Schools
RECREATION
COMMUNICATION
1 - Public Broadcasting Channel (KCRT Cable Channel 28)
1 - Emergency Communications Center
TRANSPORTATION
1 - Transit Station
2 - Interstate Freeways I-80 & I-580
5 - Charging Stations
280 - Paved Lane Miles
50.8 Miles of Bike-ways
450 Miles of Sidewalks
200 - Computers for Public Access
2 - Active Social Media Accounts
46
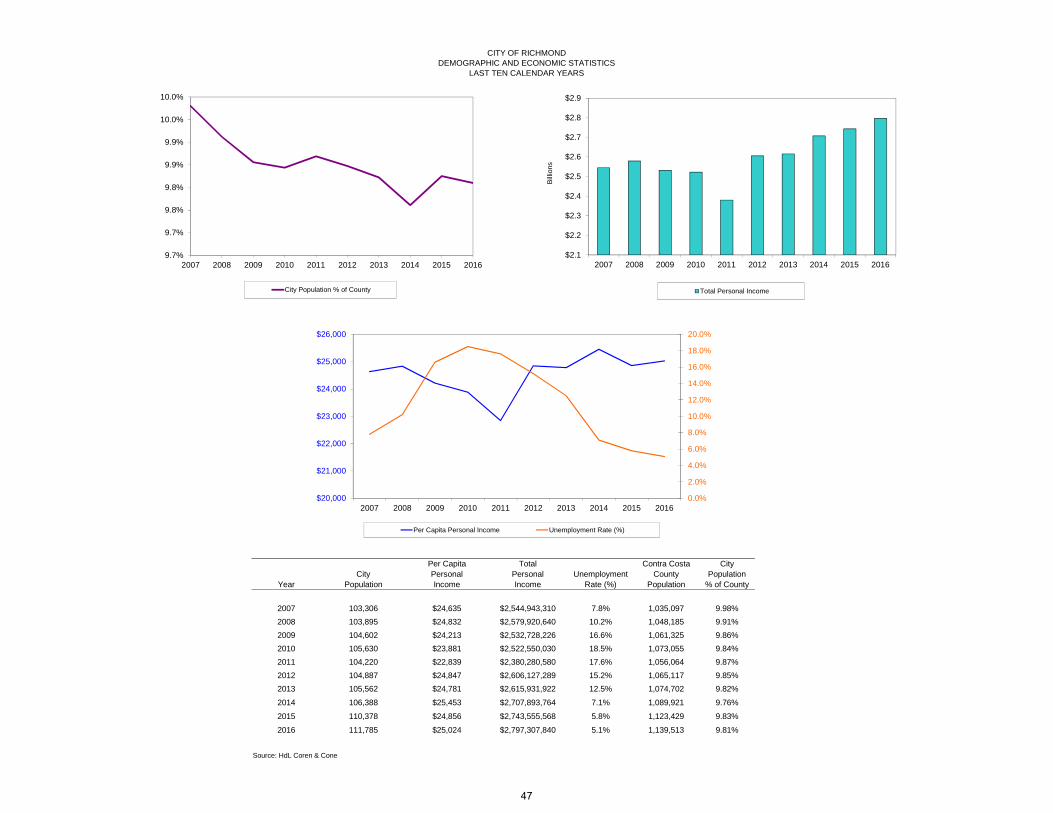
CITY OF RICHMONDDEMOGRAPHIC AND ECONOMIC STATISTICS
LAST TEN CALENDAR YEARS
Per Capita Total Contra Costa CityCity Personal Personal Unemployment County Population
Year Population Income Income Rate (%) Population % of County
2007 103,306 $24,635 $2,544,943,310 7.8% 1,035,097 9.98%2008 103,895 $24,832 $2,579,920,640 10.2% 1,048,185 9.91%2009 104,602 $24,213 $2,532,728,226 16.6% 1,061,325 9.86%2010 105,630 $23,881 $2,522,550,030 18.5% 1,073,055 9.84%2011 104,220 $22,839 $2,380,280,580 17.6% 1,056,064 9.87%2012 104,887 $24,847 $2,606,127,289 15.2% 1,065,117 9.85%2013 105,562 $24,781 $2,615,931,922 12.5% 1,074,702 9.82%
2014 106,388 $25,453 $2,707,893,764 7.1% 1,089,921 9.76%
2015 110,378 $24,856 $2,743,555,568 5.8% 1,123,429 9.83%
2016 111,785 $25,024 $2,797,307,840 5.1% 1,139,513 9.81%
Source: HdL Coren & Cone
9.7%
9.7%
9.8%
9.8%
9.9%
9.9%
10.0%
10.0%
2007 2008 2009 2010 2011 2012 2013 2014 2015 2016
City Population % of County
$2.1
$2.2
$2.3
$2.4
$2.5
$2.6
$2.7
$2.8
$2.9
2007 2008 2009 2010 2011 2012 2013 2014 2015 2016
Billi
ons
Total Personal Income
0.0%
2.0%
4.0%
6.0%
8.0%
10.0%
12.0%
14.0%
16.0%
18.0%
20.0%
$20,000
$21,000
$22,000
$23,000
$24,000
$25,000
$26,000
2007 2008 2009 2010 2011 2012 2013 2014 2015 2016
Per Capita Personal Income Unemployment Rate (%)
47
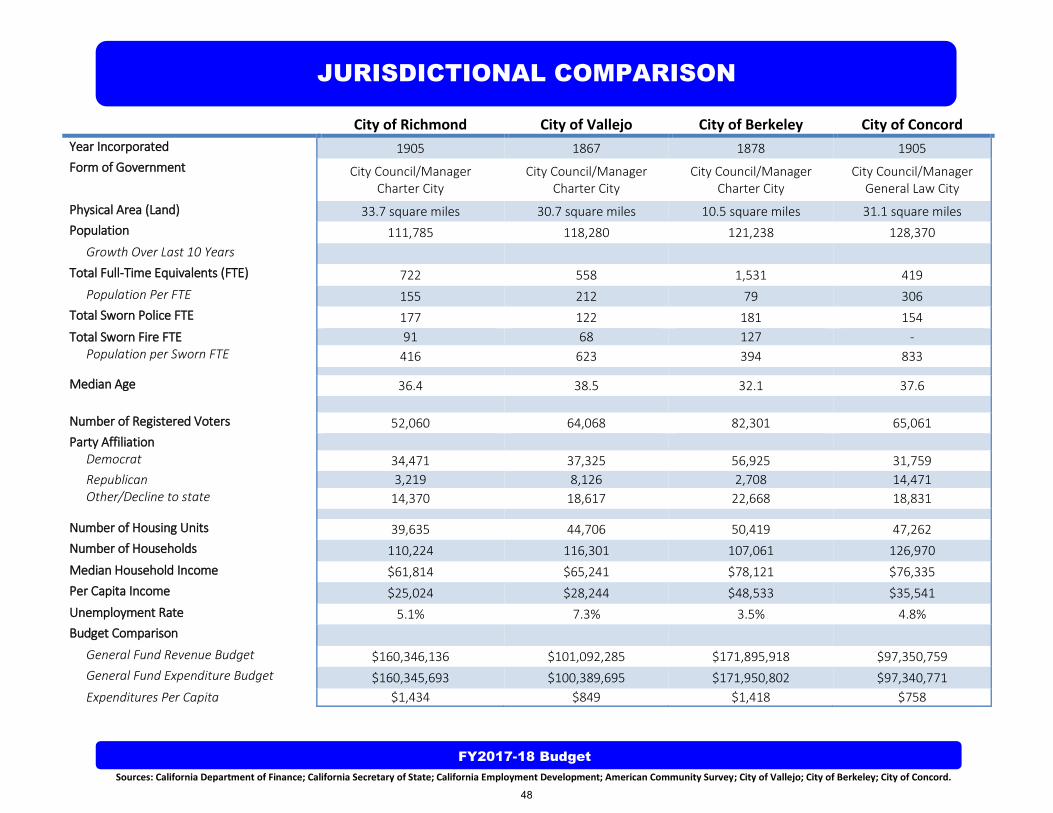
JURISDICTIONAL COMPARISON
FY2017-18 Budget
Sources: California Department of Finance; California Secretary of State; California Employment Development; American Community Survey; City of Vallejo; City of Berkeley; City of Concord.
City of Richmond City of Vallejo City of Berkeley City of Concord
Year Incorporated 1905 1867 1878 1905
Form of Government City Council/Manager Charter City
City Council/Manager Charter City
City Council/Manager Charter City
City Council/Manager General Law City
Physical Area (Land) 33.7 square miles 30.7 square miles 10.5 square miles 31.1 square miles
Population 111,785 118,280 121,238 128,370
Growth Over Last 10 Years
Total Full-Time Equivalents (FTE) 722 558 1,531 419
Population Per FTE 155 212 79 306
Total Sworn Police FTE 177 122 181 154
Total Sworn Fire FTE 91 68 127 - Population per Sworn FTE 416 623 394 833
Median Age 36.4 38.5 32.1 37.6
Number of Registered Voters 52,060 64,068 82,301 65,061
Party Affiliation Democrat 34,471 37,325 56,925 31,759
Republican 3,219 8,126 2,708 14,471 Other/Decline to state 14,370 18,617 22,668 18,831
Number of Housing Units 39,635 44,706 50,419 47,262
Number of Households 110,224 116,301 107,061 126,970
Median Household Income $61,814 $65,241 $78,121 $76,335
Per Capita Income $25,024 $28,244 $48,533 $35,541
Unemployment Rate 5.1% 7.3% 3.5% 4.8%
Budget Comparison
General Fund Revenue Budget $160,346,136 $101,092,285 $171,895,918 $97,350,759
General Fund Expenditure Budget $160,345,693 $100,389,695 $171,950,802 $97,340,771
Expenditures Per Capita $1,434 $849 $1,418 $758
48
OVERVIEW OF FINANCIAL OPERATIONS
FY2017-18 Budget
Financial Statements
Since Fiscal Year 2001-02, the City has prepared its audited Basic Financial Statements (referred to as General Purpose Financial Statements in previous years) in accordance with Governmental Accounting Standards Board Statement No. 34 (GASB 34). The Basic Financial Statements provide both government-wide financial statements with a long-term perspective on the City’s activities and the more traditional fund-based financial statements that focus on near-term inflows, outflows, and balances of spendable financial resources. The government-wide financial statements report on a full accrual basis and include comprehensive reporting of the City’s infrastructure and other fixed assets.
Financial and Accounting Information
The City maintains its accounting records in accordance with Generally Accepted Accounting Principles (GAAP) and the standards established by the Governmental Accounting Standards Board (GASB). Combined financial statements are produced following the close of each fiscal year.
The City Council employs an independent certified public accountant, who, at such time or times as specified by the City Council, at least annually, and at such other times as they determine, examines the financial statements of the City in accordance with generally accepted auditing standards, including tests of the accounting records and other auditing procedures as such accountant considers necessary. As soon as practicable after the end of the fiscal year, the independent accountant submits a final audit and report to the City Council.
The accounts of the City are organized on the basis of funds and account groups, each of which is considered a separate accounting entity. The operations of each fund are accounted for with a separate set of self-balancing accounts that comprise its assets, liabilities, fund equity, revenues and expenditures, or expenses, as appropriate. Government resources are allocated to and accounted for in individual funds based upon the purposes for which they are to be spent and the means by which spending activities are controlled. The various governmental funds are grouped into three broad fund categories (governmental, proprietary, and fiduciary).
49
FY2017-18 Budget
Budget
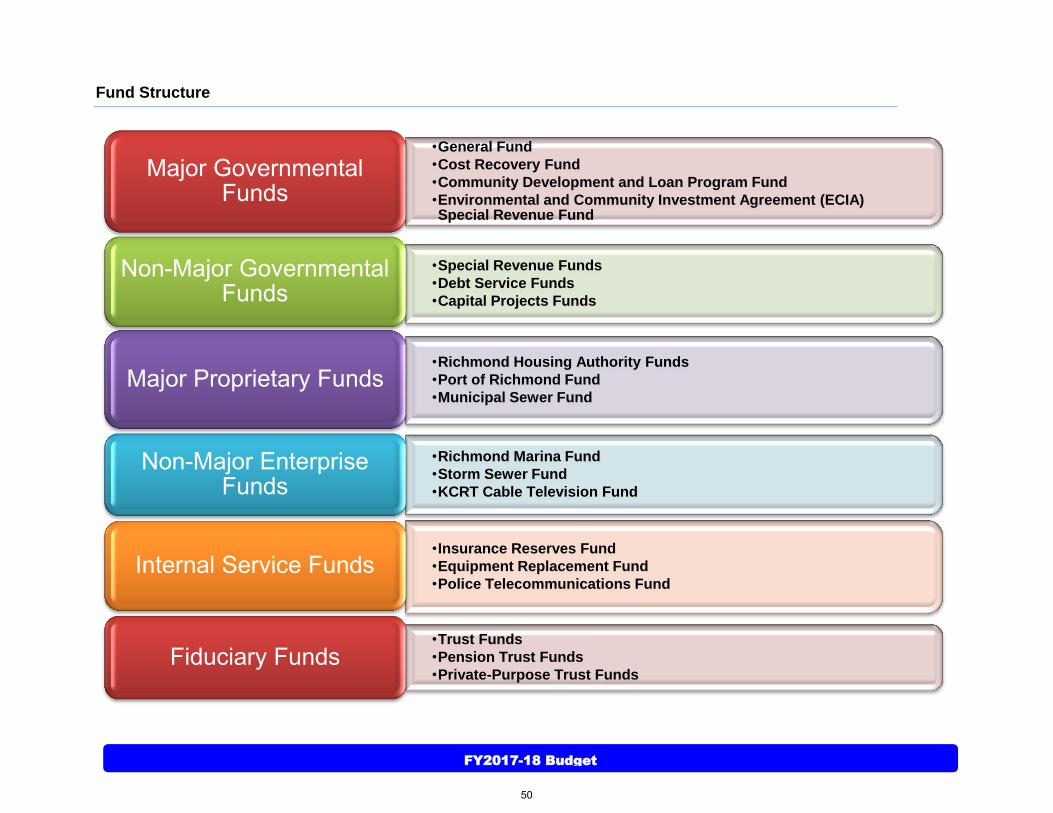
Fund Structure
•General Fund
•Cost Recovery Fund
•Community Development and Loan Program Fund
•Environmental and Community Investment Agreement (ECIA) Special Revenue Fund
Major Governmental Funds
•Special Revenue Funds
•Debt Service Funds
•Capital Projects Funds
Non-Major Governmental Funds
•Richmond Housing Authority Funds
•Port of Richmond Fund
•Municipal Sewer Fund Major Proprietary Funds
•Richmond Marina Fund
•Storm Sewer Fund
•KCRT Cable Television Fund
Non-Major Enterprise Funds
•Insurance Reserves Fund
•Equipment Replacement Fund
•Police Telecommunications Fund Internal Service Funds
•Trust Funds
•Pension Trust Funds
•Private-Purpose Trust Funds Fiduciary Funds
50
FY2017-18 Budget
Budget
Governmental Funds
Governmental funds account for governmental activities mostly supported by taxes and charges for services. All governmental funds are accounted for on the "current financial resources" measurement focus and the modified accrual basis of accounting.
Under the modified accrual basis of accounting, revenues are recognized in the accounting period in which they become both measurable and available to finance expenditures of the current period. Expenditures are recorded in the accounting period in which the related fund liability is incurred.
The City has both major and non-major governmental funds. Information is presented separately for each major governmental fund and in the aggregate for non-major governmental funds. The City reports the following major governmental funds: General Fund is used for all general revenues of the City not specifically levied or collected for other City funds and the related expenditures. The General Fund accounts for all financial resources of a governmental unit which are not accounted for in another fund.
Cost Recovery Special Revenue Fund record the receipt and use of monies for services provided to the public and developers.
Community Development and Loan Programs Fund accounts for the receipt of Community Development Block Grant, HOME Investment Partnership Program, and Neighborhood Stabilization Program grant monies and the use of the grants. The Fund also accounts for the low and moderate income housing activities of the City as Housing Successor to the former Redevelopment Agency, and activities related to the City’s loan from the California Department of Toxic Substances Control for the Miraflores Remediation project. The grants and loan programs are to be used to provide, within the City of Richmond, new affordable housing, improve existing housing conditions, assist homeless and disabled with housing, and to expand economic opportunities in business, and employment for low and moderate income residents.
Environmental and Community Investment Agreement (ECIA) Special Revenue Fund accounts for funding received from Chevron in conjunction with the Chevron Modernization Project Environmental and Community Investment Agreement to fund various projects and programs within the City of Richmond.
Proprietary Funds
Proprietary Funds account for business-type activities whose functions are intended to recover all or a significant portion of their costs through user fees and charges to external users of goods and services. Proprietary funds are accounted for using the "economic resources" measurement focus and the accrual basis of accounting.
Under the accrual basis of accounting, revenues are recognized in the period in which they are earned while expenses are recognized in the period in which the liability is incurred, regardless of when cash changes hands.
51
FY2017-18 Budget
Budget
Operating revenues in the proprietary funds are those revenues that are generated from the primary operations of the fund. All other revenues are reported as non-operating revenues. Operating expenses are those expenses that are essential to the primary operations of the fund. All other expenses are reported as non-operating expenses.
Proprietary funds of the City are two types: (1) enterprise funds and (2) internal service funds.
Enterprise funds are used to report any activity for which a fee is charged to external users for goods or services provided. The City reports the following major proprietary funds:
Municipal Sewer Fund accounts for all financial transactions relating to the City’s Wastewater and Collection Treatment. Services are on a user charge basis to residents and business owners located in Richmond.
Port of Richmond Fund accounts for all financial transactions relating to the City-owned marine terminal facilities and commercial property rentals.
Richmond Housing Authority Fund accounts for all funds provided by the Department of Housing and Urban Development (HUD) to assist low income families in obtaining decent, safe and sanitary housing. The Richmond Housing Authority, a component unit of the City, manages this fund.
The City reports the following non-major enterprise funds:
Cable TV Fund was set up for the administration and enforcement of the franchise agreements with two cable television systems, management of municipal cable channel, departmental video services, media and public information, and telecommunications planning. The fund records revenue received from franchise fees and indirect charges to other funds and administration expenses incurred in operating the system.
Richmond Marina Fund records revenue collected from berth rentals and the use of marina facilities. The fund also records expenses incurred for the operation of the facility and for the payment of the loan from the California Department of Boating and Waterways.
Storm Sewer Fund records the revenue from storm water fees and transfers from operations reserves. It also records the expenses of maintaining a clean storm sewer system so that the City is in compliance with the federally mandated Storm Water Pollution Prevention Program.
Internal service funds are used to finance and account for goods and services provided by a designated department to other departments in the City on a cost-reimbursement basis. The City maintains the following internal service funds:
Equipment Replacement Fund is used to report activities related to replacement of City vehicles. Charges to departments are
52

FY2017-18 Budget
Budget
allocated based on acquisition cost and annual increase for inflation, which are amortized over the useful life.
Insurance Reserves Fund is used to report activities related to employees’ claims due to industrial injuries and activities related to general claims against the City for damages incurred. Charges to departments are allocated based on average number of claims and dollar value, payroll costs incurred, and number of full-time equivalents in each department.
Police Telecommunications Fund is used to report activities related to Computer Aided Dispatch (CAD) and Records Management System (RMS). Charges are allocated based on actual usage of services between local area Police and Fire agencies.
Fiduciary Funds
Fiduciary funds are used to account for resources that are held by the government as a trustee or agent for parties outside the government and cannot be used to support the government’s own programs. The City reports the following fiduciary funds:
Pension Trust Funds were established to account for revenues and expenditures related to City retirees’ pension plans. The City administers the activities of certain pension funds on behalf of retirees including the following closed pension plans of the City: General Pension, Police and Firemen Pension and Garfield Pension. All current and future City employees are enrolled in CalPERS (California Public Employee’s Retirement System). CalPERS manages all of the financial activities related to the pension plans offered by the City to current and future City employees.
Private-Purpose Trust Funds are used to account for assets held by the City as an agent for an outside agency, including the following funds: Point Molate Fund and Successor Agency to the Richmond Community Redevelopment Agency Fund.
53
FY2017-18 Budget
Budget
Financial Policies
Financial policies provide guidelines for the overall fiscal management of the City. The policies help guide current and long-range fiscal planning. The City Council approves and can amend the policies to address changing circumstances and conditions. Below is a summary of the City’s financial policies; full policies can be found in the appendices of this document. Structural Balance Policy
The City shall maintain structurally balanced budgets whereby one-time funds can be spent only on one-time uses and ongoing funds can be spent on ongoing (or one-time) uses. In addition, budget enhancements can be approved only if a new source of permanent revenues is received that will cover the future cost of such enhancements. This policy is in the process of being further developed.
Reserves Policy
The City shall maintain year end contingency reserve balances in the General Fund, including PERS savings reserves but excluding departmental carryover, of minimum 7% of next year’s budgeted General Fund expenditures. City Council approval is required before any withdrawals from the reserve fund. The Council shall have the discretion to use the reserve for one time emergencies only and not to be used for ongoing expenses.
Investment Policy
The City’s Investment Policy provides guidelines for City officers charged with the investment of idle cash to ensure prudent investment and cash management practices. The Investment Policy establishes three criteria for selecting investment vehicles: safety, liquidity and yield. The Investment Policy states that an adequate percentage of the portfolio should be maintained in liquid short-term securities that can be converted to cash if necessary to meet disbursement requirements and that yield or “rate of return” on an investment should be a consideration only after the requirements of safety and liquidity are met. Debt Policy The City’s Debt Policy limits General Fund net debt service to 10% of General Fund revenues and sets forth detailed debt management and refunding practices.
Swap Policy
The City is authorized under California Government Code Section 5922 to enter into interest rate swaps to reduce the amount and duration of rate, spread, or similar risk when used in combination with the issuance of bonds. The Swap Policy provides procedural
54
FY2017-18 Budget
Budget
direction to the City, the Richmond Housing Authority, the Richmond Community Redevelopment Agency and the Richmond Joint Powers Finance Authority regarding the utilization, execution, and management of interest rate swaps and related instruments (collectively, “interest rate swaps”). Periodically, but at least annually, the City will review the Swap Policy and will make modifications as appropriate due to changes in the business environment or market conditions.
Grants Policy
The City will pursue grant funding from federal, state, and other sources, consistent with identified City goals and objectives. The City Council approves all grant applications in excess of $5,000 and delegates receipt and contract execution to the City Manager. Grants opportunities are evaluated individually, considering the benefits of the programs and the ongoing impacts to the City if grant funding is no longer available.
Budgeting
Budgetary Accounting
The City adopts a budget annually to be effective July 1, for the ensuing fiscal year. The budgets are adopted on a basis substantially consistent with generally accepted accounting principles (GAAP). Budgeted expenditures are adopted through the passage of a resolution. This resolution constitutes the maximum authorized expenditures for the fiscal year and cannot legally be exceeded except by subsequent amendments of the budget by the City Council. The City uses an encumbrance system as an extension of normal budgetary accounting for the General Fund, special revenue funds, and capital projects funds. Under this system, purchase orders, contracts, and other commitments for the expenditure of monies are recorded in order to reserve that portion of applicable appropriations. Encumbrances outstanding at year-end are recorded as reservations of fund balance since they do not constitute expenditures or liabilities. Unencumbered and unexpended appropriations lapse at year-end.
Budget Development Process
The budget development process is the formal method through which the City establishes its program priorities, goals and service levels for the upcoming fiscal year. Through the budget development process, policy is set, programs are established, service levels are expressed, performance measures are articulated, and resources are identified.
The City returned to an annual budget beginning in fiscal year 2015-16 after implementing a biennial budget for the fiscal years 2013-14 and 2014-15. Management decided that an annual budget was more suitable given the economic climate. However, the City continues to maintain a long-term outlook through its five-year financial forecast.
55
FY2017-18 Budget
Budget
The “budgetary” method of accounting is used for preparing the City’s budget. The budget is a plan of revenue and expense activities for the fiscal year and is intended to provide a clear, concise, and coordinated financial program to attain the City’s goals and objectives. Revenue estimates are derived using historical and economic data on the state and local levels. The budget should be balanced with current revenues equal to or greater than current expenditures.
Responsibilities:
1. The Finance Director has the overall administrative responsibility for planning, coordinating, analyzing, preparing and issuing the budget.
2. Each department director is responsible for preparing and submitting the budget for the department and its subsidiary divisions in accordance with the budget instructions.
3. The City Manager, in close consultation with the division and department directors, is responsible for making the final determination of the proposed budget to be submitted for approval to the City Council.
4. The City Council is responsible for approving the annual operating budget.
Preparing the Budget:
1. As a general rule, from October to December, the City Manager, the Finance Director, and Budget Division hold a series of planning meetings to analyze financial performance and determine preliminary budget guidelines for the upcoming fiscal year.
2. Following the planning meetings, the Finance Director prepares strategy recommendations for the upcoming budget and presents them to the City Manager.
3. The City Manager and the Finance Director make a final determination of the budget strategy and guidelines. 4. In January and February, the Budget Division drafts the budget guidelines, instructions, supporting materials, forms and
worksheets, and distributes them to all departments and divisions responsible for budget preparation.
The budget guidelines are based on financial information that includes:
a. New budget policies for the upcoming fiscal year. b. Department worksheets with historical actual and proposed operating revenue and expenses. c. Variance analysis (actual versus budgeted financial activity) and forecast analyses.
5. The Budget Division coordinates a series of workshops to provide technical assistance to staff who is involved in preparing
budgets for their departments or divisions. 6. Under the direction of the department director, departments and divisions prepare their budgets.
a. Budgets are expected to conform to the standards set forth in the Budget Guidelines and Instructions manual.
56

FY2017-18 Budget
Budget
b. Should the budget deviate from those standards, the department or division prepare a justification. c. If a department’s proposed budget includes new programs, the department includes information and justification
on the programs including amounts that will be required to fund their implementation.
7. When the division and department budgets are completed, the department director reviews them and forwards them to the Budget Division.
8. The Budget Division compiles the divisional and departmental budgets into a draft for a single City-wide budget, analyzing all revenue and expenditure projections to ensure that they meet the City’s goals and objectives, adhere to the budget guidelines, and that no category has been overlooked.
9. The Budget Division presents to the City Manager and the Finance Director the completed draft budget and a master list of departments’ proposed new programs.
10. The City Manager, Finance Director, and department directors meet between March and the end of April to review the draft budget, make necessary adjustments, and determine which of the proposed new programs will be presented to the City Council for adoption. These meetings are an opportunity for each department and division to present their proposed budget and their justifications for new programs, and to enhance senior management’s knowledge of operational needs.
11. When the draft budget has been approved by the City Manager and the Finance Director, the adjusted divisional and departmental budgets are returned to the department directors for their information and acknowledgement.
12. In early May, the Budget Division compiles a brief summary of the draft budget and sends a copy to the City Council pursuant to the applicable City resolution.
13. The Budget Division distributes the draft budget summary to the City Council. At the May City Council meeting, the department directors hold a work session to inform the City Council about budget strategies and the financial data upon which it is based.
14. Based upon the City Council’s comments, the Budget Division may subsequently revise the draft budget. 15. Public hearings are conducted on the proposed budgets to review all appropriations and sources of financing. 16. At its June meeting, the City Council formally adopts the budget. Once adopted, the budget is the City Council’s approved
operational plan for the ensuing fiscal year.
Monitoring the Budget:
1. Once in place, the adopted budget becomes the main internal control document used to monitor and manage the City’s financial position.
2. Expenditures are controlled at the fund level for all budgeted departments within the City. This is th e level at which expenditures may not legally exceed appropriations.
3. Department directors review the monthly financial reports and prepare written explanations of significant variances between actual revenues and expenditures and the budget projections. These data are intended to help department directors control expenditures and maximize revenue.
4. The Budget Division prepares and submits to the City Manager and the Finance Director the monthly City-wide variance
57
FY2017-18 Budget
Budget
report for review. During this review, budgetary issues are addressed and corrective action is taken. 5. Throughout the year, department directors assist their divisions and departments in taking any necessary corrective action to
control costs. Budget Amendments: Amendments to the budget may be made throughout the fiscal year. A mid-year budget review is conducted and presented to the City Council in February. Any amendment or transfer of appropriations between object group levels within the same department must be authorized by the Finance Director or his/her designee. Appropriations of new monies, transfers between funds, or any amendment to the total level of appropriations require formal action through City Council resolution irrespective of amount. Supplemental appropriations financed with unanticipated revenues during the year must also be approved by the City Council.
Cost Allocation Plan
A Cost Allocation Plan is an analytical tool through which a city can apportion administrative or indirect costs to individual departments or cost centers within its organization. Most indirect costs are those expenditures that provide support services or oversight to each department citywide and typically include legislative, managerial, financial, administrative, legal, personnel, technology, and building and equipment use. The City uses a professionally prepared cost allocation plan to allocate indirect costs from central service departments to other City departments. City maintains two cost allocation plans: full cost and 2 CFR 225 (formerly OMB A-87) compliant. The primary goal is to distribute indirect costs in a fair and reasonable manner using established metrics based on industry standards.
Capital Improvement Planning
Each year the City adopts its Five-Year Capital Improvement Plan (“CIP”) containing a forecast of capital improvement needs and funds identified to meet those needs during the current budget fiscal year and the next four fiscal years. The CIP for FY2017-18 identifies approximately $28.1 million of funded capital improvement projects funded by capital project funds, enterprise funds, internal service funds, and Successor Agency funds; and a total of $64 million over the next five fiscal years. The unfunded capital improvement projects total $175.3 million.
Five-Year Strategic Business Plan
The City of Richmond’s Five-Year Strategic Business Plan is intended to serve as a blueprint for prospective opportunities, projects, and tasks. It looks at the next five years and outline the strategies, projects and programs that will support a phased implementation of the General Plan. The City’s Capital Improvement Plan (CIP) and Operating Budget then prioritize these projects and programs on an annual basis. All projects, programs and operations in the Strategic Plan will help to ensure the City is well maintained, safe
58
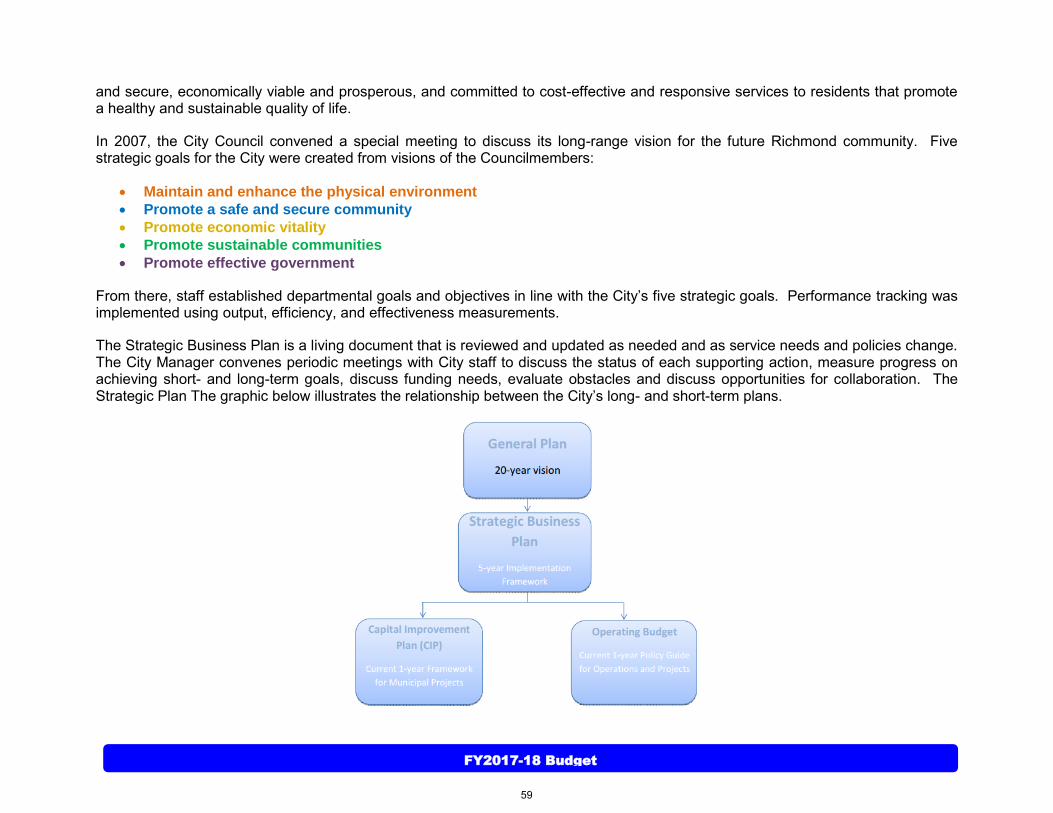
FY2017-18 Budget
Budget
and secure, economically viable and prosperous, and committed to cost-effective and responsive services to residents that promote a healthy and sustainable quality of life.
In 2007, the City Council convened a special meeting to discuss its long-range vision for the future Richmond community. Five strategic goals for the City were created from visions of the Councilmembers:
Maintain and enhance the physical environment
Promote a safe and secure community
Promote economic vitality
Promote sustainable communities
Promote effective government
From there, staff established departmental goals and objectives in line with the City’s five strategic goals. Performance tracking was implemented using output, efficiency, and effectiveness measurements.
The Strategic Business Plan is a living document that is reviewed and updated as needed and as service needs and policies change. The City Manager convenes periodic meetings with City staff to discuss the status of each supporting action, measure progress on achieving short- and long-term goals, discuss funding needs, evaluate obstacles and discuss opportunities for collaboration. The Strategic Plan The graphic below illustrates the relationship between the City’s long- and short-term plans.
59

FY2017-18 Budget
Budget
Major General Fund Revenue Sources
Property Taxes and Assessed Valuations
The City utilizes the facilities of the County for the assessment and collection of property related taxes for City purposes. The assessed valuation of property is established by the County Assessor and reported at 100% of the full cash value as of January 1, except for public utility property, which is assessed by the State Board of Equalization. City property related taxes are assessed and collected at the same time and on the same tax rolls as are county, school, and special district taxes.
The County collects the ad valorem property taxes. Taxes arising from the basic one percent levy are apportioned among local taxing agencies on the basis of a formula established by State law in 1979. Under this formula, the City receives a base year allocation plus an allocation on the basis of growth in assessed value (consisting of new construction, change of ownership and inflation). Taxes relating to voter-approved indebtedness are allocated to the relevant taxing agency. Taxes relating to voter-approved pension costs are allocated to the taxing agency. Beginning in Fiscal Year 1990-91 (with the adoption of new State legislation), the County has deducted the pro-rata cost of collecting property taxes from the City’s allocation.
Pursuant to Article XIIIA of the California Constitution, annual increases in property valuations by the County Assessor are limited to a maximum 2% unless properties are improved or sold. Transferred properties and improvements are assessed at 100% of full cash value. Therefore, the County tax rolls do not reflect values uniformly proportional to market values.
Business inventories are exempt from property taxation and are not included in the values shown in the following tables. Also excluded is the first $7,000 of the value of owner occupied residences, pursuant to the homeowners’ exemption under State law.
“Secured” property is real property which in the opinion of the County Assessor can serve as a lien to secure payment of taxes. “Utility” property is any property of a public utility which is assessed by the State Board of Equalization rather than the County Assessor, and which is also “secured” property.
In preparing its annual budgets, the City forecasts property taxes based on each of the specific categories of receipts (secured and unsecured, current and delinquent receipts, supplemental, and State replacement funds). Current receipts are derived from the County Assessor’s estimate of growth in assessed valuation, adjusted for estimates in growth for redevelopment project areas. Estimates of other property tax receipts are primarily based on historical collections.
Teeter Plan. The City is located within a county that is following the “Teeter Plan” (defined below) with respect to property tax collection and disbursement procedures. Under this plan, a county can implement an alternate procedure for the distribution of certain property tax levies on the secured roll pursuant to Chapter 3, Part 8, Division 1 of the Revenue and Taxation Code of the State of California (comprising Section 4701 through 4717, inclusive), commonly referred to as the “Teeter Plan.”
60

FY2017-18 Budget
Budget
Generally, the Teeter Plan provides for a tax distribution procedure by which secured roll taxes and assessments are distributed to taxing agencies within the county included in the Teeter Plan on the basis of the tax levy, rather than on the basis of actual tax collections. The County then receives all future delinquent tax payments, penalties and interest, and a complex tax redemption distribution system for all participating taxing agencies is avoided. While the County bears the risk of loss on delinquent taxes that go unpaid, it benefits from the penalties associated with these delinquent taxes when they are paid. In turn, the Teeter Plan provides participating local agencies with stable cash flow and the elimination of collection risk. The constitutionality of the Teeter Plan was upheld in Corrie v. County of Contra Costa, 110 Cal. App. 2d 210 (1952). The County was the first Teeter Plan county in the State when the Teeter Plan was enacted by the State Legislature in 1949.
The valuation of property is determined as of January 1 each year and equal installments of tax levied upon secured property become delinquent on the following December 10 and April 10. Taxes on unsecured property are due May 15 and become delinquent August 31.
Although the City receives its entire secured tax levy amount each year under the Teeter Plan, an indication of actual tax collections can be obtained from the history of collections of all entities levying taxes within the City limits.
Largest Taxpayers. Set forth in the following table are the ten largest secured taxpayers in the City for the Fiscal Year FY2016-17, based on assessed valuations within the City.
61

FY2017-18 Budget
Budget
FY2016-17 TOP TEN PROPERTY TAXPAYERS Top Property Owners Based on Net Values
Utility Users Tax
The City collects a Utility Users Tax (UUT) from utility users within the City’s boundaries. Such users are charged 10% of the total bill for electricity and gas services, and 9.5% of the total bill for telecommunication and cable television services. The tax is not applicable to State, County, or City agencies, insurance companies or banks. The Utility Users Tax currently represents the largest revenue source for the City.
62

FY2017-18 Budget
Budget
The Richmond Municipal Code Section 13.52.100 provides that any electric service user may annually elect to pay a maximum UUT that is calculated as the base amount of $1,148,137.54 for each percent of tax imposed for any tax year. The base amount is then adjusted annually by that percentage which is ninety percent (90%) of the total percentage of change in the United States Department of Labor, Bureau of Labor Statistics’ Gas (piped) and Electric Consumer Price Index for All Consumers Urban for the San Francisco/Oakland/San Jose Area. This is calculated on the basis of the two consecutive and most recently completed years for which data is available from the United States Department of Labor. In order to elect to pay the maximum UUT, a user of the electric service must enter into an agreement with the City Tax Administrator prior to the commencement of the tax year to pay the maximum tax liability directly to the City during the tax year. No portion of the maximum UUT is refundable in the event the service user subsequently determines that its tax liability under this chapter would have been less than the maximum UUT calculated as described above.
UUT as mentioned above consists on taxes to utilities such as cable television, gas and electricity, telecommunications (land lines and cell phones) and prepaid wireless cards – which is a new revenue as approved by the State of California in 2014 year with the passage Assembly Bill 1717. Stemming from these taxes, the City has two revenue streams related to the Chevron Refinery. The refinery opts to use the maximum UUT provision on a consistent basis. Additionally, within the UUT category the City has settlement payments related to litigation with the refinery. These two Chevron related streams account for over 63% of UUT as a whole. Furthermore, each revenue stream is analyzed independently based on prior year data and trends happening locally and legislation or changes happening at the state level. For example, for both cable television and telecommunications, there are less people
subscribing to these services (i.e. landlines), often opting for non-taxed services (dish services).
Sales and Use Taxes
The sales tax is an excise tax imposed on retailers for the privilege of selling tangible personal property. The use tax is an excise tax imposed on a person for the storage, use or other consumption of tangible personal property purchased from any retailer. The proceeds of sales and use taxes (collectively, “Sales Tax”) imposed within the boundaries of the City are distributed by the State to various agencies as shown below in the table below. The total Sales Tax rate for the City currently is 9.25% and is allocated as follows:
Rate Jurisdiction Purpose
3.69% State State's General Fund
0.50% State Local Public Safety Fund to support local criminal justice activities (1993)
0.25% State State's Education Protection Account to support school districts, county offices of education, charter schools, and community college districts.
0.50% State Local Revenue Fund to support local health and social services programs (1991 Realignment)
1.06% State Local Revenue Fund 2011
0.25% County Transportation
County transportation funds
1.00% Local City operations – Regular Sales Tax
63
FY2017-18 Budget
Budget
1.00% Local City operations – Measure Q/2004
1.00% Local City operations – Measure U/2014
9.25% Total Total Statewide Base Sales and Use Tax Rate
The Sales Tax category is made of several categories. Of significance are those collected by the State of California’s Board of Equalization, regular sales tax, and the two voter-approved extra half-cent Measure U and Measure Q sales taxes make up 75% of this revenue stream. The City works with revenue consultants, MuniServices, to produce these forecasts. The company provides quarterly updates that contain updated five year forecasts. They specifically look at California's economic and local trends to forecast future trends. Additionally, their Cash Receipts Analysis report presents performance information for the City, others in our county, geographical regions, and statewide by quarter, fiscal year to date and benchmark year. MuniServices also reviews the released sales tax permit and payment data separately from the allocation summaries State Board of Equalization. The other revenue streams within the Sales Tax category change from year to year based on different criteria. Those streams are analyzed individually and projected based on trends from prior years. One revenue in particular, the Vehicle License Fee Backfill Swap, is based directly on changes to AV. For this stream in particular, the City uses the same AV change as used for Secured Property Taxes.
Other Taxes
Other taxes include franchise fees, transient occupancy tax, and documentary transfer tax which is the largest amount collected under this revenue source. The City collects a tax (the “Documentary Transfer Tax”) on all transfers by deeds, instruments, writings or any other document by which lands, tenements, or other interests in real property are sold at a rate of $7.00 for each $1,000 or fractional part thereof of the consideration.
64

FY2017-18 Budget
Budget
Major Non-General Fund Revenue Sources
Following is a discussion of the City’s principal non-general fund revenue sources: charges for services, property taxes, federal grants, and other grants.
Charges for Services
These charges are imposed by two main departments of the City of Richmond – Water Resource Recovery and Human Resources. Water Resource Recovery department generates revenue from wastewater sewer charges. The wastewater sewer division receives revenues from fixed fees from residential, commercial, and industrial users as set by ordinance. While the residential fees are fixed based on the number of users, commercial and industrial pay a flat fee and a flow based fee. These non-residential fees (commercial & residential) are based on prior year usage. The Human Resources department receives revenue from general liability cost allocations and worker’s compensation charges. Charges are allocated to the departments to fund the City’s insurance reserves.
Property Taxes
The property taxes received outside the General Fund is from tax increment, special assessment tax (assessment district, floating lien), pension override, and secured and unsecured property taxes. The tax increment is collected and used in the Successor Agency to the Richmond Community Redevelopment Agency (RCRA) for the revitalization of physical, economic and social conditions of blighted areas and community enhancing programs to improve the general welfare and enhance the quality of life in the community. The other revenues are used on debt service, retirement benefits, bank fees, and other miscellaneous expenses. Projections of tax increment revenues are from hiring an outside consulting agency with assumptions from the assessor’s office. Assessed valuation determines the revenue from the special assessment tax each year. Pension override is a fixed rate of tax levied upon the taxable and personal property within the taxing districts. For secured property taxes - revenue is generated when the Assessor establishes the value of property (land or structures) on January 1st. This value is multiplied by the tax rate then some special charges are added i.e. sewer assessment charges. Unsecured property taxes are taxes against businesses for property that can be relocated such as business equipment, planes, and boats. The unsecured tax revenue comes from the prior year secured tax on January 1st multiplied by the tax rate.
Federal Grants
The revenue received from federal grants fund programs managed in four main departments - Housing Department, Employment and Training, Richmond Housing Authority, and the Successor Agency. Funding is received from the following sources: Department
65
FY2017-18 Budget
Budget
of Housing and Urban Development (HUD), Community and Block Development Grant (CDBG), Workforce Investment Act (WIA). While many of the grants are recurring, the City continues to explore and apply for grants in the future to better help serve our communities.
Other Grants
The revenue from other grants primarily fund Paratransit operations and capital improvement projects. Funding is received from the following local sources: Contra Costa Transit Authority, One Bay Area Grant Program, Safe Routes to School, Measure J, Bay Area Air Quality Management District.
Changes in Cash Balance
FY2017-18 Budget Summary illustrates changes in beginning and ending balances by fund. Below is a summary explaining variances of 10% or more by fund group. Other Operating Funds: Projected negative cash balance estimated to increase by 12% primarily due to historical negative balances in cost recovery funds. In this case, the existing negative balance in Code Enforcement will increase as proceeds from the Solid Waste JPA are transferred out for abatement programs. Special Revenue Funds: Projected cash balance is estimated to decrease by 18% primarily due to a draw down on reserves in the Environment & Community Investment Agreement (ECIA) fund for approved projects and programs. Capital Improvement Funds: Projected cash balance estimated to decrease by 26%. Most of the funds with positive cash balances and revenues have active projects, monies are rolled over from prior fiscal year, and remaining balances will be carried forward to next year’s budget. The negative ending balance is due to historical negative balances in Parks Projects and Traffic Impact Fee funds with no activity expected in fiscal year 2017-18. Enterprise Funds: Projected cash balance to increase by 13% due to proceeds from new Wastewater bond issuance. Internal Service Funds: Projected fund balance to decrease by 31% due to reduced allocations to City departments for insurance reserves. Housing Department Funds: Projected fund balance to decrease by 42% due to draw down on reserves in the Housing In-lieu fund.
66
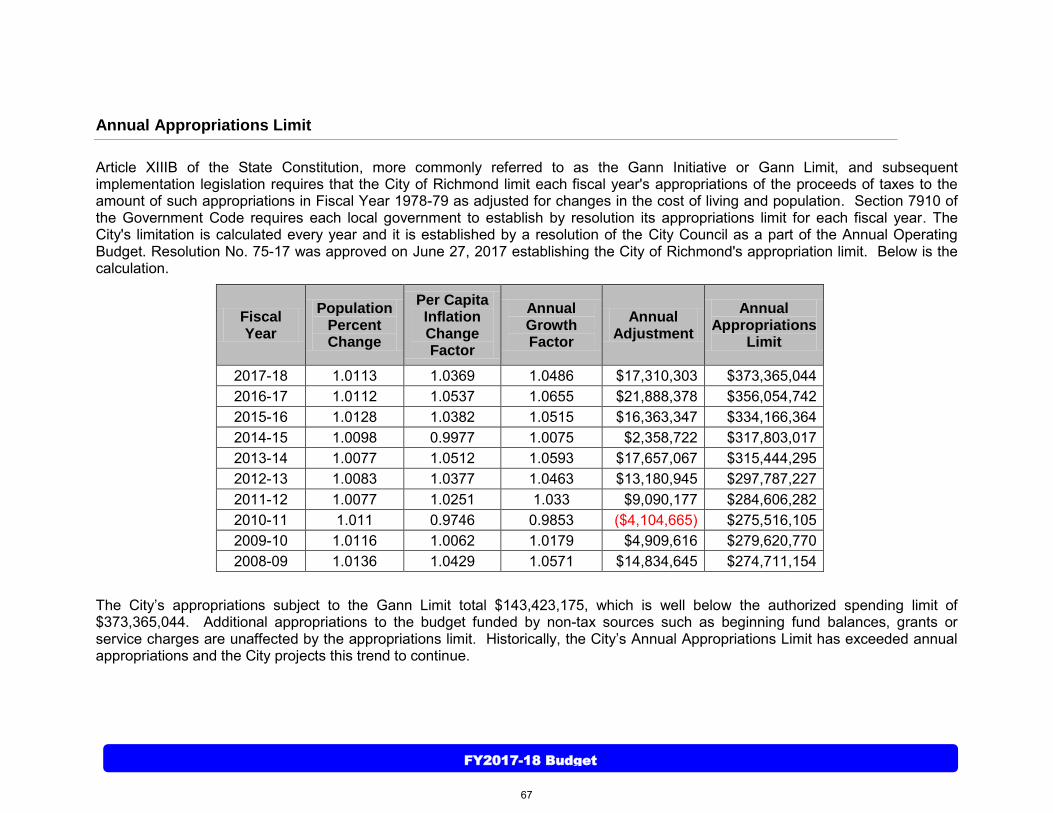
FY2017-18 Budget
Budget
Annual Appropriations Limit
Article XIIIB of the State Constitution, more commonly referred to as the Gann Initiative or Gann Limit, and subsequent implementation legislation requires that the City of Richmond limit each fiscal year's appropriations of the proceeds of taxes to the amount of such appropriations in Fiscal Year 1978-79 as adjusted for changes in the cost of living and population. Section 7910 of the Government Code requires each local government to establish by resolution its appropriations limit for each fiscal year. The City's limitation is calculated every year and it is established by a resolution of the City Council as a part of the Annual Operating Budget. Resolution No. 75-17 was approved on June 27, 2017 establishing the City of Richmond's appropriation limit. Below is the calculation.
Fiscal Year
Population Percent Change
Per Capita Inflation Change Factor
Annual Growth Factor
Annual Adjustment
Annual Appropriations
Limit
2017-18 1.0113 1.0369 1.0486 $17,310,303 $373,365,044
2016-17 1.0112 1.0537 1.0655 $21,888,378 $356,054,742
2015-16 1.0128 1.0382 1.0515 $16,363,347 $334,166,364
2014-15 1.0098 0.9977 1.0075 $2,358,722 $317,803,017
2013-14 1.0077 1.0512 1.0593 $17,657,067 $315,444,295
2012-13 1.0083 1.0377 1.0463 $13,180,945 $297,787,227
2011-12 1.0077 1.0251 1.033 $9,090,177 $284,606,282
2010-11 1.011 0.9746 0.9853 ($4,104,665) $275,516,105
2009-10 1.0116 1.0062 1.0179 $4,909,616 $279,620,770
2008-09 1.0136 1.0429 1.0571 $14,834,645 $274,711,154
The City’s appropriations subject to the Gann Limit total $143,423,175, which is well below the authorized spending limit of $373,365,044. Additional appropriations to the budget funded by non-tax sources such as beginning fund balances, grants or service charges are unaffected by the appropriations limit. Historically, the City’s Annual Appropriations Limit has exceeded annual appropriations and the City projects this trend to continue.
67