Embed Size (px)
Citation preview
ISSN 1644-0692 www.acta.media.pl
Acta Sci. Pol. Hortorum Cultus, 14(4) 2015, 93-104
THE CHEMICAL COMPOSITION OF LEMON BALM AND BASIL PLANTS GROWN UNDER DIFFERENT LIGHT CONDITIONS
Barbara Frąszczak, Monika Gąsecka, Anna Golcz, Renata Zawirska-Wojtasiak Poznań University of Life Sciences
Abstract. The aim of this study was to compare chemical composition of lemon balm and basil herbage grown in containers under fluorescent lamps (FL) and LED modules (LEDs). There were significant differences in the response of the species for the applied source of light. The content of essential oils was greater in basil herbage under fluorescent lamps, whereas the content of essential oils in lemon balm herbage was greater under LED lamps. The basil and lemon balm plants were characterised by high content of fruc-tose and glucose and by very low content of sucrose. There were no significant differ-ences in the nitrates content in basil and lemon balm herbage grown under either source of light. Both the basil and lemon balm herbage were found to have higher content of macro- and micronutrients when they were grown under LEDs compared with fluorescent lamps. It can be concluded that the chemical composition of lemon balm and basil herbage was very varied and dependent on both the light and the species.
Key words: fluorescent lamps, LED modules, Ocimum basilicum, Melissa officinalis, phytochemicals
INTRODUCTION
Since the beginning of use of LEDs in horticultural production there have been in-vestigations on the influence of individual colours on the growth and development of plants. Most studies have investigated the effects of light quality on plants, using only two colours, i.e. blue and red. Although the physiological responses to spectral changes can vary among plant species or varieties, red light is considered to be important for the photosynthetic apparatus and to influence the transport of assimilates [Baroli et al. 2008]. Blue light is important for photosynthesis, chloroplast development, chlorophyll
Corresponding author: Barbara Frąszczak, Department of Vegetable Crops, Poznań University of Life Sciences, Dąbrowskiego 159, 60-594 Poznań, e-mail: [email protected]
© Copyright by Wydawnictwo Uniwersytetu Przyrodniczego w Lublinie, Lublin 2015
94 B. Frąszczak, M. Gąsecka, A. Golcz, R. Zawirska-Wojtasiak
_____________________________________________________________________________________________________________________________________________
Acta Sci. Pol.
formation and chemical composition of plants, but the response highly depends on the dosage of blue light [Hogewoning et al. 2010]. The effect of green light is similar to that of blue light, as it participates in photosynthetic processes through the phytochrome and cryptochrome pigment photoreceptor proteins [Swartz et al. 2001].
Lighting conditions might also evoke the photo-oxidative changes in plants, which lead to the increased content and activity of antioxidative enzymes, flavonoid, ascor-bate, carotenoid or tocopherol [Samuolienė et al. 2012]. Blue light was found to have positive effect on the content of ascorbic acid in lettuce leaves [Ohashi-Kaneko et al. 2007]. Red light reduced the content of nitrates in plants [Crawford 1995]. Both blue and red light stimulate increase in the content of chlorophyll [Miyashita et al. 1997, Wu et al. 2007].
While it is widely understood that light intensity can positively affect photochemical accumulation [Li and Kubota 2009, Fu et al. 2012], the effects of light quality are more complex, and mixed results were often reported [Lin et al. 2013]. Plants are known to react to light in different ways, depending whether the plant grows in monochromatic light or light with a more complex spectra composition [Kim et al. 2004]. Thus, the problem how light quality affects the content of active substances needs to be further elucidated by using more light colours.
The aim of the study was to determine the content of some active ingredients in sweet basil and lemon balm herbage grown under fluorescent lamps and LED modules.
MATERIALS AND METHODS
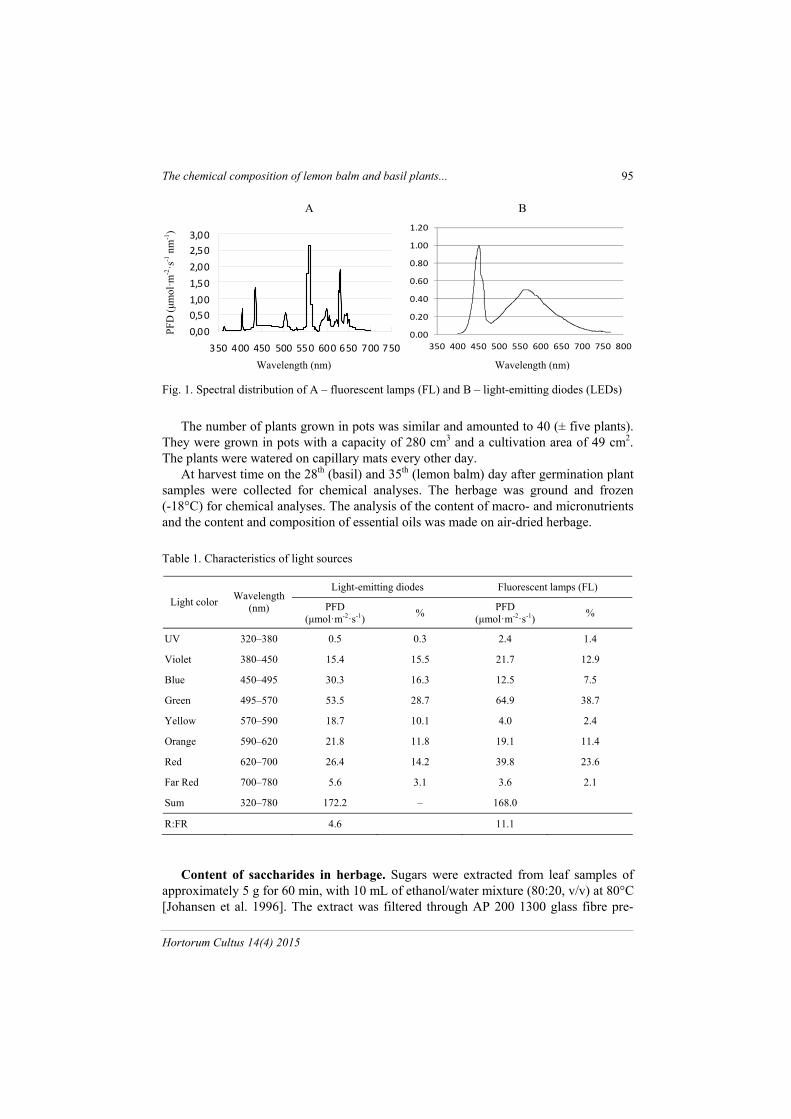
From 2012 to 2013 pot experiments were carried out in growing rooms at the Marcelin experimental station, Poznań University of Life Sciences, Poland. The ex-periment was performed in eight replications, where three pots were treated as one rep-lication. The investigations were conducted in two series (replications). Sweet basil (Ocimum basilicum L.) cultivar ‘Wala’ and lemon balm (Melissa officinalis L.) were seeded in a white peat bedding substrate (Klassmann-Deilman, Germany). The soil used for experiment of pH 5,33 and EC 1.11 contained (in mg·dm-3) 7 N-NH4, 182 N-NO3, 89 P, 219 K, 762 Ca, 96 MG, 5 S-SO4, 24 Na, 51.9 Fe, 1.2 Zn, 3.6 Mn, 0.8 Cu, 31 Cl. Plants were only watered without nutrients on capillary mats every other day. After germination the plants were cultivated for 28 days (basil) and 35 days (lemon balm). A 16-hour photoperiod and a day/night temperature of 23/18°C were maintained. The relative air humidity was 65–70%. The light sources included two types of lamps, TL’D 36W/84 fluorescent lamps (FL) Philips (Poland) with white light and a wave-length range of 350–700 nm, and high-power solid-state lighting module (LED) (type SMD, Seoul Semiconductor, South Korea). The spectra of the light sources are shown in fig. 1. The photosynthetic photon flux density (PPFD) amounted to about 160 (FL) and 166 (LED) μmol m-2 s-1 (±14 SD) at the top of plants (tab. 1). The PPFD was meas-ured with a quantum sensor (PAR-10, Sanopan, Poland). The spectral distribution of light treatments was measured with a spectroradiometer (UV-VIS by StellarNet Inc.). Both measurements were made 15 cm under the lamps, more or less at the height of the plant tops.
The chemical composition of lemon balm and basil plants... 95
_____________________________________________________________________________________________________________________________________________
Hortorum Cultus 14(4) 2015
A B
0,00
0,50
1,00
1,50
2,00
2,50
3,00
350 400 450 500 550 600 650 700 750
0.00
0.20
0.40
0.60
0.80
1.00
1.20
350 400 450 500 550 600 650 700 750 800
Wavelength (nm) Wavelength (nm)
Fig. 1. Spectral distribution of A – fluorescent lamps (FL) and B – light-emitting diodes (LEDs)
The number of plants grown in pots was similar and amounted to 40 (± five plants). They were grown in pots with a capacity of 280 cm3 and a cultivation area of 49 cm2. The plants were watered on capillary mats every other day.
At harvest time on the 28th (basil) and 35th (lemon balm) day after germination plant samples were collected for chemical analyses. The herbage was ground and frozen (-18°C) for chemical analyses. The analysis of the content of macro- and micronutrients and the content and composition of essential oils was made on air-dried herbage.
Table 1. Characteristics of light sources
Light-emitting diodes Fluorescent lamps (FL)
Light color Wavelength
(nm) PFD (μmol·m-2·s-1)
% PFD
(μmol·m-2·s-1) %
UV 320–380 0.5 0.3 2.4 1.4
Violet 380–450 15.4 15.5 21.7 12.9
Blue 450–495 30.3 16.3 12.5 7.5
Green 495–570 53.5 28.7 64.9 38.7
Yellow 570–590 18.7 10.1 4.0 2.4
Orange 590–620 21.8 11.8 19.1 11.4
Red 620–700 26.4 14.2 39.8 23.6
Far Red 700–780 5.6 3.1 3.6 2.1
Sum 320–780 172.2 – 168.0
R:FR 4.6 11.1
Content of saccharides in herbage. Sugars were extracted from leaf samples of
approximately 5 g for 60 min, with 10 mL of ethanol/water mixture (80:20, v/v) at 80°C [Johansen et al. 1996]. The extract was filtered through AP 200 1300 glass fibre pre-
PF
D (μm
ol·m
-2·s
-1 n
m-1
)
96 B. Frąszczak, M. Gąsecka, A. Golcz, R. Zawirska-Wojtasiak
_____________________________________________________________________________________________________________________________________________
Acta Sci. Pol.
filters (Millipore). After the evaporation of the solvent 1 ml of mobile phase (acetoni-trile/water, 75:25, v/v) was added and the extracts were analysed with a Waters Alliance 2695 chromatograph coupled with a Waters 2414 RI detector. The acetonitrile/water mobile phase (75:25, v/v) was used at a flow rate of 1.0 mL min-1 to separate soluble sugars (fructose, glucose and sucrose) on a Supelcosil LC NH2 column (250 × 4.6 mm, 5 μm). The sugars were identified by comparison with retention time standards (glucose – 6.819, fructose – 7.644 and sucrose – 9.785 min).
Content of phenolic compounds in herbage. The leaves were ground to fine pow-der in liquid nitrogen and phenolics were extracted twice with 10 mL of methanol and they were centrifuged. The content of total phenolics was measured according to Folin-Ciocalteu’s method with some modifications [Dong et al. 2012], with gallic acid as a calibration standard. The standard solution and the extract were mixed with 0.1 mL of Folin-Ciocalteu’s reagent. After 3 min, 1 mL of 10% Na2CO2 solution was added. After 30 min of incubation at room temperature, absorbance was measured with a Cary 300 Bio UV-Vis spectrophotometer at a wavelength λ = 765 nm. The total phenolic content was expressed as milligrams of gallic acid per gram of dry extract.
Prior to analysis dried methanolic extracts of samples were dissolved in 1 ml of methanol. HPLC analysis was performed by means of a Waters Alliance 2695 chro-matograph coupled with a Waters 2996 photodiode array detector. Chromatographic separation was performed on an RP C-18 column, 250 × 4 mm × 5 μm, with acetoni-trile: 2% aqueous acetic acid mixture (pH = 2) used as an elution phase (gradient). The concentration of phenolic acids was determined with an internal standard at wave-lengths λ = 280 nm (gallic, chlorogenic, caffeic and p-coumaric acids) or λ = 320 nm and 280 nm (ferulic and t-cinnamic acids), myricetin – C15H10O8 λ = 320 nm. Com-pounds were identified by comparing the retention time of the analysed peak with the retention time of the standard and by adding a specific amount of the standard to the samples under analysis and repeating the analysis. The detection level was 1 μg·g-1. The retention times of the assayed acids were as follows: gallic acid 8.85 min, chlorogenic acid 21.60 min, caffeic acid – 26.19, p-coumaric acid 40.20 min. The detection limit was 1 mg·kg-1.
Analysis of essential oils. Essential oils were isolated from 1 g of sweet basil or lemon balm leaves by hydrodistillation with a Deryng laboratory glass apparatus of the Polish Pharmacopoeia [2011]. The distillation took 3 h. Before the distillation 1.5 mg of the internal standard (tridecane) was added together with 0.3 mL of xylene, used as the extraction solvent. The distillates were then analysed with the GC/MS method.
A Hewlett-Packard HP 5890 gas chromatograph with a split/splitless injector and FID detector was used for the analyses. Compounds were separated with a DB-5 capil-lary column (30 m × 0.32 mm × 0.25 m). The analysis parameters on the DB-5 column were as follows: initial temperature 40C (for 1 min), then 8C/min. to 230C/min. The flow of hydrogen, used as a carrier gas, was 1.6 mL·min-1.
The amount of volatiles was calculated on the basis of the known amount of the in-ternal standard added to the sample prior to the distillation.
The identity of the separated compounds was confirmed with an Agilent 7890 chro-matograph coupled to an Agilent 5957 VLASD mass detector.
The chemical composition of lemon balm and basil plants... 97
_____________________________________________________________________________________________________________________________________________
Hortorum Cultus 14(4) 2015
Content of macro- and micronutrients in herb. In order to assay the total forms of N, P, K, Ca, Mg and Na the plant material was mineralized in concentrated sulfuric acid, while for analyses of total S, Fe, Mn, Zn and Cu – in a mixture of nitric and per-chloric acids (3:1, v/v). After mineralization of plant material the following determina-tions were performed: N-total using the distillation method according to Kjeldahl in a Parnas Wagner apparatus; P, colorimetrically with ammonia molybdate; S by nephelometry with; K, Ca, Mg, Na, Fe, Mn, Zn, Cu using flame atomic absorption spec-troscopy (FAAS, on a Carl Zeiss Jena apparatus) [Nowosielski 1998, Breś et al. 2009].
Content of ascorbic acid in herbage. The content of ascorbic acid in the herbage was determined according to the Tillman’s method recommended by the International Standardisation Organization (ISO) and the Association of Official Chemist (AOAC) [Danielczuk et al. 2004]. The determination was carried out in accordance with the Polish Standard [PN-A-04019]. Oxalic acid was applied as the regulator of acidity and 2.6 – dichlorophenolindophenol (Tilmans reagent) as a self-indicator.
Content of nitrates in herbage. The content of nitrates in fresh herbage was deter-mined according to the potentiometric method by means of an Orion 960 apparatus with the Thermo Scientific titration system [Jackson 1980]. The content of nitrates was iden-tified according to the Thermo Scientific procedure.
The significance of the impact of the light source on the content of some chemical compounds in the herbage was determined by means of the ANOVA. Differences be-tween means were estimated with the Newman-Keuls test at a significance level α = 0.05. All statistical analyses were made with the Statistica program (StatSoft, Po-land).
RESULTS
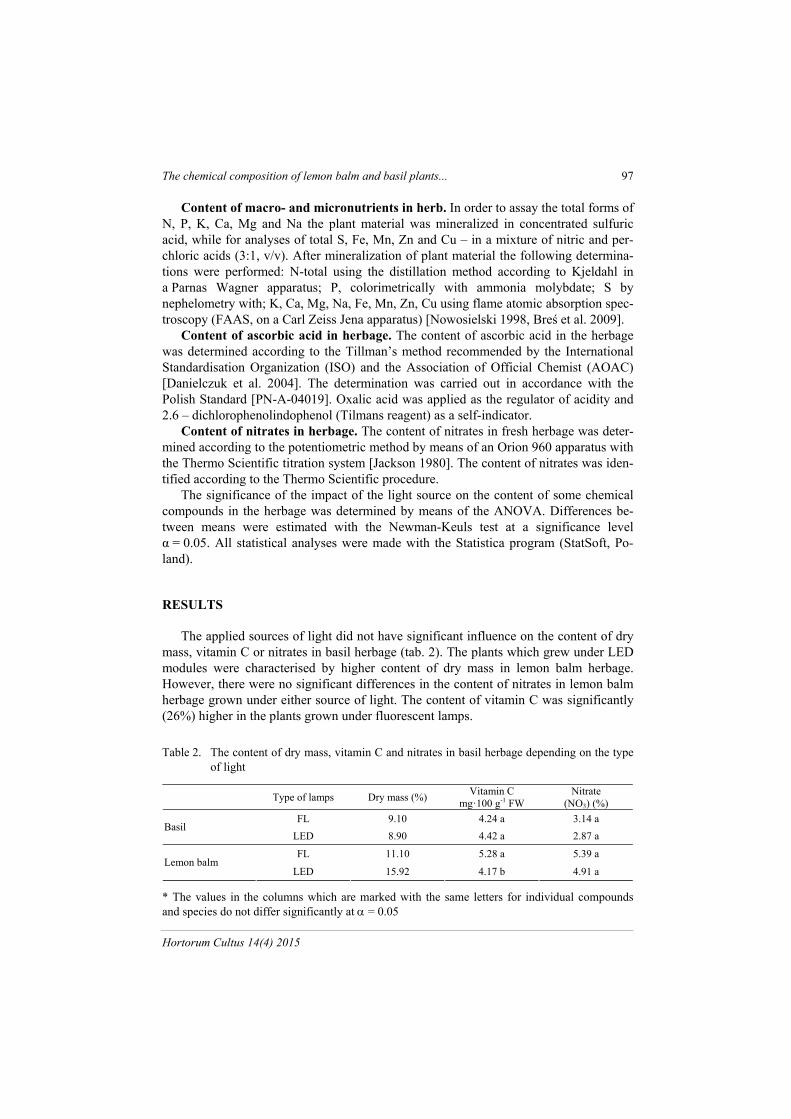
The applied sources of light did not have significant influence on the content of dry mass, vitamin C or nitrates in basil herbage (tab. 2). The plants which grew under LED modules were characterised by higher content of dry mass in lemon balm herbage. However, there were no significant differences in the content of nitrates in lemon balm herbage grown under either source of light. The content of vitamin C was significantly (26%) higher in the plants grown under fluorescent lamps.
Table 2. The content of dry mass, vitamin C and nitrates in basil herbage depending on the type of light
Type of lamps Dry mass (%) Vitamin C
mg·100 g-1 FW Nitrate
(NO3) (%)
FL 9.10 4.24 a 3.14 a Basil
LED 8.90 4.42 a 2.87 a
FL 11.10 5.28 a 5.39 a Lemon balm
LED 15.92 4.17 b 4.91 a
* The values in the columns which are marked with the same letters for individual compounds and species do not differ significantly at = 0.05
98 B. Frąszczak, M. Gąsecka, A. Golcz, R. Zawirska-Wojtasiak
_____________________________________________________________________________________________________________________________________________
Acta Sci. Pol.
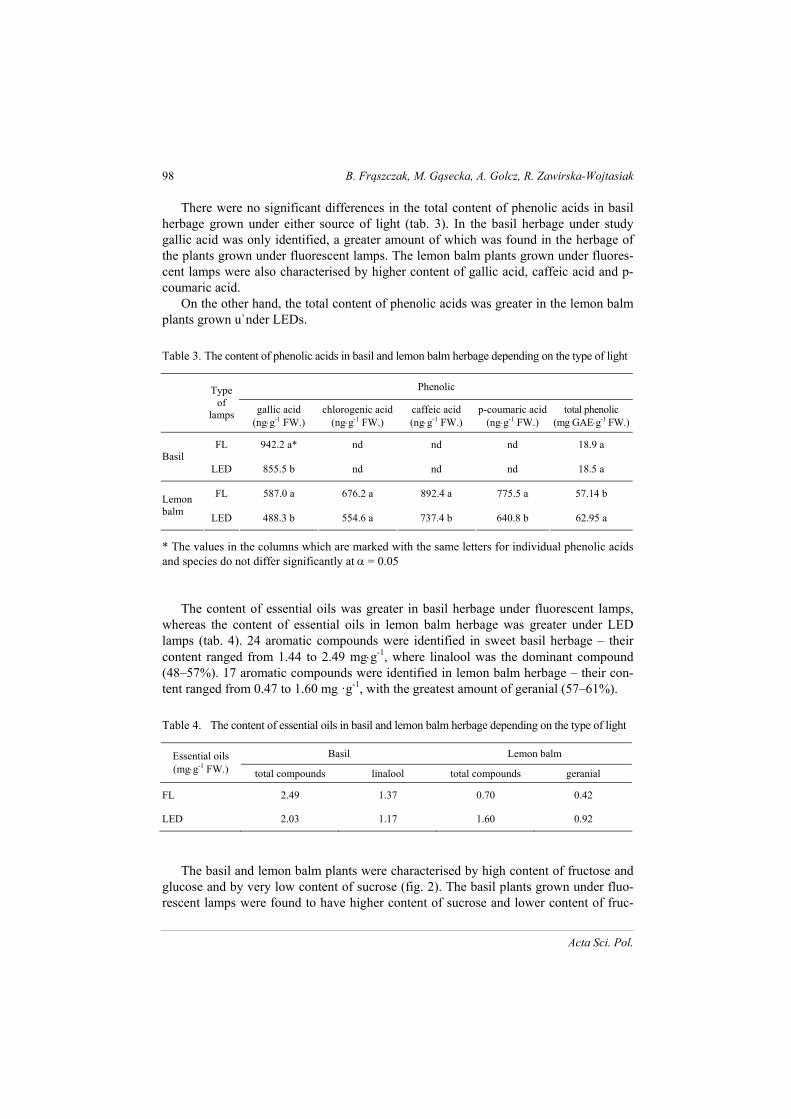
There were no significant differences in the total content of phenolic acids in basil herbage grown under either source of light (tab. 3). In the basil herbage under study gallic acid was only identified, a greater amount of which was found in the herbage of the plants grown under fluorescent lamps. The lemon balm plants grown under fluores-cent lamps were also characterised by higher content of gallic acid, caffeic acid and p-coumaric acid.
On the other hand, the total content of phenolic acids was greater in the lemon balm plants grown u`nder LEDs.
Table 3. The content of phenolic acids in basil and lemon balm herbage depending on the type of light
Phenolic
Type
of lamps gallic acid
(ngg-1 FW.) chlorogenic acid
(ngg-1 FW.) caffeic acid (ngg-1 FW.)
p-coumaric acid(ngg-1 FW.)
total phenolic (mg GAEg-1 FW.)
FL 942.2 a* nd nd nd 18.9 a Basil
LED 855.5 b nd nd nd 18.5 a
FL 587.0 a 676.2 a 892.4 a 775.5 a 57.14 b Lemon balm
LED 488.3 b 554.6 a 737.4 b 640.8 b 62.95 a
* The values in the columns which are marked with the same letters for individual phenolic acids and species do not differ significantly at = 0.05
The content of essential oils was greater in basil herbage under fluorescent lamps,
whereas the content of essential oils in lemon balm herbage was greater under LED lamps (tab. 4). 24 aromatic compounds were identified in sweet basil herbage – their content ranged from 1.44 to 2.49 mgg-1, where linalool was the dominant compound (48–57%). 17 aromatic compounds were identified in lemon balm herbage – their con-tent ranged from 0.47 to 1.60 mg ·g-1, with the greatest amount of geranial (57–61%).
Table 4. The content of essential oils in basil and lemon balm herbage depending on the type of light
Basil Lemon balm Essential oils (mgg-1 FW.) total compounds linalool total compounds geranial
FL 2.49 1.37 0.70 0.42
LED 2.03 1.17 1.60 0.92
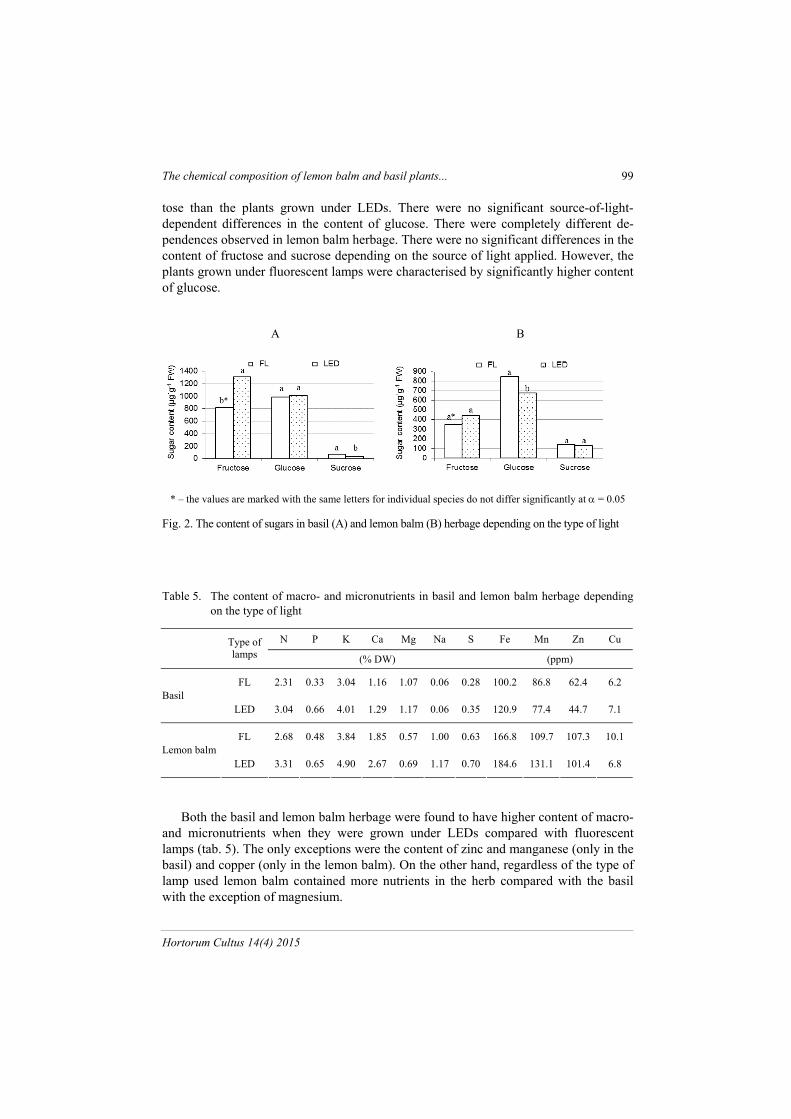
The basil and lemon balm plants were characterised by high content of fructose and glucose and by very low content of sucrose (fig. 2). The basil plants grown under fluo-rescent lamps were found to have higher content of sucrose and lower content of fruc-
The chemical composition of lemon balm and basil plants... 99
_____________________________________________________________________________________________________________________________________________
Hortorum Cultus 14(4) 2015
tose than the plants grown under LEDs. There were no significant source-of-light-dependent differences in the content of glucose. There were completely different de-pendences observed in lemon balm herbage. There were no significant differences in the content of fructose and sucrose depending on the source of light applied. However, the plants grown under fluorescent lamps were characterised by significantly higher content of glucose.
A B
* – the values are marked with the same letters for individual species do not differ significantly at = 0.05
Fig. 2. The content of sugars in basil (A) and lemon balm (B) herbage depending on the type of light
Table 5. The content of macro- and micronutrients in basil and lemon balm herbage depending on the type of light
N P K Ca Mg Na S Fe Mn Zn Cu
Type of lamps (% DW) (ppm)
FL 2.31 0.33 3.04 1.16 1.07 0.06 0.28 100.2 86.8 62.4 6.2 Basil
LED 3.04 0.66 4.01 1.29 1.17 0.06 0.35 120.9 77.4 44.7 7.1
FL 2.68 0.48 3.84 1.85 0.57 1.00 0.63 166.8 109.7 107.3 10.1 Lemon balm
LED 3.31 0.65 4.90 2.67 0.69 1.17 0.70 184.6 131.1 101.4 6.8
Both the basil and lemon balm herbage were found to have higher content of macro- and micronutrients when they were grown under LEDs compared with fluorescent lamps (tab. 5). The only exceptions were the content of zinc and manganese (only in the basil) and copper (only in the lemon balm). On the other hand, regardless of the type of lamp used lemon balm contained more nutrients in the herb compared with the basil with the exception of magnesium.
100 B. Frąszczak, M. Gąsecka, A. Golcz, R. Zawirska-Wojtasiak
_____________________________________________________________________________________________________________________________________________
Acta Sci. Pol.
DISCUSSION
On the one hand, the differences in the chemical composition of basil and lemon balm plants result from the difference in the spectral composition between the sources of light. On the other hand, they result from the fact that both species react differently to the light applied. Our results show that the plants exhibited absolutely individual reac-tions. The applied sources of light did not have significant influence on the content of dry mass in basil, but as far as lemon balm is concerned, there was much higher content of dry mass under LED modules. The study by Lin et al. [2013] also did not reveal differences in the content of dry mass between lettuce grown under fluorescent lamps and the plants grown under LEDs. Yorio et al. [2001] reported that there was higher dry matter weight accumulation in lettuce grown under red light supplemented with blue light than in lettuce grown under red light alone. However, the weight of the dry matter of shoots in some plants irradiated with blue light decreased in comparison with white light irradiation [Ohashi-Kaneko et al. 2007, Islam et al. 2012]. However, lemon balm is known to exhibit very positive reaction to blue light [Głowacka 2008]. The research conducted by the author of this article [Frąszczak et al. 2014] revealed that the sources of light had completely different influence on the fresh weight of the herbs. Basil was characterised by greater fresh weight when it was grown under fluorescent lamps, whereas lemon balm did not reveal any significant differences under either source of light.
The amount of vitamin C can vary by cultivar or variety [Mou 2009] and it is af-fected by light conditions [Shinora and Susuki 1981]. Our research confirmed these statements. The values of vitamin C were similar in both herbs under study. However, the content of vitamin C in the lemon balm herbage was significantly greater when the plants were grown under fluorescent lamps. The study by Ohashi-Kaneko et. al. [2007] also revealed a significant increase in the content of vitamin C when the plants were exposed to blue and red light. On the other hand, Li and Kubota [2009] did not observe the influence of diversified spectral composition of light on the content of vitamin C in lettuce leaves.
Red light has the highest capacity in stimulating nitrate reductase activity [Lillo and Appenroth 2001]. Samuolienė et al. [2009] exposed lettuce, marjoram and green onion to red light for three days and they observed a considerable decrease in the content of nitrates. The study conducted by Borowski et al. [2014] resulted in lower content of nitrate in lettuce leaves grown under cool white fluorescent light (FRS) than in those grown under red-blue LEDs. Blue light is known to increase the overall nitrogen con-tent [Ohashi-Kaneko et al. 2007]. On the other hand, Qi et al. [2007] and Ohashi-Kaneko et al. [2007] found that both red and blue light were more effective than white light in the reduction of nitrate concentration in spinach and lettuce. This study did not reveal significant differences in the content of nitrates depending on the source of light. The lemon balm herbage was characterised by slightly higher content of nitrates than basil.
Light quality, especially red and far red light, is known to strongly influence carbo-hydrate accumulation [Ranwala et al. 2002]. According to Lefsrud et al. [2008] the most sensitive response to different light quality was observed in the main photosynthetic product, i.e. sugars, and their accumulation in leaves. The study conducted by Lin et al.
The chemical composition of lemon balm and basil plants... 101
_____________________________________________________________________________________________________________________________________________
Hortorum Cultus 14(4) 2015
[2013] resulted in greater total content of soluble sugar in lettuce leaves grown under LEDs (with a high share of red light) than in those grown under fluorescent lamps. The authors’ findings do not provide a definite answer to the question about the influence of the spectral composition of light on the content of saccharides in basil and lemon balm herbage. According to Bian et al. [2014], the response of soluble sugars to light quality varies among species and cultivars. As Price et al. [2004] report, monosaccharides such as glucose can have greater effect on the regulation of nitrogen-metabolic genes than nitrogen itself. Our research did not reveal such dependences.
According to Tegelberg et al. [2004], the concentrations of flavonoids may be varied with qualitative changes in incident light. The authors of few studies conclude that red light stimulates the increase of phenols in plants [Li and Kubota 2009, Lee et al. 2014]. Although the mechanism is still unknown, one assumption is that red light increases the cytokinin level [Qamaruddin and Tillberg 1989] and thus it may stimulate the synthesis of phenolics [Galuszka et al. 2005]. In our study the total content of phenols in the lemon balm herbage was greater under LEDs, whereas there were no significant differ-ences in basil herbage under the sources of light applied. However, there was higher content of individual phenolic acids observed under the fluorescent lamps with a higher share of red light in the spectrum than in the case of LEDs.
The differences in the content of essential oils and their main odorants related to lighting conditions were much more evident in the case of lemon balm. According to literature, the content and composition of essential oils in plants may be affected by various factors. Genetic variation and differences between the years and place of culti-vation concerning the aroma (the composition of essential oils) of dill seeds grown in Poland were observed in a three-year study on 7 varieties Zawirska-Wojtasiak et al. 1998]. Many studies have indicated variability in the composition of rosemary essential oil depending on various factors, such as climate, soil, harvest time [Flamini et al. 2002, Serrano et al. 2002] and origin of samples [Zawirska-Wojtasiak et al. 2005]. There were similar observations concerning lemon balm [Serrano 2002].
CONCLUSIONS
The influence of composition of the spectral light on the chemical compounds con-tained in the basil and lemon balm herbage was varied and dependent on species. In the case of basil, higher contents of nutrients and fructose were obtained in cultivation un-der LEDs, whereas essential oils, sucrose and gallic acid under FL lamps. Lemon balm plants, grown under LEDs, were characterized by a higher content of dry mass, pheno-lic, essential oil and nutrients. The conducted studies demonstrate that the response of plants to color the light is specific and varies with species
ACKNOWLEDGEMENTS
The studies were supported by the Ministry of Science and Higher Education, grant No. NN310 444538.
102 B. Frąszczak, M. Gąsecka, A. Golcz, R. Zawirska-Wojtasiak
_____________________________________________________________________________________________________________________________________________
Acta Sci. Pol.
REFERENCES
Baroli, I., Price, G.D., Badger, M.R., Von Caemmerer, S. (2008). The contribution of photosyn-thesis to the red light response of stomatal conductance. Plant Physiol., 146, 737–747.
Bian, Z.H., Yang, Q.C., Liu, W.K. (2014). Effects of light quality on the accumulation of phyto-chemicals in vegetables produced in controlled environments: A review. J. Sci. Food Agricult, DOI: 10.1002/jsfa.6789.
Borowski, E., Hawrylak-Nowak, B., Michałek, S. (2014). The response of lettuce to fluorescent light and led light relative to different nitrogen nutrition of plants. Acta Sci. Pol. Hortorum Cultus, 13(5), 211–224.
Breś, W., Golcz, A., Komosa, A., Kozik, E., Tyksiński, W. (2009). Nawożenie roślin ogrodni-czych. Wyd. UP w Poznaniu, 189 ss.
Crawford, W.H. (1995). Nitrate: nutrient and signal for plant growth. Plant Cell., 7, 859–868. Danielczuk, J., Pietrzykowski, R., Zieliński, R. (2004). Comparative study of the enzymatic
method for determination of vitamin c with routine methods according to ISO. Pol. J. Food Nutr. Sci., 13/54(1), 41–46.
Dong, J., Zhang, M., Lu, L., Sun, L., Xu, M. (2012). Nitric oxide fumigation stimulates flavonoid and phenolic accumulation and enhances antioxidant activity of mushroom. Food Chem., 135(3), 1220–1225.
Flamini, G., Cioni, P., Morelli, L. (2002). Main-agronomic-productive characteristics of two ecotypes of Rosemarinus officinalis L. and chemical composition of their essential oils. J. Agric. Food Chem., 50, 3512–3717.
Frąszczak, B., Golcz, A., Zawirska-Wojtasiak, R., Janowska, B. (2014). Growth rate of sweet basil and lemon balm plants grown under fluorescent lamps and led modules. Acta Sci. Pol. Hortorum Cultus, 13(2), 3–13.
Fu, W., Li, P., Wu, Y. (2012). Effects of different light intensities on chlorophyll fluorescence characteristics and yield in lettuce. Sci. Hortic., 135, 45–51.
Galuszka, P., Frebortova, J., Luhova, L., Bilyeu, K.D., English, J.T., Frebort, I. (2005). Tissue localization of cytokinin dehydrogenase in maize: possible involvement of quinone species generated from plant phenolics by other enzymatic systems in the catalytic reaction. Plant Cell Physiol., 46, 716–728.
Głowacka, B. (2008). Wpływ składu spektralnego światła na wzrost rozsady bazylii pospolitej (Ocimum basilicum L.), melisy lekarskiej (Melissa officinalis L.) i ogórecznika lekarskiego (Borago officinalis L.). Zesz. Post. Nauk Roln., 527, 131–138.
Hogewoning, S.W., Trouwborst, G., Maljaars, H., Poorter, H., van Ieperen, W., Harbinson, J. (2010). Blue light dose–responses of leaf photosynthesis, morphology, and chemical composi-tion of Cucumis sativus grown under different combinations of red and blue light. J. Exp. Bot., 61, 3107–3117.
Islam, M.A., Kuwar, G., Clarke, J.L., Blystad, D-R., Gislerød, H.R., Olsen, J.E., Torre, S. (2012). Artificial light from light emitting diodes (LEDs) with a high portion of blue light results in shorter poinsettias compared to high pressure sodium (HPS) lamps. Sci. Hortic., 147, 136–143.
Jackson, R.K. (1980). Avoiding interferences and problems in the determination of nitrate. The comparison of two methods: The Orion specific ion electrode and the cadmium column. Comm. Soil Sci. Plant Anal., 11(2), 127–134.
Johansen, H.N., Glitso, V., Knutsen, K.E.B. (1996). Influence of extraction solvent and tempera-ture on the quantitative determination of oligosaccharides from plant materials by high-performance liquid chromatography. J. Agric. Food Chem., 44, 1470–1474.
Kim, H.H., Goins, G.D., Wheeler, R.M., Sager, J.C. (2004). Green-light supplementation for enhanced lettuce growth under red- and blue-light-emitting diodes. HortSci., 39, 1617–1622.
The chemical composition of lemon balm and basil plants... 103
_____________________________________________________________________________________________________________________________________________
Hortorum Cultus 14(4) 2015
Lee, S-W., Seob, J.M., Leeb, M-K., Chun, J-H., Antonisamy, P., Arasub, M.V., Suzukic, T., Al-Dhabid, N.A., Kimb, S-J. (2014). Influence of different LED lamps on the production of phe-nolic compounds in common and Tartary buckwheat sprouts. Ind. Crop. Prod., 54, 320–326.
Lefsrud, M.G., Kopsell, D.A., Sams, C.E. (2008). Irradiance from distinct wavelength light-emitting diodes affect secondary metabolites in kale. HortSci., 43, 2243–2244.
Li, Q., Kubota, C. (2009). Effects of supplemental light quality on growth and phytochemicals of baby leaf lettuce. Environ. Exp. Bot., 67, 59–64.
Lillo, C., Appenroth, K.J. (2001). Light regulation of nitrate reductase in higher plants: which photoreceptors are involved? Plant Biol., 3, 455–465.
Lin, K.-H., Huang, M.-Y., Huang, W.-D., Hsu, M.-H., Yang, Z.-W., Yang, C.-M. (2013). The effects of red, blue, and white light-emitting diodes on the growth, development, and edible quality of hydroponically grown lettuce (Lactuca sativa L. var. capitata). Sci. Hort., 150, 86–91.
Miyashita, Y., Kimura, T., Kitaya, Y., Kubota, C., Kozai, T. (1997). Effect of red light on the growth and morphology of potato plantlets in vitro: using light emitting diodes (LEDs) as a light source for micropropagation. Acta Hort., 418, 169–173.
Mou, B. (2009). Nutrient content of lettuce and its improvement. Curr. Nutr. Food Sci., 5, 242–248.
Nowosielski, O. (1988). Zasady opracowywania zaleceń nawozowych w ogrodnictwie. PWRiL Warszawa, 221 ss.
Ohashi-Kaneko, K., Takase, M., Kon, N., Fujiwara, K., Kurata, K. (2007). Effect of light quality on growth and vegetable quality in leaf lettuce, spinach and komatsuna. Environ. Control Biol., 45, 189–198.
PN-A-04019. Produkty Spożywcze: oznaczanie zawartości witaminy C. Polish Pharmacopoeia (Farmakopea Polska) IX (2011). T. 1. Melissae Folium, 1326–1328. Price, J., Laxmi, A., St Martin, S.K., Jang, J.C. (2004). Global transcription profiling reveals
multiple sugar signal transduction mechanisms in Arabidopsis. Plant Cell, 16, 2128–2150. Qamaruddin, M., Tillberg, E. (1989). Rapid effects of red-light on the isopentenyladenosine
content in scots pine seeds. Plant Physiol., 91, 5–8. Qi, L.D., Liu, S.H.Q., Xu, L., Yu, W.Y., Lang, Q.L. Hao, S.H.Q. (2007). Effects of light qualities
on accumulation of oxalate, tannin and nitrate in spinach. Trans. Chin. Soc. Agric. Eng., 4, 201–205.
Ranwala, N.K.D., Decoteau, D.R., Ranwala, A.P., Miller, W.B. (2002). Changes in soluble car-bohydrates during phytochrome-regulated petiole elongation in watermelon seedlings. Plant Growth. Reg., 38, 157–163.
Samuolienė, G., Sirtautas, R., Brazaitytė, A., Duchovskis, P. (2012). LED lighting and seasonality effects antioxidant properties of baby leaf lettuce. Food Chem., 134 1494–1499.
Samuolienė, G., Urbonavičiūtė, A., Duchovskis, P., Bliznikas, Z., Pranciškus, V., Žukauskas, A. (2009). Decrease in nitrate concentration in leafy vegetables under a solid-state illuminator. HortSci., 44, 1857–1860.
Serrano, E., Palma, J., Tinoco, T., Venacio, F., Martines, A. (2002). Evaluation of the essential oils of Rosemarinus officinalis L. from different zones of Alantejo (Portugal). J. Essent. Oils Res., 14, 87–92.
Shinora, Y., Suzuki, Y. (1981). Effects of light and nutritional conditions on the ascorbic acid content of lettuce. J. Jpn. Soc. Hortic. Sci., 50, 239–246.
Swartz, T.E., Corchnoy, S.B., Christie, J.M., Lewis, J.W., Szundi, I., Briggs, W.R., Bogomolni, R.A. (2001). The photocycle of a flavin-binding domain of the blue light photoreceptor photo-tropin. J. Biol. Chem., 276, 36493–36500.
104 B. Frąszczak, M. Gąsecka, A. Golcz, R. Zawirska-Wojtasiak
_____________________________________________________________________________________________________________________________________________
Acta Sci. Pol.
Tegelberg, R., Julkunen-Tiitto, R., Aphalo, P.J. (2004). Red: far-red light ratio and UV-B radia-tion: their effects on leaf phenolics and growth of silver birch seedlings. Plant Cell Environ., 27, 1005–1013.
Wu, M.-C., Hou, C.-Y., Jiang, C.-M, Wang, Y.-T, Wang, C.-Y, Chen, H.-H, Chang, H.-M. (2007). A novel approach of LED light radiation improves the antioxidant activity of pea seed-lings. Food Chem., 101, 1753–1758.
Yorio, N.C., Goins, G.D., Kagie, H.R. (2001). Improving spinach, radish, and lettuce growth under red light-emitting diodes (LEDs) with blue light supplementation. HortSci., 36, 380–383.
Zawirska-Wojtasiak, R., Mildner-Szkudlarz, S., Jeleń, H., Wąsowicz, E. (2005). Estimation of rosemary aroma by sensory analysis, gas chromatography and electronic nose. In: State of the art. Flavour chemistry and biology, T., Hofmann, M., Rothe, P., Schieberle (eds). Deutsche Forschungsanstalt fur Lebensmittelchemie, Garching, 130–136
Zawirska-Wojtasiak, R., Wąsowicz, E., Jeleń, H., Rudzińska, M., Kamiński, E., Błażczak, P. (1998). Aroma characteristics of dill seeds varieties grown in Poland. Pol. J. Food Nutr. Sci., 2, 181–191.
SKŁAD CHEMICZNY ROŚLIN MELISY I BAZYLII UPRAWIANYCH W ZRÓŻNICOWANYCH WARUNKACH ŚWIETLNYCH
Streszczenie. Światło jest jednym z czynników uprawy roślin mających wpływ na ich skład fitochemiczny. Jednak reakcja roślin na światło jest bardzo różna. Celem pracy było porównanie składu chemicznego ziela melisy i bazylii uprawianych w pojemnikach w zróżnicowanych warunkach świetlnych. Jako źródeł światła użyto lamp fluorescencyj-nych (FL) oraz modułów diodowych. Stwierdzono istotne różnice w reakcji obu gatun-ków w zależności od zastosowanego światła. Zawartość olejków eterycznych w zielu ba-zylii była większa w uprawie przy lampach fluorescencyjnych, z kolei w zielu melisy była większa w uprawie pod modułami LED. Ziele bazylii i melisy charakteryzowało się dużą zawartością fruktozy i glukozy oraz bardzo małą zawartością sacharozy. Nie stwierdzono istotnych różnic w zawartości azotanów w bazylii i melisie dla obu źródeł światła. Za-równo bazylia, jak i melisa charakteryzowały się większą zawartość makro- i mikroele-mentów w uprawie pod diodami. Zawartość badanych substancji w zielu melisy i bazylii zależała zarówno od zastosowanego źródła światła jak i od gatunku. Słowa kluczowe: lampy fluorescencyjne, moduły LED, Ocimum basilicum, Melissa offi-cinalis, skład fitochemiczny
Accepted for print: 27.04.2015 For citation: Frąszczak, B., Gąsecka, M., Golcz, A., Zawirska-Wojtasiak, R. (2015). The chemical composition of lemon balm and basil plants grown under different light conditions. Acta Sci. Pol. Hortorum Cultus, 14(4), 93–104.