Embed Size (px)
Citation preview
The Chemical and Physical Properties of Tetravalent Lanthanides: Pr, Nd, Tb, and Dy
Journal: Dalton Transactions
Manuscript ID DT-PER-04-2020-001400.R1
Article Type: Perspective
Date Submitted by the Author: 19-May-2020
Complete List of Authors: Gompa, Thaige; Georgia Institute of Technology, School of Chemistry and BiochemistryRamanathan, Arun; Georgia Institute of Technology, School of Chemistry and BiochemistryRice, Natalie; Georgia Institute of Technology, School of Chemistry and BiochemistryLa Pierre, Henry; Georgia Institute of Technology, School of Chemistry and Biochemistry
Dalton Transactions
ARTICLE
Please do not adjust margins
Please do not adjust margins
Received 00th January 20xx, Accepted 00th January 20xx
DOI: 10.1039/x0xx00000x
The Chemical and Physical Properties of Tetravalent Lanthanides: Pr, Nd, Tb, and Dy Thaige P. Gompa,a† Arun Ramanathan,a† Natalie T. Rice,a† and Henry S. La Pierrea,b*
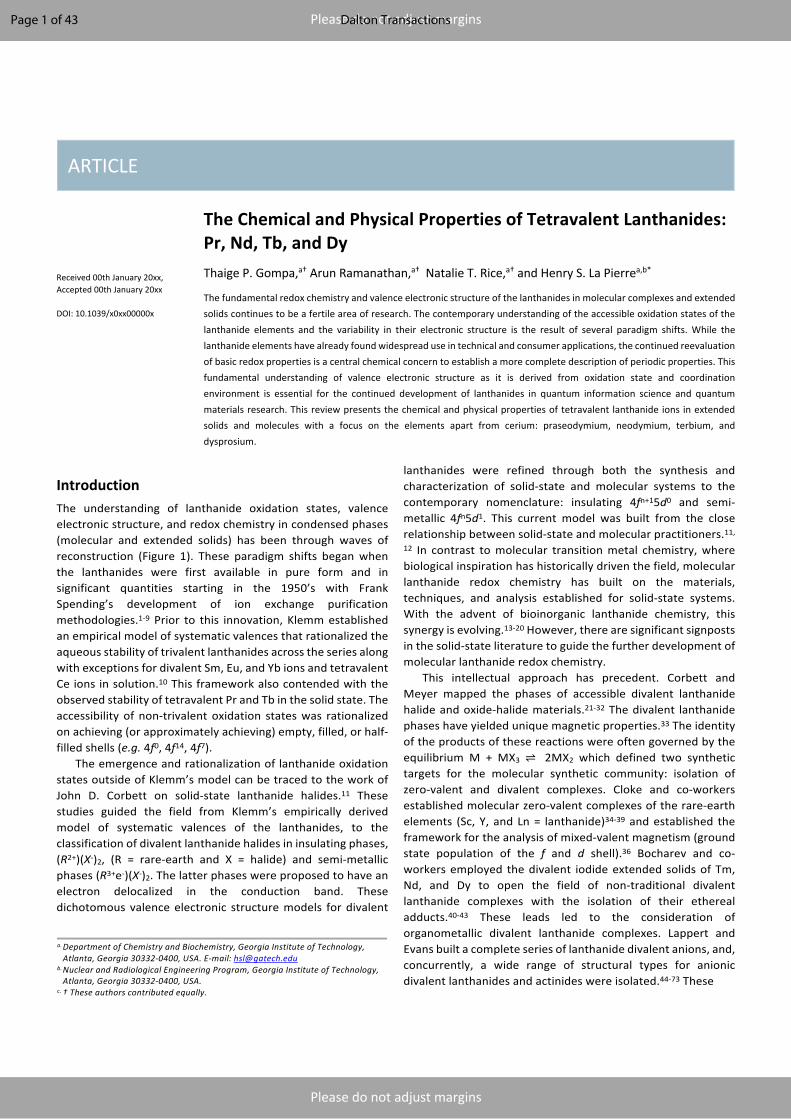
The fundamental redox chemistry and valence electronic structure of the lanthanides in molecular complexes and extended solids continues to be a fertile area of research. The contemporary understanding of the accessible oxidation states of the lanthanide elements and the variability in their electronic structure is the result of several paradigm shifts. While the lanthanide elements have already found widespread use in technical and consumer applications, the continued reevaluation of basic redox properties is a central chemical concern to establish a more complete description of periodic properties. This fundamental understanding of valence electronic structure as it is derived from oxidation state and coordination environment is essential for the continued development of lanthanides in quantum information science and quantum materials research. This review presents the chemical and physical properties of tetravalent lanthanide ions in extended solids and molecules with a focus on the elements apart from cerium: praseodymium, neodymium, terbium, and dysprosium.
Introduction The understanding of lanthanide oxidation states, valence electronic structure, and redox chemistry in condensed phases (molecular and extended solids) has been through waves of reconstruction (Figure 1). These paradigm shifts began when the lanthanides were first available in pure form and in significant quantities starting in the 1950’s with Frank Spending’s development of ion exchange purification methodologies.1-9 Prior to this innovation, Klemm established an empirical model of systematic valences that rationalized the aqueous stability of trivalent lanthanides across the series along with exceptions for divalent Sm, Eu, and Yb ions and tetravalent Ce ions in solution.10 This framework also contended with the observed stability of tetravalent Pr and Tb in the solid state. The accessibility of non-trivalent oxidation states was rationalized on achieving (or approximately achieving) empty, filled, or half-filled shells (e.g. 4f0, 4f14, 4f7). The emergence and rationalization of lanthanide oxidation states outside of Klemm’s model can be traced to the work of John D. Corbett on solid-state lanthanide halides.11 These studies guided the field from Klemm’s empirically derived model of systematic valences of the lanthanides, to the classification of divalent lanthanide halides in insulating phases, (R2+)(X-)2, (R = rare-earth and X = halide) and semi-metallic phases (R3+e-)(X-)2. The latter phases were proposed to have an electron delocalized in the conduction band. These dichotomous valence electronic structure models for divalent
lanthanides were refined through both the synthesis and characterization of solid-state and molecular systems to the contemporary nomenclature: insulating 4fn+15d0 and semi-metallic 4fn5d1. This current model was built from the close relationship between solid-state and molecular practitioners.11,
12 In contrast to molecular transition metal chemistry, where biological inspiration has historically driven the field, molecular lanthanide redox chemistry has built on the materials, techniques, and analysis established for solid-state systems. With the advent of bioinorganic lanthanide chemistry, this synergy is evolving.13-20 However, there are significant signposts in the solid-state literature to guide the further development of molecular lanthanide redox chemistry.
This intellectual approach has precedent. Corbett and Meyer mapped the phases of accessible divalent lanthanide halide and oxide-halide materials.21-32 The divalent lanthanide phases have yielded unique magnetic properties.33 The identity of the products of these reactions were often governed by the equilibrium M + MX3 ⇌ 2MX2 which defined two synthetic targets for the molecular synthetic community: isolation of zero-valent and divalent complexes. Cloke and co-workers established molecular zero-valent complexes of the rare-earth elements (Sc, Y, and Ln = lanthanide)34-39 and established the framework for the analysis of mixed-valent magnetism (ground state population of the f and d shell).36 Bocharev and co-workers employed the divalent iodide extended solids of Tm, Nd, and Dy to open the field of non-traditional divalent lanthanide complexes with the isolation of their ethereal adducts.40-43 These leads led to the consideration of organometallic divalent lanthanide complexes. Lappert and Evans built a complete series of lanthanide divalent anions, and, concurrently, a wide range of structural types for anionic divalent lanthanides and actinides were isolated.44-73 These
a. Department of Chemistry and Biochemistry, Georgia Institute of Technology, Atlanta, Georgia 30332-0400, USA. E-mail: [email protected]
b. Nuclear and Radiological Engineering Program, Georgia Institute of Technology, Atlanta, Georgia 30332-0400, USA.
c. † These authors contributed equally.
Page 1 of 43 Dalton Transactions
ARTICLE
Please do not adjust margins
Please do not adjust margins
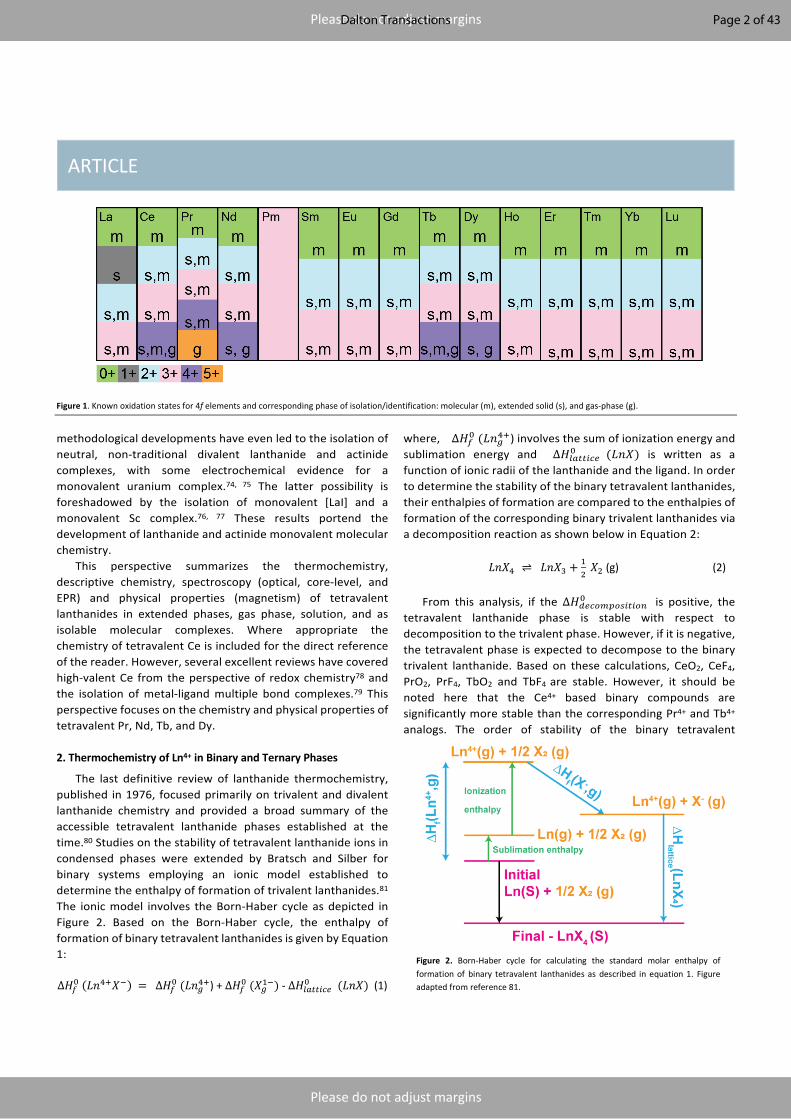
Figure 1. Known oxidation states for 4f elements and corresponding phase of isolation/identification: molecular (m), extended solid (s), and gas-phase (g).
methodological developments have even led to the isolation of neutral, non-traditional divalent lanthanide and actinide complexes, with some electrochemical evidence for a monovalent uranium complex.74, 75 The latter possibility is foreshadowed by the isolation of monovalent [LaI] and a monovalent Sc complex.76, 77 These results portend the development of lanthanide and actinide monovalent molecular chemistry.
This perspective summarizes the thermochemistry, descriptive chemistry, spectroscopy (optical, core-level, and EPR) and physical properties (magnetism) of tetravalent lanthanides in extended phases, gas phase, solution, and as isolable molecular complexes. Where appropriate the chemistry of tetravalent Ce is included for the direct reference of the reader. However, several excellent reviews have covered high-valent Ce from the perspective of redox chemistry78 and the isolation of metal-ligand multiple bond complexes.79 This perspective focuses on the chemistry and physical properties of tetravalent Pr, Nd, Tb, and Dy. 2. Thermochemistry of Ln4+ in Binary and Ternary Phases
The last definitive review of lanthanide thermochemistry, published in 1976, focused primarily on trivalent and divalent lanthanide chemistry and provided a broad summary of the accessible tetravalent lanthanide phases established at the time.80 Studies on the stability of tetravalent lanthanide ions in condensed phases were extended by Bratsch and Silber for binary systems employing an ionic model established to determine the enthalpy of formation of trivalent lanthanides.81 The ionic model involves the Born-Haber cycle as depicted in Figure 2. Based on the Born-Haber cycle, the enthalpy of formation of binary tetravalent lanthanides is given by Equation 1: ∆𝐻!"(𝐿𝑛#$𝑋%) = ∆𝐻!"(𝐿𝑛&#$) + ∆𝐻!"(𝑋&'%) - ∆𝐻()**+,-" (𝐿𝑛𝑋) (1)
where, ∆𝐻!"(𝐿𝑛&#$) involves the sum of ionization energy and sublimation energy and ∆𝐻()**+,-" (𝐿𝑛𝑋) is written as a function of ionic radii of the lanthanide and the ligand. In order to determine the stability of the binary tetravalent lanthanides, their enthalpies of formation are compared to the enthalpies of formation of the corresponding binary trivalent lanthanides via a decomposition reaction as shown below in Equation 2:
𝐿𝑛𝑋# ⇌ 𝐿𝑛𝑋/ +'0𝑋0 (g) (2)
From this analysis, if the ∆𝐻1-,23425+*+26" is positive, the tetravalent lanthanide phase is stable with respect to decomposition to the trivalent phase. However, if it is negative, the tetravalent phase is expected to decompose to the binary trivalent lanthanide. Based on these calculations, CeO2, CeF4, PrO2, PrF4, TbO2 and TbF4 are stable. However, it should be noted here that the Ce4+ based binary compounds are significantly more stable than the corresponding Pr4+ and Tb4+ analogs. The order of stability of the binary tetravalent
Figure 2. Born-Haber cycle for calculating the standard molar enthalpy of formation of binary tetravalent lanthanides as described in equation 1. Figure adapted from reference 81.
Page 2 of 43Dalton Transactions
Journal Name ARTICLE
This journal is © The Royal Society of Chemistry 20xx J. Name., 2013, 00, 1-3 | 3
Please do not adjust margins
Please do not adjust margins
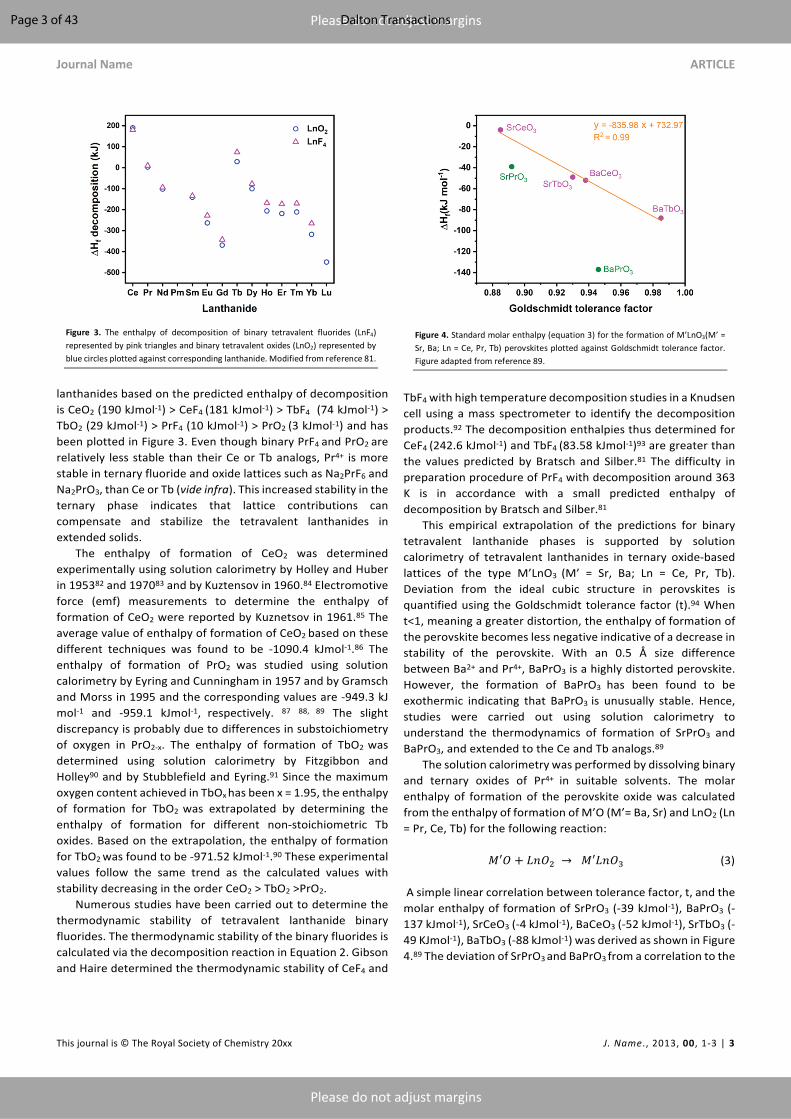
lanthanides based on the predicted enthalpy of decomposition is CeO2 (190 kJmol-1) > CeF4 (181 kJmol-1) > TbF4 (74 kJmol-1) > TbO2 (29 kJmol-1) > PrF4 (10 kJmol-1) > PrO2 (3 kJmol-1) and has been plotted in Figure 3. Even though binary PrF4 and PrO2 are relatively less stable than their Ce or Tb analogs, Pr4+ is more stable in ternary fluoride and oxide lattices such as Na2PrF6 and Na2PrO3, than Ce or Tb (vide infra). This increased stability in the ternary phase indicates that lattice contributions can compensate and stabilize the tetravalent lanthanides in extended solids.
The enthalpy of formation of CeO2 was determined experimentally using solution calorimetry by Holley and Huber in 195382 and 197083 and by Kuztensov in 1960.84 Electromotive force (emf) measurements to determine the enthalpy of formation of CeO2 were reported by Kuznetsov in 1961.85 The average value of enthalpy of formation of CeO2 based on these different techniques was found to be -1090.4 kJmol-1.86 The enthalpy of formation of PrO2 was studied using solution calorimetry by Eyring and Cunningham in 1957 and by Gramsch and Morss in 1995 and the corresponding values are -949.3 kJ mol-1 and -959.1 kJmol-1, respectively. 87 88, 89 The slight discrepancy is probably due to differences in substoichiometry of oxygen in PrO2-x. The enthalpy of formation of TbO2 was determined using solution calorimetry by Fitzgibbon and Holley90 and by Stubblefield and Eyring.91 Since the maximum oxygen content achieved in TbOx has been x = 1.95, the enthalpy of formation for TbO2 was extrapolated by determining the enthalpy of formation for different non-stoichiometric Tb oxides. Based on the extrapolation, the enthalpy of formation for TbO2 was found to be -971.52 kJmol-1.90 These experimental values follow the same trend as the calculated values with stability decreasing in the order CeO2 > TbO2 >PrO2. Numerous studies have been carried out to determine the thermodynamic stability of tetravalent lanthanide binary fluorides. The thermodynamic stability of the binary fluorides is calculated via the decomposition reaction in Equation 2. Gibson and Haire determined the thermodynamic stability of CeF4 and
TbF4 with high temperature decomposition studies in a Knudsen cell using a mass spectrometer to identify the decomposition products.92 The decomposition enthalpies thus determined for CeF4 (242.6 kJmol-1) and TbF4 (83.58 kJmol-1)93 are greater than the values predicted by Bratsch and Silber.81 The difficulty in preparation procedure of PrF4 with decomposition around 363 K is in accordance with a small predicted enthalpy of decomposition by Bratsch and Silber.81 This empirical extrapolation of the predictions for binary tetravalent lanthanide phases is supported by solution calorimetry of tetravalent lanthanides in ternary oxide-based lattices of the type M’LnO3 (M’ = Sr, Ba; Ln = Ce, Pr, Tb). Deviation from the ideal cubic structure in perovskites is quantified using the Goldschmidt tolerance factor (t).94 When t<1, meaning a greater distortion, the enthalpy of formation of the perovskite becomes less negative indicative of a decrease in stability of the perovskite. With an 0.5 Å size difference between Ba2+ and Pr4+, BaPrO3 is a highly distorted perovskite. However, the formation of BaPrO3 has been found to be exothermic indicating that BaPrO3 is unusually stable. Hence, studies were carried out using solution calorimetry to understand the thermodynamics of formation of SrPrO3 and BaPrO3, and extended to the Ce and Tb analogs.89 The solution calorimetry was performed by dissolving binary and ternary oxides of Pr4+ in suitable solvents. The molar enthalpy of formation of the perovskite oxide was calculated from the enthalpy of formation of M’O (M’= Ba, Sr) and LnO2 (Ln = Pr, Ce, Tb) for the following reaction: 𝑀′𝑂 + 𝐿𝑛𝑂0 → 𝑀′𝐿𝑛𝑂/ (3) A simple linear correlation between tolerance factor, t, and the molar enthalpy of formation of SrPrO3 (-39 kJmol-1), BaPrO3 (-137 kJmol-1), SrCeO3 (-4 kJmol-1), BaCeO3 (-52 kJmol-1), SrTbO3 (-49 KJmol-1), BaTbO3 (-88 kJmol-1) was derived as shown in Figure 4.89 The deviation of SrPrO3 and BaPrO3 from a correlation to the
Figure 3. The enthalpy of decomposition of binary tetravalent fluorides (LnF4) represented by pink triangles and binary tetravalent oxides (LnO2) represented by blue circles plotted against corresponding lanthanide. Modified from reference 81.
Figure 4. Standard molar enthalpy (equation 3) for the formation of M’LnO3(M’ = Sr, Ba; Ln = Ce, Pr, Tb) perovskites plotted against Goldschmidt tolerance factor. Figure adapted from reference 89.
Page 3 of 43 Dalton Transactions

ARTICLE
Please do not adjust margins
Please do not adjust margins
Figure 5. Structural representation of Na2PrO3 viewed along a direction to show the layered structure with layers stacked along the c direction and Na atoms between the layers.95 b) Structural representation of Li2PrO3 viewed along a direction to show the connectivity between Pr octahedrons along b direction.95 c) Structural representation of Sr2PrO4 viewed along a direction to show the layered structure with layers stacked along b direction and Sr atoms between layers.96 d) Structural representation of SrPrO3 viewed along b direction to show the cooperative tilting of Pr octahedrons.97 e) Crystal structure of K2TbGe2O7 viewed along a direction.98 f) Structural representation of PrO2 viewed along b direction.99 Pr atoms are represented by dark blue octahedra in a, b, c, d and f, Tb (light blue octahedra in e), O (red), Na (green in a), Li (orange in b), K (light green in e) , Sr (dark purple in c and d) and Ge (light purple in e). Figures generated using Vesta software using CIF files from ICSD.100, 101
tolerance factor suggests that another phenomenon is contributing to the lattice stabilization. It should be noted that SrPrO3 deviates less from the ideal linear correlation when compared to BaPrO3. This difference could be attributed to the more distorted structure of the SrPrO3 perovskite. Other closed shell and open shell systems in AMO3
perovskites with Th4+(5f06d0), Tb4+ (4f7), Pu4+ (5f4), Am4+ (5f2), and Cm4+(5f6) fit the linear correlation with the tolerance factor.89 Hence the unusual thermodynamic stability of SrPrO3
and BaPrO3 might not be from a structural origin but rather be due to the electronic structure of these perovskites, and multiple theories have been proposed.89 The change from an eight-coordinate environment in PrO2 for Pr4+ to a six coordinate in APrO3 might be a driving force for the unusual stability.89 It has also been proposed that an increase in covalency of Pr4+–O2- bonds resulting in charge delocalization between cation 4f and anion 2p orbitals might offer extra stability to these perovskites.89 There is some indirect support for this analysis from O K-edge XAS studies of the binary oxides, CeO2, PrO2, and TbO2 (vide infra).102
The enthalpy of formation of ALnO3 (A = Sr, Ba; Ln = Ce4+, Pr4+, and Tb4+) perovskites has been examined by a number experimentalists. Ushakov and Navrotsky performed oxide-melt drop solution calorimetry to calculate the enthalpy of formation of BaLnO3 (Ln = Ce, Pr) perovskite oxides based on the
reaction between BaO and PrO2 in 2002.103 The enthalpy of formation of BaPrO3 was calculated to be -70 kJmol-1, much less than the value calculated by Gramsch and Morss (-137 kJmol-1).89 However, this value is in agreement with the linear correlation between the Goldschmidt tolerance factor and enthalpy of formation. The enthalpy of formation of BaCeO3 was calculated to be -51 kJmol-1 (oxide-melt solution calorimetry) in agreement with the value reported by Gramsch and Morss89 (-52 kJmol-1), Huntelaar104 (-53.2 kJmol-1), Fuger and Haire105 (-52 kJmol-1) using solution calorimetry. The enthalpy of formation of BaCeO3 was also determined using mass spectrometry by MatsuI (-74 kJmol-1) and significantly deviated from the previous studies.106 This discrepancy was attributed to the difference in sequence of calculation of enthalpy of formation. The enthalpy of formation of SrCeO3 was also determined using solution calorimetry by Gramsch and Morss89 (-4 kJmol-1), in excellent agreement with the values provided by Huntelaar104 (-7 kJmol-1) and Fuger and Haire105 (-5.6 kJmol-1). The significantly increased thermodynamic stability of BaCeO3 in comparison to SrCeO3 can be attributed to the Goldschmidt tolerance factor since BaCeO3 is much closer to the ideal perovskite structure than SrCeO3.89 A similar analysis can be applied to Pr4+ compounds where BaPrO3 is significantly more stable than SrPrO3. The enthalpies of formation of SrTbO3 (-49 kJmol-1) and
Page 4 of 43Dalton Transactions

Journal Name ARTICLE
This journal is © The Royal Society of Chemistry 20xx J. Name., 2013, 00, 1-3 | 5
Please do not adjust margins
Please do not adjust margins
BaTbO3 (-89 kJmol-1) were determined using solution calorimetry by Fuger and Haire and follow a similar ordering.105 Based on the thermochemistry of ternary tetravalent lanthanide oxides, Tb4+ and Ce4+ perovskites fall in line with the linear relationship between enthalpy of formation and Goldschmidt tolerance factor.94 Pr4+ perovskites show a greater degree of stabilization with BaPrO3 being the most stable ternary tetravalent oxide followed by SrPrO3 (from solution calorimetry) and with SrCeO3 the least stable.89 This observed stability is in contrast with the thermochemistry of binary tetravalent lanthanide oxides and fluorides where Pr4+ is the least stable tetravalent lanthanide. Based on the enthalpy of formation of Pr4+ based perovskites and the enthalpy of decomposition of binary oxides/fluorides, it is evident that, strong lattice contributions are required to stabilize Pr4+. However, electronic stabilization might also play a key role in stabilizing Pr4+ (vide infra). Hence, the stability of Pr4+ materials may be driven by both the lattice and the electronic structure facilitated by strong coupling between the phonon density of states and electronic density of states.107 3. Solid-State Ln4+ Chemistry
With the background solid-state thermochemistry of binary and ternary tetravalent lanthanide systems established, this section reviews the synthesis and physical properties of Pr4+, Tb4+, Nd4+, and Dy4+ in pure oxidation state and doped phases. These systems span binary and ternary oxides and fluorides and the recent preparation of more complex polynary phases. The materials included here are from an exhaustive ICSD search and include our best efforts to include unindexed early reports.101 The narrative, however, is focused on recent studies and modern characterization methods. The commercially available, mixed-valent oxides of Pr and Tb (nominally Pr6O11 and Tb4O7) are not included, since these materials have been described in detail previously.108-112 In general, mixed oxidation state materials are excluded from this discussion. All known Pr4+ and Tb4+ compounds in the solid state are summarized in Table 1 and Table 2, respectively. Synthesis of LnF4 (Ln = Ce, Pr, Tb). Ce, Pr, and Tb can be stabilized in tetravalent oxidation states as binary oxides and fluorides – LnO2 and LnF4. The fluorides can be prepared by a variety of methods: in 1934 Klemm and Henkel synthesized CeF4 by reaction of anhydrous CeCl3 with F2 at room temperature.113 In 1940, Wartenberg synthesized CeF4 by reaction of CeF3 with F2 gas in the temperature range 623-773 K.114 Longer times are required if F2 gas is diluted with N2/Ar. While TbF4 is less stable than CeF4, the synthetic conditions for the preparation of TbF4 are similar to those for CeF4. TbF4 can also be prepared by treating TbF3 or TbCl3 with F2 gas around 623 K.115 Kiselew et al., reported an alternative route to the synthesis of phase pure TbF4 and CeF4 using XeFn (n = 2, 4, 6) or KrF2 as fluorinating agents.116 These reactions took place with TbF3 or CeF3 as starting materials in a nickel or Monel container. However, such a high temperature route is not feasible for the synthesis of PrF4, since it decomposes at 363 K to PrF3 and F2,117 and is the
least stable tetrafluoride of the lanthanides. Klemm and Henkel in 1934 reported that the reaction between PrCl3 and F2 only yielded PrCl3 and PrF3.113 Efforts to synthesize PrF4 using PrF3 and Pr6O11 as starting materials yielded only PrF3 as the final product even under high pressure and high temperature conditions.118, 119
An indirect method has been successful for the synthesis of PrF4 via the decomposition of Na2PrF6. In the process reported by Shamir et al., Na2PrF6 is prepared from Na2PrCl5 under pressurized F2 gas.120 This product is then decomposed in liquid HF. This synthesis requires a rigorous experimental setup including the ability to distill anhydrous HF onto the intermediate compound. Specifically, Na2PrF6 was placed on a Teflon disc inside a Ni container and closed under an N2 atmosphere. The container was then connected to an all metal vacuum line and evacuated. Anhydrous HF was then distilled onto the compound. The reaction proceeded by the decomposition of Na2PrF6 to PrF4 and NaHF2. However, the final product was found to be mixture of PrF4 and PrF3. Falconer et al., in 1972 reported an alternative synthetic setup to isolated PrF4 from the decomposition of Na2PrF6.117 This method involves heating intimate mixtures of NaF and PrF3 under pressurized F2 gas at 673 K for 4 hours. The resulting product was then washed with anhydrous HF. However, powder X-ray diffraction (PXRD) analysis of the product also indicates that the material generated by this method is not a single phase. Pure PrF4, however, can be produced from its oxide precursor, Pr6O11, using KrF2 as the oxidant based on the process reported by Kiselew et al.116 A less daunting synthesis for PrF4 was reported by Mazej in 2002, which involved photodissociation of F2.121 Pure PrF4 can be synthesized at room temperature by the reaction of Pr6O11 in anhydrous HF with F2 gas in the presence of ultraviolet light for 11 days.
Synthesis of LnO2 (Ln = Ce, Pr, Tb). The binary oxides, CeO2, PrO2 and TbO2 are less synthetically challenging to access than the binary fluorides. Ceria, CeO2, is the most stable known dioxide of the lanthanides and finds wide-use in industry.108-112 CeO2 can be prepared by decomposing corresponding hydroxide, nitrate, carbonate, oxalate, acetate, fluoride, chloride or sulfate in air. However, the final reactions have to be carried out at 1373 K to obtain phase pure stoichiometric CeO2.122
The dioxides of Pr and Tb can be prepared via dry or wet methods. The dry method for the synthesis of PrO2, developed by Brinton and Pagel in 1929, involves heating Pr6O11 or mixtures of Pr6O11 and Pr2O3 under high pressures of oxygen in the temperature ranges of 473-673 K in a customized high-pressure furnace.123 The process was later refined by McCullough in 1949 who replaced the high-pressure furnace with a sealed U-shaped quartz tube set up using NaClO3 as the oxidizing agent (NaClO3 was separated from the starting material by placing it on the other end of the U-shaped tube).99 TbO2 was later synthesized by Katz et al. in 1949 using a customized atomic oxygen furnace set up under reduced pressure and elevated temperature conditions using Tb4O7 as the starting material.124 Katz also showed that this method
Page 5 of 43 Dalton Transactions
ARTICLE
Please do not adjust margins
Please do not adjust margins
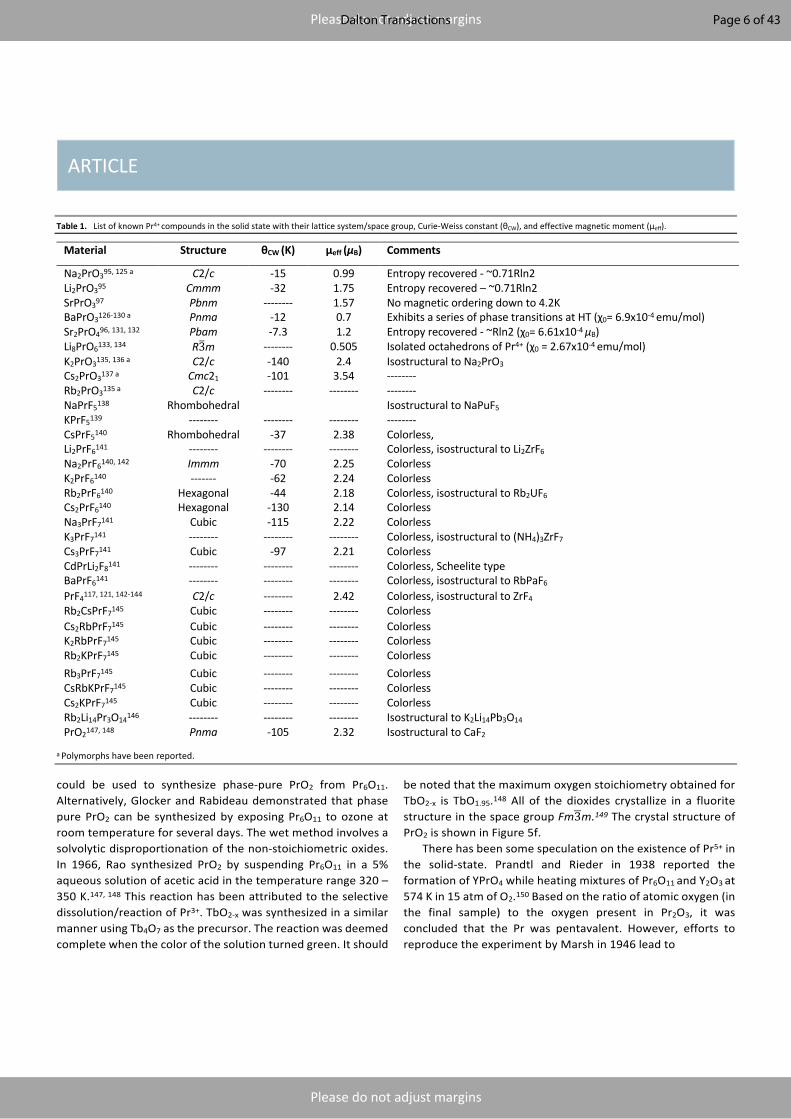
Table 1. List of known Pr4+ compounds in the solid state with their lattice system/space group, Curie-Weiss constant (θCW), and effective magnetic moment (μeff).
Material Structure θCW (K) μeff (μB) Comments
Na2PrO395, 125 a C2/c -15 0.99 Entropy recovered - ~0.71Rln2 Li2PrO395 Cmmm -32 1.75 Entropy recovered – ~0.71Rln2 SrPrO397 Pbnm -------- 1.57 No magnetic ordering down to 4.2K BaPrO3126-130 a Pnma -12 0.7 Exhibits a series of phase transitions at HT (χ0= 6.9x10⁻⁴ emu/mol) Sr2PrO496, 131, 132 Pbam -7.3 1.2 Entropy recovered - ~Rln2 (χ0= 6.61x10⁻⁴ μB) Li8PrO6133, 134 R31m -------- 0.505 Isolated octahedrons of Pr4+ (χ0 = 2.67x10⁻⁴ emu/mol) K2PrO3135, 136 a C2/c -140 2.4 Isostructural to Na2PrO3 Cs2PrO3137 a Cmc21 -101 3.54 -------- Rb2PrO3135 a C2/c -------- -------- -------- NaPrF5138 Rhombohedral Isostructural to NaPuF5 KPrF5139 -------- -------- -------- -------- CsPrF5140 Rhombohedral -37 2.38 Colorless, Li2PrF6141 -------- -------- -------- Colorless, isostructural to Li2ZrF6 Na2PrF6140, 142 Immm -70 2.25 Colorless K2PrF6140 ------- -62 2.24 Colorless Rb2PrF6140 Hexagonal -44 2.18 Colorless, isostructural to Rb2UF6 Cs2PrF6140 Hexagonal -130 2.14 Colorless Na3PrF7141 Cubic -115 2.22 Colorless K3PrF7141 -------- -------- -------- Colorless, isostructural to (NH4)3ZrF7 Cs3PrF7141 Cubic -97 2.21 Colorless CdPrLi2F8141 -------- -------- -------- Colorless, Scheelite type BaPrF6141 -------- -------- -------- Colorless, isostructural to RbPaF6 PrF4117, 121, 142-144 C2/c -------- 2.42 Colorless, isostructural to ZrF4 Rb2CsPrF7145 Cubic -------- -------- Colorless Cs2RbPrF7145 Cubic -------- -------- Colorless K2RbPrF7145 Cubic -------- -------- Colorless Rb2KPrF7145 Cubic -------- -------- Colorless Rb3PrF7145 Cubic -------- -------- Colorless CsRbKPrF7145 Cubic -------- -------- Colorless Cs2KPrF7145 Cubic -------- -------- Colorless Rb2Li14Pr3O14146 -------- -------- -------- Isostructural to K2Li14Pb3O14 PrO2147, 148 Pnma -105 2.32 Isostructural to CaF2
a Polymorphs have been reported.
could be used to synthesize phase-pure PrO2 from Pr6O11. Alternatively, Glocker and Rabideau demonstrated that phase pure PrO2 can be synthesized by exposing Pr6O11 to ozone at room temperature for several days. The wet method involves a solvolytic disproportionation of the non-stoichiometric oxides. In 1966, Rao synthesized PrO2 by suspending Pr6O11 in a 5% aqueous solution of acetic acid in the temperature range 320 – 350 K.147, 148 This reaction has been attributed to the selective dissolution/reaction of Pr3+. TbO2-x was synthesized in a similar manner using Tb4O7 as the precursor. The reaction was deemed complete when the color of the solution turned green. It should
be noted that the maximum oxygen stoichiometry obtained for TbO2-x is TbO1.95.148 All of the dioxides crystallize in a fluorite structure in the space group Fm32m.149 The crystal structure of PrO2 is shown in Figure 5f. There has been some speculation on the existence of Pr5+ in the solid-state. Prandtl and Rieder in 1938 reported the formation of YPrO4 while heating mixtures of Pr6O11 and Y2O3 at 574 K in 15 atm of O2.150 Based on the ratio of atomic oxygen (in the final sample) to the oxygen present in Pr2O3, it was concluded that the Pr was pentavalent. However, efforts to reproduce the experiment by Marsh in 1946 lead to
Page 6 of 43Dalton Transactions

ARTICLE
Please do not adjust margins
Please do not adjust margins
Table 2. List of known Tb4+ compounds in the solid state with their crystal structure, Curie-Weiss constant (θCW), and effective magnetic moment (μeff).
Material Structure θCW (K) μeff (μB) Comments
Na2TbO395, 125, 151, 152 a C2/c -105 7.90 Entropy recovered - ~0.71Rln8 K2TbO3136 a -------- -47 8.5 Isostructural to α-NaFeO2 Rb2TbO3153 a -------- -57 7.9 Isostructural to α-NaFeO2 Cs2TbO3153 a -------- -64 7.3 Isostructural to α-NaFeO2 SrTbO3154 Pnma -54.5 7.96 -------- BaTbO3154, 155 Pnma -52.8 7.96 -------- Li8TbO6133, 134 R31m -------- 6.06 Isolated octahedrons of Tb4+ Li2TbF6156-159 P121/c1 -------- 7.86 A rare example of Li in 5 coordination Li4TbF8160 Pnma -------- -------- -------- K2TbF6158 C12/c1 -------- 4.44b K = [0.0074, 0, 0] magnetic structure Rb2TbF6158 C12/c1 -------- 6.27b K = [0.0104, 0, 0] magnetic structure BaTbF6161 a P11 -------- 6.68b -------- CaTbF6162, 163 P42/m -------- -------- Undergoes a structural phase transition at 220K KTbF5164 P11 -------- -------- TN = 1.6K CsTbF5165 Cmca -------- -------- No magnetic ordering down to 1.4K RbTbF5164 P11 -------- -------- TN = 1.4K Cd2TbF8166 I41 -------- -------- A 8 coordinate Terbium Cs3TbF7167 Fm31m -------- -------- -------- K3TbF7145 Cubic -------- -------- Colorless Rb2KTbF7145 Cubic -------- -------- Colorless K2RbTbF7145 Cubic -------- -------- Colorless Rb3TbF7145 Cubic -------- -------- Colorless CsRbKTbF7145 Cubic -------- -------- Colorless Cs2KTbF7145 Cubic -------- -------- Colorless Rb2CsTbF7145 Cubic -------- -------- Colorless Cs2RbTbF7145 Cubic -------- -------- Colorless CdTbF6163 P42/m -------- 6.5b K = [½, ½, 0] magnetic structure SrTbF6163 Orthorhombic -------- -------- Undergoes a structural phase transition at 210K LiTbIO6168 -------- -------- 7.78 Brownish red NaTbIO6168 -------- -------- 8.03 Brownish red KTbIO6168 -------- -------- 7.96 Brownish red Rb2Li14Tb3O14169 -------- -------- -------- Yellow single crystals, isostructural to K2Li14Pb3O14 Cs2Li14Tb3O14170 -------- -------- -------- Orange single crystals, isostructural to K2Li14Pb3O14 K2GeTb2O798 C2/c -------- -------- Hydrothermal synthesis TbO2147, 148, 171 Fm31m -------- 7.9 TN = 3K TbF4117, 121 -------- -------- -------- --------
a Polymorphs have been reported.
b Ordered magnetic moments have been reported.
oxidation of Pr to only to the 4+ oxidation state.172 This discrepancy was attributed to the hygroscopic nature of Y2O3,
and no adequate precautions were carried out by Prandtl and Rieder against exposure to atmospheric moisture.172 Later work by McCullough to oxidize Pr in the presence of other trivalent lanthanides also confirms the formation of Pr4+.99 McCullough used the decrease in lattice constants for the solid solution in the Pr–Nd–O system from X-ray powder diffraction with
increase in oxidation state of Pr as evidence to support the tetravalent oxidation state of Pr.
Ternary Fluorides. Ternary fluorides of Ce4+ are the most stable amongst the fluorides with tetravalent lanthanides. A wide-range of ternary Ce4+ fluorides have been synthesized and a detailed accounting of these systems is not included here. The synthesis of ternary fluorides with Ce4+ such as K3CeF7 and K2CeF6 is relatively straightforward. Generally, phase pure compounds can be prepared by treating stoichiometric
Page 7 of 43 Dalton Transactions

ARTICLE Journal Name
8 | J. Name., 2012, 00, 1-3 This journal is © The Royal Society of Chemistry 20xx
Please do not adjust margins
Please do not adjust margins
mixtures of corresponding starting materials under a flow of F2 gas diluted with N2/Ar. The synthesis of ternary fluorides with Tb4+ is similar to Ce4+ in that it does not require high pressure fluorination. All known ternary fluorides with tetravalent Tb can be synthesized with F2 gas (pure or diluted) employing Tb2O3/Tb4O7/TbF3/TbCl3 as starting materials.167 The reactions are usually carried out in alumina boats if the temperature of the reaction is less than 773 K. Above 773 K, alumina reacts with F2 generating AlF3. For reactions above 773 K, nickel boats are used with some risk of contaminating samples with Ni4+. A proposed intermediate in the synthesis of ternary compounds is TbF4. Therefore care must be taken for reactions over 823 K, around which temperature TbF4 decomposes eliminating fluorine and resulting in the formation of TbF3, which can react with remaining TbF4 resulting in mixed valent compounds.173 The synthesis of ternary fluorides of Pr4+, however, requires high pressure fluorination.122
Synthesis of ALnF5 (A = Na, K, Cs, Rb; Ln = Pr, Tb). NaPrF5 was first reported by Hoppe in 1959.174 However, this material is not completely structurally characterized. The formation of Pr4+ was confirmed with magnetometry and iodometry.174 In 1961, Keenan and Asprey, synthesized NaPrF5 by high pressure fluorination in the temperature ranges 473-673 K for several hours.138 Stock solutions for Pr were made by dissolving corresponding oxide in hydrochloric acid. NaCl and Pr solutions were mixed in stoichiometric amounts and the mixture was evaporated to dryness, resulting in fine powders. The fine powders were ground and subjected to high-pressure fluorination. Based on PXRD and absorption spectroscopy, NaPrF5 was found to contain only ~75% Pr4+ and the Pr3+ was attributed to reduction of Pr4+ by adventitious H2O. Hoppe and Liebe in 1961 synthesized CsPrF5 by treating stoichiometric mixtures of CsCl and Pr6O11 in a custom-built high-pressure fluorination furnace at 623 K.140 There has been a report of the existence of KPrF5 and RbPrF5 however, definitive evidence has not been presented.139
The Tb analogs were reported by Avignant in 1997. 165 175 The studies present the single-crystal X-ray structures of KTbF5 and CsTbF5 with 8 coordinate Tb4+. It should be noted here that Hoppe and Rodder in 1961 had mentioned the existence of KTbF5 and CsTbF5 with unknown structures.176 RbTbF5 has been mentioned in literature and has been proposed to have the same crystal structure as KTbF5.167 CsTbF5 crystallizes in the orthorhombic Cmca space group with 20% edge shared and 80% corner shared polyhedrons of TbF8. KTbF5 and RbTbF5
crystallize in the P12 space group with 50% corner and 50% edge shared polyhedrons of TbF8.
Synthesis of A2LnF6 (A = Li, Na, K, Cs, Rb; Ln = Pr, Tb). Li2PrF6
was synthesized by Hoppe and Feldner in 1983.141 Colorless powders of Li2PrF6 were determined to be in the hexagonal, P321m space group. The synthesis and structural characterization of Na2PrF6, K2PrF6, Rb2PrF6 and Cs2PrF6 was reported by Hoppe and Liebe in 1961.140 The synthesis involved treating stoichiometric mixtures of corresponding alkali chloride with Pr6O11 at 763 K for Na2PrF6, 723 K for K2PrF6, 693 K for Rb2PrF6, and 663 K for Cs2PrF6. Na2PrF6 was characterized in a rhombohedral space group, while Rb2PrF6 and Cs2PrF6 were
characterized in a hexagonal space group. However, no structural information was available on K2PrF6. Riesfeld revised the structural characterization Na2PrF6 to Immm space group in 1967 yielding a cubic eight-fold coordination for Pr4+.142 Tb4+ is only structurally characterized in Li2TbF6, K2TbF6, and Rb2TbF6.177 Synthesis involves treating stoichiometric mixtures of alkali fluoride and TbF3 under a flow of F2 gas at 773 K.177 Li2TbF6 crystallizes in a P21/c space group while K2TbF6 and Rb2TbF6 are isostructural to Li2ZrF6 and crystallize in the monoclinic C2/c space group.157, 159, 178
Synthesis of M’LnF6 (M’ = Ca, Ba, Cd, Sr; Ln = Pr, Tb). Within this class of compounds, Pr is only known in BaPrF6.141 It has been reported to be isostructural to RbPaF6 (orthorhombic Cmma).179 However, for Tb4+, four compounds are known with complete structural characterization. The Tb compounds were synthesized by treating stoichiometric mixtures of M’F2 (M’ = Ca, Sr, Ba, Cd) and TbF4 under F2 gas at 773 K – 993 K.163 SrTbF6
has been found to be isostructural to BaPrF6 with edge sharing TbF8 polyhedra resulting in linear TbF6 chains linked by Sr2+
cations.163, 180 This motif is the most common structure type for M’Ln4+F6 compounds and is isostructural to APaF6, PbZrF6, EuZrF6 and SrZrF6 (A = NH4, K, Rb, Cs).180 The structure of CaTbF6
is closely related to CaZrF6 and CaUF6 – however, is not isostructural because of the difference in the coordination number of the tetravalent cations.162 The structure of CdTbF6
based on X-ray and neutron diffraction appears to be isotypic to CaTbF6. The Ca and Cd structures appear closely related to anti-KSbF6 type anion-rich compounds. It should be noted here that while the structures of CaTbF6 and CdTbF6 have been solved using P42/m, there is some discrepancy due to the presence of unexplained superstructure peaks in their diffraction patterns. Ca and Cd compounds are reported to exhibit tetragonal distortion to isostructural SrTbF6.181 The TbF8 polyhedra share opposite orthogonal edges resulting in TbF6 chains along the a-axis. CaF6 and CdF6 octahedra share corners with TbF8 polyhedra from multiple chains. This difference in structure between CaTbF6 and SrTbF6 has been attributed to a slight rearrangement of the anion lattice to accommodate eight-coordinate Tb4+
cations.162 BaTbF6 was the first known tetravalent Tb fluoride with a
polymorphic phase transition at high temperatures.182 The low temperature α–BaTbF6 was first reported as an unknown structure by Feldner and Hoppe in 1983 and was later structurally characterized by Cousseins et al. in 1997 using single crystal X-ray diffraction (SC-XRD).141, 182 α–BaTbF6 is found to be stable up to 823 K above which the high temperature β–BaTbF6 begins to form. The structure of α–BaTbF6 was solved in a triclinic P12 space group and can be considered a triclinic distortion to isostructural SrTbF6.181 The high temperature polymorph, β–BaTbF6, is stable above 823 K. The structure of β–BaTbF6 was solved by Avignant and found to be isostructural to BaPrF6.
Synthesis of A3LnF7 (A = Na, K, Rb, Cs; Ln = Pr, Tb, Nd, Dy). A3LnF7 compounds are the only class of fluoride compounds with tetravalent lanthanides that are seven-coordinate. The Pr compounds with Na, K, Rb and Cs as the A site cation were synthesized in 1961 by Hoppe and Liebe using alkali metal
Page 8 of 43Dalton Transactions

Journal Name ARTICLE
This journal is © The Royal Society of Chemistry 20xx J. Name., 2013, 00, 1-3 | 9
Please do not adjust margins
Please do not adjust margins
fluoride and PrF3 as starting materials in temperature range of 663-883 K.140 All four compounds were reported to be colorless and isostructural to (NH4)3ZrF7.
In 1961 Hoppe and Rodder synthesized the first Tb4+ material in this class, Cs3TbF7 .176 It was prepared from Tb4O7 and CsCl under F2 gas at 663 K. There have been mentions of K3TbF7 and Rb3TbF7 in the literature which report them to be isostructural to Cs3TbF7 in the (NH4)3ZrF7 setting.145 The Nd4+ and Dy4+ materials are discussed separately (vide infra). Besides the major classes of ternary fluorides discussed above, two other Tb4+ fluorides have been reported: Cd2TbF8 and Li4TbF8.160, 166
Synthesis of Li8LnO6 oxides (Ln = Ce, Pr, Tb). Lithium rich oxides of the type Li8MO6 (M = Ce, Pr, Tb), isostructural to Li8SnO6, were synthesized using Li2O or Li2O2 as starting materials. The use of alternative sources for Li2O like carbonates or nitrates did not yield the desired products. Methods to prepare single-crystal samples of the Pr4+ and Tb4+ materials were also reported.183, 184 Hoppe and Wolf in 1985 synthesized Li8TbO6 as bright yellow single crystals by heating an intimate, stoichiometric mixture of Tb4O7 and Li2O2 in a sealed silver tube at 853 K for 22 days.134 Hoppe and Wolfe also reported the synthesis of pale-yellow single crystals of Li8PrO6 by heating stoichiometric mixtures of K2PrO3 and Li2O2 at 873 K in sealed Ag tubes for 20 days. Hoppe, Wolf, and Kroeschell in 1986 reported the synthesis of colorless single crystals of Li8CeO6 by treating stoichiometric mixtures of KCeO2 and Li2O2 in Ag tubes at 923 K for 60 days.183 The synthesis of powder samples of Li8LnO6 compounds was later reported by Hinatsu in 1996.133 Hinatsu synthesized Li8LnO6 by heating stoichiometric mixtures of Li2O (5% excess Li2O was used) and corresponding lanthanide oxide (Pr6O11, Tb4O7, and CeO2) under an oxygen flow at 973 K. Li8LnO6 materials crystallize in the R32 space group. The structure consists of isolated and slightly distorted LnO6 octahedrons. Attempts to synthesize other alkali metal derivatives of Li8LnO6 type compounds were unsuccessful. Hoppe and Wolf in 1986 reported the synthesis of Li6Tb2O7 (derivative of NaCl structure type with ordered vacancies in the anion lattice) by heat treating stoichiometric mixtures of Tb4O7 and Li2O2 at 1123 K for 22 days in gold tubes.169
Synthesis of A2LnO3 oxides (A = Li, Na, K, Rb, Cs; Ln = Ce, Pr, Tb). Cubic NaCl derivatives of type A2MO3 are widely distributed across the periodic table. A2MO3 structure types can be considered as cation ordered derivatives of delafossites with structure type AMO2. A2MO3 structure types usually exhibit stable polymorphs at high temperatures.122 However, such polymorphs are found to be metastable with lanthanides and require quenching from high temperatures to capture the high-temperature modifications. A2CeO3 compounds are the most stable owing to the high thermodynamic stability of CeO2. It should be noted here that the synthesis of A2LnO3 requires the use of corresponding higher alkali metal oxides as starting materials (AOx, x > 0.5). The use of alternative sources of AOx like carbonates and nitrates has been proposed for the synthesis of transition metal based A2MO3 oxides. With lanthanides, such indirect methods are unsuccessful. However, in 2006 Hinatsu revised the synthesis of Li2PrO3, by using
stoichiometric mixtures of Li2O and Pr6O11 under an oxygen flow at 973 K for 12 hours.95 In the same paper, a revised synthesis of Na2LnO3 was reported using stoichiometric mixtures of Na2O2 and corresponding lanthanide oxide (Pr6O11, Tb4O7, and CeO2) contained in gold tubes at 973 K for 12 hours under a flow of oxygen. In Li2PrO3 the PrO6 octahedra are edge shared along c-axis and corner shared along the b-axis as shown in Figure 5b. In Na2LnO3 the LnO6 and NaO6 octahedra are edge shared forming 2D layers with Na atoms between the layers as shown in Figure 5a.
Synthesis of M’LnO3 oxides (M’ = Sr, Ba; Ln = Ce, Pr, Tb). M’BO3 perovskites are widespread across the periodic table. Depending on the ratio of the ionic radii of A site and B site cation, given by the Goldschmidt tolerance factor, the perovskites deviate from the ideal cubic structure due to cooperative tilting of the BO6 octahedron.94 The cooperative tilting results in significant oxygen atom displacements and hence lowering the symmetry to either a trigonal or orthorhombic space group. Since Ce4+ and Pr4+ are closer in ionic radii compared to Tb4+, Ce4+ and Pr4+ based perovskites exhibit similar structural features.
BaLnO3 perovskites are synthesized by firing stoichiometric mixtures of BaCO3 and CeO2 (Pr2O3/Tb2O3) under a flow of oxygen at 1323 K for 48 hours twice. Hinatsu later reported the synthesis of BaPrO3 and BaTbO3 by treating stoichiometric mixtures of BaCO3 and Pr6O11 or Tb4O7 at 1573 K under a flow of oxygen.155 BaPrO3 and BaCeO3 crystallize in orthorhombic Pbnm, while BaTbO3 crystallizes in trigonal R32c.184 As expected, due to the decrease in ionic radii from Ce4+ to Tb4+, the Goldschmidt tolerance factor increases from BaCeO3 to BaTbO3, as shown in Figure 4. Since the ionic radius of Tb4+ is closer to the ionic radius of Ba2+, the Goldschmidt tolerance factor is closer to unity, resulting in a higher symmetry space group for BaTbO3 when compared to BaPrO3 and BaCeO3.
However, the assignment of the BaTbO3 space group is complex due to the difficulties in differentiating structural variations in these perovskites. This difficulty is likely due to variations in cooling rates, synthetic methods, and technical
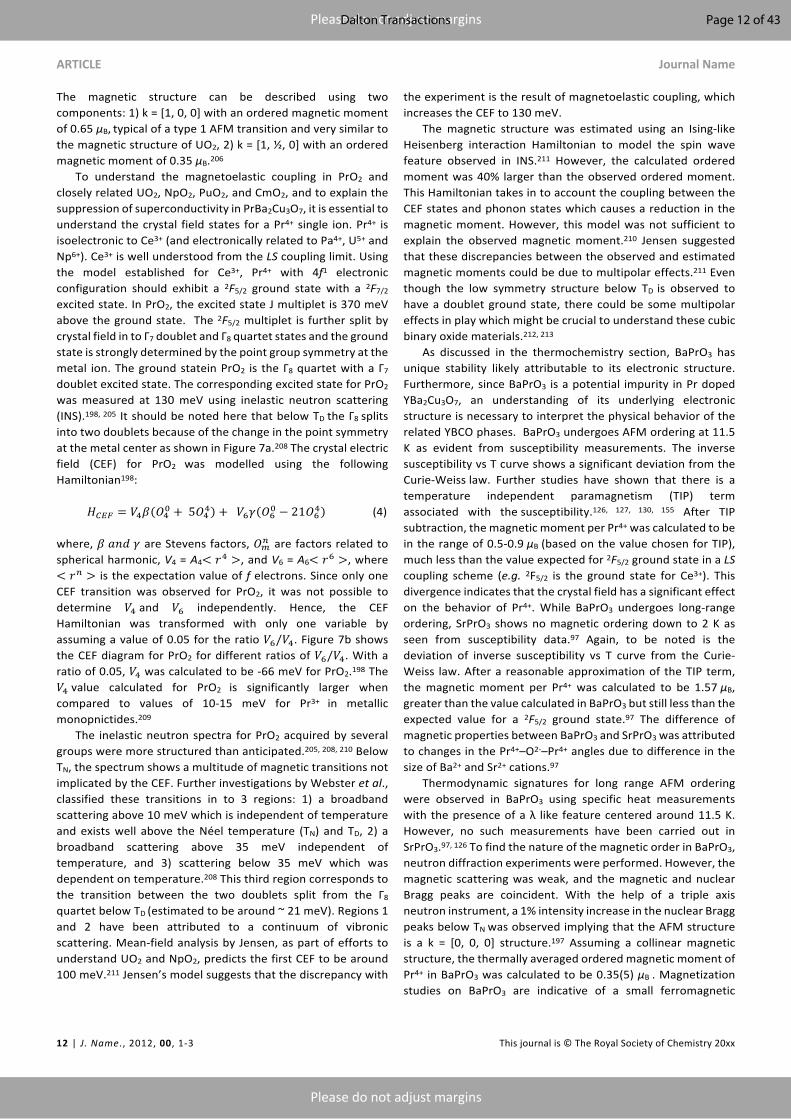
Figure 6. The lattice constants for cubic phase A2A’LnF7 (A = Rb, Cs; A’ = Cs, Rb; Ln = Ce, Pr, Nd, Tb, Dy) plotted against corresponding lanthanide. It should be noted here that the lattice constants have not been plotted against ionic radii since the ionic radii of Nd4+ and Dy4+ are not well established. Figure adapted from reference 145.
Page 9 of 43 Dalton Transactions
ARTICLE Journal Name
10 | J. Name., 2012, 00, 1-3 This journal is © The Royal Society of Chemistry 20xx
Please do not adjust margins
Please do not adjust margins
developments in diffraction capabilities. Since its initial characterization by Hoppe and Paletta in 1966, the material has been solved in a range of space groups.136, 184-187 Most recently, high resolution neutron diffraction experiments across a wide range of temperatures by Ijdo et al. in 2004 showed that BaTbO3
adopts an orthorhombic Ibnm below 280 K.188 BaTbO3
undergoes a phase transformation adopting a tetragonal I4/mcm above 280 K before adopting a cubic Pm32m space group above 623 K. A similar series of phase transformation has also been reported for BaCeO3 and BaPbO3.189 SrLnO3 perovskites can be synthesized using similar conditions as BaLnO3
perovskites.186 The room temperature structure of SrTbO3 was solved using an orthorhombic pnma space group using neutron diffraction.186 SrPrO3 was reported to crystallize in an orthorhombic space group by Hinatsu et al.,97 but later characterized using a monoclinic space group by Bukowski et al.190 The crystal structure of SrPrO3 is shown in Figure 5d.
Ruddlesden-Popper perovskites of the type M’n+1LnnO3n+1 (n=1) are also known to stabilize lanthanides in the tetravalent oxidation state. However, only Sr2CeO4 and Sr2PrO4 have been isolated in this class of materials.191 Sr2PrO4 was synthesized by firing a stoichiometric mixture of Pr6O11 and SrCO3 at 1273 K for 48 hours in a muffle furnace under ambient atmosphere.96 Unlike the other Pr based oxides, Sr2PrO4 does not require a pure oxygen atmosphere. In Sr2PrO4, the PrO6 octahedra form an edge shared chain along the b-axis as shown in Figure 5c.
Polynary phases. Besides the binary and ternary oxides and fluorides of tetravalent lanthanides, polynary systems can stabilize the lanthanide 4+ oxidation state. Kolis et al.98 have described the synthesis of germanates that stabilize Tb4+ using hydrothermal conditions. In one such reaction, a KOH solution and Tb4O7 and GeO2 as starting materials, were heated at 973 K under hydrothermal conditions. Two materials were isolated from the same reaction: Tb13(GeO4)6O7(OH) containing Tb3+ and K2TbGe2O7 containing Tb4+. The crystal structure of K2TbGe2O7 is shown in Figure 5e. Tb4+ has also been stabilized in germanate-based lattices using flux synthetic techniques. Zur Loye recently reported the synthesis of a mixed-valent Tb3+/Tb4+ material, Cs8Tb23+Tb4+Ge9O27, using CsCl as a flux.192
Tb4+ compounds have been stabilized in lattices using non-traditional solid-state techniques by making use of the ability to stabilize Tb4+ in aqueous solutions (like the hydrothermal method discussed above) in an appropriate ligand field. Ru-Dong et al., in 1991, synthesized alkali Tb hexaiodate from basic aqueous solution using Tb3+ precursors and ozone as the oxidizing agent.168 The Tb3+ precursor was synthesized by dissolving KIO4 and KOH in distilled water followed by adding a Tb(NO3)3 solution dropwise. This colorless solution was oxidized using ozone until the solution changed color to a dark reddish-brown. The resulting solution was filtered, followed by addition of a saturated alkali nitrate solution to precipitate ATb4+IO6 (A = Li, Na or K). These materials were characterized by magnetic measurements. There have also been reports of the existence of Pr4+ in polynary phases and these are listed in Table 1.145, 146
Tetravalent Nd and Dy. Nd and Dy have also been isolated in their tetravalent oxidation states. The synthesis of Nd4+ and Dy4+ is often obscured due to competing reactions that result in
impure phases.193 However, pure Nd4+ and Dy4+ compounds have been synthesized using high pressure fluorination.193 So far, only six pure phases of Nd4+ and Dy4+ have been reported. All of the six compounds are of the type A2A’MF7 (A = Rb, Cs, A’ = Rb, Cs, M = Nd, Dy). A2A’MCl6 was used as the starting material. Initially, the chloride was subjected to dilute fluorine gas (F2: N2 = 1:5) at ambient pressures in corundum containers at 673 K. These conditions resulted in a halogen exchange reaction leading to the formation of A2A’MF6. This fluoride compound was then subjected to high pressure fluorination in a Monel autoclave with 5 mL of liquid F2 condensed into the autoclave at a pressure of 170 bar. The reaction was carried out at a temperature of 693 K for 2 hours. The heating rate was limited to ~35 K/min. After 2 hours, the autoclave was quenched from the furnace on to a stream of cold air followed by dipping in to liquid N2.193
All of the six compounds crystallize in a cubic phase with their lattice parameters co-plotted with their Ce, Pr, and Tb analogs in Figure 6. The lattice constants for A2A’LnF7 materials decrease monotonically due to a decrease in ionic radii from Ce4+ to Dy4+ confirming the tetravalent oxidation state of Nd and Dy (the anomalous lattice constant for Cs2KTbF7 is not explained in the literature). Kaindl (vide infra) later confirmed the tetravalent oxidation state of Nd and Dy in the materials using Ln L3-edge, M5,4-edge, and F K-edge X-ray absorption spectroscopy (XAS) studies. However, no magnetic measurements have been reported for either Nd4+ or Dy4+ materials. It should be noted here that A2A’LnF6 also crystallizes in a cubic space group. The final products were microcrystalline and were described as yellow/orange in color.145
There have also been reports of the presence of Dy4+ in perovskite-based oxides. Brauer and Kristen in 1980 reported that BaCeO3 was able to stabilize tetravalent Dy doped up to 5% loading.194 However, Soderholm et al. in 1987 showed the dysprosium in the system was not tetravalent using Mossbauer spectroscopy.195 Shinoda et al. in 2012 synthesized 20% Dy doped in BaZrO3 lattice under an O2 atmosphere at 1893 K.196 A black pellet was obtained after the reaction and the phase purity was confirmed by X-ray diffraction. Under a reducing H2 atmosphere, the pellet changed to white color. L3-edge X-ray absorption near edge spectroscopy (XANES) was used as the primary technique to determine the oxidation state of the Dy. The L3-edge XAS spectrum for the black pellet exhibits a multi-peak feature while the L3-edge XAS spectrum for the white pellet exhibits a single peak feature analogous to Dy2O3. Hence, the authors concluded that the Dy in BaZrO3 even under oxidizing atmospheres is mixed-valent with both Dy3+ and Dy4+.
Electronic Structure and Physical Properties of Ln4+ Phases. Extensive studies have been carried out to understand the single-ion and bulk behavior of Pr4+ systems (PrO2 and BaPrO3). These studies were primarily motivated due to the anomalous behavior of Pr-doped YBa2Cu3O7, a high temperature superconducting layered perovskite.126, 197 In this class of materials, the superconducting transition temperature is relatively insensitive to doping of Y with a trivalent lanthanide, except for Ce, Pr, or Tb. Pr, in particular, has a notable effect on
Page 10 of 43Dalton Transactions
ARTICLE
Please do not adjust margins
Please do not adjust margins
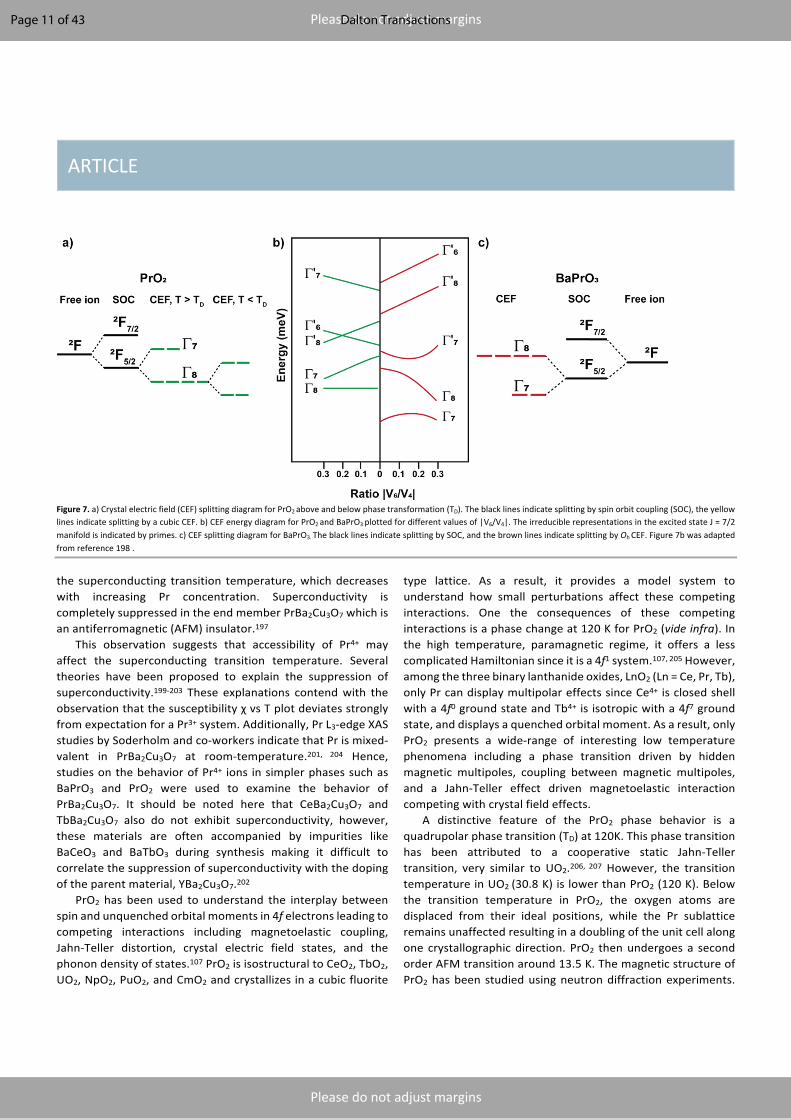
Figure 7. a) Crystal electric field (CEF) splitting diagram for PrO2 above and below phase transformation (TD). The black lines indicate splitting by spin orbit coupling (SOC), the yellow lines indicate splitting by a cubic CEF. b) CEF energy diagram for PrO2 and BaPrO3 plotted for different values of |V6/V4|. The irreducible representations in the excited state J = 7/2 manifold is indicated by primes. c) CEF splitting diagram for BaPrO3. The black lines indicate splitting by SOC, and the brown lines indicate splitting by Oh CEF. Figure 7b was adapted from reference 198 .
the superconducting transition temperature, which decreases with increasing Pr concentration. Superconductivity is completely suppressed in the end member PrBa2Cu3O7 which is an antiferromagnetic (AFM) insulator.197
This observation suggests that accessibility of Pr4+ may affect the superconducting transition temperature. Several theories have been proposed to explain the suppression of superconductivity.199-203 These explanations contend with the observation that the susceptibility χ vs T plot deviates strongly from expectation for a Pr3+ system. Additionally, Pr L3-edge XAS studies by Soderholm and co-workers indicate that Pr is mixed-valent in PrBa2Cu3O7 at room-temperature.201, 204 Hence, studies on the behavior of Pr4+ ions in simpler phases such as BaPrO3 and PrO2 were used to examine the behavior of PrBa2Cu3O7. It should be noted here that CeBa2Cu3O7 and TbBa2Cu3O7 also do not exhibit superconductivity, however, these materials are often accompanied by impurities like BaCeO3 and BaTbO3 during synthesis making it difficult to correlate the suppression of superconductivity with the doping of the parent material, YBa2Cu3O7.202
PrO2 has been used to understand the interplay between spin and unquenched orbital moments in 4f electrons leading to competing interactions including magnetoelastic coupling, Jahn-Teller distortion, crystal electric field states, and the phonon density of states.107 PrO2 is isostructural to CeO2, TbO2, UO2, NpO2, PuO2, and CmO2 and crystallizes in a cubic fluorite
type lattice. As a result, it provides a model system to understand how small perturbations affect these competing interactions. One the consequences of these competing interactions is a phase change at 120 K for PrO2 (vide infra). In the high temperature, paramagnetic regime, it offers a less complicated Hamiltonian since it is a 4f1 system.107, 205 However, among the three binary lanthanide oxides, LnO2 (Ln = Ce, Pr, Tb), only Pr can display multipolar effects since Ce4+ is closed shell with a 4f0 ground state and Tb4+ is isotropic with a 4f7 ground state, and displays a quenched orbital moment. As a result, only PrO2 presents a wide-range of interesting low temperature phenomena including a phase transition driven by hidden magnetic multipoles, coupling between magnetic multipoles, and a Jahn-Teller effect driven magnetoelastic interaction competing with crystal field effects.
A distinctive feature of the PrO2 phase behavior is a quadrupolar phase transition (TD) at 120K. This phase transition has been attributed to a cooperative static Jahn-Teller transition, very similar to UO2.206, 207 However, the transition temperature in UO2 (30.8 K) is lower than PrO2 (120 K). Below the transition temperature in PrO2, the oxygen atoms are displaced from their ideal positions, while the Pr sublattice remains unaffected resulting in a doubling of the unit cell along one crystallographic direction. PrO2 then undergoes a second order AFM transition around 13.5 K. The magnetic structure of PrO2 has been studied using neutron diffraction experiments.
Page 11 of 43 Dalton Transactions
ARTICLE Journal Name
12 | J. Name., 2012, 00, 1-3 This journal is © The Royal Society of Chemistry 20xx
Please do not adjust margins
Please do not adjust margins
The magnetic structure can be described using two components: 1) k = [1, 0, 0] with an ordered magnetic moment of 0.65 μB, typical of a type 1 AFM transition and very similar to the magnetic structure of UO2, 2) k = [1, ½, 0] with an ordered magnetic moment of 0.35 μB.206
To understand the magnetoelastic coupling in PrO2 and closely related UO2, NpO2, PuO2, and CmO2, and to explain the suppression of superconductivity in PrBa2Cu3O7, it is essential to understand the crystal field states for a Pr4+ single ion. Pr4+ is isoelectronic to Ce3+ (and electronically related to Pa4+, U5+ and Np6+). Ce3+ is well understood from the LS coupling limit. Using the model established for Ce3+, Pr4+ with 4f1 electronic configuration should exhibit a 2F5/2 ground state with a 2F7/2 excited state. In PrO2, the excited state J multiplet is 370 meV above the ground state. The 2F5/2 multiplet is further split by crystal field in to Γ7 doublet and Γ8 quartet states and the ground state is strongly determined by the point group symmetry at the metal ion. The ground statein PrO2 is the Γ8 quartet with a Γ7 doublet excited state. The corresponding excited state for PrO2
was measured at 130 meV using inelastic neutron scattering (INS).198, 205 It should be noted here that below TD the Γ8 splits into two doublets because of the change in the point symmetry at the metal center as shown in Figure 7a.208 The crystal electric field (CEF) for PrO2 was modelled using the following Hamiltonian198:
𝐻789 = 𝑉#𝛽(𝑂#" +5𝑂##) + 𝑉:𝛾(𝑂:" − 21𝑂:#) (4)
where, 𝛽𝑎𝑛𝑑𝛾 are Stevens factors, 𝑂36 are factors related to spherical harmonic, V4 = A4< 𝑟# >, and V6 = A6< 𝑟: >, where < 𝑟6 > is the expectation value of f electrons. Since only one CEF transition was observed for PrO2, it was not possible to determine 𝑉#and 𝑉: independently. Hence, the CEF Hamiltonian was transformed with only one variable by assuming a value of 0.05 for the ratio 𝑉:/𝑉#. Figure 7b shows the CEF diagram for PrO2 for different ratios of 𝑉:/𝑉#. With a ratio of 0.05, 𝑉# was calculated to be -66 meV for PrO2.198 The 𝑉#value calculated for PrO2 is significantly larger when compared to values of 10-15 meV for Pr3+ in metallic monopnictides.209
The inelastic neutron spectra for PrO2 acquired by several groups were more structured than anticipated.205, 208, 210 Below TN, the spectrum shows a multitude of magnetic transitions not implicated by the CEF. Further investigations by Webster et al., classified these transitions in to 3 regions: 1) a broadband scattering above 10 meV which is independent of temperature and exists well above the Néel temperature (TN) and TD, 2) a broadband scattering above 35 meV independent of temperature, and 3) scattering below 35 meV which was dependent on temperature.208 This third region corresponds to the transition between the two doublets split from the Γ8
quartet below TD (estimated to be around ~ 21 meV). Regions 1 and 2 have been attributed to a continuum of vibronic scattering. Mean-field analysis by Jensen, as part of efforts to understand UO2 and NpO2, predicts the first CEF to be around 100 meV.211 Jensen’s model suggests that the discrepancy with
the experiment is the result of magnetoelastic coupling, which increases the CEF to 130 meV.
The magnetic structure was estimated using an Ising-like Heisenberg interaction Hamiltonian to model the spin wave feature observed in INS.211 However, the calculated ordered moment was 40% larger than the observed ordered moment. This Hamiltonian takes in to account the coupling between the CEF states and phonon states which causes a reduction in the magnetic moment. However, this model was not sufficient to explain the observed magnetic moment.210 Jensen suggested that these discrepancies between the observed and estimated magnetic moments could be due to multipolar effects.211 Even though the low symmetry structure below TD is observed to have a doublet ground state, there could be some multipolar effects in play which might be crucial to understand these cubic binary oxide materials.212, 213 As discussed in the thermochemistry section, BaPrO3 has unique stability likely attributable to its electronic structure. Furthermore, since BaPrO3 is a potential impurity in Pr doped YBa2Cu3O7, an understanding of its underlying electronic structure is necessary to interpret the physical behavior of the related YBCO phases. BaPrO3 undergoes AFM ordering at 11.5 K as evident from susceptibility measurements. The inverse susceptibility vs T curve shows a significant deviation from the Curie-Weiss law. Further studies have shown that there is a temperature independent paramagnetism (TIP) term associated with the susceptibility.126, 127, 130, 155 After TIP subtraction, the magnetic moment per Pr4+ was calculated to be in the range of 0.5-0.9 μB (based on the value chosen for TIP), much less than the value expected for 2F5/2 ground state in a LS coupling scheme (e.g. 2F5/2 is the ground state for Ce3+). This divergence indicates that the crystal field has a significant effect on the behavior of Pr4+. While BaPrO3 undergoes long-range ordering, SrPrO3 shows no magnetic ordering down to 2 K as seen from susceptibility data.97 Again, to be noted is the deviation of inverse susceptibility vs T curve from the Curie-Weiss law. After a reasonable approximation of the TIP term, the magnetic moment per Pr4+ was calculated to be 1.57 μB, greater than the value calculated in BaPrO3 but still less than the expected value for a 2F5/2 ground state.97 The difference of magnetic properties between BaPrO3 and SrPrO3 was attributed to changes in the Pr4+–O2-–Pr4+ angles due to difference in the size of Ba2+ and Sr2+ cations.97
Thermodynamic signatures for long range AFM ordering were observed in BaPrO3 using specific heat measurements with the presence of a λ like feature centered around 11.5 K. However, no such measurements have been carried out in SrPrO3.97, 126 To find the nature of the magnetic order in BaPrO3, neutron diffraction experiments were performed. However, the magnetic scattering was weak, and the magnetic and nuclear Bragg peaks are coincident. With the help of a triple axis neutron instrument, a 1% intensity increase in the nuclear Bragg peaks below TN was observed implying that the AFM structure is a k = [0, 0, 0] structure.197 Assuming a collinear magnetic structure, the thermally averaged ordered magnetic moment of Pr4+ in BaPrO3 was calculated to be 0.35(5) μB . Magnetization studies on BaPrO3 are indicative of a small ferromagnetic
Page 12 of 43Dalton Transactions
Journal Name ARTICLE
This journal is © The Royal Society of Chemistry 20xx J. Name., 2013, 00, 1-3 | 13
Please do not adjust margins
Please do not adjust margins
component associated with magnetic ordering. It was hinted that the ferromagnetic component could be either associated with spin canting or to magneto structural transition across the TN.126
Hence it was crucial to observe the direction of magnetic moment in BaPrO3. Rigorous neutron diffraction experiments using cold neutrons on BaPrO3, show that the magnetic moment is aligned along the a-axis with a small ferromagnetic component aligned along the z direction (c-axis).127 A significant assumption was made that the magnetic form factor for Pr4+ is the same as Pr3+. It should be noted here that, the low magnetic moment of Pr4+, poses significant challenges in using neutrons to probe the low temperature spin dynamics in these systems.127, 197 In BaPrO3 the ground state J multiplet is split by the Oh crystal field into a Γ7 doublet ground state and a Γ8
quartet excited state (260 meV above the ground state) as seen in Figure 7c. Similar to PrO2, the excited state J multiplet 2F7/2 is separated from the ground state by 370 meV. The CEF for Pr4+ in BaPrO3 was modeled using the same Hamiltonian as Equation 2. With the same ratio of 0.05 for 𝑉:/𝑉#, 𝑉# was calculated to be +119 meV, which is twice as large as the value calculated for PrO2 (𝑉#= -66meV) with opposite sign. Figure 7b shows the CEF diagram for BaPrO3 for different ratios of 𝑉:/𝑉#.198 This figure could potentially be used as a guideline for future CEF predictions in other Pr4+ systems. Several other Pr4+ systems have been examined in some detail. Li2PrO3 undergoes an AFM transition at 6.5 K.95 Again, to be noted is the deviation of the inverse susceptibility vs T curve from the Curie-Weiss law. After TIP subtraction, the magnetic moment was calculated to be 1.75 μB. Specific heat measurements further confirm the long-range ordering at 6.5 K. Long range AFM ordering was observed in Na2PrO3 at 4.6 K.95 Deviation from the Curie-Weiss law is also observed for Na2PrO3. Specific heat further confirms the long-range ordering in Na2PrO3. The magnetic entropy recovered due to the long-range ordering in A2PrO3 (A = Li, Na) and BaPrO3 have been calculated by subtracting the phonon contribution at high temperature using diamagnetic analogs. The entropy recovered for an f1 ion with a doublet ground state should be Rln2. However, in all the three Pr4+ compounds discussed above, there is a universal behavior that the entropy recovered is only 71% of Rln2. This behavior, and the origin of the TIP term remain open questions. Similar to other Pr4+ oxides, in Sr2PrO4 the susceptibility deviates from the Curie-Weiss law. After a TIP subtraction, the effective magnetic moment of Pr4+ in Sr2PrO4 was calculated to be 1.20 μB. Specific heat measurements further confirm the long range ordering.131 However, unlike the other Pr4+ oxides, the Pr4+ ions in Sr2PrO4 recover 94% of Rln2, making it an outlier from the observed general behavior. Neutron diffraction measurements on Sr2PrO4 below TN did not show any magnetic Bragg peaks and was attributed to the low ordered magnetic moment of Pr4+.132 For the lithium rich oxides of the type Li8LnO6 (Ln = Ce, Pr, Tb), no magnetic ordering was observed for Li8PrO6 down to 2 K and the susceptibility also deviates from Curie-Weiss behavior. After a TIP subtraction, the effective magnetic moment was calculated to be 0.503 μB. No specific heat
measurements were reported.133 TIP terms along with Curie-Weiss constants and effective magnetic moments for a number of Pr4+ oxides and fluorides are listed in Table 1. Magnetic measurements have also been carried out for oxides and fluorides containing Tb4+ ions. Na2TbO3, SrTbO3, and BaTbO3 (isostructural to the Pr analogs) exhibit long range AFM ordering at 38.3 K, 32.0 K and 33.4 K respectively.95 Unlike the oxides of Pr4+, the susceptibility follows Curie-Weiss behavior down to TN yielding a magnetic moment of 7.9 μB, 7.83 μB, and 7.88 μB for Na2TbO3, SrTbO3 and BaTbO3, respectively.151, 154, 155 The calculated μeff is slightly lower than the expected value for a 4f7 ion with a 8S7/2 ground state (LS coupling limit). The small difference between the calculated and theoretical values has been attributed to an increased crystal field compared to Tb3+. Specific heat measurements have been carried out to confirm the long-range ordering in Na2TbO3. The entropy recovered saturates at 71% Rln8. This observation is reasonable if the ground state of Tb4+ is an octet.151 Curie-Weiss constants and effective magnetic moments for a number of Tb4+ oxides and fluorides are listed in Table 2.
4. Gas-Phase Chemistry
While this review is focused on the established solid-state and molecular chemistry of the tetravalent lanthanides, the gas-phase redox chemistry also provides important structural and thermodynamic insight into the stability of high-valent lanthanide complexes. In line with the relative instability of PrF4 (in comparison to CeF4 and TbF4) as evidenced by its thermal decomposition at 363 K, its infrared spectrum in matrix-isolation studies was not known until 2015.214 Subsequently, a complete study of the lanthanide fluorides across the series established that, in addition to the previously identified neutral tetravalent lanthanides – CeF4, PrF4, and TbF4, NdF4, and DyF4 could be identified in matrix isolation studies (Ar or Ne matrix , 20-35 K) in the reaction of laser-ablated lanthanide metal and F2 gas.215 It should be noted that neither SmF4 or HoF4 were observed despite the fact that the fourth ionization energies of Sm and Ho are not substantially greater than that of Dy. The accessibility of tetravalent neutral fluorides is thus in accordance with observed tetravalent lanthanides characterized in the solid-state as their [LnF7]3- salts. Additionally, Riedel and co-workers predicted a similar Ho–F bond disassociation energy (BDE) in HoF4 to that found for NdF4 yet found no spectroscopic evidence for its existence under these conditions.
Andrews and Dixon described the observation of tetravalent Ce, Pr, and Tb as their neutral hydroxides in an argon matrix at 4 K from the reaction of hydrogen peroxide and laser ablated lanthanide metal ions.216 The formation of terminal oxide tetravalent lanthanides in matrix isolation studies and mass spectrometry has been observed via the fragmentation of [Ln(NO3)4]1- to [LnO(NO3)3]1- and in the reaction of ablated lanthanide metal with oxygen difluoride to form [LnOF2].217, 218 In these species, the oxide can be either mono- or dianionic. Based on quantum chemical calculations, hydrolysis kinetics, and the fourth ionization potentials of the lanthanides, Gibson and co-workers find that only Ce is truly tetravalent in
Page 13 of 43 Dalton Transactions
ARTICLE Journal Name
14 | J. Name., 2012, 00, 1-3 This journal is © The Royal Society of Chemistry 20xx
Please do not adjust margins
Please do not adjust margins
[LnO(NO3)3]1-, and that Pr, Nd, and Tb have intermediate oxidation states, Ln4+/3+, and that all other lanthanides are trivalent in these anions. Similarly, Andrews and co-workers find that Ce is tetravalent in [CeOF2] and that Pr and Tb are intermediate between Ln3+ and Ln4+. Remarkably, pentavalent Pr has been identified in gas-phase reactions both through matrix isolation and mass spectrometry. This finding has no precedence in either solution, molecular chemistry, or extended solids. While the possibility of Pr pentafluoride has been explored,214 the first evidence of a pentavalent Pr ion was reported in 2016 by Zhou and co-workers in which the [PrO2]+ ion was identified by both mass spectrometry and matrix isolation in conjunction with quantum chemical calculations.219 The [PrO2]+ was generated by the reaction of laser ablated Pr metal with O2 seeded He in a supersonic expansion source. It should be noted that prior work identified [PrO3]1- in laser ablation studies of Pr with O2 in a solid-Ar matrix. Subsequent quantum chemical calculations indicate that the [PrO3]1- is Pr4+ with a ligand radical.220 Dau, Gibson, and co-workers also identified [PrO2]+ in the reaction of NO2 and PrO+ in a quadrupole ion trap (QIT) as part of studies identifying pentavalent Bk and Cf.221 This product was likely also identified previously by Bohme and co-workers in 2009 using a selected ion flow tube. Gibson and co-workers also observed Pr5+ in a gas-phase nitrate complex, [PrO2(NO3)2]1- via low-energy collision induced dissociation (CID) in a QIT, through NO2 elimination from their previously identified monooxo anion, [PrO(NO3)3]1-.218, 222 This methodology has been extended to the identification of Cm5+, Bk5+, and Cf5+ nitrate complexes.223 Recently, through use of matrix-isolation infrared absorption (IR) spectroscopy and quantum chemical calculations both NPrO and [NPrO]1- were identified. 224 Both of these are linear molecules, and the neutral complex is pentavalent. These high-valent lanthanide complexes identified in gas-phase reactions indicate that substantial new chemistry in condensed phases may be accessible through ligand and methodology development. 5. Solution Thermochemistry of Ln4+
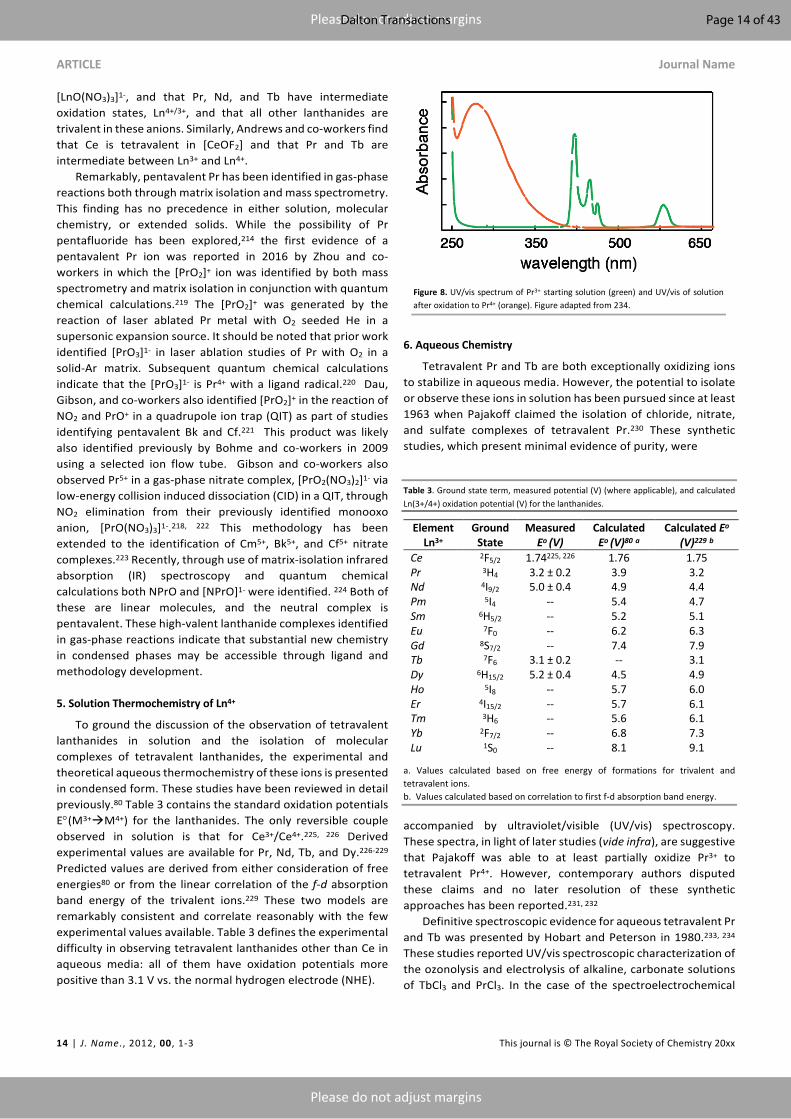
To ground the discussion of the observation of tetravalent lanthanides in solution and the isolation of molecular complexes of tetravalent lanthanides, the experimental and theoretical aqueous thermochemistry of these ions is presented in condensed form. These studies have been reviewed in detail previously.80 Table 3 contains the standard oxidation potentials E°(M3+àM4+) for the lanthanides. The only reversible couple observed in solution is that for Ce3+/Ce4+.225, 226 Derived experimental values are available for Pr, Nd, Tb, and Dy.226-229 Predicted values are derived from either consideration of free energies80 or from the linear correlation of the f-d absorption band energy of the trivalent ions.229 These two models are remarkably consistent and correlate reasonably with the few experimental values available. Table 3 defines the experimental difficulty in observing tetravalent lanthanides other than Ce in aqueous media: all of them have oxidation potentials more positive than 3.1 V vs. the normal hydrogen electrode (NHE).
6. Aqueous Chemistry
Tetravalent Pr and Tb are both exceptionally oxidizing ions to stabilize in aqueous media. However, the potential to isolate or observe these ions in solution has been pursued since at least 1963 when Pajakoff claimed the isolation of chloride, nitrate, and sulfate complexes of tetravalent Pr.230 These synthetic studies, which present minimal evidence of purity, were Table 3. Ground state term, measured potential (V) (where applicable), and calculated Ln(3+/4+) oxidation potential (V) for the lanthanides.
Element Ln3+
Ground State
Measured Eo (V)
Calculated Eo (V)80 a
Calculated Eo
(V)229 b
Ce 2F5/2 1.74225, 226 1.76 1.75 Pr 3H4 3.2 ± 0.2 3.9 3.2 Nd 4I9/2 5.0 ± 0.4 4.9 4.4 Pm 5I4 -- 5.4 4.7 Sm 6H5/2 -- 5.2 5.1 Eu 7F0 -- 6.2 6.3 Gd 8S7/2 -- 7.4 7.9 Tb 7F6 3.1 ± 0.2 -- 3.1 Dy 6H15/2 5.2 ± 0.4 4.5 4.9 Ho 5I8 -- 5.7 6.0 Er 4I15/2 -- 5.7 6.1 Tm 3H6 -- 5.6 6.1 Yb 2F7/2 -- 6.8 7.3 Lu 1S0 -- 8.1 9.1
a. Values calculated based on free energy of formations for trivalent and tetravalent ions. b. Values calculated based on correlation to first f-d absorption band energy.
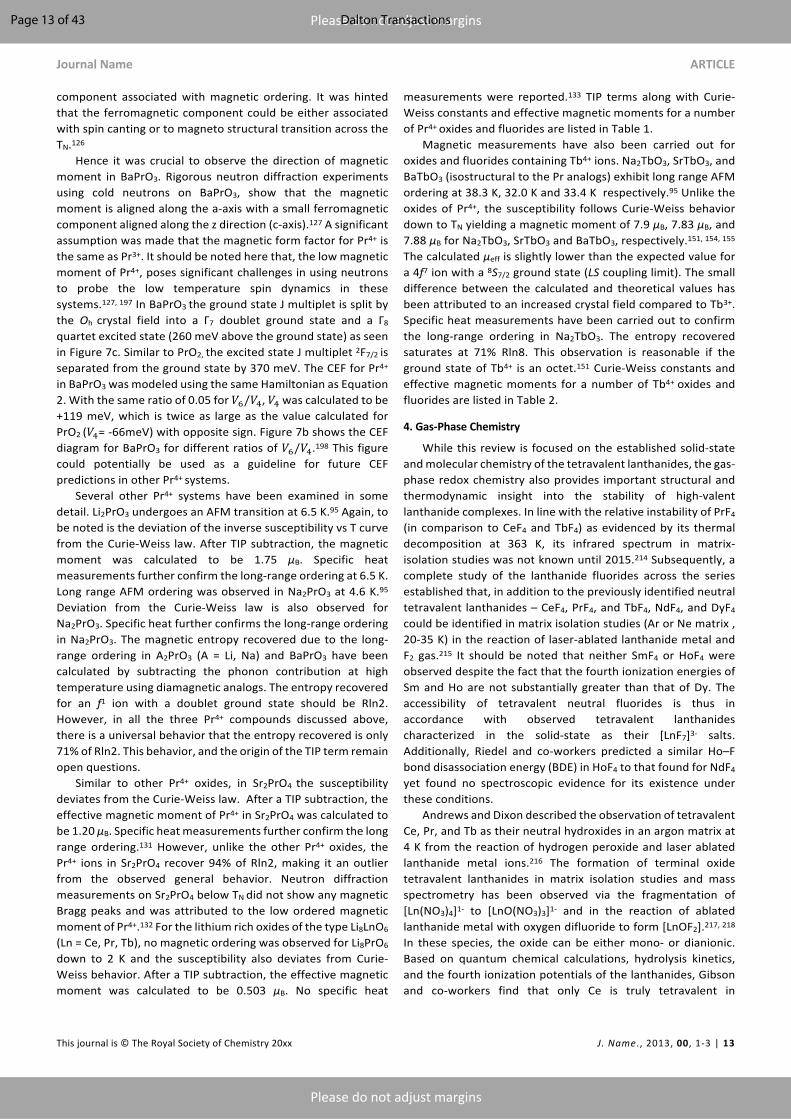
accompanied by ultraviolet/visible (UV/vis) spectroscopy. These spectra, in light of later studies (vide infra), are suggestive that Pajakoff was able to at least partially oxidize Pr3+ to tetravalent Pr4+. However, contemporary authors disputed these claims and no later resolution of these synthetic approaches has been reported.231, 232 Definitive spectroscopic evidence for aqueous tetravalent Pr and Tb was presented by Hobart and Peterson in 1980.233, 234 These studies reported UV/vis spectroscopic characterization of the ozonolysis and electrolysis of alkaline, carbonate solutions of TbCl3 and PrCl3. In the case of the spectroelectrochemical
Figure 8. UV/vis spectrum of Pr3+ starting solution (green) and UV/vis of solution after oxidation to Pr4+ (orange). Figure adapted from 234.
Page 14 of 43Dalton Transactions
Journal Name ARTICLE
This journal is © The Royal Society of Chemistry 20xx J. Name., 2013, 00, 1-3 | 15
Please do not adjust margins
Please do not adjust margins
characterization, a potential of +1.4 V (vs. saturated calomel electrode (SCE)) was applied to 0.1 M solutions of PrCl3 and a potential of +1.3 V (vs. SCE) was applied to 0.1 M solutions of TbCl3 (both experiments were conducted in 1 M KOH and 5.5 M K2CO3). In the case of Pr, the original pale green solution changed to a pale-yellow solution as evidenced by the UV/vis spectrum (Figure 8). For the Tb solution, the initially colorless solution changes to deep reddish-brown. In both cases, the color change is attributed to the onset of a strong ligand to metal charge transfer (LMCT) feature and, as evidence by UV/spectroscopy, the bleaching of f-f features that are diagnostic for the trivalent ions. Similar results were obtained by bubbling ozone through the solutions and Pr4+ and Tb4+. These solutions were found to be stable with carbonate in the range of 2 – 5 M. A subsequent study also documented the hydroxide concentration dependence of Tb4+ and found that under low concentration (0.15 to 0.3 M) Tb4+ precipitates at 1 M K2CO3, while at 1 M K2CO3 it remains in solution and bleaches over an hour.235 At high concentration of KOH (0.5 M) and 5 M K2CO3 the Tb4+ solution is stable for weeks. The methods were extended to the study of tetravalent actinides in aqueous solutions.233, 236
These in-situ oxidation studies with ozone were extended to acetonitrile solutions of M(NO3)3 • 6H2O (M = Ce, Pr, and Tb) in the presence of two equivalents of either triphenylphosphine oxide or triphenylarsine oxide by Payne and Peterson.237 The ozonolysis of these solutions was performed for 1-24 h at 70 °C. In the case of Ce, the reaction produced a purple solution which turned brown on precipitation. For Pr and Tb, these reactions produced yellow solutions and yellow precipitates that were observed to be stable to air and moisture. UV/vis spectroscopy of the Pr reaction revealed bleaching of f-f transitions diagnostic for Pr3+ and the growth of an intense feature at 352 nm assigned as a LMCT. This behavior is analogous to that observed for the carbonate ozonolysis reactions. The chemical oxidation of Tb has been reported in aqueous solutions of tetrametaphosphate, phosphotungstates, pyrophosphates, tellurates, condensed phosphates, and highly concentrated potassium hydroxide.238-243 Li and co-workers presented a detailed concentration and temperature dependence study of the oxidation of Tb in tetrametaphosphate solutions. These oxidations were performed with ozone and demonstrated similar UV/vis spectroscopic features (broad feature at 365 nm) for the tetravalent Tb species in these solutions. This red-brown oxidation product was also quenched immediately upon the addition of hydrogen peroxide. The oxidation rate was found to be dependent on pH, temperature, and concentration of tetrametaphosphate. Qualitatively, these results are similar to the ozonolysis reactions in carbonate solutions.234, 235
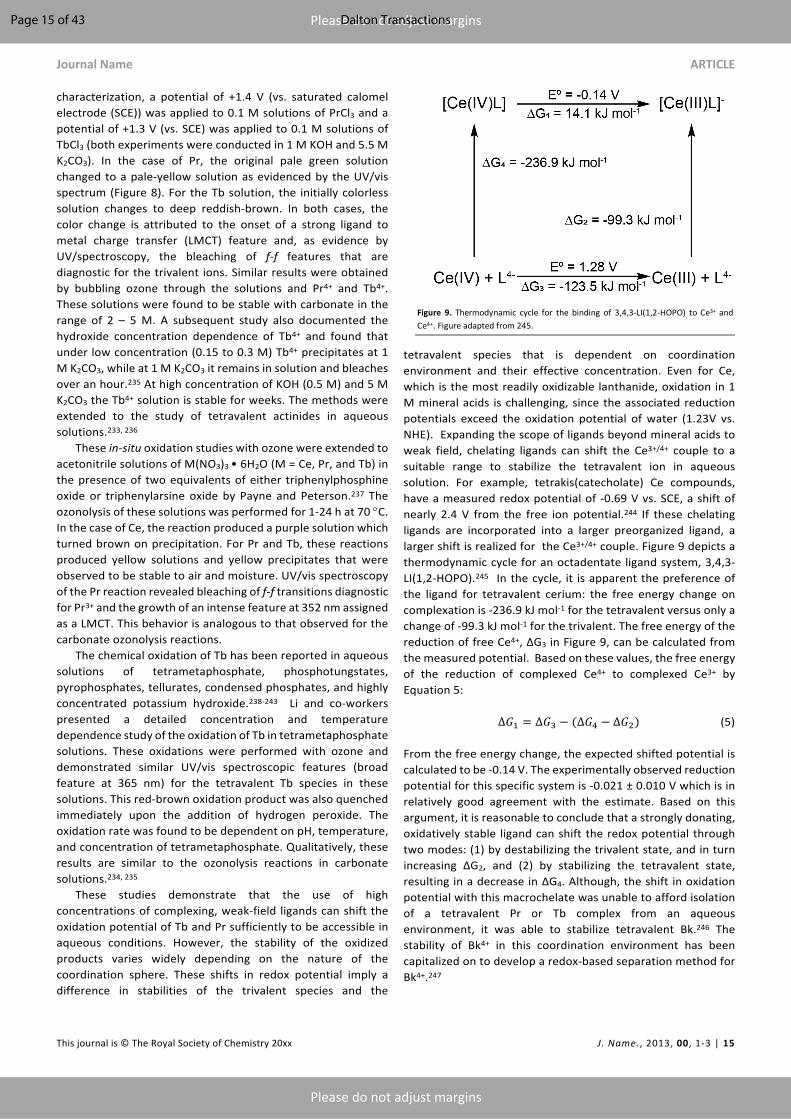
These studies demonstrate that the use of high concentrations of complexing, weak-field ligands can shift the oxidation potential of Tb and Pr sufficiently to be accessible in aqueous conditions. However, the stability of the oxidized products varies widely depending on the nature of the coordination sphere. These shifts in redox potential imply a difference in stabilities of the trivalent species and the
tetravalent species that is dependent on coordination environment and their effective concentration. Even for Ce, which is the most readily oxidizable lanthanide, oxidation in 1 M mineral acids is challenging, since the associated reduction potentials exceed the oxidation potential of water (1.23V vs. NHE). Expanding the scope of ligands beyond mineral acids to weak field, chelating ligands can shift the Ce3+/4+ couple to a suitable range to stabilize the tetravalent ion in aqueous solution. For example, tetrakis(catecholate) Ce compounds, have a measured redox potential of -0.69 V vs. SCE, a shift of nearly 2.4 V from the free ion potential.244 If these chelating ligands are incorporated into a larger preorganized ligand, a larger shift is realized for the Ce3+/4+ couple. Figure 9 depicts a thermodynamic cycle for an octadentate ligand system, 3,4,3-LI(1,2-HOPO).245 In the cycle, it is apparent the preference of the ligand for tetravalent cerium: the free energy change on complexation is -236.9 kJ mol-1 for the tetravalent versus only a change of -99.3 kJ mol-1 for the trivalent. The free energy of the reduction of free Ce4+, ΔG3 in Figure 9, can be calculated from the measured potential. Based on these values, the free energy of the reduction of complexed Ce4+ to complexed Ce3+ by Equation 5:
∆𝐺' = ∆𝐺/ − (∆𝐺# − ∆𝐺0) (5) From the free energy change, the expected shifted potential is calculated to be -0.14 V. The experimentally observed reduction potential for this specific system is -0.021 ± 0.010 V which is in relatively good agreement with the estimate. Based on this argument, it is reasonable to conclude that a strongly donating, oxidatively stable ligand can shift the redox potential through two modes: (1) by destabilizing the trivalent state, and in turn increasing ΔG2, and (2) by stabilizing the tetravalent state, resulting in a decrease in ΔG4. Although, the shift in oxidation potential with this macrochelate was unable to afford isolation of a tetravalent Pr or Tb complex from an aqueous environment, it was able to stabilize tetravalent Bk.246 The stability of Bk4+ in this coordination environment has been capitalized on to develop a redox-based separation method for Bk4+.247
Figure 9. Thermodynamic cycle for the binding of 3,4,3-LI(1,2-HOPO) to Ce3+ and Ce4+. Figure adapted from 245.
Page 15 of 43 Dalton Transactions
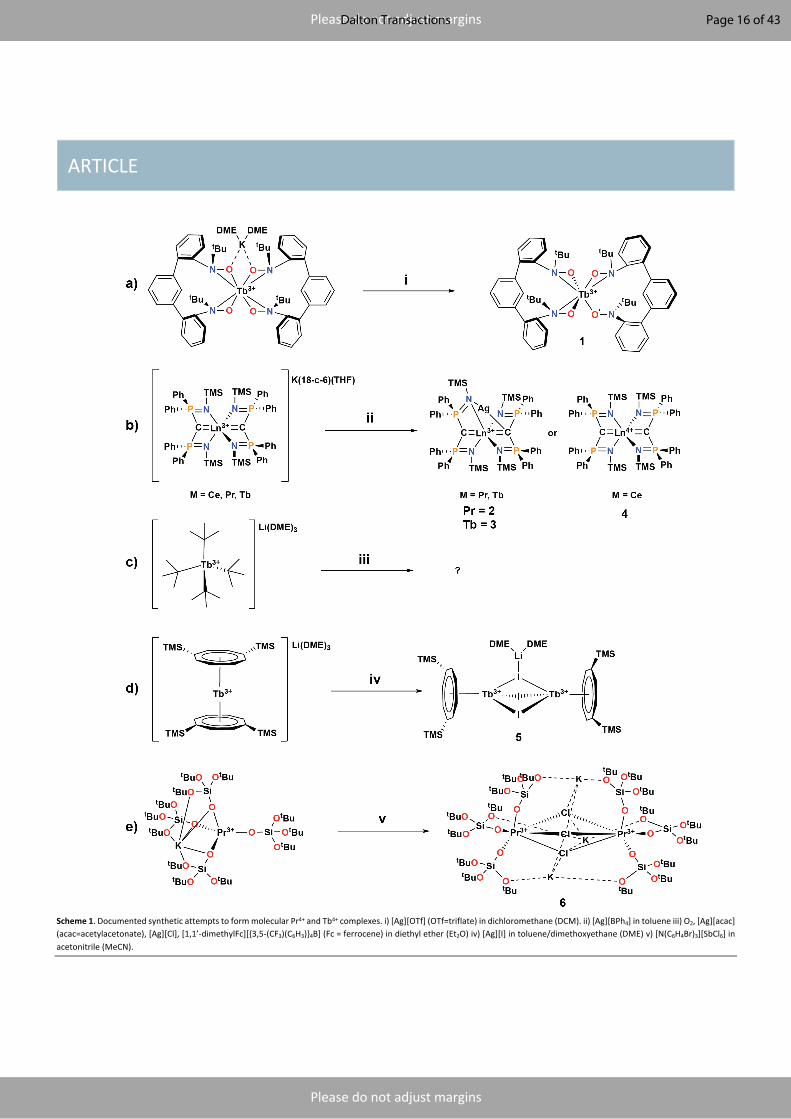
ARTICLE
Please do not adjust margins
Please do not adjust margins
Scheme 1. Documented synthetic attempts to form molecular Pr4+ and Tb4+ complexes. i) [Ag][OTf] (OTf=triflate) in dichloromethane (DCM). ii) [Ag][BPh4] in toluene iii) O2, [Ag][acac] (acac=acetylacetonate), [Ag][Cl], [1,1’-dimethylFc][{3,5-(CF3)(C6H3)}4B] (Fc = ferrocene) in diethyl ether (Et2O) iv) [Ag][I] in toluene/dimethoxyethane (DME) v) [N(C6H4Br)3][SbCl6] in acetonitrile (MeCN).
Page 16 of 43Dalton Transactions
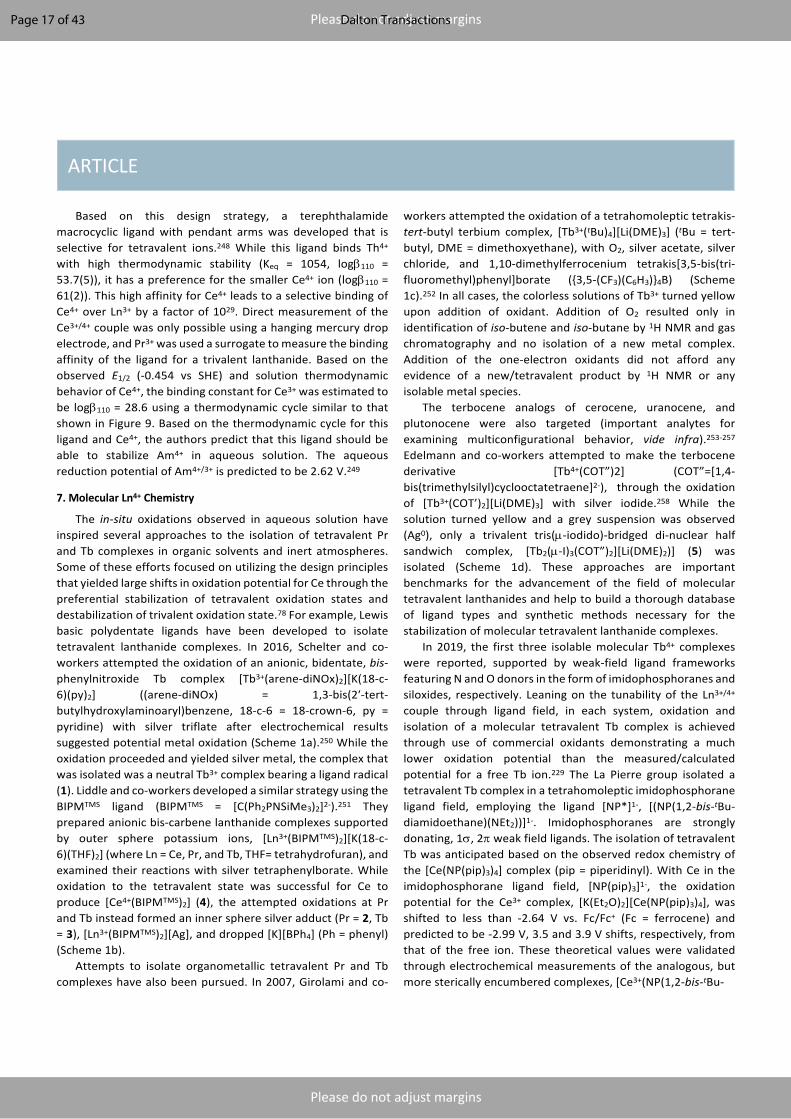
ARTICLE
Please do not adjust margins
Please do not adjust margins
Based on this design strategy, a terephthalamide macrocyclic ligand with pendant arms was developed that is selective for tetravalent ions.248 While this ligand binds Th4+ with high thermodynamic stability (Keq = 1054, logb110 = 53.7(5)), it has a preference for the smaller Ce4+ ion (logb110 = 61(2)). This high affinity for Ce4+ leads to a selective binding of Ce4+ over Ln3+ by a factor of 1029. Direct measurement of the Ce3+/4+ couple was only possible using a hanging mercury drop electrode, and Pr3+ was used a surrogate to measure the binding affinity of the ligand for a trivalent lanthanide. Based on the observed E1/2 (-0.454 vs SHE) and solution thermodynamic behavior of Ce4+, the binding constant for Ce3+ was estimated to be logb110 = 28.6 using a thermodynamic cycle similar to that shown in Figure 9. Based on the thermodynamic cycle for this ligand and Ce4+, the authors predict that this ligand should be able to stabilize Am4+ in aqueous solution. The aqueous reduction potential of Am4+/3+ is predicted to be 2.62 V.249
7. Molecular Ln4+ Chemistry
The in-situ oxidations observed in aqueous solution have inspired several approaches to the isolation of tetravalent Pr and Tb complexes in organic solvents and inert atmospheres. Some of these efforts focused on utilizing the design principles that yielded large shifts in oxidation potential for Ce through the preferential stabilization of tetravalent oxidation states and destabilization of trivalent oxidation state.78 For example, Lewis basic polydentate ligands have been developed to isolate tetravalent lanthanide complexes. In 2016, Schelter and co-workers attempted the oxidation of an anionic, bidentate, bis-phenylnitroxide Tb complex [Tb3+(arene-diNOx)2][K(18-c-6)(py)2] ((arene-diNOx) = 1,3-bis(2ʹ-tert-butylhydroxylaminoaryl)benzene, 18-c-6 = 18-crown-6, py = pyridine) with silver triflate after electrochemical results suggested potential metal oxidation (Scheme 1a).250 While the oxidation proceeded and yielded silver metal, the complex that was isolated was a neutral Tb3+ complex bearing a ligand radical (1). Liddle and co-workers developed a similar strategy using the BIPMTMS ligand (BIPMTMS = [C(Ph2PNSiMe3)2]2-).251 They prepared anionic bis-carbene lanthanide complexes supported by outer sphere potassium ions, [Ln3+(BIPMTMS)2][K(18-c-6)(THF)2] (where Ln = Ce, Pr, and Tb, THF= tetrahydrofuran), and examined their reactions with silver tetraphenylborate. While oxidation to the tetravalent state was successful for Ce to produce [Ce4+(BIPMTMS)2] (4), the attempted oxidations at Pr and Tb instead formed an inner sphere silver adduct (Pr = 2, Tb = 3), [Ln3+(BIPMTMS)2][Ag], and dropped [K][BPh4] (Ph = phenyl) (Scheme 1b).
Attempts to isolate organometallic tetravalent Pr and Tb complexes have also been pursued. In 2007, Girolami and co-
workers attempted the oxidation of a tetrahomoleptic tetrakis-tert-butyl terbium complex, [Tb3+(tBu)4][Li(DME)3] (tBu = tert-butyl, DME = dimethoxyethane), with O2, silver acetate, silver chloride, and 1,10-dimethylferrocenium tetrakis[3,5-bis(tri-fluoromethyl)phenyl]borate ({3,5-(CF3)(C6H3)}4B) (Scheme 1c).252 In all cases, the colorless solutions of Tb3+ turned yellow upon addition of oxidant. Addition of O2 resulted only in identification of iso-butene and iso-butane by 1H NMR and gas chromatography and no isolation of a new metal complex. Addition of the one-electron oxidants did not afford any evidence of a new/tetravalent product by 1H NMR or any isolable metal species.
The terbocene analogs of cerocene, uranocene, and plutonocene were also targeted (important analytes for examining multiconfigurational behavior, vide infra).253-257 Edelmann and co-workers attempted to make the terbocene derivative [Tb4+(COT”)2] (COT”=[1,4-bis(trimethylsilyl)cyclooctatetraene]2-), through the oxidation of [Tb3+(COT’)2][Li(DME)3] with silver iodide.258 While the solution turned yellow and a grey suspension was observed (Ag0), only a trivalent tris(µ-iodido)-bridged di-nuclear half sandwich complex, [Tb2(µ-I)3(COT”)2][Li(DME)2)] (5) was isolated (Scheme 1d). These approaches are important benchmarks for the advancement of the field of molecular tetravalent lanthanides and help to build a thorough database of ligand types and synthetic methods necessary for the stabilization of molecular tetravalent lanthanide complexes.
In 2019, the first three isolable molecular Tb4+ complexes were reported, supported by weak-field ligand frameworks featuring N and O donors in the form of imidophosphoranes and siloxides, respectively. Leaning on the tunability of the Ln3+/4+ couple through ligand field, in each system, oxidation and isolation of a molecular tetravalent Tb complex is achieved through use of commercial oxidants demonstrating a much lower oxidation potential than the measured/calculated potential for a free Tb ion.229 The La Pierre group isolated a tetravalent Tb complex in a tetrahomoleptic imidophosphorane ligand field, employing the ligand [NP*]1-, [(NP(1,2-bis-tBu-diamidoethane)(NEt2))]1-. Imidophosphoranes are strongly donating, 1s, 2p weak field ligands. The isolation of tetravalent Tb was anticipated based on the observed redox chemistry of the [Ce(NP(pip)3)4] complex (pip = piperidinyl). With Ce in the imidophosphorane ligand field, [NP(pip)3]1-, the oxidation potential for the Ce3+ complex, [K(Et2O)2][Ce(NP(pip)3)4], was shifted to less than -2.64 V vs. Fc/Fc+ (Fc = ferrocene) and predicted to be -2.99 V, 3.5 and 3.9 V shifts, respectively, from that of the free ion. These theoretical values were validated through electrochemical measurements of the analogous, but more sterically encumbered complexes, [Ce3+(NP(1,2-bis-tBu-
Page 17 of 43 Dalton Transactions
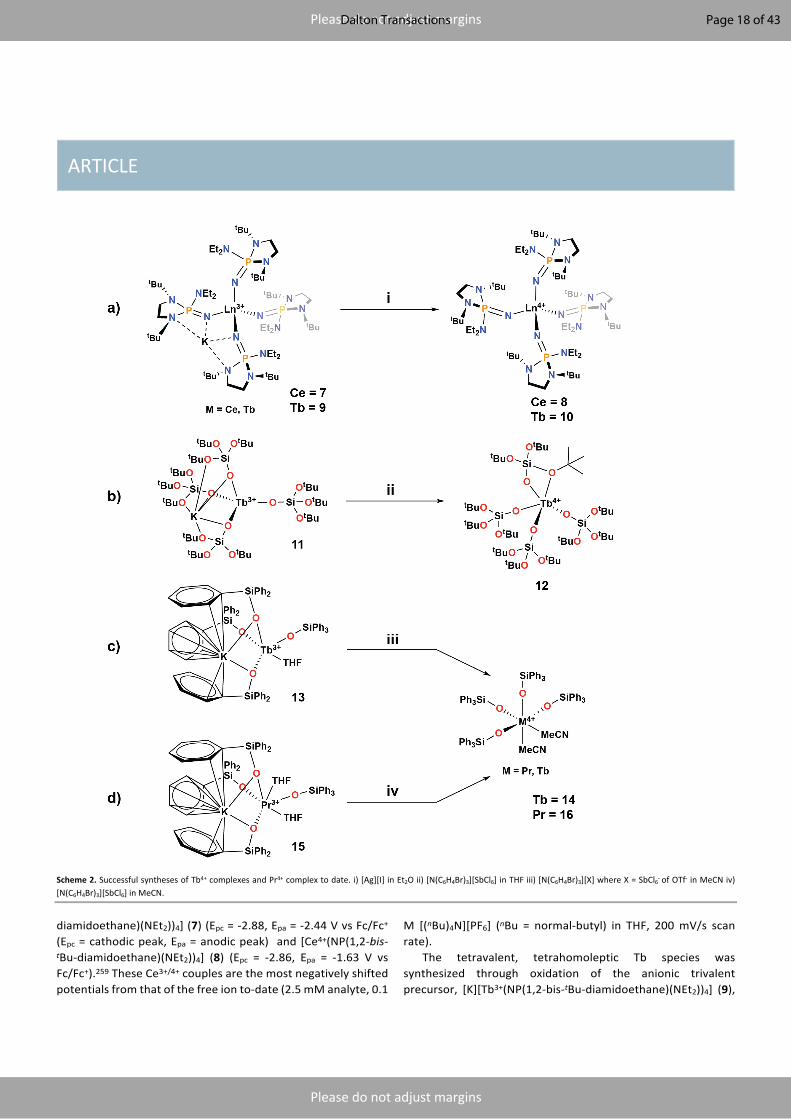
ARTICLE
Please do not adjust margins
Please do not adjust margins
Scheme 2. Successful syntheses of Tb4+ complexes and Pr4+ complex to date. i) [Ag][I] in Et2O ii) [N(C6H4Br)3][SbCl6] in THF iii) [N(C6H4Br)3][X] where X = SbCl6- of OTf- in MeCN iv) [N(C6H4Br)3][SbCl6] in MeCN.
diamidoethane)(NEt2))4] (7) (Epc = -2.88, Epa = -2.44 V vs Fc/Fc+
(Epc = cathodic peak, Epa = anodic peak) and [Ce4+(NP(1,2-bis-tBu-diamidoethane)(NEt2))4] (8) (Epc = -2.86, Epa = -1.63 V vs Fc/Fc+).259 These Ce3+/4+ couples are the most negatively shifted potentials from that of the free ion to-date (2.5 mM analyte, 0.1
M [(nBu)4N][PF6] (nBu = normal-butyl) in THF, 200 mV/s scan rate).
The tetravalent, tetrahomoleptic Tb species was synthesized through oxidation of the anionic trivalent precursor, [K][Tb3+(NP(1,2-bis-tBu-diamidoethane)(NEt2))4] (9),
Page 18 of 43Dalton Transactions
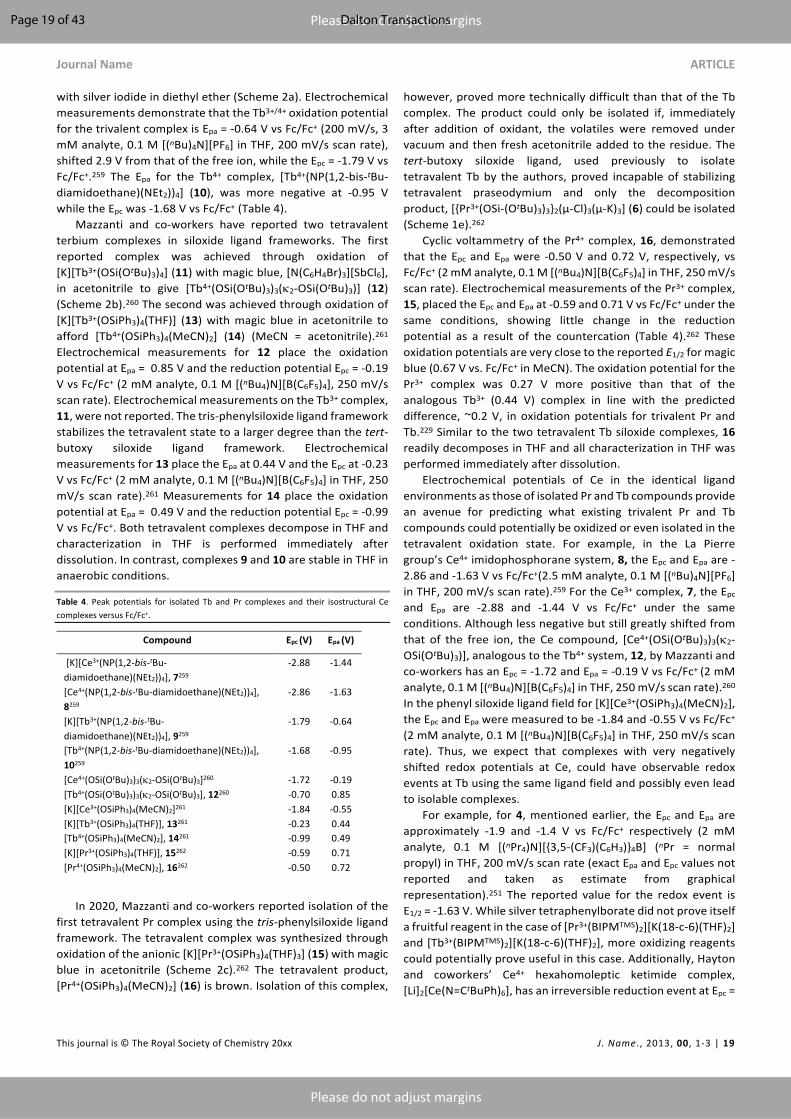
Journal Name ARTICLE
This journal is © The Royal Society of Chemistry 20xx J. Name., 2013, 00, 1-3 | 19
Please do not adjust margins
Please do not adjust margins
with silver iodide in diethyl ether (Scheme 2a). Electrochemical measurements demonstrate that the Tb3+/4+ oxidation potential for the trivalent complex is Epa = -0.64 V vs Fc/Fc+ (200 mV/s, 3 mM analyte, 0.1 M [(nBu)4N][PF6] in THF, 200 mV/s scan rate), shifted 2.9 V from that of the free ion, while the Epc = -1.79 V vs Fc/Fc+.259 The Epa for the Tb4+ complex, [Tb4+(NP(1,2-bis-tBu-diamidoethane)(NEt2))4] (10), was more negative at -0.95 V while the Epc was -1.68 V vs Fc/Fc+ (Table 4).
Mazzanti and co-workers have reported two tetravalent terbium complexes in siloxide ligand frameworks. The first reported complex was achieved through oxidation of [K][Tb3+(OSi(OtBu)3)4] (11) with magic blue, [N(C6H4Br)3][SbCl6], in acetonitrile to give [Tb4+(OSi(OtBu)3)3(k2-OSi(OtBu)3)] (12) (Scheme 2b).260 The second was achieved through oxidation of [K][Tb3+(OSiPh3)4(THF)] (13) with magic blue in acetonitrile to afford [Tb4+(OSiPh3)4(MeCN)2] (14) (MeCN = acetonitrile).261 Electrochemical measurements for 12 place the oxidation potential at Epa = 0.85 V and the reduction potential Epc = -0.19 V vs Fc/Fc+ (2 mM analyte, 0.1 M [(nBu4)N][B(C6F5)4], 250 mV/s scan rate). Electrochemical measurements on the Tb3+ complex, 11, were not reported. The tris-phenylsiloxide ligand framework stabilizes the tetravalent state to a larger degree than the tert-butoxy siloxide ligand framework. Electrochemical measurements for 13 place the Epa at 0.44 V and the Epc at -0.23 V vs Fc/Fc+ (2 mM analyte, 0.1 M [(nBu4)N][B(C6F5)4] in THF, 250 mV/s scan rate).261 Measurements for 14 place the oxidation potential at Epa = 0.49 V and the reduction potential Epc = -0.99 V vs Fc/Fc+. Both tetravalent complexes decompose in THF and characterization in THF is performed immediately after dissolution. In contrast, complexes 9 and 10 are stable in THF in anaerobic conditions.
Table 4. Peak potentials for isolated Tb and Pr complexes and their isostructural Ce complexes versus Fc/Fc+.
Compound Epc (V) Epa (V)
[K][Ce3+(NP(1,2-bis-tBu-diamidoethane)(NEt2))4], 7259
-2.88 -1.44
[Ce4+(NP(1,2-bis-tBu-diamidoethane)(NEt2))4], 8259
-2.86 -1.63
[K][Tb3+(NP(1,2-bis-tBu-diamidoethane)(NEt2))4], 9259
-1.79 -0.64
[Tb4+(NP(1,2-bis-tBu-diamidoethane)(NEt2))4], 10259
-1.68 -0.95
[Ce4+(OSi(OtBu)3)3(k2-OSi(OtBu)3]260 -1.72 -0.19 [Tb4+(OSi(OtBu)3)3(k2-OSi(OtBu)3], 12260 -0.70 0.85 [K][Ce3+(OSiPh3)4(MeCN)2]261 -1.84 -0.55 [K][Tb3+(OSiPh3)4(THF)], 13261 -0.23 0.44 [Tb4+(OSiPh3)4(MeCN)2], 14261 -0.99 0.49 [K][Pr3+(OSiPh3)4(THF)], 15262 -0.59 0.71 [Pr4+(OSiPh3)4(MeCN)2], 16262 -0.50 0.72
In 2020, Mazzanti and co-workers reported isolation of the first tetravalent Pr complex using the tris-phenylsiloxide ligand framework. The tetravalent complex was synthesized through oxidation of the anionic [K][Pr3+(OSiPh3)4(THF)3] (15) with magic blue in acetonitrile (Scheme 2c).262 The tetravalent product, [Pr4+(OSiPh3)4(MeCN)2] (16) is brown. Isolation of this complex,
however, proved more technically difficult than that of the Tb complex. The product could only be isolated if, immediately after addition of oxidant, the volatiles were removed under vacuum and then fresh acetonitrile added to the residue. The tert-butoxy siloxide ligand, used previously to isolate tetravalent Tb by the authors, proved incapable of stabilizing tetravalent praseodymium and only the decomposition product, [{Pr3+(OSi-(OtBu)3)3}2(μ-Cl)3(μ-K)3] (6) could be isolated (Scheme 1e).262 Cyclic voltammetry of the Pr4+ complex, 16, demonstrated that the Epc and Epa were -0.50 V and 0.72 V, respectively, vs Fc/Fc+ (2 mM analyte, 0.1 M [(nBu4)N][B(C6F5)4] in THF, 250 mV/s scan rate). Electrochemical measurements of the Pr3+ complex, 15, placed the Epc and Epa at -0.59 and 0.71 V vs Fc/Fc+ under the same conditions, showing little change in the reduction potential as a result of the countercation (Table 4).262 These oxidation potentials are very close to the reported E1/2 for magic blue (0.67 V vs. Fc/Fc+ in MeCN). The oxidation potential for the Pr3+ complex was 0.27 V more positive than that of the analogous Tb3+ (0.44 V) complex in line with the predicted difference, ~0.2 V, in oxidation potentials for trivalent Pr and Tb.229 Similar to the two tetravalent Tb siloxide complexes, 16 readily decomposes in THF and all characterization in THF was performed immediately after dissolution.
Electrochemical potentials of Ce in the identical ligand environments as those of isolated Pr and Tb compounds provide an avenue for predicting what existing trivalent Pr and Tb compounds could potentially be oxidized or even isolated in the tetravalent oxidation state. For example, in the La Pierre group’s Ce4+ imidophosphorane system, 8, the Epc and Epa are -2.86 and -1.63 V vs Fc/Fc+(2.5 mM analyte, 0.1 M [(nBu)4N][PF6] in THF, 200 mV/s scan rate).259 For the Ce3+ complex, 7, the Epc and Epa are -2.88 and -1.44 V vs Fc/Fc+ under the same conditions. Although less negative but still greatly shifted from that of the free ion, the Ce compound, [Ce4+(OSi(OtBu)3)3(k2-OSi(OtBu)3)], analogous to the Tb4+ system, 12, by Mazzanti and co-workers has an Epc = -1.72 and Epa = -0.19 V vs Fc/Fc+ (2 mM analyte, 0.1 M [(nBu4)N][B(C6F5)4] in THF, 250 mV/s scan rate).260 In the phenyl siloxide ligand field for [K][Ce3+(OSiPh3)4(MeCN)2], the Epc and Epa were measured to be -1.84 and -0.55 V vs Fc/Fc+ (2 mM analyte, 0.1 M [(nBu4)N][B(C6F5)4] in THF, 250 mV/s scan rate). Thus, we expect that complexes with very negatively shifted redox potentials at Ce, could have observable redox events at Tb using the same ligand field and possibly even lead to isolable complexes.
For example, for 4, mentioned earlier, the Epc and Epa are approximately -1.9 and -1.4 V vs Fc/Fc+ respectively (2 mM analyte, 0.1 M [(nPr4)N][{3,5-(CF3)(C6H3)}4B] (nPr = normal propyl) in THF, 200 mV/s scan rate (exact Epa and Epc values not reported and taken as estimate from graphical representation).251 The reported value for the redox event is E1/2 = -1.63 V. While silver tetraphenylborate did not prove itself a fruitful reagent in the case of [Pr3+(BIPMTMS)2][K(18-c-6)(THF)2] and [Tb3+(BIPMTMS)2][K(18-c-6)(THF)2], more oxidizing reagents could potentially prove useful in this case. Additionally, Hayton and coworkers’ Ce4+ hexahomoleptic ketimide complex, [Li]2[Ce(N=CtBuPh)6], has an irreversible reduction event at Epc =
Page 19 of 43 Dalton Transactions

ARTICLE Journal Name
20 | J. Name., 2012, 00, 1-3 This journal is © The Royal Society of Chemistry 20xx
Please do not adjust margins
Please do not adjust margins
-2.16 V vs. Fc/Fc+ (2 mM analyte, 0.1 M [(nBu4)N][BPh4] in THF, 200 mV/s scan rate).263 Diaconescu and co-workers’ have two similar Ce4+ complexes, employing Schiff base ligands with a ferrocene backbone, which have exceptionally negative redox potentials.264 The complex [Ce4+(L’)(OtBu)2] (L’ = 1,10-Di(2,4-bis-tert-butyl-salicylimino)ferrocene)has an Epc = -2.07 and Epa = -1.01 V vs Fc/Fc+ (1.5 mM analyte, 0.5 M [(nPr4)N][{3,5-(CF3)(C6H3)}4B] in THF, 100 mV/s scan rate). At more negative potentials, the complex [Ce4+(L”)(OtBu)2] (L” = 1,10-di(2-tert-butyl-6- diphenylphosphiniminophenol)ferrocene) has an Epc = -2.39 and Epa = -1.70 V vs Fc/Fc+. And lastly, Schelter and co-workers’ nitronyl nitroxide Ce4+ complex, [Ce(2-(tBuNO)py)4] (tBuNO)py = N-tert-butyl-N-2-pyridylnitroxide) has very negative peak potentials of Epc = -2.09 and Epa = -1.80 for a reported E1/2= -1.95 V vs Fc/Fc+ (0.1 M [(nPr4)N][{3,5-(CF3)(C6H3)}4B] in DCM (DCM = dichloromethane)).265 We suggest that Tb complexes of these ligands may, at the very least, present observable redox features by cyclic voltammetry. This prediction, however, will not necessarily hold true for every Ce/Tb isostructural pair even with sufficiently negative redox potentials at Ce. For example, despite the negatively shifted potentials for the Ce complex, [Ce4+(arene-diNOx)2], oxidation of [Tb3+(arene-diNOx)2][K(18-c-6)(py)2] with a relatively mild oxidant of [Ag][OTf] resulted in ligand oxidation and rearrangement to form 1.250 This observation indicates an important point: oxidation potential of the isostructural Ce complex is not the sole criterion for the observation of an oxidation of trivalent Pr and Tb complexes. Features of ligand architecture are also likely important including the architecture to minimize rearrangement during oxidation, the relative donor properties, and the absence of ligand redox events.
We expect that the above tetravalent Ce compounds, and likely more than those explicitly mentioned here, with oxidation potentials more negative than -0.2 V vs Fc/Fc+ as observed by CV, may have analogous Tb complexes that have observable redox events within the organic solvent window by CV.266-268 The accessibility of a Tb oxidation event is, in turn, defined by the oxidation potential of the chemical oxidant and the reagent’s compatibility with the solvent. To-date, magic blue is the strongest oxidant employed. Conceivably, the suggested Epa cut-off value could be pushed to 0 V vs Fc/Fc+ but would require stronger oxidants such as [NO][BF4], which is known to react with ethereal solvents.269
This guideline is based on the observed difference between the oxidation potentials for the two Ce and Tb pairs for the imidophosphorane and tert-butoxy siloxide ligand fields. Specifically, the difference in Epa for the imidophosphorane Ce and Tb complexes was 0.68 V vs Fc/Fc+ while for the tert-butoxy siloxide, it was 1.0 V. Thus, estimating the oxidation potential of Tb to be 1.0 V from that of the analogous Ce4+ complex is a reasonable estimate for the Tb4+ oxidation potential. With more Tb4+ complexes likely on the verge of discovery, this range can be further refined. Although most of the complexes discussed here are neutral Ce4+ complexes, we would argue that for anionic trivalent Ce complexes, analysis by cyclic voltammetry is likely more insightful as those potentials would take into account cation effects which can have a large impact on the
driving force for oxidation.259, 270, 271 While the shift in oxidation potential at Tb is important to ensure it is accessible with chemically compatible oxidants, merely shifting the oxidation potential within a reasonable window does not guarantee an isolable or bench stable complex.
The physical characterization of these novel molecular complexes of Pr4+ and Tb4+ included SC-XRD, magnetometry, and UV/vis/NIR, EPR, and L3-edge spectroscopies. The structural comparison of the tetravalent complexes is described here and the other characterization modalities are broken out in subsequent sections to facilitate comparison to solid-state data. Changes in M–L bond length upon changes in metal oxidation state are generally well correlated with the size difference of the ionic radius of the metal in each oxidation state. In the lanthanides, changes in ionic radii can be quite large in comparison to the transition metals. Thus, changes in Ln–L bond lengths are direct indicators of redox events at a lanthanide ion. The ionic radius for Ce4+ is 0.87 Å, 0.14 Å smaller than Ce3+, the ionic radius for Pr4+ is 0.85 Å, 0.14 Å smaller than Pr3+, and the ionic radius for Tb4+ is 0.76 Å, 0.16 Å smaller than Tb3+.272 Thus a 0.14 – 0.16 Å contraction is expected on oxidation. It should be noted that Ce4+ and Pr4+ are significantly larger than Tb4+ by 0.09 – 0.11 Å, thus the structural chemistry of tetravalent Ce is not necessarily a direct model of Tb4+ structural phenomena.
The Tb3+ complex, 9, is pseudotetrahedral with an inner sphere potassium atom which is 4-coordinate and bound by two of the imidophosphorane ligands.273 The largest structural rearrangement upon oxidation is in the contraction of the Tb–N bond distances by 0.13 Å and 0.16 Å for the potassium bound and terminal ligands, respectively, consistent with a change in metal oxidation state from Tb3+ to Tb4+. The tetravalent complex, 10, is also four-coordinate with S4 symmetry. This change in Ln–N bond length is echoed in the isostructural Ce complexes. Upon oxidation, the Ce–N bond lengths contract by 0.14 Å and 0.08 Å for the potassium bound and terminal ligands respectively, consistent with the change in ionic radius from Ce3+ to Ce4+.259
Since the 8 and 10 are homoleptic and isotypic, a Voronoi-Dirichlet Polyhedra (VDP) analysis was pursued to quantify the changes in the coordination sphere introduced by the 0.11 Å difference in metal ion size between Ce and Tb.259, 274, 275 This analysis revealed that the secondary coordination sphere – the alkyl hydrogens – is much less accessible to the metal in the Tb complex than in the Ce complex. This finding emphasizes that ligand interactions with the metal and in the second coordination sphere are important considerations for the isolation of molecular Ln4+ complexes.
The analysis of Tb4+ siloxide complexes is a bit more complex, since the coordination numbers change in the redox process and complexes are heteroleptic. Nonetheless, similar trends are seen in the Tb–O bond length contractions that were seen with the imidophosphorane complex. In the trivalent terbium complexes with siloxide ligand fields, the coordination number is four in the trivalent oxidation state for 11260 and five for 13261 (four ligands and one solvent molecule). Upon oxidation, 11 undergoes a structural rearrangement and one of the tert-butoxy arms of the tert-butoxy siloxide coordinates to
Page 20 of 43Dalton Transactions
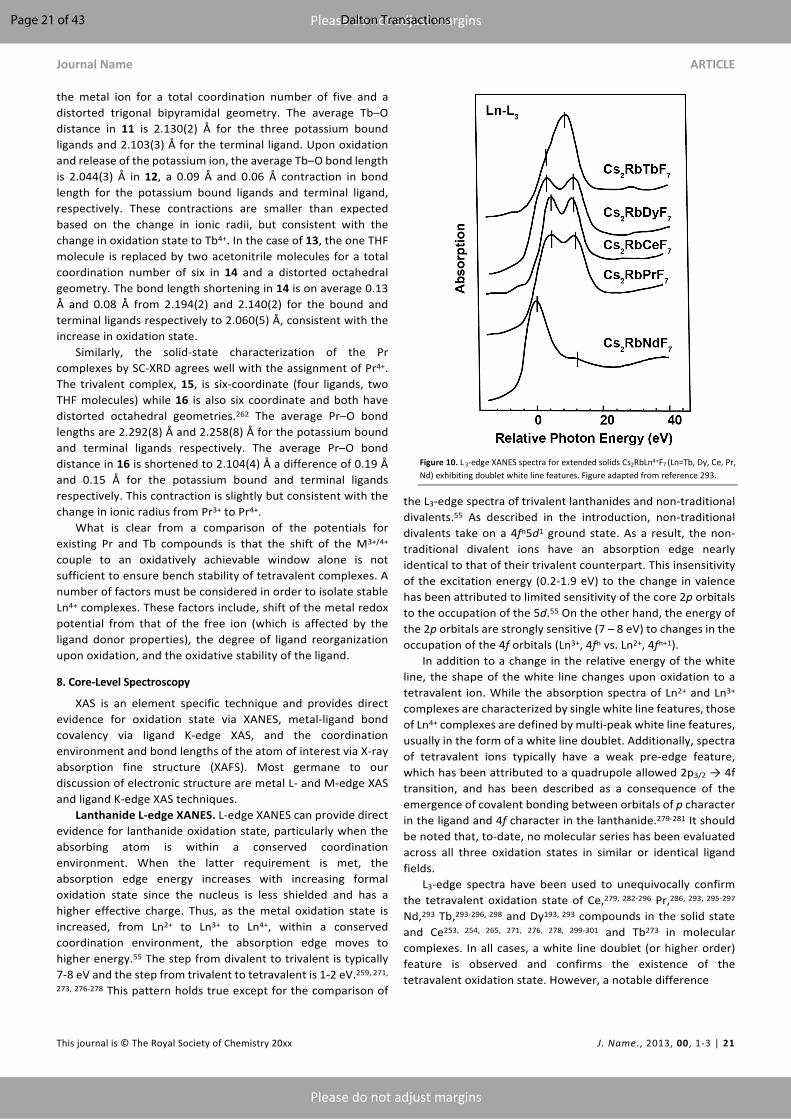
Journal Name ARTICLE
This journal is © The Royal Society of Chemistry 20xx J. Name., 2013, 00, 1-3 | 21
Please do not adjust margins
Please do not adjust margins
the metal ion for a total coordination number of five and a distorted trigonal bipyramidal geometry. The average Tb–O distance in 11 is 2.130(2) Å for the three potassium bound ligands and 2.103(3) Å for the terminal ligand. Upon oxidation and release of the potassium ion, the average Tb–O bond length is 2.044(3) Å in 12, a 0.09 Å and 0.06 Å contraction in bond length for the potassium bound ligands and terminal ligand, respectively. These contractions are smaller than expected based on the change in ionic radii, but consistent with the change in oxidation state to Tb4+. In the case of 13, the one THF molecule is replaced by two acetonitrile molecules for a total coordination number of six in 14 and a distorted octahedral geometry. The bond length shortening in 14 is on average 0.13 Å and 0.08 Å from 2.194(2) and 2.140(2) for the bound and terminal ligands respectively to 2.060(5) Å, consistent with the increase in oxidation state.
Similarly, the solid-state characterization of the Pr complexes by SC-XRD agrees well with the assignment of Pr4+. The trivalent complex, 15, is six-coordinate (four ligands, two THF molecules) while 16 is also six coordinate and both have distorted octahedral geometries.262 The average Pr–O bond lengths are 2.292(8) Å and 2.258(8) Å for the potassium bound and terminal ligands respectively. The average Pr–O bond distance in 16 is shortened to 2.104(4) Å a difference of 0.19 Å and 0.15 Å for the potassium bound and terminal ligands respectively. This contraction is slightly but consistent with the change in ionic radius from Pr3+ to Pr4+.
What is clear from a comparison of the potentials for existing Pr and Tb compounds is that the shift of the M3+/4+ couple to an oxidatively achievable window alone is not sufficient to ensure bench stability of tetravalent complexes. A number of factors must be considered in order to isolate stable Ln4+ complexes. These factors include, shift of the metal redox potential from that of the free ion (which is affected by the ligand donor properties), the degree of ligand reorganization upon oxidation, and the oxidative stability of the ligand.
8. Core-Level Spectroscopy
XAS is an element specific technique and provides direct evidence for oxidation state via XANES, metal-ligand bond covalency via ligand K-edge XAS, and the coordination environment and bond lengths of the atom of interest via X-ray absorption fine structure (XAFS). Most germane to our discussion of electronic structure are metal L- and M-edge XAS and ligand K-edge XAS techniques.
Lanthanide L-edge XANES. L-edge XANES can provide direct evidence for lanthanide oxidation state, particularly when the absorbing atom is within a conserved coordination environment. When the latter requirement is met, the absorption edge energy increases with increasing formal oxidation state since the nucleus is less shielded and has a higher effective charge. Thus, as the metal oxidation state is increased, from Ln2+ to Ln3+ to Ln4+, within a conserved coordination environment, the absorption edge moves to higher energy.55 The step from divalent to trivalent is typically 7-8 eV and the step from trivalent to tetravalent is 1-2 eV.259, 271,
273, 276-278 This pattern holds true except for the comparison of
the L3-edge spectra of trivalent lanthanides and non-traditional divalents.55 As described in the introduction, non-traditional divalents take on a 4fn5d1 ground state. As a result, the non-traditional divalent ions have an absorption edge nearly identical to that of their trivalent counterpart. This insensitivity of the excitation energy (0.2-1.9 eV) to the change in valence has been attributed to limited sensitivity of the core 2p orbitals to the occupation of the 5d.55 On the other hand, the energy of the 2p orbitals are strongly sensitive (7 – 8 eV) to changes in the occupation of the 4f orbitals (Ln3+, 4fn vs. Ln2+, 4fn+1).
In addition to a change in the relative energy of the white line, the shape of the white line changes upon oxidation to a tetravalent ion. While the absorption spectra of Ln2+ and Ln3+ complexes are characterized by single white line features, those of Ln4+ complexes are defined by multi-peak white line features, usually in the form of a white line doublet. Additionally, spectra of tetravalent ions typically have a weak pre-edge feature, which has been attributed to a quadrupole allowed 2p3/2 → 4f transition, and has been described as a consequence of the emergence of covalent bonding between orbitals of p character in the ligand and 4f character in the lanthanide.279-281 It should be noted that, to-date, no molecular series has been evaluated across all three oxidation states in similar or identical ligand fields.
L3-edge spectra have been used to unequivocally confirm the tetravalent oxidation state of Ce,279, 282-296 Pr,286, 293, 295-297 Nd,293 Tb,293-296, 298 and Dy193, 293 compounds in the solid state and Ce253, 254, 265, 271, 276, 278, 299-301 and Tb273 in molecular complexes. In all cases, a white line doublet (or higher order) feature is observed and confirms the existence of the tetravalent oxidation state. However, a notable difference
Figure 10. L 3-edge XANES spectra for extended solids Cs2RbLn4+F7 (Ln=Tb, Dy, Ce, Pr, Nd) exhibiting doublet white line features. Figure adapted from reference 293.
Page 21 of 43 Dalton Transactions

ARTICLE
Please do not adjust margins
Please do not adjust margins
Table 5. nf values and fitting peak energies for the L3-edge XANES spectra of selected Ce, Pr, and Tb compounds.
Ln4+ Compound nf 4fn+1 (eV) 4fn (eV)
[Ce4+(NP(pip)3)4]271 0.38(2) 5728.91(8), 5725.67(3) 5735.96(3) [Ce4+(NP(1,2-bis-tBu-diamidoethane)(NEt2))4]259 0.40(4) 5730.44(9), 5726.45(8) 5736.57(6) [Ce(trop)4]299 0.50(3) 5728.2(3) 5736.0(3) [CeCl6]2- 276 0.51(5) 5720-5734 (3 peaks, n.d.) 5734-5742 (2 peaks, n.d.) [Ce(acac)4]299 0.51(3) 5727.9(3) 5735.9(3) CeO2296 0.56(4) 5728.0(1) 5736.2(2) [Ce(tmtaa)2]299 0.59(3) 5726.8(3) 5735.6(3) [Ce(C8H8)]254 0.82(3) 5725.0(3) 5736.5(3) [Tb4+(NP(1,2-bis-tBu-diamidoethane)(NEt2))4]273 0.39(4) 7520.30(3) 7528.50(3) TbO2296 0.42(4) 7518.9(1) 7526.1(1) PrO2296 0.64(4) 5968.4(1) 5977.7(2)
n.d. stands for not defined in the original text
between some compounds is in the shape and peak splitting of the white line doublet. For example, in Cs2RbLn4+F7 (Ln = Ce, Pr, Nd, Dy, Tb), the shape of the spectra for Nd and Tb diverge from the rest (Figure 10).293, 298 While the two peaks appear to be about a 50/50 contribution in the white line feature for Ce, Pr, and Dy, in the Tb spectrum, the lower energy feature of the white line doublet has a much lower intensity when compared to the higher energy feature and vice versa for Nd. This decreased intensity has also been observed in L3-edge spectra of TbO2 and TbF4.286, 294-296 Additionally, in molecular complexes of Ce this variability in peak structure has been observed over a large range of complexes and relative peak intensities (Table 5). 253, 254, 265, 271, 276, 278, 299-301
Two competing hypotheses for the origin of the doublet white line feature for tetravalent complexes have been advanced: either a ground state or a final state effect. The dipole allowed transition probed at the L3-edge is from the metal 2p orbitals to unoccupied states with metal 5d character, 2p64fn5d0 → 2p54fn5d1, where n corresponds to the number of f electrons in the ground state. The ground state theory invokes the existence of two ground states, both the Ln4+ 2p64fn5d0L and an Ln3+ 2p64fn+15d0L (where L is a full ligand orbital and L is a ligand hole), which have the final states 2p54fn5d1L and 2p54fn+15d1L, respectively resulting in the multipeak feature. The other scenario suggests that a single ground state exists, 2p64fn5d0L, and that the peak splitting observed in the white line feature is a result of transitions to the unoccupied 5d states, which are split by the crystal field.
Numerous studies have sought to answer this question on the origin of the white line multipeak feature. Pressure dependence studies on PrO2 in 1994 show that with increasing pressure, the intensity of the 2p54fn+15d1L (Pr3+) contribution to the white line doublet increases.297 The authors claim that is a
result of increased covalency between the 2p and 4f orbitals at higher pressures. If the lower energy feature were one of mixed valent origins, this change in relative intensity would not be observed, therefore confirming a multiconfigurational ground state. These results were similar to those observed in CeO2 in 1988.284 More recent studies explain the multiconfigurational ground state through a complementary approach on Ce4+ complexes. Magnetic susceptibility studies have been performed on cerocene ([Ce4+(C8H8)2]), [Ce4+(acac)4], [Ce4+(trop)4], and [Ce4+(tmtaa)2] and show that these four formally 4f0 complexes exhibit TIP with c0 > 0.254, 299 Additionally, for [Ce4+(acac)4], [Ce4+(trop)4], and [Ce4+(tmtaa)2], Complete Active Space Self-Consistent Field (CASSCF) calculations demonstrate that the TIP behavior is correlated to the small energy difference between the ground state (open shell singlet, f1L) and the first excited state (open shell triplet, f1L).299 Further studies of cerocene at the Ce M5,4-edges and configuration interaction (CI) calculations to model the spectra also provide evidence for a multiconfigurational ground state, discussed below in the M-edge section.302
In light of these studies demonstrating multiconfigurational behavior at tetravalent Ce, the L3-edge spectra of tetravalent lanthanides may be fit to determine the relative contribution of each configuration to the ground state. In particular, weighting the 2p54fn+15d1L intensity to the total observed intensity is described by an nf value, which provides a quantitative measure to compare between different systems. Using the common two-peak model, the nf value is defined in Equation 6:
𝑛! =;!"#$
;!"#$$;!"%$ (6)
where ALn3+ is the intensity of the 2p54fn+15d1L contribution and ALn4+ is the intensity of the 2p54fn5d1L contribution to the white
Page 22 of 43Dalton Transactions
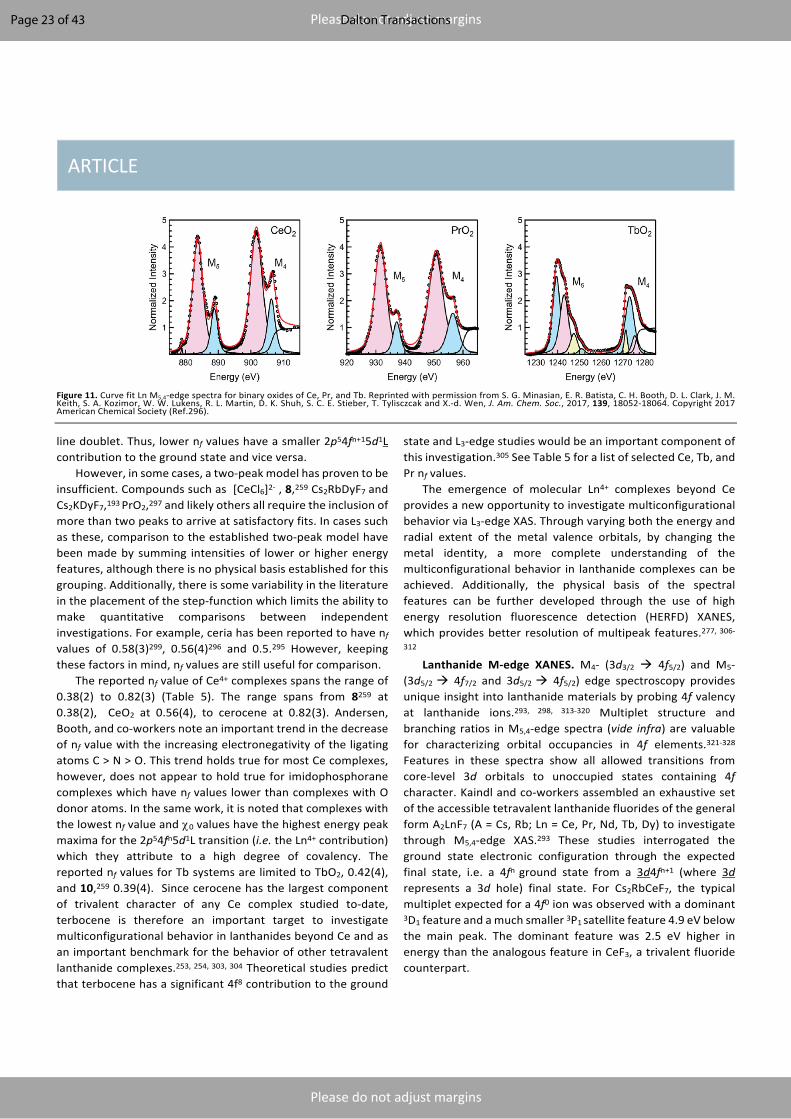
ARTICLE
Please do not adjust margins
Please do not adjust margins
Figure 11. Curve fit Ln M5,4-edge spectra for binary oxides of Ce, Pr, and Tb. Reprinted with permission from S. G. Minasian, E. R. Batista, C. H. Booth, D. L. Clark, J. M. Keith, S. A. Kozimor, W. W. Lukens, R. L. Martin, D. K. Shuh, S. C. E. Stieber, T. Tylisczcak and X.-d. Wen, J. Am. Chem. Soc., 2017, 139, 18052-18064. Copyright 2017 American Chemical Society (Ref.296).
line doublet. Thus, lower nf values have a smaller 2p54fn+15d1L contribution to the ground state and vice versa.
However, in some cases, a two-peak model has proven to be insufficient. Compounds such as [CeCl6]2- , 8,259 Cs2RbDyF7 and Cs2KDyF7,193 PrO2,297 and likely others all require the inclusion of more than two peaks to arrive at satisfactory fits. In cases such as these, comparison to the established two-peak model have been made by summing intensities of lower or higher energy features, although there is no physical basis established for this grouping. Additionally, there is some variability in the literature in the placement of the step-function which limits the ability to make quantitative comparisons between independent investigations. For example, ceria has been reported to have nf values of 0.58(3)299, 0.56(4)296 and 0.5.295 However, keeping these factors in mind, nf values are still useful for comparison.
The reported nf value of Ce4+ complexes spans the range of 0.38(2) to 0.82(3) (Table 5). The range spans from 8259 at 0.38(2), CeO2 at 0.56(4), to cerocene at 0.82(3). Andersen, Booth, and co-workers note an important trend in the decrease of nf value with the increasing electronegativity of the ligating atoms C > N > O. This trend holds true for most Ce complexes, however, does not appear to hold true for imidophosphorane complexes which have nf values lower than complexes with O donor atoms. In the same work, it is noted that complexes with the lowest nf value and c0 values have the highest energy peak maxima for the 2p54fn5d1L transition (i.e. the Ln4+ contribution) which they attribute to a high degree of covalency. The reported nf values for Tb systems are limited to TbO2, 0.42(4), and 10,259 0.39(4). Since cerocene has the largest component of trivalent character of any Ce complex studied to-date, terbocene is therefore an important target to investigate multiconfigurational behavior in lanthanides beyond Ce and as an important benchmark for the behavior of other tetravalent lanthanide complexes.253, 254, 303, 304 Theoretical studies predict that terbocene has a significant 4f8 contribution to the ground
state and L3-edge studies would be an important component of this investigation.305 See Table 5 for a list of selected Ce, Tb, and Pr nf values.
The emergence of molecular Ln4+ complexes beyond Ce provides a new opportunity to investigate multiconfigurational behavior via L3-edge XAS. Through varying both the energy and radial extent of the metal valence orbitals, by changing the metal identity, a more complete understanding of the multiconfigurational behavior in lanthanide complexes can be achieved. Additionally, the physical basis of the spectral features can be further developed through the use of high energy resolution fluorescence detection (HERFD) XANES, which provides better resolution of multipeak features.277, 306-
312 Lanthanide M-edge XANES. M4- (3d3/2 à 4f5/2) and M5-
(3d5/2 à 4f7/2 and 3d5/2 à 4f5/2) edge spectroscopy provides unique insight into lanthanide materials by probing 4f valency at lanthanide ions.293, 298, 313-320 Multiplet structure and branching ratios in M5,4-edge spectra (vide infra) are valuable for characterizing orbital occupancies in 4f elements.321-328 Features in these spectra show all allowed transitions from core-level 3d orbitals to unoccupied states containing 4f character. Kaindl and co-workers assembled an exhaustive set of the accessible tetravalent lanthanide fluorides of the general form A2LnF7 (A = Cs, Rb; Ln = Ce, Pr, Nd, Tb, Dy) to investigate through M5,4-edge XAS.293 These studies interrogated the ground state electronic configuration through the expected final state, i.e. a 4fn ground state from a 3d4fn+1 (where 3d represents a 3d hole) final state. For Cs2RbCeF7, the typical multiplet expected for a 4f0 ion was observed with a dominant 3D1 feature and a much smaller 3P1 satellite feature 4.9 eV below the main peak. The dominant feature was 2.5 eV higher in energy than the analogous feature in CeF3, a trivalent fluoride counterpart.
Page 23 of 43 Dalton Transactions

ARTICLE Journal Name
24 | J. Name., 2012, 00, 1-3 This journal is © The Royal Society of Chemistry 20xx
Please do not adjust margins
Please do not adjust margins
This energy shift of the dominant peak is in contrast to the shift in energy observed for CeO2 from Ce2O3 by Minasian co-workers.296, 329 In the oxides, the dominant feature is only 1.7 eV higher in energy. This difference in the peak shift from the fluorides to the oxides implies stronger ionic character for Ce4+ in the fluoride materials when compared to the oxides. A similar trend is seen with Cs2RbTbF7, where the dominant feature of the M5,4-edge spectra is 2.4 eV higher in energy than the trivalent fluoride, in comparison to a difference of 1.2 eV in the equivalent oxides. Pr follows suit with an increase in the dominant peak of 2.5 eV in the fluorides versus 1.7 eV in the oxides. For the stable dioxides (CeO2, PrO2, and TbO2), M5,4-edge spectroscopy provides evidence for Ln–L bond covalency and corroborates the covalency measured by ligand K-edge XAS studies (vide infra).296 Due to relatively large spin-orbit coupling in the lanthanides, both M5 and M4-edges are split into a more intense main feature and a higher energy satellite feature for all three dioxides (Figure 11). Analysis of the first and second derivatives of the M5,4-edge spectra support the use of four pseudo-Voigt functions to fit the spectra of CeO2 and PrO2. Due to the complexity of the multiplet splitting for TbO2, more functions are required to obtain a satisfactory fit. To quantify the effect of splitting, a branching ratio is defined, or the ratio of total peak intensity associated with the M5 transition to the total peak intensity associated with both M5 and M4 transitions. This value is 0.44(5) for CeO2 and PrO2 and 0.65(7) for TbO2. It is important to note that since final states are 3d94fn+1 and 3d9L4fn+2, the branching ratio is not suitable for investigating the amount of L4fn+1 that may be present in the ground state of the materials. The values of the branching ratios are consistent with expected trends for these three lanthanides; the ratios approach one as the series is traversed, because the probability of transitions to 4f5/2 state decrease as the f-orbitals are filled.
Configuration interaction (CI) calculations were performed to determine the origin of spectral features and assign how ground and final state mixing between Ln 4f orbitals and O 2p orbitals contribute to observed M5,4-edge spectra. These calculations showed that using simply a purely trivalent or tetravalent model for Ce and Pr did not agree well. In particular satellite features are not modelled accurately. A more satisfactory model is obtained through a charge-transfer model using two ground-state configurations, 3d104fn and 3d10L4fn+1, and the corresponding final-state configurations, 3d94fn+1 and 3d9L4fn+2. Both ground- and final-state are defined by the difference in charge-transfer energy, which can be benchmarked to experimentally observed LMCT feature in UV/vis spectra. The calculated ground states for CeO2 and PrO2 were similar. CeO2 was calculated to be 70% 3d104f0 and 30% 3d10L4f1, with a LMCT energy of 3.2 eV (experimental value is 3.1 eV330). PrO2 was calculated to be 71% 3d104f1 and 29% 3d10L4f2, with a LMCT energy of 2.2 eV (experimental value is 2.4 eV331). Although the amount of ligand hole character in the ground state for each of these materials is smaller than the amount determined from L3-edge spectroscopy on the same materials, it does provide additional evidence for mixing between Ln 4f orbitals and O 2p orbitals in the ground-state.
M5,4-edge XAS can also provide evidence of 4f occupation. However, this measurement is perturbed by the differences in formal oxidation state between analytes. Changing oxidation state affects the magnitude of the branching ratio and introduces satellite features for tetravalent complexes. For example, the spectra of molecular Ce4+ complexes differ from those of La3+ complexes, even though both ions are formally 4f0. Considering the most likely final state of 3d94f1, it is expected that there would be a singular peak for each the M5- and M4-edge. This structure is observed in La3+ spectra.323 However, the spectra of Ce(C8H8)2, CeRh3, and CeCl62- contain the expected intense feature along with weaker satellite features.276, 296, 302,
332 These spectra are similar in shape to spectra of CeO2.296, 324,
333, 334 However, the energy of the main features varies for each compound. The main features for [Ce(C8H8)2] (882.0 and 900.0 eV) and CeRh3 (882.6 and 900.1 eV) are lower in energy than in [CeCl6]2- (883.7 and 901.6 eV) and CeO2 (883.7 and 901.7 eV). The former resembles the energy scale observed for formally trivalent Ce compounds such as [CeCl6]3- (882.3 and 900.0 eV) and [Ce(C8H8)2]- (882.4 and 900.2 eV). This similarity is suggestive that there may be correlation between peak energy in M-edge XAS and the nf measured by L3-edge XAS.
In this context, the branching ratio for the trivalent and tetravalent molecular hexachlorides can be used to compare, relatively, the 4f occupancy in the ground state.276 Since Ce3+ has one more 4f electron than its tetravalent counterpart, it is expected that Ce3+ would have a higher branching ratio than Ce4+. For the hexachlorides, the branching ratios are 0.50(3) and 0.48(2) for Ce3+ and Ce4+, respectively. Although the trivalent branching ratio is slightly higher, once error is considered, the values are essentially equal. This is similar to what is seen for PrO2 and CeO2296 (vide supra) and implies that the sensitivity of the technique may not be enough to easily distinguish between a 4f1 and a 4f0 material. Ligand K-edge XAS. Since ligand K-edge XAS probes bound-state, dipole-allowed 1s à np transitions from ligand-based orbitals, transitions to molecular orbitals with ligand p-character can be observed.102, 276, 296, 329, 335-358 Figure 12 depicts a generalized form of transitions from ligand based 1s orbitals to a molecular orbital containing ligand p-character. Measurement of the intensity of pre-edge features can allow for a quantitative measurement of orbital mixing, or metal-ligand covalency – i.e. the amount of mixing between ligand-based p-orbitals with metal-based d- and f-orbitals.
Figure 12. General depiction of transition from ligand 1s orbital to molecular antibonding orbital containing ligand np character. Figure adapted from 276.
Page 24 of 43Dalton Transactions
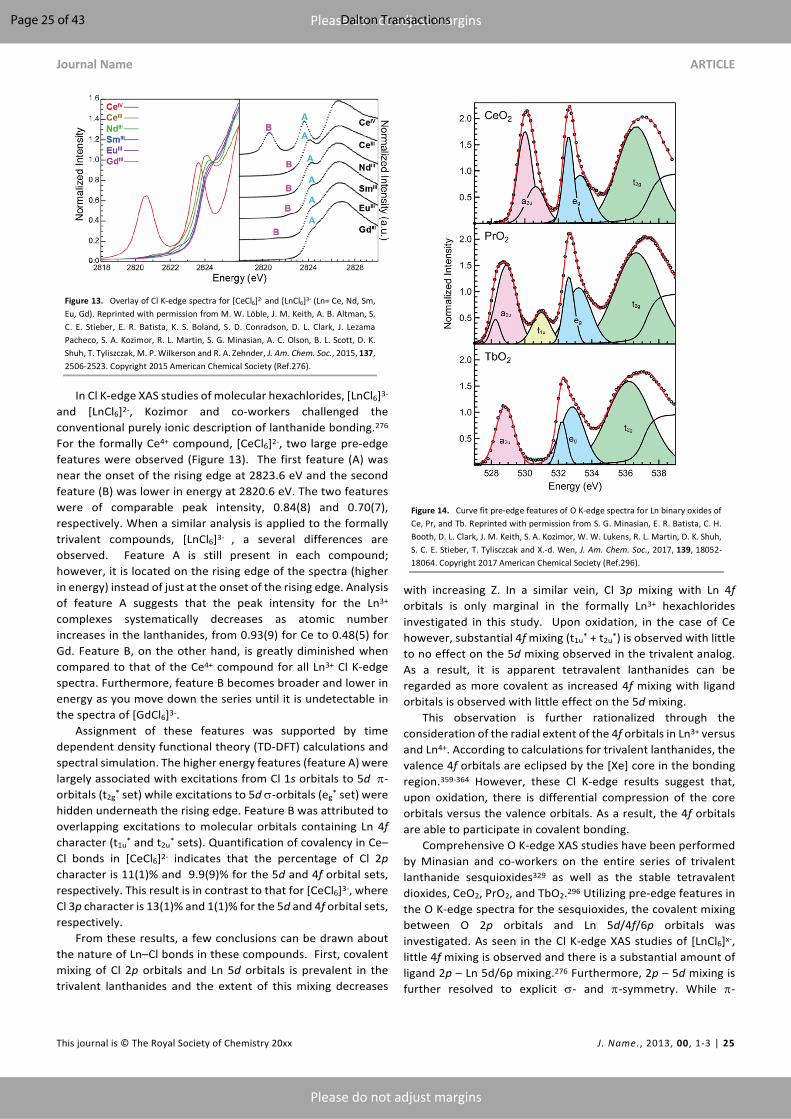
Journal Name ARTICLE
This journal is © The Royal Society of Chemistry 20xx J. Name., 2013, 00, 1-3 | 25
Please do not adjust margins
Please do not adjust margins
In Cl K-edge XAS studies of molecular hexachlorides, [LnCl6]3-
and [LnCl6]2-, Kozimor and co-workers challenged the conventional purely ionic description of lanthanide bonding.276 For the formally Ce4+ compound, [CeCl6]2-, two large pre-edge features were observed (Figure 13). The first feature (A) was near the onset of the rising edge at 2823.6 eV and the second feature (B) was lower in energy at 2820.6 eV. The two features were of comparable peak intensity, 0.84(8) and 0.70(7), respectively. When a similar analysis is applied to the formally trivalent compounds, [LnCl6]3- , a several differences are observed. Feature A is still present in each compound; however, it is located on the rising edge of the spectra (higher in energy) instead of just at the onset of the rising edge. Analysis of feature A suggests that the peak intensity for the Ln3+ complexes systematically decreases as atomic number increases in the lanthanides, from 0.93(9) for Ce to 0.48(5) for Gd. Feature B, on the other hand, is greatly diminished when compared to that of the Ce4+ compound for all Ln3+ Cl K-edge spectra. Furthermore, feature B becomes broader and lower in energy as you move down the series until it is undetectable in the spectra of [GdCl6]3-.
Assignment of these features was supported by time dependent density functional theory (TD-DFT) calculations and spectral simulation. The higher energy features (feature A) were largely associated with excitations from Cl 1s orbitals to 5d p-orbitals (t2g* set) while excitations to 5d s-orbitals (eg* set) were hidden underneath the rising edge. Feature B was attributed to overlapping excitations to molecular orbitals containing Ln 4f character (t1u* and t2u* sets). Quantification of covalency in Ce–Cl bonds in [CeCl6]2- indicates that the percentage of Cl 2p character is 11(1)% and 9.9(9)% for the 5d and 4f orbital sets, respectively. This result is in contrast to that for [CeCl6]3-, where Cl 3p character is 13(1)% and 1(1)% for the 5d and 4f orbital sets, respectively.
From these results, a few conclusions can be drawn about the nature of Ln–Cl bonds in these compounds. First, covalent mixing of Cl 2p orbitals and Ln 5d orbitals is prevalent in the trivalent lanthanides and the extent of this mixing decreases
with increasing Z. In a similar vein, Cl 3p mixing with Ln 4f orbitals is only marginal in the formally Ln3+ hexachlorides investigated in this study. Upon oxidation, in the case of Ce however, substantial 4f mixing (t1u* + t2u*) is observed with little to no effect on the 5d mixing observed in the trivalent analog. As a result, it is apparent tetravalent lanthanides can be regarded as more covalent as increased 4f mixing with ligand orbitals is observed with little effect on the 5d mixing.
This observation is further rationalized through the consideration of the radial extent of the 4f orbitals in Ln3+ versus and Ln4+. According to calculations for trivalent lanthanides, the valence 4f orbitals are eclipsed by the [Xe] core in the bonding region.359-364 However, these Cl K-edge results suggest that, upon oxidation, there is differential compression of the core orbitals versus the valence orbitals. As a result, the 4f orbitals are able to participate in covalent bonding. Comprehensive O K-edge XAS studies have been performed by Minasian and co-workers on the entire series of trivalent lanthanide sesquioxides329 as well as the stable tetravalent dioxides, CeO2, PrO2, and TbO2.296 Utilizing pre-edge features in the O K-edge spectra for the sesquioxides, the covalent mixing between O 2p orbitals and Ln 5d/4f/6p orbitals was investigated. As seen in the Cl K-edge XAS studies of [LnCl6]x-, little 4f mixing is observed and there is a substantial amount of ligand 2p – Ln 5d/6p mixing.276 Furthermore, 2p – 5d mixing is further resolved to explicit s- and p-symmetry. While p-
Figure 13. Overlay of Cl K-edge spectra for [CeCl6]2- and [LnCl6]3- (Ln= Ce, Nd, Sm, Eu, Gd). Reprinted with permission from M. W. Löble, J. M. Keith, A. B. Altman, S. C. E. Stieber, E. R. Batista, K. S. Boland, S. D. Conradson, D. L. Clark, J. Lezama Pacheco, S. A. Kozimor, R. L. Martin, S. G. Minasian, A. C. Olson, B. L. Scott, D. K. Shuh, T. Tyliszczak, M. P. Wilkerson and R. A. Zehnder, J. Am. Chem. Soc., 2015, 137, 2506-2523. Copyright 2015 American Chemical Society (Ref.276).
Figure 14. Curve fit pre-edge features of O K-edge spectra for Ln binary oxides of Ce, Pr, and Tb. Reprinted with permission from S. G. Minasian, E. R. Batista, C. H. Booth, D. L. Clark, J. M. Keith, S. A. Kozimor, W. W. Lukens, R. L. Martin, D. K. Shuh, S. C. E. Stieber, T. Tylisczcak and X.-d. Wen, J. Am. Chem. Soc., 2017, 139, 18052-18064. Copyright 2017 American Chemical Society (Ref.296).
Page 25 of 43 Dalton Transactions
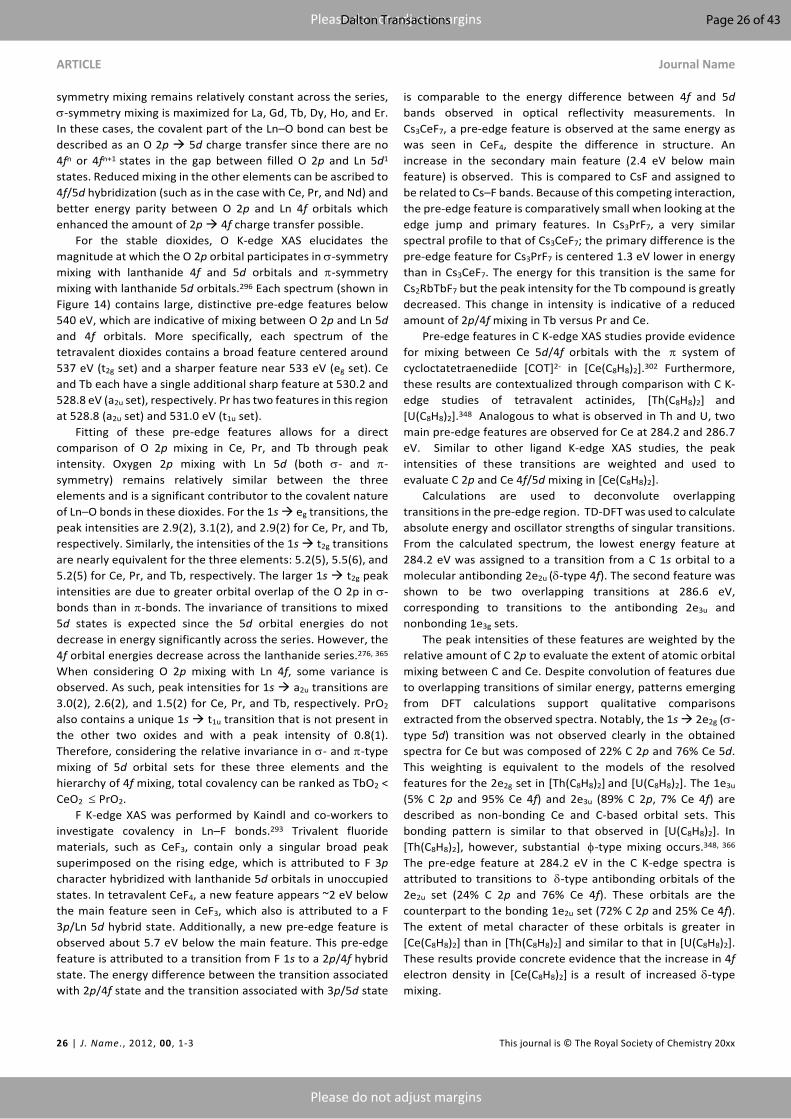
ARTICLE Journal Name
26 | J. Name., 2012, 00, 1-3 This journal is © The Royal Society of Chemistry 20xx
Please do not adjust margins
Please do not adjust margins
symmetry mixing remains relatively constant across the series, s-symmetry mixing is maximized for La, Gd, Tb, Dy, Ho, and Er. In these cases, the covalent part of the Ln–O bond can best be described as an O 2p à 5d charge transfer since there are no 4fn or 4fn+1 states in the gap between filled O 2p and Ln 5d1 states. Reduced mixing in the other elements can be ascribed to 4f/5d hybridization (such as in the case with Ce, Pr, and Nd) and better energy parity between O 2p and Ln 4f orbitals which enhanced the amount of 2p à 4f charge transfer possible.
For the stable dioxides, O K-edge XAS elucidates the magnitude at which the O 2p orbital participates in s-symmetry mixing with lanthanide 4f and 5d orbitals and p-symmetry mixing with lanthanide 5d orbitals.296 Each spectrum (shown in Figure 14) contains large, distinctive pre-edge features below 540 eV, which are indicative of mixing between O 2p and Ln 5d and 4f orbitals. More specifically, each spectrum of the tetravalent dioxides contains a broad feature centered around 537 eV (t2g set) and a sharper feature near 533 eV (eg set). Ce and Tb each have a single additional sharp feature at 530.2 and 528.8 eV (a2u set), respectively. Pr has two features in this region at 528.8 (a2u set) and 531.0 eV (t1u set).
Fitting of these pre-edge features allows for a direct comparison of O 2p mixing in Ce, Pr, and Tb through peak intensity. Oxygen 2p mixing with Ln 5d (both s- and p-symmetry) remains relatively similar between the three elements and is a significant contributor to the covalent nature of Ln–O bonds in these dioxides. For the 1s à eg transitions, the peak intensities are 2.9(2), 3.1(2), and 2.9(2) for Ce, Pr, and Tb, respectively. Similarly, the intensities of the 1s à t2g transitions are nearly equivalent for the three elements: 5.2(5), 5.5(6), and 5.2(5) for Ce, Pr, and Tb, respectively. The larger 1s à t2g peak intensities are due to greater orbital overlap of the O 2p in s-bonds than in p-bonds. The invariance of transitions to mixed 5d states is expected since the 5d orbital energies do not decrease in energy significantly across the series. However, the 4f orbital energies decrease across the lanthanide series.276, 365 When considering O 2p mixing with Ln 4f, some variance is observed. As such, peak intensities for 1s à a2u transitions are 3.0(2), 2.6(2), and 1.5(2) for Ce, Pr, and Tb, respectively. PrO2 also contains a unique 1s à t1u transition that is not present in the other two oxides and with a peak intensity of 0.8(1). Therefore, considering the relative invariance in s- and p-type mixing of 5d orbital sets for these three elements and the hierarchy of 4f mixing, total covalency can be ranked as TbO2 < CeO2 £ PrO2. F K-edge XAS was performed by Kaindl and co-workers to investigate covalency in Ln–F bonds.293 Trivalent fluoride materials, such as CeF3, contain only a singular broad peak superimposed on the rising edge, which is attributed to F 3p character hybridized with lanthanide 5d orbitals in unoccupied states. In tetravalent CeF4, a new feature appears ~2 eV below the main feature seen in CeF3, which also is attributed to a F 3p/Ln 5d hybrid state. Additionally, a new pre-edge feature is observed about 5.7 eV below the main feature. This pre-edge feature is attributed to a transition from F 1s to a 2p/4f hybrid state. The energy difference between the transition associated with 2p/4f state and the transition associated with 3p/5d state
is comparable to the energy difference between 4f and 5d bands observed in optical reflectivity measurements. In Cs3CeF7, a pre-edge feature is observed at the same energy as was seen in CeF4, despite the difference in structure. An increase in the secondary main feature (2.4 eV below main feature) is observed. This is compared to CsF and assigned to be related to Cs–F bands. Because of this competing interaction, the pre-edge feature is comparatively small when looking at the edge jump and primary features. In Cs3PrF7, a very similar spectral profile to that of Cs3CeF7; the primary difference is the pre-edge feature for Cs3PrF7 is centered 1.3 eV lower in energy than in Cs3CeF7. The energy for this transition is the same for Cs2RbTbF7 but the peak intensity for the Tb compound is greatly decreased. This change in intensity is indicative of a reduced amount of 2p/4f mixing in Tb versus Pr and Ce. Pre-edge features in C K-edge XAS studies provide evidence for mixing between Ce 5d/4f orbitals with the p system of cycloctatetraenediide [COT]2- in [Ce(C8H8)2].302 Furthermore, these results are contextualized through comparison with C K-edge studies of tetravalent actinides, [Th(C8H8)2] and [U(C8H8)2].348 Analogous to what is observed in Th and U, two main pre-edge features are observed for Ce at 284.2 and 286.7 eV. Similar to other ligand K-edge XAS studies, the peak intensities of these transitions are weighted and used to evaluate C 2p and Ce 4f/5d mixing in [Ce(C8H8)2].
Calculations are used to deconvolute overlapping transitions in the pre-edge region. TD-DFT was used to calculate absolute energy and oscillator strengths of singular transitions. From the calculated spectrum, the lowest energy feature at 284.2 eV was assigned to a transition from a C 1s orbital to a molecular antibonding 2e2u (d-type 4f). The second feature was shown to be two overlapping transitions at 286.6 eV, corresponding to transitions to the antibonding 2e3u and nonbonding 1e3g sets.
The peak intensities of these features are weighted by the relative amount of C 2p to evaluate the extent of atomic orbital mixing between C and Ce. Despite convolution of features due to overlapping transitions of similar energy, patterns emerging from DFT calculations support qualitative comparisons extracted from the observed spectra. Notably, the 1s à 2e2g (s-type 5d) transition was not observed clearly in the obtained spectra for Ce but was composed of 22% C 2p and 76% Ce 5d. This weighting is equivalent to the models of the resolved features for the 2e2g set in [Th(C8H8)2] and [U(C8H8)2]. The 1e3u
(5% C 2p and 95% Ce 4f) and 2e3u (89% C 2p, 7% Ce 4f) are described as non-bonding Ce and C-based orbital sets. This bonding pattern is similar to that observed in [U(C8H8)2]. In [Th(C8H8)2], however, substantial f-type mixing occurs.348, 366 The pre-edge feature at 284.2 eV in the C K-edge spectra is attributed to transitions to d-type antibonding orbitals of the 2e2u set (24% C 2p and 76% Ce 4f). These orbitals are the counterpart to the bonding 1e2u set (72% C 2p and 25% Ce 4f). The extent of metal character of these orbitals is greater in [Ce(C8H8)2] than in [Th(C8H8)2] and similar to that in [U(C8H8)2]. These results provide concrete evidence that the increase in 4f electron density in [Ce(C8H8)2] is a result of increased d-type mixing.
Page 26 of 43Dalton Transactions

Journal Name ARTICLE
This journal is © The Royal Society of Chemistry 20xx J. Name., 2013, 00, 1-3 | 27
Please do not adjust margins
Please do not adjust margins
It should be noted that Autsbach and co-workers have proposed an alternative interpretation of the C K-edge spectra of [Th(C8H8)2] and [U(C8H8)2] based on an ab initio multireference, restricted active space (RAS) approach.303 These calculations indicate that the experimental C K-edge XAS spectra do not indicate the involvement of f-5f orbitals in ground state bonding for [Th(C8H8)2], and that for [U(C8H8)2] there is ligand to metal f-bonding in the excited state. However, the multiconfigurational character of the wavefunction prevents the assignment of bonding interactions.
9. Optical Spectroscopy
Optical spectroscopy probes available transitions which are inherently tied to a specific oxidation state and electronic configuration. Similar to d-d electronic transitions in transition metals, f-f transitions in the lanthanides are forbidden based on selection rules. However, unlike transition metals, f-f transitions are not usually broadened or gain intensity through molecular vibrations and crystal field effects, which results in sharp transitions. On the other hand, f-d transitions in lanthanides are not orbital-forbidden and are relatively intense, especially in the case of Ce3+ and Tb3+ which have very intense transitions.
Optical spectroscopy has been carried out by Asprey and Varga to identify the free ion levels of Dy4+ and Nd4+ in Cs3LnF7.367, 368 The presence of Dy3+ and Nd3+ impurities was evident from the optical spectra. The optical spectra of Nd4+ and Dy4+ were compared to their isoelectronic trivalent counterparts, Pr3+ and Tb3+ respectively. The observed optical spectra were fit to a function with spin-orbit coupling parameter (ζ) and Racah parameters E1, E2, and E3 which are a function of the Slater radial integrals F2, F4 and F6 to determine the f energy levels for the corresponding free ions.
In Cs3NdF7, all transitions (7 f-f) up to 1D2 level at 487.8 nm (20500 cm-1) were assigned using absorption spectra. Fluorescence spectra for Cs3NdF7 showed two sets of transitions at 350-380 nm (28571.4 – 26315.7 cm-1) and 270-280 nm (37037 – 35714 cm-1), the former was assigned to transitions from 3P1, 3P0 and 1D2 (upper f-f transitions) and the latter to Nd3+ impurities or charge transfer. However, the transitions in the 350-380 nm region were broad and their origin was dubious. These transitions could be from the charge transfer band associated with orange/yellow color of Cs3NdF7. Since f-d transitions were so high in energy, they were not observed in either the absorption or the fluorescence spectra.367
In Cs3DyF7, six new transitions (f-f) between 3891 nm (2570 cm-1) and 1333.3 nm (7500 cm-1) were observed in the absorption spectra when compared to Cs3DyF6. A broad absorption band with a maximum at 400 nm (25000 cm-1) was observed and assigned as a charge transfer band giving rise to the orange/yellow color of Cs3DyF7. With fluorescence, two more f-f transitions were observed at 525 nm and 630 nm. These transitions were assigned by comparison of the spectrum to isoelectronic Cs3TbF6. Again, no f-d transitions were observed.368 In Cs3TbF7 no excitation was observed in either the fluorescence or the absorption spectra, hence putting a lower
limit on the first f-f transition at 303 nm (33000 cm-1). Such high energies for f-f transitions in Tb4+ are reasonable because Gd3+ with the same electron configuration (4f7) has the first f-f transition ~312.5 nm (32000 cm-1). However, the first f-f transition for Tb4+ is higher in energy than Gd3+ due to less effective screening of the nuclear charge in tetravalent lanthanides. Asprey and Varga did not comment on the charge transfer band in Cs3TbF7 even though Tb4+ compounds are known have bright colors. Again, no f-d transitions were observed.368
Asprey and Reisfeld reported one f-f transition as expected for a 4f1 Pr4+ in Na2PrF6 and PrF4 around 3466 nm (2885 cm-1) corresponding to a 2F5/2→ 2F7/2 transition.142 The authors did not comment on the charge transfer band in Pr4+ fluorides. Again, there were no obervable f-d transitions. While the study by Asprey and Reisfeld reported only one f-f transition for Pr4+, Popova et al., reported five f-f transitions in the optical spectrum of BaPrO3.369 The observation of five f-f transitions is in stark contrast to the expectation for a 4f1 system. However, the five f-f transitions are a result of comparable energy scales of CEF and SOC in tetravalent lanthanides. Two excitations were observed in the energy range of 900–2500 nm (11111 – 4000 cm-1) and were assigned to excitations to Γ8’ and Γ6 states based on a cubic symmetry first approximation as shown in Figure 7. Electric dipole transitions between different CEF levels are forbidden but transitions to Γ7’ and Γ8’ are magnetic dipole allowed. The optical excitation at 1449 nm (6900 cm-1) was assigned as a Γ7 to Γ6 vibronic transition. The optical excitation at 1887 nm (5300 cm-1) was assigned to a Γ7 to Γ8’ transition. The transition corresponding to Γ7 to Γ8’ is asymmetric, probably due to the splitting of the quartet into two Kramer’s doublets due to a lower CEF symmetry (a cubic CEF was a first order approximation). Further investigation of the optical spectroscopy on BaPrO3 resulted in the observation of two transitions, a two-peak feature at 4968 nm (2013 cm-1) and 4885 nm (2047 cm-1) and a single maximum at 3182 nm (3143 cm-1).370 The transition at 3182 nm is assigned to a Γ7 to Γ7’ transition. The excitations at 4968 nm and 4885 nm correspond to Γ7 to Γ8 transitions (where Γ8 is a quadruplet split into two Kramer’s doublets due to a lower CEF symmetry). For a Pr4+ free ion the first f-d transition is situated at 86.9 nm (115052 cm-1, measured in the gas phase).371
The one f-f transition observed in PrF4 and Na2PrF6
corresponds to a transition between two different J manifolds, J = 5/2 and J = 7/2 with 7ζ/2 = 2885 cm-1 resulting in ζ = 824 cm-
1. In BaPrO3 the transition between Γ7 with predominantly J = 5/2 character to Γ7’ with predominantly J = 7/2 character can be considered as the first f-f transition between the two different J manifolds. Crystal field calculation on BaPrO3 by Popova et al., provides a ζ = 840 cm-1. Both the reported values of SOC parameters are less than the SOC parameter for a Pr4+ free ion (865 cm-1).371 This discrepancy could be attributed to the effect of the ligand fields on Pr4+.370
Corresponding ζ values for 3+ and 4+ lanthanides are plotted in Figure 15. It is evident that the spin-orbit coupling parameter for tetravalent lanthanides is greater than the trivalent lanthanides. It should be noted that, in Ln3+, there is a break in
Page 27 of 43 Dalton Transactions
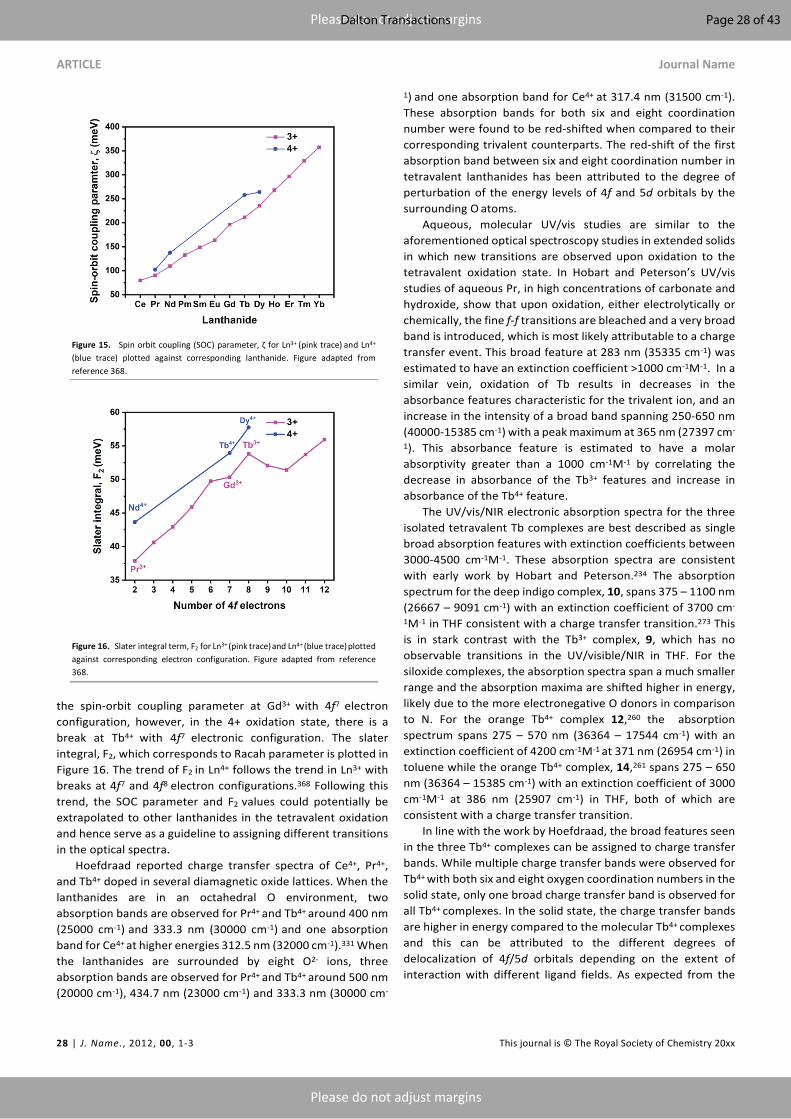
ARTICLE Journal Name
28 | J. Name., 2012, 00, 1-3 This journal is © The Royal Society of Chemistry 20xx
Please do not adjust margins
Please do not adjust margins
the spin-orbit coupling parameter at Gd3+ with 4f7 electron configuration, however, in the 4+ oxidation state, there is a break at Tb4+ with 4f7 electronic configuration. The slater integral, F2, which corresponds to Racah parameter is plotted in Figure 16. The trend of F2 in Ln4+ follows the trend in Ln3+ with breaks at 4f7 and 4f8 electron configurations.368 Following this trend, the SOC parameter and F2 values could potentially be extrapolated to other lanthanides in the tetravalent oxidation and hence serve as a guideline to assigning different transitions in the optical spectra.
Hoefdraad reported charge transfer spectra of Ce4+, Pr4+, and Tb4+ doped in several diamagnetic oxide lattices. When the lanthanides are in an octahedral O environment, two absorption bands are observed for Pr4+ and Tb4+ around 400 nm (25000 cm-1) and 333.3 nm (30000 cm-1) and one absorption band for Ce4+ at higher energies 312.5 nm (32000 cm-1).331 When the lanthanides are surrounded by eight O2- ions, three absorption bands are observed for Pr4+ and Tb4+ around 500 nm (20000 cm-1), 434.7 nm (23000 cm-1) and 333.3 nm (30000 cm-
1) and one absorption band for Ce4+ at 317.4 nm (31500 cm-1). These absorption bands for both six and eight coordination number were found to be red-shifted when compared to their corresponding trivalent counterparts. The red-shift of the first absorption band between six and eight coordination number in tetravalent lanthanides has been attributed to the degree of perturbation of the energy levels of 4f and 5d orbitals by the surrounding O atoms.
Aqueous, molecular UV/vis studies are similar to the aforementioned optical spectroscopy studies in extended solids in which new transitions are observed upon oxidation to the tetravalent oxidation state. In Hobart and Peterson’s UV/vis studies of aqueous Pr, in high concentrations of carbonate and hydroxide, show that upon oxidation, either electrolytically or chemically, the fine f-f transitions are bleached and a very broad band is introduced, which is most likely attributable to a charge transfer event. This broad feature at 283 nm (35335 cm-1) was estimated to have an extinction coefficient >1000 cm-1M-1. In a similar vein, oxidation of Tb results in decreases in the absorbance features characteristic for the trivalent ion, and an increase in the intensity of a broad band spanning 250-650 nm (40000-15385 cm-1) with a peak maximum at 365 nm (27397 cm-
1). This absorbance feature is estimated to have a molar absorptivity greater than a 1000 cm-1M-1 by correlating the decrease in absorbance of the Tb3+ features and increase in absorbance of the Tb4+ feature.
The UV/vis/NIR electronic absorption spectra for the three isolated tetravalent Tb complexes are best described as single broad absorption features with extinction coefficients between 3000-4500 cm-1M-1. These absorption spectra are consistent with early work by Hobart and Peterson.234 The absorption spectrum for the deep indigo complex, 10, spans 375 – 1100 nm (26667 – 9091 cm-1) with an extinction coefficient of 3700 cm-
1M-1 in THF consistent with a charge transfer transition.273 This is in stark contrast with the Tb3+ complex, 9, which has no observable transitions in the UV/visible/NIR in THF. For the siloxide complexes, the absorption spectra span a much smaller range and the absorption maxima are shifted higher in energy, likely due to the more electronegative O donors in comparison to N. For the orange Tb4+ complex 12,260 the absorption spectrum spans 275 – 570 nm (36364 – 17544 cm-1) with an extinction coefficient of 4200 cm-1M-1 at 371 nm (26954 cm-1) in toluene while the orange Tb4+ complex, 14,261 spans 275 – 650 nm (36364 – 15385 cm-1) with an extinction coefficient of 3000 cm-1M-1 at 386 nm (25907 cm-1) in THF, both of which are consistent with a charge transfer transition.
In line with the work by Hoefdraad, the broad features seen in the three Tb4+ complexes can be assigned to charge transfer bands. While multiple charge transfer bands were observed for Tb4+ with both six and eight oxygen coordination numbers in the solid state, only one broad charge transfer band is observed for all Tb4+ complexes. In the solid state, the charge transfer bands are higher in energy compared to the molecular Tb4+ complexes and this can be attributed to the different degrees of delocalization of 4f/5d orbitals depending on the extent of interaction with different ligand fields. As expected from the
Figure 15. Spin orbit coupling (SOC) parameter, ζ for Ln3+ (pink trace) and Ln4+
(blue trace) plotted against corresponding lanthanide. Figure adapted from reference 368.
Figure 16. Slater integral term, F2 for Ln3+ (pink trace) and Ln4+ (blue trace) plotted against corresponding electron configuration. Figure adapted from reference 368.
Page 28 of 43Dalton Transactions

Journal Name ARTICLE
This journal is © The Royal Society of Chemistry 20xx J. Name., 2013, 00, 1-3 | 29
Please do not adjust margins
Please do not adjust margins
solid state, no f-f/f-d transitions were observed in the Tb4+
complexes. The UV/vis/NIR absorption spectrum of the brown Pr4+
complex, 16, spans 275 – 700 nm (36364 – 14286 cm-1) with a molar absorptivity coefficient of 3800 cm-1M-1 at 363 nm (27548 cm-1) in THF.262 The molar absorptivity of this feature is consistent with that of a charge transfer transition. This spectrum is more asymmetric than those of the Tb siloxides. These results on Pr are also in line with the aqueous studies of Pr4+ by Hobart and Peterson. The absorption spectrum for 16 is in line with absorption spectra reported for Pr4+ doped in different diamagnetic lattices, which also contained a charge transfer feature. Within the energy range measured, no f-f transitions were observed, in line with the optical spectra of BaPrO3 where all five f-f transitions were observed in the far IR region between 1500 nm (6667 cm-1) – 4900 nm (2041 cm-1).369 The f-d transitions are likely too high in energy to observed.
10. Magnetic Properties
The only magnetic data available for Ln4+ ions are Pr4+ and Tb4+. Pr and Tb in the tetravalent oxidation state have electronic configurations of 4f1 and 4f7, respectively. Due to their characteristic paramagnetism, magnetic studies can be used to assign oxidation state and understand the electronic structure of tetravalent lanthanides complexes and extended solids. Lanthanides exhibit significant SOC, and optical spectroscopy measurements have shown that SOC is further enhanced in the tetravalent oxidation state compared to the trivalent oxidation state (vide supra).
Lanthanide anisotropy results from unquenched orbital moments, hence making J a good quantum number to describe the trivalent lanthanides. This model is in contrast to that for transition metals (mainly first and second row) where S is a good quantum number since these elements exhibit quenched orbital moments. Hence all three empirical Hund’s rule plays a critical role in determining the ground state of trivalent lanthanides while the first two empirical rules are sufficient to describe the ground state of first and second row transition metals. The trivalent lanthanides are best described in the Russell-Saunders (L-S coupling) scheme. Extending the same conceptualization of ground states to tetravalent lanthanides, the electronic structure of Pr4+ and Tb4+ can be explained using ground states 2F5/2 and 8S7/2, respectively. The expected room temperature magnetic moments for pure 2F5/2 and 8S7/2 ground states are 2.54 μB and 7.94 μB respectively assuming the ground state is completely populated at room temperature. DC-susceptibility measurements were performed on all three tetravalent terbium complexes and their trivalent counterparts. The expected magnetic moment at room temperature for a 4f8 Tb3+ ion is 9.72 μB in contrast to the lowered moment for the 4f7 Tb4+ ion, which is 7.94 μB. For 10, the magnetic moment was 8.27 μB while the Tb3+ precursor, 9, was 10.7 μB.273 Both values are higher than the expected moments but clearly demonstrate a change in oxidation state from Tb3+ to Tb4+. In addition to the Tb3+ and Tb4+ complexes, Mazzanti and co-workers synthesized the isoelectronic 4f7 Gd3+ equivalent to the tert-butoxy siloxide Tb4+ complex. The
complex [K][Gd3+(OSi(OtBu)3)4] had a magnetic moment of 7.88 μB and the Tb4+ complex, 12, of 7.89 μB, confirming the 4f7 configuration.260 The Tb3+ complex, 11, had a magnetic moment of 9.46 μB, which although slightly lower than the predicted value, confirms the change in oxidation state between the two Tb complexes. For the Tb4+ phenyl siloxide, 14, the magnetic moment was consistent with the previous tetravalent complex at 7.91 μB.261 The Tb3+ complex’s, 13, magnetic moment was 9.12 μB, significantly lower than the predicted value. These moments are consistent with values obtained for extended solid state Tb4+ compounds (Table 2).95, 151, 155
Similar trends were seen for magnetic studies of molecular Pr. The expected magnetic moment at room temperature for the 4f2 Pr3+ ion is 3.58 μB, larger than that of the 4f1 Pr4+ ion at 2.54 μB. Additionally, Mazzanti and co-workers synthesized a Ce3+ complex for comparison to the isoelectronic Pr4+ complex. For [K][Ce3+(OSiPh3)4(THF)] the magnetic moment was 2.08 μB while for 16 it was 2.23 μB, below the predicted value but consistent with the assignment of a 4f1 ion.262 Likewise, the magnetic moment for the Pr3+ complex, 15, is higher at 3.46 μB and consistent with a 4f2 ion. These magnetic studies are in contrast with extended solid systems of Pr4+.
The shape of the DC susceptibility vs T plot for 16 is in reasonable agreement with that of [K][Ce3+(OSiPh3)4(THF)]. In both complexes, χmT monotonously decreases from room temperature down to the lowest temperature measured, which can be attributed to thermal depopulation of low-lying Kramer’s doublets. The 2F5/2 ground state J multiplet in the Ce3+ and Pr4+
complexes are split by the crystal field into three Kramer’s doublets with |J, MJ> = |5/2,±1/2>, |5/2,±3/2>, and |5/2,±5/2>.372 Mazzanti and co-workers report the absence of an EPR spectrum at 5 K for both the Ce3+ and Pr4+ complexes (vide infra). Assuming only the ground state doublet is populated at 5 K, the absence of an EPR spectrum rules out the possibility of a |5/2,±1/2> ground state with XY anisotropy (𝑔∥ = 0.86, 𝑔== 2.57) in both complexes.372
The observed results for [K][Ce3+(OSiPh3)4(THF)] and 16262 indicate that the ground states could be comprised of either the |5/2,±3/2> doublet with 𝑔∥ = 2.57, 𝑔== 0 and an expected magnetic moment of 1.28 μB or |5/2,±5/2> doublet with 𝑔∥ = 4.29, 𝑔== 0 and expected magnetic moment of 2.14 μB (both Kramers doublets exhibit Ising anisotropy).372 However, the possibility of a quartet ground state cannot be ruled out (although unlikely in lower symmetry complexes). The observed magnetic moment at 5 K for the Ce3+ complex is ~1.25 μB is in reasonable agreement with the |5/2,±3/2> ground state doublet and for the Pr4+ complex with ~1 μB is less than the expected value for either a pure |5/2,±3/2> or |5/2,±5/2> doublet and hence making the ground state assignment difficult.
Mixing the ground state with excited states in the same J manifold could potentially explain the reduced moment of Pr4+ complex with a ground state of the form a|5/2,±3/2> + b|5/2,±5/2> + c|5/2,±1/2>, a2+b2+c2 = 1. The room temperature magnetic moments of the Ce3+ and Pr4+ complexes are less than the expected value for a f1, indicative of the 2F5/2
Page 29 of 43 Dalton Transactions
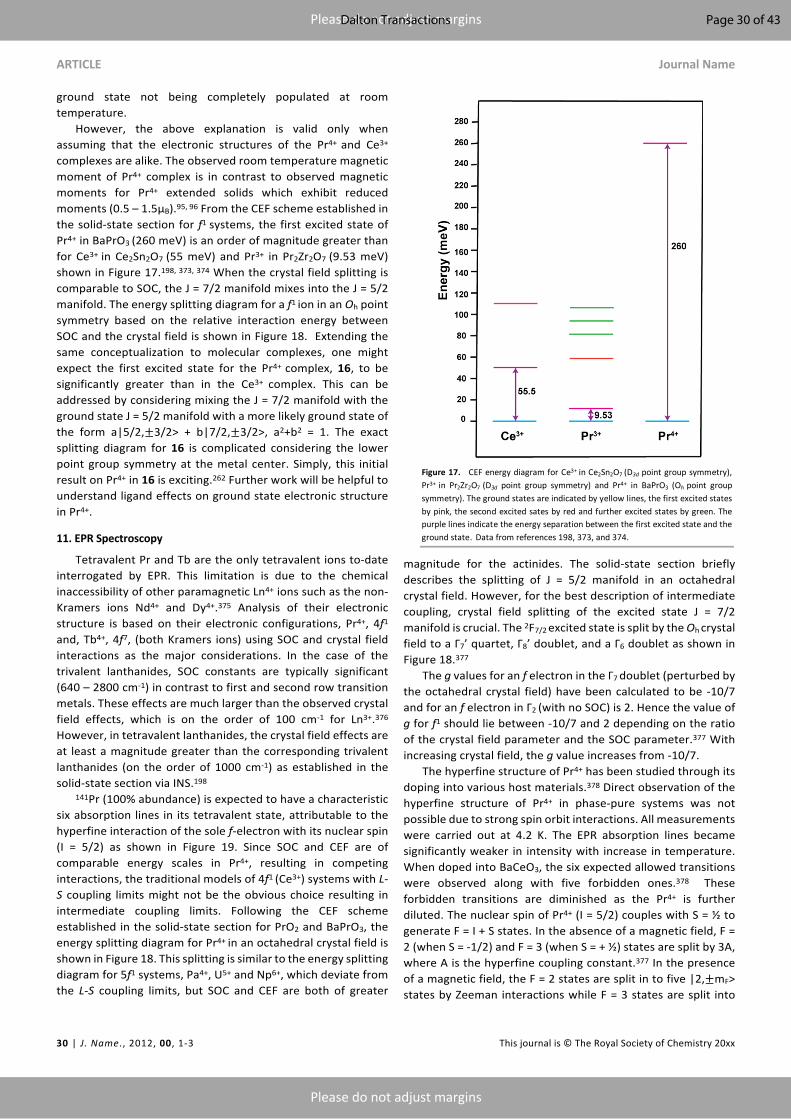
ARTICLE Journal Name
30 | J. Name., 2012, 00, 1-3 This journal is © The Royal Society of Chemistry 20xx
Please do not adjust margins
Please do not adjust margins
ground state not being completely populated at room temperature. However, the above explanation is valid only when assuming that the electronic structures of the Pr4+ and Ce3+
complexes are alike. The observed room temperature magnetic moment of Pr4+ complex is in contrast to observed magnetic moments for Pr4+ extended solids which exhibit reduced moments (0.5 – 1.5μB).95, 96 From the CEF scheme established in the solid-state section for f1 systems, the first excited state of Pr4+ in BaPrO3 (260 meV) is an order of magnitude greater than for Ce3+ in Ce2Sn2O7 (55 meV) and Pr3+ in Pr2Zr2O7 (9.53 meV) shown in Figure 17.198, 373, 374 When the crystal field splitting is comparable to SOC, the J = 7/2 manifold mixes into the J = 5/2 manifold. The energy splitting diagram for a f1 ion in an Oh point
symmetry based on the relative interaction energy between SOC and the crystal field is shown in Figure 18. Extending the same conceptualization to molecular complexes, one might expect the first excited state for the Pr4+ complex, 16, to be significantly greater than in the Ce3+ complex. This can be addressed by considering mixing the J = 7/2 manifold with the ground state J = 5/2 manifold with a more likely ground state of the form a|5/2,±3/2> + b|7/2,±3/2>, a2+b2 = 1. The exact splitting diagram for 16 is complicated considering the lower point group symmetry at the metal center. Simply, this initial result on Pr4+ in 16 is exciting.262 Further work will be helpful to understand ligand effects on ground state electronic structure in Pr4+.
11. EPR Spectroscopy
Tetravalent Pr and Tb are the only tetravalent ions to-date interrogated by EPR. This limitation is due to the chemical inaccessibility of other paramagnetic Ln4+ ions such as the non-Kramers ions Nd4+ and Dy4+.375 Analysis of their electronic structure is based on their electronic configurations, Pr4+, 4f1 and, Tb4+, 4f7, (both Kramers ions) using SOC and crystal field interactions as the major considerations. In the case of the trivalent lanthanides, SOC constants are typically significant (640 – 2800 cm-1) in contrast to first and second row transition metals. These effects are much larger than the observed crystal field effects, which is on the order of 100 cm-1 for Ln3+.376 However, in tetravalent lanthanides, the crystal field effects are at least a magnitude greater than the corresponding trivalent lanthanides (on the order of 1000 cm-1) as established in the solid-state section via INS.198
141Pr (100% abundance) is expected to have a characteristic six absorption lines in its tetravalent state, attributable to the hyperfine interaction of the sole f-electron with its nuclear spin (I = 5/2) as shown in Figure 19. Since SOC and CEF are of comparable energy scales in Pr4+, resulting in competing interactions, the traditional models of 4f1 (Ce3+) systems with L-S coupling limits might not be the obvious choice resulting in intermediate coupling limits. Following the CEF scheme established in the solid-state section for PrO2 and BaPrO3, the energy splitting diagram for Pr4+ in an octahedral crystal field is shown in Figure 18. This splitting is similar to the energy splitting diagram for 5f1 systems, Pa4+, U5+ and Np6+, which deviate from the L-S coupling limits, but SOC and CEF are both of greater
magnitude for the actinides. The solid-state section briefly describes the splitting of J = 5/2 manifold in an octahedral crystal field. However, for the best description of intermediate coupling, crystal field splitting of the excited state J = 7/2 manifold is crucial. The 2F7/2 excited state is split by the Oh crystal field to a Γ7’ quartet, Γ8’ doublet, and a Γ6 doublet as shown in Figure 18.377
The g values for an f electron in the Γ7 doublet (perturbed by the octahedral crystal field) have been calculated to be -10/7 and for an f electron in Γ2 (with no SOC) is 2. Hence the value of g for f1 should lie between -10/7 and 2 depending on the ratio of the crystal field parameter and the SOC parameter.377 With increasing crystal field, the g value increases from -10/7.
The hyperfine structure of Pr4+ has been studied through its doping into various host materials.378 Direct observation of the hyperfine structure of Pr4+ in phase-pure systems was not possible due to strong spin orbit interactions. All measurements were carried out at 4.2 K. The EPR absorption lines became significantly weaker in intensity with increase in temperature. When doped into BaCeO3, the six expected allowed transitions were observed along with five forbidden ones.378 These forbidden transitions are diminished as the Pr4+ is further diluted. The nuclear spin of Pr4+ (I = 5/2) couples with S = ½ to generate F = I + S states. In the absence of a magnetic field, F = 2 (when S = -1/2) and F = 3 (when S = + ½) states are split by 3A, where A is the hyperfine coupling constant.377 In the presence of a magnetic field, the F = 2 states are split in to five |2,±mF> states by Zeeman interactions while F = 3 states are split into
Figure 17. CEF energy diagram for Ce3+ in Ce2Sn2O7 (D3d point group symmetry), Pr3+ in Pr2Zr2O7 (D3d point group symmetry) and Pr4+ in BaPrO3 (Oh point group symmetry). The ground states are indicated by yellow lines, the first excited states by pink, the second excited sates by red and further excited states by green. The purple lines indicate the energy separation between the first excited state and the ground state. Data from references 198, 373, and 374.
Page 30 of 43Dalton Transactions

Journal Name ARTICLE
This journal is © The Royal Society of Chemistry 20xx J. Name., 2013, 00, 1-3 | 31
Please do not adjust margins
Please do not adjust margins
seven |3,±mF> states. The six allowed transitions follow the selection rule ΔF = ±1, ΔmF = ±1 as shown in Figure 19. The five observed forbidden transitions were assigned as ΔF = ±1 and ΔmF = ±0. The forbidden transitions were not observed in any other Pr4+ doped host lattices. In very dilute, Pr doped zirconium and tin perovskites (Pr4+: BaZrO3, BaSnO3), very distinct hyperfine lines broader than in BaCeO3 (hence masking the forbidden transitions) are observed and, in some cases, only five lines are observed.379 Calculations demonstrated that the sixth line is expected at a higher field that was not instrumentally accessible.
Pr4+ doped in different diamagnetic oxide lattices has also been studied. It should be noted here that the number of observed allowed transitions varies anywhere between 4 – 12 depending on the lattice and the accessible scan window of the instrument. All these EPR spectra were fit to the following Hamiltonian by Hinatsu in Equation 7:380
𝐻 = 𝑔𝛽𝐻. 𝑆 + 𝐴𝑆. 𝐼 − 𝑔>? 𝛽𝐻. 𝐼 (7)
where g is the value corresponding to spin, 𝑔>? is the value corresponding to Pr nucleus, A is the hyperfine coupling constant, I is the nuclear spin, H is the magnetic field applied and β is the Bohr magneton. The best fit parameters with g values and hyperfine coupling constant (A) are summarized in Table 6 along with values determined for isoelectronic Pa4+, U5+
and Np6+.381-385 The EPR spectrum for Pr4+: La2Sn2O7 has been simulated using EasySpin386 with the parameters provided by Hinatsu et al.,380 and plotted in Figure 20. When Pr4+ is doped in Ce4+ based lattices (SrCeO3 and Sr2CeO4) there are twelve observed transitions. These transitions in Pr4+: Sr2CeO4 can be separated into two different groups each consisting of six transitions and has been attributed to significant anisotropy of hyperfine interaction between the nuclear spin and electron spin parallel and perpendicular to the crystallographic c-axis due to the axial symmetry (|𝑔∥| > |𝑔=|).387 In Pr4+:SrCeO3, a spatially anisotropic g tensor with |𝑔@| > I𝑔AI > |𝑔B| was used to fit the spectrum.379 The fit parameter with corresponding anisotropic values are provided in Table 6. The EPR spectrum for Pr4+: SrCeO3 has been simulated using in EasySpin with the parameters provided by Hinatsu et al.379 and has been plotted in Figure 20.
While all of the host lattices described above include Pr4+ in a pseudo Oh environment, studies have been carried out by Parker and Harris, where Pr4+ doped in ZrSiO4 single crystals is coordinated to eight O atoms, thereby reducing the point group symmetry at Pr4+ compared to previous studies.388 The corresponding A and g values are listed in Table 6. At 4.2 K, six widely spread hyperfine lines were observed with significantly small anisotropy along and normal to c-axis (z-direction parallel to c-axis).
It should be noted that in all the studies discussed above, a first order approximation of an Oh crystal field was assumed irrespective of the point group symmetry at Pr4+. The above studies do not provide the sign of the g value. However, by creating an analogy to isoelectronic 5f1 systems – Pa4+, U5+ and Np6+, Hinatsu and Edelstein assigned a negative sign to the g value of Pr4+.385 Based on these tabulated g values, it has been
Figure 18. Energy splitting of a f1 system as a function of ξ determined by the relative magnitudes of crystal field splitting parameters (Δ and θ) and SOC parameter (ζ). ξ = 1 corresponds to a strong crystal field limit with SOC parameter (ζ) = 0 and ξ = 0 corresponds to a weak crystal field limit with crystal field parameters Δ + θ = 0. Figure adapted from reference 377.
Figure 19. Energy level splitting diagram for hyperfine coupled term of Pr4+ with F = I + S, where I = 5/2 is the nuclear spin and S = ±1/2 is the electron spin in the presence and absence of a magnetic field. The absence of the magnetic field is represented by H = 0 and the presence of magnetic field by H = H0. Dotted arrows indicate allowed transitions. It should be noted here that the Zeeman splitting levels are equally space only for clarity.
Page 31 of 43 Dalton Transactions
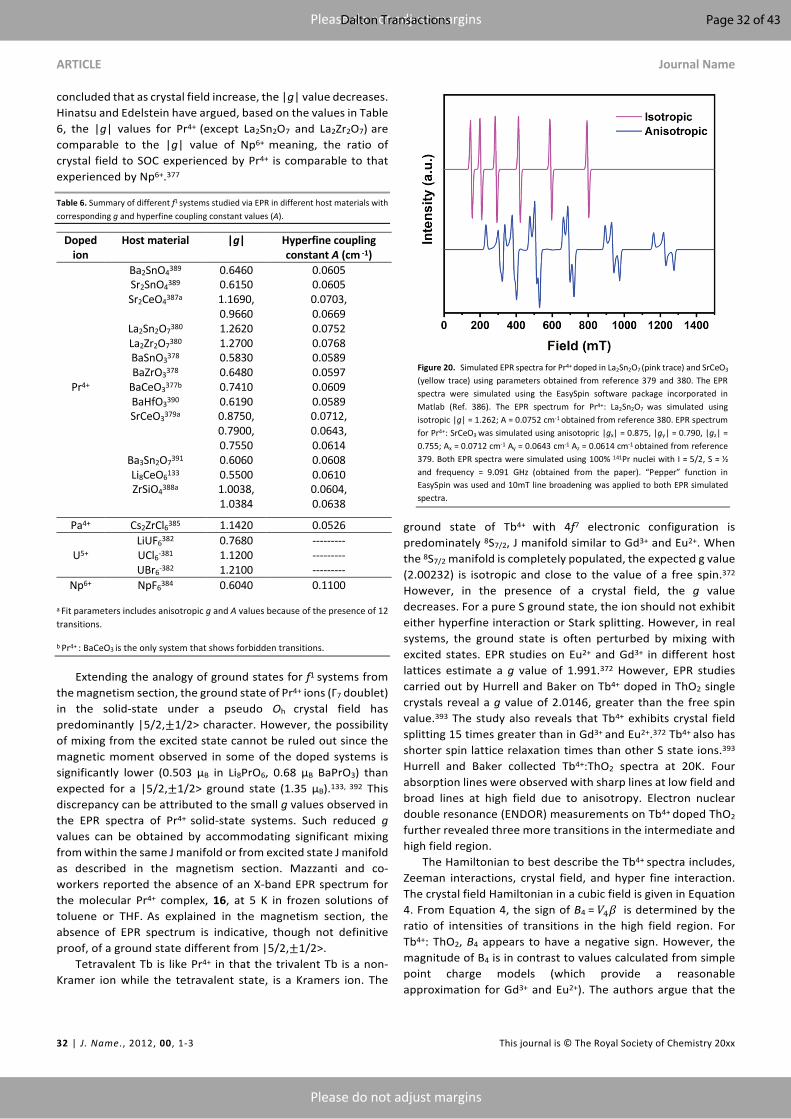
ARTICLE Journal Name
32 | J. Name., 2012, 00, 1-3 This journal is © The Royal Society of Chemistry 20xx
Please do not adjust margins
Please do not adjust margins
concluded that as crystal field increase, the |g| value decreases. Hinatsu and Edelstein have argued, based on the values in Table 6, the |g| values for Pr4+ (except La2Sn2O7 and La2Zr2O7) are comparable to the |g| value of Np6+ meaning, the ratio of crystal field to SOC experienced by Pr4+ is comparable to that experienced by Np6+.377
Table 6. Summary of different f1 systems studied via EPR in different host materials with corresponding g and hyperfine coupling constant values (A).
Doped ion
Host material |g| Hyperfine coupling constant A (cm -1)
Pr4+
Ba2SnO4389 0.6460 0.0605 Sr2SnO4389 0.6150 0.0605 Sr2CeO4387a 1.1690,
0.9660 0.0703, 0.0669
La2Sn2O7380 1.2620 0.0752 La2Zr2O7380 1.2700 0.0768 BaSnO3378 0.5830 0.0589 BaZrO3378 0.6480 0.0597
BaCeO3377b 0.7410 0.0609 BaHfO3390 0.6190 0.0589 SrCeO3379a 0.8750,
0.7900, 0.7550
0.0712, 0.0643, 0.0614
Ba3Sn2O7391 0.6060 0.0608 Li8CeO6133 0.5500 0.0610 ZrSiO4388a 1.0038,
1.0384 0.0604, 0.0638
Pa4+ Cs2ZrCl6385 1.1420 0.0526
U5+ LiUF6382 0.7680 --------- UCl6-381 1.1200 --------- UBr6-382 1.2100 ---------
Np6+ NpF6384 0.6040 0.1100
a Fit parameters includes anisotropic g and A values because of the presence of 12 transitions.
b Pr4+ : BaCeO3 is the only system that shows forbidden transitions.
Extending the analogy of ground states for f1 systems from the magnetism section, the ground state of Pr4+ ions (Γ7 doublet) in the solid-state under a pseudo Oh crystal field has predominantly |5/2,±1/2> character. However, the possibility of mixing from the excited state cannot be ruled out since the magnetic moment observed in some of the doped systems is significantly lower (0.503 μB in Li8PrO6, 0.68 μB BaPrO3) than expected for a |5/2,±1/2> ground state (1.35 μB).133, 392 This discrepancy can be attributed to the small g values observed in the EPR spectra of Pr4+ solid-state systems. Such reduced g values can be obtained by accommodating significant mixing from within the same J manifold or from excited state J manifold as described in the magnetism section. Mazzanti and co-workers reported the absence of an X-band EPR spectrum for the molecular Pr4+ complex, 16, at 5 K in frozen solutions of toluene or THF. As explained in the magnetism section, the absence of EPR spectrum is indicative, though not definitive proof, of a ground state different from |5/2,±1/2>.
Tetravalent Tb is like Pr4+ in that the trivalent Tb is a non-Kramer ion while the tetravalent state, is a Kramers ion. The
ground state of Tb4+ with 4f7 electronic configuration is predominately 8S7/2, J manifold similar to Gd3+ and Eu2+. When the 8S7/2 manifold is completely populated, the expected g value (2.00232) is isotropic and close to the value of a free spin.372 However, in the presence of a crystal field, the g value decreases. For a pure S ground state, the ion should not exhibit either hyperfine interaction or Stark splitting. However, in real systems, the ground state is often perturbed by mixing with excited states. EPR studies on Eu2+ and Gd3+ in different host lattices estimate a g value of 1.991.372 However, EPR studies carried out by Hurrell and Baker on Tb4+ doped in ThO2 single crystals reveal a g value of 2.0146, greater than the free spin value.393 The study also reveals that Tb4+ exhibits crystal field splitting 15 times greater than in Gd3+ and Eu2+.372 Tb4+ also has shorter spin lattice relaxation times than other S state ions.393 Hurrell and Baker collected Tb4+:ThO2 spectra at 20K. Four absorption lines were observed with sharp lines at low field and broad lines at high field due to anisotropy. Electron nuclear double resonance (ENDOR) measurements on Tb4+ doped ThO2
further revealed three more transitions in the intermediate and high field region.
The Hamiltonian to best describe the Tb4+ spectra includes, Zeeman interactions, crystal field, and hyper fine interaction. The crystal field Hamiltonian in a cubic field is given in Equation 4. From Equation 4, the sign of B4 = 𝑉#𝛽 is determined by the ratio of intensities of transitions in the high field region. For Tb4+: ThO2, B4 appears to have a negative sign. However, the magnitude of B4 is in contrast to values calculated from simple point charge models (which provide a reasonable approximation for Gd3+ and Eu2+). The authors argue that the
Figure 20. Simulated EPR spectra for Pr4+ doped in La2Sn2O7 (pink trace) and SrCeO3
(yellow trace) using parameters obtained from reference 379 and 380. The EPR spectra were simulated using the EasySpin software package incorporated in Matlab (Ref. 386). The EPR spectrum for Pr4+: La2Sn2O7 was simulated using isotropic |g| = 1.262; A = 0.0752 cm-1 obtained from reference 380. EPR spectrum for Pr4+: SrCeO3 was simulated using anisotopric |gx| = 0.875, |gy| = 0.790, |gz| = 0.755; Ax = 0.0712 cm-1 Ay = 0.0643 cm-1 Az = 0.0614 cm-1 obtained from reference 379. Both EPR spectra were simulated using 100% 141Pr nuclei with I = 5/2, S = ½ and frequency = 9.091 GHz (obtained from the paper). “Pepper” function in EasySpin was used and 10mT line broadening was applied to both EPR simulated spectra.
Page 32 of 43Dalton Transactions
Journal Name ARTICLE
This journal is © The Royal Society of Chemistry 20xx J. Name., 2013, 00, 1-3 | 33
Please do not adjust margins
Please do not adjust margins
unusually large value of B4 in Tb4+ compared to Gd3+ and Eu2+ is indicative of covalent bonding effects.372 The anomalously large g value can be explained by higher order perturbations distorting the spherical symmetry of Tb4+ resulting in a small anisotropy or by mixing the 6P7/2 excited state into the ground state. The magnetic hyperfine coupling in Tb4+ was found to be significantly smaller than in Eu2+ and Gd3+, which is indicative increased covalency in Tb4+.393
The EPR spectrum of Tb4+ in zircon (a non-cubic crystal field) by Milne and Hutton have similar findings to the above discussion.394 The crystal field Hamiltonian in a non-cubic crystal field requires the use of higher order operators as shown below in Equation 8:
𝐻789 = 𝐵0𝑂0 + 𝐵#𝑂# +𝐵:𝑂: +𝐵::𝑂:: (8)
The B2 value in the crystal field Hamiltonian determined for Tb4+ in zircon is 20 times greater than for Gd3+ in the same host lattice indicative of increased covalency. In a paper by Fielding and co-workers, hyperfine coupling to Tb (I = 3/2) is resolved in Tb4+ doped in zircon single-crystals. The hyperfine coupling is measured to be 𝐴== 94.7(9) MHz and 𝐴∥ = 101.2(9) MHz at 50 K. The authors also note the significant zero field splitting of Tb4+ in comparison to Gd3+.395 Heidepreim and Ehrt observed EPR spectra for Tb4+ and Eu2+ in fluoride phosphate glasses with g = 5.0 for Tb4+ and g values of 2.0, 2.8 and 6.0 for Eu2+. The difference in the spectra has been attributed to higher crystal field strength for Tb4+ in comparison to Eu2+.396
Perovskites of tetravalent Tb as well as diamagnetic perovskites doped with Tb have been synthesized and studied through EPR experiments by Hinatsu. The EPR spectrum of BaTbO3 shows a very broad linewidth, spanning over 1100 G. The g-value was estimated to be 2.00. Crystal field effects play a notable role the magnetic properties of tetravalent Tb. During the perovskite studies, it was noted that distortion from ideal perovskite structure, as was the case in SrTbO3, resulted in a decrease in g-value from 2.00 to 1.97.154 However, EPR studies by Lanzi on SrTbO3 reveal a g value of 2.012, greater than the free spin value in line with the observation by Baker and Hurrell. The increased g value was again attributed to increased covalency in the Tb–O bond.397 Lithium-rich oxides of Tb have also been studied through EPR. After doping with diamagnetic Li8CeO6, a very broad line width of approximately 3000 G is observed along with a complicated structure due to hyperfine interaction with the Tb nucleus.133 No g value was estimated. It should be noted here that these measurement by Hinatsu were carried out at room temperature and the observation of broad features rather than fine structure as in Tb4+ doped in ThO2 can most likely be attributed to temperature effects.
All three tetravalent Tb complexes were characterized via EPR and their spectra differ significantly from those obtained in the solid-state. Spectra were collected at 4 K in toluene for 10273 and 20 K for 14261 and 12260 which were in Et2O/THF and toluene, respectively. Signals for 10 were dampened at 77 K and completely attenuated at room temperature. The temperature dependence nature of the signal in the two siloxide complexes is unreported. A number of factors may contribute to the
convoluted spectra including zero field splitting, potential hyperfine coupling to the I = +3/2 Tb nucleus, g-strain, and rhombicity, ½D/E½. Disentangling these contributions to provide a cohesive and detailed model requires the investigation of these complexes via high-field and frequency EPR techniques. 12. Summary
While the isolation of tetravalent Pr and Tb molecular complexes had been a long-standing challenge in coordination chemistry, these recent results are based on the considerable progress that had been made in extended solid phases and in the gas-phase to identify and characterize tetravalent lanthanide ions. These synthetic and spectroscopic results, detailed in the above sections, map out areas where further discoveries are possible and suggest areas for the development and application of advanced spectroscopies. Outstanding challenges include definitive evidence for Dy4+ in oxide lattices and the potential to prepare Sm4+ or Ho4+ in fluoride or oxide lattices. However, revisiting the synthetic approaches of Hoppe to prepare the A3LnF7 materials (condensed, pressurized F2) is daunting. The thermochemistry and electronic structure of Pr4+ in oxides indicates that further unusual magnetic phenomena can be realized as synthetic chemistry is developed. Additionally, it is clear from the characterization of extant tetravalent lanthanides that the CEF is increased in comparison to their trivalent counterparts. This phenomenon is an opportunity for the application of advanced synchrotron techniques including RIXS to map higher lying crystal field states in systems that include strong neutron absorbers.398-404 Synthetic molecular chemistry has many avenues for further development. The prospect of pentavalent Pr complexes, established in gas-phase experiments, should provide significant impetus for the further exploration of the reactivity of early lanthanide coordination complexes. The evidence from in aqueous chemistry in strongly complexing solutions and the recent isolations of molecular tetravalent complexes suggest that stable Pr4+ and Tb4+ may be accessible in aqueous phases via further ligand development. This technology could have significant implications for redox-based separation processes. Additionally, the dramatic shifts in the observed the redox couples based on the coordination sphere for 7 and 9 suggest that a wealth of Pr4+ and Tb4+ coordination chemistry and reactivity is available to be explored. Given the very negative potentials accessible with the ligands developed to stabilize Tb4+ and Pr4+, there may even be the possibility to isolate other tetravalent lanthanide ions in molecular complexes.
Synchrotron spectroscopies are an efficient and powerful tool to evaluate oxidation state in the lanthanides. However, there are a number of open questions including the physical basis of the observed multipeak feature in tetravalent spectra in L-edge and M-edge XAS spectra. The expanding coordination chemistry of these systems presents the opportunity for the application of HERFD-XANES and CASSCF methodologies to the identification of ligand parameters involved in the observed multiconfigurational behavior and other complicating physical
Page 33 of 43 Dalton Transactions
ARTICLE Journal Name
34 | J. Name., 2012, 00, 1-3 This journal is © The Royal Society of Chemistry 20xx
Please do not adjust margins
Please do not adjust margins
phenomena.277, 306-312 Ligand K-edge studies have demonstrated the increased covalency in tetravalent lanthanides and will remain an essential technique to evaluate bonding as synthetic chemistry expands the known analytes. The continued development of synthetic chemistry is essential to increase the number of known tetravalent analytes in pure form in the condensed phase. These analytes are essential to fully mapping the physical and chemical properties of tetravalent lanthanides, and will drive the continued development of optical, spectroscopic, magnetic, and EPR characterization methodologies to understanding the electronic structure of the tetravalent lanthanide ions.
Acknowledgements
This work was supported by the School of Chemistry and Biochemistry at the Georgia Institute of Technology and the Department of Energy, Heavy Element Chemistry Program (DE-SC0019385).
References
1. F. H. Spedding, A. F. Voigt, E. M. Gladrow and N. R.
Sleight, J. Am. Chem. Soc., 1947, 69, 2777-2781. 2. F. H. Spedding, A. F. Voigt, E. M. Gladrow, N. R. Sleight, J.
E. Powell, J. M. Wright, T. A. Butler and P. Figard, J. Am. Chem. Soc., 1947, 69, 2786-2792.
3. F. H. Spedding, E. I. Fulmer, T. A. Butler, E. M. Gladrow, M. Gobush, P. E. Porter, J. E. Powell and J. M. Wright, J. Am. Chem. Soc., 1947, 69, 2812-2818.
4. F. H. Spedding, E. I. Fulmer, T. A. Butler and J. E. Powell, J. Am. Chem. Soc., 1950, 72, 2349-2354.
5. F. H. Spedding, E. I. Fulmer, J. E. Powell and T. A. Butler, J. Am. Chem. Soc., 1950, 72, 2354-2361.
6. F. H. Spedding and A. H. Daane, J. Am. Chem. Soc., 1952, 74, 2783-2785.
7. F. H. Spedding, Discuss. Faraday Soc., 1949, 7, 214-231. 8. US Pat., US2539282, 1951. 9. US Pat., US2798789, 1957. 10. W. Klemm, Z. Anorg. Allg. Chem., 1929, 184, 345-351. 11. G. Meyer, J. Solid State Chem., 2019, 270, 324-334. 12. G. Meyer, Angew. Chem. Int. Edit., 2014, 53, 3550-3551. 13. A. Pol, T. R. M. Barends, A. Dietl, A. F. Khadem, J.
Eygensteyn, M. S. M. Jetten and H. J. M. Op den Camp, Environ. Microbiol., 2014, 16, 255-264.
14. J. T. Keltjens, A. Pol, J. Reimann and H. J. M. Op den Camp, Appl. Microbiol. Biot., 2014, 98, 6163-6183.
15. N. C. Martinez-Gomez, H. N. Vu and E. Skovran, Inorg. Chem., 2016, 55, 10083-10089.
16. H. Lumpe, A. Pol, H. J. M. Op den Camp and L. J. Daumann, Dalton Trans., 2018, 47, 10463-10472.
17. L. J. Daumann, Angew. Chem. Int. Edit., 2019, 58, 12795-12802.
18. J. A. Bogart, A. J. Lewis and E. J. Schelter, Chem-Eur J, 2015, 21, 1743-1748.
19. W. L. Dorfner, P. J. Carroll and E. J. Schelter, Org. Lett., 2015, 17, 1850-1853.
20. J. A. Cotruvo, ACS Cent. Sci., 2019, 5, 1496-1506. 21. L. F. Druding, J. D. Corbett and B. N. Ramsey, Inorg.
Chem., 1963, 2, 869-871.
22. R. A. Sallach and J. D. Corbett, Inorg. Chem., 1963, 2, 457-459.
23. L. F. Druding and J. D. Corbett, J. Am. Chem. Soc., 1959, 81, 5512-5512.
24. J. D. Corbett and B. C. McCollum, Inorg. Chem., 1966, 5, 938-940.
25. D. A. Lokken and J. D. Corbett, Inorg. Chem., 1973, 12, 556-559.
26. U. Loechner and J. D. Corbett, Inorg. Chem., 1975, 14, 426-428.
27. G. Meyer, Chem. Rev., 1988, 88, 93-107. 28. T. Schleid and G. Meyer, Inorg. Chim. Acta, 1987, 140,
113-116. 29. G. Meyer, Prog. Solid State Ch., 1982, 14, 141-219. 30. S. Hammerich, I. Pantenburg and G. Meyer, Z. Anorg. Allg.
Chem., 2006, 632, 2181-2183. 31. S. Hammerich, I. Pantenburg and G. Meyer, Z. Anorg. Allg.
Chem., 2006, 632, 1487-1490. 32. G. Meyer and H. J. Meyer, Chem. Mater., 1992, 4, 1157-
1168. 33. C. Felser, K. Ahn, R. K. Kremer, R. Seshadri and A. Simon, J.
Solid State Chem., 1999, 147, 19-25. 34. F. G. N. Cloke, Chem. Soc. Rev., 1993, 22, 17-24. 35. J. G. Brennan, F. G. N. Cloke, A. A. Sameh and A. Zalkin, J.
Chem. Soc. Chem. Comm., 1987, 1668-1669. 36. D. M. Anderson, F. G. N. Cloke, P. A. Cox, N. Edelstein, J. C.
Green, T. Pang, A. A. Sameh and G. Shalimoff, J. Chem. Soc. Chem. Comm., 1989, 53-55.
37. F. G. N. Cloke, K. Khan and R. N. Perutz, J. Chem. Soc. Chem. Comm., 1991, 1372-1373.
38. P. L. Arnold, F. Geoffrey N. Cloke and P. B. Hitchcock, Chem. Commun., 1997, 481-482.
39. P. L. Arnold, M. A. Petrukhina, V. E. Bochenkov, T. I. Shabatina, V. V. Zagorskii, G. B. Sergeev and F. G. N. Cloke, J. Organomet. Chem., 2003, 688, 49-55.
40. M. N. Bochkarev, I. L. Fedushkin, A. A. Fagin, T. V. Petrovskaya, J. W. Ziller, R. N. R. Broomhall-Dillard and W. J. Evans, Angew. Chem. Int. Edit., 1997, 36, 133-135.
41. W. J. Evans, N. T. Allen and J. W. Ziller, J. Am. Chem. Soc., 2000, 122, 11749-11750.
42. M. N. Bochkarev, I. L. Fedushkin, S. Dechert, A. A. Fagin and H. Schumann, Angew. Chem. Int. Edit., 2001, 40, 3176-3178.
43. M. N. Bochkarev and A. A. Fagin, Chem-Eur J, 1999, 5, 2990-2992.
44. P. L. Arnold, F. Geoffrey N. Cloke and J. F. Nixon, Chem. Commun., 1998, 797-798.
45. P. B. Hitchcock, M. F. Lappert, L. Maron and A. V. Protchenko, Angew. Chem. Int. Edit., 2008, 47, 1488-1491.
46. M. R. MacDonald, J. W. Ziller and W. J. Evans, J. Am. Chem. Soc., 2011, 133, 15914-15917.
47. M. R. MacDonald, J. E. Bates, J. W. Ziller, F. Furche and W. J. Evans, J. Am. Chem. Soc., 2013, 135, 9857-9868.
48. M. R. MacDonald, M. E. Fieser, J. E. Bates, J. W. Ziller, F. Furche and W. J. Evans, J. Am. Chem. Soc., 2013, 135, 13310-13313.
49. R. R. Langeslay, M. E. Fieser, J. W. Ziller, F. Furche and W. J. Evans, Chem. Sci., 2015, 6, 517-521.
50. M. E. Fieser, M. R. MacDonald, B. T. Krull, J. E. Bates, J. W. Ziller, F. Furche and W. J. Evans, J. Am. Chem. Soc., 2015, 137, 369-382.
Page 34 of 43Dalton Transactions
Journal Name ARTICLE
This journal is © The Royal Society of Chemistry 20xx J. Name., 2013, 00, 1-3 | 35
Please do not adjust margins
Please do not adjust margins
51. K. R. Meihaus, M. E. Fieser, J. F. Corbey, W. J. Evans and J. R. Long, J. Am. Chem. Soc., 2015, 137, 9855-9860.
52. C. J. Windorff, M. R. MacDonald, K. R. Meihaus, J. W. Ziller, J. R. Long and W. J. Evans, Chem-Eur J, 2016, 22, 772-782.
53. D. H. Woen, G. P. Chen, J. W. Ziller, T. J. Boyle, F. Furche and W. J. Evans, Angew. Chem. Int. Edit., 2017, 56, 2050-2053.
54. C. J. Windorff, G. P. Chen, J. N. Cross, W. J. Evans, F. Furche, A. J. Gaunt, M. T. Janicke, S. A. Kozimor and B. L. Scott, J. Am. Chem. Soc., 2017, 139, 3970-3973.
55. M. E. Fieser, M. G. Ferrier, J. Su, E. Batista, S. K. Cary, J. W. Engle, W. J. Evans, J. S. Lezama Pacheco, S. A. Kozimor, A. C. Olson, A. J. Ryan, B. W. Stein, G. L. Wagner, D. H. Woen, T. Vitova and P. Yang, Chem. Sci., 2017, 8, 6076-6091.
56. M. E. Fieser, C. T. Palumbo, H. S. La Pierre, D. P. Halter, V. K. Voora, J. W. Ziller, F. Furche, K. Meyer and W. J. Evans, Chem. Sci., 2017, 8, 7424-7433.
57. D. N. Huh, L. E. Darago, J. W. Ziller and W. J. Evans, Inorg. Chem., 2018, 57, 2096-2102.
58. A. J. Ryan, L. E. Darago, S. G. Balasubramani, G. P. Chen, J. W. Ziller, F. Furche, J. R. Long and W. J. Evans, Chem-Eur J, 2018, 24, 7702-7709.
59. J. Su, C. J. Windorff, E. R. Batista, W. J. Evans, A. J. Gaunt, M. T. Janicke, S. A. Kozimor, B. L. Scott, D. H. Woen and P. Yang, J. Am. Chem. Soc., 2018, 140, 7425-7428.
60. D. H. Woen, D. N. Huh, J. W. Ziller and W. J. Evans, Organometallics, 2018, 37, 3055-3063.
61. D. N. Huh, J. W. Ziller and W. J. Evans, Inorg. Chem., 2018, 57, 11809-11814.
62. C. T. Palumbo, D. P. Halter, V. K. Voora, G. P. Chen, J. W. Ziller, M. Gembicky, A. L. Rheingold, F. Furche, K. Meyer and W. J. Evans, Inorg. Chem., 2018, 57, 12876-12884.
63. T. F. Jenkins, D. H. Woen, L. N. Mohanam, J. W. Ziller, F. Furche and W. J. Evans, Organometallics, 2018, 37, 3863-3873.
64. S. A. Moehring, M. J. Beltrán-Leiva, D. Páez-Hernández, R. Arratia-Pérez, J. W. Ziller and W. J. Evans, Chem-Eur J, 2018, 24, 18059-18067.
65. D. N. Huh, J. W. Ziller and W. J. Evans, Dalton Trans., 2018, 47, 17285-17290.
66. A. J. Ryan, M. A. Angadol, J. W. Ziller and W. J. Evans, Chem. Commun., 2019, 55, 2325-2327.
67. M. A. Angadol, D. H. Woen, C. J. Windorff, J. W. Ziller and W. J. Evans, Organometallics, 2019, 38, 1151-1158.
68. S. A. Moehring and W. J. Evans, Chem-Eur J, 2020, 26, 1530-1534.
69. S. A. Moehring, M. Miehlich, C. J. Hoerger, K. Meyer, J. W. Ziller and W. J. Evans, Inorg. Chem., 2020, 59, 3207-3214.
70. H. S. La Pierre, H. Kameo, D. P. Halter, F. W. Heinemann and K. Meyer, Angew. Chem. Int. Edit., 2014, 53, 7154-7157.
71. H. S. La Pierre, A. Scheurer, F. W. Heinemann, W. Hieringer and K. Meyer, Angew. Chem. Int. Edit., 2014, 53, 7158-7162.
72. B. S. Billow, B. N. Livesay, C. C. Mokhtarzadeh, J. McCracken, M. P. Shores, J. M. Boncella and A. L. Odom, J. Am. Chem. Soc., 2018, 140, 17369-17373.
73. R. P. Kelly, L. Maron, R. Scopelliti and M. Mazzanti, Angew. Chem. Int. Edit., 2017, 56, 15663-15666.
74. C. A. Gould, K. R. McClain, J. M. Yu, T. J. Groshens, F. Furche, B. G. Harvey and J. R. Long, J. Am. Chem. Soc., 2019, 141, 12967-12973.
75. F.-S. Guo, N. Tsoureas, G.-Z. Huang, M.-L. Tong, A. Mansikkamäki and R. A. Layfield, Angew. Chem. Int. Edit., 2020, 59, 2299-2303.
76. J. D. Martin and J. D. Corbett, Angew. Chem. Int. Edit., 1995, 34, 233-235.
77. P. L. Arnold, F. G. N. Cloke, P. B. Hitchcock and J. F. Nixon, J. Am. Chem. Soc., 1996, 118, 7630-7631.
78. N. A. Piro, J. R. Robinson, P. J. Walsh and E. J. Schelter, Coordin. Chem. Rev., 2014, 260, 21-36.
79. D. Schädle and R. Anwander, Chem. Soc. Rev., 2019, 48, 5752-5805.
80. L. R. Morss, Chem. Rev., 1976, 76, 827-841. 81. S. Bratsch and H. B. Silber, Inorg. Chim. Acta, 1982, 65,
L53-L55. 82. E. J. Huber and C. E. Holley, J. Am. Chem. Soc., 1953, 75,
5645-5647. 83. F. B. Baker and C. E. Holley, J. Chem. Eng. Data., 1968, 13,
405-407. 84. F. A. Kuznetsov, T. N. Rezukhina and A. N. Gobulenko,
Russ. J. Phys. Chem., 1960, 34, 1010. 85. F. A. Kuznetsov, V. I. Belyi, T. N. Rezykhina and Y. I.
Gerasimov, Dokl. Akad. Nauk SSSR, 1961, 139, 1405. 86. L. R. Morss and R. J. M. Konings, in Binary Rare Earth
Oxides, eds. G. Adachi, N. Imanaka and Z. C. Kang, Springer Netherlands, Dordrecht, 2004, pp. 163-188.
87. R. J. M. Konings, O. Beneš, A. Kovács, D. Manara, D. Sedmidubský, L. Gorokhov, V. S. Iorish, V. Yungman, E. Shenyavskaya and E. Osina, J. Phys. Chem. Ref. Data., 2014, 43, 013101.
88. L. Eyring, H. R. Lohr and B. B. Cunningham, J. Am. Chem. Soc., 1952, 74, 1186-1190.
89. S. A. Gramsch and L. R. Morss, J. Chem. Thermodyn., 1995, 27, 551-560.
90. G. C. Fitzgibbon and C. E. Holley, J. Chem. Eng. Data., 1968, 13, 63-65.
91. C. T. Stubblefield, H. Eick and L. Eyring, J. Am. Chem. Soc., 1956, 78, 3877-3879.
92. J. K. Gibson and R. G. Haire, J. Solid State Chem., 1988, 73, 524-530.
93. J. K. Gibson and R. G. Haire, Thermochim. Acta, 1988, 133, 241-246.
94. G. Beskow, Geologiska Föreningen i Stockholm Förhandlingar, 1924, 46, 738-743.
95. Y. Hinatsu and Y. Doi, J. Alloy. Compd., 2006, 418, 155-160.
96. J. E. Fiscus and H.-C. zur Loye, J. Alloy. Compd., 2000, 306, 141-145.
97. Y. Hinatsu, M. Itoh and N. Edelstein, J. Solid State Chem., 1997, 132, 337-341.
98. K. Fulle, L. D. Sanjeewa, C. D. McMillen, Y. Wen, A. C. Rajamanthrilage, J. N. Anker, G. Chumanov and J. W. Kolis, Inorg. Chem., 2017, 56, 6044-6047.
99. J. D. McCullough, J. Am. Chem. Soc., 1950, 72, 1386-1390. 100. K. Momma and F. Izumi, Journal of Applied
Crystallography, 2008, 41, 653-658. 101. M. Hellenbrandt, Crystallography Reviews, 2004, 10, 17-
22. 102. S. G. Minasian, J. M. Keith, E. R. Batista, K. S. Boland, J. A.
Bradley, S. R. Daly, S. A. Kozimor, W. W. Lukens, R. L.
Page 35 of 43 Dalton Transactions
ARTICLE Journal Name
36 | J. Name., 2012, 00, 1-3 This journal is © The Royal Society of Chemistry 20xx
Please do not adjust margins
Please do not adjust margins
Martin, D. Nordlund, G. T. Seidler, D. K. Shuh, D. Sokaras, T. Tyliszczak, G. L. Wagner, T.-C. Weng and P. Yang, J. Am. Chem. Soc., 2013, 135, 1864-1871.
103. S. V. Ushakov, J. Cheng, A. Navrotsky, J. R. Wu and S. M. Haile, MRS Proceedings, 2002, 718, D7.17.
104. E. H. P. Cordfunke, A. S. Booij and M. E. Huntelaar, J. Chem. Thermodyn., 1998, 30, 437-447.
105. J. Goudiakas, R. G. Haire and J. Fuger, J. Chem. Thermodyn., 1990, 22, 577-587.
106. T. Matsui, Thermochim. Acta, 1995, 253, 155-165. 107. P. Santini, S. Carretta, G. Amoretti, R. Caciuffo, N.
Magnani and G. H. Lander, Rev. Mod. Phys., 2009, 81, 807-863.
108. L. Zhou, X. Li, Z. Yao, Z. Chen, M. Hong, R. Zhu, Y. Liang and J. Zhao, Sci. Rep-UK, 2016, 6, 23900.
109. T. Montini, M. Melchionna, M. Monai and P. Fornasiero, Chem. Rev., 2016, 116, 5987-6041.
110. P. Xiao, R. C. Davis, X. Ouyang, J. Li, A. Thomas, S. L. Scott and J. Zhu, Catal. Commun., 2014, 50, 69-72.
111. D. C. Grinter, S. D. Senanayake and J. I. Flege, Appl. Catal. B-Environ, 2016, 197, 286-298.
112. C. Ratnasamy and J. P. Wagner, Catal. Rev., 2009, 51, 325-440.
113. W. Klemm and P. Henkel, Z. Anorg. Allg. Chem., 1934, 220, 180-182.
114. H. von Wartenberg, Z. Anorg. Allg. Chem., 1940, 244, 337-347.
115. B. B. Cunningham, D. C. Feay and M. A. Rollier, J. Am. Chem. Soc., 1954, 76, 3361-3363.
116. V. I. Spitzin, L. I. Martynenko and J. U. M. Kiselew, Z. Anorg. Allg. Chem., 1982, 495, 39-51.
117. E. W. Kaiser, W. A. Sunder and W. E. Falconer, J. Less Common Met., 1972, 27, 383-387.
118. T. P. Perros and C. R. Naeser, J. Am. Chem. Soc., 1952, 74, 3694-3695.
119. A. I. Popov and G. Glockler, J. Am. Chem. Soc., 1952, 74, 1357-1358.
120. J. Soriano, M. Givon and J. Shamir, Inorg. Nucl. Chem. Lett., 1966, 2, 13-14.
121. Z. Mazej, J. Fluorine. Chem., 2002, 118, 127-129. 122. G. Meyer and L. R. Morss, Synthesis of Lanthanide and
Actinide Compounds, Springer Netherlands. 123. H. A. Pagel and P. H. M. P. Brinton, J. Am. Chem. Soc.,
1929, 51, 42-54. 124. D. M. Gruen, W. C. Koehler and J. J. Katz, J. Am. Chem.
Soc., 1951, 73, 1475-1479. 125. R. Wolf and R. Hoppe, Z. Anorg. Allg. Chem., 1988, 556,
97-108. 126. G. Cao, T. Yuen, P. Pernambuco-Wise, J. E. Crow, J. W.
O’Reilly, M. V. Kuric, R. P. Guertin, N. Rosov and J. W. Lynn, J. Appl. Phys., 1991, 70, 6332-6334.
127. D. J. Goossens, R. A. Robinson and M. T. F. Telling, Physica B, 2004, 352, 105-110.
128. B. C. Tofield, A. J. Jacobson and B. E. F. Fender, J. Phys. C Solid State, 1972, 5, 2887-2895.
129. C. S. Knee, A. Magrasó, T. Norby and R. I. Smith, J. Mater. Chem., 2009, 19, 3238-3247.
130. M. Bickel, G. L. Goodman, L. Soderholm and B. Kanellakopulos, J. Solid State Chem., 1988, 76, 178-185.
131. S. Majumdar, M. R. Lees, G. Balakrishnan and D. M. Paul, J. Phys-Condens. Mat., 2003, 15, 7585-7590.
132. J. Hernández-Velasco, J. Magn. Magn. Mater., 2007, 310, 1669-1671.
133. Y. Hinatsu, J. Solid State Chem., 1997, 128, 228-232. 134. R. Wolf and R. Hoppe, Z. Anorg. Allg. Chem., 1985, 522,
39-47. 135. H. Brunn and R. Hoppe, Z. Anorg. Allg. Chem., 1977, 430,
144-154. 136. E. Paletta and R. Hoppe, Naturwissenschaften, 1966, 53,
611-612. 137. H. Brunn and R. Hoppe, Z. Anorg. Allg. Chem., 1977, 433,
189-199. 138. L. B. Asprey and T. K. Keenan, J. Inorg. Nucl. Chem., 1961,
16, 260-262. 139. A. Oudahmane, M. El-Ghozzi, L. Jouffret and D. Avignant,
J. Solid State Chem., 2015, 232, 73-78. 140. R. Hoppe and W. Liebe, Z. Anorg. Allg. Chem., 1961, 313,
221-227. 141. R. Hoppe, in Inorganic Solid Fluorides, ed. P. Hagenmuller,
Academic Press, 1985, pp. 275-307. 142. L. B. Asprey, J. S. Coleman and M. J. Reisfeld, in
Lanthanide/Actinide Chemistry, American Chemical Society, 1967, vol. 71, ch. 9, pp. 122-126.
143. T. P. Perros, T. R. Munson and C. R. Naeser, Journal of Chemical Education, 1953, 30, 402.
144. V. I. Spitsyn, Y. M. Kiselev, L. I. Martynenko, V. N. Prusakov and V. B. Sokolov, Doklady Akademii Nauk SSSR, 1974, 219, 621-624.
145. R. Hoppe, Angew. Chem. Int. Edit., 1981, 20, 63-87. 146. S. Voigt and R. Hoppe, J. Less Common Met., 1989, 156,
97-104. 147. R. L. N. Sastry, P. N. Mehrotra and C. N. R. Rao, J. Inorg.
Nucl. Chem., 1966, 28, 2167-2173. 148. M. Gasgnier, G. Schiffmacher, L. Albert, P. E. Caro, H.
Dexpert, J. M. Esteva, C. Blancard and R. C. Karnatak, J. Less Common Met., 1989, 156, 59-73.
149. L. Eyring, in Handbook on the Physics and Chemistry of Rare Earths, Elsevier, 1979, vol. 3, pp. 337-399.
150. W. Prandtl and G. Rieder, Z. Anorg. Allg. Chem., 1938, 238, 225-235.
151. Y. Doi, K. Ninomiya, Y. Hinatsu and K. Ohoyama, J. Phys-Condens. Mat., 2005, 17, 4393-4401.
152. R. Hoppe and W. Lidecke, Naturwissenschaften, 1962, 49, 255-255.
153. R. Hoppe and K. Seeger, Naturwissenschaften, 1968, 55, 297-297.
154. Y. Hinatsu, J. Solid State Chem., 1992, 100, 136-140. 155. Y. Hinatsu, J. Alloy. Compd., 1993, 193, 113-115. 156. M. Guillot, M. El Ghozzi, D. Avignant and G. Ferey, Cr.
Acad. Sci. II, 1991, 313, 1141-1147. 157. M. Guillot, M. El-Ghozzi, D. Avignant and G. Ferey, J. Solid
State Chem., 1992, 97, 400-404. 158. M. Josse, M. El-Ghozzi, D. Avignant, G. André and F.
Bourée, J. Solid State Chem., 2007, 180, 1623-1635. 159. Y. Laligant, A. Le Bail, G. Ferey, D. Avignant and J. C.
Cousseins, Eur. J. Sol. State Inorg., 1988, 25, 551-563. 160. M. El-Ghozzi, D. Avignant and J. C. Cousseins, Eur. J. Sol.
State Inorg., 1992, 29, 981-992. 161. M. Josse, M. El-Ghozzi, D. Avignant, G. André, F. Bourée
and O. Isnard, J. Solid State Chem., 2012, 185, 229-237. 162. M. Josse, M. Dubois, M. El-Ghozzi, J. Cellier and D.
Avignant, Acta Crystallogr. B, 2005, 61, 1-10.
Page 36 of 43Dalton Transactions
Journal Name ARTICLE
This journal is © The Royal Society of Chemistry 20xx J. Name., 2013, 00, 1-3 | 37
Please do not adjust margins
Please do not adjust margins
163. E. Largeau and M. El-Ghozzi, J. Fluorine. Chem., 1998, 89, 223-228.
164. M. Josse, M. El-Ghozzi, M. Dubois, D. Avignant, G. André and F. Bourée, Physica B, 2004, 350, E43-E45.
165. V. Gaumet and D. Avignant, Acta Crystallogr. C, 1997, 53, 1176-1178.
166. A. V. Vologzhanina, D. V. Pushkin and V. N. Serezhkin, Russ. J. Inorg. Chem., 2006, 51, 747-758.
167. M. El-Ghozzi and D. Avignant, J. Fluorine. Chem., 2001, 107, 229-233.
168. Y. Ying and Y. Ru-Dong, Polyhedron, 1992, 11, 963-966. 169. R. Wolf and R. Hoppe, Z. Anorg. Allg. Chem., 1986, 539,
127-140. 170. S. Voigt, R. Werthmann and R. Hoppe, Z. Anorg. Allg.
Chem., 1989, 574, 65-78. 171. S. Quezel-Ambrunaz and E. F. Bertaut, Solid State
Commun., 1972, 11, 605-610. 172. J. K. Marsh, J. Chem. Soc., 1946, 15-17. 173. D. Avignant, E. Largeau, V. Gaumet, P. Dugat and M. El-
Ghozzi, J. Alloy. Compd., 1998, 275-277, 1-5. 174. R. Hoppe, Angewandte Chemie, 1959, 71, 457-457. 175. V. Gaumet, E. Largeau and D. Avignant, Eur. J. Sol. State
Inorg., 1997, 34, 1075-1084. 176. R. Hoppe and K.-M. Rödder, Z. Anorg. Allg. Chem., 1961,
312, 277-281. 177. M. Josse, M. Dubois, M. El-Ghozzi, D. Avignant, G. André,
F. Bourée and M. Guillot, J. Alloy. Compd., 2004, 374, 207-212.
178. M. Guillot, M. El-Ghozzi, D. Avignant and G. Ferey, J. Appl. Phys., 1993, 73, 5389-5390.
179. J. H. Burns, H. A. Levy and O. L. Keller, Acta. Cryst. , 1968, B24, 1675.
180. J.-P. Laval and R. Mayet, Acta Crystallogr. C, 2018, 74, 229-235.
181. J.-P. Laval and R. Mayet, Acta Crystallogr. C, 2018, 74, 229-235.
182. E. Largeau, V. Gaumet, M. El-Ghozzi, D. Avignant and J. C. Cousseins, J. Mater. Chem., 1997, 7, 1881-1885.
183. P. Kroeschell, R. Wolf and R. Hoppe, Z. Anorg. Allg. Chem., 1986, 536, 81-91.
184. A. J. Jacobson, B. C. Tofield and B. E. F. Fender, Acta Crystallogr. B-Stru, 1972, 28, 956-961.
185. E. Banks, S. J. La Placa, W. Kunnmann, L. M. Corliss and J. M. Hastings, Acta Crystallogr. B, 1972, 28, 3429-3430.
186. K. Tezuka, Y. Hinatsu, Y. Shimojo and Y. Morii, J. Phys-Condens. Mat., 1998, 10, 11703-11712.
187. W. T. Fu, D. Visser and D. J. W. Ijdo, J. Solid State Chem., 2002, 165, 393-396.
188. W. T. Fu, D. Visser, K. S. Knight and D. J. W. Ijdo, J. Solid State Chem., 2004, 177, 1667-1671.
189. K. S. Knight, Solid State Ionics, 1994, 74, 109-117. 190. R. Horyń, M. Wołcyrz and Z. Bukowski, J. Solid State
Chem., 1996, 124, 176-181. 191. E. Danielson, M. Devenney, D. M. Giaquinta, J. H. Golden,
R. C. Haushalter, E. W. McFarland, D. M. Poojary, C. M. Reaves, W. H. Weinberg and X. D. Wu, Journal of Molecular Structure, 1998, 470, 229-235.
192. G. Morrison, N. R. Spagnuolo, S. G. Karakalos and H.-C. zur Loye, Inorg. Chem., 2019, 58, 8702-8709.
193. Z. Hu, G. Kaindl, D. Vandré, R. Hoppe and G. Wortmann, J. Alloy. Compd., 1994, 205, 263-269.
194. G. Brauer and H. Kristen, Z. Anorg. Allg. Chem., 1980, 462, 35-41.
195. L. Soderholm, L. R. Morss and M. F. Mohar, J. Less Common Met., 1987, 127, 131-135.
196. D. Han, T. Uda, Y. Nose, T. Okajima, H. Murata, I. Tanaka and K. Shinoda, Adv. Mater., 2012, 24, 2051-2053.
197. N. Rosov, J. W. Lynn, Q. Lin, G. Cao, J. W. O’Reilly, P. Pernambuco-Wise and J. E. Crow, Phys. Rev. B, 1992, 45, 982-986.
198. S. Kern, C. K. Loong and G. H. Lander, Phys. Rev. B, 1985, 32, 3051-3057.
199. A. Kebede, C. S. Jee, J. Schwegler, J. E. Crow, T. Mihalisin, G. H. Myer, R. E. Salomon, P. Schlottmann, M. V. Kuric, S. H. Bloom and R. P. Guertin, Phys. Rev. B, 1989, 40, 4453-4462.
200. Y. Dalichaouch, M. S. Torikachvili, E. A. Early, B. W. Lee, C. L. Seaman, K. N. Yang, H. Zhou and M. B. Maple, Solid State Commun., 1988, 65, 1001-1006.
201. E. E. Alp, L. Soderholm, G. K. Shenoy, D. G. Hinks, B. W. Veal and P. A. Montano, Physica B & C, 1988, 150, 74-79.
202. L. Soderholm and G. L. Goodman, J. Solid State Chem., 1989, 81, 121-128.
203. L. Soderholm, C. K. Loong, G. L. Goodman and B. D. Dabrowski, Phys. Rev. B, 1991, 43, 7923-7935.
204. U. Staub, L. Soderholm, S. R. Wasserman, A. G. O. Conner, M. J. Kramer, B. D. Patterson, M. Shi and M. Knapp, Phys. Rev. B, 2000, 61, 1548-1554.
205. S. Kern, C. K. Loong, J. Faber and G. H. Lander, Solid State Commun., 1984, 49, 295-298.
206. C. H. Gardiner, A. T. Boothroyd, P. Pattison, M. J. McKelvy, G. J. McIntyre and S. J. S. Lister, Phys. Rev. B, 2004, 70, 024415.
207. C. H. Gardiner, A. T. Boothroyd, M. J. McKelvy, G. J. McIntyre and K. Prokeš, Phys. Rev. B, 2004, 70, 024416.
208. C. H. Webster, L. M. Helme, A. T. Boothroyd, D. F. McMorrow, S. B. Wilkins, C. Detlefs, B. Detlefs, R. I. Bewley and M. J. McKelvy, Phys. Rev. B, 2007, 76, 134419.
209. K. C. Turberfield, L. Passell, R. J. Birgeneau and E. Bucher, J. Appl. Phys., 1971, 42, 1746-1754.
210. G. Bevilacqua, D. Ippolito and L. Martinelli, Phys. Rev. B, 2004, 69, 155208.
211. J. Jensen, Phys. Rev. B, 2007, 76, 144428. 212. N. Magnani, P. Santini, G. Amoretti, R. Caciuffo, P.
Javorský, F. Wastin, J. Rebizant and G. H. Lander, Physica B, 2005, 359-361, 1087-1089.
213. N. Magnani, P. Santini, G. Amoretti and R. Caciuffo, Phys. Rev. B, 2005, 71, 054405.
214. T. Vent-Schmidt and S. Riedel, Inorg. Chem., 2015, 54, 11114-11120.
215. T. Vent-Schmidt, Z. Fang, Z. Lee, D. Dixon and S. Riedel, Chem-Eur J, 2016, 22, 2406-2416.
216. X. Wang, L. Andrews, Z. Fang, K. S. Thanthiriwatte, M. Chen and D. A. Dixon, J. Phys. Chem. A, 2017, 121, 1779-1796.
217. T. Mikulas, M. Chen, D. A. Dixon, K. A. Peterson, Y. Gong and L. Andrews, Inorg. Chem., 2014, 53, 446-456.
218. A. F. Lucena, C. Lourenço, M. C. Michelini, P. X. Rutkowski, J. M. Carretas, N. Zorz, L. Berthon, A. Dias, M. Conceição Oliveira, J. K. Gibson and J. Marçalo, Phys. Chem. Chem. Phys., 2015, 17, 9942-9950.
219. S. P. Willson and L. Andrews, J. Phys. Chem. A, 1999, 103, 3171-3183.
Page 37 of 43 Dalton Transactions
ARTICLE Journal Name
38 | J. Name., 2012, 00, 1-3 This journal is © The Royal Society of Chemistry 20xx
Please do not adjust margins
Please do not adjust margins
220. J. Su, S. Hu, W. Huang, M. Zhou and J. Li, Sci. China Chem., 2016, 59, 442-451.
221. P. D. Dau, M. Vasiliu, K. A. Peterson, D. A. Dixon and J. K. Gibson, Chem-Eur J, 2017, 23, 17369-17378.
222. B. Monteiro, N. A. G. Bandeira, C. Lourenço, A. F. Lucena, J. M. Carretas, J. K. Gibson and J. Marçalo, Chem. Commun., 2019, 55, 14139-14142.
223. A. Kovács, P. D. Dau, J. Marçalo and J. K. Gibson, Inorg. Chem., 2018, 57, 9453-9467.
224. S.-X. Hu, J. Jian, J. Su, X. Wu, J. Li and M. Zhou, Chem. Sci., 2017, 8, 4035-4043.
225. H. L. Conley, USAEC UCRL-9332, 1960, 46. 226. W. M. Latimer, Oxidation Potentials, Prentice Hall, New
Jersey, 1952. 227. L. B. Asprey and B. B. Cunningham, Prog. Inorg. Chem.,
1960, 2, 267. 228. B. B. Cunningham, Comparative Chemistry of the
Lanthanide and Actinide Elements pp. 64-81, 1959, Paper presented at the XVII International Congress of Pure and Applied Chemistry, Munich
229. L. J. Nugent, R. D. Baybarz, J. L. Burnett and J. L. Ryan, J. Inorg. Nucl. Chem., 1971, 33, 2503-2530.
230. S. Pajakoff, Monatsh. Chem. Verw. Tl., 1963, 94, 482-496. 231. N. G. Bogdanovic, N. I. Pechurova, V. I. Spitsyn and L. I.
Martynenko, Zh. Neorg. Kim., 1970, 15, 2145. 232. B. F. Myasoedov, I. A. Lebedev, V. M. Mikhaliv and V. Y.
Frenkel, Radiochem. Radioanal. Lett., 1974, 17, 359. 233. D. E. Hobart, PhD Thesis, University of Tennessee, 1981. 234. D. E. Hobart, K. Samhoun, J. P. Young, V. E. Norvell, G.
Mamantov and J. R. Peterson, Inorg. Nucl. Chem. Lett., 1980, 16, 321-328.
235. P. G. Varlashkin, G. M. Begun and J. R. Peterson, J. Less Common Met., 1985, 109, 123-134.
236. H. D. E, S. K and P. J. R, Radiochimica Acta, 1982, 31, 139-146.
237. G. F. Payne and J. R. Peterson, J. Less Common Met., 1986, 126, 371-377.
238. X. Li, W. Dong, Y. Qi, D. Wang and R. Yang, Polyhedron, 1991, 10, 1479-1483.
239. X. Li and R. Yang, Acta Chim. Sinica, 1987, 45, 432-438. 240. W. Dong and R. Yang, Acta Chim. Sinica, 1986, 44, 563-
567. 241. R. D. Yang, J. M. Liu and T. R. Ma, Chem. J. Chin. Univ.,
1982, 153. 242. A. S. Saprykin, V. I. Spitsyn and N. N. Krot, Doke. Akad.
Nauk SSSR, 1976, 231, 150. 243. S. M. Hua and R. D. Yang, Chem. J. Chin. Univ., 1980, 573. 244. S. R. Sofen, S. R. Cooper and K. N. Raymond, Inorg. Chem.,
1979, 18, 1611-1616. 245. G. J. P. Deblonde, M. Sturzbecher-Hoehne and R. J.
Abergel, Inorg. Chem., 2013, 52, 8805-8811. 246. G. J. P. Deblonde, M. Sturzbecher-Hoehne, P. B. Rupert, D.
D. An, M.-C. Illy, C. Y. Ralston, J. Brabec, W. A. de Jong, R. K. Strong and R. J. Abergel, Nat. Chem., 2017, 9, 843-849.
247. G. J. P. Deblonde, A. Ricano and R. J. Abergel, Nat. Commun., 2019, 10, 2438.
248. T. A. Pham, A. B. Altman, S. C. E. Stieber, C. H. Booth, S. A. Kozimor, W. W. Lukens, D. T. Olive, T. Tyliszczak, J. Wang, S. G. Minasian and K. N. Raymond, Inorg. Chem., 2016, 55, 9989-10002.
249. L. R. Morss and J. Fuger, J. Inorg. Nucl. Chem., 1981, 43, 2059-2064.
250. J. E. Kim, J. A. Bogart, P. J. Carroll and E. J. Schelter, Inorg. Chem., 2016, 55, 775-784.
251. M. Gregson, E. Lu, D. P. Mills, F. Tuna, E. J. L. McInnes, C. Hennig, A. C. Scheinost, J. McMaster, W. Lewis, A. J. Blake, A. Kerridge and S. T. Liddle, Nat. Commun., 2017, 8, 14137.
252. W. Noh and G. S. Girolami, Polyhedron, 2007, 26, 3865-3870.
253. N. M. Edelstein, P. G. Allen, J. J. Bucher, D. K. Shuh, C. D. Sofield, N. Kaltsoyannis, G. H. Maunder, M. R. Russo and A. Sella, J. Am. Chem. Soc., 1996, 118, 13115-13116.
254. M. D. Walter, C. H. Booth, W. W. Lukens and R. A. Andersen, Organometallics, 2009, 28, 698-707.
255. C. Apostolidis, O. Walter, J. Vogt, P. Liebing, L. Maron and F. T. Edelmann, Angew. Chem. Int. Edit., 2017, 56, 5066-5070.
256. A. Streitwieser and U. Mueller-Westerhoff, J. Am. Chem. Soc., 1968, 90, 7364-7364.
257. A. Zalkin and K. N. Raymond, J. Am. Chem. Soc., 1969, 91, 5667-5668.
258. V. Lorenz, P. Liebing, M. Böhme, A. Buchholz, W. Plass, N. Geue, L. Hilfert, S. Busse, F. Engelhardt, C. G. Hrib and F. T. Edelmann, Eur. J. Inorg. Chem., 2017, 2017, 4840-4849.
259. N. T. Rice, I. A. Popov, D. R. Russo, T. P. Gompa, A. Ramanathan, J. Bacsa, E. R. Batista, P. Yang and H. S. La Pierre, Chem. Sci., 2020, DOI: 10.1039/D1030SC01414A.
260. C. T. Palumbo, I. Zivkovic, R. Scopelliti and M. Mazzanti, J. Am. Chem. Soc., 2019, 141, 9827-9831.
261. A. R. Willauer, C. T. Palumbo, R. Scopelliti, I. Zivkovic, I. Douair, L. Maron and M. Mazzanti, Angew. Chem. Int. Edit., 2020, 59, 3549-3553.
262. A. R. Willauer, C. T. Palumbo, F. Fadaei-Tirani, I. Zivkovic, I. Douair, L. Maron and M. Mazzanti, J. Am. Chem. Soc., 2020, 142, 5538-5542.
263. M. K. Assefa, D.-C. Sergentu, L. A. Seaman, G. Wu, J. Autschbach and T. W. Hayton, Inorg. Chem., 2019, 58, 12654-12661.
264. E. M. Broderick, P. S. Thuy-Boun, N. Guo, C. S. Vogel, J. Sutter, J. T. Miller, K. Meyer and P. L. Diaconescu, Inorg. Chem., 2011, 50, 2870-2877.
265. J. A. Bogart, A. J. Lewis, S. A. Medling, N. A. Piro, P. J. Carroll, C. H. Booth and E. J. Schelter, Inorg. Chem., 2013, 52, 11600-11607.
266. L. A. Solola, T. Cheisson, Q. Yang, P. J. Carroll and E. J. Schelter, Inorg. Chem., 2018, 57, 10543-10547.
267. U. J. Williams, B. D. Mahoney, A. J. Lewis, P. T. DeGregorio, P. J. Carroll and E. J. Schelter, Inorg. Chem., 2013, 52, 4142-4144.
268. J. Xu, E. Radkov, M. Ziegler and K. N. Raymond, Inorg. Chem., 2000, 39, 4156-4164.
269. N. G. Connelly and W. E. Geiger, Chem. Rev., 1996, 96, 877-910.
270. J. R. Levin, W. L. Dorfner, P. J. Carroll and E. J. Schelter, Chem. Sci., 2015, 6, 6925-6934.
271. N. T. Rice, J. Su, T. P. Gompa, D. R. Russo, J. Telser, L. Palatinus, J. Bacsa, P. Yang, E. R. Batista and H. S. La Pierre, Inorg. Chem., 2019, 58, 5289-5304.
272. R. Shannon, Acta Crystallogr. A, 1976, 32, 751-767. 273. N. T. Rice, I. A. Popov, D. R. Russo, J. Bacsa, E. R. Batista, P.
Yang, J. Telser and H. S. La Pierre, J. Am. Chem. Soc., 2019, 141, 13222-13233.
Page 38 of 43Dalton Transactions
Journal Name ARTICLE
This journal is © The Royal Society of Chemistry 20xx J. Name., 2013, 00, 1-3 | 39
Please do not adjust margins
Please do not adjust margins
274. V. A. Blatov *, Crystallography Reviews, 2004, 10, 249-318.
275. V. A. Blatov, A. P. Shevchenko and V. N. Serenzhkin, Acta Crystallogr. A, 1995, 51, 909-916.
276. M. W. Löble, J. M. Keith, A. B. Altman, S. C. E. Stieber, E. R. Batista, K. S. Boland, S. D. Conradson, D. L. Clark, J. Lezama Pacheco, S. A. Kozimor, R. L. Martin, S. G. Minasian, A. C. Olson, B. L. Scott, D. K. Shuh, T. Tyliszczak, M. P. Wilkerson and R. A. Zehnder, J. Am. Chem. Soc., 2015, 137, 2506-2523.
277. R. L. Halbach, G. Nocton, J. I. Amaro-Estrada, L. Maron, C. H. Booth and R. A. Andersen, Inorg. Chem., 2019, 58, 12083-12098.
278. C. H. Booth, M. D. Walter, M. Daniel, W. W. Lukens and R. A. Andersen, Phys. Rev. Lett., 2005, 95, 267202.
279. A. M. Shahin, F. Grandjean, G. J. Long and T. P. Schuman, Chem. Mater., 2005, 17, 315-321.
280. A. Kotani, K. O. Kvashnina, S. M. Butorin and P. Glatzel, J. Electron Spectrosc., 2011, 184, 210-215.
281. K. O. Kvashnina, S. M. Butorin and P. Glatzel, Journal of Analytical Atomic Spectrometry, 2011, 26, 1265-1272.
282. G. Kaindl, G. K. Wertheim, G. Schmiester and E. V. Sampathkumaran, Phys. Rev. Lett., 1987, 58, 606-609.
283. A. Kotani, K. Okada and M. Okada, Solid State Commun., 1987, 64, 1479-1482.
284. G. Kaindl, G. Schmiester, E. V. Sampathkumaran and P. Wachter, Phys. Rev. B, 1988, 38, 10174-10177.
285. A. Bianconi, A. Marcelli, M. Tomellini and I. Davoli, J. Magn. Magn. Mater., 1985, 47-48, 209-211.
286. A. Bianconi, A. Marcelli, H. Dexpert, R. Karnatak, A. Kotani, T. Jo and J. Petiau, Phys. Rev. B, 1987, 35, 806-812.
287. T. Jo and A. Kotani, Solid State Commun., 1985, 54, 451-456.
288. D. Malterre, Phys. Rev. B, 1991, 43, 1391-1398. 289. F. Grandjean, G. J. Long, R. Cortes, D. T. Morelli and G. P.
Meisner, Phys. Rev. B, 2000, 62, 12569-12572. 290. D. R. Modeshia, C. S. Wright, J. L. Payne, G. Sankar, S. G.
Fiddy and R. I. Walton, J. Phys. Chem. C, 2007, 111, 14035-14039.
291. J. P. Itié, F. Baudelet, A. Congeduti, B. Couzinet, F. Farges and A. Polian, J. Phys-Condens. Mat., 2005, 17, S883-S888.
292. Y. Takahashi, H. Sakami and M. Nomura, Anal. Chim. Acta, 2002, 468, 345-354.
293. Z. Hu, G. Kaindl and B. G. Müller, J. Alloy. Compd., 1997, 246, 177-185.
294. G. Kalkowski, G. Kaindl, G. Wortmann, D. Lentz and S. Krause, Phys. Rev. B, 1988, 37, 1376-1382.
295. H. Dexpert, R. C. Karnatak, J. M. Esteva, J. P. Connerade, M. Gasgnier, P. E. Caro and L. Albert, Phys. Rev. B, 1987, 36, 1750-1753.
296. S. G. Minasian, E. R. Batista, C. H. Booth, D. L. Clark, J. M. Keith, S. A. Kozimor, W. W. Lukens, R. L. Martin, D. K. Shuh, S. C. E. Stieber, T. Tylisczcak and X.-d. Wen, J. Am. Chem. Soc., 2017, 139, 18052-18064.
297. Z. Hu, S. Bertram and G. Kaindl, Phys. Rev. B, 1994, 49, 39-43.
298. Z. Hu, E.-J. Cho, G. Kaindl and B. G. Müller, Phys. Rev. B, 1995, 51, 7514-7520.
299. R. L. Halbach, G. Nocton, C. H. Booth, L. Maron and R. A. Andersen, Inorg. Chem., 2018, 57, 7290-7298.
300. J. A. Bogart, A. J. Lewis, M. A. Boreen, H. B. Lee, S. A. Medling, P. J. Carroll, C. H. Booth and E. J. Schelter, Inorg. Chem., 2015, 54, 2830-2837.
301. J. R. Robinson, Z. Gordon, C. H. Booth, P. J. Carroll, P. J. Walsh and E. J. Schelter, J. Am. Chem. Soc., 2013, 135, 19016-19024.
302. D. E. Smiles, E. R. Batista, C. H. Booth, D. L. Clark, J. M. Keith, S. A. Kozimor, R. L. Martin, S. G. Minasian, D. K. Shuh, S. C. E. Stieber and T. Tyliszczak, Chem. Sci., 2020, 11, 2796-2809.
303. G. Ganguly, D.-C. Sergentu and J. Autschbach, Chem-Eur J, 2020, 26, 1776-1788.
304. A. Kerridge and N. Kaltsoyannis, J. Phys. Chem. A, 2009, 113, 8737-8745.
305. W. Liu, M. Dolg and P. Fulde, Inorg. Chem., 1998, 37, 1067-1072.
306. P. L. Arnold, K. Wang, S. J. Gray, L. M. Moreau, C. H. Booth, M. Curcio, J. A. L. Wells and A. M. Z. Slawin, Dalton Trans., 2020, 49, 877-884.
307. Y. Yu, P. Karayaylali, S. H. Nowak, L. Giordano, M. Gauthier, W. Hong, R. Kou, Q. Li, J. Vinson, T. Kroll, D. Sokaras, C.-J. Sun, N. Charles, F. Maglia, R. Jung and Y. Shao-Horn, Chem. Mater., 2019, 31, 7864-7876.
308. J. Kolorenč and K. O. Kvashnina, MRS Advances, 2018, 3, 3143-3148.
309. S. M. Butorin, A. Modin, J. R. Vegelius, K. O. Kvashnina and D. K. Shuh, J. Phys. Chem. C, 2016, 120, 29397-29404.
310. S. M. Butorin, K. O. Kvashnina, J. R. Vegelius, D. Meyer and D. K. Shuh, Proceedings of the National Academy of Sciences, 2016, 113, 8093.
311. M. Zegke, X. Zhang, I. Pidchenko, J. A. Hlina, R. M. Lord, J. Purkis, G. S. Nichol, N. Magnani, G. Schreckenbach, T. Vitova, J. B. Love and P. L. Arnold, Chem. Sci., 2019, 10, 9740-9751.
312. T. Vitova, I. Pidchenko, D. Fellhauer, T. Pruessmann, S. Bahl, K. Dardenne, T. Yokosawa, B. Schimmelpfennig, M. Altmaier, M. Denecke, J. Rothe and H. Geckeis, Chem. Commun., 2018, 54, 12824-12827.
313. J. C. Fuggle, F. U. Hillebrecht, J. M. Esteva, R. C. Karnatak, O. Gunnarsson and K. Schönhammer, Phys. Rev. B, 1983, 27, 4637-4643.
314. J. A. Bradley, K. T. Moore, M. J. Lipp, B. A. Mattern, J. I. Pacold, G. T. Seidler, P. Chow, E. Rod, Y. Xiao and W. J. Evans, Phys. Rev. B, 2012, 85, 100102.
315. Z. Hu, G. Kaindl and G. Meyer, J. Alloy. Compd., 1997, 246, 186-192.
316. C. H. Lee, H. Oyanagi, C. Sekine, I. Shirotani and M. Ishii, Phys. Rev. B, 1999, 60, 13253-13256.
317. D. E. Bugaris, R. Copping, T. Tyliszczak, D. K. Shuh and J. A. Ibers, Inorg. Chem., 2010, 49, 2568-2575.
318. R. A. Gordon, G. T. Seidler, T. T. Fister and K. P. Nagle, J. Electron Spectrosc., 2011, 184, 220-223.
319. J. H. Richter, B. J. Ruck, M. Simpson, F. Natali, N. O. V. Plank, M. Azeem, H. J. Trodahl, A. R. H. Preston, B. Chen, J. McNulty, K. E. Smith, A. Tadich, B. Cowie, A. Svane, M. van Schilfgaarde and W. R. L. Lambrecht, Phys. Rev. B, 2011, 84, 235120.
320. J. A. Bradley, K. T. Moore, G. van der Laan, J. P. Bradley and R. A. Gordon, Phys. Rev. B, 2011, 84, 205105.
321. G. Kaindl, W. D. Brewer, G. Kalkowski and F. Holtzberg, Phys. Rev. Lett., 1983, 51, 2056-2059.
Page 39 of 43 Dalton Transactions
ARTICLE Journal Name
40 | J. Name., 2012, 00, 1-3 This journal is © The Royal Society of Chemistry 20xx
Please do not adjust margins
Please do not adjust margins
322. T. Manoubi, C. Colliex and P. Rez, J. Electron Spectrosc., 1990, 50, 1-18.
323. B. T. Thole, G. van der Laan, J. C. Fuggle, G. A. Sawatzky, R. C. Karnatak and J. M. Esteva, Phys. Rev. B, 1985, 32, 5107-5118.
324. G. Kaindl, G. Kalkowski, W. D. Brewer, B. Perscheid and F. Holtzberg, J. Appl. Phys., 1984, 55, 1910-1915.
325. T. Jo and A. Kotani, Phys. Rev. B, 1988, 38, 830-833. 326. P. Ayala, R. Kitaura, R. Nakanishi, H. Shiozawa, D. Ogawa,
P. Hoffmann, H. Shinohara and T. Pichler, Phys. Rev. B, 2011, 83, 085407.
327. T. Nakamura, T. Hirono, T. Kinoshita, Y. Narumi, M. Hayashi, H. Nojiri, A. Mitsuda, H. Wada, K. Kodama, K. Kindo and A. Kotani, J. Phys. Soc. Jpn., 2012, 81, 103705.
328. K. R. Meihaus, S. G. Minasian, W. W. Lukens, S. A. Kozimor, D. K. Shuh, T. Tyliszczak and J. R. Long, J. Am. Chem. Soc., 2014, 136, 6056-6068.
329. A. B. Altman, J. I. Pacold, J. Wang, W. W. Lukens and S. G. Minasian, Dalton Trans., 2016, 45, 9948-9961.
330. C. A. Hogarth and Z. T. Al-Dhhan, Phys. Status Solidi B, 1986, 137, K157-K160.
331. H. E. Hoefdraad, J. Inorg. Nucl. Chem., 1975, 37, 1917-1921.
332. G. Kaindl, G. Kalkowski, W. D. Brewer, E. V. Sampathkumaran, F. Holtzberg and A. S. v. Wittenau, J. Magn. Magn. Mater., 1985, 47-48, 181-189.
333. G. Strasser and F. P. Netzer, J. Vac. Sci. Technol. A, 1984, 2, 826-830.
334. E. Wuilloud, B. Delley, W. D. Schneider and Y. Baer, Phys. Rev. Lett., 1984, 53, 202-205.
335. B. Hedman, K. O. Hodgson and E. I. Solomon, J. Am. Chem. Soc., 1990, 112, 1643-1645.
336. S. E. Shadle, J. E. Penner-Hahn, H. J. Schugar, B. Hedman, K. O. Hodgson and E. I. Solomon, J. Am. Chem. Soc., 1993, 115, 767-776.
337. S. E. Shadle, B. Hedman, K. O. Hodgson and E. I. Solomon, J. Am. Chem. Soc., 1995, 117, 2259-2272.
338. T. Glaser, B. Hedman, K. O. Hodgson and E. I. Solomon, Accounts Chem. Res., 2000, 33, 859-868.
339. E. I. Solomon, B. Hedman, K. O. Hodgson, A. Dey and R. K. Szilagyi, Coordin. Chem. Rev., 2005, 249, 97-129.
340. S. DeBeer George, P. Brant and E. I. Solomon, J. Am. Chem. Soc., 2005, 127, 667-674.
341. R. Sarangi, L. Yang, S. G. Winikoff, L. Gagliardi, C. J. Cramer, W. B. Tolman and E. I. Solomon, J. Am. Chem. Soc., 2011, 133, 17180-17191.
342. S. Sproules, T. Weyhermüller, R. Goddard and K. Wieghardt, Inorg. Chem., 2011, 50, 12623-12631.
343. L. Liu, C. A. Burnyeat, R. S. Lepsenyi, I. O. Nwabuko and T. L. Kelly, Chem. Mater., 2013, 25, 4206-4214.
344. M. S. Queen, B. D. Towey, K. A. Murray, B. S. Veldkamp, H. J. Byker and R. K. Szilagyi, Coordin. Chem. Rev., 2013, 257, 564-578.
345. S. A. Kozimor, P. Yang, E. R. Batista, K. S. Boland, C. J. Burns, C. N. Christensen, D. L. Clark, S. D. Conradson, P. J. Hay, J. S. Lezama, R. L. Martin, D. E. Schwarz, M. P. Wilkerson and L. E. Wolfsberg, Inorg. Chem., 2008, 47, 5365-5371.
346. S. A. Kozimor, P. Yang, E. R. Batista, K. S. Boland, C. J. Burns, D. L. Clark, S. D. Conradson, R. L. Martin, M. P. Wilkerson and L. E. Wolfsberg, J. Am. Chem. Soc., 2009, 131, 12125-12136.
347. S. G. Minasian, J. M. Keith, E. R. Batista, K. S. Boland, D. L. Clark, S. D. Conradson, S. A. Kozimor, R. L. Martin, D. E. Schwarz, D. K. Shuh, G. L. Wagner, M. P. Wilkerson, L. E. Wolfsberg and P. Yang, J. Am. Chem. Soc., 2012, 134, 5586-5597.
348. S. G. Minasian, J. M. Keith, E. R. Batista, K. S. Boland, D. L. Clark, S. A. Kozimor, R. L. Martin, D. K. Shuh and T. Tyliszczak, Chem. Sci., 2014, 5, 351-359.
349. J. Suntivich, W. T. Hong, Y.-L. Lee, J. M. Rondinelli, W. Yang, J. B. Goodenough, B. Dabrowski, J. W. Freeland and Y. Shao-Horn, J. Phys. Chem. C, 2014, 118, 1856-1863.
350. F. Frati, M. O. J. Y. Hunault and F. M. F. de Groot, Chem. Rev., 2020.
351. R. Sarangi, S. DeBeer George, D. J. Rudd, R. K. Szilagyi, X. Ribas, C. Rovira, M. Almeida, K. O. Hodgson, B. Hedman and E. I. Solomon, J. Am. Chem. Soc., 2007, 129, 2316-2326.
352. S. G. Minasian, J. M. Keith, E. R. Batista, K. S. Boland, S. A. Kozimor, R. L. Martin, D. K. Shuh, T. Tyliszczak and L. J. Vernon, J. Am. Chem. Soc., 2013, 135, 14731-14740.
353. J. T. Lukens, I. M. DiMucci, T. Kurogi, D. J. Mindiola and K. M. Lancaster, Chem. Sci., 2019, 10, 5044-5055.
354. J. N. Cross, J. Su, E. R. Batista, S. K. Cary, W. J. Evans, S. A. Kozimor, V. Mocko, B. L. Scott, B. W. Stein, C. J. Windorff and P. Yang, J. Am. Chem. Soc., 2017, 139, 8667-8677.
355. S. R. Daly, J. M. Keith, E. R. Batista, K. S. Boland, D. L. Clark, S. A. Kozimor and R. L. Martin, J. Am. Chem. Soc., 2012, 134, 14408-14422.
356. S. E. Shadle, B. Hedman, K. O. Hodgson and E. I. Solomon, Inorg. Chem., 1994, 33, 4235-4244.
357. T. Dumas, D. Guillaumont, C. Fillaux, A. Scheinost, P. Moisy, S. Petit, D. K. Shuh, T. Tyliszczak and C. D. Auwer, Phys. Chem. Chem. Phys., 2016, 18, 2887-2895.
358. C. D. Pemmaraju, R. Copping, S. Wang, M. Janousch, S. J. Teat, T. Tyliszcak, A. Canning, D. K. Shuh and D. Prendergast, Inorg. Chem., 2014, 53, 11415-11425.
359. H. M. Crosswhite, H. Crosswhite, W. T. Carnall and A. P. Paszek, J. Chem. Phys., 1980, 72, 5103-5117.
360. T. R. Cundari and W. J. Stevens, J. Chem. Phys., 1993, 98, 5555-5565.
361. G. Hong, F. Schautz and M. Dolg, J. Am. Chem. Soc., 1999, 121, 1502-1512.
362. L. Maron and O. Eisenstein, J. Phys. Chem. A, 2000, 104, 7140-7143.
363. V. Vetere, P. Maldivi and C. Adamo, J. Comput. Chem., 2003, 24, 850.
364. M. Atanasov, C. Daul, H. U. Güdel, T. A. Wesolowski and M. Zbiri, Inorg. Chem., 2005, 44, 2954-2963.
365. L. Brewer, J. Opt. Soc. Am., 1971, 61, 1666-1682. 366. J. S. Parry, Cloke, S. J. Coles and M. B. Hursthouse, J. Am.
Chem. Soc., 1999, 121, 6867-6871. 367. L. P. Varga and L. B. Asprey, J. Chem. Phys., 1968, 49,
4674-4679. 368. L. P. Varga and L. B. Asprey, J. Chem. Phys., 1968, 48, 139-
146. 369. M. N. Popova, S. A. Klimin, S. A. Golubchik, G. Cao and J.
Crow, Phys. Lett. A, 1996, 211, 242-246. 370. M. N. Popova, S. A. Klimin, B. Z. Malkin, L. A. Kasatkina, G.
Cao and J. Crow, Phys. Lett. A, 1996, 223, 308-312. 371. W. C. Martin, L. Hagan and R. Zalubas, Atomic energy
levels--the rare-earth elements: the spectra of lanthanum, cerium, praseodymium, neodymium, promethium,
Page 40 of 43Dalton Transactions
Journal Name ARTICLE
This journal is © The Royal Society of Chemistry 20xx J. Name., 2013, 00, 1-3 | 41
Please do not adjust margins
Please do not adjust margins
samarium, europium, gadolinium, terbium, dysprosium, holmium, erbium, thulium, ytterbium, and lutetium, U.S. Dept. of Commerce, National Bureau of Standards : for sale by the Supt. of Docs., U.S. Govt. Print. Off., [Washington], 1978.
372. A. Abragam and B. Bleaney, Electron Paramagnetic Resonance of Transition Ions, Oxford University Press, Oxford, 1992.
373. B. Gao, T. Chen, D. W. Tam, C.-L. Huang, K. Sasmal, D. T. Adroja, F. Ye, H. Cao, G. Sala, M. B. Stone, C. Baines, J. A. T. Verezhak, H. Hu, J.-H. Chung, X. Xu, S.-W. Cheong, M. Nallaiyan, S. Spagna, M. B. Maple, A. H. Nevidomskyy, E. Morosan, G. Chen and P. Dai, Nat. Phys., 2019, 15, 1052-1057.
374. K. Kimura, S. Nakatsuji, J. J. Wen, C. Broholm, M. B. Stone, E. Nishibori and H. Sawa, Nat. Commun., 2013, 4, 1934.
375. H. A. Kramers, Proc. Acad. Amst, 1930, 33. 376. S. T. Liddle, Angew. Chem. Int. Edit., 2015, 54, 8604-8641. 377. Y. Hinatsu and N. Edelstein, J. Solid State Chem., 1994,
112, 53-57. 378. Y. Hinatsu, J. Solid State Chem., 1996, 122, 384-389. 379. Y. Hinatsu and N. Edelstein, J. Alloy. Compd., 1997, 250,
400-404. 380. K. Tezuka and Y. Hinatsu, J. Solid State Chem., 1999, 143,
140-143. 381. J. Selbin, C. J. Ballhausen and D. G. Durrett, Inorg. Chem.,
1972, 11, 510-515. 382. A. F. Leung and Y.-M. Poon, Can. J. Phys., 1977, 55, 937-
942. 383. P. Rigny, A. J. Dianoux and P. Plurien, J. Phys. Chem. Solids,
1971, 32, 1175-1180. 384. C. A. Hutchison and B. Weinstock, J. Chem. Phys., 1960,
32, 56-61. 385. J. D. Axe, H. J. Stapleton and C. D. Jeffries, Phys. Rev.,
1961, 121, 1630-1637. 386. S. Stoll and A. Schweiger, Journal of Magnetic Resonance,
2006, 178, 42-55. 387. Y. Hinatsu, M. Wakeshima, N. Edelstein and I. Craig, J.
Solid State Chem., 1999, 144, 20-24. 388. E. A. Harris, J. H. Mellor and S. Parke, Phys. Status Solidi B,
1984, 122, 757-760. 389. Y. Hinatsu, J. Solid State Chem., 1997, 130, 250-253.
390. K. Tezuka and Y. Hinatsu, J. Solid State Chem., 2001, 156, 203-206.
391. Y. Hinatsu and K. Tezuka, J. Solid State Chem., 1998, 138, 329-333.
392. Y. Hinatsu, J. Solid State Chem., 1993, 102, 362-367. 393. J. M. Baker, J. R. Chadwick, G. Garton, J. P. Hurrell and B.
Bleaney, Philos. Tr. R. Soc. S-A, 1965, 286, 352-365. 394. D. R. Hutton and R. J. Milne, J. Phys. C Solid State, 1969, 2,
2297-2300. 395. S. Hansen, B. D. Mosel, W. Müller-Warmuth and P. E.
Fielding, Z. Naturforsch. A, 1996, 51, 885-894. 396. H. Ebendorff-Heidepriem and D. Ehrt, J. Phys-Condens.
Mat., 1999, 11, 7627-7634. 397. C. B. Azzoni, G. L. D. Nero and G. Lanzi, Lettere Al Nuovo
Cimento, 1977, 19, 369-372. 398. J. J. Gallet, J. M. Mariot, L. Journel, C. F. Hague, A.
Rogalev, H. Ogasawara, A. Kotani and M. Sacchi, Phys. Rev. B, 1999, 60, 14128-14131.
399. A. Amorese, O. Stockert, K. Kummer, N. B. Brookes, D.-J. Kim, Z. Fisk, M. W. Haverkort, P. Thalmeier, L. H. Tjeng and A. Severing, Phys. Rev. B, 2019, 100, 241107.
400. A. Amorese, N. Caroca-Canales, S. Seiro, C. Krellner, G. Ghiringhelli, N. Brookes, D. Vyalikh, C. Geibel and K. Kummer, 2018.
401. Y.-J. Kim, J. Clancy, H. Gretarsson, G. Cao, Y. Singh, J. Kim, M. Upton, D. Casa and T. Gog, Probing electronic excitations in iridates with resonant inelastic x-ray scattering and emission spectroscopy techniques, 2018.
402. H. Gretarsson, J. P. Clancy, X. Liu, J. P. Hill, E. Bozin, Y. Singh, S. Manni, P. Gegenwart, J. Kim, A. H. Said, D. Casa, T. Gog, M. H. Upton, H.-S. Kim, J. Yu, V. M. Katukuri, L. Hozoi, J. van den Brink and Y.-J. Kim, Phys. Rev. Lett., 2013, 110, 076402.
403. C. Monney, K. Zhou, V. Strocov, T. Schmitt, V. Bisogni, R. Kraus and J. Geck, Ver. Deut. Phys. Gesell., 2011, 1.
404. J. Dvorak, I. Jarrige, V. Bisogni, S. Coburn and W. Leonhardt, Rev. Sci. Instrum., 2016, 87, 115109.
Page 41 of 43 Dalton Transactions

ARTICLE
Please do not adjust margins
Please do not adjust margins
TOC Graphic:
The thermochemistry, descriptive chemistry, spectroscopy (optical, core-level, and EPR) and physical properties of the tetravalent lanthanides (Pr, Nd, Tb and Dy) in extended phases, gas phase, solution, and as isolable molecular complexes is presented.
Author Biographies:
Natalie T. Rice received her Bachelor of Science in Chemistry from North Carolina State University. She is currently a graduate student in the La Pierre group at Georgia Institute of Technology. Her research focuses on the high-valent chemistry of lanthanide and actinide complexes. Arun Ramanathan was born in Coimbatore, India at the foothills of the Western Ghats in 1994. He received his Bachelor’s degree in Metallurgical Engineering from PSG College of Technology in 2011 and Master’s degree in Materials science and Engineering at the University of Illinois Urbana Champaign in 2016. During his course of stay at UIUC, he conducted research with Professor Daniel Shoemaker. He then interned for six months at the Los Alamos National Laboratory in the LANSCE division. He is currently a graduate student in the La Pierre group at Georgia Institute of Technology. His research focuses on solid-state synthesis of lanthanide chalcogenides and the spectroscopy and magnetism of high oxidation state lanthanide materials.
Page 42 of 43Dalton Transactions

Journal Name ARTICLE
This journal is © The Royal Society of Chemistry 20xx J. Name., 2013, 00, 1-3 | 43
Please do not adjust margins
Please do not adjust margins
Thaige P. Gompa received his Bachelor of Science in Chemical Engineering from Mississippi State University where his research was primarily focused on magnetic nanomaterials. He joined the La Pierre Group at Georgia Institute of Technology in 2016 and his research is focused on f-block coordination complexes with unique oxidation states, magnetic properties, and metal-metal interactions.
Henry, also known by his nickname, Pete, was born in St. Louis, MO. During his undergraduate studies at Harvard University, he worked with Prof. Jared Shaw at the Broad Institute on the synthesis of antibiotics and with Prof. Masahiro Murakami at Kyoto University on main group organometallics. His graduate work, with Professors John Arnold, Robert Bergman, and Dean Toste at UC-Berkeley, focused on the development of a Z-selective alkyne semihydrogenation catalyst. Following graduation, he studied ligand control of reactive low- and high-valent uranium complexes as a postdoctoral scholar with Prof. Karsten Meyer at FAU Erlangen-Nuremberg. He also worked as a Director’s Postdoctoral Fellow at Los Alamos National Laboratory (LANL) with Dr. Stosh Kozimor on ligand K-edge XAS of transuranic complexes. Since 2016, he has been an assistant professor at the Georgia Institute of Technology. His group is broadly interested in the synthesis and spectroscopy of
lanthanide and actinide complexes and materials.
Page 43 of 43 Dalton Transactions