Embed Size (px)
Citation preview
TheCharacteristics
andRoles
ofRural Health Clinicsin the United States:
A Chartbookby John A. Gale and Andrew F. Coburn
Edmund S. MuskieSchool of Public ServiceUniversity of Southern Maine

TheCharacteristics andRolesofRural Health Clinicsin the United States:
A Chartbook
John A. Gale, Project DirectorMaine Rural Health Research Center,University of Southern Maine
Andrew F. Coburn, Principal InvestigatorDirector, Maine Rural Health Research Center,University of Southern Maine
Support for this project was provided by the federal Office of Rural Health Policy,Health Resources and Services Administration, Department of Health and HumanServices. The conclusions and opinions expressed in the paper are the authors’ andno endorsement by the University of Southern Maine or the funding source isintended or should be inferred.
Publication Date: January 2003
Edmund S. Muskie School of Public Service96 Falmouth StreetP.O. Box 9300Portland, Maine 04104-9300

We would like to acknowledge the assistance and support of Bill Finerfrock,Executive Director of the National Association of Rural Health Clinics whoserved as a consultant to this project.
We would also to like to acknowledge the support of Karen Travers, VicePresident, BDMP/Westport Group; Jake Culp of the Office of Rural HealthPolicy, Health Resources and Services Administration, DHHS; and Ron Nelson,President and CEO, Health Services Associates, Inc. for their assistance indeveloping the initial survey instrument.
We would also like to acknowledge the work of Al Leighton, Director, and thestaff of the Survey Research Center at the Muskie School for their work inconducting the survey upon which this chartbook is based. We would like toacknowledge Julie Motherwell of Graphic Communications for her work indeveloping the layout and design of this chartbook.
Finally, we would like to thank and acknowledge the administrators andproviders of the Rural Health Clinics who took the time to complete this survey.
Acknowledgements

Table of Contents
i ...... Executive Summary
v ...... Introduction
vi ..... History and Background
xii .... Study Methodology
1 ..... Section I:Characteristics of Rural Health Clinics
9 ..... Section II:Staffing and Recruitment Issues
13 ... Section III:Financial Operations
17 Section IV:Location of RHCs Relative to Underservice andAccess Problems of Rural Communities
25 ... Section V:Proximity to Other RHCs and Primary Care Services
27 ... Section VI:Safety Net Role of RHCs
33 ... Section VII:Participation of RHCs in Health Professions Education
35 ... Section VIII:Networking Activities of RHCs
39 ... Section IX:Participation of RHCs in Managed Care Programs
45 ... Section X:Policy Implications
51 ... References
54 ... Appendix I — Methodology

Overview
Public Law 95-210, the Rural Health Clinic Services Act, was passed byCongress in December 1977 in an effort to increase the availability and
accessibility of primary care services for residents of rural communities. The Actprovided for cost-based Medicare and Medicaid reimbursement to qualified RuralHealth Clinics for a defined set of core services and expanded Medicare andMedicaid coverage for services provided by nurse practitioners (NPs) and physicianassistants (PAs), even when delivered at a clinic in the absence of a physician.Subsequent amendments to the act added certified nurse midwives (CNMs),clinical psychologists, and clinical social workers to the list of core providers whoseservices are eligible for cost-based reimbursement.
To be eligible for participation in the Rural Health Clinics program, a facilityhas to apply for and become certified as a Rural Health Clinic (RHC). To qualifyfor certification, a facility must be located in an area defined by the U.S. CensusBureau as nonurbanized (e.g., an area with a population of less than 50,000) anddesignated by the U.S. Department of Health and Human Services as having ashortage of personal health care services or primary care medical services. Inaddition, facilities must meet relevant requirements involving physical plant,personnel credentials and staffing, licensure, governing policies, medical services,and referral arrangements before it can be certified for participation in the program.Under the original terms of the Rural Health Clinic Services Act, a clinic that wassuccessfully certified as an RHC maintained its certification as an RHC regardless ofchanges to the rural status or shortage area designation of the area in which it islocated. This “grandfathering” provision was designed to protect the status ofclinics whose presence in an area could jeopardize its shortage area designation.Although the Balanced Budget Act of 1997 contained provisions to refine theshortage area requirements that apply to RHCs, thereby effectively eliminating thisgrandfathering provision, the final regulations implementing those provisions havenot been promulgated as of the date of this publication.
Although Congress had anticipated widespread participation in the programwhen it passed the Rural Health Clinic Services Act in 1977, participation lagged
Executive Summary
i

Edmund S. Muskie School of Public Service
behind those initial expectations during the first 13 to 15 years of the program. Overtime, Congress passed a number of amendments to address some of the perceived problemsinherent in the original legislation and to boost participation. The changes to the program,in combination with changes in the rural practice environment during the late 1980s andearly 1990s, served to make the it a more attractive option for rural providers. As a result,participation in the program grew rapidly during the mid-1990s. According to data releasedby the U.S. Office of the Inspector General in 1996, participation in the program grew byover 650 percent from the end of 1990 (when there were 314 clinics) through October1995 (when there were 2,350 RHCs). At the beginning of our study in September 1999,we identified 3,477 operational RHCs.
Along with this growth in the number of clinics came a corresponding growth in thelevel of Medicare and Medicaid expenditures. This growth drew the attention of Medicareand Medicaid officials as well as the U.S. Office of the Inspector General (OIG) and theU.S. General Accounting Office (GAO). The OIG and GAO released reports in 1996 thatquestioned the extent to which the RHC program actually improved access for underservedpopulations in rural communities. A 1997 study conducted by Mathematica PolicyResearch refuted a number of the findings in these reports. The OIG and GAO studieshave been criticized as they were based on relatively small numbers of RHCs and used aninterpretation of the program’s goals that was more rigorous than the original legislation.In an effort to obtain up-to-date information on the characteristics and operations of RHCsnationally, the federal Office of Rural Health Policy commissioned the survey upon whichthis chartbook is based.
MethodsUsing data from the Center for Medicare and Medicaid Services Online, Survey,
Certification, and Reporting (OSCAR) database, we selected a random sample of RuralHealth Clinics evenly stratified between independent and provider-based clinics. Theseclinics were surveyed using a mailed survey instrument. Data obtained from the survey andthe OSCAR database were supplemented with data on the characteristics of the counties inwhich RHCs are located, as drawn from the 2000 Area Resource File. Further analysis onthe rurality of the communities in which RHCs are located was conducted using the RuralUrban Commuting Area Codes developed by the WWAMI Rural Health Research Center atthe University of Washington.
ii

Edmund S. Muskie School of Public Service
Findings� Most RHCs continue to serve rural, underserved communities. Close to 99 percent
are located in rural areas as defined by the Rural Health Clinic Services Act.1 Over97 percent are located in areas that are currently designated as having a shortage ofprimary care services.2
� Over 81 percent of the zip codes in which RHCs are located have only one RHClocated with them.
� RHCs are serving a valuable safety net role with services rendered to Medicaid,uninsured, self-pay, and free/reduced-cost care patients accounting for 45 percentof their overall volume.
� RHCs are also an important source of free- and reduced- cost care in theircommunities — as 36 percent of independent clinics and 29 percent of provider-based clinics reported that they wrote off between 5 and 14 percent of their totalcharges as free- and reduced- cost care. Another 51 percent of independent clinicsand 55 percent of provider-based clinics reported that they wrote off up to 4percent of total charges as free- and reduced- cost care.
� Recruitment and retention is a problem for many RHCs, as 18 percent of surveyrespondents reported a physician vacancy during the past year and 20 percentreported a NP, PA, or CNM vacancy during the same period. Of those RHCs withphysician vacancies, 77 percent indicated that they had difficulty filling the position.Forty-nine percent with NP, PA, or CNM vacancies reported difficulty in finding aclinician to fill their positions.
� Some RHCs continue to face financial challenges despite cost-based reimbursement.Independent RHCs reported that, on average, total expenses exceeded totalrevenues by $40,505. Provider-based RHCs reported that their total expensesexceeded total revenues by $38,441 during their most recently completed fiscalyear. The adjusted cost-per-visit, reported by both independent ($66.31) andprovider-based ($81.01) RHCs, exceeded the cap on per-visit reimbursement thatapplied to independent clinics and provider-based clinics owned by hospitals of 50or more beds in both 1999 ($60.40) and 2000 ($61.85).
� Among the survey respondents, 0.12 percent employ a clinical psychologist and0.07 percent employ a clinical social worker. This represents a missed opportunityto add an important service needed in most rural communities.
iii

Edmund S. Muskie School of Public Serviceiv
� Under the proposed rules implementing the shortage area refinements mandated bythe Balanced Budget Act of 1977, 1.5 percent of RHCs may potentially lose theircertification due to the loss of their rural status.1 Slightly less than 3 percent are atrisk due to the loss of the shortage area designation for the area in which they arelocated, unless they can qualify for an exception as an essential provider.2 Furtherstudy is needed to understand the full impact of the proposed regulations on theRHC program and on access to services in the communities in which at-risk clinicsare located.
� Similarly, the impact of the Medicaid prospective payment system mandated by theBenefits Improvement and Protection Act of 2000 and implemented effectiveJanuary 1, 2001, requires further study to estimate the impact on the financialstatus of RHCs.
1 The Rural Urban Commuting Area Codes (RUCA) used to describe the rurality of the communities inwhich RHCs are located is based on 1990 Census data. As the process of updating the RUCA taxonomy tothe 2000 Census had not been completed as of the publication of this chartbook, we were not able toestimate the impact of the 2000 Census changes. Indications are that the actual number may be higherwhen the impact of the 2000 Census rural and urban classifications are available, although we are unable toestimate the magnitude of the change at this time.
2 Based on data obtained from the 2000 Area Resource File. Unfortunately, the data from the 2000Resource File do not allow us to identify clinics that are located in shortage areas whose designations ormost recent updates are greater than three years old. Clinics located in these areas are also at risk under theproposed regulations.

Edmund S. Muskie School of Public Service v
Introduction
Rural Health Clinics (RHCs) have become an important part of the rural healthcare infrastructure. As of September 30, 1999, 3,477 RHCs were providing a
wide range of primary care services to the rural residents of 45 states.3 The patientpopulations served by these RHCs include a high proportion of rural elderly and poorthrough the Medicare and Medicaid programs. In addition, RHCs are increasingly lookedupon as safety net providers (Gaston, 1997), based on the requirement that they be locatedin rural areas designated as underserved. Despite their relatively wide acceptance, RHCsand the RHC Program have come under scrutiny because of the growth in program costsand concerns about the extent to which RHCs are improving access. These issues havearisen as a result of the dramatic growth in the number of RHCs during the mid-1990s(McBride and Mueller, 2002) and the distribution of those clinics in areas with establishedhealth care systems (U.S. General Accounting Office, 1996).
Despite these concerns, current data are not available on the characteristics andoperations of RHCs nationwide. The last national survey of RHCs was conducted in 1994(Thometz, 1994).
This project was undertaken to provide an updated, comprehensive picture of theRHC program and the operations of RHCs, addressing the following questions:
� What are the characteristics of RHCs in terms of staffing levels and patterns,populations served, payer mix, hours of operation, and financial performance?
How do independent and provider-based RHCs compare in terms of thesecharacteristics?
� Where are RHCs located relative to underservice problems and access needs ofrural areas?
� Where are RHCs located in relation to one another?
� To what extent have RHCs converted from some other type of practice? What arethe changes in staffing patterns of clinics that have converted to RHC status?
� What safety net functions are performed by RHCs?

Edmund S. Muskie School of Public Service
� What are the staffing and recruitment issues faced by RHCs?
� To what extent are RHCs participating in the training of health careprofessionals?
� To what extent are RHCs participating in networking activities to expand accessand build service capacity?
� How have RHCs been affected by both commercial- and public- managed care plans?
3 At the time of our study, Connecticut, Delaware, Maryland, Massachusetts, and NewJersey had no RHCs in operation.
vi

Edmund S. Muskie School of Public Service
History and Background
The Rural Health Clinic Services Act, PL 95-210, established the Rural HealthClinic program in December 1977. The goal of the Act was to improve access to
healthcare services for rural residents living in designated shortage areas through theestablishment of federally-certified Rural Health Clinics (RHCs), and to expand the use ofnurse practitioners and physician assistants in rural communities.
To be certified as an RHC, a clinic must:
� Be located in a nonurbanized area as defined by the U.S. Bureau of the Census; 4
� Be located in an area designated as a Health Professional Shortage Area (“HPSA”),Medically Underserved Area (“MUA”), or Governor-Designated Shortage Area;
� Be engaged primarily in providing outpatient primary medical care;
� Employ at least one nurse practitioner (NP), physician assistant (PA), or certifiednurse midwife (CNM) at least 50 percent of the time that the clinic is open;
� Comply with all applicable federal, state, and local requirements;
� Meet health and safety requirements prescribed by Medicare and Medicaidregulations; and
� Receive medical direction from a physician who periodically reviews the servicesprovided by the NPs, PAs, and/or CNMs, provides general medical supervision,and is present on-site at least once every two weeks.
The Rural Health Clinic Services Act authorized Medicare and Medicaid cost-basedreimbursement to certified RHCs for a defined set of core rural health clinic services; andestablished reimbursement for the services of NPs, PAs, and CNMs in RHCs, even ifdelivered in the absence of a physician. The core services defined by the Act include: primaryhealth services; six basic laboratory tests (e.g., chemical examination of urine by stick ortablet, hemoglobin or hematocrit, blood sugar, examination of stool specimens for occultblood, pregnancy tests, and primary cultures for transmittal to a certified lab) witharrangements for other tests; emergency care services as a first response to common life
vii

Edmund S. Muskie School of Public Service
threatening injuries and acute illnesses; x-ray services (which can be provided througharrangements with other facilities); and hospital specialty care through demonstratedarrangements with specialty providers. Subsequent amendments to the Act added theservices of clinical psychologists and clinical social workers to the list of core services,and added certified nurse midwives to the definition of midlevel providers.
Most recently, the Medicare, Medicaid, and SCHIP Benefits Improvement andProtection Act of 2000 (BIPA 2000) repealed the reasonable cost-based reimbursementfor Medicaid patients served by Federally Qualified Health Centers (FQHCs) and RHCs(Center for Medicare & Medicaid Services State Medicaid Directors’ Letter, SMDL # 01-014). Effective January 1, 2001, state Medicaid programs must reimburse FQHCs/RHCs at a rate consistent with the new prospective payment system described in section1902(aa) of the act. During the first phase of the Medicaid Prospective Payment System(January 1, 2001, through September 30, 2001), states are required to pay FQHCs/RHCs 100 percent of the average of their reasonable costs of providing Medicaid-covered services during Fiscal Years 1999 and 2000; adjusted to take into account anyincrease (or decrease) in the scope of services furnished during Fiscal Year 2001 by theFQHC or RHC. The payment amount is to be calculated on a per-visit basis. Beginningin FY 2002 and for each fiscal year thereafter, each FQHC and RHC will be paid theper-visit amount to which the facility was entitled in the previous fiscal year; increased bythe percentage increase in the Medicare economic index for primary care services andadjusted to take into account any increase (or decrease) in the scope of servicesfurnished by the facility during that fiscal year.
States are allowed to develop alternative Medicaid payment methodologies forFQHCs and RHCs as long as the following three statutory requirements are met:
1) the state and each individual FQHC/RHC to which the state wishes to applythe methodology must agree to the alternative methodology;
2) the alternative methodology must result in a payment to each facility that is atleast equal to the amount that would have been paid under the MedicaidProspective Payment System; and
3) the alternative methodology must be described in the approved state plan.These changes to the payment of RHCs took place subsequent to our surveyand, as such, the impact of these changes are not reflected in the data wecollected.
RHCs can either be independent or provider-based. An independent RHC is afreestanding clinic or office-based practice. In comparison, a provider-based RHC must
viii

Edmund S. Muskie School of Public Service
be an integral and subordinate part of a hospital, skilled nursing facility, or home healthagency participating in the Medicare program; and be operated with other departments ofthat provider under common licensure, governance, and professional supervision.
RHCs are reimbursed on a reasonable cost basis for core services including theprofessional services of physicians, NPs, PAs, and CNMs. Independent RHCs are paid acost-based, all-inclusive per-visit rate subject to established caps. Originally, all provider-based RHCs were reimbursed for covered services at the lower of costs or charges calculatedfrom the cost report of the host provider (Travers, Ellis, and Dartt, 1995). As of January 1,1998, provider-based RHCs owned by hospitals of 50 or more beds are subject to the sameper-visit upper payment limit as independent RHCs (Balanced Budget Act of 1997 [P.L. 105-33, subtitle C § 4205]). Provider-based RHCs owned by rural hospitals with fewer than 50beds, however, are exempt from those payment limits. This change came on the heels of thesignificant increase in the number of RHCs (and related payment levels) during the mid-1990s, as well as concerns that some providers have used RHC status to increase Medicareand Medicaid reimbursement for outpatient services without necessarily improving access tocare (U.S. Office of the Inspector General, 1996 and U.S. General Accounting Office, 1996).
Despite the incentives provided by the Act, participation during the early years of theprogram lagged behind Congress’s initial expectations (Washington and Kushner 1991).Although only 581 RHCs were operating as of October 1990 (Travers, Ellis, and Dartt1995), the program took off quickly after that. There were over 800 RHCs operating in1992. From the end of October 1990 through October 1995, the number of RHCs grewby 650 percent (U.S. Office of the Inspector General, 1996). As of September 30, 1999,3,477 RHCs were in operation, of which 53 percent were classified as independent and47 percent were classified as provider-based. As a result of this growth, RHCs are amongthe largest outpatient primary care programs serving underserved rural communities(Thometz 1994).
The reasons for the initial slow growth during the early years of the program (prior to1992) included the perception that early federal reimbursement rates, which were capped ata maximum cost-per-visit, were too low; a lack of knowledge about the program; conflictingstate laws that limited the utilization of NPs, PAs, and CNMs; and concerns that the costreporting and certification processes were too complex (Travers, Ellis, and Dartt, 1995,Finerfrock and Petersen, 1994, and Tessen, Dugi, and Reese, 1998). In an effort to improveparticipation, Congress passed amendments to increase reimbursement rates, ease theadministrative burden, and promote technical assistance and awareness of the program(American Academy of Physician Assistants, 1997). Similarly, states addressed barriers relatedto the scope of practice of NPs, PAs, and CNMs (American Academy of PhysicianAssistances, 1997, Tessen, Dugi, and Reese, 1998, and Michigan Center for Rural Health,1996). Declining reimbursement from the standard Medicare fee-for-service system further
ix

Edmund S. Muskie School of Public Service
served to make the RHC program an attractive option for many rural providers(National Rural Health Association, 1997).
The growth in the number of RHCs has been accompanied by a rapid increase in thecost of the program. Medicare spending for RHCs increased from $44 million in 1991 to$220 million in 1997 (McBride and Mueller, 2002). Similarly, Medicaid expenditures forRHC services increased from $34 million in 1990 to $308 million in 1997 (Finerfrock,1999).
This growth in total payment to RHCs can be largely attributed to increased access forresidents of rural communities. For example, the increase in Medicaid expenditures can beattributed to an increase in the number of Medicaid patients served by RHCs. From 1995to 1997, the number of Medicaid recipients served by RHCs increased by 16.4 percent,compared to an 11.0 percent decline in Medicaid patients receiving physician services; an18.4 percent decline in those receiving hospital outpatient services, and an 11.4 percentdecline in those receiving care in clinics (Finerfrock, 1999). In the absence of these RHCs,many patients would seek care from other health care providers. For example, the presenceof an RHC in a community has been found to reduce emergency room use (Cheh andThompson, 1997).
As mentioned earlier, this recent and dramatic growth in the number of RHCs and theassociated costs has resulted in greater scrutiny of the RHC program. Evaluations of theRHC program by the General Accounting Office (U.S. General Accounting Office, 1996)and the Office of the Inspector General (U.S. Office of the Inspector General, 1996) havequestioned the degree to which the objectives of the program were being met. Yet thesestudies have themselves been controversial because of the small number of clinics studied.The GAO study (1996) was based on case studies of 27 RHCs located in Illinois,Mississippi, and Texas. The OIG study (1996) examined claims data and providerregistration data from a total of 119 RHCs in Alabama, Kansas, New Hampshire, andWashington; and conducted telephone surveys with 76 of those clinics. In a more recentevaluation of the RHC program, Cheh and Thompson (1997) based their findings on a pre-post examination of 18 recently-established clinics in California, Kansas, Maine, Michigan,North Carolina, and Texas.
Although these studies raised some useful questions, their conclusions are notnecessarily based on the intent of the legislation establishing the RHC Program. The GAO,in particular, criticized the program for not being focused on improving care in isolatedareas. The Rural Health Clinic Services Act did not specifically target isolated rural areas,rather it established a standard (requiring that a clinic be located in a non-urbanized area ofless than 50,000) that covered a broader array of rural areas across the country. In addition,many of their concerns had less to do with the RHC program and more to do with the
x

Edmund S. Muskie School of Public Service
existing shortage-area-designation process used to certify clinics for participation in theprogram. As a result, the conclusions reached by these earlier studies need to be evaluated inthe context of the goals of the enabling legislation.
Despite the recent scrutiny given the RHC program, up-to-date information on thecharacteristics and operations of RHCs has largely been unavailable. As previously discussed,the National Association of Rural Health Clinics last conducted a national survey of RHCsin 1994. A limited number of states have conducted and published surveys of their RHCs.These have included Oklahoma (Biard-Holmes, Brown, Eley, and Valdmanis, 1997), Texas(Tessen, Dugi, and Reese, 1998), Oregon (Redd, 2001), and Michigan (Michigan Center forRural Health, 1996).
This chartbook presents an analysis of the most recent data on rural health clinics,collected from a national survey of RHCs conducted during the summer and fall of 2000.
4 The Census Bureau defines an urbanized area as comprising one or more places (“central place”) andthe adjacent densely settled surrounding territory (“urban fringe”) that together have a minimum of 50,000persons. A non-urbanized area is one in which the central place and related urban fringe have less than50,000 people. A list of urbanized areas is available from the Census Bureau.
xi

Edmund S. Muskie School of Public Service
Study Methodology
In order to provide an updated comprehensive picture of the Rural Health Clinicsprogram, we surveyed a randomly-selected sample of RHCs, equally stratified by
clinic type (e.g., independent versus provider-based) using a mailed survey instrument. Weidentified the population of 3,477 RHCs using the September 1999 Online Survey,Certification, and Reporting (OSCAR) database maintained by the Centers for Medicareand Medicaid Services. We mailed written survey instruments to 1,600 RHCs. Extensivefollow-up was conducted to encourage participation in the survey; including a secondmailing of the survey instrument to those who had not responded and multiple follow-uptelephone calls to those who did not respond to the second mailing.
Usable surveys were returned by 611 RHCs. Our original sample was adjusted toreflect the return of 151 survey instruments that could not be delivered due to clinic closureor incorrect addresses. Our response rate of 42.2 percent was based on the adjusted samplesize of 1,449. The data provided by these RHCs were supplemented by data from theOSCAR database, the 2000 Area Resource File, and the Rural-Urban Commuting Area(RUCA) Zip Code Approximation file, Version 1.1 produced by the WWAMI Rural HealthResearch Center at the University of Washington. Over 83 percent of the surveys werecompleted by the clinic administrator, an employee of the parent organization, or anothermember of the clinic’s administrative or clinical staff. Twenty-three percent were completedby either a physician, nurse practitioner, or physician assistant.5
Our survey population closely resembles the overall population of RHCs along anumber of important characteristics. Of the 3,477 clinics in operation as of September 30,1999, 52 percent were classified as independent and 48 percent were classified as provider-based. In comparison, 53 percent of our survey population were classified as independentand 47 percent were classified as provider-based. Over 75 percent of all RHCs wereconcentrated in the Atlanta (IV), Chicago (V), Dallas (VI), and Kansas City (VII) federalregions compared to 68 percent of the survey respondents. In terms of corporate structuresand ownership patterns, 41 percentof both populations operated as non-profit corporations,29 percent of the total population and 27 percent of the survey population operated as for-profit corporations; 16 percent of both populations operated under the auspices of local,state, or federal governments; 10 percent of the total population of RHCs and 12 percent ofthe survey population operated under individual ownership; and 5 percent of bothpopulations operated as partnerships.6 Finally, 73 percent of the total population and 75percent of the survey population were located in counties that were either wholly or partially
xii

Edmund S. Muskie School of Public Service
designated as Health Professional Shortage Areas. Approximately 24 percent of both groupswere located in counties designated as Medically Underserved Areas. Less than 1 percent ofboth populations are located in counties that are Governor Designated Shortage Areas.Three percent of the total population and 2 percent of the survey population are located incounties no longer designated as shortage areas.
Version 1.1 of the RUCA Zip Code Approximation file allowed us to assess the ruralityof the communities in which RHCs are located at the zip code level. The RUCA system is aten-tiered classification system of population sizes and commuting relationships based oncensus tract geography using 1990 Census data. The Zip Code Approximation filecrosswalks census tracts to the relevant zip codes; thereby, allowing this information to belinked easily to databases containing address information. Using, a four-tiered consolidationof the larger RUCA classification system developed by the Washington State Office ofCommunity and Rural Health (Washington Department of Health, 2001), we were able toclassify the communities in which RHCs are located into the following categories: urbancore areas (urbanized areas with a population of 50,000 or more), suburban areas (areaswith high commuting relationships to urban core areas including large town, small towns,and isolated rural areas), large town areas (towns with populations between 10,000 and49,999), and small town/isolated rural areas (towns with populations below 10,000 andother isolated rural areas). Unfortunately, the process of updating the RUCA taxonomy tothe 2000 Census had not been completed as of the publication of this chartbook. We expectthat the classification of the communities in which RHCs are located may change whenVersion 2.0 of the RUCA codes is released; however, we were unable to estimate the extentof the change prior to publication.
In the first section of this chartbook, we describe RHCs by a number of characteristicsincluding provider type, location, ownership issues, corporate structure, conversion history,and hours of operation. In Section II, we address staffing and recruitment issues faced byRHCs. Section III describes the financial operations of RHCs. Section IV and V explore thelocation of RHCs relative to underservice; and access problems in rural communities, andtheir proximity to other RHCs and primary care services. Section VI addresses the safety netrole of RHCs. Sections VII through IX describe the participation of RHCs in healthprofessions education, the networking activities of RHCs, and the participation of RHCs inmanaged care programs, both public and private. Finally, Section X discusses the policyimplications of our findings.
Although this chartbook provides the most up-to-date information available on thestatus of RHCs nationally, it cannot be considered an exhaustive exploration of the issuesrelated to the RHC program. Further research is needed to fully understand the role ofRHCs in expanding access to primary care services for the residents of rural communities.
xiii

Edmund S. Muskie School of Public Service
Our goal in preparing this chartbook was to provide a resource for national and statepolicymakers on the status of the RHC program. We have carefully selected a range of data,presented through graphs and narrative, to “tell the story” of the Rural Health Clinicsprogram; document the performance of the program relative to the policy goals; exploreconcerns that have been raised about it; and to suggest opportunities for further researchand analysis necessary to understand and support this important rural program.
5 These totals exceed 100 percent as multiple individuals participated in the completion of some surveys6 Due to rounding, the sum of these categories do not equal 100 percent..
xiv

Edmund S. Muskie School of Public Service
Section I
Characteristics of Rural Health Clinics
This section of the chartbook presents data on a broad range of characteristicsof RHCs, provided by our survey respondents, and our analysis of the overall
population of RHCs. Within this section, we provide a descriptive picture of RHCsaccording to clinic type (e.g., independent versus provider-based), geographic location,corporate structure, ownership, changes in ownership, and hours of operation. Inaddition, we explore issues related to the conversion of existing primary care practices toRural Health Clinic status.
The GAO and OIG raised questions about the conversion of existing primarycare practices to RHC status. They were concerned that some of these practices mightnot need the enhanced reimbursement provided by the RHC program to remain inoperation, nor use the benefits of the program to expand care to the underserved.Through our survey data, we were able to examine issues related to the conversion ofexisting practices to RHC status and related changes to professional staffing patterns.Although our survey data did not allow us to determine whether or not the respondingpractices would have closed without the additional reimbursement provided underthe RHC program, we have been able to determine that practices converted to RHCstatus expanded their professional staffing post conversion; thereby, improving accessto services.
Key Findings� As of September 30, 1999, 3,477 RHCs were in operation nationally. Of these
clinics, 52 percent (1,814) were classified as independent. The remaining 48percent were classified as provider-based.
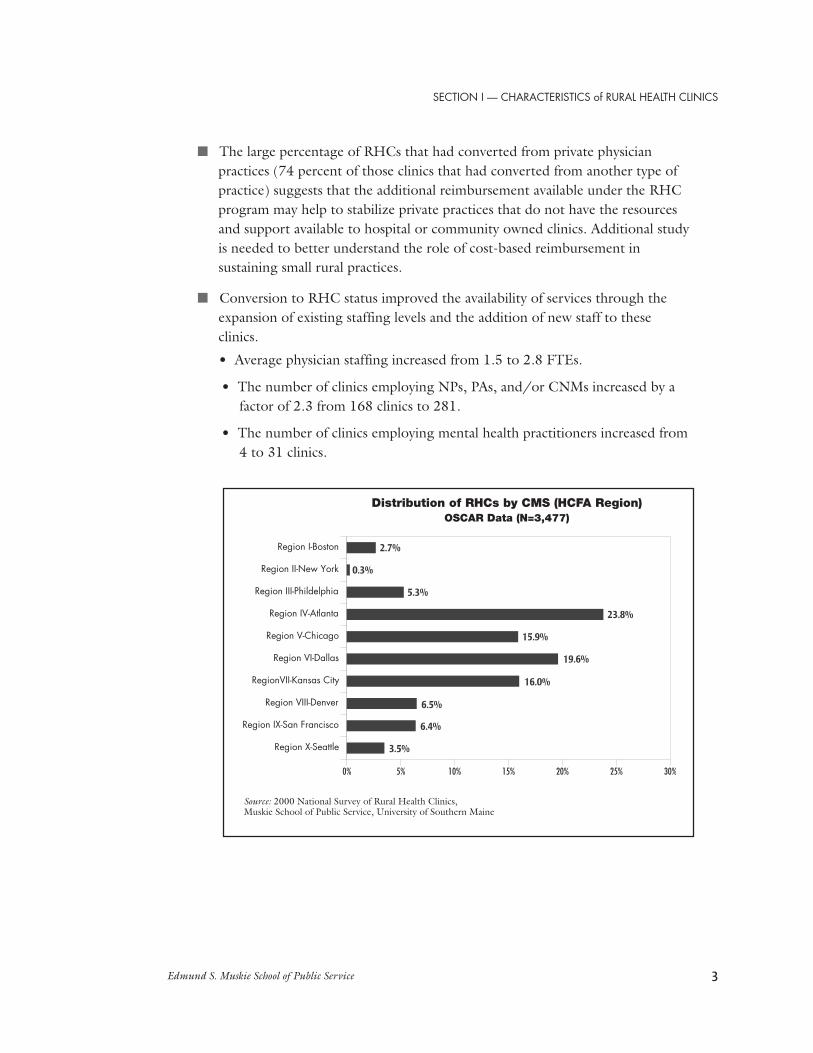
� The CMS/HCFA regions with the heaviest concentration of RHCs wereAtlanta (Region IV), Dallas (Region VI), Kansas City (Region VI), andChicago (Region V). These four regions contained more than 75 percent of theRHCs in the country.
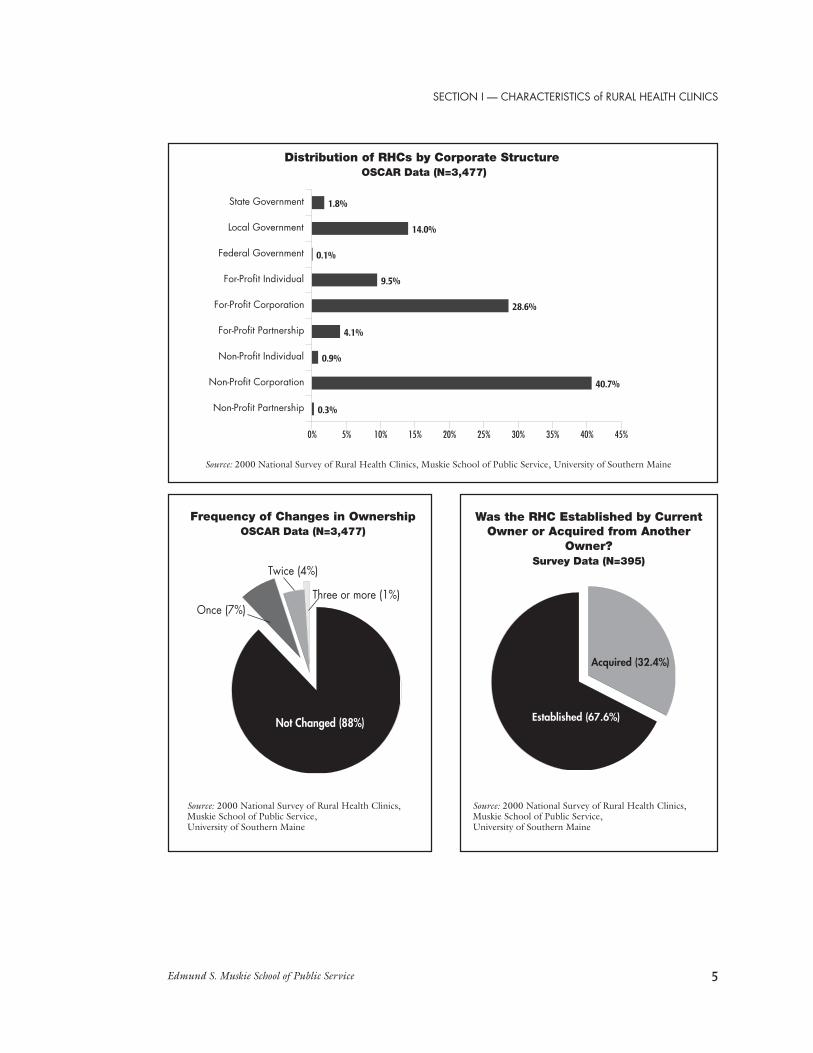
� The most common corporate structures were non-profit corporations (41percent of the total population), for-profit corporations (29 percent), andgovernmental entities (16 percent).
1

Edmund S. Muskie School of Public Service
� Independent clinics were most commonly owned by physicians (49 percent),other individuals or corporate entities (29 percent), hospital corporations (15percent), NPs, PAs, or CNMs (7 percent), or RHC administrators (1 percent).
� Provider-based clinics are owned by hospitals of less than 50 beds (50 percent),hospitals of more than 50 beds (40 percent), and nursing homes and otherowners (10 percent).
� RHCs exhibit stable ownership patterns. Based on data contained in theOSCAR files, only 12 percent of RHCs have changed ownership since the dateof their original certification. Seven percent of all RHCs have changedownership only once. The remaining 5 percent have changed ownership two ormore times.
� Among the survey respondents, 68 percent reported that the clinic had beenestablished by the existing owner. Of the remaining 32 percent, 72 percent(N=101) converted to RHC status after acquisition of the clinic.
� Fourteen percent of therespondents report operating asother than an RHC (e.g., theyprovide services to patientsoutside of their operations as anRHC).
� On average, RHCs are openapproximately 41 hours perweek. The most typical hours ofoperation are Monday throughFriday. Comparatively few offerSaturday hours (19 percent) andeven fewer (3 percent) offerSunday hours.
� Sixty percent of respondents (N=361) indicated that their RHC had convertedfrom some other type of provider organization.
� Of these 361 clinics, 74 percent reported converting to RHC status from aprivate physician practice, 12 percent converted from a hospital outpatientclinic, 7 percent converted from a community-owned clinic, and 7 percentconverted from another practice type.
Distribution of RHCs by Clinic TypeOSCAR Data (N=3,477)
Source: 2000 National Survey of Rural Health Clinics,Muskie School of Public Service, University of Southern Maine
Provider-Based48%
Independent52%
2
Edmund S. Muskie School of Public Service
� The large percentage of RHCs that had converted from private physicianpractices (74 percent of those clinics that had converted from another type ofpractice) suggests that the additional reimbursement available under the RHCprogram may help to stabilize private practices that do not have the resourcesand support available to hospital or community owned clinics. Additional studyis needed to better understand the role of cost-based reimbursement insustaining small rural practices.
� Conversion to RHC status improved the availability of services through theexpansion of existing staffing levels and the addition of new staff to theseclinics.
• Average physician staffing increased from 1.5 to 2.8 FTEs.
• The number of clinics employing NPs, PAs, and/or CNMs increased by afactor of 2.3 from 168 clinics to 281.
• The number of clinics employing mental health practitioners increased from4 to 31 clinics.
Distribution of RHCs by CMS (HCFA Region)OSCAR Data (N=3,477)
Source: 2000 National Survey of Rural Health Clinics,Muskie School of Public Service, University of Southern Maine
Region X-Seattle
Region IX-San Francisco
Region VIII-Denver
RegionVII-Kansas City
Region VI-Dallas
Region V-Chicago
Region IV-Atlanta
Region III-Phildelphia
Region II-New York
Region I-Boston
0% 5% 10% 15% 20% 25% 30%
3.5%
6.4%
6.5%
16.0%
19.6%
15.9%
23.8%
5.3%
0.3%
2.7%
SECTION I — CHARACTERISTICS of RURAL HEALTH CLINICS
3

Edmund S. Muskie School of Public Service
Independent RHCs by Type of OwnerSurvey Data (N=326)
Provider-Based RHCs by Type of OwnerSurvey Data (N=292)
Source: 2000 National Survey of Rural Health Clinics, Muskie School of Public Service, University of Southern Maine
Source: 2000 National Survey of Rural Health Clinics, Muskie School of Public Service, University of Southern Maine
Hospital Corporation
Certified Nurse Midwife
RHC Administrator
Other
Physician Assistant
Physician
Nurse Practitioner
0% 10% 20% 30% 40% 50% 60%
15.0%
0.3%
0.9%
29.1%
2.8%
48.5%
3.4%
Other
Skilled Nursing Facility
Hospital of 49 or Fewer Beds
Hospital of 50 or More Beds
0% 10% 20% 30% 40% 50% 60%
9.9%
0.3%
50.3%
39.4%
4
Edmund S. Muskie School of Public Service
Not Changed (88%)
Once (7%)
Twice (4%)
Three or more (1%)
Frequency of Changes in OwnershipOSCAR Data (N=3,477)
Source: 2000 National Survey of Rural Health Clinics, Muskie School of Public Service, University of Southern Maine
Source: 2000 National Survey of Rural Health Clinics,Muskie School of Public Service,University of Southern Maine
Distribution of RHCs by Corporate Structure OSCAR Data (N=3,477)
Was the RHC Established by CurrentOwner or Acquired from Another
Owner?Survey Data (N=395)
Non-Profit Partnership
Non-Profit Corporation
Non-Profit Individual
For-Profit Partnership
For-Profit Corporation
For-Profit Individual
Federal Government
Local Government
State Government
0% 5% 10% 15% 20% 25% 30% 35% 40% 45%
0.3%
40.7%
0.9%
4.1%
28.6%
9.5%
0.1%
14.0%
1.8%
Source: 2000 National Survey of Rural Health Clinics,Muskie School of Public Service,University of Southern Maine
Acquired (32.4%)
Established (67.6%)
SECTION I — CHARACTERISTICS of RURAL HEALTH CLINICS
5

Edmund S. Muskie School of Public Service
If Acquired from Another Owner, WhenDid RHC Conversion Occur?
Survey Data (N=140)
Source: 2000 National Survey of Rural Health Clinics,Muskie School of Public Service,University of Southern Maine
Are Facilities Operating asOther than an RHC?Survey Data (N=589)
Source: 2000 National Survey of Rural Health Clinics,Muskie School of Public Service, University of Southern Maine
Average Weekly Hours of OperationSurvey Data (N=401)
Yes (13.8%)
No (86.2%)
Source: 2000 National Survey of Rural Health Clinics,Muskie School of Public Service,University of Southern Maine
Total Hours
Friday
Thursday
Wednesday
Tuesday
Monday
0 5 10 15 20 25 30 35 40 45
41.9
8.1
8.5
8.3
8.4
8.6
Converted after Acquisition (72.1%)
Converted prior to Acquisition (27.9%)
Converted afterAcquisition (72.1%)
6

Edmund S. Muskie School of Public Service
Did RHCs Convert from Some Other Typeof Provider Organization?
Survey Data (N=601)
Source: 2000 National Survey of Rural Health Clinics, Muskie School of Public Service, University of Southern Maine
Type of Provider Entity from which RHC ConvertedSurvey Data (N=361)
Unknown (2%)
No (38%)Yes (60%)
Other
Federally Qualified Health Center
Hospital Outpatient Clinic
Midlevel Clinic
Community or Publicly Operated Clinic
Private Physician Practice
0% 10% 20% 30% 40% 50% 60% 70% 80%
72.3%
6.9%
1.1%
12.2%
0.6%
6.9%
Changes in Staffing for RHCs that Converted from Existing PracticesSurvey Data
Source: 2000 National Survey of Rural Health Clinics, Muskie School of Public Service,University of Southern Maine
Prior to Conversion At Date of SurveyProvider Types FTEs N FTEs N
Physicians 1.5 296 2.8 311
Physicians Assistants 1.2 91 1.2 176
Nurse Practitioners 1 69 1.1 198
Certified Nurse Midwives 1.3 8 1 7
PhD Level Clinical Psychologists 0.1 1 0.6 9
Master’s Level clinical Psychologists 0 0 0.7 6
Clinical Social Workers 1 3 0.7 12
SECTION I — CHARACTERISTICS of RURAL HEALTH CLINICS
7

Edmund S. Muskie School of Public Service8

Edmund S. Muskie School of Public Service
Section II
Staffing and Recruitment Issues
BackgroundStaffing and recruitment issues are a major concern for RHCs. To qualify for RHC
certification, a clinic must be located in a non-urbanized area as defined by the U.S.Bureau of the Census and an area designated as a Health Professional Shortage Area(HPSA), Medically Underserved Area (MUA), or a Governor’s Designated ShortageArea (GDSA). RHCs face staffing difficulties created by distribution patterns in whichproviders are less likely to practice in rural areas, by shortages of health professionals,and competition with other rural health care providers. For example, 20 percent of thenation’s population live in rural areas. Less than 11 percent of the nation’s physicians,however, practice in these areas (NRHA, 1998). Although shortages of NPs, PAs,CNMs, registered nurses, and allied health professionals have an impact on all providers,they have a disproportionate impact on rural communities (U.S. Congress, Office ofTechnology Assessment, 1990). As a result, RHCs are forced to compete with rural healthcare providers for this limited pool of health care providers who are interested in, andwilling, to practice in rural areas.
In order to identify the staffing and recruitment issues faced by RHCs, wesurveyed RHCs on their professional staffing patterns, vacancies, and recruitmentdifficulties. Additional work is needed to determine the ability of RHCs to competewith other rural providers for staff, particularly those rural providers that receive cost-basedreimbursementwithoutpayment caps(e.g., CriticalAccessHospitals andRHCs ownedby hospitalsfor hospitalsof less than50 beds).
Number of FTEs N Range
Physicians 1.7 503 0.05-15
Physicians Assistants 1.2 305 0.05-8
Nurse Practitioners 1.1 303 0.05-6
Certified Nurse Midwives 0.09 10 0.2-2
Overall Mid-Level Staffing 1.3 561 .07-8
Other Clinical Staff 3.3 49 0.1-15
Clinical Psychologists: PhD 0.06 13 0.1-1
Clinical Psychologists: Masters 0.06 13 0.1-1
Clinical Social Workers .07 22 0.1-2
Rural Health Clinic Staffing PatternsSurvey Data
Source: 2000 National Survey of Rural Health Clinics,Muskie School of Public Service, University of Southern Maine
9

Edmund S. Muskie School of Public Service
Physicians 108 18% 83 77% 101 10.3%
NPs, PAs, and/or CNMs 122 20% 49 40% 99 4.7%
Clinical Psychologists: 6 1% 5 83% 5 6.9% PhD, Clinical Psychologists: Masters, and/or clinical Social Workers
RHCs Reporting Vacancies and Recruitment Difficultiesduring the Past Year
Survey Data
Source: 2000 National Survey of Rural Health Clinics,Muskie School of Public Service, University of Southern Maine
Vacant Trouble Average Positions Recruiting? Number of
Months VacantN % N % N %
Key Findings� The average RHC employs 1.7 FTE physicians and 1.3 FTE midlevel providers
(PAs, NPs, and/or CNMs). Staffing patterns are similar across independent andprovider-based RHCs.
� Despite regulatory changes that allow RHCs to receive cost-based reimbursementfor the services of clinical psychologists and clinical social workers, very few havechosen to do so. Of our survey respondents, only 13 indicated that they employed aPhD-level psychologist; another 13 employed a master’s-level psychologist, and 22employed a clinical social worker.
� Eighteen percent of responding clinics indicated that they had a vacant physicianposition during the last year. Of those RHCs with physician vacancies, 77 percentindicated that they had trouble recruiting and filling the position. The averagephysician vacancy was open 10 months before being filled.
� Twenty percent indicated that they had a vacant NP, PA, or CNM position duringthe past year. Of those clinics with vacant NP, PA, and CNM positions, 40 percenthad trouble recruiting a replacement. The positions remained open 4.7 monthsbefore being filled.
� Although based on small numbers (six vacancies), 83 percent of RHCs attemptingto fill mental health vacancies (master’s-level psychologists, PhD-level psychologists,and/or and clinical social workers) reported trouble with recruiting. Mental healthpositions remained vacant an average of five months before being filled.
10

Edmund S. Muskie School of Public Service
Source: 2000 National Survey of Rural Health Clinics,Muskie School of Public Service, University of Southern Maine
Source: 2000 National Survey of Rural Health Clinics,Muskie School of Public Service, University of Southern Maine
Percentage of Practices with Vacant PositionsSurvey Data (N=611)
Percentage of RHCs with Vacancies Reporting Recruiting DifficultiesSurvey Data
Physicians (N=108)
NPs, PAs, CNMs (N=122)
Mental Health Providers (N=6)
0% 5% 10% 15% 20% 25%
1.0%
20.0%
18.0%
Physicians (N=83)
NPs, PAs, CNMs (N=49)
Mental Health Providers (N=5)
0% 10% 20% 30% 40% 50% 60% 70% 80% 90%
83.3%
40.2%
76.9%
SECTION II — STAFFING AND RECRUITMENT
11

Edmund S. Muskie School of Public Service
Average Length of Vacancy in Months by Type ofClinician during the Past Year
Survey Data
Source: 2000 National Survey of Rural Health Clinics,Muskie School of Public Service, University of Southern Maine
Physicians (N=101)
NPs, PAs, CNMs (N=99)
Mental Health Providers (N=5)
0 2 4 6 8 10 12
6.9
4.7
10.3
6.9 months
4.7 months
10.3 months
12

Edmund S. Muskie School of Public Service
Section III
Financial Operations
BackgroundAt the time of our survey, one of the major incentives offered by the RHC
program is Medicare and Medicaid cost-based reimbursement.1 RHCs are paid a cost-based, all-inclusive per-visit rate. Independent RHCs, and provider-based RHCs ownedby hospitals of 50 beds or more, were subject to a reimbursement rate cap of $60.40 in1999 and $61.85 in 2000. Provider-based RHCs owned by hospitals of less than 50beds are not subject to a cap on reimbursement. For purposes of reimbursement, theper-visit rate covers all applicable RHCs services rendered to a patient on a given day byone or more health professionals employed by the RHC.
The per-visit rate is based on the applicable costs of providing covered RHCservices. The RHC is paid the lesser of their costs (as expressed by the per-visit rate) orthe per-visit reimbursement rate cap. Independent RHCs must submit the MedicareCost Report for Independent Federally Qualified Health Centers/Rural Health Clinics(HCFA 222) form annually to document their costs, productivity rates, and otherminimum statistical data necessary to calculate the RHCs cost per-visit. Costs forprovider-based RHCs are established from the cost report of the sponsoring provider.
Independent RHCs are subject to a baseline productivity standard of 6,300 annualMedicare and Medicaid annual visits for each medical team (the Calculated MinimumStandard), consisting of one full-time equivalent (FTE) physician and one FTE mid-level provider (Travers, Ellis, and Dartt, 1995). This rate is prorated to reflect differingFTE staffing patterns for each clinic. The greater of the individual RHC’s productivityrate, or the Calculated Minimum Standard (CMS) for productivity, is used to calculatethe clinic’s per-visit rate. Clinics that do not meet the CMS standard for their given levelof staffing are penalized through the use of the higher CMS rate in the calculation oftheir per-visit rate. Provider-based RHCs are not subject to these productivity standards.
Although cost-based reimbursement is an important benefit for RHCs, it must beviewed in the context of the overall payer mix for RHCs. RHCs are heavily dependenton Medicare and Medicaid as payer sources for a large percentage of their patients. Itshould also be remembered that cost-based reimbursement covers only the costs ofproviding RHC services to Medicare and Medicaid patients. It does not provide forprofit nor cover the costs of treating uninsured or indigent patients. In light of the capon reimbursement for many RHCs, many RHCs administrators argue that they are stillnot covering their costs, despite the receipt of cost based reimbursement.
13

Edmund S. Muskie School of Public Service
In an effort to shed some light on these issues, we asked a series of financialquestions on our survey related to the adjusted cost-per-visit reported by the RHC,total expenses, total revenues, payer mix, and the receipt of outside funding to supportthe clinic.
As the BIPA 2000-mandated Medicaid PPS payment methodology wasimplemented subsequent to our survey, we are unable to discuss the impact of thischange on the financial status of RHCs. Further research is needed to understand theimpact of this payment methodology on RHCs, as well as on the access to services forMedicaid patients served by them.
Key Findings� On average, RHCs reported that total expenses exceed total revenues for both
independent and provider-based RHCs.
• Annual total expenses for independent RHCs ($731,174) exceeded totalrevenues ($690,669) by $40,505 (N=148).
• Annual total expenses for provider-based RHCs ($590,617) exceeded totalrevenues ($522,176) by $38,441 (N=81).
� Independent RHCs reported an adjusted cost-per-visit of $66.31 compared to$81.01 for provider-based clinics. As mentioned earlier, per-visit reimbursementfor independent RHCs and provider-based RHCs owned by hospitals of 50 ormore beds was capped at $60.40 in 1999 (United Government Services, LLC.,1999) and $61.85 in 2000 (Health Care Financing Administration, 2000).
� The lower shortfall in revenues for provider-based RHCs can be explained, inpart, by the fact that RHCs owned by hospitals of less than 50 beds are notsubject to the cap on per-visit reimbursement that applies to independentRHCs and provider-based RHCs owned by hospitals of 50 beds or more.
� Medicare and Medicaid account for slightly more than 54 percent of RHCvolume when measured as a percentage of revenues (just under 56 percentwhen measured as a percentage of patient visits).
� Commercial and private insurances account for just under 30 percent of RHCrevenues (slightly more than 28 percent of patient visits).
� Uninsured, private-pay and free/reduced-cost care patients account for slightlyless than 15 percent of RHC revenues and patient visits.
14

Edmund S. Muskie School of Public Service
� Many RHCs have difficulty distinguishing between revenues generated byprivate-pay patients and revenues generated by indigent patients. Similarly, theyhave difficulty distinguishing charges written off as bad debt from chargeswritten off for free/reduced-cost care.
� Comparatively few RHCs receive outside funding to support their efforts.Twenty percent of independent RHCs report receiving some form of outsidefunding compared to 16 percent of provider-based RHCs.
� The most common form of outside funding received by RHCs (as measured bythe number of respondents indicating that they received these funds) were:• State funds (N=25)• Municipal and county funds (N=17)• Other funds (N=17)• Foundation and private grants (N=12)• Individual voluntary contributions (N=12)• Federal funds (N=9)
� For these respondents, outside funds represented between 4 and 27 percent oftotal revenues.
1 As discussed earlier, BIPA 2000-mandated that Medicaid payments be made RHCs under aprospective payment system methodology effective January 1, 2001. Under BIPA 2000, states may elect touse an alternative payment methodology as long as the payments made under the alternative methodologyare equal to or exceed the payments that would be made under the BIPA 2000-mandated PPSmethodology, and the alternative methodology is agreed to by each individual RHC to which the statewishes to apply the methodology.
Total Revenues, Expenses, and Adjusted-Cost-Per-VisitSurvey Data
Source: 2000 National Survey of Rural Health Clinics, Muskie School of Public Service,University of Southern Maine
All RHCs $641,683 229 $681,457 229 $71.51 229
Independent RHCs $690,669 148 $731,174 148 $66.31 148
Provider-Based RHCs $552,176 81 $590,617 81 $81.01 81
Total Total Adjusted CostRevenues N Expenses N Per Visit N
SECTION III — FINANCIAL OPERATIONS
15

Edmund S. Muskie School of Public Service
Proportion of Revenues and Patient Visits by payer TypeSurvey Data
Source: 2000 National Survey of Rural Health Clinics,Muskie School of Public Service, University of Southern Maine
Medicare 29.9% 315 30.8% 440
Medicaid/SCHIP 24.4% 313 25.0% 330
Uninsured/Private Pay/FreeCost Care 14.7% 299 14.6% 410
Commercial/Private Insurance 29.5% 299 28.4% 422
Other 4.2% 312 3.9% 374
Payer Percent of Percent ofType Revenues N Patient Visits N
Source: 2000 National Survey of Rural Health Clinics,Muskie School of Public Service,University of Southern Maine
Are RHCs Receiving OutsideFunding to Support
Patient Care Activities?Survey Data (N=390)
Percentage of Revenues Received from Outside Funding SourcesSurvey Data
YES NO0%
10%
20%
30%
40%
50%
60%
70%
80%
90%
20%16%
80%84%
Independent RHCs Provider-Based RHCs
All RHCs Independent RHCs Provider-Based RHCs N Percentage N Percentage N Percentage
of Revenues of Revenues of Revenues
Source: 2000 National Survey of Rural Health Clinics, Muskie School of Public Service,University of Southern Maine
Individual Voluntary Contribution 12 4.4% 10 4.2% 2 25.5%
Federal Funds 9 26.8% 5 30.7% 4 22.0%
State Funds 25 23.6% 17 21.0% 8 29.1%
Municipal/County Funds 17 22.5% 9 22.8% 4 22.1%
Foundation/Private Grants 12 13.2% 8 7.6% 4 24.3%
Other 17 17.7% 13 18.4% 4 15.3%
16

Edmund S. Muskie School of Public Service
Section IV
Location of RHCs Relative toUnderservice and Access Problemsof Rural Communities
BackgroundThe RHC program, as created in 1977 by P.L. 95-210, is intended to increase
access to primary health care services for residents of rural medically underserved areas.To qualify for RHC certification, a clinic must be located in a non-urbanized area asdefined by the U.S. Bureau of the Census and an area designated as a HealthProfessional Shortage Area (HPSA), Medically Underserved Area (MUA), or aGovernor’s Designated Shortage Area (GDSA). Although the Federal regulations donot require RHCs to provide services to specific populations, the program is based onthe assumption that maintaining the health care infrastructure in rural communities willresult in improved access for vulnerable populations (e.g., Medicare beneficiaries,Medicaid recipients, low income patients, and uninsured patients).
With the significant growth in the number of RHCs during the mid-1990s,Medicare officials, state Medicaid directors, the General Accounting Office (GAO), andthe Inspector General of the Department of Health and Human Services (OIG) haveincreasingly scrutinized the level of federal and state funding for the program. Reportsissued by the GAO and the OIG in 1996 criticized the program and suggested that theincreased Medicare and Medicaid payments to RHCs did not result in improved accessto care in isolated areas.
Specifically, the GAO was concerned that: “the Program had lost its focus onserving Medicare and Medicaid populations experiencing difficulty obtaining primarycare in isolated rural areas” (U.S. General Accounting Office, 1996). Although, aspreviously discussed, the original legislation did not solely target the program to isolatedrural areas. Based on their analysis of RHCs in four states (Alabama, Kansas, NewHampshire, and Washington), the GAO suggested that the additional paymentsprovided to RHCs by the Medicare and Medicaid programs increasingly benefitedclinics in suburban areas that already had extensive health care delivery systems in place(U.S. General Accounting Office, 1996). They further noted that the program’s benefitswere best exemplified by RHCs located in small rural communities. Finally, theyobserved that the broad eligibility criteria allowed program growth in areas where theneed was minimal.
17

Edmund S. Muskie School of Public Service
The OIG had similar concerns based on data obtained from CMS’s OSCARdatabase, interviews with state Medicaid agencies, and case studies of three states(Illinois, Mississippi, and Texas). In regards to access, the OIG found that RHCsappeared to be filling a need for primary care in some rural areas, but they did notalways increase access to primary care as the law intended. They also found there wereno reliable data quantifying the impact of RHCs on access to care.
In addition, both reports raised concerns about the process used to identify anddesignate health professional shortage areas. They also criticized the grandfatheringprovision contained in the original act that allowed an RHC to retain its certificationregardless of the loss of its rural status or shortage area designation. The GAO hadraised some of these same issues in an earlier report that questioned the usefulness ofshortage area designations in directing resources to underserved areas (U.S. GeneralAccounting Office, 1995). They found that the value of shortage area designations intargeting underserved areas was undermined by two primary flaws in the shortage areadesignation process. The first flaw related to the fact that half of the underservicedesignations were outdated and, therefore, might not accurately portray the availabilityof health care professionals in those areas. The second flaw involved the methodologyused to determine shortage areas designations. The existing methodology did not (andstill does not) count important primary care providers, such as nurse practitioners,physician assistants, and certified nurse midwives when calculating population to full-time equivalent primary care provider ratios; thereby, potentially underestimating theavailable supply of primary care providers.
In response to these two studies, HCFA (now CMS) contracted with MathematicaPolicy Research, Inc. to evaluate the program. Mathematica conducted a pre-postexamination of 18 clinics designated in 1992 and 1993 in six states (California, Kansas,Maine, Michigan, North Carolina, and Texas). In contrast to the GAO and OIGstudies, Mathematica found that the program did improve access to care at substantial,but not unreasonable cost (Cheh and Thompson, 1997). Specifically, they found thatclinics added health care providers to the community and increased service use;Medicaid recipients living in larger rural communities experienced the greatestimprovements in access; emergency room use declined in communities with new RHCs;and increases in Medicare payments were primarily due to enhanced payment rates,while increases in Medicaid payments were primarily due to improved access.
The Balanced Budget Act of 1997 (BBA 1997) contained provisions to addresssome of the concerns with the RHC Program. Specifically, it contained provisions torefine the definition of what constitutes a qualifying rural shortage area for purposes ofRHC certification. Under the proposed rules implementing the provisions of BBA1997, clinics must be located in non-urbanized areas that have been designated (or had
18

Edmund S. Muskie School of Public Service
their shortage area designation renewed) within the past three years to be certifiedas a RHC, or retain their existing certification (Federal Register, 2000). Those RHCsthat are located in areas no longer classified as non-urbanized will automatically losetheir certification under the proposed rules. Furthermore, those clinics that are locatedin areas whose shortage area designations are more than three years old will also losetheir certification, unless the designation is updated or they qualify under one of fiveexceptions identifying the RHC as an “essential provider.” As of October 31, 2002,the proposed rules were still under review by the Center for Medicare and MedicaidServices.
We used multiple approaches to understand where RHCs are located relative to theunderservice and access problems of rural communities. These included analyses that:examined the rurality of the areas in which RHCs are located using the Rural UrbanCommuting Area Codes, Zip Code Approximation file developed by the WWAMI RuralHealth Research Center at the University of Washington;1 identified the status of theshortage area designation for the areas in which RHCs are located using the 2000 AreaResource File; described the economic and policy characteristics of the counties in whichRHCs are located using the county typology codes developed by the EconomicResearch Service of the U.S. Department of Agriculture (Cook and Mizer, 1994);2 anddescribed the reported difficulty in accessing primary care and specialty services, basedon data collected through our survey.
Readers should be cautious in interpreting these data as they are only descriptivemeasures of the areas in which RHCs are located. As with earlier studies, our studysuffers from the same lack of reliable data quantifying the impact of this program onaccess. On the other hand, our measures of rurality, shortage area designations, andcounty typology codes are based on the total population of RHCs (3,477 at the time ofour study) rather than the more-limited sample used by earlier studies.
SECTION IV — LOCATION of RHCs
19
Edmund S. Muskie School of Public Service
Key Findings� Over 69 percent (2,407) of all RHCs are located in zip codes classified as small
towns (with populations of less than 10,000) or isolated rural areas. Slightly lessthan 17 percent (581) are located in zip codes classified as large towns (withpopulations of 10,000 to 49,999). Just under 13 percent (438) are located inzip codes classified as suburban areas (large, towns, small towns, or isolatedrural areas with strong commuting ties to an urban core area), although theystill meet the definition of non-urbanized areas as required by the RHC Act.Finally, 1.5 percent (51) are located in areas currently classified as urban coreareas (urbanized areas with populations of 50,000 or more).3
� Thirty-three percent of all RHCs are located in whole county HealthProfessional Shortage Areas (HPSAs). Another 40 percent are located in partialcounty HPSAs. Twenty-four percent are located in Medically UnderservedAreas (MUAs). Less than 1 percent are located in Governor DesignatedShortage Areas. Almost 3 percent are located in areas that are no longerdesignated as shortage areas.
� Thirty percent (1,041) of all RHCs are located in counties classified as“adverse” according to the economic typology codes. Of this group, 18 percent(620) are in counties classified as “farming dependent,” with extremely highratios of dependent populations to working-age adults and deterioratingeconomic bases; 5 percent (175) are in counties classified as “miningdependent” that experienced significant outmigration and economic declineduring the 1980s; and 7 percent (246) are in counties classified as “governmentdependent,” with levels of economic well-being that are lower than that for allnon-metro counties.
� Fifty-one percent (1,753) of all RHCs are located in counties classified as“adverse,” according to the policy typology codes. Of this group, 23 percent(792) are in counties classified as “persistent poverty” counties, with povertyrates of 20 percent or higher; 17 percent are in “transfer dependent” countiesthat depend heavily on unearned income from government transfer payments;and 11 percent (387) are in “commuting” counties, in which the level ofeconomic activity within the local economy is less than that for all non-metrocounties due to the outflow of workers.
� According to our survey respondents, indigent patients in their communitieshave the most difficulty obtaining primary care, with over 32 percent indicatingdifficulty levels of significant to extreme. Thirty-four percent of the respondents
20

Edmund S. Muskie School of Public Service
thought that both Medicaid and self-pay patients experienced moderate toextreme difficulty in accessing primary care services. Medicare and commercialpatients were reported to have the least difficulty, with 75 percent and 80percent respectively, indicating difficulty levels of minimal to limited.
� Respondents indicated that all five payer classes experienced a greater degree ofdifficulty in obtaining specialty-care services (compared to primary careservices) in their communities. Sixty percent reported that indigent-carepatients experience significant to extreme difficulty in obtaining specialty-careservices. Forty-four percent reported that both Medicaid and self-pay patientsexperienced significant to extreme difficulty in obtaining specialty care. As withprimary care, Medicare and commercial patients were thought to have the leastamount of difficulty, with 44 and 50 percent respectively falling into theminimal to limited categories.
1 Version 1.1 of the Rural Urban Commuting Area Codes, Zip Code Approximation File are based on 1990Census data. The process of updating the RUCA taxonomy to the 2000 Census had not been completed as of thepublication of this chartbook.
2 The county typology codes identify 11 types of nonmetropolitan counties according to either the primaryeconomic activity or other themes of social policy significance. The economic county typology codes are dividedinto six mutually exclusive classifications defined by primary economic activity. They can be further categorized aseconomically adverse (farming dependent, mining dependent, and government dependent) or favorable(manufacturing dependent, service dependent, and non-specialized counties) based on the economic performanceof these counties. The policy typology codes are divided into five overlapping classifications defined by applicablethemes of special policy significance. They may also be categorized as adverse (persistent poverty, transfer-dependent, and commuting counties) or favorable (retirement or federal lands counties based on the impact of thesepolicy characteristics on the county.
3 This estimate was made using Version 1.1 of the Rural Urban Commuting Area codes which are based on1990 Census data. Indications are that this number may be significantly higher when 2000 Census rural and urbanclassifications are available, although this has yet to be verified.
SECTION IV — LOCATION of RHCs
21

Edmund S. Muskie School of Public Service
Distribution of RHCs by Georgraphic LocationOSCAR Data (N=3,477)
Source: 2000 National Survey of Rural Health Clinics,Muskie School of Public Service, University of Southern Maine
Urban Core: 1% Suburban Areas:13%
Large TownAreas: 17%
Small Town and IsolatedAreas: 69%
Source: 2000 National Survey of Rural Health Clinics,Muskie School of Public Service, University of Southern Maine
Whole County HPSA
Partial County HPSA
Medically Underserved Area
Governor Designated Shortage Area
Not Designated
Shortage Area Designations for the Countiesin which RHCs Are Located
OSCAR Data (N=3,477)
0.0% 5.0% 10.0% 15.0% 20.0% 25.0% 30.0% 35.0% 40.0% 45.0%
33.1%
39.8%
23.8%
0.6%
2.7%
22

Edmund S. Muskie School of Public Service
Location of RHCs by County Typology CodeOSCAR Data (N=3,477)
Source: 2000 National Survey of Rural Health Clinics,Muskie School of Public Service, University of Southern Maine
ECONOMIC
POLICY
Farming Dependent
Mining-Dependent
Manufacturing Dependent
Government-Dependent
Service-Dependent
Nonspecialized
0.0% 5.0% 10.0% 15.0% 20.0% 25.0%
18.0%
5.0%
17.0%
7.0%
13.0%
22.0%
Retirement Destination
Federal Lands
Commuting
Persistent Poverty
Transfer-Dependent
0.0% 5.0% 10.0% 15.0% 20.0% 25.0%
8.0%
6.0%
11.0%
23.0%
17.0%
SECTION IV — LOCATION of RHCs
23

Edmund S. Muskie School of Public Service
Medicare Medicaid Commercial Self-Pay Indigent0%
10%
20%
30%
40%
50%
60%
70%
57%
18%15%
8%
2%
50%
17%15%12%
7%
60%
20%
14%
5%1%
49%
18%19%
10%
5%
41%
14%13%16% 16%
Minimal Limited Moderate Significant Extreme
Source: 2000 National Survey of Rural Health Clinics, Muskie School of Public Service, University of Southern Maine
Difficulty in Accessing Primary Care Services in AreasServed by RHCs as Reported by Survey Respondents (N=611)
Medicare Medicaid Commercial Self-Pay Indigent0%
5%
10%
15%
20%
25%
30%
35%
40%
22% 22%
25%
21%
10%
17%18%
22%
25%
19%
27%
23%24%
17%
9%
16%17%
24%
27%
17%
12% 12%
16%
26%
34%
Minimal Limited Moderate Significant Extreme
Difficulty in Accessing Specialty Care Services in AreasServed by RHCs as Reported by Survey Respondents (N=611)
Source: 2000 National Survey of Rural Health Clinics, Muskie School of Public Service, University of Southern Maine
24

Edmund S. Muskie School of Public Service
Section V
Proximity to Other RHCs and PrimaryCare Services
BackgroundThe GAO and the OIG have raised concerns about situations in which multiple
RHCs were located in the same community, or in which RHCs were located incommunities with established health care infrastructures. In addition, the OIG raisedconcerns about the potential for RHCs, as a result of their preferential Medicare andMedicaid reimbursement, to compete unfairly with private practices, community healthcenters, and federally qualified health centers. Using data from OSCAR on thepopulation of RHCs, we were able to look at the issue of where RHCs are located andhow they are distributed on a national basis. In addition, our survey data allow us todescribe the health care infrastructure of the communities in which RHCs are located.
Readers should be cautious when interpreting the data related to the health careinfrastructure of the communities in which RHCs are located. The data on theproviders, facilities, and agencies in a given community were reported by the surveyrespondents. The number of respondents that did not provide data on theircommunities was quite high, ranging from 16 to 46 percent overall. In addition, thedistribution of the responses exhibited two patterns that influenced the calculation ofthe mean or average response. First, a high percentage of the respondents who answeredthis question reported “none” when asked about the number of different types ofproviders in their communities. The percentage ranged from a low of 12 percent fordentists to a high of 45 percent for school-based clinics. Second, some respondentsreported unusually high numbers for different types of providers. As a result, we havereported both the mean (or average) number of providers, as well as the median (ormidpoint) response. We have used the median, or most common response, for eachcategory to describe the health care infrastructure in the communities in which RHCsare located.
The presence of other health care providers does not necessarily mean that RHCsare not improving access in rural communities. The impact on access within thesecommunities cannot be determined without further study, using Medicare and Medicaidclaims data and patient utilization patterns within individual communities.
25

Edmund S. Muskie School of Public Service
Hospitals 0.9 1 514 0-20 26% 16%
Outpatient Clinics 0.8 1 427 0-10 30% 30%
Primary Care Physicians/Practices 3 1 450 0-50 20% 26%
Specialty Care Physicians/Practices 2.8 0 371 0-50 33% 39%
Public Health Clinics 0.7 1 442 0-7 24% 28%
School-Based Clinics 0.2 0 310 0-6 45% 49%
Other RHCs 0.7 0 389 0-6 33% 36%
FQHCs .30 0 331 0-7 41% 46%
Mental Health Agencies 0.7 1 416 0-5 26% 32%
Family Planning Agencies 0.5 0 379 0-3 33% 38%
Home Health Agencies 1.3 1 465 0-30 19% 24%
Dentists 3.0 2 483 0-50 12% 21%
Key Findings� Over 81 percent (2,242) of the zip codes in which RHCs are located have
only one RHC. Less than 19 percent (513) of the zip codes have more thanone RHC located within them.
� The average number of RHCs located in zip codes with more than one RHCis 2.4.
� The typical health care infrastructure of the communities in which RHCs arelocated consists (based on the median response) of a hospital, an outpatientclinic, a primary care physician/practice, a public health clinic, a mentalhealth agency, a home health agency, and two dentists.
The Health Care Infrastructure of Communities in which RHCs Are LocatedSurvey Data (N=611)
Source: 2000 National Survey of Rural Health Clinics, Muskie School of Public Service,University of Southern Maine
Provider Type Mean Median N Range of Percent Percent “NoResponses Reporting Response”
“None”
Distribution of RHCs by Zip CodeOSCAR Database
Source: 2000 National Survey of Rural Health Clinics, Muskie School of Public Service,University of Southern Maine
Mean # of RHCs in zip codes with more than one RHC 2.4
Percent of zip codes with multiple RHCs N=513 18.6% (Total Number of zip codes = 2,755)
Percent of zip codes with only one RHC N=2,242 81.4%
Range of RHCs in single zip code 1 7
26

Edmund S. Muskie School of Public Service
Section VI
Safety Net Role of RHCs
BackgroundRHCs are increasingly viewed as safety net providers (Gaston, 1997, Buto, 1997,
and Gage, 2000) given their role in serving Medicare, Medicaid, and other vulnerablepopulations in rural areas. Unfortunately, the application of this term to RHCs hascreated potentially unrealistic expectations for the program. This is due to the generallack of agreement on which providers comprise the safety net. Similarly, there is ageneral lack of understanding on what constitutes safety net services.
The Institute of Medicine (IOM) in America’s Health Care Safety Net: IntactBut Endangered (Lewin and Altman, 2000) acknowledged this general lack ofagreement. In an effort to bring clarity to the situation, the IOM proposed its owndefinition of safety net providers as:
“Those providers that organize and deliver a significant level of health care and otherhealth-related services to uninsured, Medicaid, and other vulnerable populations.”
The IOM further identified a subset of the safety net that is described as “coresafety net providers.” According to the IOM, core safety net providers have twodistinguishing characteristics: first, they have a legal mandate or explicit mission to offeraccess to services to patients regardless of their ability to pay; second, a substantial shareof their patient mix is uninsured, Medicaid, and other vulnerable populations.
By virtue of the process for certification, RHCs meet the IOM’s definition of safetynet providers, due to their location in rural areas that have also been designated asshortage areas. Although they are not required to provide services to uninsured andindigent patients nor are they paid to do so, a subset of RHCs may also qualify as coresafety net providers according to the IOM’s definition based on ownership, corporatestructures, institutional mission, and/or patient populations.
As mentioned, RHCs are not obligated to provide services to vulnerable andunderserved populations. Although self pay, uninsured, and low income patients makeup a significant portion of the patient base of many RHCs, these facilities receive nospecific reimbursement for the delivery of services to these populations. As discussed inSection III Financial Operations, many RHCs continue to struggle financially despitethe provision of cost-based reimbursement.
27

Edmund S. Muskie School of Public Service
In addition, many RHCs do not have the necessary financial reporting systems todistinguish between write offs for bad debt and free/reduced-cost care. As a result, theyare unable to provide accurate data on the amount of free/reduced-cost care theydeliver. Therefore, it is difficult to clearly quantify the level of free/reduced-cost carerendered by RHCs nationally.
Despite the fact that RHCs can be identified as part of the health care safety net,comparatively little is known about the safety net functions they perform and, due to thereporting issues discussed above, the amount of charity and indigent care they render. Inan effort to begin to describe the safety net role of RHCs, we added a number of safetynet-related questions to our survey.
Key Findings� Ninety-seven percent of independent and 99 percent of provider-based RHCs
clinics report that they are accepting new Medicaid patients. In addition, 91percent of both types of clinics are accepting new patients enrolled in StateChildren’s Health Insurance Programs (SCHIP).
� Slightly more provider-based RHCs provide assistance to enroll potentially-eligible patients in Medicaid (66 percent verses 60 percent) and SCHIP (69percent compared to 62 percent) than do independent RHCs. This may be dueto the fact that provider-based RHCs are able to use the registration policiesand support staff of their sponsoring hospitals.
� Most commonly, RHCs provide Medicaid and SCHIP application forms (39and 40 percent of independent and provider-based RHCs respectively) andassistance in completing those forms (37 and 39 percent of independent andprovider-based RHCs respectively). Comparatively few RHCs (7 and 6 percentof independent and provider-based RHCs respectively) work to enroll patientsdirectly in these programs.
� More provider-based RHCs (69 percent) have either formal or informal policescovering the provision of free/reduced cost care to low income patients than doindependent RHCs (55 percent). The difference may be due to the fact thatprovider-based RHCs are likely to have access to the policies and systemsdeveloped by their sponsoring hospitals.
� Of these facilities, 81 percent of independent and 79 percent of provider-basedclinics report that they are accepting new applications from patients for free/reduced-cost care.
28

Edmund S. Muskie School of Public Service
� The most common method for determining eligibility for free/reduced-costcare is an income based sliding fee scale used by 61 percent of independent and65 percent of provider-based RHCs respectively.
� In contrast, 14 percent of independent RHCs and 9 percent of provider-basedRHCs conduct no eligibility determinations.
� The remaining RHCs use a variety of eligibility criteria to qualify patients forthe free/reduced-cost care.
� Fifty-one percent of independent RHCs and 55 percent of provider-basedRHCs wrote off between 0 and 4 percent of total charges as free and reduced-cost care during the past year. Another 24 percent of independent and 18percent of provider-based RHCs wrote off between 5 and 9 percent of totalcharges. Twelve percent of independent RHCs and 11 percent of provider-based RHCs wrote off between 10 and 14 percent of charges. Close to 13percent of independent RHCs and more than 16 percent of provider-basedclinics wrote off 15 percent or more of total charges as free/reduced-cost care.
� Independent RHCs estimated that 9 percent of monthly visits received free orreduced-cost care compared to 7 percent for provider-based RHCs.
Are RCHs Accepting New Medicaidand SCHIP Patients?
Survey Data
Source: 2000 National Survey of Rural Health Clinics, Muskie School of Public Service, University of Southern Maine
Are RCHs Providing Assistance to Enroll Patients in Medicaid
and SCHIP?Survey Data
Independent RHCs Provider-Based RHCs0%
10%
20%
30%
40%
50%
60%
70%
80%
90%
100% 97%91%
99%
91%
Medicaid (N=602) SCHIP (N=564)
Independent RHCs Provider-Based RHCs0%
10%
20%
30%
40%
50%
60%
70%
60% 62%66%
69%
Medicaid (N=598) SCHIP (N=564)
SECTION VI — SAFETY NET ROLE
29

Edmund S. Muskie School of Public Service
Types of Assistance Provided to Enroll Medicaid/SCHIP Eligible PatientsSurvey Data
Do RHCs Have Policies covering the Provision of Free and Reduced-Cost Care?Survey Data (N=587)
Source: 2000 National Survey of Rural Health Clinics, Muskie School of Public Service, University of Southern Maine
Source: 2000 National Survey of Rural Health Clinics, Muskie School of Public Service, University of Southern Maine
Independent RHCs Provider-Based RHCs0%
5%
10%
15%
20%
25%
30%
35%
40% 39%37%
7%
27%
40% 39%
6%
27%
Provides Applications (N=606)
Assists in Completing Forms (N=606)
Enrolls Patients Directly (N=606)
Provides Other Assistance (N=606)
YES NO0.0%
10.0%
20.0%
30.0%
40.0%
50.0%
60.0%
70.0%
55.0%
69.2%
45.0%
30.8%
Independent RHCs (N=311) Provider-Based RHCs (N=276)
30

Edmund S. Muskie School of Public Service
Are RHCs Accepting Applications for Free and Reduced-Cost Care?Survey Data (N=403)
How is Eligibility Determined for Free/Reduced-Cost Care?Survey Data (N=369)
Source: 2000 National Survey of Rural Health Clinics, Muskie School of Public Service, University of Southern Maine
Source: 2000 National Survey of Rural Health Clinics, Muskie School of Public Service, University of Southern Maine
YES NO0%
10%
20%
30%
40%
50%
60%
70%
80%
90%80.9% 78.5%
19.1% 21.5%
Independent RHCs (N=194) Provider-Based RHCs (N=209)
Income-Based Sliding Fee Scale No Determination is Conducted Other0.0%
10.0%
20.0%
30.0%
40.0%
50.0%
60.0%
70.0%
60.6%64.9%
13.5%8.9%
28.8% 27.7%
Independent RHCs (N=175) Provider-Based RHCs (N=194)
SECTION VI — SAFETY NET ROLE
31

Edmund S. Muskie School of Public Service
Source: 2000 National Survey of Rural Health Clinics,Muskie School of Public Service, University of Southern Maine
Percentage of RHC Charges Written Off as Free/Reduced-Cost Careduring the Past YearSurvey Data (N=319)
Source: 2000 National Survey of Rural Health Clinics,Muskie School of Public Service, University of Southern Maine
Percentage of Monthly Visit That Received Free/Reduced-Cost Care during the Past Year
Survey Data (N=319)
% of Visits N RangeAll RHCs 7.8% 292 0 to 98%
Independent RHCs 8.7% 148 0 to 98%
Provider-Based RHCs 7.0% 144 0 to 80%
0 - 4% 5 - 9% 10 - 14% 15 - 19% 20 - 24% 25% or more0.0%
10.0%
20.0%
30.0%
40.0%
50.0%
60.0%
51.3%54.7%
24.4%
18.2%
11.9% 10.7%
4.4% 5.7% 5.6%7.5%
2.5% 3.1%
Independent RHCs (N=160) Provider-Based RHCs (N=159)
32

Edmund S. Muskie School of Public Service
Section VII
Participation of RHCs in HealthProfessions Education
BackgroundIn light of the difficulties faced by RHCs in recruiting and retaining health
professionals (physicians, midlevel providers, registered nurses, and others),policymakers have expressed interest in the extent to which RHCs participate in theeducation of health professionals, who may later choose to practice in rural areas as aresult of their training experience. To date, there has been little if any information onthe participation of RHCs in health professions education. To rectify this gap in ourknowledge, we asked a series of questions regarding the participation of RHCs in healthprofessions education and the number of health professions students rotating throughtheir RHCs during the course of a year. Additional research is needed to determine howmany students, who rotate through RHCs actually practice in rural areas over time.
Key Findings� Sixty-three percent of the survey respondents who answered this questions
report that their RHCs participate in health professions education.
� Sixty-six percent of independent RHCs participated in health professionseducation compared to 59 percent of provider-based facilities.
� An average of 3.4 medical students/residents rotated through bothindependent and provider-based RHCs per year.
� On average, 2.6 physician assistant students rotated through independent RHCsper year compared to 1.9 through provider-based clinics.
� On average, 2.3 nurse practitioner students rotated through both types of clinicsper year.
� On average, 6.9 nursing students rotated through independent RHCs yearlycompared to 4.6 through provider-based clinics.
33

Edmund S. Muskie School of Public Service
Other Health Professions Students (N=33)
Social Work Students (N=10)
Clinical Psychology Students (N=1)
Nursing Students (N=94)
Nurse Midwifery Students (N=5)
Nurse Practitioner Students (N=178)
Physician Assistant Students (N=125)
Medical Students/Residents (N=195)
0 1 2 3 4 5 6 7
2.85.7
3.61
10
6.94.6
11.5
2.32.3
2.61.9
3.43.4
IndependentProvider-Based
Source: 2000 National Survey of Rural Health Clinics, Muskie School of Public Service, University of Southern Maine
Are RHCs Serving as Training Sites for Health Professions Students?Survey Data (N=578)
Source: 2000 National Survey of Rural Health Clinics, Muskie School of Public Service, University of Southern Maine
Average Number of Health Professions Students Rotatingthrough RCHs by Clinic Type
Survey Data
YES NO0%
10%
20%
30%
40%
50%
60%
70% 66%
59%
34%
41%
Independent RHCs (n=305) Provider-Based RHCs (N=273)
34

Edmund S. Muskie School of Public Service
Section VIII
Networking Activities of RHCs
BackgroundThe Rural Health Clinic Act established the RHC program to support and expand
the primary care infrastructure in rural communities through the expansion of coveragefor mid-level providers, and the provision of cost-based reimbursement for core RHCservices. The program’s impact on the health care infrastructure in rural communitiesoccurs on a clinic-by-clinic basis.
Since the establishment of the RHC program in 1977, the concept of networkinghas emerged as an important strategy for improving access to health care services in ruralcommunities. Although the RHC program provides no specific incentives fornetworking, RHCs are likely candidates to benefit from ongoing networking activities.However, little, if any, information has been available on the extent to which RHCs areengaging networking activities, the types of health care providers with whom they arenetworking, and the specific focus of those efforts.
The survey represents an initial exploration of RHC networking efforts. Furtherresearch is needed to understand the nature of those efforts, the benefits realized by theparticipants, the costs involved, the impact of these initiatives on the rural health careinfrastructure, and the policy implications of these activities.
Key Findings� Seventy percent of RHCs are participating in networking activities.
• Twenty-six percent of all RHCs are engaged in 1 to 2 different types ofnetworking activities.
• Twenty-one percent are engaged in 3 to 4 networking activities.
• Sixteen percent are engaged in 5 to 6 activities.
• Seven percent are engaged in 7 or more activities.
35
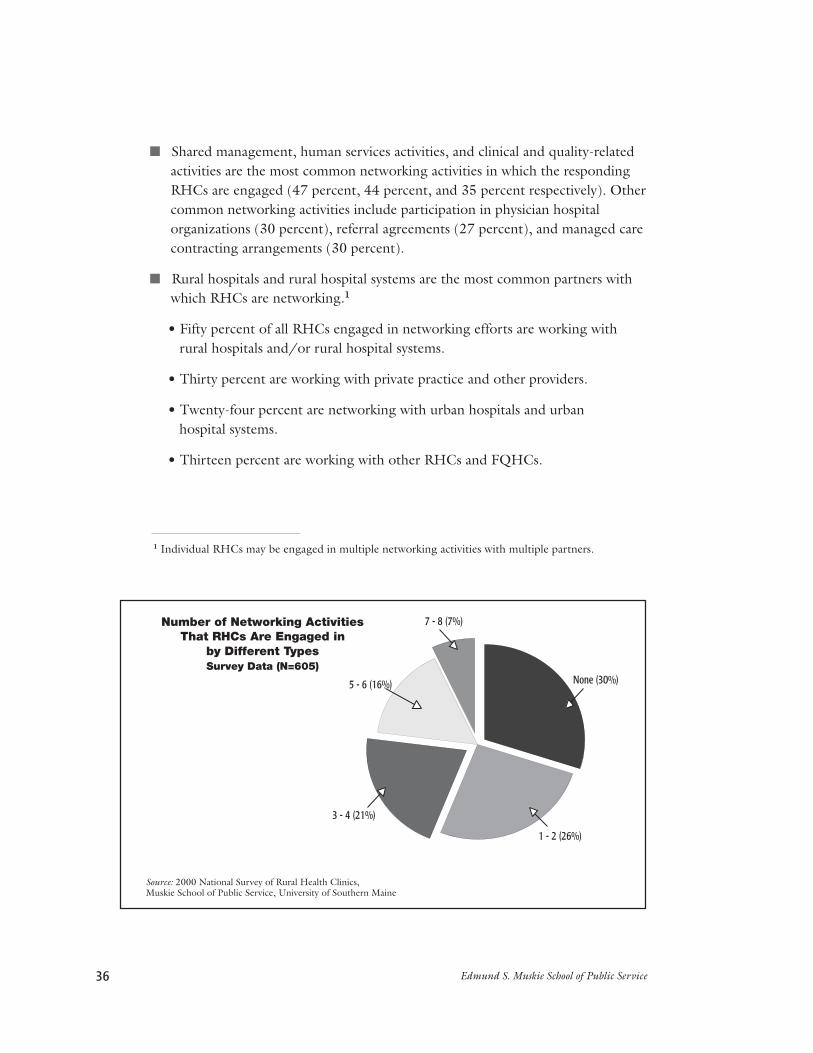
Edmund S. Muskie School of Public Service
� Shared management, human services activities, and clinical and quality-relatedactivities are the most common networking activities in which the respondingRHCs are engaged (47 percent, 44 percent, and 35 percent respectively). Othercommon networking activities include participation in physician hospitalorganizations (30 percent), referral agreements (27 percent), and managed carecontracting arrangements (30 percent).
� Rural hospitals and rural hospital systems are the most common partners withwhich RHCs are networking.1
• Fifty percent of all RHCs engaged in networking efforts are working withrural hospitals and/or rural hospital systems.
• Thirty percent are working with private practice and other providers.
• Twenty-four percent are networking with urban hospitals and urban hospital systems.
• Thirteen percent are working with other RHCs and FQHCs.
1 Individual RHCs may be engaged in multiple networking activities with multiple partners.
Source: 2000 National Survey of Rural Health Clinics,Muskie School of Public Service, University of Southern Maine
Number of Networking ActivitiesThat RHCs Are Engaged in
by Different TypesSurvey Data (N=605)
None (30%)
1 - 2 (26%)
3 - 4 (21%)
5 - 6 (16%)
7 - 8 (7%)
36

Edmund S. Muskie School of Public Service
Urban Hospitals/Systems Rural Hospitals/Systems Other RHCs/FQHCs Private Practice/Other Providers
0%
10%
20%
30%
40%
50%
60%
70%
80%
90%
24%
76%
50% 50%
13%
87%
30%
70%
YES NO
SECTION VIII — NETWORKING ACTIVITIES
Source: 2000 National Survey of Rural Health Clinics, Muskie School of Public Service, University of Southern Maine
Source: 2000 National Survey of Rural Health Clinics, Muskie School of Public Service, University of Southern Maine
With What Types of ProvidersAre RHCs Networking?
Survey Data (N=605)
Percentage of RHCs Participating in Different Typesof Networking Activities
Survey Data (N=605)
Other Collaborative Activities
Integrated Delivery Systems
Clinical and Quality Activities
Physician Hospital Organizations
EMS Networks
Managed Care Contracting
Human Service Activities
Management Activities
Referral Agreements
0% 5% 10% 15% 20% 25% 30% 35% 40% 45% 50%
1%
20%
35%
30%
26%
27%
44%
47%
27%
37

Edmund S. Muskie School of Public Service
Referral Agreements 46 8% 104 17% 23 4% 67 11%Management Activities 67 11% 176 29% 43 7% 85 14%Human Service Activities 80 13% 180 30% 29 5% 46 8%
Managed Care Contracting 41 7% 104 17% 15 3% 43 7%EMS Networks 36 6% 115 19% 5 1% 24 4%Physician Hospital Organizations 56 9% 130 22% 8 1% 20 3%
Clinical and Quality Activities 58 10% 144 24% 15 3% 29 5%Integrated Delivery Systems 35 6% 90 15% 11 2% 14 2%Other Collaborative Activities 3 1% 3 1% 0 0% 4 1%
or Systems or Systems RHCs/FQHCs and Other ProvidersN % N % N % N %
Urban Hospitals Rural Hospitals Other Private Practice
Source: 2000 National Survey of Rural Health Clinics,Muskie School of Public Service, University of Southern Maine
Types of Networking Activities in Which RHCs AreEngaged by Type of Networking Partner
Survey Data (N=605)
38

Edmund S. Muskie School of Public Service
Section IX
Participation of RHCs in Managed CarePrograms
BackgroundManaged care presents a challenge for RHCs, given their heavy dependence on
Medicare and Medicaid and their comparatively limited commercial insurance bases. Asdiscussed in Section III: Financial Operations, Medicare and Medicaid account for 55percent of the payer mix of most RHCs. In contrast, commercial and other privateinsurances account for just under 30 percent of the average payer mix, when measuredas a percentage of revenues. Despite cost-based reimbursement under Medicare andMedicaid, most RHCs are struggling financially (see Section III).
Managed-care programs can compromise the tenuous financial status of RHCs bydemanding discounts from RHCs and/or potentially excluding them from theirprovider networks. Given their dependence on Medicaid and Medicare revenues and thefact that Medicaid and Medicare managed care plans are not required to reimburseRHCs on a cost basis, RHCs may have little choice but to accept the discounted ratesoffered by these plans, or risk the loss of their patient base.
Although managed care has declined in many markets, it is still an importantsource of coverage in some markets and in a number of state Medicaid programs. Assuch, it is necessary to understand the impact of managed care on RHCs. Although, wehave begun to document the extent to which RHCs are involved with managed-careplans, further research is needed to fully understand the financial and operational impactof managed care on RHCs.
39

Edmund S. Muskie School of Public Service
Key Findings� Eighty-seven percent of the responding RHCs reported that commercial
managed-care plans were available to patients in their markets. Seventy-sevenpercent of the survey respondents reported that their RHC participated in oneor more commercial managed care plans.
� Over 33 percent reported that Medicare managed-care plans were available topatients in their markets. Twenty-six percent of the survey respondents reportedthat their RHC participated in one or more Medicare managed care plans intheir market area.
� Fifty-six percent reported that Medicaid managed care plans were available topatients in their markets. Forty-seven percent of the survey respondentsreported that their RHC participated in one or more Medicaid managed careplans.
� Although Medicaid managed-care plans are not required to reimburse RHCson a cost basis, almost 41 percent of the RHCs that participated in Medicaidmanaged care plans (N=285) reported that they received cost-basedreimbursement. Close to 30 percent were being paid either on a full- or partial-capitated basis. Just under 26 percent were being paid on a discounted fee-for-service basis. Slightly less than 8 percent were being paid through a variety ofother methods.1
� Twenty-five percent received wrap-around payments from the state tosupplement payments received from Medicaid managed care plans.
� RHCs that participated in managed care plans received 24 percent of revenuesfrom commercial managed care plans, 21 percent from Medicaid managed careplans, and 14 percent from Medicare managed care plans.
� Of those RHCs participating in managed care plans, 70 percent reportedparticipating in preferred provider organizations, 63 percent in healthmaintenance organizations and/or point of service plans, 33 percent in
primary care case management plans, and two percent in other forms of managed care plans.
1 These percentages exceed 100 percent as some RHCs reported receiving multiple forms ofreimbursement from Medicaid managed care plans.
40
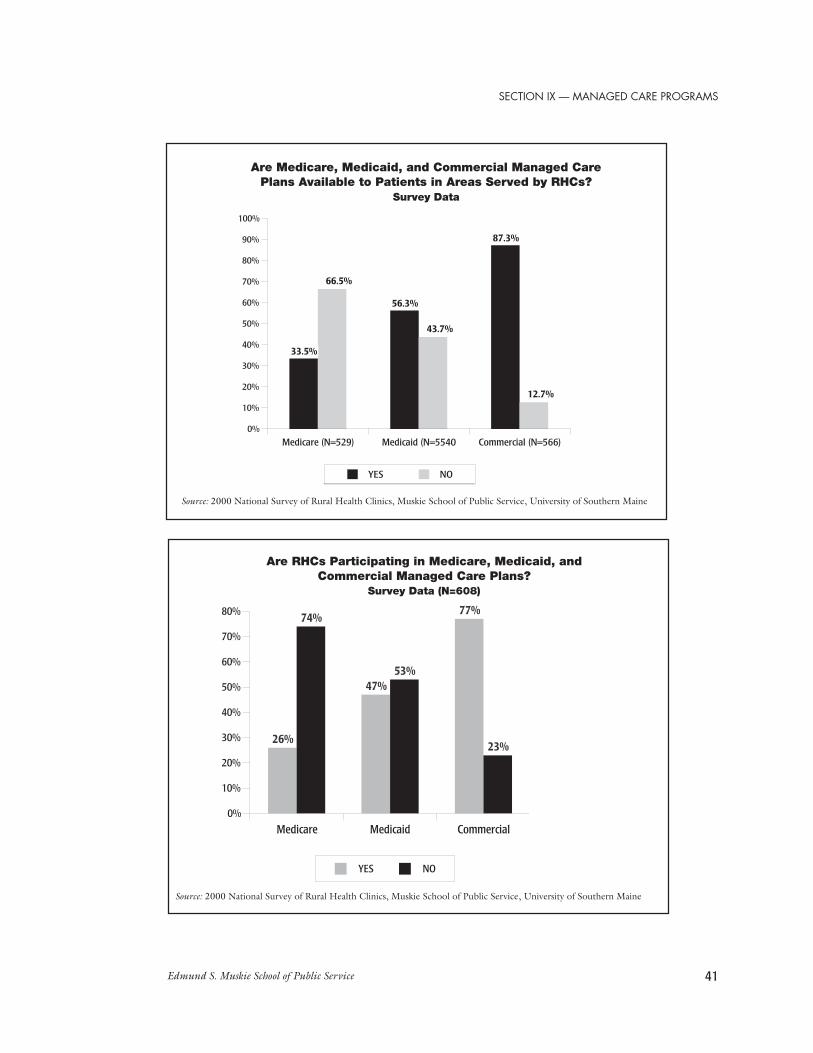
Edmund S. Muskie School of Public Service
Medicare Medicaid Commercial0%
10%
20%
30%
40%
50%
60%
70%
80%
26%
74%
47%53%
77%
23%
YES NO
Source: 2000 National Survey of Rural Health Clinics, Muskie School of Public Service, University of Southern Maine
Are RHCs Participating in Medicare, Medicaid, andCommercial Managed Care Plans?
Survey Data (N=608)
Are Medicare, Medicaid, and Commercial Managed CarePlans Available to Patients in Areas Served by RHCs?
Survey Data
SECTION IX — MANAGED CARE PROGRAMS
Medicare (N=529) Medicaid (N=5540 Commercial (N=566)0%
10%
20%
30%
40%
50%
60%
70%
80%
90%
100%
33.5%
66.5%
56.3%
43.7%
87.3%
12.7%
YES NO
Source: 2000 National Survey of Rural Health Clinics, Muskie School of Public Service, University of Southern Maine
41

Edmund S. Muskie School of Public Service
Source: 2000 National Survey of Rural Health Clinics,Muskie School of Public Service, University of Southern Maine
Source: 2000 National Survey of Rural Health Clinics, Muskie School of Public Service, University of Southern Maine
How Are RHCs Reimbursed by Medicaid Managed Care Plans?Survey Data
Are Participating RHCs Receiving Wrap-AroundPayments from Medicaid Managed Care Plans?
Survey Data (N=285)
YES (25%)
NO (75%)
Full or Partial Capitation Cost-Based Discounted Fee for Service Other
0%
5%
10%
15%
20%
25%
30%
35%
40%
45%
29.5%
40.7%
25.6%
7.7%
42

Edmund S. Muskie School of Public Service
SECTION IX — MANAGED CARE PROGRAMS
Source: 2000 National Survey of Rural Health Clinics,Muskie School of Public Service, University of Southern Maine
Percentage of Patient Care Revenues Represented byManaged Care Payer Type
Survey Data
Medicare (N=153) Medicaid (N=191) Commercial (N=251)
0%
5%
10%
15%
20%
25%
14%
21%
24%
Source: 2000 National Survey of Rural Health Clinics,Muskie School of Public Service, University of Southern Maine
What Types of Managed Care Plans Are RHCs Participating in?Survey Data (N=608)
0%
10%
20%
30%
40%
50%
60%
70%
80%
90%
100%
70%
30%
63%
37%33%
67%
2%
98%
YES NO
Preferred ProviderOrgzanization
Health MaintenanceOrganization/Point of
Service Plan
Primary CareCase Management Plan
Other Managed Care Plan
43

Edmund S. Muskie School of Public Service44

Edmund S. Muskie School of Public Service
Section X
Policy Implications
Rural Health Clinics have become an important part of the rural health careinfrastructure with 3,477 clinics (at the time of our survey) serving patients in
rural communities across the country. The original intent of the program was to supportand enhance the availability of primary care services in rural, underserved communities(defined as non-urbanized areas with populations of less than 50,000 and carrying aHPSA, MUA, or GDSA designation) through the provision of cost-basedreimbursement for care delivered to Medicare and Medicaid patients, and through theprovision of coverage for NPs, Pas, and CNMs. With the exception of changes to themethodology for the Medicaid reimbursement mandated by BIPA 2000, theinterventions employed by the RHC program remain the same.
Despite the enhanced reimbursement provided by the RHC program, many RHCsface continued challenges in providing primary care services to rural, underservedresidents, not the least of which are changing expectations by state and federalpolicymakers regarding the role of RHCs as safety net providers; regulatory changesmandated by the Balanced Budget Act of 1997 and the Medicare, Medicaid, andSCHIP Benefits Improvement and Protection Act of 2000; and the ongoing operationaldifficulties stemming from their location in rural communities. These latter difficultiesinclude serving populations with higher rates of uninsurance and underinsurance,greater dependency on Medicare and Medicaid reimbursement, and recruitment andretention difficulties. These challenges and difficulties speak directly to the issues ofsupporting the primary care infrastructure in rural communities and should not beoverlooked by policymakers when considering changes to the program. Accordingly, wepresent the following considerations that should be taken into account in efforts tosupport the delivery of primary care services to underserved and vulnerable populationsin rural communities through the Rural Health Clinics Program.
A. Most RHCs continue to serve rural, underserved communities asdefined by the program regulations.
Just under 99 percent of RHCs in operation at the time of our survey were locatedin rural areas as defined by the Rural Health Clinic Services Act. Over 69 percent of theclinics at the time of our survey were located in areas classified as small towns withpopulations of under 10,000 or isolated areas. Another 17 percent were located in areasclassified as large towns with populations of under 50,000. Just under 13 percent arelocated in areas classified as suburban primarily due to their commuting ties to urbancore areas. As these suburban areas may be large towns, small towns, or isolated areas,
45

Edmund S. Muskie School of Public Service
they still meet the rural definition established for the program. Over 97 percentcontinue to be located in areas designated as health manpower shortage areas.
Caution should be used when interpreting these data as estimates are based on1990 Census data. Indications are that classification of the areas in which RHCs arelocated may change when the RUCA codes are updated to the 2000 Census, althoughwe are unable to estimate the extent of the changes at this time.
B. The potential impact of the refinements to the shortage arearequirements mandated by the Balanced Budget Act of 1997 remainsunclear.
The potential impact of the BBA 1997-mandated refinements to the shortage arearequirements for RHCs remains unclear for four primary reasons. First, the regulationsimplementing the provisions of BBA 1997 have not been finalized as of October 2002.Second, the RUCA codes, which were used to estimate the rurality of the communitiesin which RHCs are located, are based on 1990 Census data.1 Third, existing data setscontaining information on partial county HPSAs, MUAs, and GDSAs are not easilylinked to our file of RHCs as the shortage areas are defined by a variety of geographicdesignations, including census tracts, minor civil divisions, and townships. Notranslation file exists to match the location of RHCs to the boundaries of these partialcounty shortage areas. Finally, the shortage area data contained in the Area ResourceFile, as used in our analysis, do not include the date of designation nor the fate of themost recent update of existing shortage areas. As the proposed regulations require thatRHCs be located in an area that has been designated as a shortage area or had itsshortage designation updated within the past three years, this information is required toaccurately estimate the impact of these regulatory changes.
In light of these limitations, the following estimates of the impact of the proposedshortage area refinements should be considered as both tentative and conservative.Based strictly on the first draft of the proposed regulations, 1.5 percent (51 clinics) maybe at risk for losing their RHC certification because the areas in which they are locatedare no longer classified as nonurbanized.2 Three percent are at risk for losing theircertification due to the lost of their shortage area designation, unless they qualify for anexception under one of the five essential provider tests established by the proposedregulations. Again, it should be remembered that additional clinics may be at riskdepending on the dates of their shortage area designations or updates.
46

Edmund S. Muskie School of Public Service
C. RHCs are functioning as safety net providers by serving a substantialnumber of uninsured, Medicaid, and other vulnerable populations; bydelivering free and reduced cost care to indigent patients; and byproviding assistance to enroll eligible patients in Medicaid, StateChildren’s Health Insurance Programs, and other assistance programsfor which they might be eligible.
The Institute of Medicine has defined safety net providers as “those providers thatorganize and deliver a significant level of health care and other health-related services touninsured, Medicaid, and other vulnerable populations.” RHCs clearly fall under thisdefinition as services delivered to Medicaid, uninsured, self-pay, and free/reduced-costcare patients account for approximately 45 percent of their overall volume, whethermeasured as a percentage of revenues or as a percentage of patient visits. Ninety-ninepercent of the survey respondents reported that they are accepting new Medicaidpatients. Ninety-one percent are accepting new patients enrolled in State Children’sHealth Insurance programs.
Over 32 percent of survey respondents indicated that indigent patients experiencesignificant to extreme difficulty in accessing primary care in their communities, while 43percent indicated that Medicaid and self-pay patients experienced moderate to extremedifficulty. These populations would likely experience even greater difficulty in obtainingprimary care services if the RHCs in their communities were to close.
Despite not receiving financial support to do so, 24 percent of independent and 18percent of provider-based RHCs that responded to our survey wrote off between 5 and9 percent of their total charges as free- and reduced-cost care. Another 51 percent ofindependent RHCs and 55 percent of provider-based clinics wrote off up to 4 percent oftheir total charges. Almost 12 percent of independent RHCs and 11 percent ofprovider-based RHCs wrote off between 10 and 14 percent of total charges. Finally, 13percent of independent and 16 percent of provider-based RHCs wrote off 15 percent ormore of total charges as free/reduced-cost care to low income and indigent patients.
Fifty-five percent of independent and 69 percent of provider-based RHCs haveeither formal or informal policies governing the provision of free- and reduced-cost care.Of these facilities, 81 percent of independent and 79 percent of provider-based clinicsreport that they are accepting new applications from patient for free- and reduced-costcare. Most commonly, independent and provider-based RHCs use a sliding fee scale (61percent and 65 percent respectively) to determine eligibility for these services.
In addition, many RHCs provide assistance to enroll eligible patients in Medicaid(60 percent of independent and 66 percent of provider-based clinics) and SCHIPprograms (62 percent of independent and 69 percent of provider-based clinics). This
SECTION X — POLICY IMPLICATIONS
47

Edmund S. Muskie School of Public Service
assistance includes the provision of Medicaid and SCHIP application forms (39and 40 percent of independent and provider-based clinics respectively) and assistance incompleting those forms (37 and 39 percent of independent and provider-based clinicsrespectively).
As mentioned earlier, RHCs do not receive specific funding to support theprovision of safety net services to vulnerable populations. We encourage policymakers toexplore ways to support RHCs in their roles as safety net providers. Possible policyinterventions may include: the collection and analysis of data nationwide on the level offree- and reduced-cost care provided by RHCs; the provision of financial support for theuncompensated care delivered to indigent patients; and policies to expand the abilities ofRHCs to participate in the enrollment of eligible patients in Medicaid, SCHIP, andother support programs.
D. Recruitment and retention of professional staff is a problem formany RHCs.
Eighteen percent of responding clinics indicated that they had a vacant physicianposition during the 12 months prior to our survey. Twenty percent indicated that theyhad a vacant nurse practitioner, physician assistant, or certified nurse midwife positionwithin the same period. Of those RHCs with physician vacancies, 77 percent hadtrouble recruiting for, and filling, their vacant positions. Vacant physician positions wereopen for an average of 10 months before being filled. Forty-nine percent of RHCs withNP, PA, or CNM vacancies had trouble filling their vacancies. These positions remainedopen almost five months before being filled. Given the requirement that RHCs belocated in designated health manpower shortage areas, this difficulty in recruitingshould not be surprising. These vacancies compromise access to services within thesurrounding area and the financial viability of these clinics. Federal and statepolicymakers should consider ways in which existing Federal programs, such as theNational Health Service Corp and state level recruitment initiatives, can be used tosupport Rural Health Clinics.
E. Despite reimbursement enhancements provided by the RHC program,some RHCs continue to face significant financial challenges.
Although the Rural Health Clinics Services Act provided for cost-basedreimbursement under Medicare and Medicaid, some RHCs continue to face significant
48

Edmund S. Muskie School of Public Service
SECTION X — POLICY IMPLICATIONS
financial challenges. Our survey respondents reported that, on average, total expensesexceeded total revenues. Independent RHCs reported that, on average, total expensesexceeded total revenues by $40,505, with an adjusted cost per visit of $66.31. Provider-based RHCs reported that total expenses exceeded total revenues by $38,441, with anadjusted cost per visit of $81.01. In comparison, the cap on per-visit reimbursement thatapplied to independent RHCs and provider-based RHCs owned by hospitals of 50 bedsor more was $60.40 in 1999 and $61.85 in 2000.
RHCs remain heavily dependent on Medicare and Medicaid, as sources of fundingfor patient care with these two payer sources accounting for 55 percent of RHCrevenues. In contrast, commercial and private insurances account for less than 30percent of revenues. Uninsured, private pay, and free/reduced-cost care patients accountfor slightly less than 15 percent of revenues. RHCs located in areas with lower levels ofemployer-sponsored health insurance, or greater levels of uninsured or underinsuredresidents, may be more dependent on Medicare and Medicaid than the overallpopulation of RHCs.
Unfortunately, our data do not allow us to understand the impact ofreimbursement caps, the Medicaid prospective payment system, and other financialpolicies on the overall population of RHCs and sub-populations of RHCs that may besubject to greater levels of financial pressure because of their location in more isolated oreconomically-distressed areas. We encourage policymakers at both the federal and statelevels to consider these issues prior to making further changes to reimbursement policiesaffecting RHCs. We also encourage them to conduct the analysis needed to betterunderstand the impact of their decisions on RHCs, and to explore policy options tosupport RHCs in the delivery of primary care services to underserved residents in ruralcommunities.
F. Most RHCs have not taken advantage of opportunities to employmental health professionals as allowed under the terms of the program.
Although amendments to the Rural Health Clinic Services Act added the servicesof clinical psychologists in 1987 and clinical social workers in 1989 to the core serviceseligible for cost-based reimbursement, only 0.12 percent of the survey respondentsreported that their clinic employed either a PhD or Master’s level psychologist and 0.07percent employed a clinical social worker. Given the shortage of mental health servicesavailable in rural communities, the RHC program represents an unrealized opportunityto provide important services needed by rural residents.
49

Edmund S. Muskie School of Public Service
In many ways, the RHC is an ideal vehicle to expand the availability of mentalhealth services in rural areas. As the primary care providers employed by RHCs identifymental health issues among their patients, the presence of a clinical psychologist orclinical social worker on-site would facilitate their ability to refer those patients forservices. At the same time, the location of these mental health providers within the RHCwould serve to minimize the stigma associated with the receipt of services.Unfortunately, we don’t know why more RHCs have not added the services of clinicalpsychologists or clinical social workers to their core service offerings. Further research isneeded to understand the barriers to doing so, and to develop the necessary policies toencourage more RHCs to consider this option.
1 The RUCA taxonomy will not be updated to the 2000 Census until the later part of 2002.
2 Indications are that this number may be significantly higher when 2000 Census rural and urbanclassifications are available, although this has yet to be verified.
50

Edmund S. Muskie School of Public Service
References
American Academy of Physician Assistants. (1997). Policy Brief: Rural HealthClinics, [Online]. Available: http://www.aapa.org/gandp/rhc.html. [2001, July 23].
Baird-Holmes, D., Brown, M., Eley, C. and Valdmanis, V. (1999). Rural healthclinics in Oklahoma: An exploratory study. Texas Journal of Rural Health, 17(1):18-26.
Buto, K. (1997, Feb. 13). Statement of Kathleen A. Buto, Associate Administratorfor Policy, Health Care Financing Administration on Rural Health Clinics: Before theHouse Committee on Government Reform and Oversight Subcommittee on HumansResources and Intergovernmental Relations, [Online]. Available: http://www.cms.hcfa.gov/testimony/1997/t970213d.asp., [2001, Nov. 7].
Center for Medicare & Medicaid Services State Medicaid Directors’ Letter (2001,Jan. 19). State Medicaid Director’s Letter (SMDL # 01-014), [Online]. Available: http://cms.hhs.gov/states/letter/smd119a1.asp. [2002, Sept. 10].
Cheh, V. and Thompson, R. (1997). Rural Health Clinics: Improved access at acost. Executive summary. (MPR Reference No. 8293) Princeton, NJ: Mathematica PolicyResearch, Inc.
Cook, P.J., and K.L. Mizer. (1994). The revised ERS County Typology: An overview.(Rural Development Research Report 89). Place: U.S. Department of Agriculture,Economic Research Service.
Finerfrock, B. (1999, Nov. 9). Medicaid and Rural Health Clinics – The UntoldStory. Paper presented at the annual meeting of the National Association of Rural HealthClinics, Washington, DC.
Finerfrock, B. and Petersen, J. (1994). Rural Health Clinics explode across U.S.Rural Health News, 1(3), 5.
Gage, L. (2000, Mar. 23). Statement of Larry S. Gage, President, NationalAssociation of Public Hospitals and Health Systems: Before the Senate Health, Education,Labor and Pensions Subcommittee on Public Health, [Online]. Available: http://naph.activematter.com/Content/ContentGroups/Advocacy_Issues/Statements_And_Testimony/IAST-LarrySGageTest.pdf. [2002, July 2].
Gaston, M. (1997, Feb. 13). Testimony on Safety Net Health Care Programs: Beforethe House Committee on Government Reform and Oversight, Subcommittee on HumanResources, [Online]. Available: http://www.hhs.gov/asl/testify/t970213b.html. [2001,Nov. 7].
51

Edmund S. Muskie School of Public Service
Health Care Financing Administration. (2000, Jan.). Program MemorandumIntermediaries: Announcement of Medicare Rural Health Clinics (RHCs) and FederallyQualified Health Centers (FQHCs) payment rate increases and policy clarifications andguidance for services furnished by RHCs and FQHCs, (HCFA-Pub. 60A), [Online].Available: http://cms.hhs.gov/manuals/pm_trans/a003060.pdf. [2002, Sept. 10].
Lewin, M. and Altman, S., (Eds.). (2000). America’s health care safety net: Intactbut endangered. Washington, D.C.: National Academy Press.
McBride, T. & Mueller, K. (2002). Effects of Medicare payment on rural healthcare systems. Journal of Rural Health. 18(S), 147-163.
Medicare program: Rural Health Clinics: Amendments to participationrequirements and payment provisions; and establishment of a quality assessment andperformance improvement program, 65 Fed. Reg. 39 (Feb. 28, 2000) (to be codified at42 C.F.R., parts 405 and 491).
Michigan Center for Rural Health. (1996). A survey of Michigan’s Rural HealthClinics: Information and data highlighting the volume and complexity of Rural HealthClinics in Michigan., [Online]. Available: http://www.com.msu.edu/micrh/survey.htm. [2000, Nov. 1].
National Rural Health Association. (1997). Rural Health Clinics in RuralAmerica. [Online]. Available: http://www.nrharural.org/dc/issuepapers/ipaper8.html.[2002, Aug. 2].
National Rural Health Association. (1998). Physician Recruitment andRetention, [Online]. Available: www.nrharural.org/dc/issuepapers/ipapers13.html.[2002, Aug. 2].
Redd, Diane. (2001). Oregon’s Rural Health Clinics, [Online]. Available: http://opca.org/clinics.html. [2002, Aug. 2]
Tessen, R., Dugi, D. and Reese, R. (1998). Access, utilization, and effects of RuralHealth Clinics in Texas. Texas Journal of Rural Health 16(1); 29-40.
Thometz, A. (1994). A summary report of the first national survey of Rural HealthClinics. Office of Rural Health Policy, Bethesda, MD: Global Exchange, Inc.
Travers, K., Ellis, R., and Dartt, L. (1995). Comparison of the Rural Health Clinicand Federally
Qualified Health Center Programs, Revised July 1995. Washington, DC: NationalAssociation of Community Health Centers.
52

Edmund S. Muskie School of Public Service
United Governmental Services, LCC. (1999, May 24). Medicare Memo: RuralHealth Clinic (RHC) and FQHCs Policy Clarification, [No. FQHC1999-1]. Available:http://www.ugsmedicare.com/medicare%20memo’s/1999/memos99/052499.pdf.[2002, Sept. 10].
U.S. Congress, Office of Technology Assessment, Health care in rural America.(OTA-H-434) Washington, DC: U.S. Government Printing Office, Sept. 1990.
U.S. House. 105th Congress, 1st Session. (1997, Jan. 7). H.R. 2015, An Act toProvide for Reconciliation
Pursuant to Subsections (b)(1) and (c) of Section 105 of the Concurrent Resolutionon the Budget for Fiscal Year 1998, [Online]. Available: http://hippo.findlaw.com/SubtitleC.html, [2002, Aug. 2].
U.S. General Accounting Office. (1995). Health care shortage areas: Designationsnot a useful tool for directing resources to the underserved. (Pub. No. GAO/HEHS-95-200). Report to Congressional Committees. Washington, DC: GAO.
U.S. General Accounting Office. (1996). Rural Health Clinics: Rising programexpenditures not focused on improving care in isolated areas. (Pub. No. GAO/HEHS-97-24). Report to the Chairman, Subcommittee on Human Resources andIntergovernmental Relations, Committee on Government Reform and Oversight,House of Representatives. Washington, DC: GAO.
U.S. Office of the Inspector General (OIG). (1996). Rural Health Clinics:Growth, access, and payment. (Pub. No. OEI-05-94-00040). Washington, DC: U.S.Department of Health and Human Services.
Washington, P. and Kushner, C. (1991). The Rural Health Clinic Services Act:Public Law. 95-210. Washington, DC: Office of Rural Health Policy, U.S. Departmentof Health and Human Services.
Washington State Department of Health. (2002). Guidelines for using rural-urbanclassification systems for public health assessment, [Online]. Available: http://www.doh.wa.gov/data/guidelines/ruralurban.htm. [2002, Aug. 2].
53

Edmund S. Muskie School of Public Service
Appendix I
MethodologySource: 2000 National Survey of Rural Health Clinics,Muskie School of Public Service, University of Southern Maine
Distribution of RHCs by Clinic TypeOSCAR and Survey Data
Distribution of RHCs by Corporate StructureOSCAR and Survey Data
Independent Provider-Based0%
10%
20%
30%
40%
50%
60%
52% 53%
48% 47%
Total Population (N=3,477) Survey Respondents (N=611)
State Government
Local Government
Federal Government
For-Profti Individual
For-Profit Corporation
For-Profit Partnership
Non-Profit Individual
Non-Profit Corporation
Non-Profit Partnership
0% 5% 10% 15% 20% 25% 30% 35% 40% 45%
1.8%1.6%
14.0%13.6%
0.1%0.3%
9.5%10.0%
28.6%26.5%
4.1%4.4%
0.9%1.8%
40.7%41.4%
0.3%0.3%
Total Population (N=3,477)Survey Respondents (N=611)
54

Edmund S. Muskie School of Public Service
Distribution of RHCs by CMS (HCFA) RegionOSCAR and Survey Data
Shortage Area Designations for the Counties in Which RHCs Are LocatedOSCAR and Survey Data
Not Designated
Whole County HPSA
Partial County HPSA
Medically Underserved Area
Governor Designated Shortage Area
0% 5% 10% 15% 20% 25% 30% 35% 40% 45%
2.7%
1.6%
33.1%
31.8%
39.8%
42.7%
23.8%
23.6%
0.6%
0.3%
All RHCs (N = 3,477)Survey Respondents (N = 611)
Region1 - Boston
Region II - New York
Region III - Phildelphia
Region IV - Atlanta
Region V - Chicago
Region VI - Dallas
Region VII - Kansas City
Region VIII - Denver
Region IX - San Francisco
Region X - Seattle
0% 5% 10% 15% 20% 25%
2.7%4.3%
0.3%0.2%
5.3%6.7%
23.8%17.0%
15.9%13.3%
19.6%17.8%
16.0%19.6%
6.5%10.6%
6.4%5.9%
3.5%4.6%
Total Population (N=3,477)Survey Respondents (N=611)
METHODOLOGY
55

Edmund S. Muskie School of Public Service
Distribution of RHCs by County Typology Code PolicyOSCAR and Survey Data
Farming Dependent
Mining Dependent
Manufacturing Dependent
Government Dependent
Service Dependent
Nonspecialized
0% 5% 10% 15% 20% 25%
17.9%
22.1%
5.1%
6.2%
17.3%
13.6%
7.1%
8.3%
12.6%
12.4%
21.5%
20.8%
ECONOMIC
Retirement Destination
Federal Lands
Commuting
Persistent Poverty
Transfer Dependent
0% 5% 10% 15% 20% 25%
8.1%
7.4%
6.1%
6.7%
11.2%
10.8%
22.9%
22.9%
16.6%
15.7%
All RHCs (N=3,477)Survey RHCs (N=611)
POLICY
56

Edmund S. Muskie School of Public Service
Position of Survey RespondentSurvey Data
Position of Survey Respondent N %
Administrator 233 38%
Physician 60 10%
Employee of Parent Organization 88 14%
Other Administrative or Clinical Staff 181 30%
Physician Assistant 33 5%
Nurse Practitioner 46 8%
Consultant 1 0.3%
METHODOLOGY
57

Edmund S. Muskie School of Public Service58