Embed Size (px)
Citation preview
COUNTRY FOCUS: GUINEA
SPRING 2018
TheCHALLENGESURBANIZATION in West Africa
of Pub
lic D
iscl
osur
e A
utho
rized
Pub
lic D
iscl
osur
e A
utho
rized
Pub
lic D
iscl
osur
e A
utho
rized
Pub
lic D
iscl
osur
e A
utho
rized


2
ACKNOWLEDGEMENTS ......................................................................................................................................................3
FOREWORD ..................................................................................................................................................................................4
SPECIAL TOPIC ...........................................................................................................................................................................7
Unlocking productivity and livability ...........................................................................................................................7
COUNTRY FOCUS: GUINEA ............................................................................................................................................ 42
COUNTRY ECONOMIC FOCUS .....................................................................................................................................59
CHAD ............................................................................................................................................................................................. 60
MALI ............................................................................................................................................................................................... 66
NIGER .............................................................................................................................................................................................69
TheCHALLENGESURBANIZATION in West Africa
of
3
acknowledgements
This report was a collective effort prepared under the direction of José López-Calix,
Michel Rogy, and Megha Mukim, with contributions from an interdisciplinary Bank team composed of
Yélé Maweki Batana, Luc Razafimandimby, Aly Sanoh, Olivier Béguy, Johannes Hoogeveen, Ali Zafar,
Markus Kitzmuller, Ernest John Sergenti, Abdoul G. Mijiyawa, Marcel Nshimiyimana, Olanrewaju Malik
Kassim, André-Marie Taptué, Irum Touqeer, Susana Sánchez, Emilia Skrok, Paolo Avner, Christian Van
Eghoff, Alex Chunet, Michael Winter, Harris Selod, Caroline Plançon, Olivia D’aoust, Sabine Beddies,
Zie Ibrahima Coulibaly, Aanchal Anand, and Franck Taillandier. Lars Christian Moller, Andrew L. Dabalen,
François Nankobogo, Siaka Bakayoko, Rachidi B. Radji, Christophe Lemière, Michael Hamaide,
Meskerem Brhane, Somik Lall, Giuseppe Zampaglione, Jean Baptiste Migraine, and Boubacar Sidiki
Walbani provided helpful guidance, information, and comments.
Compiling the report would not have been possible without the editorial assistance of Maude
Jean-Baptiste and Aichatou Assa Cisse, media support from Anne Senges and Edmond Bagde
Dingamhoudou, and administrative support from Hawa Maiga, Micky Ananth, Fatimata K. Sy,
Mariama Diabate-Jabbie, and Aissata Diop Diallo.
Invaluable editorial and composing work was executed in a timely manner by Valérie Bennett,
Maria Deverna, and their translation and editing colleagues at JPD Systems.
4
foreword
This is the fifth edition in a series of reports dealing with key development issues in Chad, Guinea,
Mali, and Niger. The AFCW3 Economic update series is intended to foster public debate about key
macroeconomic and structural developments in support of poverty reduction. More specifically, the
series encourages the exchange of ideas on some of the most critical issues affecting the Sahel
region. In so doing, it provides a deeper iterative country focus — in this case, Guinea — as well as a
glimpse of regional macroeconomic trends. The series provides a broad analysis, even if the findings
are preliminary and less than fully polished. In short, this new series has become an innovative vehicle
for the World Bank and the AFCW3 region in particular. It is intended to be used in approaching the
media and proposing priority policy reforms not yet introduced or even debated in these countries.1
The main article in the present volume is devoted to the pressing challenges presented by
urbanization in the Sahel, with a special focus on Guinea, Mali, and Niger. The Sahel is experiencing
rapid and disorderly urbanization. The capital cities of Bamako, Conakry, and Niamey dominate
the urban landscape in their respective countries. In each of these three countries, the economic
importance of the capital city is enormous. For instance, Bamako represents about 34 percent of
gross domestic product (GDP), whereas Conakry and Niamey each represent about 27 percent of
GDP in their respective countries. Furthermore, as their populations are increasing at a faster rate than
anywhere else in the world, the attendant youth bulge could turn into either a demographic dividend,
whereby cities take advantage of a temporary boom in the working age population to productively
employ young people, or a demographic disaster, accompanied by urban instability if cities do not
meet these aspirations.
Despite their importance to their national economies, Bamako, Conakry, and Niamey are neither
engines of growth nor of effective service delivery. All three are failing to make progress in increasing
their competitiveness or in delivering on urban services for their citizens. Labor productivity in these
cities is low compared to the average for 15 cities in Sub-Saharan Africa, and has remained stagnant
1 It should be noted that the findings, interpretations, and conclusions expressed in this report are entirely those of the World Bank staff and do not necessarily represent the views of the World Bank Group and its affiliated organizations or those of the Executive Directors of the World Bank or the governments they represent.

5
over the past 15 or so years. Even more troubling is the fact that urban service delivery in Guinea,
Mali, and Niger continues to lag the Sub-Saharan average and is showing no signs of catching
up with comparator countries. Although Niamey is reasonably well concentrated around its city
center, Bamako displays a highly fragmented urban form, and Conakry remains highly constrained
by its geographical location on the Kaloum peninsula, which leads to linear expansion, with high
concentration at the extreme point of the peninsula. Cities with fragmented urban form tend to limit
opportunities for interactions, leading to costlier delivery of urban infrastructure and services. Thus,
these cities are failing to reap the benefits usually associated with urban growth.
The article aims to shed light on the factors underlying these urban issues while presenting an
assessment of options for coordinated policies and investments. City leaders, policymakers, and
researchers, especially those concerned with Africa’s urban development, are looking to better
understand the scale and impact of growth on the capital cities of West Africa relative to other capitals
in the region but also to other African and Asian comparators.
The report also focuses on Guinea’s development needs, summarizing the findings of the Systematic
Country Diagnostic (SCD) conducted by World Bank staff to identify priority areas for World Bank
Group engagement. The document was developed in close consultation with national authorities,
the private sector, civil society, and other key stakeholders. It presents a systematic assessment of
the constraints that will need to be addressed as well as the opportunities available to accelerate
progress toward achieving the twin goals of ending extreme poverty and promoting shared prosperity
sustainably.
In terms of the economic outlook, I am especially pleased to report that growth recovery is
consolidating. With the exception of Chad, all countries experienced positive growth rates in 2017,
with Guinea at 8.2 percent and Mali and Niger at around 5.3 percent. Moreover, positive growth rates
are envisioned for the future, this time including Chad, following the successful restructuring of
its debt with Glencore. Furthermore, this is happening in a context of low and downward-trending
inflation.
This performance deserves to be highlighted because despite their common characteristics
and various ongoing external shocks, all countries continue to be handicapped by slow export
6
diversification, weak structural transformation, a weakly productive agriculture sector, and a stagnating
manufacturing sector. In all countries, inadequate access to finance, major infrastructure gaps,
cumbersome business regulations, and low levels of foreign investment and technology transfer
continue to be major obstacles to fostering growth and competitiveness. Thus, growth resilience will
need to be built. For the first time in many years, all countries are now moving from concentrating their
efforts on stabilizing their economies in the short term to regaining momentum in the implementation
of deeper structural reforms in the medium term.
Finally, I would like once again to express my gratitude to our governments and technical and
financial partners for their cooperation and many joint contributions over the past few months. Their
encouragement, inputs, and technical advice made it possible to create an environment particularly
well suited to a rich and regular exchange of views on development policy. I trust this series will
make it possible to deepen these discussions and move them into the public sphere to better inform
citizens and enable them to express their own views.
Soukeyna KaneDirector of Operations
Chad, Guinea, Mali, and Niger

7
special topic THE CHALLENGES OF URBANIZATION IN WEST AFRICA
Unlocking productivity and livability in three West African cities
Cities have many advantages. They allow workers to be closer to jobs, increasing opportunities and
fueling productivity. They bring people together physically, facilitating the exchange of ideas and
bringing about innovations. High densities make it cheaper to provide services efficiently and equitably.
As a result, many of the benefits of urban life – productivity and livability - are associated with proximity
within the city. In contrast, fragmented urban development makes cities less productive and less livable.
It is becoming increasingly important to understand how cities can unlock productivity and livability.
This is the goal of this article. As cities grapple with the influx of newcomers, often young people, they
face many challenges associated with rapid urbanization, key among which are creating competitive
economies and providing adequate urban services. However, urbanization also comes with many
opportunities. Building upon city-specific analyses of Bamako (Mali), Niamey (Niger), and Conakry (Guinea),
this report aims to clarify the factors underlying urban issues while laying out an assessment of options
for coordinated policies and investments. City leaders, policy makers, and researchers, especially those
looking at Africa’s urban development, seek to better understand the scale and impact of growth in West
African capital cities relative to other capitals in the region but also to other African and Asian comparators.
The capital cities of Bamako, Niamey, and Conakry dominate the urban landscape in their respective
country. A central premise of policy-making in cities is that the flexibility, practicality, and focus of
local governments make them ideal players to understand and respond to the needs of their citizens.
Cities mostly aim their problem-solving at local conditions. In each of the three countries under study,
the economic importance of the capital cannot be understated: it is the nerve center of the national
economy. If Bamako were to be eliminated, Mali would lose 34% of its GDP, while Guinea and Niger
would lose around 27% (Figure 1). Thus, reforms and investments aimed at tackling challenges related
to urban development in the capital will have knock-on effects on national economic development.
This article was prepared by Megha Mukim, supported by a team composed of Paolo Avner, Caroline Plançon, Christian Eghoff, Harris Selod, Somik Lall, Olivia Severine D’Aoust, Zie Ibrahima Coulibaly. and Alex Chunet. The team would like to thank comments from peer reviewers Judy Baker and Nancy Lozano.
8
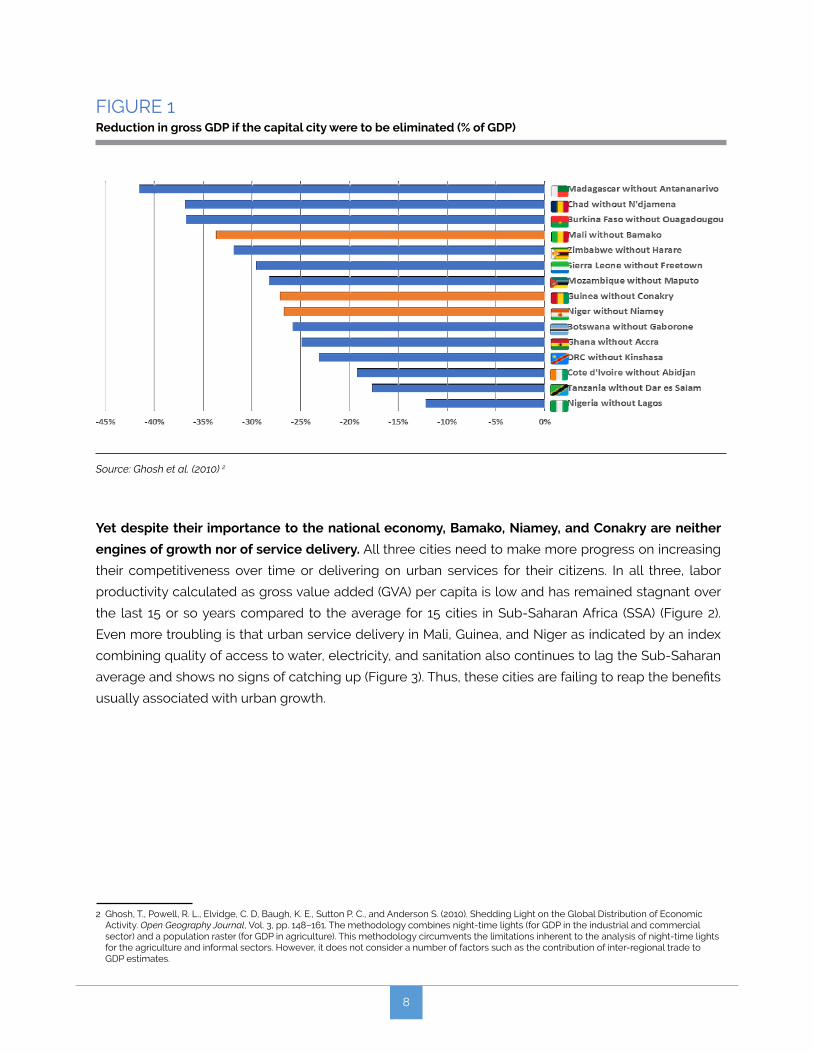
FIGURE 1 Reduction in gross GDP if the capital city were to be eliminated (% of GDP)
Source: Ghosh et al. (2010) 2
2 Ghosh, T., Powell, R. L., Elvidge, C. D, Baugh, K. E., Sutton P. C., and Anderson S. (2010). Shedding Light on the Global Distribution of Economic Activity. Open Geography Journal, Vol. 3, pp. 148–161. The methodology combines night-time lights (for GDP in the industrial and commercial sector) and a population raster (for GDP in agriculture). This methodology circumvents the limitations inherent to the analysis of night-time lights for the agriculture and informal sectors. However, it does not consider a number of factors such as the contribution of inter-regional trade to GDP estimates.
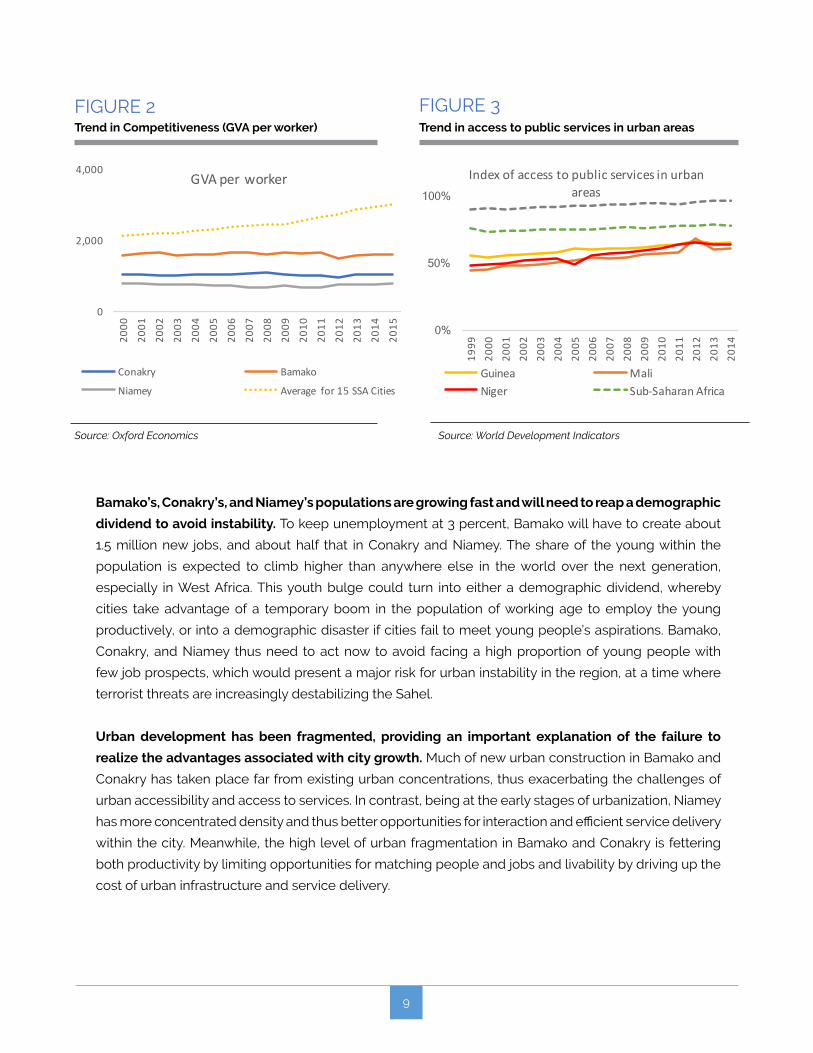
Yet despite their importance to the national economy, Bamako, Niamey, and Conakry are neither
engines of growth nor of service delivery. All three cities need to make more progress on increasing
their competitiveness over time or delivering on urban services for their citizens. In all three, labor
productivity calculated as gross value added (GVA) per capita is low and has remained stagnant over
the last 15 or so years compared to the average for 15 cities in Sub-Saharan Africa (SSA) (Figure 2).
Even more troubling is that urban service delivery in Mali, Guinea, and Niger as indicated by an index
combining quality of access to water, electricity, and sanitation also continues to lag the Sub-Saharan
average and shows no signs of catching up (Figure 3). Thus, these cities are failing to reap the benefits
usually associated with urban growth.
9
FIGURE 2Trend in Competitiveness (GVA per worker)
Source: Oxford Economics
0
2,000
4,000
2000
2001
2002
2003
2004
2005
2006
2007
2008
2009
2010
2011
2012
2013
2014
2015
GVAperworker
Conakry Bamako
Niamey Average for15SSACities
0%
50%
100%
1999
2000
2001
2002
2003
2004
2005
2006
2007
2008
2009
2010
2011
2012
2013
2014
Indexofaccesstopublicservicesinurbanareas
Guinea MaliNiger Sub-SaharanAfrica
FIGURE 3 Trend in access to public services in urban areas
Source: World Development Indicators
Bamako’s, Conakry’s, and Niamey’s populations are growing fast and will need to reap a demographic
dividend to avoid instability. To keep unemployment at 3 percent, Bamako will have to create about
1.5 million new jobs, and about half that in Conakry and Niamey. The share of the young within the
population is expected to climb higher than anywhere else in the world over the next generation,
especially in West Africa. This youth bulge could turn into either a demographic dividend, whereby
cities take advantage of a temporary boom in the population of working age to employ the young
productively, or into a demographic disaster if cities fail to meet young people’s aspirations. Bamako,
Conakry, and Niamey thus need to act now to avoid facing a high proportion of young people with
few job prospects, which would present a major risk for urban instability in the region, at a time where
terrorist threats are increasingly destabilizing the Sahel.
Urban development has been fragmented, providing an important explanation of the failure to
realize the advantages associated with city growth. Much of new urban construction in Bamako and
Conakry has taken place far from existing urban concentrations, thus exacerbating the challenges of
urban accessibility and access to services. In contrast, being at the early stages of urbanization, Niamey
has more concentrated density and thus better opportunities for interaction and efficient service delivery
within the city. Meanwhile, the high level of urban fragmentation in Bamako and Conakry is fettering
both productivity by limiting opportunities for matching people and jobs and livability by driving up the
cost of urban infrastructure and service delivery.
10
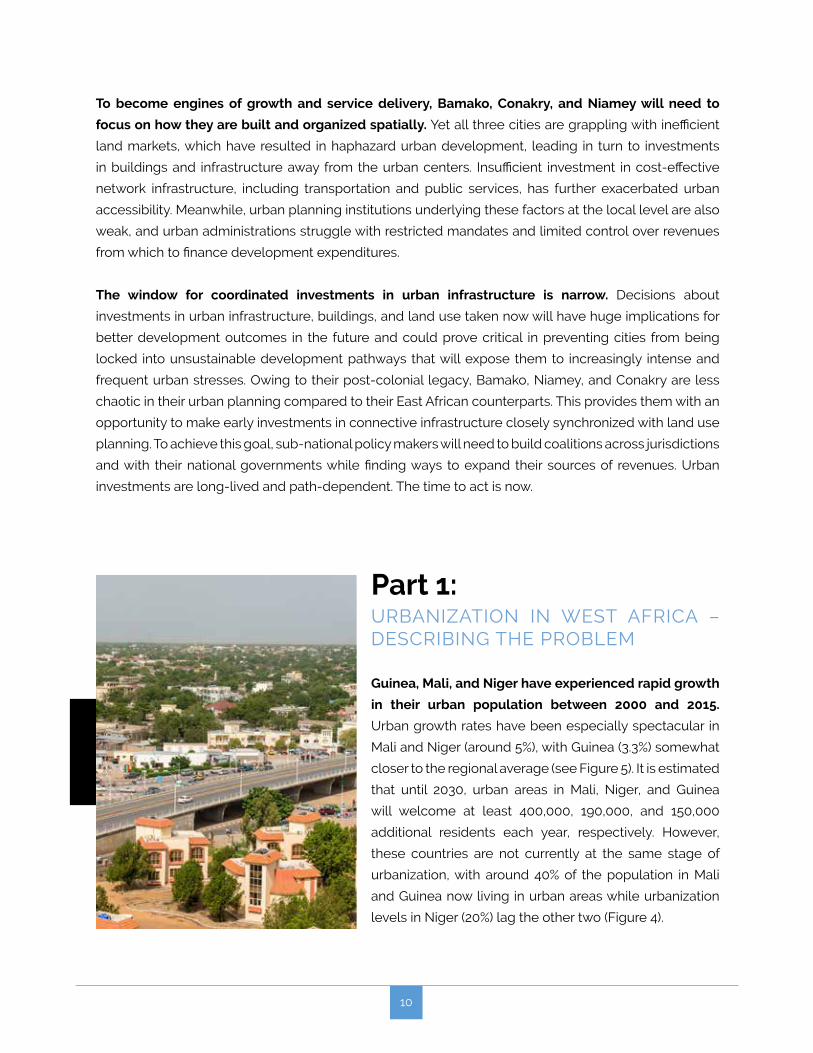
To become engines of growth and service delivery, Bamako, Conakry, and Niamey will need to
focus on how they are built and organized spatially. Yet all three cities are grappling with inefficient
land markets, which have resulted in haphazard urban development, leading in turn to investments
in buildings and infrastructure away from the urban centers. Insufficient investment in cost-effective
network infrastructure, including transportation and public services, has further exacerbated urban
accessibility. Meanwhile, urban planning institutions underlying these factors at the local level are also
weak, and urban administrations struggle with restricted mandates and limited control over revenues
from which to finance development expenditures.
The window for coordinated investments in urban infrastructure is narrow. Decisions about
investments in urban infrastructure, buildings, and land use taken now will have huge implications for
better development outcomes in the future and could prove critical in preventing cities from being
locked into unsustainable development pathways that will expose them to increasingly intense and
frequent urban stresses. Owing to their post-colonial legacy, Bamako, Niamey, and Conakry are less
chaotic in their urban planning compared to their East African counterparts. This provides them with an
opportunity to make early investments in connective infrastructure closely synchronized with land use
planning. To achieve this goal, sub-national policy makers will need to build coalitions across jurisdictions
and with their national governments while finding ways to expand their sources of revenues. Urban
investments are long-lived and path-dependent. The time to act is now.
Part 1: URBANIZATION IN WEST AFRICA – DESCRIBING THE PROBLEM
Guinea, Mali, and Niger have experienced rapid growth
in their urban population between 2000 and 2015.
Urban growth rates have been especially spectacular in
Mali and Niger (around 5%), with Guinea (3.3%) somewhat
closer to the regional average (see Figure 5). It is estimated
that until 2030, urban areas in Mali, Niger, and Guinea
will welcome at least 400,000, 190,000, and 150,000
additional residents each year, respectively. However,
these countries are not currently at the same stage of
urbanization, with around 40% of the population in Mali
and Guinea now living in urban areas while urbanization
levels in Niger (20%) lag the other two (Figure 4).
11
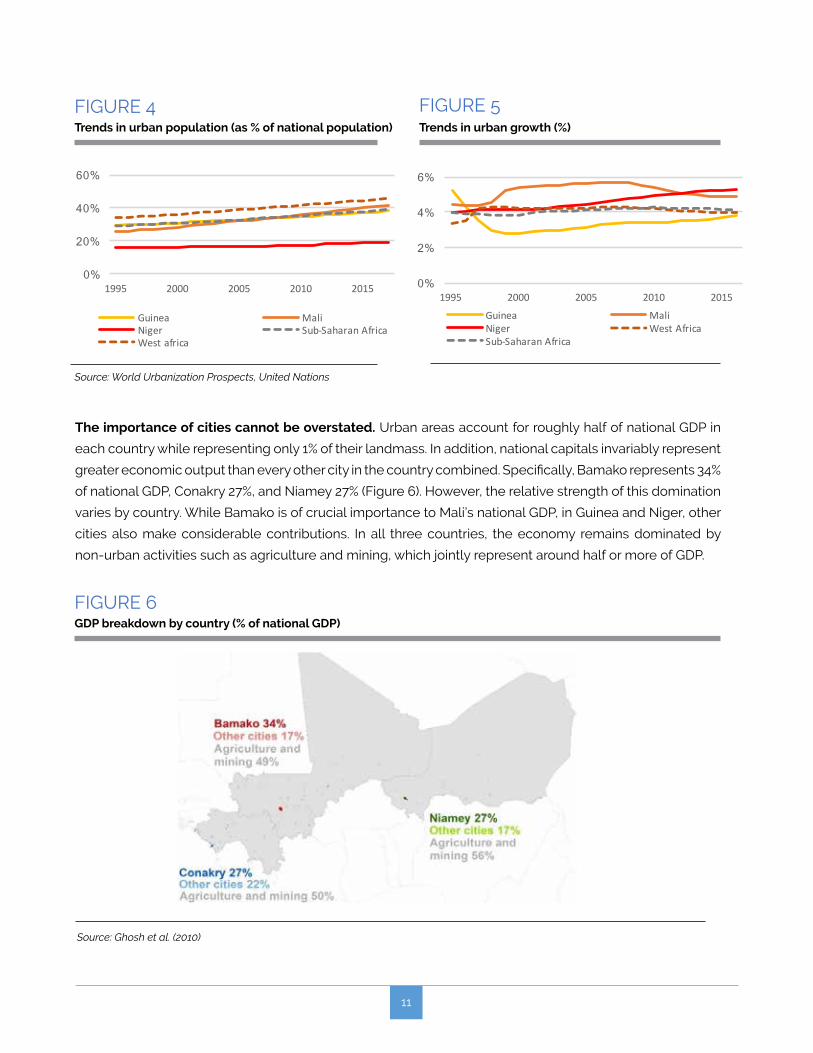
FIGURE 4Trends in urban population (as % of national population)
Source: World Urbanization Prospects, United Nations
0%
20%
40%
60%
1995 2000 2005 2010 2015
Guinea MaliNiger Sub-SaharanAfricaWestafrica
0%
2%
4%
6%
1995 2000 2005 2010 2015
Guinea MaliNiger WestAfricaSub-SaharanAfrica
FIGURE 5 Trends in urban growth (%)
The importance of cities cannot be overstated. Urban areas account for roughly half of national GDP in
each country while representing only 1% of their landmass. In addition, national capitals invariably represent
greater economic output than every other city in the country combined. Specifically, Bamako represents 34%
of national GDP, Conakry 27%, and Niamey 27% (Figure 6). However, the relative strength of this domination
varies by country. While Bamako is of crucial importance to Mali’s national GDP, in Guinea and Niger, other
cities also make considerable contributions. In all three countries, the economy remains dominated by
non-urban activities such as agriculture and mining, which jointly represent around half or more of GDP.
FIGURE 6 GDP breakdown by country (% of national GDP)
Source: Ghosh et al. (2010)
12
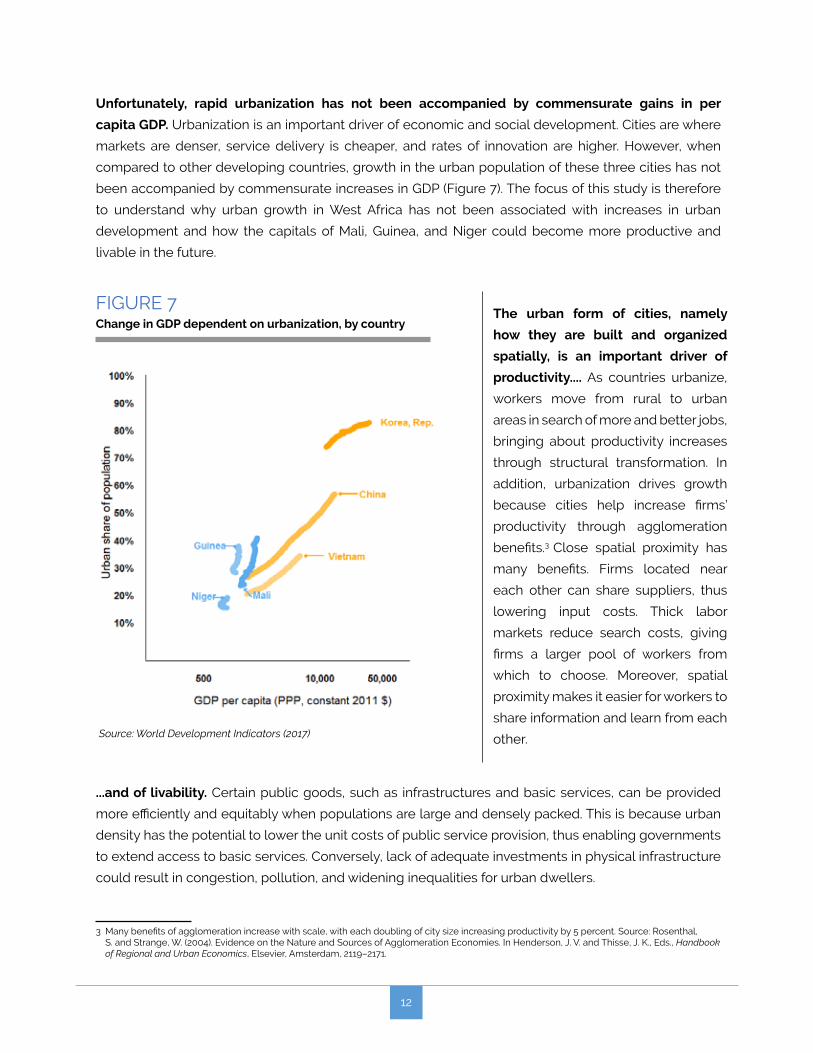
Unfortunately, rapid urbanization has not been accompanied by commensurate gains in per
capita GDP. Urbanization is an important driver of economic and social development. Cities are where
markets are denser, service delivery is cheaper, and rates of innovation are higher. However, when
compared to other developing countries, growth in the urban population of these three cities has not
been accompanied by commensurate increases in GDP (Figure 7). The focus of this study is therefore
to understand why urban growth in West Africa has not been associated with increases in urban
development and how the capitals of Mali, Guinea, and Niger could become more productive and
livable in the future.
FIGURE 7 Change in GDP dependent on urbanization, by country
The urban form of cities, namely
how they are built and organized
spatially, is an important driver of
productivity.... As countries urbanize,
workers move from rural to urban
areas in search of more and better jobs,
bringing about productivity increases
through structural transformation. In
addition, urbanization drives growth
because cities help increase firms’
productivity through agglomeration
benefits.3 Close spatial proximity has
many benefits. Firms located near
each other can share suppliers, thus
lowering input costs. Thick labor
markets reduce search costs, giving
firms a larger pool of workers from
which to choose. Moreover, spatial
proximity makes it easier for workers to
share information and learn from each
other. Source: World Development Indicators (2017)
...and of livability. Certain public goods, such as infrastructures and basic services, can be provided
more efficiently and equitably when populations are large and densely packed. This is because urban
density has the potential to lower the unit costs of public service provision, thus enabling governments
to extend access to basic services. Conversely, lack of adequate investments in physical infrastructure
could result in congestion, pollution, and widening inequalities for urban dwellers.
3 Many benefits of agglomeration increase with scale, with each doubling of city size increasing productivity by 5 percent. Source: Rosenthal, S. and Strange, W. (2004). Evidence on the Nature and Sources of Agglomeration Economies. In Henderson, J. V. and Thisse, J. K., Eds., Handbook of Regional and Urban Economics, Elsevier, Amsterdam, 2119–2171.
13
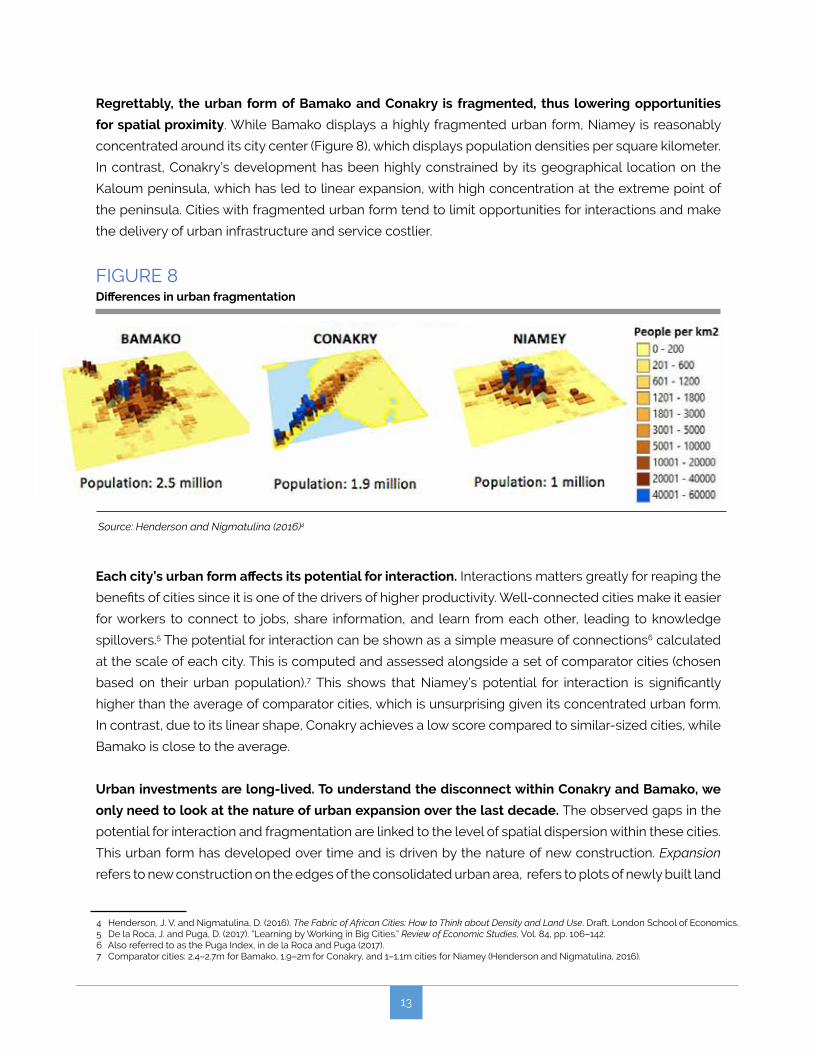
Regrettably, the urban form of Bamako and Conakry is fragmented, thus lowering opportunities
for spatial proximity. While Bamako displays a highly fragmented urban form, Niamey is reasonably
concentrated around its city center (Figure 8), which displays population densities per square kilometer.
In contrast, Conakry’s development has been highly constrained by its geographical location on the
Kaloum peninsula, which has led to linear expansion, with high concentration at the extreme point of
the peninsula. Cities with fragmented urban form tend to limit opportunities for interactions and make
the delivery of urban infrastructure and service costlier.
FIGURE 8 Differences in urban fragmentation
Source: Henderson and Nigmatulina (2016)4
4 Henderson, J. V. and Nigmatulina, D. (2016). The Fabric of African Cities: How to Think about Density and Land Use. Draft. London School of Economics.5 De la Roca, J. and Puga, D. (2017). “Learning by Working in Big Cities.” Review of Economic Studies, Vol. 84, pp. 106–142.6 Also referred to as the Puga Index, in de la Roca and Puga (2017).7 Comparator cities: 2.4–2.7m for Bamako, 1.9–2m for Conakry, and 1–1.1m cities for Niamey (Henderson and Nigmatulina, 2016).
Each city’s urban form affects its potential for interaction. Interactions matters greatly for reaping the
benefits of cities since it is one of the drivers of higher productivity. Well-connected cities make it easier
for workers to connect to jobs, share information, and learn from each other, leading to knowledge
spillovers.5 The potential for interaction can be shown as a simple measure of connections6 calculated
at the scale of each city. This is computed and assessed alongside a set of comparator cities (chosen
based on their urban population).7 This shows that Niamey’s potential for interaction is significantly
higher than the average of comparator cities, which is unsurprising given its concentrated urban form.
In contrast, due to its linear shape, Conakry achieves a low score compared to similar-sized cities, while
Bamako is close to the average.
Urban investments are long-lived. To understand the disconnect within Conakry and Bamako, we
only need to look at the nature of urban expansion over the last decade. The observed gaps in the
potential for interaction and fragmentation are linked to the level of spatial dispersion within these cities.
This urban form has developed over time and is driven by the nature of new construction. Expansion
refers to new construction on the edges of the consolidated urban area, refers to plots of newly built land

14
that do not border existing development, and infill refers to construction on unbuilt plots surrounded
by existing development (see Lall et al. 2017 for details and additional comparators).8 Across all three
cities, extension development accounts for a large share, markedly so in Bamako and Conakry (see
Figure 9, which displays a breakdown of urban expansion per city). Although urban extensions along city
edges are a natural process of growth, its effect on urban productivity and livability will be determined
by the extent of urban planning. If new construction is not clustered close to existing development,
this reduces economic density, defragmenting the city, lowering connections between workers, jobs,
and firms, and increasing the costs of service delivery. Worryingly, Bamako also displays the highest
share of leapfrog development (19%), with Conakry following closely (13%). In contrast, Niamey’s urban
expansion has been characterized by a very high share of infill in new areas (44%), a trend that – if
maintained – bodes well for the city’s future.
8 Lall, S. V., Henderson, J. V., and Venables, A. J. (2017). Africa’s Cities: Opening Doors to the World. World Bank. 9 Baruah, N. G., Henderson, J. V., and Peng, C. (2017). Colonial Legacies: Shaping African Cities. SERC Discussion Paper No. 226, Spatial Economics Research Center.
FIGURE 9 Breakdown of urban expansion for selected cities (2000–2010)
Source: Baruah et al., 20179
0% 10% 20% 30% 40% 50% 60% 70% 80% 90%
100%
Niam
eyDa
kar
Suku
taW
indh
oek
Lago
sAd
dis
Cona
kry
Toub
aNy
ala
Lusa
kaOua
gado
ugou
Kiga
liNa
irobi
Bam
ako
Bulaway
oM
aput
oAb
uja
Kam
pala
Kano
Noua
kcho
ttAc
cra
Extension Leapfrog Infill
Accessibility depends on two factors: land use, or where people live and where jobs are located,
and the performance of the transportation systems that allow people to travel to jobs. Cities can
maximize the impact of rapid urbanization through agglomeration economies, which themselves are
generated through efficient interactions between people and firms within the city. The availability of
efficient and affordable transportation infrastructure is just as important as the urban form of the city for
matching people, including to employment.
15
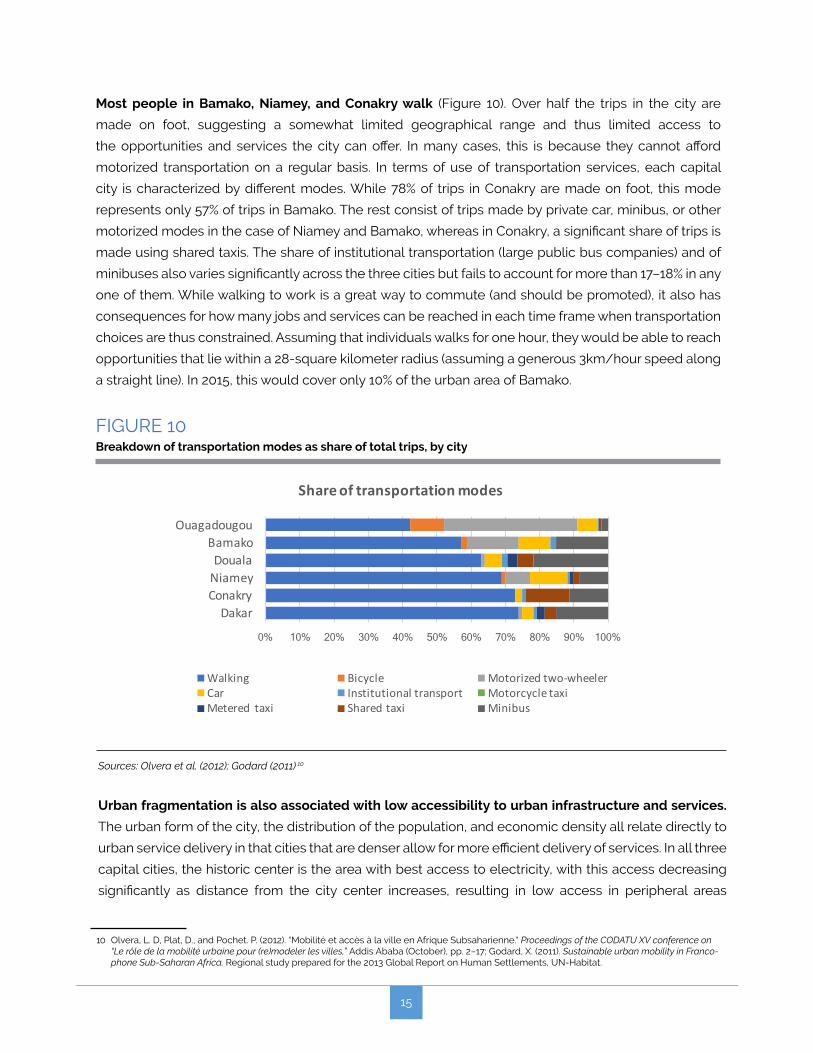
Most people in Bamako, Niamey, and Conakry walk (Figure 10). Over half the trips in the city are
made on foot, suggesting a somewhat limited geographical range and thus limited access to
the opportunities and services the city can offer. In many cases, this is because they cannot afford
motorized transportation on a regular basis. In terms of use of transportation services, each capital
city is characterized by different modes. While 78% of trips in Conakry are made on foot, this mode
represents only 57% of trips in Bamako. The rest consist of trips made by private car, minibus, or other
motorized modes in the case of Niamey and Bamako, whereas in Conakry, a significant share of trips is
made using shared taxis. The share of institutional transportation (large public bus companies) and of
minibuses also varies significantly across the three cities but fails to account for more than 17–18% in any
one of them. While walking to work is a great way to commute (and should be promoted), it also has
consequences for how many jobs and services can be reached in each time frame when transportation
choices are thus constrained. Assuming that individuals walks for one hour, they would be able to reach
opportunities that lie within a 28-square kilometer radius (assuming a generous 3km/hour speed along
a straight line). In 2015, this would cover only 10% of the urban area of Bamako.
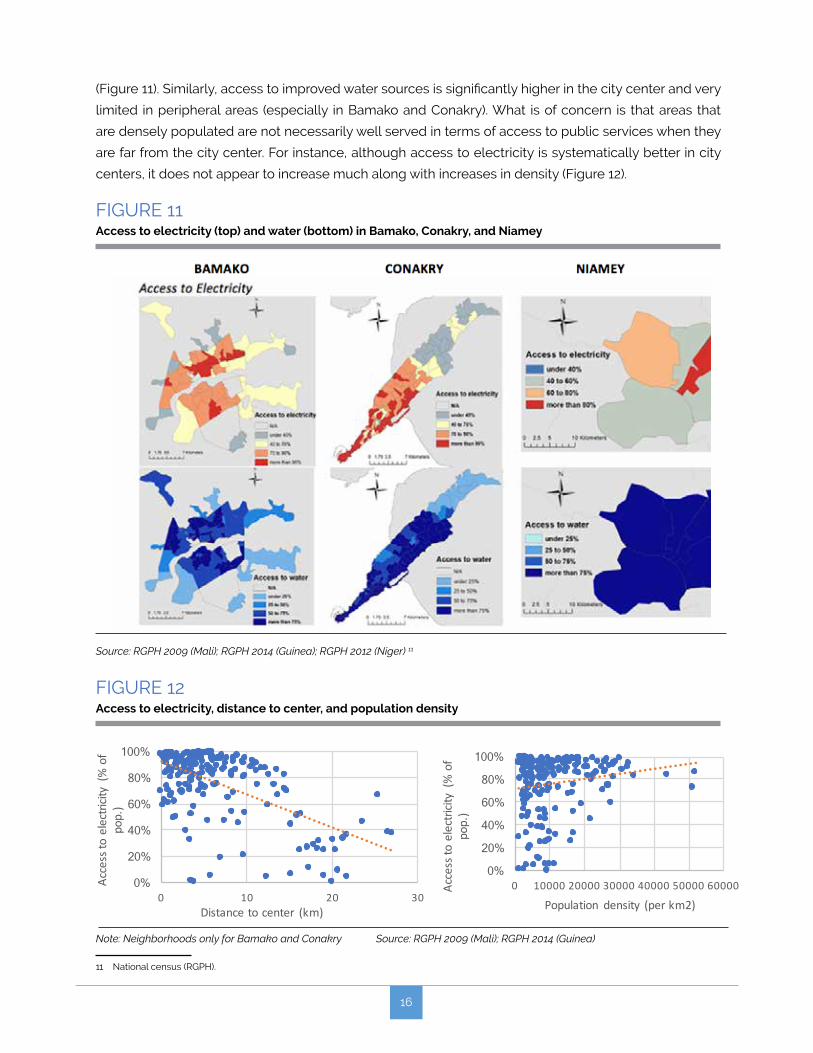
Urban fragmentation is also associated with low accessibility to urban infrastructure and services.
The urban form of the city, the distribution of the population, and economic density all relate directly to
urban service delivery in that cities that are denser allow for more efficient delivery of services. In all three
capital cities, the historic center is the area with best access to electricity, with this access decreasing
significantly as distance from the city center increases, resulting in low access in peripheral areas
FIGURE 10 Breakdown of transportation modes as share of total trips, by city
Sources: Olvera et al. (2012); Godard (2011) 10
0% 10% 20% 30% 40% 50% 60% 70% 80% 90% 100%
DakarConakryNiameyDouala
BamakoOuagadougou
Shareoftransportationmodes
Walking Bicycle Motorizedtwo-wheelerCar Institutionaltransport MotorcycletaxiMetered taxi Sharedtaxi Minibus
10 Olvera, L. D, Plat, D., and Pochet. P. (2012). “Mobilité et accès à la ville en Afrique Subsaharienne.“ Proceedings of the CODATU XV conference on “Le rôle de la mobilité urbaine pour (re)modeler les villes,” Addis Ababa (October), pp. 2–17; Godard, X. (2011). Sustainable urban mobility in Franco-phone Sub-Saharan Africa. Regional study prepared for the 2013 Global Report on Human Settlements, UN-Habitat.
16
(Figure 11). Similarly, access to improved water sources is significantly higher in the city center and very
limited in peripheral areas (especially in Bamako and Conakry). What is of concern is that areas that
are densely populated are not necessarily well served in terms of access to public services when they
are far from the city center. For instance, although access to electricity is systematically better in city
centers, it does not appear to increase much along with increases in density (Figure 12).
FIGURE 11 Access to electricity (top) and water (bottom) in Bamako, Conakry, and Niamey
Source: RGPH 2009 (Mali); RGPH 2014 (Guinea); RGPH 2012 (Niger) 11
11 National census (RGPH).
FIGURE 12 Access to electricity, distance to center, and population density
0%
20%
40%
60%
80%
100%
0 10 20 30
Accesstoelectricity(%of
pop.)
Distancetocenter (km)
0%
20%
40%
60%
80%
100%
0 10000 20000 30000 40000 50000 60000Acce
ssto
ele
ctric
ity(
%o
fpo
p.)
Population density(perkm2)
Note: Neighborhoods only for Bamako and Conakry Source: RGPH 2009 (Mali); RGPH 2014 (Guinea)
17
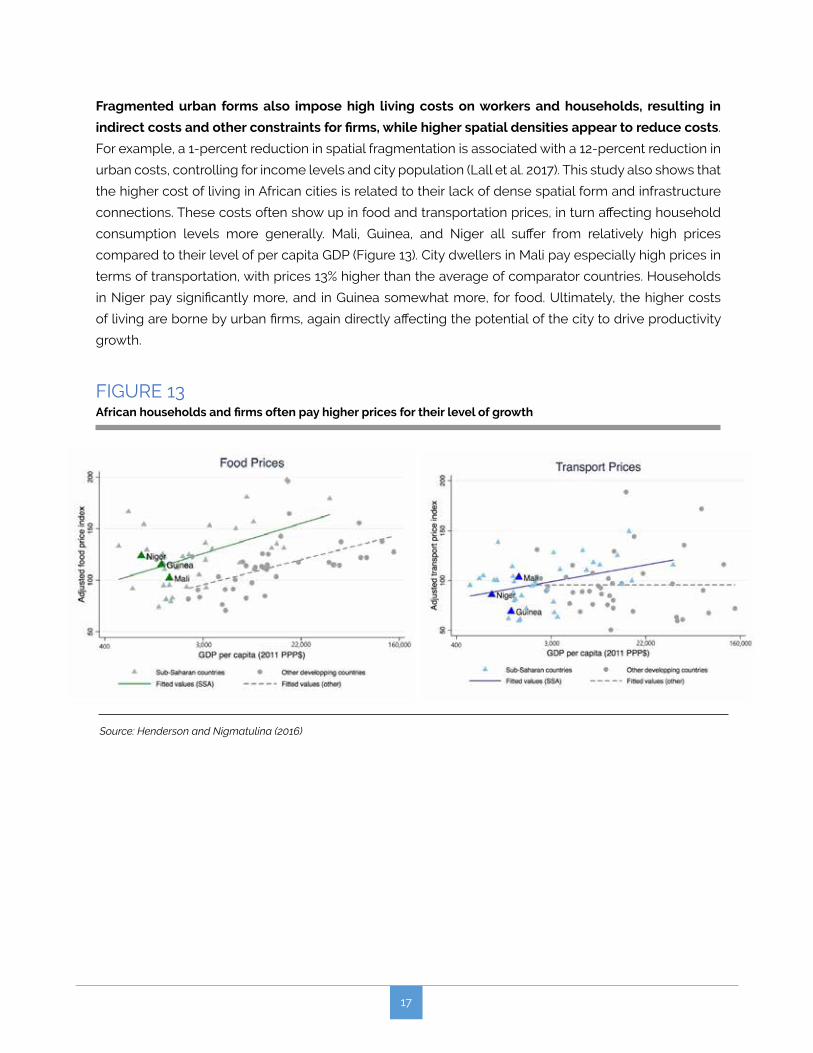
Fragmented urban forms also impose high living costs on workers and households, resulting in
indirect costs and other constraints for firms, while higher spatial densities appear to reduce costs.
For example, a 1-percent reduction in spatial fragmentation is associated with a 12-percent reduction in
urban costs, controlling for income levels and city population (Lall et al. 2017). This study also shows that
the higher cost of living in African cities is related to their lack of dense spatial form and infrastructure
connections. These costs often show up in food and transportation prices, in turn affecting household
consumption levels more generally. Mali, Guinea, and Niger all suffer from relatively high prices
compared to their level of per capita GDP (Figure 13). City dwellers in Mali pay especially high prices in
terms of transportation, with prices 13% higher than the average of comparator countries. Households
in Niger pay significantly more, and in Guinea somewhat more, for food. Ultimately, the higher costs
of living are borne by urban firms, again directly affecting the potential of the city to drive productivity
growth.
FIGURE 13African households and firms often pay higher prices for their level of growth
Source: Henderson and Nigmatulina (2016)
18
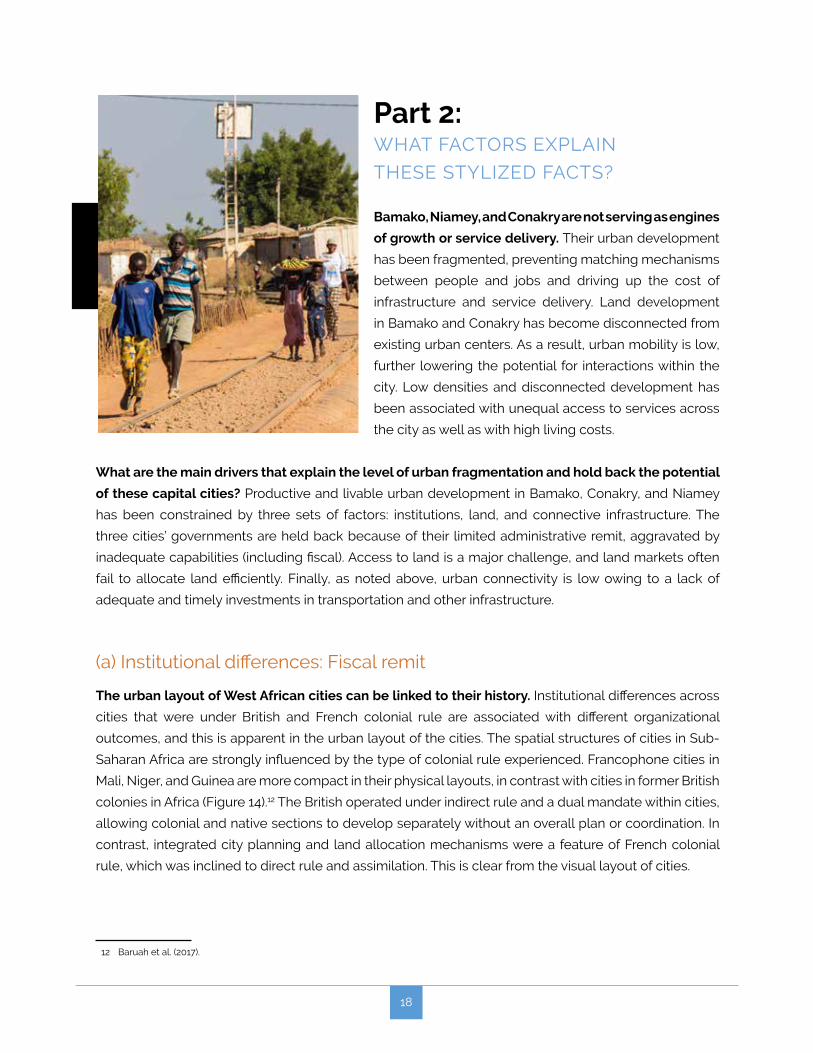
Part 2: WHAT FACTORS EXPLAIN
THESE STYLIZED FACTS?
Bamako, Niamey, and Conakry are not serving as engines
of growth or service delivery. Their urban development
has been fragmented, preventing matching mechanisms
between people and jobs and driving up the cost of
infrastructure and service delivery. Land development
in Bamako and Conakry has become disconnected from
existing urban centers. As a result, urban mobility is low,
further lowering the potential for interactions within the
city. Low densities and disconnected development has
been associated with unequal access to services across
the city as well as with high living costs.
What are the main drivers that explain the level of urban fragmentation and hold back the potential
of these capital cities? Productive and livable urban development in Bamako, Conakry, and Niamey
has been constrained by three sets of factors: institutions, land, and connective infrastructure. The
three cities’ governments are held back because of their limited administrative remit, aggravated by
inadequate capabilities (including fiscal). Access to land is a major challenge, and land markets often
fail to allocate land efficiently. Finally, as noted above, urban connectivity is low owing to a lack of
adequate and timely investments in transportation and other infrastructure.
(a) Institutional differences: Fiscal remit
The urban layout of West African cities can be linked to their history. Institutional differences across
cities that were under British and French colonial rule are associated with different organizational
outcomes, and this is apparent in the urban layout of the cities. The spatial structures of cities in Sub-
Saharan Africa are strongly influenced by the type of colonial rule experienced. Francophone cities in
Mali, Niger, and Guinea are more compact in their physical layouts, in contrast with cities in former British
colonies in Africa (Figure 14).12 The British operated under indirect rule and a dual mandate within cities,
allowing colonial and native sections to develop separately without an overall plan or coordination. In
contrast, integrated city planning and land allocation mechanisms were a feature of French colonial
rule, which was inclined to direct rule and assimilation. This is clear from the visual layout of cities.
12 Baruah et al. (2017).
19
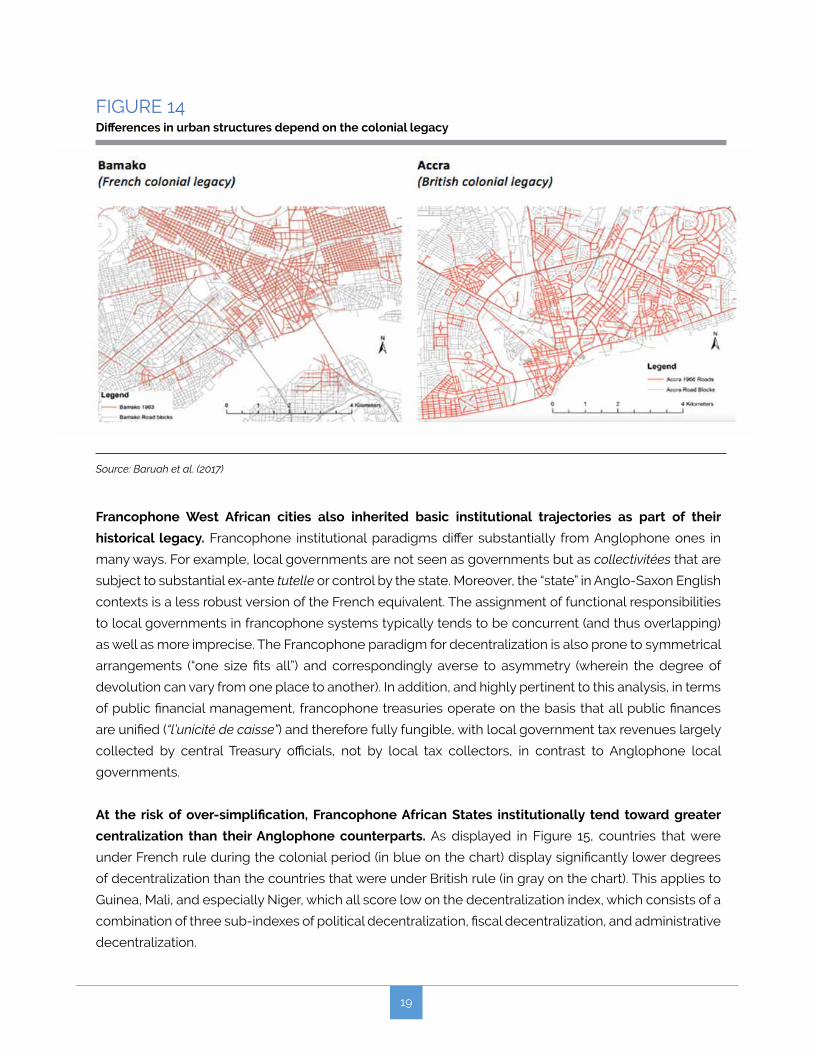
FIGURE 14 Differences in urban structures depend on the colonial legacy
Source: Baruah et al. (2017)
Francophone West African cities also inherited basic institutional trajectories as part of their
historical legacy. Francophone institutional paradigms differ substantially from Anglophone ones in
many ways. For example, local governments are not seen as governments but as collectivitées that are
subject to substantial ex-ante tutelle or control by the state. Moreover, the “state” in Anglo-Saxon English
contexts is a less robust version of the French equivalent. The assignment of functional responsibilities
to local governments in francophone systems typically tends to be concurrent (and thus overlapping)
as well as more imprecise. The Francophone paradigm for decentralization is also prone to symmetrical
arrangements (“one size fits all”) and correspondingly averse to asymmetry (wherein the degree of
devolution can vary from one place to another). In addition, and highly pertinent to this analysis, in terms
of public financial management, francophone treasuries operate on the basis that all public finances
are unified (“l’unicité de caisse”) and therefore fully fungible, with local government tax revenues largely
collected by central Treasury officials, not by local tax collectors, in contrast to Anglophone local
governments.
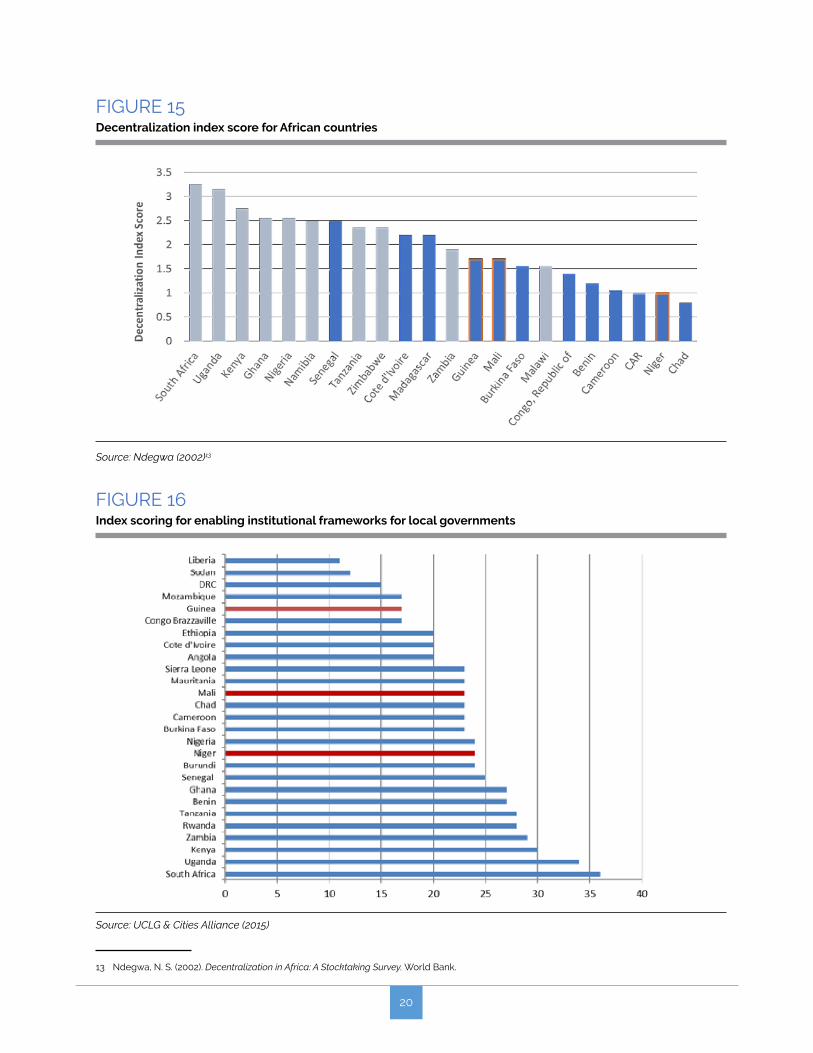
At the risk of over-simplification, Francophone African States institutionally tend toward greater
centralization than their Anglophone counterparts. As displayed in Figure 15, countries that were
under French rule during the colonial period (in blue on the chart) display significantly lower degrees
of decentralization than the countries that were under British rule (in gray on the chart). This applies to
Guinea, Mali, and especially Niger, which all score low on the decentralization index, which consists of a
combination of three sub-indexes of political decentralization, fiscal decentralization, and administrative
decentralization.
20
FIGURE 15Decentralization index score for African countries
Source: Ndegwa (2002)13
13 Ndegwa, N. S. (2002). Decentralization in Africa: A Stocktaking Survey. World Bank.
FIGURE 16Index scoring for enabling institutional frameworks for local governments
Source: UCLG & Cities Alliance (2015)
21
Although there has been common Institutional path dependency across all three Francophone
countries, this has inevitably resulted in different outcomes given their more recent political histories.
In each country, different political trajectories and processes have shaped how decentralization
has evolved even within a common institutional paradigm. Preliminary hypotheses for this finding
are sketched out below, with Mali as the implicit point of reference.
14 Ten criteria (constitutional framework, legislative framework, local democracy, financial transfers, own-source revenues, capacity building of local government administrations, transparency, citizen participation, local government performance, urban strategy) were identified as key to assessing the enabling environment each African government provides for its cities and local governments. Each country was analyzed in terms of progress with the implementation of – as well as constraints on – decentralization and then rated on a scale of 10 to 40. See: http://www.citiesalliance.org/ca-uclg-jwp
15 OECD (2016). Subnational Governments around the World: Structure and Finance.
Source: OECD (2016)15
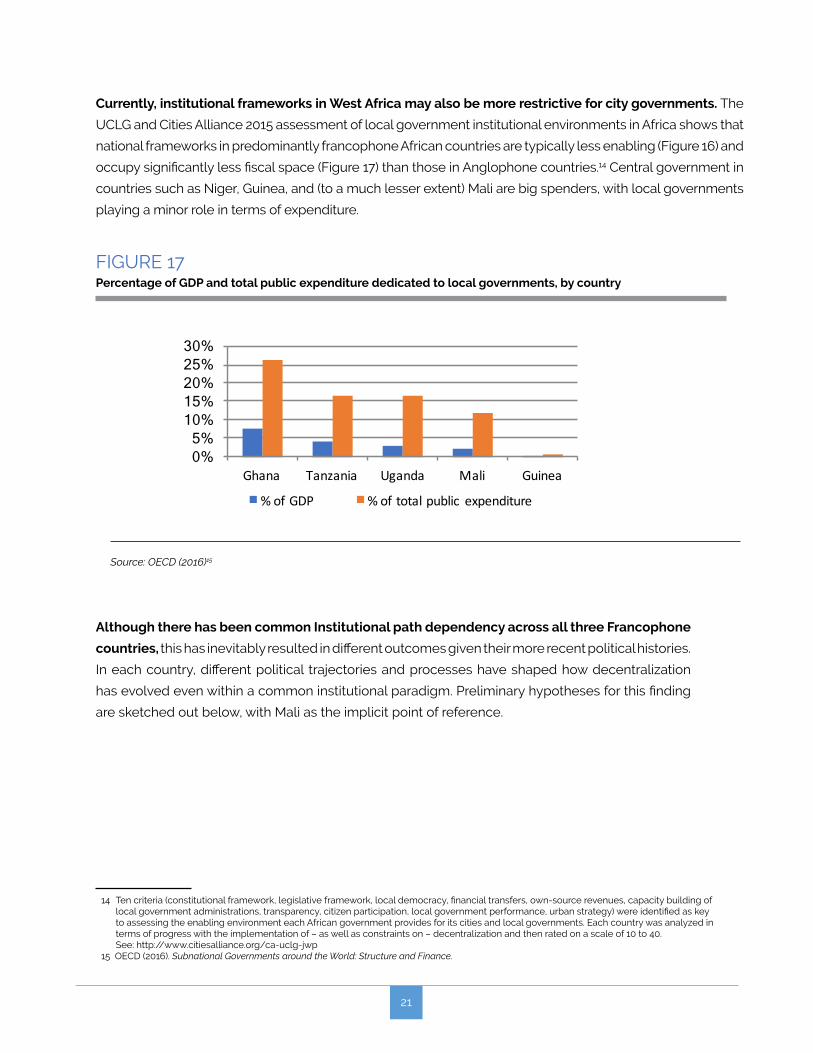
FIGURE 17 Percentage of GDP and total public expenditure dedicated to local governments, by country
0% 5%
10% 15% 20% 25% 30%
Ghana Tanzania Uganda Mali Guinea
%ofGDP %oftotalpublic expenditure
Currently, institutional frameworks in West Africa may also be more restrictive for city governments. The
UCLG and Cities Alliance 2015 assessment of local government institutional environments in Africa shows that
national frameworks in predominantly francophone African countries are typically less enabling (Figure 16) and
occupy significantly less fiscal space (Figure 17) than those in Anglophone countries.14 Central government in
countries such as Niger, Guinea, and (to a much lesser extent) Mali are big spenders, with local governments
playing a minor role in terms of expenditure.
22
n Decentralization in Mali has been consistent over time and has been one way of maintaining
national and territorial integrity. In part, this can be explained by the relative weakness of
the central Malian state over the period 1960–1991 and the consequent failure of one-party
and authoritarian regimes to resist popular demands for pluralist democracy and some form
of democratic local governance. Decentralization then became a leitmotif in the country’s
post-1991 political reforms, and has been largely sustained – with inevitable ups and downs –
ever since. As a result, an ever-growing number of sectors (education, health, etc.) have been
devolved to local governments in recent years. More recently and perhaps as importantly,
Mali’s decentralization reforms have also been driven and shaped by the state’s response to
secessionist-fueled conflicts in the north. Political settlements in the north have consistently
included commitments (both rhetorical and real) to greater degrees of local self-governance,
which have translated into further and deeper decentralization reforms. Since 2012 and the
resurgence of conflict in the north, regionalization has become an increasingly prominent
part of the country’s political discourse. At the same time and for the same reasons, Mali has
committed to allocating 30% of national revenues to local governments.
n In contrast, decentralization in Niger and Guinea has proceeded more slowly. In the immediate
post-independence period, both the Nigerien and Guinean States were more successful at
centralizing authority than their Malian counterpart. Although Niger and Guinea underwent
democratization and decentralization from the 1990s onward, central government continued
to exert a substantial degree of control in both countries, although arguably decreasingly so
since 2010. Both countries have also experienced regionally-based insurgencies of varying
intensities, though much less so than Mali. As a result, decentralization in Niger and Guinea has
probably been less urgent and much less of a political necessity. However, in both Niger and
Guinea, in the wake of post-2010 political changes, decentralization reforms have gained added
traction. In Guinea, the Local Community Code (Code des Collectivités Locales) was revised and
updated in 2017, and long-delayed local elections have just taken place (February 2018), while
in Niger, there has been a revival in the high-level policy debate over decentralization and the
need to devolve key social sectors as a way of improving service delivery.
These different decentralization trajectories have impacted the importance and financing of local
government in each country. In Guinea, where decentralization has been tepid (at best), communes
within Conakry have limited responsibilities and very few resources (see below). As a result, urban
local governments have far less scope to shape city development and services compared to their
counterparts in Bamako or Niamey.
23
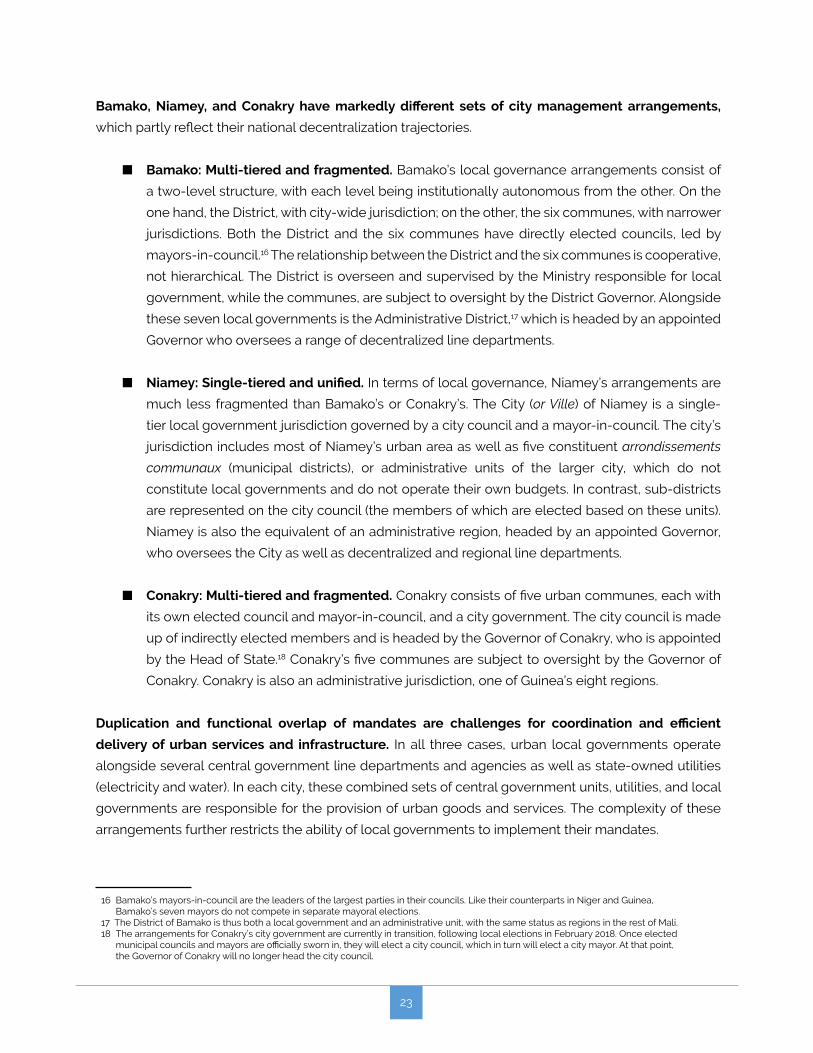
Bamako, Niamey, and Conakry have markedly different sets of city management arrangements,
which partly reflect their national decentralization trajectories.
n Bamako: Multi-tiered and fragmented. Bamako’s local governance arrangements consist of
a two-level structure, with each level being institutionally autonomous from the other. On the
one hand, the District, with city-wide jurisdiction; on the other, the six communes, with narrower
jurisdictions. Both the District and the six communes have directly elected councils, led by
mayors-in-council.16 The relationship between the District and the six communes is cooperative,
not hierarchical. The District is overseen and supervised by the Ministry responsible for local
government, while the communes, are subject to oversight by the District Governor. Alongside
these seven local governments is the Administrative District,17 which is headed by an appointed
Governor who oversees a range of decentralized line departments.
n Niamey: Single-tiered and unified. In terms of local governance, Niamey’s arrangements are
much less fragmented than Bamako’s or Conakry’s. The City (or Ville) of Niamey is a single-
tier local government jurisdiction governed by a city council and a mayor-in-council. The city’s
jurisdiction includes most of Niamey’s urban area as well as five constituent arrondissements
communaux (municipal districts), or administrative units of the larger city, which do not
constitute local governments and do not operate their own budgets. In contrast, sub-districts
are represented on the city council (the members of which are elected based on these units).
Niamey is also the equivalent of an administrative region, headed by an appointed Governor,
who oversees the City as well as decentralized and regional line departments.
n Conakry: Multi-tiered and fragmented. Conakry consists of five urban communes, each with
its own elected council and mayor-in-council, and a city government. The city council is made
up of indirectly elected members and is headed by the Governor of Conakry, who is appointed
by the Head of State.18 Conakry’s five communes are subject to oversight by the Governor of
Conakry. Conakry is also an administrative jurisdiction, one of Guinea’s eight regions.
Duplication and functional overlap of mandates are challenges for coordination and efficient
delivery of urban services and infrastructure. In all three cases, urban local governments operate
alongside several central government line departments and agencies as well as state-owned utilities
(electricity and water). In each city, these combined sets of central government units, utilities, and local
governments are responsible for the provision of urban goods and services. The complexity of these
arrangements further restricts the ability of local governments to implement their mandates.
16 Bamako’s mayors-in-council are the leaders of the largest parties in their councils. Like their counterparts in Niger and Guinea, Bamako’s seven mayors do not compete in separate mayoral elections.
17 The District of Bamako is thus both a local government and an administrative unit, with the same status as regions in the rest of Mali.18 The arrangements for Conakry’s city government are currently in transition, following local elections in February 2018. Once elected
municipal councils and mayors are officially sworn in, they will elect a city council, which in turn will elect a city mayor. At that point, the Governor of Conakry will no longer head the city council.
24
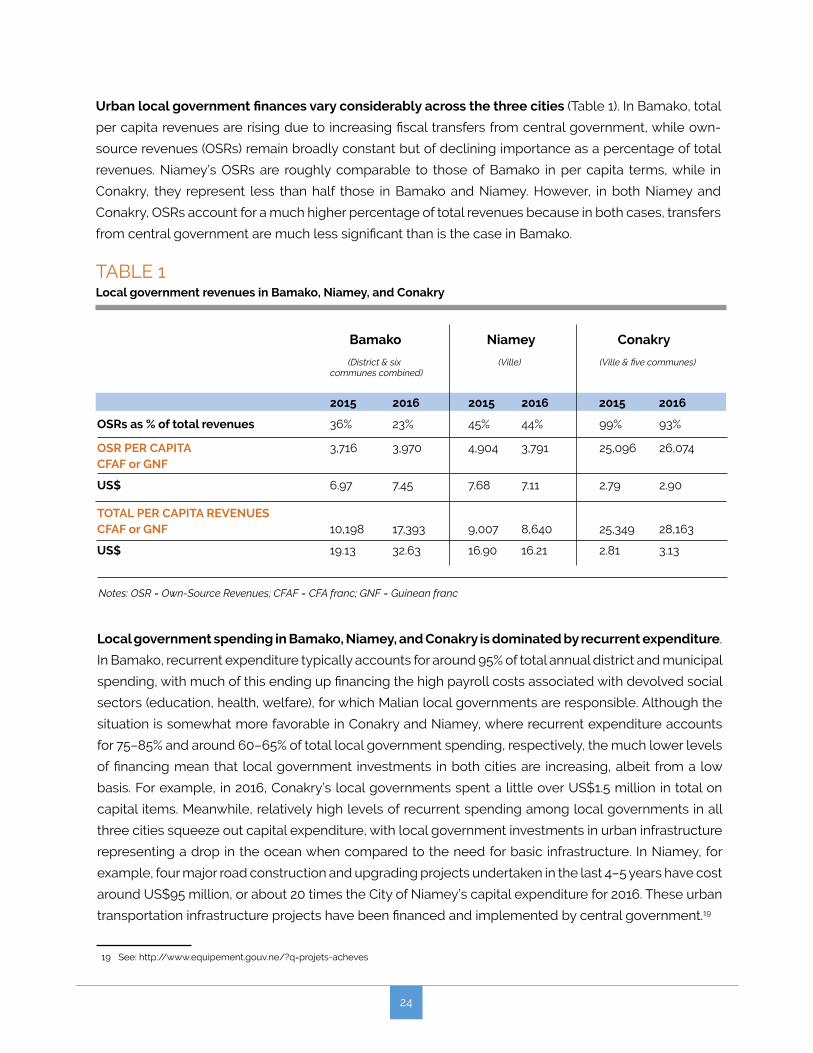
Urban local government finances vary considerably across the three cities (Table 1). In Bamako, total
per capita revenues are rising due to increasing fiscal transfers from central government, while own-
source revenues (OSRs) remain broadly constant but of declining importance as a percentage of total
revenues. Niamey’s OSRs are roughly comparable to those of Bamako in per capita terms, while in
Conakry, they represent less than half those in Bamako and Niamey. However, in both Niamey and
Conakry, OSRs account for a much higher percentage of total revenues because in both cases, transfers
from central government are much less significant than is the case in Bamako.
TABLE 1 Local government revenues in Bamako, Niamey, and Conakry
Notes: OSR = Own-Source Revenues; CFAF = CFA franc; GNF = Guinean franc
2015 2016 2015 2016 2015 2016
OSRs as % of total revenues 36% 23% 45% 44% 99% 93%
OSR PER CAPITA 3,716 3,970 4,904 3,791 25,096 26,074CFAF or GNF
US$ 6.97 7.45 7.68 7.11 2.79 2.90
TOTAL PER CAPITA REVENUESCFAF or GNF 10,198 17,393 9,007 8,640 25,349 28,163
US$ 19.13 32.63 16.90 16.21 2.81 3.13
Bamako Niamey Conakry
(District & six (Ville) (Ville & five communes) communes combined)
Local government spending in Bamako, Niamey, and Conakry is dominated by recurrent expenditure.
In Bamako, recurrent expenditure typically accounts for around 95% of total annual district and municipal
spending, with much of this ending up financing the high payroll costs associated with devolved social
sectors (education, health, welfare), for which Malian local governments are responsible. Although the
situation is somewhat more favorable in Conakry and Niamey, where recurrent expenditure accounts
for 75–85% and around 60–65% of total local government spending, respectively, the much lower levels
of financing mean that local government investments in both cities are increasing, albeit from a low
basis. For example, in 2016, Conakry’s local governments spent a little over US$1.5 million in total on
capital items. Meanwhile, relatively high levels of recurrent spending among local governments in all
three cities squeeze out capital expenditure, with local government investments in urban infrastructure
representing a drop in the ocean when compared to the need for basic infrastructure. In Niamey, for
example, four major road construction and upgrading projects undertaken in the last 4–5 years have cost
around US$95 million, or about 20 times the City of Niamey’s capital expenditure for 2016. These urban
transportation infrastructure projects have been financed and implemented by central government.19
19 See: http://www.equipement.gouv.ne/?q=projets-acheves
25
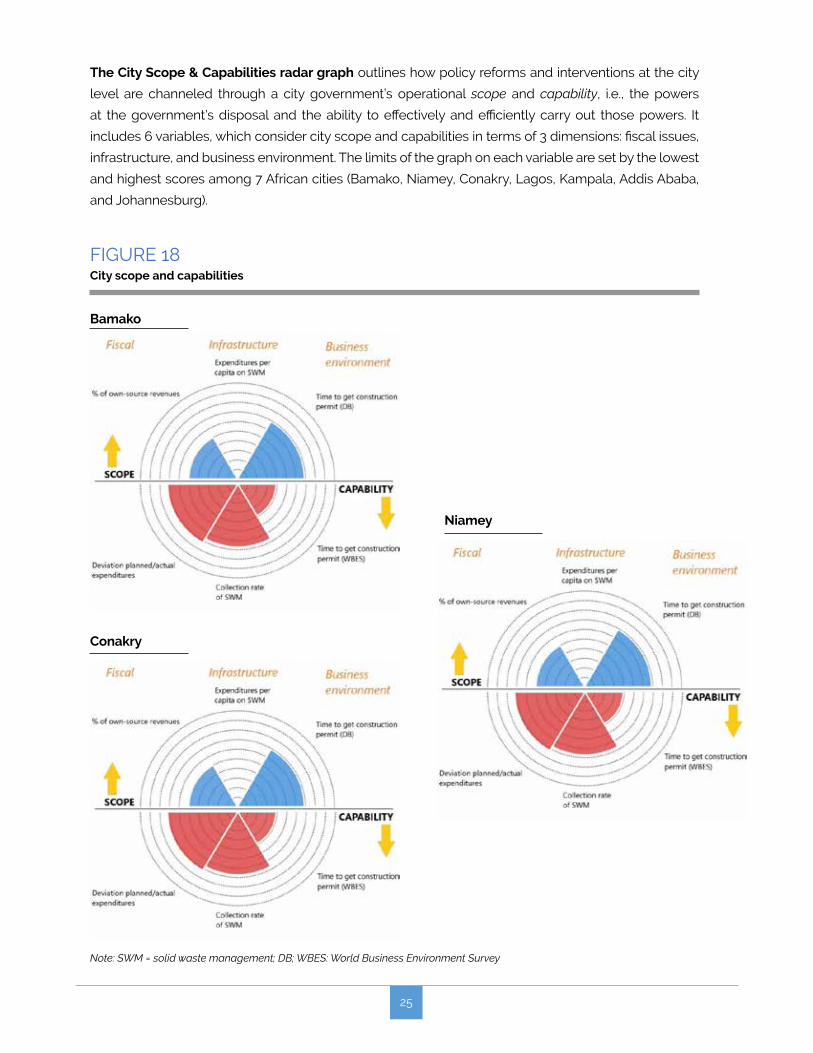
The City Scope & Capabilities radar graph outlines how policy reforms and interventions at the city
level are channeled through a city government’s operational scope and capability, i.e., the powers
at the government’s disposal and the ability to effectively and efficiently carry out those powers. It
includes 6 variables, which consider city scope and capabilities in terms of 3 dimensions: fiscal issues,
infrastructure, and business environment. The limits of the graph on each variable are set by the lowest
and highest scores among 7 African cities (Bamako, Niamey, Conakry, Lagos, Kampala, Addis Ababa,
and Johannesburg).
FIGURE 18 City scope and capabilities
Note: SWM = solid waste management; DB; WBES: World Business Environment Survey
Bamako
Conakry
Niamey
26
The quality of city governance is an important concern for urban development. Urban governance
structures across Mali, Niger, and Guinea tend to be diverse, being the outcome of specific historical
and political circumstances. Not only does their administrative remit differ, but so do their capabilities to
implement that remit while being given access to resources, both fiscal and technical. What they have
in common is that to varying degrees, city governments in Bamako, Conakry, and Niamey lack financial
resources and technical capabilities to tackle urban planning for the delivery of urban infrastructure and
services (Figure 18 and accompanying box). The total number of urban planners in Mali is 20, or 0.13 per
100,000 people, compared to 0.97 across Africa.20 The city’s scope and capability radar graph shows
that Bamako’s fiscal scope (above the line) and its capability (below the line) are well matched, though
neither is very high. However, the city has no control over its waste management function.21 There is also
a major disconnect in terms of business environment in that the Doing Business measure regarding
construction permits (a mainly a de jure measure) lags far behind actual time to get construction permits
(i.e. de facto) measured by Enterprise Survey data from Bamako. Similar disconnects are observed in
Niamey and Conakry. In the case of the latter, the percentage of own-source revenues seems very
high because there are virtually no direct transfers from central government and actual revenues are
very low relative to Bamako or Niamey. However, the capability to use these revenues is much lower in
comparison.
(b) Access to land and functioning of land markets
The fragmented spatial form of West African cities prevents them from becoming productive and
livable, and challenges in the land sector provide an important explanation. Weak property right
systems and poor land governance contribute to making access to land costly and insecure, resulting
in land misallocation and deterring productive investment. These are the predominant conditions under
which urban land markets operate in West Africa, thus failing to provide the enabling environment
needed to sustain productive urbanization without exerting a significant toll on the economy. The rapid
pace of urban expansion in West African cities has relied predominantly on informal processes for access
to land for housing, urban services, and infrastructure. Such informal spatial expansion (illustrated by
the above-mentioned data on urban extensions and leapfrog development), in turn creates challenges
for urban planning and infrastructure provision. Only a small proportion of the population holds formal
land titles, leading to under-investment and inefficient land markets. At the core of these challenges
is the coexistence of different land tenure regimes (referred to as “legal pluralism”), poor governance
in the management of land at all levels of government, and a largely uncoordinated pattern of land
use and land tenure transformation that has accompanied urban population growth and spatial urban
expansion.
20 Authors’ calculations based on: The State of Planning in Africa (2004). African Planning Association and UN-Habitat.21 The absence of revenue in the local governments’ budgets reflect the funding structure of solid waste management (SWM) services, where
households pay directly to small collection consortiums and the government funds the collection directly through a contract with a private company (Ozone). The District of Bamako stopped budgeting expenditure for the Roads and Sanitation agency separately as of the 2016 budget after signing the Ozone contract on September 29, 2015.
27
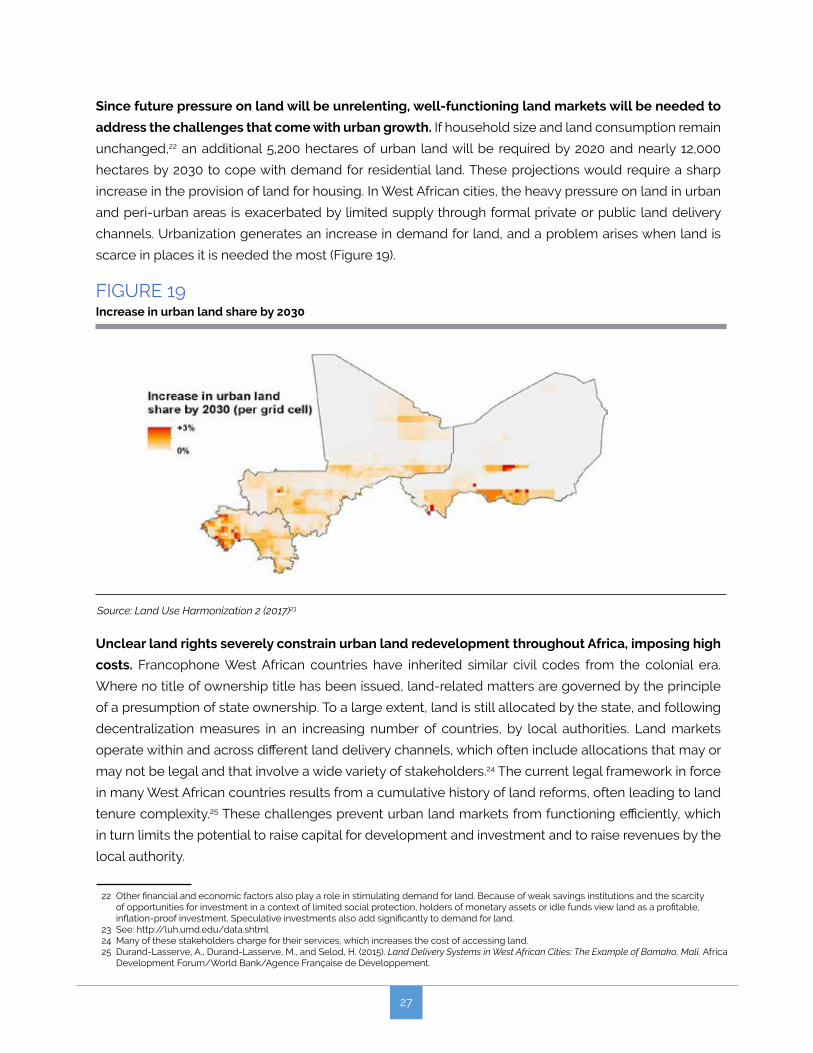
Since future pressure on land will be unrelenting, well-functioning land markets will be needed to
address the challenges that come with urban growth. If household size and land consumption remain
unchanged,22 an additional 5,200 hectares of urban land will be required by 2020 and nearly 12,000
hectares by 2030 to cope with demand for residential land. These projections would require a sharp
increase in the provision of land for housing. In West African cities, the heavy pressure on land in urban
and peri-urban areas is exacerbated by limited supply through formal private or public land delivery
channels. Urbanization generates an increase in demand for land, and a problem arises when land is
scarce in places it is needed the most (Figure 19).
FIGURE 19Increase in urban land share by 2030
Source: Land Use Harmonization 2 (2017)23
22 Other financial and economic factors also play a role in stimulating demand for land. Because of weak savings institutions and the scarcity of opportunities for investment in a context of limited social protection, holders of monetary assets or idle funds view land as a profitable, inflation-proof investment. Speculative investments also add significantly to demand for land.
23 See: http://luh.umd.edu/data.shtml24 Many of these stakeholders charge for their services, which increases the cost of accessing land.25 Durand-Lasserve, A., Durand-Lasserve, M., and Selod, H. (2015). Land Delivery Systems in West African Cities: The Example of Bamako, Mali. Africa
Development Forum/World Bank/Agence Française de Développement.
Unclear land rights severely constrain urban land redevelopment throughout Africa, imposing high
costs. Francophone West African countries have inherited similar civil codes from the colonial era.
Where no title of ownership title has been issued, land-related matters are governed by the principle
of a presumption of state ownership. To a large extent, land is still allocated by the state, and following
decentralization measures in an increasing number of countries, by local authorities. Land markets
operate within and across different land delivery channels, which often include allocations that may or
may not be legal and that involve a wide variety of stakeholders.24 The current legal framework in force
in many West African countries results from a cumulative history of land reforms, often leading to land
tenure complexity.25 These challenges prevent urban land markets from functioning efficiently, which
in turn limits the potential to raise capital for development and investment and to raise revenues by the
local authority.
28
In Bamako, two issues exemplify how inefficiencies in land markets create obstacles to coordinated
urban development: the provision of housing, and securing access to land. Interventions in the
land and housing sector mainly take the form of subdivisions (lotissements), which in practice are a
(remunerative) form of land-sharing scheme found in all rural communes in the peri-urban areas of
Bamako within Kati Circle, with the support of prefects and sub-prefects. The lack of coordination
of subdivisions (whether public or private, authorized or unauthorized) is not consistent with larger
development schemes for serviced land and access to public services. They sometime occur at the
expense of households who do not have secure property rights and in ways that are not compatible
with formal rights, adding to the confusion.
Land markets in Bamako are highly distorted and do not allocate land efficiently. With different land
tenure systems coexisting, the procedures used to make land available for housing are complex, costly,
and opaque. Bamako residents access land in accordance with their employment status and income.
A small proportion of households, usually those with high incomes or with public or private sector jobs,
access land through various formal channels, while a clear majority of households have to use other,
more informal channels. Social and political networks also play a critical role. In practice, informality is
the norm, not the exception, and is in a way set up with the many beneficiaries of the system, including
the public authorities. For most households, access to land under formal tenure is either unaffordable or
unattainable due to the lack of social connections required to navigate the land administration or may
not be envisioned at all due to the lack of information or knowledge regarding property rights.26 Such
unequal access greatly contributed to social unrest and instability.27
Challenges present in the land sector hinder investments and economic development and have
serious consequences for livelihoods, social peace, and political stability. Access to land in urban
and peri-urban areas in these cities, where poverty levels and population growth are high, is a sensitive
issue. For governments, inadequate policy objectives and lack of control over land delivery constitute
major threats. Land markets in these countries operate in a context of weak governance, insufficient
human and financial resources, and limited institutional capacity in the land sector. Better understanding
of current urban land and housing practices, the functioning of land markets, and the formation of land
prices is a precondition for designing any sustainable land and housing policy.
(c) Urban connectivity
When accessibility is good, cities allow people to choose jobs from wider pools, leading to increased
welfare and productivity.28 By increasing the number and diversity of employers and job seekers, large
26 Many households are poorly informed about property rights. For some, there is also a misunderstanding that administrative documents are property rights or that use rights are ownership rights.
27 For the majority of the urban population, especially the poor and the middle class, accessing land for housing has become increasingly difficult, holding land is insecure, and conflict over land is pervasive. These problems exacerbate inequality, threaten social and political stability, and fail to provide the enabling environment for productive investments.
28 Bertaud, A. (2014). Cities as Labor Markets. Working paper No. 2. Marron Institute on Cities and the Urban Environment, New York University.
29
and integrated labor markets allow for appropriate matches, which makes the best of their respective
skills and aspirations. Consider, for example, a schoolteacher or carpenter looking for work in Bamako,
Conakry, or Niamey. These job-seekers could apply for ten positions, and if they can effectively travel to
all ten daily, they would be able to choose the best offer in terms of salary, required skills, or desirable
location within the urban area. A wider pool of accessible jobs also produces more inclusive cities,
avoiding the disconnection of entire neighborhoods of urban areas from the rest of the local economy.
The potential for interaction within cities is determined not only by the use of land but also by the
level of urban mobility and connectivity. Urban management through careful urban planning and
interventions in the transportation sector is key to ensuring that people remain connected to employment
opportunities. Failure in this regard leads to fragmented urban areas, where matching between people
and jobs is forced to remain at the local level.
Accessibility also contributes to improvements in livability. A well-coordinated land use and transport
system helps relieve pressure on household resources, both fiscal and in terms of time, freeing up
resources for other expenditures. Importantly, better accessibility to opportunities means that the
poorest households are not forced to live in the immediate vicinity of job-generating urban cores,
which is often where land is most expensive, leaving them with less for living expenses.29 In Nairobi, for
example, most residents of informal settlements have jobs and comparatively high levels of education
relative to those living in formal housing, yet their living conditions remain basic. This situation probably
reflects a premium already placed on accessibility.
29 Gulyani, S., Bassett, E. M., and Talukdar, D. (2012). “Living Conditions, Rents, and their Determinants in the Slums of Nairobi and Dakar.” Land Economics, Vol. 88, No. 2, pp. 251–274.
30 The first and second estimates are derived from Global Human Settlements Layer (GHSL) and the 2009 census (RGPH), respectively.
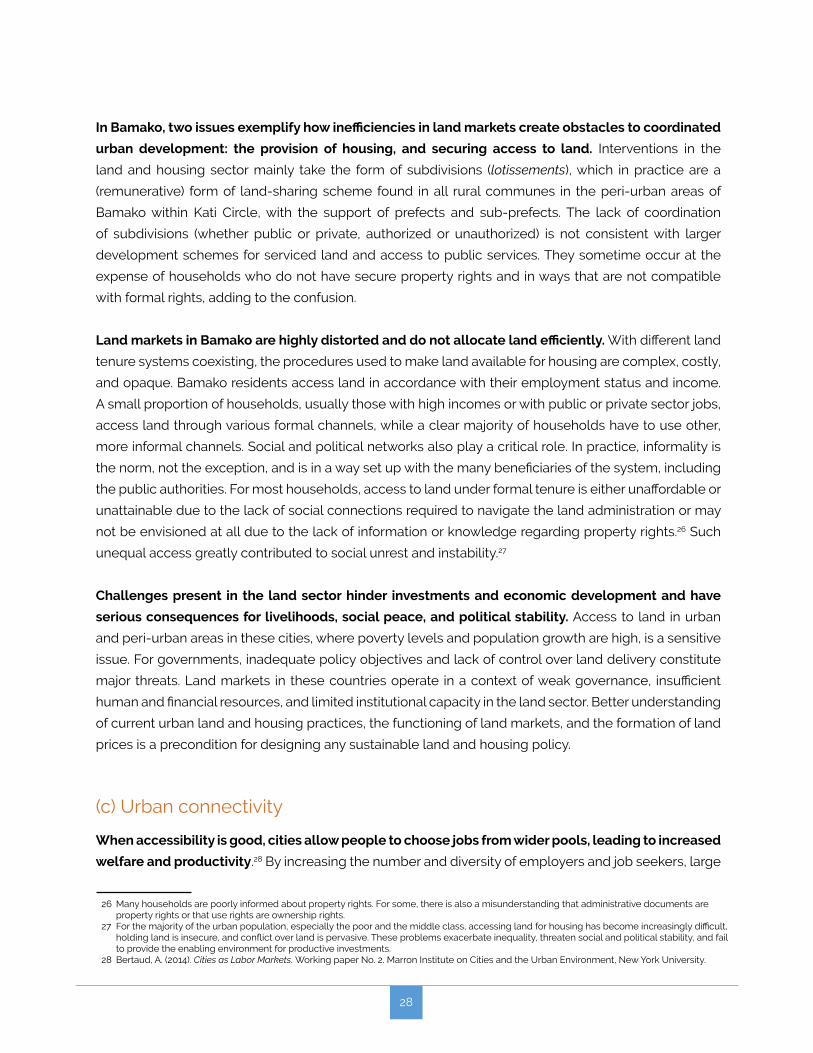
FIGURE 20 Urban expansion in Bamako, 1975–2014
Source: Global Human Settlement Layers 1975, 2000, 2015
In Bamako, accessibility is constrained by low
population densities and high congestion levels
on the main arterial roads. Peak population
density in Bamako is around 37–45 per hectare.30
This order of magnitude is lower than in the
highest densities found in Nairobi (315/ha), Dakar
(315/ha), Dar Es Salaam (280/ha), and to a lesser
extent Addis Ababa (200/ha). This means that on
average, people must travel longer distances to
reach the same number of jobs than in denser
cities. In addition, the conversion of agricultural land
to building land on the periphery of Bamako over
the last 30 or more years means that the average
distance to the more central locations, where job
density is high, has increased (Figure 20). This
contributes to constrains on accessibility levels
30
despite slight overall densification. Congestion also plays a powerful role in limiting access to
opportunities in the city as the River Niger creates a natural bottleneck for people commuting from the
south bank (with mainly residential neighborhoods) to the north bank (with the highest job densities).
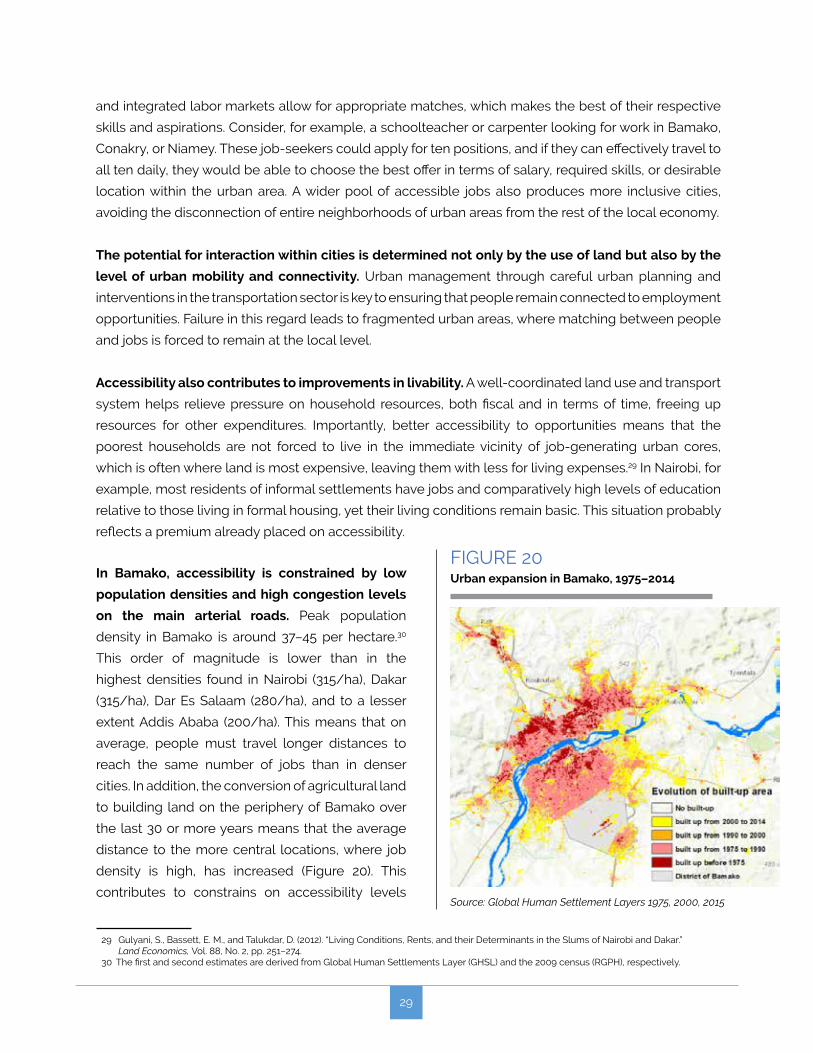
FIGURE 21 Share of jobs accessible within 60 minutes for pedestrians and Sotrama users depending on growth scenario
Source: Author’s calculation based on 2009 RGPH and 2015 Business Registry
0%10%20%30%40%50%60%
Pedestrian Sotrama
Normal growth Clustering
In Bamako, the clustering of jobs and households
could increase accessibility. Studies suggest that
generalized congestion, which halves traveling
speeds, can reduce the share of jobs that can
be reached using the informal minibus network
(known as sotrama and magbana) by 27 percentage
points within one hour and that intervening in the
six most important minibus corridors alone could
increase average accessibility by 12% through
speeds increases of 30%. The main driver of limited
accessibility in Bamako is the under-utilization
of land, especially in the city center, and heavy
congestion along the main roads. Thus, an increase
in population and job concentration would have a
significant impact on accessibility levels (Figure 21).
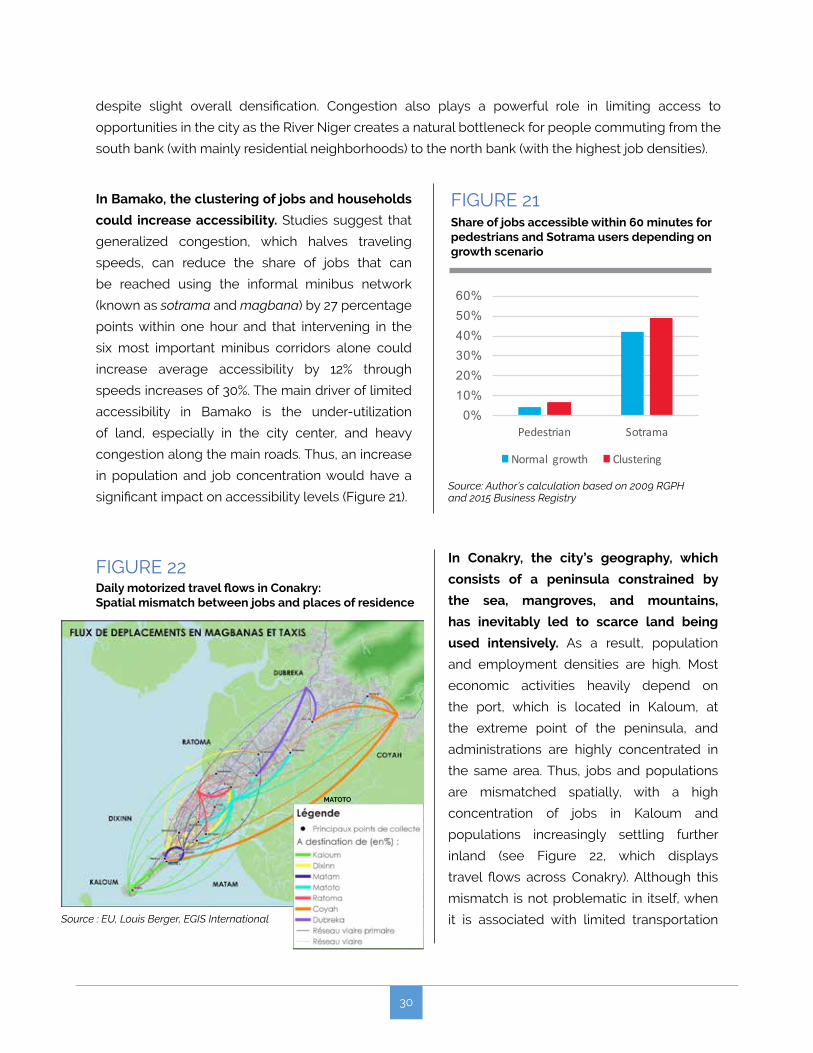
In Conakry, the city’s geography, which
consists of a peninsula constrained by
the sea, mangroves, and mountains,
has inevitably led to scarce land being
used intensively. As a result, population
and employment densities are high. Most
economic activities heavily depend on
the port, which is located in Kaloum, at
the extreme point of the peninsula, and
administrations are highly concentrated in
the same area. Thus, jobs and populations
are mismatched spatially, with a high
concentration of jobs in Kaloum and
populations increasingly settling further
inland (see Figure 22, which displays
travel flows across Conakry). Although this
mismatch is not problematic in itself, when
it is associated with limited transportation
FIGURE 22 Daily motorized travel flows in Conakry: Spatial mismatch between jobs and places of residence
Source : EU, Louis Berger, EGIS International
MATOTO
31
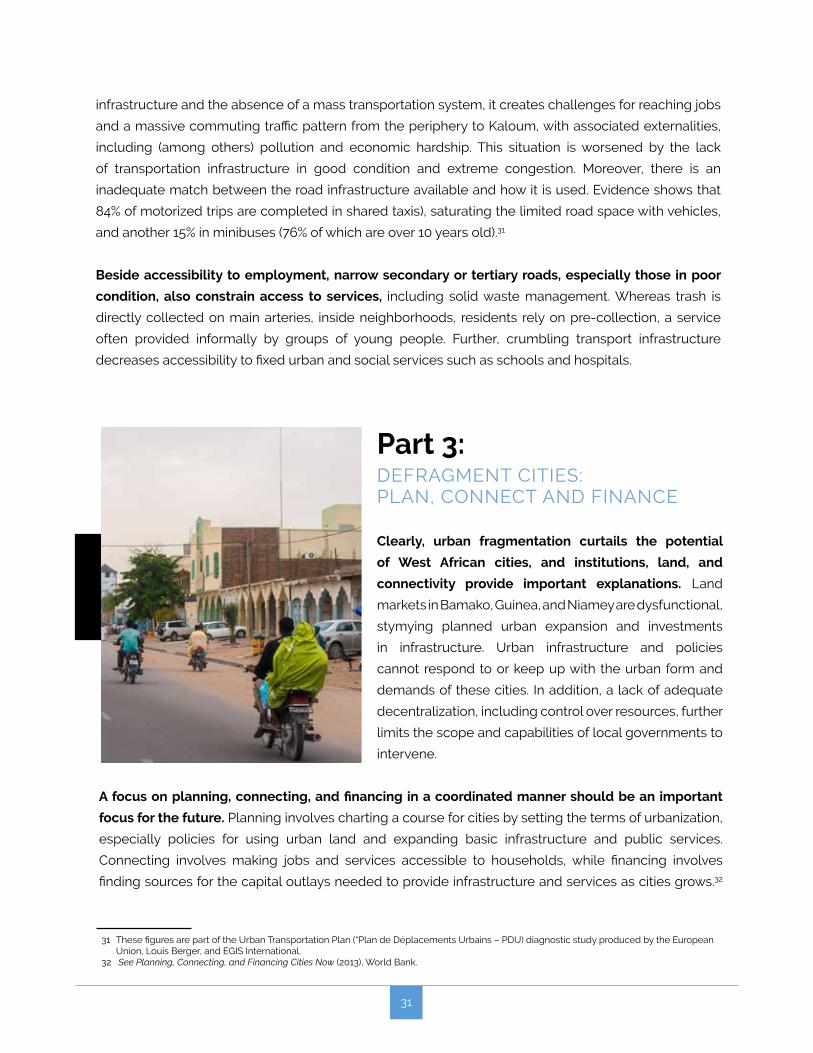
infrastructure and the absence of a mass transportation system, it creates challenges for reaching jobs
and a massive commuting traffic pattern from the periphery to Kaloum, with associated externalities,
including (among others) pollution and economic hardship. This situation is worsened by the lack
of transportation infrastructure in good condition and extreme congestion. Moreover, there is an
inadequate match between the road infrastructure available and how it is used. Evidence shows that
84% of motorized trips are completed in shared taxis), saturating the limited road space with vehicles,
and another 15% in minibuses (76% of which are over 10 years old).31
Beside accessibility to employment, narrow secondary or tertiary roads, especially those in poor
condition, also constrain access to services, including solid waste management. Whereas trash is
directly collected on main arteries, inside neighborhoods, residents rely on pre-collection, a service
often provided informally by groups of young people. Further, crumbling transport infrastructure
decreases accessibility to fixed urban and social services such as schools and hospitals.
31 These figures are part of the Urban Transportation Plan (“Plan de Déplacements Urbains – PDU) diagnostic study produced by the European Union, Louis Berger, and EGIS International.
32 See Planning, Connecting, and Financing Cities Now (2013), World Bank.
Part 3: DEFRAGMENT CITIES: PLAN, CONNECT AND FINANCE
Clearly, urban fragmentation curtails the potential
of West African cities, and institutions, land, and
connectivity provide important explanations. Land
markets in Bamako, Guinea, and Niamey are dysfunctional,
stymying planned urban expansion and investments
in infrastructure. Urban infrastructure and policies
cannot respond to or keep up with the urban form and
demands of these cities. In addition, a lack of adequate
decentralization, including control over resources, further
limits the scope and capabilities of local governments to
intervene.
A focus on planning, connecting, and financing in a coordinated manner should be an important
focus for the future. Planning involves charting a course for cities by setting the terms of urbanization,
especially policies for using urban land and expanding basic infrastructure and public services.
Connecting involves making jobs and services accessible to households, while financing involves
finding sources for the capital outlays needed to provide infrastructure and services as cities grows.32
32
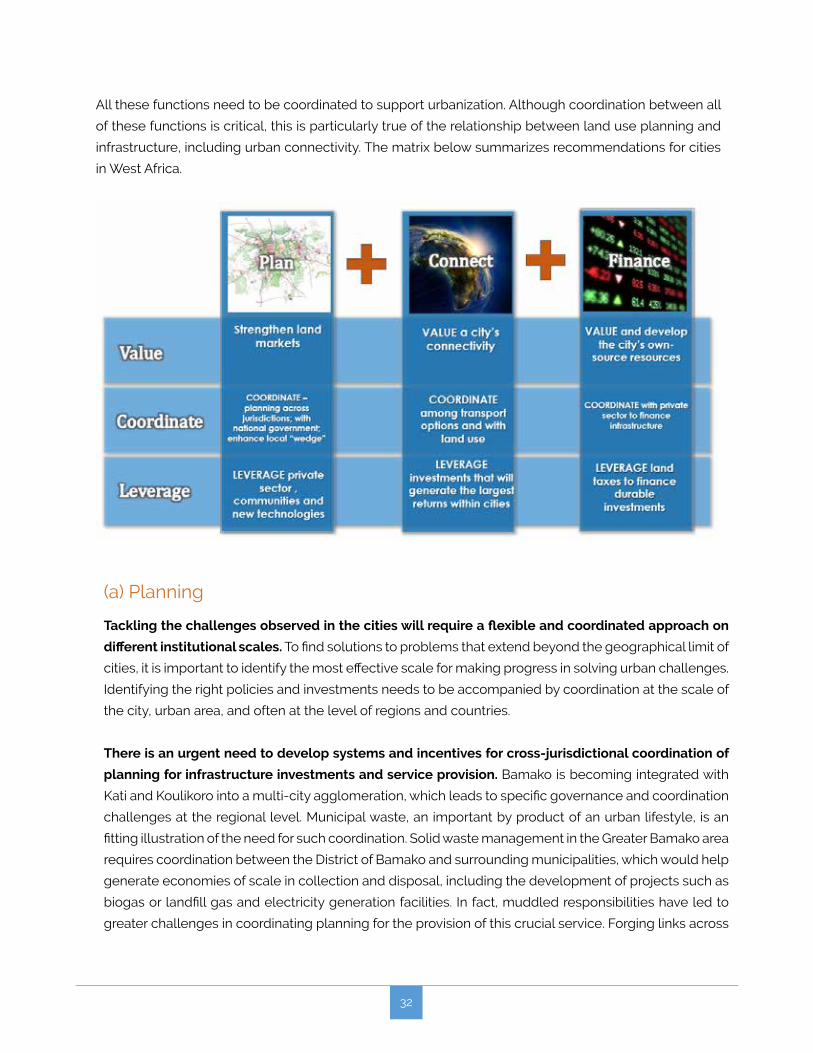
All these functions need to be coordinated to support urbanization. Although coordination between all
of these functions is critical, this is particularly true of the relationship between land use planning and
infrastructure, including urban connectivity. The matrix below summarizes recommendations for cities
in West Africa.
(a) Planning
Tackling the challenges observed in the cities will require a flexible and coordinated approach on
different institutional scales. To find solutions to problems that extend beyond the geographical limit of
cities, it is important to identify the most effective scale for making progress in solving urban challenges.
Identifying the right policies and investments needs to be accompanied by coordination at the scale of
the city, urban area, and often at the level of regions and countries.
There is an urgent need to develop systems and incentives for cross-jurisdictional coordination of
planning for infrastructure investments and service provision. Bamako is becoming integrated with
Kati and Koulikoro into a multi-city agglomeration, which leads to specific governance and coordination
challenges at the regional level. Municipal waste, an important by product of an urban lifestyle, is an
fitting illustration of the need for such coordination. Solid waste management in the Greater Bamako area
requires coordination between the District of Bamako and surrounding municipalities, which would help
generate economies of scale in collection and disposal, including the development of projects such as
biogas or landfill gas and electricity generation facilities. In fact, muddled responsibilities have led to
greater challenges in coordinating planning for the provision of this crucial service. Forging links across
33
neighboring urban areas may in fact require voluntary coordination if government-led organization
with overarching jurisdiction is lacking. In Uganda, coordination between the city of Kampala and
surrounding local governments has developed thanks to persistent efforts over time. In the UK, central
government encourages city councils to work together more effectively to identify local economic
development opportunities, which can then secure the necessary funding.33
Land markets must also be strengthened by improving access to land and simplifying and
clarifying land and property rights. Clarifying land and property rights, scaling up investment in
infrastructure, and improving access to credit across rural and urban areas are a first step in urban
development. Secure tenure promotes greater investment in land and housing, improves the ability
to transfer land, and enhances access to credit. However, legal and regulatory measures aimed at
improvements in land allocation processes and land rights security need to be tackled at the national
level. Failing this, the success of pilot schemes such as delivery platforms in specific cities will be
short-lived. Thus, while the setting up of local land commissions will help manage land conversion in
peri-urban areas, this must be accompanied by a systematic inventory of all land, including validation
of titles. However, building a land cadaster along with accompanying geographical information and
legal frameworks is a longer-term objective. In the short term, governments in Mali, Guinea, and Niger
can help improve the methodology for the validation and conversion of precarious existing titles as
well as the prevention and resolution of land conflicts in urban areas (see Box 1 for an example of
innovative solutions).
Cities can also leverage competitive markets alongside regulations in order to expand basic
services. To promote entrepreneurship, policy makers need to remove constraints on business
development and support light manufacturing sectors in urban centers. Local governments are often
in the lead when experimenting with “smart” solutions such as crowding in private sector players to
help tackle urban challenges. In all three countries, there is a large, untapped potential for piloting
projects that could demonstrate intermediate success in using digital technologies to address urban
challenges and could potentially be scaled up in the future. In cases where urban services provision
is limited in the short term by available resources and capacity, local governments could facilitate
crowding in by private sector firms in order to provide ideas and solutions.
33 https://www.gov.uk/government/policies/city-deals-and-growth-deals
34
BOX 2Creating markets for service delivery: The case of sewerage
Social enterprises in many low-income cities and countries can serve poor households, sometimes through off-grid solutions. Millions of people at the bottom of the pyramid live in communities that are not connected to the sewerage system. Most of them use pit latrines or engage in open defecation. To address the problem, dozens of social enterprises have devised innovative toilets that require no water. These low-cost in-home or community-based units represent a huge improvement over unimproved sanitation and create jobs for people who install and service them. Serviced toilets are compact units that can be used in homes and communities without access to centralized sewerage systems. Clients usually pay for using the toilets but do not own them. The company that owns the toilets empties them, treats the waste, and converts it into fertilizer or fuel.
The business model usually involves a mix of private companies, NGOs, local entrepreneurs, and, often local government agencies. Under a typical serviced toilet model, the firm supplies and installs the toilet and evacuates and often processes the waste. For community toilets, local franchisees or operators usually service the toilets, keep them clean, collect fees, and sell other services at the toilet site. For example, in Kenya, Ecotact operates “toilet malls,” which also serve as retail outlets for basic necessities such as prepaid mobile cards, snacks, and shoe cleaning services.39 An NGO operates the toilet network, provides training, and supports over 300 local entrepreneurs, who earn steady incomes from their business. In Tunisia, Envitou STAS provides containers to allow for economical and environmentally safe collection and removal of large amounts of garbage across municipalities throughout the country,40 with local municipalities usually involved in waste management and disposal of the waste at local plants.
BOX 1Using Blockchain to administer and manage land
Blockchain technology has the potential to revolutionize the way records of value, such as land plots, are stored and transferred. As the name suggests, blockchain is a chain of blocks where each block represents a record. This record can represent an asset such as a plot, an identity, or even a cryptocurrency. Blockchain is useful because it is decentralized, with processing taking place on several nodes, or computers connected to the blockchain network, thus decreasing transaction processing time and, possibly, cost),34 distributed, with the data spread across different nodes, thus increasing transparency and reliability and improving disaster recovery), and consisting of an immutable ledger, with blocks connected through a complex mathematical formula that is cryptographically secure, making it almost impossible to alter a record retroactively.
Evidence from pilot projects indicates that blockchain can help register land titles and transactions in a tamper-proof manner. This can be seen in the cases of the Bitfury pilot in Georgia35 and the Consensys pilot with the Dubai Land Department,36 which register land titles and transactions on a private blockchain. Blockchain can also be very useful in low governance environments as it allows for the storage of time-stamped, tamper-proof transactions. This can be used as a pilot to increase trust and transparency. However, the simplest application is virtual notarization on a public blockchain made accessible to all on the network. Instead of requiring a notary to certify previous ownership while transferring an asset, the blockchain method can process the virtual notarization at lower cost. While a public blockchain is more transparent and tamper-proof, a private blockchain can also be useful if it comes with a stamp of approval from the government upholding the legality of transactions on the blockchain platform.
However, blockchain requires certain off-chain conditions to function well. For a blockchain-based solution for land administration to work effectively, accurate, digitized records are required.37 This is what is behind the success of BenBen, a private company in Ghana, which uses surveying and mapping techniques to obtain accurate field information before digitizing it on their platform. Once accurate, the digital information is made available and is used for transactions,38 which in turn helps galvanize the use of land in commercial markets.
34 The Internet of Value-Exchange, Deloitte Report: https://www2.deloitte.com/content/dam/Deloitte/uk/Documents/Innovation/deloitte-uk-inter-net-of-value-exchange.pdf
35 The First Government to Secure Land Titles on The Bitcoin Blockchain, Expands Project: https://www.forbes.com/sites/laurashin/2017/02/07/ the-first-government-to-secure-land-titles-on-the-bitcoin-blockchain-expands-project/#4feddb424dcd
36 Blockchain Virtual GovHack video: https://www.youtube.com/watch?v=-y0WGwzKaxI 37 Other constraints to be considered include data privacy data, a capacity related to understanding blockchain’s advantages and disadvantages,
data storage, the recognition of customary ownership, and the legal recognition of transactions conducted on the blockchain.38 World Bank Interview with BenBen team (April 2017).39 Esper, H., London, T., and Kanchwala, Y. (2013). Improved Sanitation and its Impact on Children: An Exploration of Sanergy. William Davidson Institute,
University of Michigan.40 See: Social Entrepreneurship in Tunisia: Achievements and Ways Forward. (2017). World Bank Group.
35
(b) Connecting
Better monitoring and tracking accessibility challenges is an important first step. One
consequence of institutional weaknesses and lack of resources is the absence of reliable data on
urban transportation. Without such monitoring and tracking, the formulation of urban planning and
transportation policies is seriously hindered. Travel surveys are the traditional way of understanding
mobility patterns in urban areas. They usually record origins and destinations of travelers, frequencies
of trips, transportation modes, travel times, and spending. However, these surveys are expensive
and time-consuming to conduct frequently as they require the hiring of large teams of surveyors.
While they remain the most comprehensive method for understanding commuting patterns and
accessibility, recent technological advances can provide some of this information at a fraction of the
cost. Typically using the anonymized information associated with the use of mobile phones, Call Detail
Records (see Box 3) can provide some of the information made available by travel surveys, including
location of jobs and people in the urban area, and in some cases travel times. Other initiatives have
focused on understanding the supply of public transportation such as para-transit, which is often not
well understood.41 Mapping these routes and collecting travel times and fares in the form of a publicly
available and standard GTFS format can shed light on parts of the urban area that are under-serviced.
Finally, new smartphone apps can register the quality of roads with precise coordinates and thus help
identify the most pressing needs in terms of road maintenance.
In many African cities, including Bamako, Conakry, and Niamey, improvements in the walking
experience of people matter hugely to the majority of residents. With such a large share of the
urban population traveling on foot to reach services and opportunities (or 61% of trips by non-poor
and 76% for the poor in Conakry), it is essential to make sure they are safe. This implies a focus on
better managing public space, including making sure that sidewalks exist and are not used for parking
vehicles, thereby forcing pedestrians to slalom between obstacles.
In Bamako, better land use management and integration with the transportation system will
defragment the city and improve accessibility. Bamako is a city characterized by urban expansion,
where central population densities are moderate to low. Thus, investments in the transportation
infrastructure must be accompanied by higher use of land in the central areas of the city. Large
amounts of underused – though not unclaimed or vacant – land in central areas force newcomers
to settle in peripheral and more distant areas, thereby imposing higher average commuting costs
on city residents. While investing in roads and efficient public transportation networks is important,
failure to address the issue of land under-utilization will result in lower accessibility and higher
transportation costs while – importantly – also lower the return on future urban infrastructure
investments. If a larger share of future job creation and population distribution between now and
2030 could be concentrated in the more central areas of the city, average access to jobs could rise by
7.3 percentage points in comparison with a situation where these dynamics take place at the periphery.
As displayed in Figure 23, The densest areas would benefit while the periphery would lose, while the
total effect would be a net accessibility gain.
41 See, for example: Digital Matatus Project: http://www.digitalmatatus.com/intro_lite.html
36
BOX 3Using mobile phone data to understand mobility patterns: Learning from Haiti
Working in data-scarce environments often requires innovative sources of data and information. A better understanding of challenges to the accessibility of information on the location of jobs in relation to that of people is needed. In Haiti, the most recent census was conducted in 2003, when there was no business registry. To bridge this data gap, a World Bank team turned to mobile phones. It partnered with Digicel, the largest mobile provider in Haiti, and Flowminder, an NGO with vast experience of mobile data analysis for development purposes, thus with multiple stakeholders, alongside government, to handle highly sensitive data. The rich set of information provided by individuals as they use their phones combined with machine learning techniques allowed the team to get a sense of where people live and work, which constitutes key information for city planning.
Mobile phone data allows for the extraction of information on where people live and work. Using Call Details Records over a three-month period, the first step is to understand people’s “meaningful locations”, that is, locations that structure the ordinary day of the phone user. The approximate location of a user at the time of a call can be ascertained based on the cell phone tower to which the user is connected. When calls are placed from a given location (or locations close to each other) repeatedly over a three-month period, this location is deemed to be “meaningful.” The second step in the analysis is to determine whether these locations correspond to home or work locations, the two places where people are likely to spend most of their time. To label the locations as “home” or “work,” a scoring criterion is employed based on the time of day and the day of the week at which calls are placed. The underlying assumption is that most people spend much of their morning and evening hours at home and some time over the weekend. Conversely, they are likely to spend a larger part of their weekday daytime at work.
Understanding flows within the city allows for better urban planning, including for natural disasters. By getting a sense of where people live and work, the World Bank team was able to understand population flows within the city’s network. This was combined with information on natural hazards, such as flooding, to identify the most critical links in the transportation network, that is, those that, if affected by a natural disaster, would impede access to jobs. Thus, starting from a situation of data scarcity, mobile phone data shed light on the location of the main job hubs in the city, the most common trips, and the most critical links in the transportation network, including when flooding risk is taken into account.
Better management of public space can go
a long way toward increasing speeds
as congestion stems in large part from
competing uses of constrained space
for traffic. Transportation interventions
alongside increased intensity in the use of
land have the potential to increase speeds
as well as accessibility. These can take many
forms and do not necessarily require costly
investments. This includes interventions
aimed at preserving dedicated space for
specific uses: i) sidewalks for pedestrians;
ii) spaces for street vendors so they do not
encroach on roads; iii) a parking management
strategy aiming to prevent parked vehicles
from occupying street space; iv) segregated
lanes for two-wheelers; and as far as possible
v) segregated lanes for public buses coupled
with the creation of bus stops for minibuses
(sotrama and magbana), and other public
transportation vehicles. In addition, road
maintenance to fix potholes can also reduce
localized bottlenecks, and rehabilitation or
upgrading of the secondary road network
through paving could help reduce traffic on
the primary network and increase average
speeds. Finally, setting up and enforcing a
functioning traffic management system would
greatly improve urban mobility.

37
FIGURE 23Impact of future population and employment growth in central areas compared to a baseline of current growth
Source: Author’s calculations based on census (RGPH 2009) and 2015 business registry
A mass transportation system would align with Conakry’s geography and help meet concentrated
demand. Although increasing land use intensity in the city will not be straightforward since employment
and population densities are already very high, it is important that the mobility needs of the population
be met by a transportation system that is better suited to the characteristics of the urban area. Given low
amounts of space, larger vehicles carrying more people could substantially reduce congestion when
compared to multiple private cars competing for road space. In fact, because of its high concentration
of demand for mobility in well-defined parts of the city, Conakry is ideally set up to benefit from a mass
transportation option. Thus, there is a powerful rationale for a mass transit system that could ideally take
advantage of the existing railway lines or of the rights of way provided by corridors along main roads with
the construction of dedicated bus lanes. Whether based on the existing rail infrastructure or through the
construction of dedicated bus lanes, the concentration of demand from the periphery to Kaloum in the
morning and in reverse in the evening justifies the fixed costs of the infrastructure.
A mass transportation solution in Conakry should also be coordinated with land use if it is to
maximize impact. While a mass transportation solution is well suited to Conakry’s geography, its benefits
will be maximized if it is accompanied by a series of interventions regarding land. First, allowing for
high densities around new transportation network hubs will help increase the number of households
impacted. Conversely, if building densities close to these hubs are constrained, this will constitute a
missed opportunity to provide increased access on a wide scale. Secondly, mass transportation hubs

38
have the potential to act as nodes and become thriving areas for shopping and leisure. However,
this can only happen if land can be readily converted from its present use, which in turn will require
functioning land markets. Active planning could reinforce mixed land use, another key feature of
thriving neighborhoods. Finally, capturing the increased value of land from accessibility gains can
provide important revenue streams from which to finance service delivery or defray the upfront costs
of improving the transportation infrastructure. Where land surrounding transportation stations is
publicly owned or owned by public companies, this provides opportunities to local governments to
capture the increase in land values in the form of land value capture by reselling or renting plots at
higher prices.42 Such an approach is being followed in the case, for example, of the redevelopment
of Nairobi’s central station and its surroundings. This project also promotes mixed land use. Where
land is privately owned, an efficient land taxation system also allows for the collection of increased
revenues.
In Niamey, transparent urban planning with the aim of guiding future investment decisions by
firms and households could be deployed as a powerful tool. Compared to Conakry and Bamako,
the relatively compact layout of Niamey allows for more interactions than in other cities of the same
size. Niamey has managed to keep its inherited integrated urban pattern and to contain sprawl
despite rapid urban growth. This constitutes a major asset for the city, which local decision makers
will want to maintain over time as the population grows. To do so, they could draw up and widely
disseminate urban plans, which have been proven to be a highly effective strategy in guiding new
development. For instance, in Tunis, by making vital information widely available to households, the
local government was able to guide their choices. Thus, rather than trying to restrict urban expansion
into unplanned areas, the government provides clear and transparent information to the public on
future infrastructure expansion plans. Households who are settling in what today are unplanned and
un-serviced areas can use this information to make sure that rights of way are left clear for future
investment. This benefits not only the government by reducing investment costs but also households
as these are less likely to be adversely affected by future interventions and will thus benefit from
greater accessibility once roads and public transportation systems are extended to these areas.
Although this analysis and recommendations focused mainly on aspects of connectivity within
the three African cities under study, connectivity across the region is an important consideration
for the future. West Africa’s inland cities are cut off from the global market. The region relies heavily
on international trade, which accounts for approximately 40% of non-subsistence GDP.43 Virtually all
this trade is conducted by sea, and infrastructure capacity linking inland cities to coastal ports is poor.
This hampers growth in landlocked Mali and Niger compared to Senegal or Côte d’Ivoire.
42 Salat, S. and Ollivier, G. (2017). Transforming the Urban Space through Transit-Oriented Development. World Bank.43 Based on World Bank national accounts data from Exports of Goods and Services (% of GDP) after subtracting the 36% figure from
Bossard, L. (2016). The main sector of economic activity in West Africa consists of feeding its people. Sahel and West Africa Club/OECD.
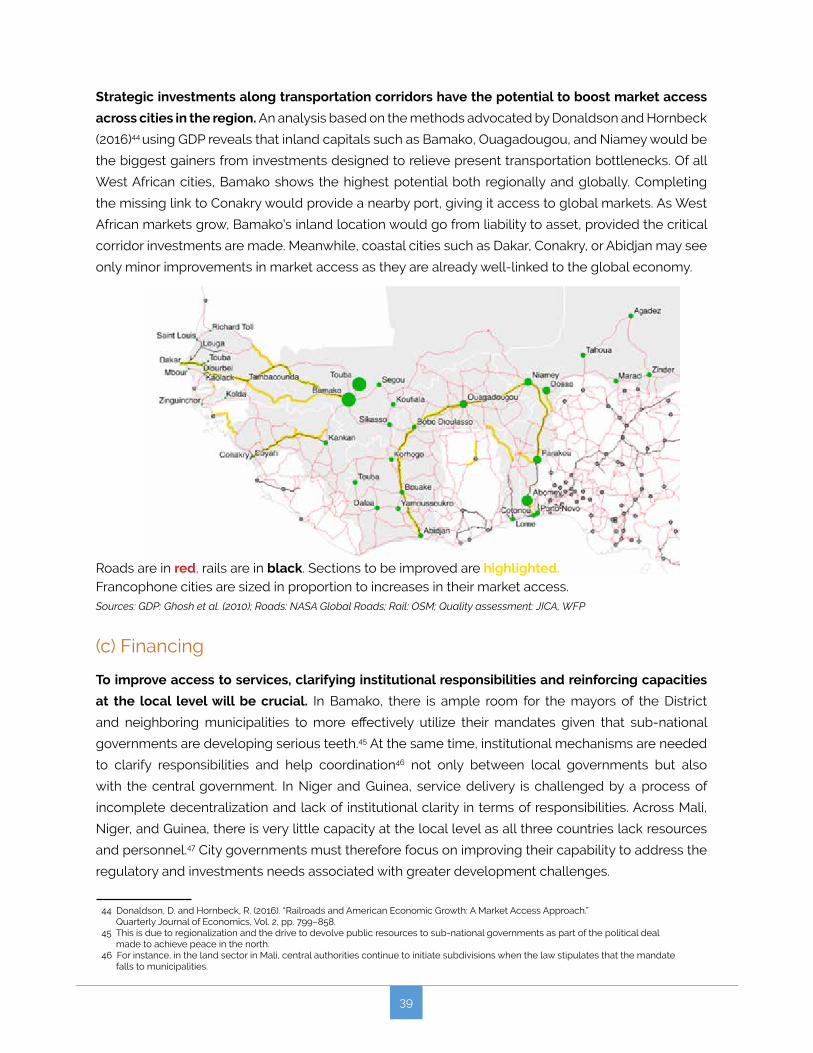
39
Strategic investments along transportation corridors have the potential to boost market access
across cities in the region. An analysis based on the methods advocated by Donaldson and Hornbeck
(2016)44 using GDP reveals that inland capitals such as Bamako, Ouagadougou, and Niamey would be
the biggest gainers from investments designed to relieve present transportation bottlenecks. Of all
West African cities, Bamako shows the highest potential both regionally and globally. Completing
the missing link to Conakry would provide a nearby port, giving it access to global markets. As West
African markets grow, Bamako’s inland location would go from liability to asset, provided the critical
corridor investments are made. Meanwhile, coastal cities such as Dakar, Conakry, or Abidjan may see
only minor improvements in market access as they are already well-linked to the global economy.
44 Donaldson, D. and Hornbeck, R. (2016). “Railroads and American Economic Growth: A Market Access Approach.” Quarterly Journal of Economics, Vol. 2, pp. 799–858.
45 This is due to regionalization and the drive to devolve public resources to sub-national governments as part of the political deal made to achieve peace in the north.
46 For instance, in the land sector in Mali, central authorities continue to initiate subdivisions when the law stipulates that the mandate falls to municipalities.
Roads are in red, rails are in black. Sections to be improved are highlighted.Francophone cities are sized in proportion to increases in their market access.Sources: GDP: Ghosh et al. (2010); Roads: NASA Global Roads; Rail: OSM; Quality assessment: JICA, WFP
(c) Financing
To improve access to services, clarifying institutional responsibilities and reinforcing capacities
at the local level will be crucial. In Bamako, there is ample room for the mayors of the District
and neighboring municipalities to more effectively utilize their mandates given that sub-national
governments are developing serious teeth.45 At the same time, institutional mechanisms are needed
to clarify responsibilities and help coordination46 not only between local governments but also
with the central government. In Niger and Guinea, service delivery is challenged by a process of
incomplete decentralization and lack of institutional clarity in terms of responsibilities. Across Mali,
Niger, and Guinea, there is very little capacity at the local level as all three countries lack resources
and personnel.47 City governments must therefore focus on improving their capability to address the
regulatory and investments needs associated with greater development challenges.
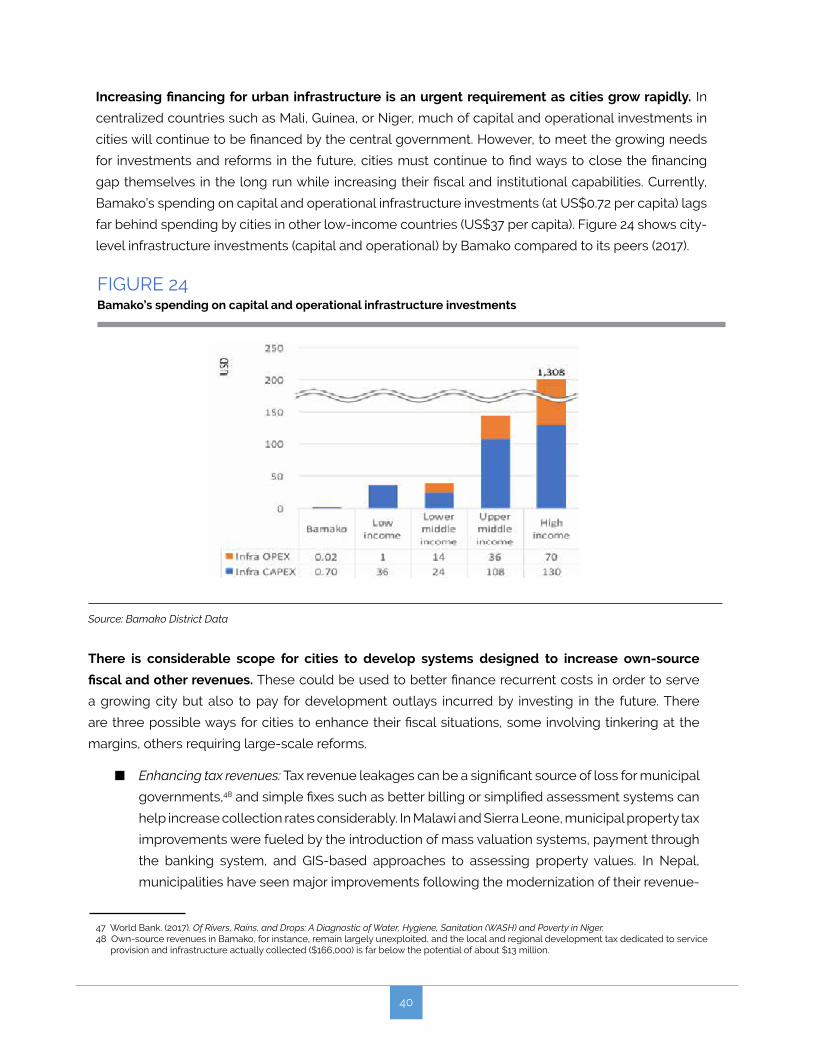
40
Increasing financing for urban infrastructure is an urgent requirement as cities grow rapidly. In
centralized countries such as Mali, Guinea, or Niger, much of capital and operational investments in
cities will continue to be financed by the central government. However, to meet the growing needs
for investments and reforms in the future, cities must continue to find ways to close the financing
gap themselves in the long run while increasing their fiscal and institutional capabilities. Currently,
Bamako’s spending on capital and operational infrastructure investments (at US$0.72 per capita) lags
far behind spending by cities in other low-income countries (US$37 per capita). Figure 24 shows city-
level infrastructure investments (capital and operational) by Bamako compared to its peers (2017).
47 World Bank. (2017). Of Rivers, Rains, and Drops: A Diagnostic of Water, Hygiene, Sanitation (WASH) and Poverty in Niger.48 Own-source revenues in Bamako, for instance, remain largely unexploited, and the local and regional development tax dedicated to service
provision and infrastructure actually collected ($166,000) is far below the potential of about $13 million.
FIGURE 24Bamako’s spending on capital and operational infrastructure investments
Source: Bamako District Data
There is considerable scope for cities to develop systems designed to increase own-source
fiscal and other revenues. These could be used to better finance recurrent costs in order to serve
a growing city but also to pay for development outlays incurred by investing in the future. There
are three possible ways for cities to enhance their fiscal situations, some involving tinkering at the
margins, others requiring large-scale reforms.
n Enhancing tax revenues: Tax revenue leakages can be a significant source of loss for municipal
governments,48 and simple fixes such as better billing or simplified assessment systems can
help increase collection rates considerably. In Malawi and Sierra Leone, municipal property tax
improvements were fueled by the introduction of mass valuation systems, payment through
the banking system, and GIS-based approaches to assessing property values. In Nepal,
municipalities have seen major improvements following the modernization of their revenue-
41
raising administrations. On its own initiative, the City of Niamey recently began to reform
municipal tax administration, where until now, municipal tax collectors were responsible for
assessing the number of taxpayers liable for a head tax levied on all adults. To rectify this,
from 2018 onward, taxpayer assessments will be carried out by different municipal staff. In
Guinea, an EU-funded capacity building program has just begun to provide municipal and
Treasury officials with basic training in tax administration. Experiences from other countries
suggests that working on improvements to the tax and revenue administration can be a
promising way ahead given that raising tax rates or expanding the tax base is not within the
remit of local governments.
n Enhancing non-tax revenues: Rental incomes from local government properties and user fees
(for instance, for garbage collection) can be major revenue sources for local administrations.
Improvements aimed at improving efficiency in the collection of fees and charges, more
frequent assessments, and better pricing (to cover a greater proportion of costs) can also
help tackle the revenue constraints faced by local governments.
n Conducting tax reforms: Putting in place systems that will allow local governments to tax land
would help to help finance infrastructure and provide public goods and services. Leveraging
land values, especially in the case of fast-growing cities, can help with the efficient allocation
of land use patterns and density and simultaneously create revenue opportunities to
invest in large, long-lived, urban infrastructures. However, land-based financing requires
putting in place land databases and information systems that transparently reflect prices
and availability. In all three countries, land administration systems function poorly, owing
partly to unclear land rights or formal titles and partly to institutional weaknesses in
enforcement. Another area ripe for major reforms would be with respect to shared revenues.
Under revenue-sharing arrangements in Niamey and Conakry, a large proportion of local
government revenues derive from shared revenues, collected by the central government
tax administration and then shared with local governments. However, revenue sharing
arrangements for Niamey could be improved as it is currently difficult for the city to forecast
such revenues and thus budget for annual expenditures. Meanwhile, the national Treasury
has few incentives to release Niamey’s share on a timely and regular basis. Possible reforms
might include making revenue-sharing arrangements more transparent, improving and
formalizing communications between national treasuries and city governments, or even
moving entirely away from revenue sharing to a more predictable system of grants financed
out of a proportion of national revenues.
At the same time, there is no getting away from the need for central governments to provide
local government with transfers and grants. In Mali, as part of wider peace-building efforts, the
government has committed to providing local government with 30% of national revenues, and it is
clearly trying to honor this commitment. The issue in Mali is not so much how much gets transferred
to local governments but the extent to which such allocations are simply earmarked to pay for specific
functions (e.g., teachers’ salaries), which were previously the responsibility of the central government.
42
In both Niger and Guinea, central governments have set up dedicated funding pools in the national budget
from which to make annual allocations to local governments.49 However, the problem here is twofold: the
small size of such funding pools, and the irregularity and uncertainty associated with transfers. Much
could be done to increase or improve transfers to local governments in all three countries.
Cities would also benefit from a focus on the efficiency and opportunity costs of local government
expenditures. Although a focus on increasing revenues is important, local governments could also
focus on better management of their expenditures. Local government spending can be wasteful in
many ways. World Bank research in Malawi showed that council payrolls were massively bloated,
and many overheads were unjustifiable. In the case of Bamako, payroll costs account for a huge
proportion of spending by the District, as does recurrent spending, with the District and municipal
budgets typically consisting of a high proportion of salaries (62 percent on average) while only
4.6 percent goes to investment. Thus, reviewing local public spending and identifying and
implementing quick fixes may help free up scarce resources, tasks that are clearly within the remit
of mayors and municipal councils, even though these measures tend to be unpopular among public
administration officials. However, progress is possible. In Vietnam, sub-national governments were
incentivized to make their administrative services more cost-effective through improvements that led
to small savings, which eventually added up to a considerable amount at year end.
ConclusionBamako, Conakry, and Niamey have a narrow window of opportunity to coordinate and invest
in reforms, infrastructures, and institutions, with far-reaching consequences in the future. Sunk
investments made (or facilitated) by the government can be a signaling mechanism for longer-run
coordinated investments in a city. Coordinated reforms and investments such as land use planning
supplemented by investments in urban infrastructure can help households and firms respond
efficiently to the city’s growth pattern. Bamako must focus on retrofitting existing structures and
coordinating land redevelopment alongside infrastructure investments. Conakry must focus on
better connectivity within the city and to the periphery. Niamey must lay the ground for future urban
development. Getting these choices right, with urbanization in its incipient stages, will be critical.
All three cities – Bamako, Niamey, and Conakry – have the potential to become productive and
livable cities. They are currently grappling with the effect of institutions and investments, often a
function of past decisions. The cost of correcting the dysfunctions is very high, especially in cities that
are growing rapidly. The analyses highlighted in this article build upon in-depth analyses conducted
in each of these cities and lay out detailed recommendations for reforms and policies tailored to their
individual context. The conclusion, drawn from the commonalities and differences noted, is that all
three cities have a narrow window of opportunity to invest in building institutions and infrastructures
that will lay the foundations for durable urban development in the future.
49 Guinea’s National Local Development Fund (FNDL) was established as a national budget line item in 2016, to be financed out of national mining royalties. In Niger, the government has established both the Decentralization Support Fund (FAD) and the Equalization Fund (FP), both of which are intended to finance grants to local governments.
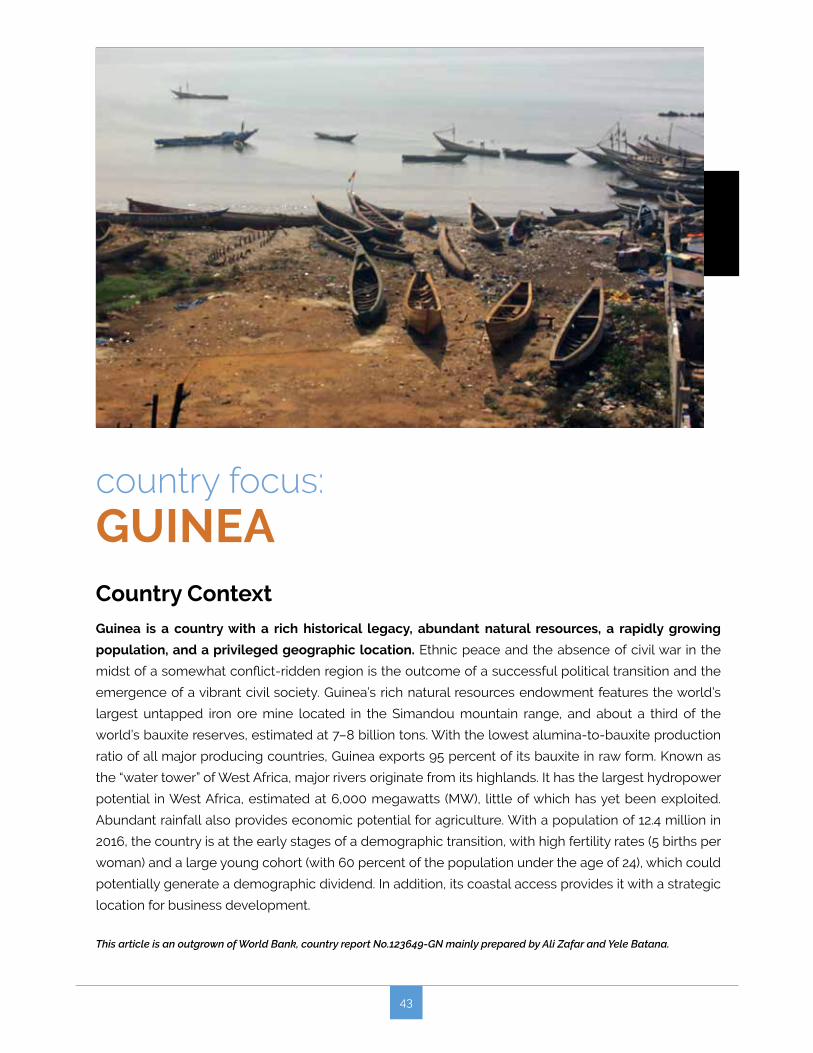
43
country focus: GUINEACountry ContextGuinea is a country with a rich historical legacy, abundant natural resources, a rapidly growing
population, and a privileged geographic location. Ethnic peace and the absence of civil war in the
midst of a somewhat conflict-ridden region is the outcome of a successful political transition and the
emergence of a vibrant civil society. Guinea’s rich natural resources endowment features the world’s
largest untapped iron ore mine located in the Simandou mountain range, and about a third of the
world’s bauxite reserves, estimated at 7–8 billion tons. With the lowest alumina-to-bauxite production
ratio of all major producing countries, Guinea exports 95 percent of its bauxite in raw form. Known as
the “water tower” of West Africa, major rivers originate from its highlands. It has the largest hydropower
potential in West Africa, estimated at 6,000 megawatts (MW), little of which has yet been exploited.
Abundant rainfall also provides economic potential for agriculture. With a population of 12.4 million in
2016, the country is at the early stages of a demographic transition, with high fertility rates (5 births per
woman) and a large young cohort (with 60 percent of the population under the age of 24), which could
potentially generate a demographic dividend. In addition, its coastal access provides it with a strategic
location for business development.
This article is an outgrown of World Bank, country report No.123649-GN mainly prepared by Ali Zafar and Yele Batana.
44
However, Guinea is not unique only on its positives, since despite such abundance, the country
also remains among the poorest and least competitive in the world. Poverty is high and rising,
affecting almost 60 percent of its population in 2014. In 2015, Guinea ranked 182th out of 188 countries
in terms of the Human Development Index (HDI). Life expectancy at birth was 59.2 years, and mean
years of schooling was only 2.6 years. Access to basic services is low, with a small share of the
population having access to electricity (28 percent), improved sanitation (20 percent), and improved
water sources (77 percent). The 2017–2018 Global Competitiveness Report ranked Guinea 119th out
of 137 countries, with wide gaps in the quality of institutions, infrastructure, health, education, and
financial market development. Per capita growth is very low, averaging 0.6 percent during 1998–2016.
Although agriculture is one of the main drivers of economic growth and employment, it suffers from
very low productivity.
As a result, the country faces severe challenges in translating its assets and opportunities into
higher incomes for its citizens. Economic growth has been very low and volatile in contributing to
poverty reduction on a sustained basis. The economy is susceptible to fluctuations in commodity
prices and health shocks (e.g., the Ebola pandemic). Rapid growth is also hindered by low investment,
lagging infrastructure, and limited financial intermediation and inclusion. The population’s incomes
are affected by a wide human capital deficit, low access to input and output markets, low productivity
in agriculture (the main source of income for the poor), and limited job opportunities outside of
agriculture. Moreover, rapid and unplanned urbanization has created a chaotic urban environment,
which faces pressure from a young unemployed population as well as rural migration. Gender
inequalities are wide, especially in terms of access to justice, health, education, and access to credit.
Since independence in 1958, Guinea’s development path has been affected by two critical factors.
First, the country endured two long-lived authoritarian regimes as well as political instability before the
inception of democracy in 2010. This legacy of poor economic governance led to the mismanagement
of natural resources, institutional fragmentation of the government, a weak social contract and rule
of law, and low and ineffective public investment. Second, the structure of the economy remains
dependent on the primary sector (agriculture and mining), thus lacking diversification in its sources
of growth and exports. The very slow process of structural transformation is driven by low levels of
agricultural productivity and poorly managed urbanization plagued by informality.
Poverty is high and deteriorating following the Ebola crisis
Despite its potential, Guinea remains one of the poorest countries in Sub-Saharan Africa, with
stubbornly high levels of poverty. Per capita GDP was only US$531 in 2015, compared to an average
of US$1,571 for Sub-Saharan Africa. Using the official poverty line, poverty affected 55.2 percent of the
population, about the same level as in 2002. Moreover, chronic poverty is pervasive, affecting 4 out of
10 people. Based on simulations using data from the 2014 population census, poverty increased to
57.7 percent, and the 2014–2015 Ebola outbreak most likely led to further increases in poverty.50
50 The National Institute of Statistics will conduct a new household survey in 2018, which will provide new poverty estimates.
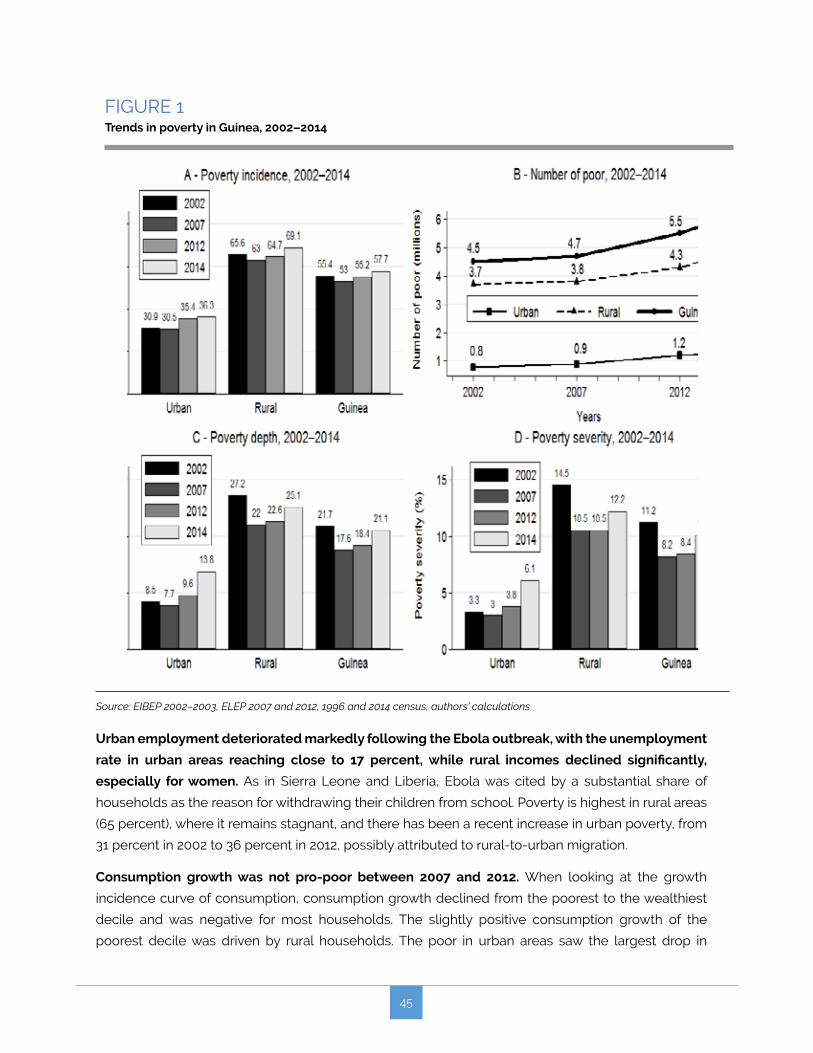
45
FIGURE 1Trends in poverty in Guinea, 2002–2014
Source: EIBEP 2002–2003, ELEP 2007 and 2012, 1996 and 2014 census, authors’ calculations
Urban employment deteriorated markedly following the Ebola outbreak, with the unemployment
rate in urban areas reaching close to 17 percent, while rural incomes declined significantly,
especially for women. As in Sierra Leone and Liberia, Ebola was cited by a substantial share of
households as the reason for withdrawing their children from school. Poverty is highest in rural areas
(65 percent), where it remains stagnant, and there has been a recent increase in urban poverty, from
31 percent in 2002 to 36 percent in 2012, possibly attributed to rural-to-urban migration.
Consumption growth was not pro-poor between 2007 and 2012. When looking at the growth
incidence curve of consumption, consumption growth declined from the poorest to the wealthiest
decile and was negative for most households. The slightly positive consumption growth of the
poorest decile was driven by rural households. The poor in urban areas saw the largest drop in
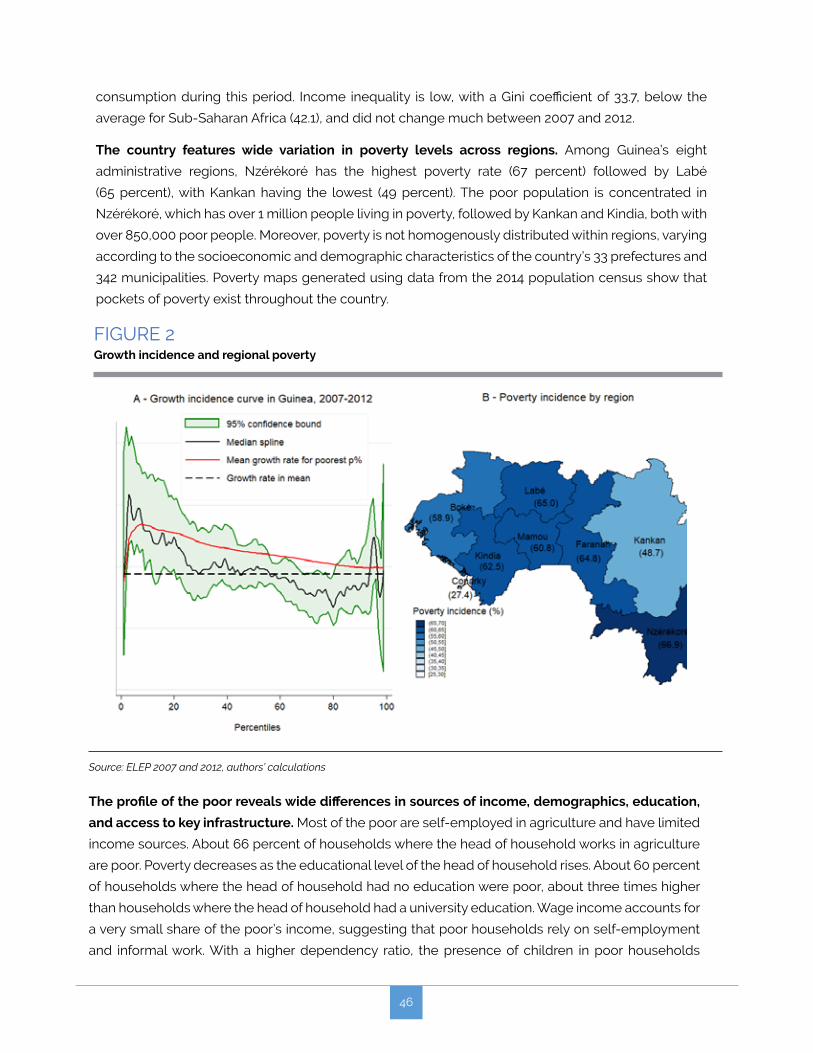
46
consumption during this period. Income inequality is low, with a Gini coefficient of 33.7, below the
average for Sub-Saharan Africa (42.1), and did not change much between 2007 and 2012.
The country features wide variation in poverty levels across regions. Among Guinea’s eight
administrative regions, Nzérékoré has the highest poverty rate (67 percent) followed by Labé
(65 percent), with Kankan having the lowest (49 percent). The poor population is concentrated in
Nzérékoré, which has over 1 million people living in poverty, followed by Kankan and Kindia, both with
over 850,000 poor people. Moreover, poverty is not homogenously distributed within regions, varying
according to the socioeconomic and demographic characteristics of the country’s 33 prefectures and
342 municipalities. Poverty maps generated using data from the 2014 population census show that
pockets of poverty exist throughout the country.
FIGURE 2Growth incidence and regional poverty
Source: ELEP 2007 and 2012, authors’ calculations
The profile of the poor reveals wide differences in sources of income, demographics, education,
and access to key infrastructure. Most of the poor are self-employed in agriculture and have limited
income sources. About 66 percent of households where the head of household works in agriculture
are poor. Poverty decreases as the educational level of the head of household rises. About 60 percent
of households where the head of household had no education were poor, about three times higher
than households where the head of household had a university education. Wage income accounts for
a very small share of the poor’s income, suggesting that poor households rely on self-employment
and informal work. With a higher dependency ratio, the presence of children in poor households
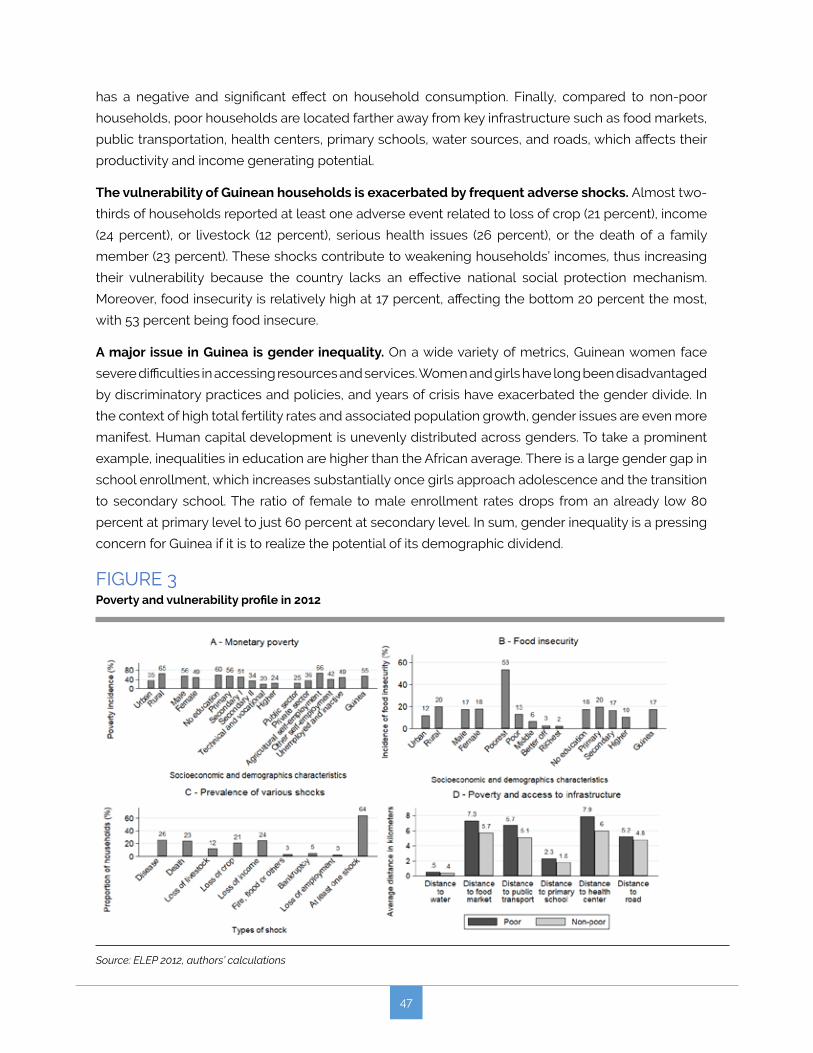
47
has a negative and significant effect on household consumption. Finally, compared to non-poor
households, poor households are located farther away from key infrastructure such as food markets,
public transportation, health centers, primary schools, water sources, and roads, which affects their
productivity and income generating potential.
The vulnerability of Guinean households is exacerbated by frequent adverse shocks. Almost two-
thirds of households reported at least one adverse event related to loss of crop (21 percent), income
(24 percent), or livestock (12 percent), serious health issues (26 percent), or the death of a family
member (23 percent). These shocks contribute to weakening households’ incomes, thus increasing
their vulnerability because the country lacks an effective national social protection mechanism.
Moreover, food insecurity is relatively high at 17 percent, affecting the bottom 20 percent the most,
with 53 percent being food insecure.
A major issue in Guinea is gender inequality. On a wide variety of metrics, Guinean women face
severe difficulties in accessing resources and services. Women and girls have long been disadvantaged
by discriminatory practices and policies, and years of crisis have exacerbated the gender divide. In
the context of high total fertility rates and associated population growth, gender issues are even more
manifest. Human capital development is unevenly distributed across genders. To take a prominent
example, inequalities in education are higher than the African average. There is a large gender gap in
school enrollment, which increases substantially once girls approach adolescence and the transition
to secondary school. The ratio of female to male enrollment rates drops from an already low 80
percent at primary level to just 60 percent at secondary level. In sum, gender inequality is a pressing
concern for Guinea if it is to realize the potential of its demographic dividend.
FIGURE 3Poverty and vulnerability profile in 2012
Source: ELEP 2012, authors’ calculations

48
Growth is low and per capita income has not progressed
Guinea features persistently low growth rates. Growth averaged 2.7 percent between 1998 and
2016, about two percentage points below the Sub-Saharan Africa average.51 When converted to
per capita terms, the average growth rate during 1998–2016 was very low (0.6 percent), or about
1.2 and 3.3 percentage points below the Sub-Saharan Africa and middle-income country averages,
respectively. Thus, Guinea has not kept pace with other countries in Sub-Saharan Africa. Guinea has
very low investment levels, averaging 14 percent of GDP in 2010–2015, much lower than neighboring
countries and the Sub-Saharan Africa average of 20 percent. Factor accumulation (labor and, to a
lesser extent, capital) explain most of this variation in growth. The large contribution of labor to growth
is consistent with the expansion of the working age population. Although capital accumulation has
made an increasing contribution over time, it has not led to improvements in infrastructure. Negative
total factor productivity (TFP) has held back growth in recent decades.
51 Although the National Accounts were revised in 2016 for the period 2006–2015, macro indicators used in this chapter are mainly based on the old series as the Systematic Country Diagnostic (SCD) covers a longer period than 2006–2015.
52 The Simandou mining project has the potential of doubling Guinea’s GDP, with iron ore reserves estimated at 3.2 billion tons. The project requires a huge initial investment of about US$20 billion and calls for the development of a new 670-kilometer (416-mile) heavy haul freight railway originating in Simandou and connecting it with a new deep-water, multi-use port. The start of the project has been delayed due to a combination of low iron ore prices and ownership changes. In 2017, Rio Tinto, the previous main shareholder of the project, transferred its shares to Chinalco, a Chinese stated-owned mining company, which now owns 80 percent of the asset.
FIGURE 4Real GDP and per capita GDP growth
4.3
2.13.0
1.82.6 2.92.7
0.01.02.03.04.05.06.0
A- RealGDPgrowth(annual%)
1987-97 1998-2009 2010-16 1998-2016
Source: Calculations using data from World Development Indicators
-2.0 -1.0 0.01.02.03.04.05.0
B- PercapitaGDPgrowth(annual%)
1987-97 1998-2009 2010-16 1998-2016
Mining and agriculture have been the drivers of economic growth in Guinea, and both have been
characterized by high volatility. Even though mining accounted for less than 15 percent of GDP in 2015,
it represented about 80 percent of exports. Plummeting commodity prices and delays in exploiting
the Simandou iron ore deposit, a key mining project, are factors that contributed to volatility in the
sector.52 Guinea’s bauxite export price declined from close to $40 per ton in the early 1990s to less
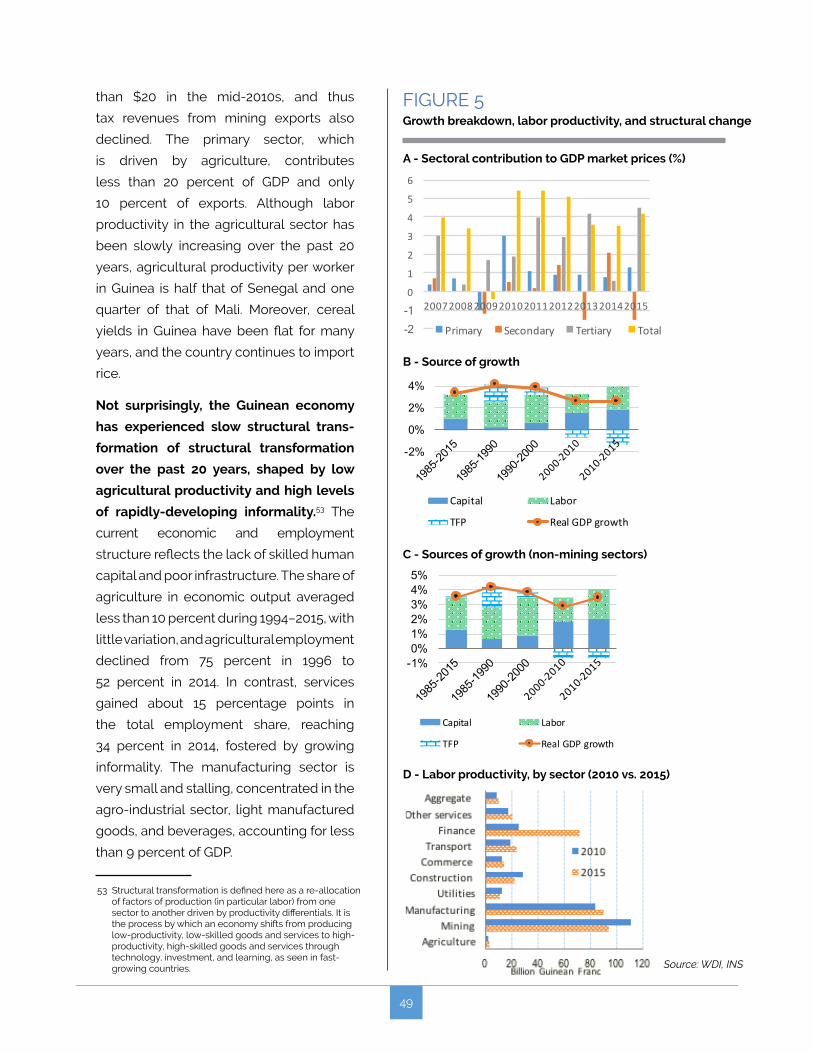
49
than $20 in the mid-2010s, and thus
tax revenues from mining exports also
declined. The primary sector, which
is driven by agriculture, contributes
less than 20 percent of GDP and only
10 percent of exports. Although labor
productivity in the agricultural sector has
been slowly increasing over the past 20
years, agricultural productivity per worker
in Guinea is half that of Senegal and one
quarter of that of Mali. Moreover, cereal
yields in Guinea have been flat for many
years, and the country continues to import
rice.
Not surprisingly, the Guinean economy
has experienced slow structural trans-
formation of structural transformation
over the past 20 years, shaped by low
agricultural productivity and high levels
of rapidly-developing informality.53 The
current economic and employment
structure reflects the lack of skilled human
capital and poor infrastructure. The share of
agriculture in economic output averaged
less than 10 percent during 1994–2015, with
little variation, and agricultural employment
declined from 75 percent in 1996 to
52 percent in 2014. In contrast, services
gained about 15 percentage points in
the total employment share, reaching
34 percent in 2014, fostered by growing
informality. The manufacturing sector is
very small and stalling, concentrated in the
agro-industrial sector, light manufactured
goods, and beverages, accounting for less
than 9 percent of GDP.
53 Structural transformation is defined here as a re-allocation of factors of production (in particular labor) from one sector to another driven by productivity differentials. It is the process by which an economy shifts from producing low-productivity, low-skilled goods and services to high-productivity, high-skilled goods and services through technology, investment, and learning, as seen in fast-growing countries.
FIGURE 5Growth breakdown, labor productivity, and structural change
-2 -1 0
1
2
3
4
5
6
200720082009201020112012201320142015
Primary Secondary Tertiary Total
-2%
0%
2%
4%
Capital Labor
TFP RealGDPgrowth
A - Sectoral contribution to GDP market prices (%)
B - Source of growth
-1%0%1%2%3%4%5%
Capital Labor
TFP RealGDPgrowth
C - Sources of growth (non-mining sectors)
D - Labor productivity, by sector (2010 vs. 2015)
-2 -1 0
1
2
3
4
5
6
200720082009201020112012201320142015
Primary Secondary Tertiary Total
Source: WDI, INS
50
Changes in the relative contribution of each sector have also had implications for low labor
productivity, defined as output per worker. Guinea’s labor productivity growth averaged 0.48 percent
per year during 1994–2015. Most of this growth is attributed to the shift of jobs from agriculture, a
sector with the lowest labor productivity, to (mostly informal) services, and to a lesser extent the
industrial sector (i.e., static structural change). The positive contribution of demographic change
(0.15 percent) to per capita GDP growth has been offset by the negative effect of lower employment
rates (-0.14 percent). With agriculture showing about labor productivity nine times lower than in
the manufacturing and mining sectors, the manufacturing-to-agriculture labor productivity ratio in
Guinea is much higher than the African average of about 2.3. Such a wide productivity gap across
sectors indicates that policies aimed at increasing agricultural productivity could foster structural
change and contribute to higher growth rates.
Since 2010, Guinea has improved its macroeconomic performance despite the Ebola pandemic and
lower commodity prices. After years of fiscal mismanagement and debt build-up, macroeconomic
reforms were undertaken as part of the country’s effort to reach the Highly-Indebted Poor Country
(HIPC) completion point in September 2012, leading to significant reductions of its external debt level
and servicing cost. Debt servicing payments amounted to over 4 percent of GDP in 2008 but have
fallen to below 1 percent of GDP since 2013, creating some fiscal space for pro-poor spending.
A final area of progress is rising investment in hydropower resources. The country’s parliament
approved a new mining code in 2011 that included several best practices for governing relations
between mining companies and countries in a fair and transparent manner. As a result, the
Guinean government launched a new online database containing all its existing mining contracts
and completed a technical review to ensure that such contracts align with international fiscal
and environmental norms and comply with the 2011 mining code. To meet domestic demand for
electricity from hydropower and become a major electricity exporter to the West Africa Power
Pool, the government began investing in adding new generation capacity. The completion of the
240 MW Kaleta hydroelectricity power plant in 2015 was a major achievement, improving the supply
of electricity. More recently, the authorities signed a memorandum of understanding (MOU) with the
China Water and Electricity corporation to build the 600 MW Souapiti hydropower project.
Constraints were identified and prioritized around four pathways as part of an analytical framework
The persistence of high poverty and low per capita GDP growth provided the basis for identifying
binding constraints through an analytical framework (Figure 6) and a six-step process. First, a
broad range of constraints on economic growth was identified based on the Hausmann, Rodrik,
and Velasco (HRV) growth diagnostics procedure,54 expert views, and available empirical evidence.
Second, a parallel exercise identifies general constraints on inclusion and sustainability using
poverty analysis and fragility assessment. Third, the analysis addresses two key explanations in weak
governance and slow structural transformation. Fourth, stakeholder consultations and detailed field
54 Hausmann, R., Rodrik, D., and Velasco, A. (2005). Country Diagnostics. John F. Kennedy School of Government, Harvard University.
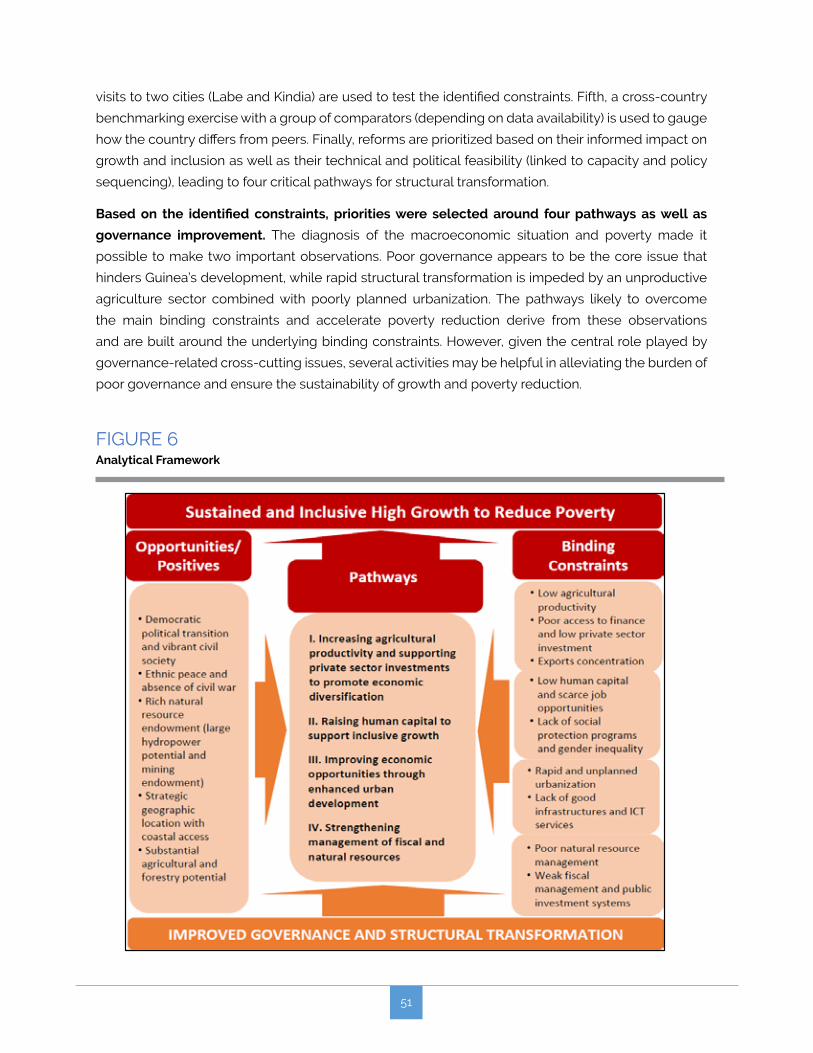
51
visits to two cities (Labe and Kindia) are used to test the identified constraints. Fifth, a cross-country
benchmarking exercise with a group of comparators (depending on data availability) is used to gauge
how the country differs from peers. Finally, reforms are prioritized based on their informed impact on
growth and inclusion as well as their technical and political feasibility (linked to capacity and policy
sequencing), leading to four critical pathways for structural transformation.
Based on the identified constraints, priorities were selected around four pathways as well as
governance improvement. The diagnosis of the macroeconomic situation and poverty made it
possible to make two important observations. Poor governance appears to be the core issue that
hinders Guinea’s development, while rapid structural transformation is impeded by an unproductive
agriculture sector combined with poorly planned urbanization. The pathways likely to overcome
the main binding constraints and accelerate poverty reduction derive from these observations
and are built around the underlying binding constraints. However, given the central role played by
governance-related cross-cutting issues, several activities may be helpful in alleviating the burden of
poor governance and ensure the sustainability of growth and poverty reduction.
FIGURE 6Analytical Framework
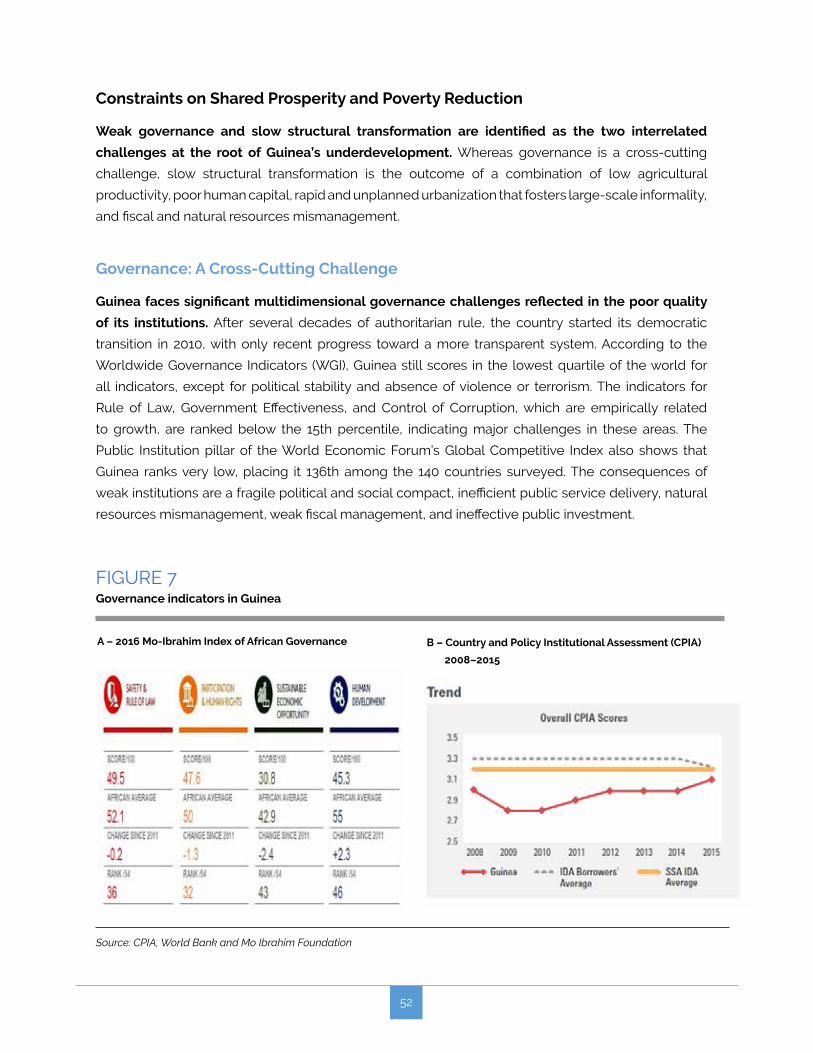
52
Constraints on Shared Prosperity and Poverty Reduction
Weak governance and slow structural transformation are identified as the two interrelated
challenges at the root of Guinea’s underdevelopment. Whereas governance is a cross-cutting
challenge, slow structural transformation is the outcome of a combination of low agricultural
productivity, poor human capital, rapid and unplanned urbanization that fosters large-scale informality,
and fiscal and natural resources mismanagement.
Governance: A Cross-Cutting Challenge
Guinea faces significant multidimensional governance challenges reflected in the poor quality
of its institutions. After several decades of authoritarian rule, the country started its democratic
transition in 2010, with only recent progress toward a more transparent system. According to the
Worldwide Governance Indicators (WGI), Guinea still scores in the lowest quartile of the world for
all indicators, except for political stability and absence of violence or terrorism. The indicators for
Rule of Law, Government Effectiveness, and Control of Corruption, which are empirically related
to growth, are ranked below the 15th percentile, indicating major challenges in these areas. The
Public Institution pillar of the World Economic Forum’s Global Competitive Index also shows that
Guinea ranks very low, placing it 136th among the 140 countries surveyed. The consequences of
weak institutions are a fragile political and social compact, inefficient public service delivery, natural
resources mismanagement, weak fiscal management, and ineffective public investment.
FIGURE 7Governance indicators in Guinea
Source: CPIA, World Bank and Mo Ibrahim Foundation
A – 2016 Mo-Ibrahim Index of African Governance B – Country and Policy Institutional Assessment (CPIA)
2008–2015
53
Low agricultural productivity and private investment
Agriculture remains the main source of employment for the poor and a potential source of
productivity gains. Agriculture provides incomes for 57 percent of rural households and employs
52 percent of the workforce. Cultivatable land amounts to 6.2 million hectares, though only 25 percent
is farmed. Hence, the country still has significant agricultural potential to further contribute to growth.
In addition, rainfall is abundant, and the country has not yet tapped into its potentially irrigable land,
with only 8 percent of irrigable land currently equipped for irrigation.
Moreover, agricultural productivity is constrained by a combination of limited use of improved
technologies, input market failures, and land tenure uncertainties. Subsistence farmers, who
account for 95 percent of the cultivated area, use very few agricultural inputs (e.g., improved seeds,
fertilizer, pesticides, irrigation, and mechanization). Only 15 percent of poor farming households use
fertilizer, about 1.8 percentage points lower than non-poor ones. At the aggregate level, fertilizer
use per hectare is 16 times lower than the average for Sub-Saharan Africa. Cereal yields are thus
relatively low (1.2 tons per hectare compared to averages of 1.5 tons for Sub-Saharan Africa and
3.9 tons worldwide), below potential, and they have been stagnant for many years. The country
continues to import increasing quantities of rice, a staple in which it has a natural competitive
advantage. Before 2011, successive governments did not develop an adequate agriculture input
policy for farmers. A subsidy program undertaken during 2011–2016 to increase fertilizer use did not
produce an expected increase in yields because of poor targeting, inadequate quantities, and lack
of improved seeds and advisory services. The program also created market distortions that hindered
private sector participation in the fertilizer market. A complex dual land tenure system and weak land
administration generate uncertainties that hinder private investment. Finally, certain groups, including
women, displaced persons, and migrants, have limited access to land.
An under-developed agriculture supply chain limits productivity and farm incomes. First, farmers
focus mainly on crop production for subsistence and lack the skills needed to obtain information
on market prices and to enter into business relationship with larger consumers such as hotels
and restaurants. Second, farmers cannot maximize sales because of limited opportunities to store
agricultural products at times of surplus and low prices (the harvest period). Third, constraints in
terms of modes of transportation for agriculture leave farmers with no option but to sell their crops to
local traders. In addition, their bargaining power is limited because they are organized either by crop
(e.g., rice or potatoes) or market orientation (e.g., exporters). Fourth, value-added agriculture is limited
by the lack of reliable electricity supply, advisory services, and types of organizations.
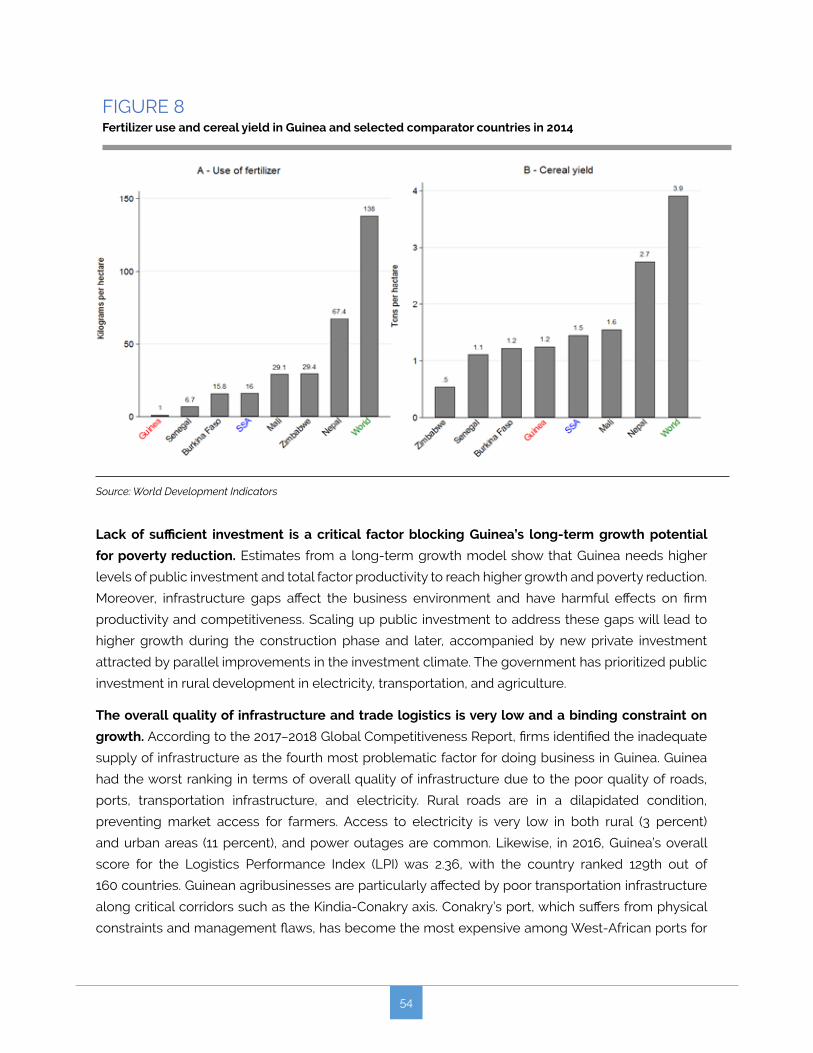
54
FIGURE 8Fertilizer use and cereal yield in Guinea and selected comparator countries in 2014
Source: World Development Indicators
Lack of sufficient investment is a critical factor blocking Guinea’s long-term growth potential
for poverty reduction. Estimates from a long-term growth model show that Guinea needs higher
levels of public investment and total factor productivity to reach higher growth and poverty reduction.
Moreover, infrastructure gaps affect the business environment and have harmful effects on firm
productivity and competitiveness. Scaling up public investment to address these gaps will lead to
higher growth during the construction phase and later, accompanied by new private investment
attracted by parallel improvements in the investment climate. The government has prioritized public
investment in rural development in electricity, transportation, and agriculture.
The overall quality of infrastructure and trade logistics is very low and a binding constraint on
growth. According to the 2017–2018 Global Competitiveness Report, firms identified the inadequate
supply of infrastructure as the fourth most problematic factor for doing business in Guinea. Guinea
had the worst ranking in terms of overall quality of infrastructure due to the poor quality of roads,
ports, transportation infrastructure, and electricity. Rural roads are in a dilapidated condition,
preventing market access for farmers. Access to electricity is very low in both rural (3 percent)
and urban areas (11 percent), and power outages are common. Likewise, in 2016, Guinea’s overall
score for the Logistics Performance Index (LPI) was 2.36, with the country ranked 129th out of
160 countries. Guinean agribusinesses are particularly affected by poor transportation infrastructure
along critical corridors such as the Kindia-Conakry axis. Conakry’s port, which suffers from physical
constraints and management flaws, has become the most expensive among West-African ports for
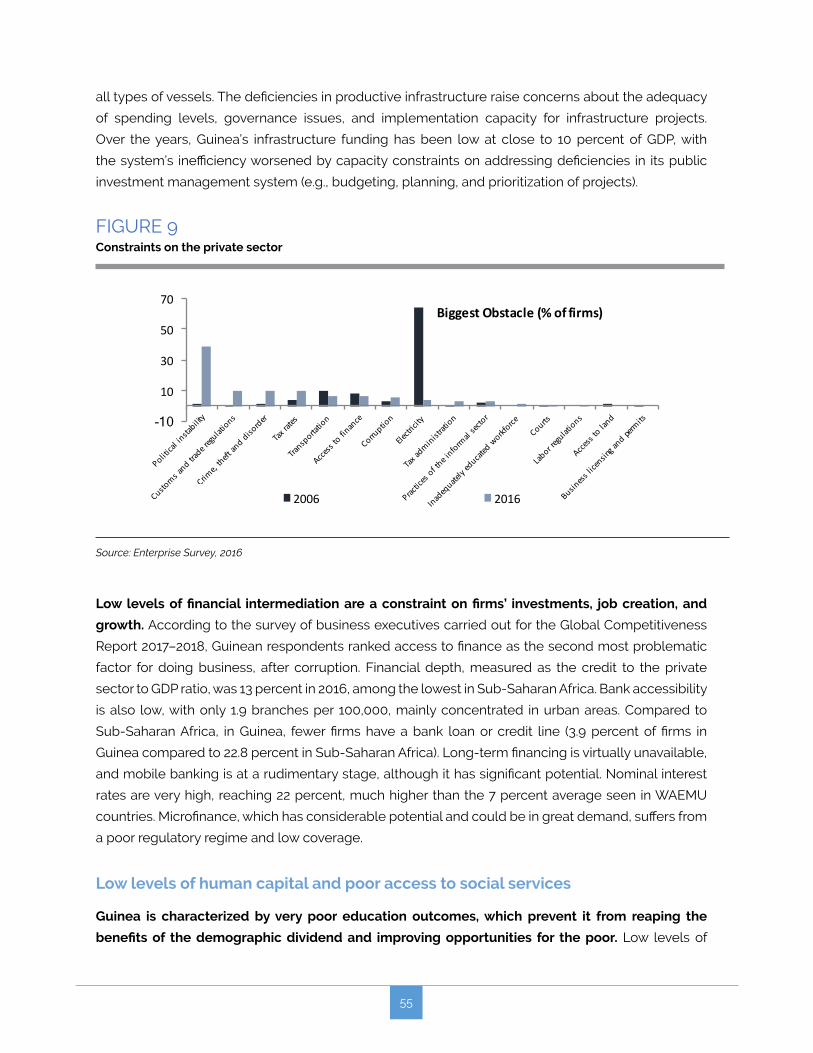
55
all types of vessels. The deficiencies in productive infrastructure raise concerns about the adequacy
of spending levels, governance issues, and implementation capacity for infrastructure projects.
Over the years, Guinea’s infrastructure funding has been low at close to 10 percent of GDP, with
the system’s inefficiency worsened by capacity constraints on addressing deficiencies in its public
investment management system (e.g., budgeting, planning, and prioritization of projects).
FIGURE 9Constraints on the private sector
-10
10
30
50
70BiggestObstacle(%offirms)
2006 2016
Source: Enterprise Survey, 2016
Low levels of financial intermediation are a constraint on firms’ investments, job creation, and
growth. According to the survey of business executives carried out for the Global Competitiveness
Report 2017–2018, Guinean respondents ranked access to finance as the second most problematic
factor for doing business, after corruption. Financial depth, measured as the credit to the private
sector to GDP ratio, was 13 percent in 2016, among the lowest in Sub-Saharan Africa. Bank accessibility
is also low, with only 1.9 branches per 100,000, mainly concentrated in urban areas. Compared to
Sub-Saharan Africa, in Guinea, fewer firms have a bank loan or credit line (3.9 percent of firms in
Guinea compared to 22.8 percent in Sub-Saharan Africa). Long-term financing is virtually unavailable,
and mobile banking is at a rudimentary stage, although it has significant potential. Nominal interest
rates are very high, reaching 22 percent, much higher than the 7 percent average seen in WAEMU
countries. Microfinance, which has considerable potential and could be in great demand, suffers from
a poor regulatory regime and low coverage.
Low levels of human capital and poor access to social services
Guinea is characterized by very poor education outcomes, which prevent it from reaping the
benefits of the demographic dividend and improving opportunities for the poor. Low levels of
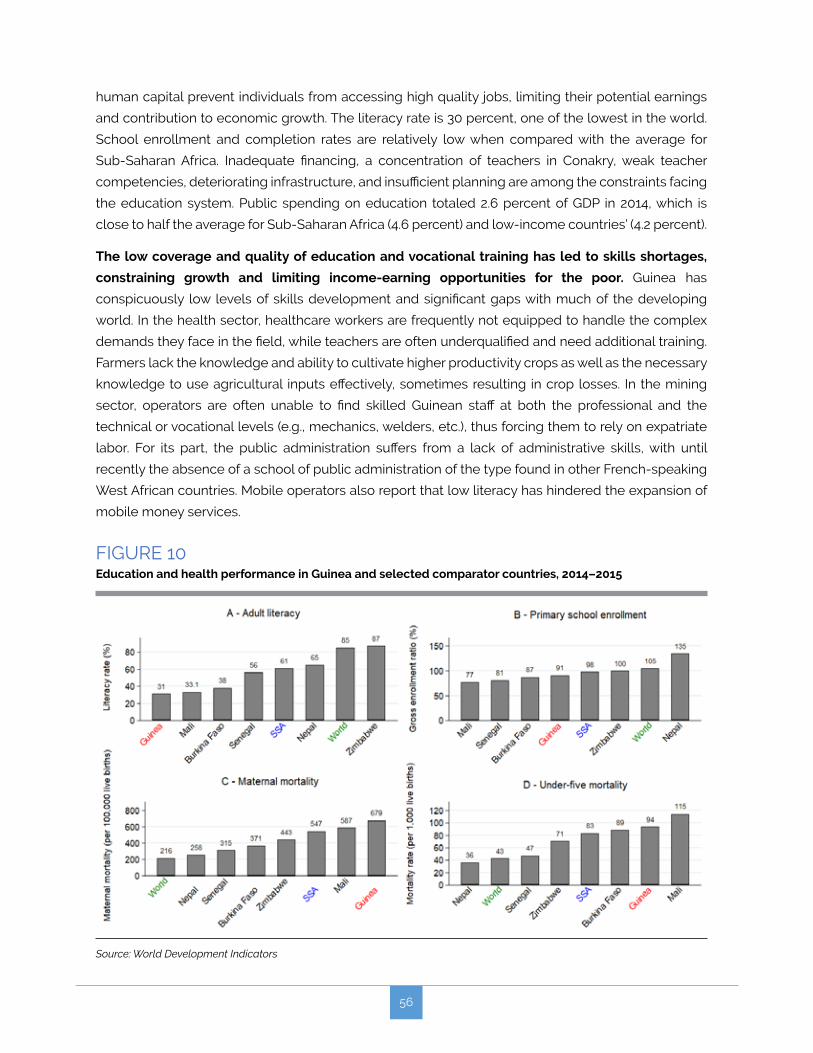
56
human capital prevent individuals from accessing high quality jobs, limiting their potential earnings
and contribution to economic growth. The literacy rate is 30 percent, one of the lowest in the world.
School enrollment and completion rates are relatively low when compared with the average for
Sub-Saharan Africa. Inadequate financing, a concentration of teachers in Conakry, weak teacher
competencies, deteriorating infrastructure, and insufficient planning are among the constraints facing
the education system. Public spending on education totaled 2.6 percent of GDP in 2014, which is
close to half the average for Sub-Saharan Africa (4.6 percent) and low-income countries’ (4.2 percent).
The low coverage and quality of education and vocational training has led to skills shortages,
constraining growth and limiting income-earning opportunities for the poor. Guinea has
conspicuously low levels of skills development and significant gaps with much of the developing
world. In the health sector, healthcare workers are frequently not equipped to handle the complex
demands they face in the field, while teachers are often underqualified and need additional training.
Farmers lack the knowledge and ability to cultivate higher productivity crops as well as the necessary
knowledge to use agricultural inputs effectively, sometimes resulting in crop losses. In the mining
sector, operators are often unable to find skilled Guinean staff at both the professional and the
technical or vocational levels (e.g., mechanics, welders, etc.), thus forcing them to rely on expatriate
labor. For its part, the public administration suffers from a lack of administrative skills, with until
recently the absence of a school of public administration of the type found in other French-speaking
West African countries. Mobile operators also report that low literacy has hindered the expansion of
mobile money services.
FIGURE 10Education and health performance in Guinea and selected comparator countries, 2014–2015
Source: World Development Indicators
57
Inadequate skills are also partly responsible for Guinea’s poor health outcomes, which can be
attributed to a weak public health system that is inaccessible, inequitable, and inefficient. The
maternal mortality ratio stands at 679 per 100,000 live births, among the highest in the world. Only
45 percent of births are attended by a skilled professional, lower even than in many fragile countries
in the region. The under-five mortality also remains among the highest, with just under 100 deaths
per 1,000 live births. Although the chronic malnutrition rate (stunting) decreased from 47 percent
in 2000 to 31 percent in 2012, it remains a concern, especially in rural areas, were 40 percent of
children are stunted. Access to healthcare facilities is hindered by high fees relative to incomes as
well as distance, with wide disparities between rural and urban areas as well as across regions. About
34 percent of sick individuals fail to visit a health center due to high fees. Setting up a powerful
public health system was one of the main lessons learned from the recent Ebola epidemic. Such a
system is necessary if the economy is to become more resilient to health covariate shocks. This will
also help households cope with the usual idiosyncratic health shocks that negatively affect workers’
productivity and families’ well-being.
A lack of public resources, low demand, and poor financial resource management are other key
issues afflicting the health sector. A lack of public resources has led to a low quality of services, as
reflected in the lack of facilities and skilled personnel, especially in rural areas. There is also a lack
of demand for health services, particularly in rural areas, because of the above-mentioned quality
issues, substantial distances between communities and points of care, and high user fees. Finally,
in addition to this lack of resources, Guinea’s financial resource management and monitoring of the
health system is poor, which once again raises governance issues.
Difficult access to basic infrastructure services also affects human capital outcomes. According
to the 2013 Poverty Reduction Strategy Paper (PRSP III), only 42 percent of Guinea’s rural population
had access to drinking water compared to more than 85 percent in Conakry, and 31 percent of
the population lived in households with improved sanitary facilities (15 percent in rural areas and
65 percent in rural areas). In addition, the lack of access to drinking water has a disproportional impact
on the workload of women.
Rapid and unplanned urbanization
Urbanization in Guinea has not been well managed, and the economic benefits of agglomeration
have been elusive. Messy urbanization has been characterized by deficient urban planning, lack of
clear or rapid investment in infrastructure, and poor natural waste management. The triple challenges
of congestion, urban slums, and pollution have hampered investment in real estate. Failures in land
regulation and weak land laws have compounded the problem. Employment in both tradables
and non-tradables has not grown, and many of the migrants driven off the land by unproductive
agriculture enter the informal, equally unproductive service sector in the cities. The spillover of
Conakry across its peninsula and boundaries and the resulting large number of urban slums has
made the delivery of basic urban services and the provision of infrastructure a real challenge. In a
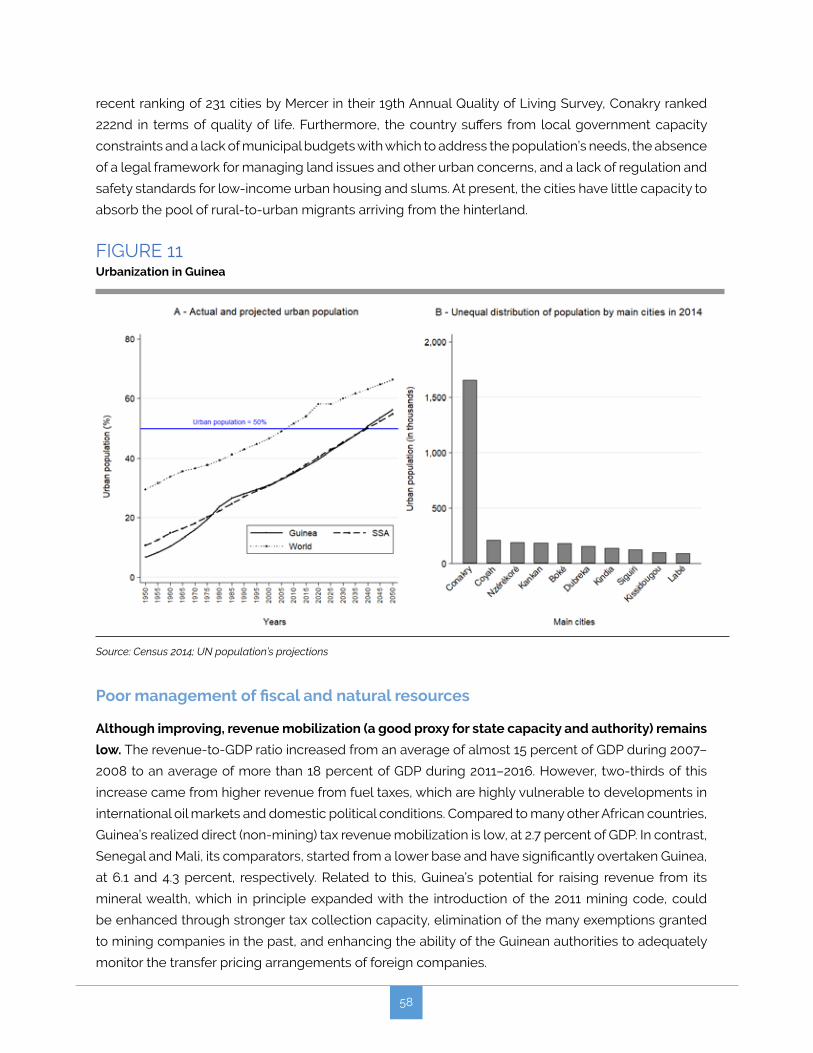
58
recent ranking of 231 cities by Mercer in their 19th Annual Quality of Living Survey, Conakry ranked
222nd in terms of quality of life. Furthermore, the country suffers from local government capacity
constraints and a lack of municipal budgets with which to address the population’s needs, the absence
of a legal framework for managing land issues and other urban concerns, and a lack of regulation and
safety standards for low-income urban housing and slums. At present, the cities have little capacity to
absorb the pool of rural-to-urban migrants arriving from the hinterland.
FIGURE 11Urbanization in Guinea
Source: Census 2014; UN population’s projections
Poor management of fiscal and natural resources
Although improving, revenue mobilization (a good proxy for state capacity and authority) remains
low. The revenue-to-GDP ratio increased from an average of almost 15 percent of GDP during 2007–
2008 to an average of more than 18 percent of GDP during 2011–2016. However, two-thirds of this
increase came from higher revenue from fuel taxes, which are highly vulnerable to developments in
international oil markets and domestic political conditions. Compared to many other African countries,
Guinea’s realized direct (non-mining) tax revenue mobilization is low, at 2.7 percent of GDP. In contrast,
Senegal and Mali, its comparators, started from a lower base and have significantly overtaken Guinea,
at 6.1 and 4.3 percent, respectively. Related to this, Guinea’s potential for raising revenue from its
mineral wealth, which in principle expanded with the introduction of the 2011 mining code, could
be enhanced through stronger tax collection capacity, elimination of the many exemptions granted
to mining companies in the past, and enhancing the ability of the Guinean authorities to adequately
monitor the transfer pricing arrangements of foreign companies.
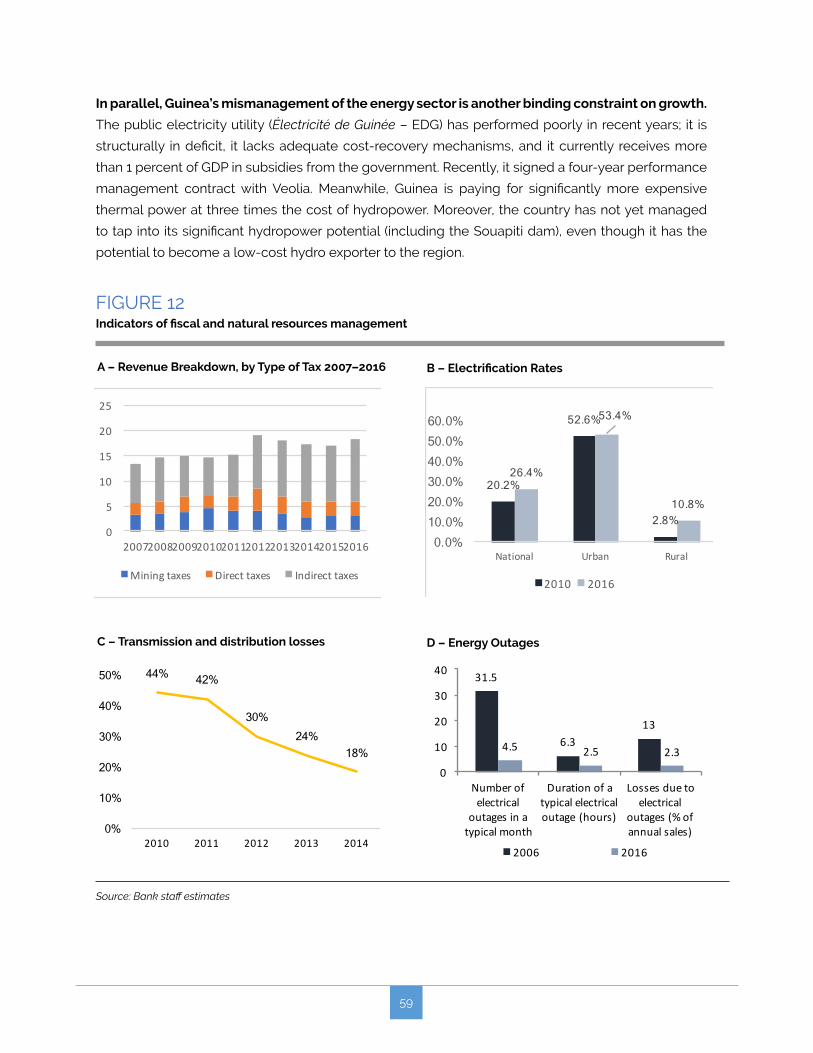
59
In parallel, Guinea’s mismanagement of the energy sector is another binding constraint on growth.
The public electricity utility (Électricité de Guinée – EDG) has performed poorly in recent years; it is
structurally in deficit, it lacks adequate cost-recovery mechanisms, and it currently receives more
than 1 percent of GDP in subsidies from the government. Recently, it signed a four-year performance
management contract with Veolia. Meanwhile, Guinea is paying for significantly more expensive
thermal power at three times the cost of hydropower. Moreover, the country has not yet managed
to tap into its significant hydropower potential (including the Souapiti dam), even though it has the
potential to become a low-cost hydro exporter to the region.
FIGURE 12Indicators of fiscal and natural resources management
Source: Bank staff estimates
0
5
10
15
20
25
2007200820092010201120122013201420152016
Miningtaxes Directtaxes Indirecttaxes
20.2%
52.6%
2.8%
26.4%
53.4%
10.8%
0.0% 10.0% 20.0% 30.0% 40.0% 50.0% 60.0%
National Urban Rural
2010 2016
A – Revenue Breakdown, by Type of Tax 2007–2016 B – Electrification Rates
44% 42%
30% 24%
18%
0%
10%
20%
30%
40%
50%
2010 2011 2012 2013 2014
31.5
6.313
4.5 2.5 2.3
0
10
20
30
40
Numberofelectrical
outagesinatypicalmonth
Durationofatypicalelectricaloutage (hours)
Lossesduetoelectrical
outages(%ofannualsales)
2006 2016
C – Transmission and distribution losses D – Energy Outages

60
Finally, the country’s public investment and procurement systems impede its economic progress.
Although public investment has doubled during the last decade, it has been volatile, with a high of
10 percent of GDP in 2015 and a low of 4.7 percent in 2011, leading to inappropriate budget planning
and waste. Ad hoc cuts and a lack of systematic follow-up have hindered its efficacy. In parallel,
the public procurement system, another key concern, relies mainly on costly and inefficient single
sourcing, frequently bypassing existing rules and conventional practices for competitive bidding.
Pathways to Structural Transformation
Based on the above diagnostics, four pathways to structural transformation could help accelerate
growth and poverty reduction in Guinea. These are:
i. Increasing agricultural productivity and supporting private sector investments to promote
economic diversification;
ii. Raising human capital to support inclusive growth;
iii. Improving economic opportunities through enhanced urban development; and
iv. Strengthening the management of fiscal and natural resources.
Each pathway should enable the achievement of cross-cutting reform, leading to incremental
improvements in governance.
These pathways translate in reform areas whose prioritization was determined by considering
three parameters. These are:
i. Their likely effect on poverty reduction and shared prosperity;
ii. Political feasibility based on capacity and reform sequencing, and
iii. The importance of the issue being seen through stakeholder consultations and cross-country
benchmarking.
As a result, the top five constraints that necessitate policy action are:
i. Low access to agricultural inputs;
ii. Poor skills development;
iii. Weak infrastructure (port, roads, logistics);
iv. Inappropriate fiscal management (revenue, investment, procurement); and
v. Low access to finance.
61
Inputs remain the key obstacle to increasing farmer productivity and expanding agricultural
output. Guinea’s skills gap with other developing countries is significant, and the country will
need a veritable skills revolution if it to catch up with emerging economies. Infrastructure
remains in poor condition, especially in terms of urban and rural roads, ports, and logistics.
Poor fiscal management is the Achilles heel of the Guinean economy and will need to improve.
Finally, financial access is fundamental for entrepreneurs to obtain sufficient working capital to
set up small and medium-sized firms.
Lastly, delivering reliable public services to vulnerable populations is a key tool in contributing
to poverty reduction. To reach this goal, the way forward is a mix of strong institutions that can fulfill
their mandate through reforms designed to improve the effectiveness of service delivery. In some
cases, these actions should be undertaken jointly with sociological activities designed to educate
local population into adopting good practices, including in women’s education, water, sanitation, and
health matters.

62
COUNTRY ECONOMIC FOCUSMacroeconomic indicators of AFCW3 countries at a glance, 2013-2018
-10
-5
0
5
10
15
2013 2014 2015 2016e 2017p 2018p
GDPgrow
thra
te(%
)
Growth recoveriesmadeprogressin2017,Chadisgraduallyemergingfromrecession…
Chad Mali Guinea Niger
-5
0
5
10
15
2013 2014 2015 2016e 2017p 2018p
Annual,average
..andtheinflation rateskeptbelow 3percent,with theexception ofGuinea
Chad Mali Guinea Niger
-35
-25
-15
-5
Chad Mali Guinea Niger
%o
fGD
P
All currentaccountdeficitsdeclinedin2017,butremainedindoubledigitsinGuineaandNiger…
2013 2014 2015 2016e 2017p 2018p
-60
-40
-20
0
20
40
Chad Mali Guinea Niger
Annu
al,%
cha
nge
…whiletheirtermsoftradedeteriorated,exceptforChad
2013 2014 2015 2016e 2017p 2018p
-10
-5
0
5
Chad Mali Guinea Niger
Inclu
dinggrants,cashbasis,%ofG
DP
Fiscaldeficits improved in2017,exceptforGuinea…
2013 2014 2015 2016e 2017p 2018p
10
15
20
25
30
2013 2014 2015 2016e 2017p 2018p
Exclud
inggrants,%
ofG
DP
…supported byanincreaseinrevenue,exceptforGuinea
Chad Mali Guinea Niger
Source: IMF and World Bank staff estimates; IMF AIV, several years. Note: data for 2016 are revised estimates, and 2017 and 2018 are projections. Fiscal deficits include grants and are on cash basis (except for Niger – on commitment basis); they may slightly differ from those reported in the text done on a commitment basis.
This section is the outcome of the entire AFCW3 economic and poverty teams: Lars Moller, Andrew Dabalen, Luc Razafimandimby, Marcel Nshimiyimama, Markus Kitzmuller, Olanrewaju Kasim, Ernest Sergenti, Abdoul Mijiyawa, Olivier Beguy, Johannes Hoogeveen, Aly Sanoh, Yele Batana, and Andre-Marie Taptue. Irum Touqeer took care of carefully producing the consolidated graphs, as usual.
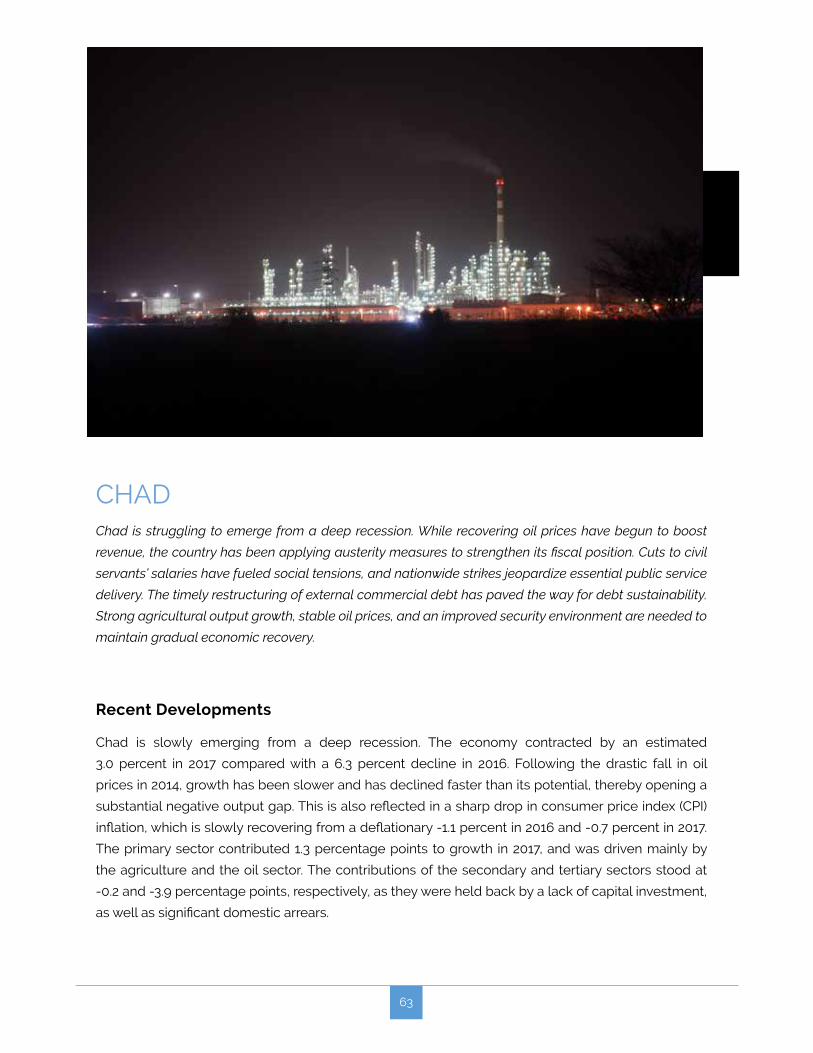
63
CHAD Chad is struggling to emerge from a deep recession. While recovering oil prices have begun to boost
revenue, the country has been applying austerity measures to strengthen its fiscal position. Cuts to civil
servants’ salaries have fueled social tensions, and nationwide strikes jeopardize essential public service
delivery. The timely restructuring of external commercial debt has paved the way for debt sustainability.
Strong agricultural output growth, stable oil prices, and an improved security environment are needed to
maintain gradual economic recovery.
Recent Developments
Chad is slowly emerging from a deep recession. The economy contracted by an estimated
3.0 percent in 2017 compared with a 6.3 percent decline in 2016. Following the drastic fall in oil
prices in 2014, growth has been slower and has declined faster than its potential, thereby opening a
substantial negative output gap. This is also reflected in a sharp drop in consumer price index (CPI)
inflation, which is slowly recovering from a deflationary -1.1 percent in 2016 and -0.7 percent in 2017.
The primary sector contributed 1.3 percentage points to growth in 2017, and was driven mainly by
the agriculture and the oil sector. The contributions of the secondary and tertiary sectors stood at
-0.2 and -3.9 percentage points, respectively, as they were held back by a lack of capital investment,
as well as significant domestic arrears.
64
The external current account deficit decreased from 13 percent of gross domestic product (GDP)
in 2016 to 5.2 percent in 2017. Imports contracted by -1.3 percent in 2017 due to subdued private
consumption and the problematic security environment along the Nigeria-Chad border. On the
upside, moderately higher oil prices boosted oil exports.
The government remained committed to fiscal consolidation in 2017. Total expenditure stagnated
around 15 percent of GDP in 2017. Against expectations, the wage bill saw a slight increase from
7.5 percent of nonoil GDP in 2016 to 7.8 percent in 2017. Total revenues increased from 12.9 percent of
GDP in 2016 to 13.4 percent in 2017 as oil prices began to rise toward the end of the year. Consequently,
the overall fiscal deficit declined from -2.6 percent of GDP in 2016 to -1.4 in 2017. Finally, the 2017
financing gap was closed through external concessional loans and domestic arrears accumulation.
After several attempts to restructure its commercial debt with Glencore in 2017, an agreement was
reached in February 2018. The terms of the restructuring include a 2-year grace period, a maturity
of 12 years from the previous 7 years, and a reduction in the interest rates from 7.5 to 2 percent
above London Inter-bank Offered Rate (LIBOR). This agreement, together with restructured advances
from the Bank of Central African States (BEAC), provides the fiscal space needed to close the 2018
financing gap and puts the country’s external debt back on a sustainable path.
As a member of the Central African Economic and Monetary Union (CEMAC), Chad’s currency is
pegged to the euro. The BEAC conducts monetary policy across its six largely oil-producing member
states. Recently, monetary policy was tightened and regional foreign exchange (forex) reserves
increased marginally from 2.3 months of import coverage in 2016 to 2.7 months by the end of 2017.
Nevertheless, this remains well below the five months coverage considered adequate for a resource-
rich monetary union with a fixed exchange rate.
Although poverty rates have decreased since 2003, population growth increased the absolute
number of poor and vulnerable individuals. Household survey data from 2003 and 2011 reveal
only modest improvements. In 2003, 36 percent of the population was food insecure, 55 percent
poor, and 76 percent vulnerable. In 2011, these rates decreased to 29 percent, 47 percent, and
68 percent, respectively. In 2011, approximately 6.8 million people in Chad were vulnerable, compared to
5.7 million in 2003. Meanwhile, inequality persists, with the difference in per capita daily consumption
between the 10th and 90th income percentiles being $4.44 in urban areas, whereas the equivalent
difference in rural areas is $2.78.
65
Outlook
Gradual economic recovery over the next two years depends on relatively steady and strong oil
prices, as well as continued external budget support. Real GDP growth is expected to reach about
2.6 percent in 2018, supported by two key factors: export growth, which is estimated to accelerate by
3.6 percentage points as oil prices remain strong, and a gradual recovery in gross fixed investment.
Given the continued tight fiscal and monetary policies, the output gap is unlikely to be closed in the
medium term.
Increasing oil exports will drive recovery, with the non-oil economy gradually following suit. The
external current account deficit is expected to further decrease to 4.4 percent of GDP in 2018, and
imputed reserves should be rebuilt gradually to about 0.4 months of import coverage.
The overall fiscal surplus is expected to reach 0.6 percent of GDP in 2018 and oscillate around
0 percent in future. Public investment is expected to slowly increase from around 4 percent of GDP in
2017 to 4.5 percent by 2020.
The BEAC policy rate is currently 2.95 percent, and monetary policy may tighten further in the near
term. The regional reserves are estimated to reach 3 months of import coverage by the end of 2018.
Successful external debt restructuring will reduce the debt service-to-revenue ratio below 18 percent
and, together with external financial support, lower the risk of debt distress.
Using the international poverty line of US$1.90 per day in purchasing power parity -- PPP -- terms,
poverty is expected to decline by less than 1 percentage point between 2018–2020. With population
growth at 3.3. percent annually, this will lead to an additional half a million poor people by 2020, thus
increasing the absolute number to about 6.6 million (up from 4.7 million in 2011).
Risks and Challenges
Chad’s economic recovery remains fragile and subject to significant downside risks. Continued
austerity fuels social tensions, and a deterioration in the security environment could quickly challenge
economic activity, discourage investment, and further strain the public finances through increasing
security expenditure. Political instability, as witnessed by frequent government reshuffles, weighs
on economic growth. With about 20,000 new arrivals from the Central African Republic, the current
refugee crisis remains a challenge given the government’s very limited fiscal space. Finally, oil price
volatility may lead oil sector contributions to GDP growth off track.
Overall, external and fiscal pressures foretell a reversal of some of the poverty gains made in the
recent past. Against these risks, a key challenge remains how to diversify Chad’s economy to foster
resilience and sustainable growth, supported by investment in priority sectors such as agriculture or
ICT telecom.
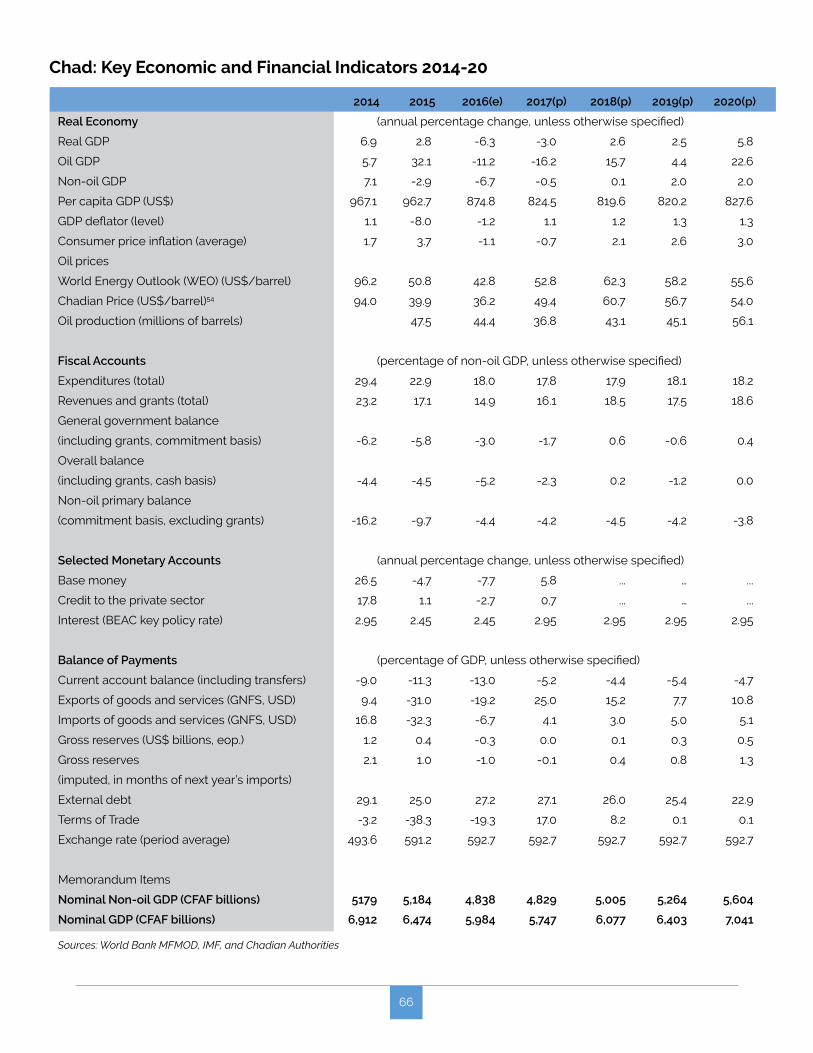
66
Chad: Key Economic and Financial Indicators 2014-20
2014 2015 2016(e) 2017(p) 2018(p) 2019(p) 2020(p)
Real Economy (annual percentage change, unless otherwise specified)
Real GDP 6.9 2.8 -6.3 -3.0 2.6 2.5 5.8
Oil GDP 5.7 32.1 -11.2 -16.2 15.7 4.4 22.6
Non-oil GDP 7.1 -2.9 -6.7 -0.5 0.1 2.0 2.0
Per capita GDP (US$) 967.1 962.7 874.8 824.5 819.6 820.2 827.6
GDP deflator (level) 1.1 -8.0 -1.2 1.1 1.2 1.3 1.3
Consumer price inflation (average) 1.7 3.7 -1.1 -0.7 2.1 2.6 3.0
Oil prices
World Energy Outlook (WEO) (US$/barrel) 96.2 50.8 42.8 52.8 62.3 58.2 55.6
Chadian Price (US$/barrel)54 94.0 39.9 36.2 49.4 60.7 56.7 54.0
Oil production (millions of barrels) 47.5 44.4 36.8 43.1 45.1 56.1
Fiscal Accounts (percentage of non-oil GDP, unless otherwise specified)
Expenditures (total) 29.4 22.9 18.0 17.8 17.9 18.1 18.2
Revenues and grants (total) 23.2 17.1 14.9 16.1 18.5 17.5 18.6
General government balance
(including grants, commitment basis) -6.2 -5.8 -3.0 -1.7 0.6 -0.6 0.4
Overall balance
(including grants, cash basis) -4.4 -4.5 -5.2 -2.3 0.2 -1.2 0.0
Non-oil primary balance
(commitment basis, excluding grants) -16.2 -9.7 -4.4 -4.2 -4.5 -4.2 -3.8
Selected Monetary Accounts (annual percentage change, unless otherwise specified)
Base money 26.5 -4.7 -7.7 5.8 ... … ...
Credit to the private sector 17.8 1.1 -2.7 0.7 ... … ...
Interest (BEAC key policy rate) 2.95 2.45 2.45 2.95 2.95 2.95 2.95
Balance of Payments (percentage of GDP, unless otherwise specified)
Current account balance (including transfers) -9.0 -11.3 -13.0 -5.2 -4.4 -5.4 -4.7
Exports of goods and services (GNFS, USD) 9.4 -31.0 -19.2 25.0 15.2 7.7 10.8
Imports of goods and services (GNFS, USD) 16.8 -32.3 -6.7 4.1 3.0 5.0 5.1
Gross reserves (US$ billions, eop.) 1.2 0.4 -0.3 0.0 0.1 0.3 0.5
Gross reserves 2.1 1.0 -1.0 -0.1 0.4 0.8 1.3
(imputed, in months of next year’s imports)
External debt 29.1 25.0 27.2 27.1 26.0 25.4 22.9
Terms of Trade -3.2 -38.3 -19.3 17.0 8.2 0.1 0.1
Exchange rate (period average) 493.6 591.2 592.7 592.7 592.7 592.7 592.7
Memorandum Items
Nominal Non-oil GDP (CFAF billions) 5179 5,184 4,838 4,829 5,005 5,264 5,604
Nominal GDP (CFAF billions) 6,912 6,474 5,984 5,747 6,077 6,403 7,041
Sources: World Bank MFMOD, IMF, and Chadian Authorities

67
GUINEAThe economy grew by 8.2 percent in 2017 driven by a surge in mining activity. Medium-term growth
prospects are also good as foreign direct investment (FDI) into the mining sector remains substantial
and increased infrastructure investments boost the construction and agricultural sectors. Downside risks
to the outlook include socio-political tensions, reform slippage in the run-up to parliamentary elections
in the Fall of 2018, and declining commodity prices. The extreme poverty rate is expected to decline to
24 percent in 2020 from 31 percent in 2016.
Recent Economic Development
Economic growth reached an estimated 8.2 percent in 2017, driven by increased mining production,
resumed construction activity, good agricultural performance, and improved electricity provision.
Although very strong, growth was lower than in 2016, when it was driven by a substantial 139 percent
increase in investment and revised upward to 10.5 percent.
The external current account deficit (including grants) was estimated at 16.8 percent of gross domestic
product (GDP) in 2017, down from 31.1 percent in 2016. Higher mining and agricultural exports and
lower capital imports contributed to the lower deficit. FDI inflows accounted for about 14 percent of
GDP in 2017 and continue to finance a sizable portion of the deficit. International reserves increased
slightly from 2.3 months of imports in 2016 to 2.5 months in 2017. However, given that reserves are
below adequate levels, the economy remains vulnerable to commodity price shocks.
68
The fiscal deficit widened from 0.1 percent of GDP in 2016 to 2.1 percent in 2017. Driven by an increase
in capital expenditure, spending on goods and services and subsidies to the public energy utility
(Électricité de Guinée – EDG), meant that total expenditure increased from 16.0 percent of GDP in
2016 to 17.5 percent in 2017. Subsidies to EDG are estimated to have reached 1.3 percent of GDP,
because of higher electricity consumption, production costs, and arrears clearance. In addition, fiscal
revenue and grants declined from 15.8 percent of GDP in 2016 to 15.4 percent in 2017 mainly because
of a large decrease in indirect taxes on goods and services.
The Central Bank of the Republic of Guinea (BCRG) maintained a tight monetary stance and continued
its policy of not pre-financing public works projects through loan guarantees. In addition, the parallel
foreign exchange premium remained low, averaging just 1 percent in 2017. The BCRG also maintained
its benchmark interest rate at 12.5 percent while lowering reserve requirements in March 2017 to
16 percent. After two years of large increases, credit to the private sector slowed to 2.4 percent in
2016 and 0.9 percent in 2017. Consequently, the average inflation rate remained in single digits, at an
estimated 8.9 percent in 2017, slightly higher than the 8.2 percent recorded in 2016 owing to increases
in both domestic and imported goods prices.
External debt was estimated at 19.5 percent of GDP in 2017, down slightly from 21.0 percent in
2016. Guinea continues to use external borrowing to finance investments in energy and transport
infrastructure, with priority given to concessional loans. To preserve debt sustainability under a new
international monetary fund (IMF) Extended Credit Facility (ECF) approved in December 2017 for
US$170 million, Guinea agreed to limit additional non-concessional borrowing to US$650 million in
2018-20. Guinea remains at moderate risk of debt distress.
The 2014–2015 Ebola epidemic and a decline in commodity prices led to a worsening of living
standards and a rise in poverty. Simulations based on the 2014 census using the national poverty line
indicate an increase in the poverty rate to nearly 58 percent from around 55 percent between 2002
and 2012, with both urban and rural areas experiencing increased poverty. With the high incidence of
poverty and rapid population growth of around 3 percent annually, the population living in poverty is
projected to have increased to about 6 million, a net increase of half a million people compared to
2002. However, the extreme poverty rate calculated using the international poverty line of US$1.90
per day (at purchasing-power parity – PPP) decreased to 31 percent in 2016 from an estimated 35
percent in 2012.
69
Outlook
Over the medium term, economic growth is projected to average about 6 percent. It will be driven
by large FDI inflows into the mining industry and increased infrastructure investment boosting
construction and agricultural activities. The external current account deficit is expected to average
18 percent of GDP in 2018–2020 as FDI-financed intermediate imports remain high and mining and
agricultural exports increase. International reserves should gradually increase to 3.5 months of import
coverage by 2020.
The 2018 fiscal deficit is projected to reach 3.3 percent of GDP. After weeks of strikes and protests, a
decision in March 2018 to accelerate a planned 40 percent increase in public sector workers’ salaries
might increase the wage bill up to 0.4 percent of GDP in 2018. To keep within the government’s deficit
target of less than 3 percent of GDP by 2019, Guinea will pursue effective spending controls and strong
mobilization efforts to raise domestic revenue. These should include cutting non-priority spending,
reducing tax exemptions in the mining sector, and improving tax compliance through administrative
reforms. The inflation rate is forecast to remain between 8 and 9 percent over the medium term,
reflecting sound monetary policy and expected increases in agricultural productivity and the food
supply. The public debt-to-GDP ratio should increase to 41.8 percent in 2019 and remain at that level
in 2020.
Given strong economic growth over the next three years, especially in the agricultural sector, the
extreme poverty rate is expected to decrease further to around 24 percent by 2020.
Risks and Challenges
The economic outlook relies on the ability of the authorities to manage socio-political tensions
and implement reforms, mainly pertaining to fiscal policy. Parliamentary elections are expected in
September 2018, and election-related spending may weaken fiscal discipline and require corrective
actions.
Low commodity prices, for especially aluminum and gold, remain a downside risk. Additional
risks may be caused by the expected increase in mining and infrastructure investments. Delayed
implementation of structural reforms and weak growth in the agriculture sector could also slow
growth and poverty reduction. Finally, preserving debt sustainability will require close monitoring over
the forecast period as Guinea scales up its investments in critical energy and transport infrastructure.
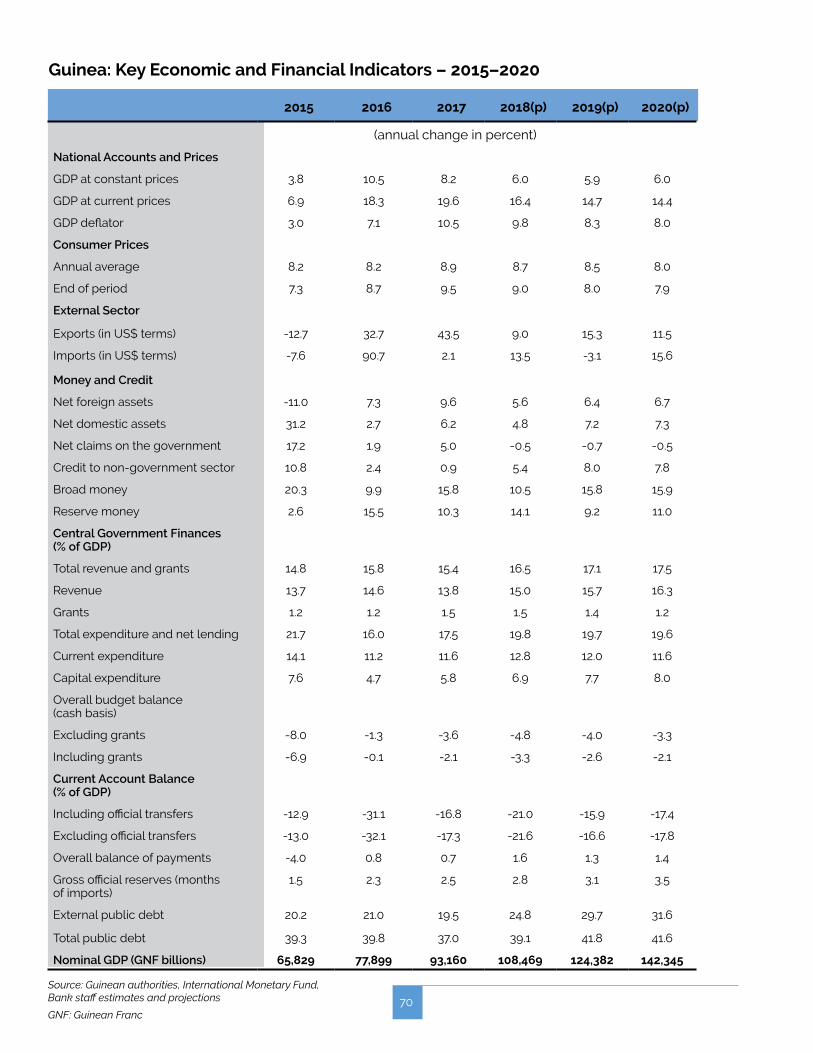
70
Guinea: Key Economic and Financial Indicators – 2015–2020
(annual change in percent)
National Accounts and Prices
GDP at constant prices 3.8 10.5 8.2 6.0 5.9 6.0
GDP at current prices 6.9 18.3 19.6 16.4 14.7 14.4
GDP deflator 3.0 7.1 10.5 9.8 8.3 8.0
Consumer Prices
Annual average 8.2 8.2 8.9 8.7 8.5 8.0
End of period 7.3 8.7 9.5 9.0 8.0 7.9
External Sector
Exports (in US$ terms) -12.7 32.7 43.5 9.0 15.3 11.5
Imports (in US$ terms) -7.6 90.7 2.1 13.5 -3.1 15.6
Money and Credit
Net foreign assets -11.0 7.3 9.6 5.6 6.4 6.7
Net domestic assets 31.2 2.7 6.2 4.8 7.2 7.3
Net claims on the government 17.2 1.9 5.0 -0.5 -0.7 -0.5
Credit to non-government sector 10.8 2.4 0.9 5.4 8.0 7.8
Broad money 20.3 9.9 15.8 10.5 15.8 15.9
Reserve money 2.6 15.5 10.3 14.1 9.2 11.0
Central Government Finances (% of GDP)
Total revenue and grants 14.8 15.8 15.4 16.5 17.1 17.5
Revenue 13.7 14.6 13.8 15.0 15.7 16.3
Grants 1.2 1.2 1.5 1.5 1.4 1.2
Total expenditure and net lending 21.7 16.0 17.5 19.8 19.7 19.6
Current expenditure 14.1 11.2 11.6 12.8 12.0 11.6
Capital expenditure 7.6 4.7 5.8 6.9 7.7 8.0
Overall budget balance (cash basis)
Excluding grants -8.0 -1.3 -3.6 -4.8 -4.0 -3.3
Including grants -6.9 -0.1 -2.1 -3.3 -2.6 -2.1
Current Account Balance (% of GDP)
Including official transfers -12.9 -31.1 -16.8 -21.0 -15.9 -17.4
Excluding official transfers -13.0 -32.1 -17.3 -21.6 -16.6 -17.8
Overall balance of payments -4.0 0.8 0.7 1.6 1.3 1.4
Gross official reserves (months of imports)
1.5 2.3 2.5 2.8 3.1 3.5
External public debt 20.2 21.0 19.5 24.8 29.7 31.6
Total public debt 39.3 39.8 37.0 39.1 41.8 41.6
Nominal GDP (GNF billions) 65,829 77,899 93,160 108,469 124,382 142,345
Source: Guinean authorities, International Monetary Fund, Bank staff estimates and projections
GNF: Guinean Franc
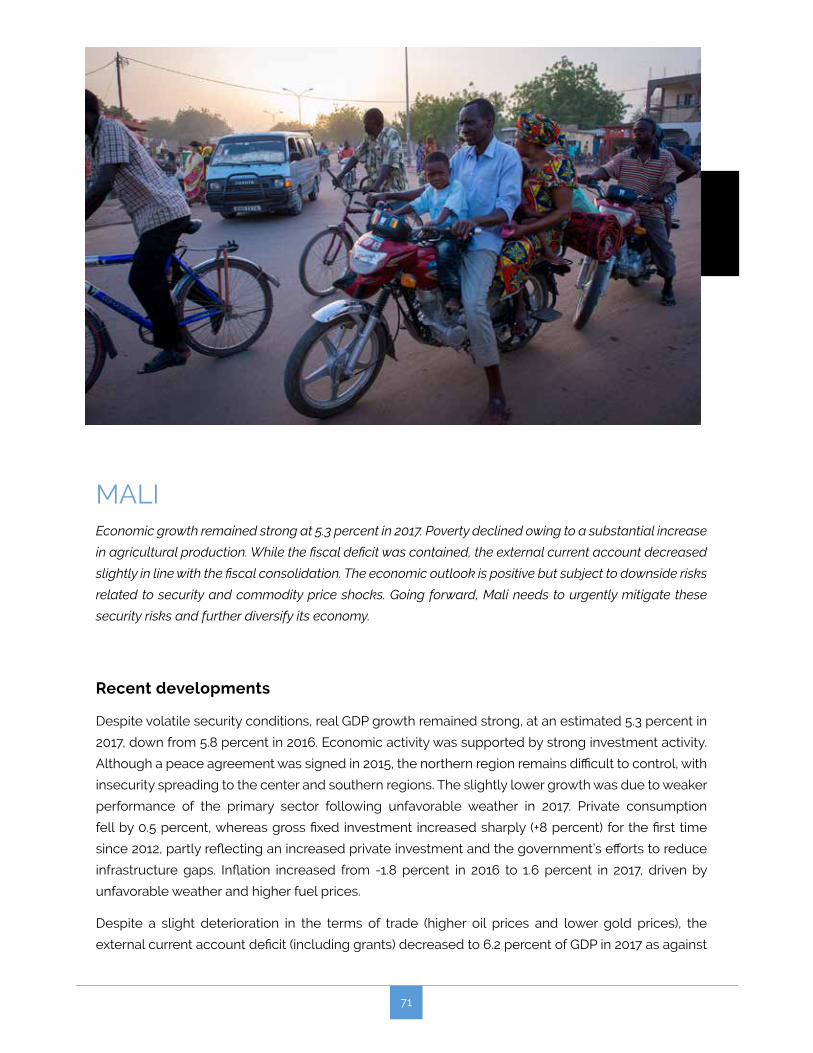
71
MALIEconomic growth remained strong at 5.3 percent in 2017. Poverty declined owing to a substantial increase
in agricultural production. While the fiscal deficit was contained, the external current account decreased
slightly in line with the fiscal consolidation. The economic outlook is positive but subject to downside risks
related to security and commodity price shocks. Going forward, Mali needs to urgently mitigate these
security risks and further diversify its economy.
Recent developments
Despite volatile security conditions, real GDP growth remained strong, at an estimated 5.3 percent in
2017, down from 5.8 percent in 2016. Economic activity was supported by strong investment activity.
Although a peace agreement was signed in 2015, the northern region remains difficult to control, with
insecurity spreading to the center and southern regions. The slightly lower growth was due to weaker
performance of the primary sector following unfavorable weather in 2017. Private consumption
fell by 0.5 percent, whereas gross fixed investment increased sharply (+8 percent) for the first time
since 2012, partly reflecting an increased private investment and the government’s efforts to reduce
infrastructure gaps. Inflation increased from -1.8 percent in 2016 to 1.6 percent in 2017, driven by
unfavorable weather and higher fuel prices.
Despite a slight deterioration in the terms of trade (higher oil prices and lower gold prices), the
external current account deficit (including grants) decreased to 6.2 percent of GDP in 2017 as against
72
7.2 percent in 2016, in line with the fiscal consolidation. The deficit was financed by foreign direct
investment (FDI) and public borrowing.
Despite pressure on public spending, the authorities succeeded in containing the fiscal deficit, which
declined slightly overall from 3.9 percent of GDP in 2016 to 2.9 percent in 2017 due to the rationalization
of recurrent expenditures and significant improvement in domestic revenues. The fiscal deficit was
mainly financed by regional bonds issuance and donor budget support. Efforts to broaden the tax
base and rationalize tax exemptions led to an increase in total revenues amounting 1.8 percentage
points of GDP. Total public spending rose from 22.2 percent in 2016 to 23.0 percent of GDP owing to
net lending. Public debt increased slightly to 36.9 percent of GDP in 2017 from 35.9 percent in 2016.
Domestic debt remained steady at 11.0 percent of GDP at the end of 2017. According to the December
2017 Debt Sustainability Analysis (DSA), the risk of external debt distress remains moderate.
Mali’s monetary and exchange rate policies are managed at the regional level by the Central Bank
of West African States (BCEAO), which maintains a fixed peg between the CFA franc and the euro.
Monetary policy was tightened in December 2016 as the BCEAO raised the marginal lending facility
rate from 3.5 to 4.5 percent. This helped ease pressures on international reserves and supported
interbank market activity. However, in April 2017, the policy stance was loosened somewhat as the
reserve requirement ratio was reduced from 5 to 3 percent to ease liquidity constraints in the banking
sector. International reserves reached 4 months of import coverage by the end of 2017. Continued
fiscal consolidation among member countries is needed to support regional reserves.
The economic slowdown following the security and political crises of 2012–2013 led to an increase in
the extreme poverty rate, to 46.9 percent in 2013. Nonetheless, exceptional agricultural output growth
since 2014 coupled with expansion in the tertiary sector led to strong per capita GDP growth. Poverty
was estimated at 39.2 percent in 2017, down from 43.5 percent in 2014. Despite pockets of production
deficits in some parts of the country, the increase in agricultural production favored household and
the market availability of food and contributed to reduced poverty. Inequality is also likely to have
waned since the increase in incomes would mostly benefit households working in the agricultural
and tertiary sectors, which are most affected by poverty.
Outlook
Real GDP growth is projected to remain robust at around 5 percent in 2018 over the medium term,
in line with the estimated potential rate of growth. Agricultural growth should be underpinned by
favorable weather and the positive effects of input subsidy reforms. Services growth should remain
strong, reflecting stronger activity in the telecom, transportation, and trade sectors. On the demand
side, investment is expected to increase supported by the operationalization of the public-private
partnerships (PPP) law and the creation of a Sustainable Development Fund to finance reconstruction
in conflict-affected areas. Inflation is projected to remain moderate as good agricultural crops keep
food price increases at bay, underpinned by a prudent regional monetary policy.
73
Fiscal consolidation and tax revenue-oriented measures should bring the overall fiscal balance
down from -3.3 percent of GDP in 2018 to -3.0 percent in 2019, in line with the WAEMU convergence
criterion. The external current account deficit is projected to narrow from 6.9 percent in 2018 to about
6.2 percent by 2020 in line with planned fiscal consolidation. This projected improvement of the
country’s external position should help Mali replenish its forex reserves over the medium term.
The poverty rate is projected to decline steadily provided the robust expansion of the Malian economy
continues over the period 2018–2020 and the security threat does not spread further south. Under
those assumptions, per capita GDP should rise, with a concomitant reduction in the poverty rate to
about 37.9 percent in 2019. However, because of poor rains in some areas, poverty may rise locally
as pastoral and agricultural households are expected to experience increased food insecurity during
the lean season.
Risks and Challenges
Key downside risks could be a deteriorating security and political situation. In particular, the
presidential, parliamentary, and local elections scheduled for this this year may lead to election-
related pressure on spending.
Negative weather could aggravate food insecurity, raise social spending needs and food inflation,
and slow GDP growth. Given Mali’s limited fiscal buffers, such risks could affect budget execution, and
in particular, domestically-financed public investment, thus possibly generating the accumulation of
expenditure arrears.
An unexpected rise in oil prices or a drop in gold prices could affect fiscal and external balances
negatively. Mali remains dependent on commodities and has relatively few export markets.
Further diversification of exports would enable Mali to lower output volatility and achieve greater
macroeconomic stability.
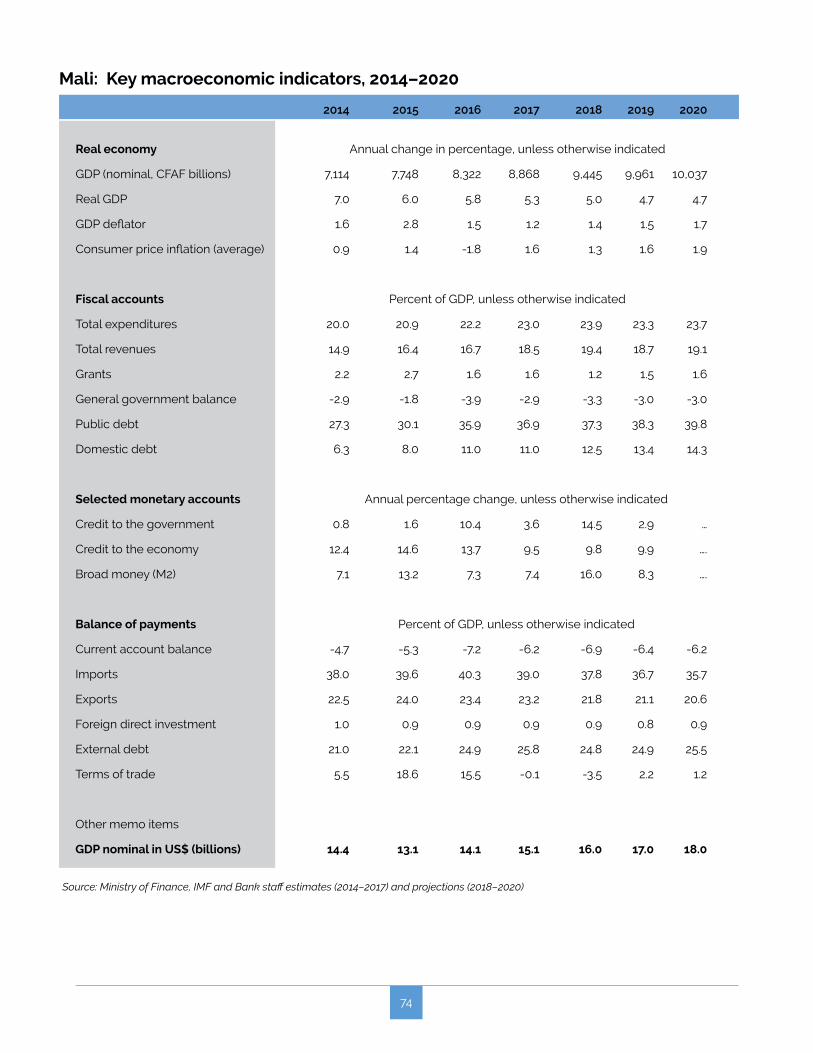
74
Mali: Key macroeconomic indicators, 2014–2020
2014 2015 2016 2017 2018 2019 2020
Real economy Annual change in percentage, unless otherwise indicated
GDP (nominal, CFAF billions) 7,114 7,748 8,322 8,868 9,445 9,961 10,037
Real GDP 7.0 6.0 5.8 5.3 5.0 4.7 4.7
GDP deflator 1.6 2.8 1.5 1.2 1.4 1.5 1.7
Consumer price inflation (average) 0.9 1.4 -1.8 1.6 1.3 1.6 1.9
Fiscal accounts Percent of GDP, unless otherwise indicated
Total expenditures 20.0 20.9 22.2 23.0 23.9 23.3 23.7
Total revenues 14.9 16.4 16.7 18.5 19.4 18.7 19.1
Grants 2.2 2.7 1.6 1.6 1.2 1.5 1.6
General government balance -2.9 -1.8 -3.9 -2.9 -3.3 -3.0 -3.0
Public debt 27.3 30.1 35.9 36.9 37.3 38.3 39.8
Domestic debt 6.3 8.0 11.0 11.0 12.5 13.4 14.3
Selected monetary accounts Annual percentage change, unless otherwise indicated
Credit to the government 0.8 1.6 10.4 3.6 14.5 2.9 …
Credit to the economy 12.4 14.6 13.7 9.5 9.8 9.9 ….
Broad money (M2) 7.1 13.2 7.3 7.4 16.0 8.3 ….
Balance of payments Percent of GDP, unless otherwise indicated
Current account balance -4.7 -5.3 -7.2 -6.2 -6.9 -6.4 -6.2
Imports 38.0 39.6 40.3 39.0 37.8 36.7 35.7
Exports 22.5 24.0 23.4 23.2 21.8 21.1 20.6
Foreign direct investment 1.0 0.9 0.9 0.9 0.9 0.8 0.9
External debt 21.0 22.1 24.9 25.8 24.8 24.9 25.5
Terms of trade 5.5 18.6 15.5 -0.1 -3.5 2.2 1.2
Other memo items
GDP nominal in US$ (billions) 14.4 13.1 14.1 15.1 16.0 17.0 18.0
Source: Ministry of Finance, IMF and Bank staff estimates (2014–2017) and projections (2018–2020)
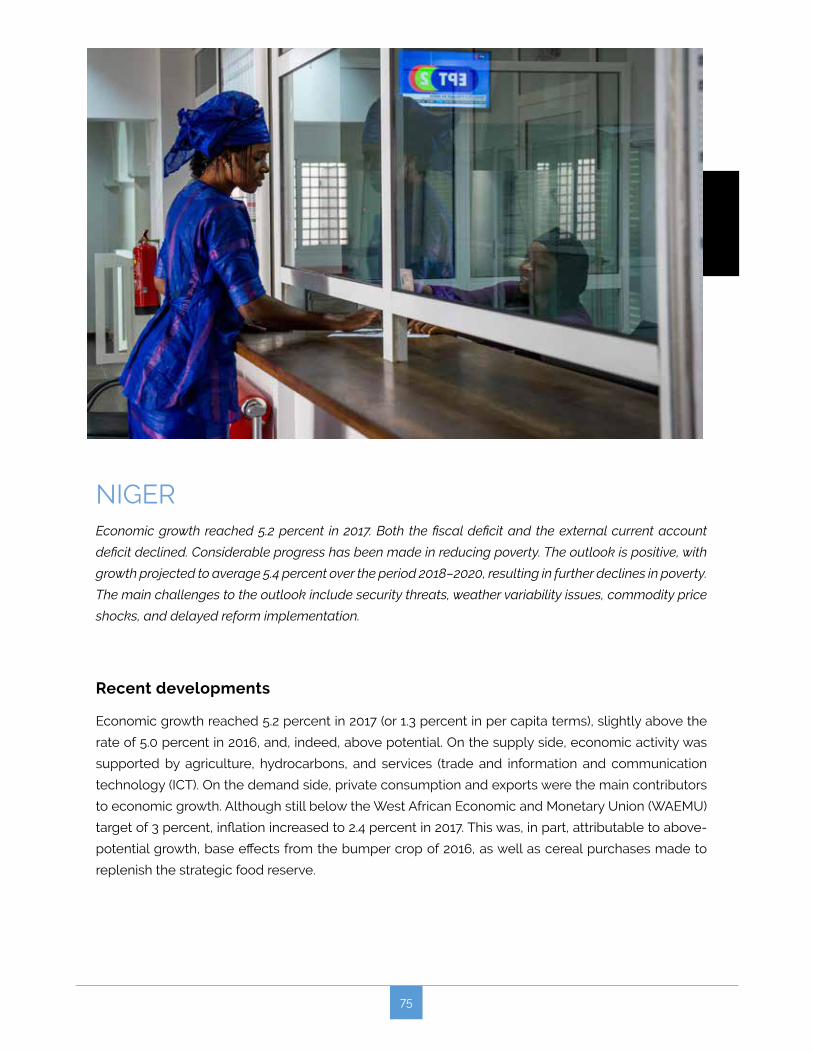
75
NIGEREconomic growth reached 5.2 percent in 2017. Both the fiscal deficit and the external current account
deficit declined. Considerable progress has been made in reducing poverty. The outlook is positive, with
growth projected to average 5.4 percent over the period 2018–2020, resulting in further declines in poverty.
The main challenges to the outlook include security threats, weather variability issues, commodity price
shocks, and delayed reform implementation.
Recent developments
Economic growth reached 5.2 percent in 2017 (or 1.3 percent in per capita terms), slightly above the
rate of 5.0 percent in 2016, and, indeed, above potential. On the supply side, economic activity was
supported by agriculture, hydrocarbons, and services (trade and information and communication
technology (ICT). On the demand side, private consumption and exports were the main contributors
to economic growth. Although still below the West African Economic and Monetary Union (WAEMU)
target of 3 percent, inflation increased to 2.4 percent in 2017. This was, in part, attributable to above-
potential growth, base effects from the bumper crop of 2016, as well as cereal purchases made to
replenish the strategic food reserve.
76
The external current account deficit (including grants) narrowed from 15.5 percent of GDP in 2016
to 13.2 percent in 2017. Oil exports rebounded due to volume and price effects, and capital imports
declined. In 2017, the external current account deficit was financed by capital grants, project loans,
and foreign direct investment (FDI), with each contributing by about one-third.
The fiscal deficit (including grants) narrowed to 5.1 percent of GDP in 2017, down from 6.1 percent in
2016, mainly thanks to an increase in grants. Tax revenues declined by 0.7 percent of GDP due to the
temporary absence of key administrative personnel and low collection of tax arrears. Both grants
and non-tax revenues measured as a share of GDP increased by 1.1 and 0.4 percent, respectively.
Expenditures fell by 0.2 percent of GDP, driven by a reduction in recurrent expenditures. Public debt
increased from 46.7 percent of GDP in 2016 to 48.0 percent in 2017. In this context, the risk of external
debt distress remains moderate.
Niger’s monetary and exchange rate policies are managed at the regional level by the Central Bank
of West African States (BCEAO), which maintains a fixed peg exchange rate between the CFA franc
and the euro. Monetary policy was tightened in December 2016 when the BCEAO raised the marginal
lending facility rate from 3.5 to 4.5 percent. This helped ease pressures on international reserves and
supported interbank market activity. However, in April 2017, the policy stance was loosened somewhat
as the reserve requirement ratio was reduced from 5 to 3 percent to ease liquidity constraints in
the banking sector. Niger’s international reserves were at 4 months of imports by the end of 2017.
Continued fiscal consolidation among member countries is needed to support regional reserves.
Niger has made significant progress in reducing poverty. Between 2005 and 2014, poverty fell from
about 50.3 to 45.7 percent of the population (using the international poverty line of US$1.90 per day).
However, an examination of the incidence of growth over the same period reveals that the increase in
per capita GDP was associated with an increase in income inequality. The shared prosperity premium
(the difference between growth in the incomes of the bottom 40 percent and growth in mean income)
was positive, beit very small at 0.5 percentage points, or an extra US$0.39. In this regard, the overall
population gained an extra US$0.73.
Outlook
The economic outlook is positive. The economy is expected to grow by 5.4 percent between
2018 and 2020. Growth will be supported by reforms and investments in the agriculture,
energy, oil and telecommunications sectors. Anchored in the regional monetary policy and
aided by a positive agricultural output, inflation should remain below the WAEMU target of
3 percent. The external current account deficit is projected to average 17.0 percent of GDP in
2018–2020 as a result of strong imports related to donor projects and the construction of an
oil pipeline. The deficit should be largely financed by FDI, capital grants, and project loans.
Domestic revenue mobilization and expenditure rationalization should help gradually lower

77
the fiscal deficit to within the regional target of 3 percent of GDP. Using the international poverty
line of US$1.90 per day in purchasing power parity (PPP) terms, poverty is expected to decline
by 3 percentage points over the period 2018–2020.
Risks and Challenges
Downside risks to the economic outlook prevail in Niger. The economy remains vulnerable to
increased security threats, delayed recovery of the Nigerian economy, and adverse commodity price
shocks. Delayed donors’ project implementation could also adversely impact medium-term growth.
Failure to raise tax revenues could damage fiscal and debt sustainability. Meanwhile, high fertility
and gender inequality remains a challenge, with high fertility associated with large families, high
dependency ratios, and low levels of education, all of which are positively associated with poverty.
On the upside, strong reform momentum and donor support could set a virtuous circle of private
sector development in motion.
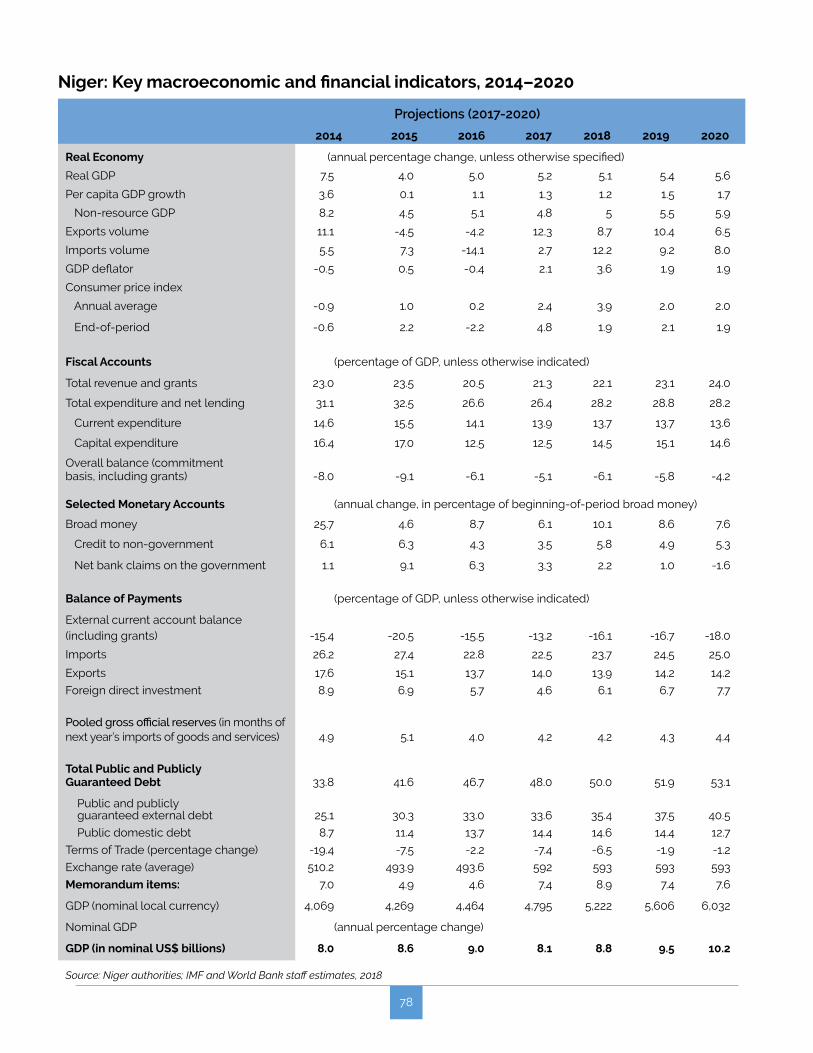
78
Niger: Key macroeconomic and financial indicators, 2014–2020
Projections (2017-2020)
2014 2015 2016 2017 2018 2019 2020
Real Economy (annual percentage change, unless otherwise specified)
Real GDP 7.5 4.0 5.0 5.2 5.1 5.4 5.6
Per capita GDP growth 3.6 0.1 1.1 1.3 1.2 1.5 1.7
Non-resource GDP 8.2 4.5 5.1 4.8 5 5.5 5.9
Exports volume 11.1 -4.5 -4.2 12.3 8.7 10.4 6.5
Imports volume 5.5 7.3 -14.1 2.7 12.2 9.2 8.0
GDP deflator -0.5 0.5 -0.4 2.1 3.6 1.9 1.9
Consumer price index
Annual average -0.9 1.0 0.2 2.4 3.9 2.0 2.0
End-of-period -0.6 2.2 -2.2 4.8 1.9 2.1 1.9
Fiscal Accounts (percentage of GDP, unless otherwise indicated)
Total revenue and grants 23.0 23.5 20.5 21.3 22.1 23.1 24.0
Total expenditure and net lending 31.1 32.5 26.6 26.4 28.2 28.8 28.2
Current expenditure 14.6 15.5 14.1 13.9 13.7 13.7 13.6
Capital expenditure 16.4 17.0 12.5 12.5 14.5 15.1 14.6
Overall balance (commitment basis, including grants) -8.0 -9.1 -6.1 -5.1 -6.1 -5.8 -4.2
Selected Monetary Accounts (annual change, in percentage of beginning-of-period broad money)
Broad money 25.7 4.6 8.7 6.1 10.1 8.6 7.6
Credit to non-government 6.1 6.3 4.3 3.5 5.8 4.9 5.3
Net bank claims on the government 1.1 9.1 6.3 3.3 2.2 1.0 -1.6
Balance of Payments (percentage of GDP, unless otherwise indicated)
External current account balance(including grants) -15.4 -20.5 -15.5 -13.2 -16.1 -16.7 -18.0
Imports 26.2 27.4 22.8 22.5 23.7 24.5 25.0
Exports 17.6 15.1 13.7 14.0 13.9 14.2 14.2
Foreign direct investment 8.9 6.9 5.7 4.6 6.1 6.7 7.7
Pooled gross official reserves (in months of next year’s imports of goods and services) 4.9 5.1 4.0 4.2 4.2 4.3 4.4
Total Public and Publicly Guaranteed Debt 33.8 41.6 46.7 48.0 50.0 51.9 53.1
Public and publicly guaranteed external debt 25.1 30.3 33.0 33.6 35.4 37.5 40.5
Public domestic debt 8.7 11.4 13.7 14.4 14.6 14.4 12.7
Terms of Trade (percentage change) -19.4 -7.5 -2.2 -7.4 -6.5 -1.9 -1.2
Exchange rate (average) 510.2 493.9 493.6 592 593 593 593
Memorandum items: 7.0 4.9 4.6 7.4 8.9 7.4 7.6
GDP (nominal local currency) 4,069 4,269 4,464 4,795 5,222 5,606 6,032
Nominal GDP (annual percentage change)
GDP (in nominal US$ billions) 8.0 8.6 9.0 8.1 8.8 9.5 10.2
Source: Niger authorities; IMF and World Bank staff estimates, 2018
TheCHALLENGESURBANIZATION in West Africa
of
COUNTRY FOCUS: GUINEA
SPRING 2018


![Desertification in the Sahel - Vanderbilt University€¦ · Desertification in the Sahel 9/4/2015 1:33:22 PM] Map of the sahel in north Africa](https://img.pdfslide.us/doc/110x75/602cf1f134913e1a72530cc6/desertification-in-the-sahel-vanderbilt-university-desertification-in-the-sahel.jpg)