Embed Size (px)
Citation preview

Understanding the Changing Religious
Landscape of China
Shuming BaoChina Data Center
University of Michigan
New Information - New Technology - New Directions

Questions How the religious landscape of China will look like in 20, 50
or 100 years?
What impacts of religious structures on regional landscape?
What impact of urbanization on religious landscape?
Is there a crowding out effect between different religions?
What impact of international investments and trade on
religious landscape?
What impact of inter-region migration on religious
landscape?
What are the spatial patterns and trends of different
religious denominations?
How the religious development interact with other
socioeconomic development?

Buddhism1949-2004
Islam1949-2004
Christian1949-2004
The Changing Religious Landscape of China

Why Spatial?
What are the spatial patterns of data?
What are the spatial trends over the time?
What are spatial interactions between different
aspects of the society over the time and space?
What are the potential impacts of proposed actions on
our complex systems?

Methodology
Exploratory Data Analysis (descriptive reports, charts,
histogram, scatterplot, ….)
Exploratory Spatial Data Analysis (spatial visualization,
Moran I, LISA, .…)
Statistical Analysis (statistical modeling, estimates,
predictions, ….)
Space-Time Analysis (space-time modeling,
animation ,…)

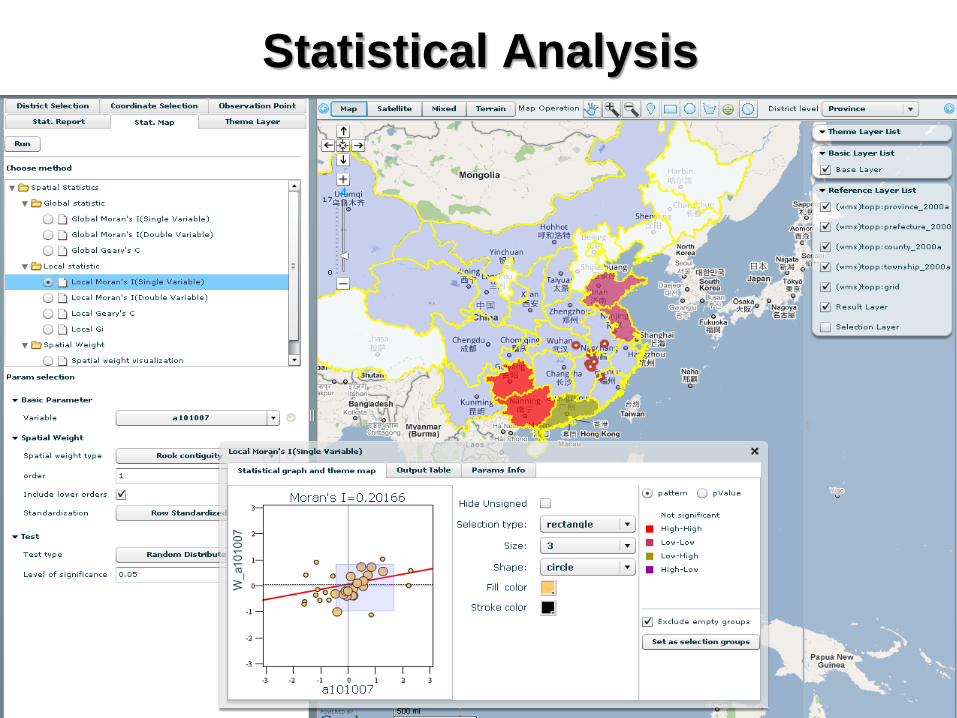
Exploratory Spatial Data Analysis
Tests for spatial patterns of the data
Tests for spatial autocorrelation
Identifying outliers over the space
Identifying spatial trends
o Moran I test for spatial autocorrelation:
o LISA tests for spatial associations:
Local Moran: Local Geary:
o Variogram test for spatial stationarity and nonstationarity (variogram,
covariogram, correlogram, boxplots, trend model, and statistic graphics)
n
i
n
ij
ij
n
i
n
ij
jiij
wS
xxxxw
dI2
))((
)(
n
ijj
jijii ZdZdI,
)(*
n
ijj
jiiji ZZddC,
2)()(*
2'
1
)]()([|)(|2
1)( i
N
i
i
k
k xzxzhN
hk

Statistical Analysis
A simple regression model:
A simple spatial autoregressive model:
A General Form of Spatial Process Model:
where W1 and W2 are spatial weight matrices, ~ N(0,).
y W y X 1 2W
Xy
Wyy
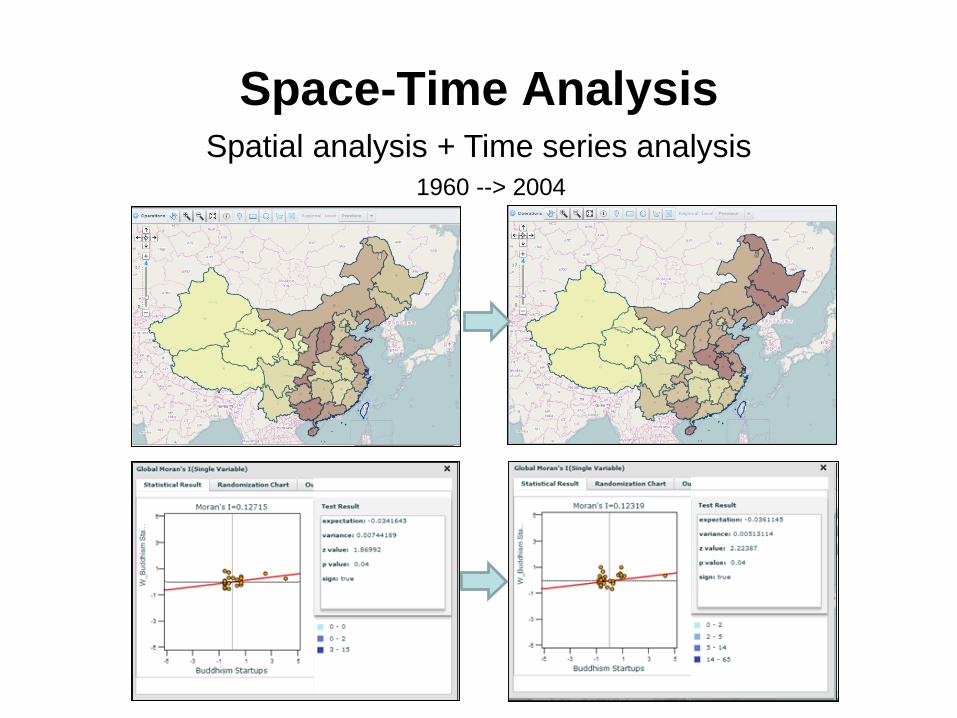
Space-Time AnalysisSpatial analysis + Time series analysis
1960 --> 2004

Data: ChinaS
q K
m G
rid
Pre
fec
ture
Pro
vin
ce
Co
un
tyT
ow
ns
hip
Government Statistics
o Provincial Statistics (1949 - )
o City Statistics (1996 - )
o County Statistics (1997 - )
Population Census
o Census 1953 (GRID)
o Census 1964 (GRID)
o Census 1982 (GRID)
o Census 1990 (GRID)
o Census 2000 (province, city, county, township, GRID)
Economic Census
o Industrial Census 1995 (province, city, county, ZIP)
o Basic Unit Census 2001 (province, city, county, ZIP)
o Economic Census 2004 (province, city, county, ZIP)
Establishments (individual companies and organizations)
o Industrial Census(1995)
o Basic Unit Census (2001)
o Economic Census (2004)
Geography and Environment
o Land Use data (GRID)
o Night-Time data (GRID)
o Transportation (railway, highway, roads)
o Rivers and Lakes
o ….
ZIP

China & US Geo-Explorer
An Integration of Spatial Data and Analysis for China Studies
Statistics
GIS
Census
Charts
Maps
Tables
Reports
Data Output

Spatial Explorer of ReligionSpatial Intelligence for Space-Time Data Integration and Analysis
PySAL StatGeo
Modeling
Religious Sites::
- Buddhism
- Taoism
- Christianity
- Muslim
- others
Population Census Data
Economic Census Data
Historical Data
Reference Data
Changes in religious structure

Why Religion?
Fundamental component of cultural gene
Available data
Funding support

Functions
Report Analysis
Site Analysis
Location Analysis
Trend Analysis
Statistical Analysis
Space-Time Analysis
Graphic Analysis
Map Visualization
GIS
Statistical
Analysis
Spatial
Analysis
ESDA

Report Analysis
Select by administrative units
Select by map

Site Analysis

Location Analysis

Trend Analysis

Structural Analysis

Graphic Analysis
Statistical Analysis
Space-Time Analysis
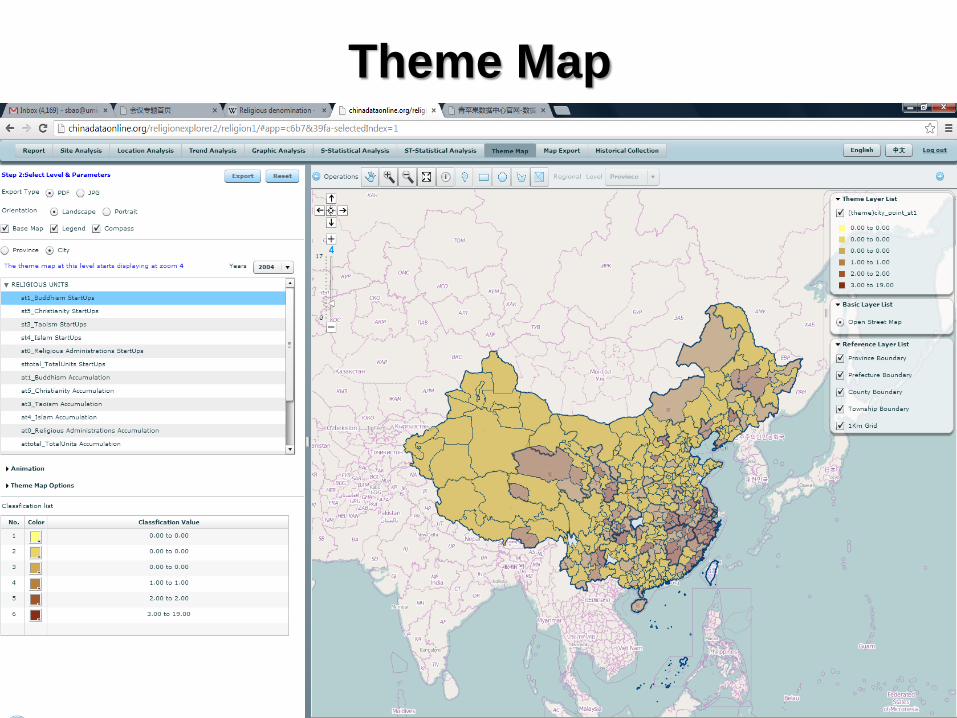
Theme Map

Data Export (HTM, PDF, EXCEL, WORD)
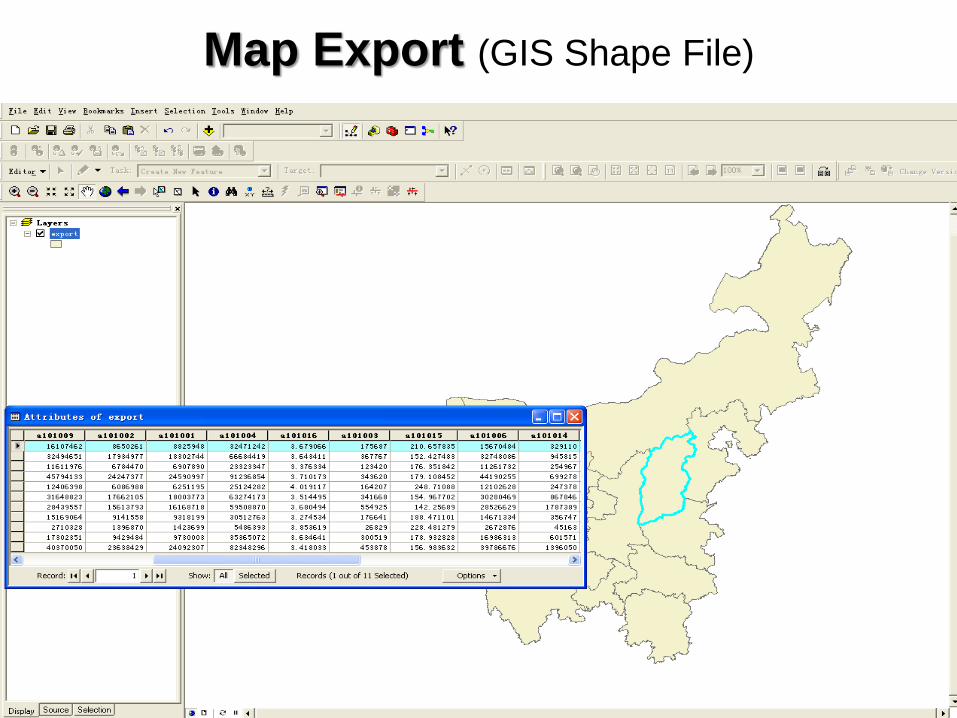
Map Export (GIS Shape File)

Case Studies
Spatial Religion and Economic Growth
Spatial Religion and Urbanization
Spatial Religion and International Trade
Spatial Religion and Migration
Spatial Religion and Culture

Tests of Crowding Out Effects between Religions
_
_
_
+
+ +

Religious Structure and Economic Growth
Literature: Polarization of religion has positive impact on economic growth
Test: What is the impact of religious diversity on regional growth?
References:
• Barro (1999) and Sala-i-Martinet al. (2004), Noland (2005)
• Barro and McCleary (2003): Herfindahl indexes
• Montalvo and Reynal-Querol (2002)
• Montalvo and Reynal-Querol (2003)
• Eum (2011)
The Measurements of Religious Polarization:


Test of the impact of religious polarization on per capita GDP
(1) (2) (3) (4)
lnrpgdp lnrpgdp lnrpgdp lnrpgdp
lnfra 0.713*** 0.545*** 0.569*** -0.472**
(7.46) (4.40) (3.92) (-2.48)
-0.0074 -0.0020 -0.0106 0.0223
(-0.58) (-0.11) (-0.53) (1.50)
lnpol -0.576*** -0.251 -1.058*** 2.037***
(-3.63) (-1.51) (-3.89) (4.76)
lnedu -0.496*** 0.0169 0.268 -0.344**
(-3.63) (0.07) (1.43) (-2.29)
lncap 0.0356 0.241*** 0.0336 0.132***
(1.28) (5.83) (1.10) (2.87)
lnpub -0.0777* -0.249*** 0.150*** -0.120*
(-1.88) (-4.73) (2.69) (-1.83)
_cons 7.558*** 6.923*** 6.348*** 7.106***
(28.96) (15.81) (16.32) (23.88)
N 516 192 144 180
0.974 0.986 0.994 0.983

Religious Development and Urbanization
Literature: Urbanization may have negative impact on religious development
Test: Where are mostly dynamic changes in religious sites located: urban,
rural or transition areas?
0.00
10.00
20.00
30.00
40.00
50.00
60.00
70.00
80.00
1980 1981 1982 1983 1984 1985 1986 1987 1988 1989 1990 1991 1992 1993 1994 1995 1996 1997 1998 1999 2000 2001 2002 2003 2004
The Changes of Religious Structure in Urban, Rural and Transitional Areas: 1980-2004
城市化成熟地区 快速城市化地区 城市化初期地区
Rural
Transitional Area
Urban

Defining Urban, Rural and Transitional Areas
Urban Area: Non-agricultural population > 50%
Transition Area: Non-agricultural population < 50% and Migration > 20%
Rural Area: Non-agricultural population < 50% and Migration < 20%

Buddhism & Urbanization
Start-ups
Percentage by
urban, rural and
transition areas
Accumulation
Urban
Rural
Start-ups
Percentage by
urban, rural and
transition areas
Accumulation
Urban
Rural
Christianity & Urbanization

Islam & Urbanization
Start-ups
Percentage by
urban, rural and
transition areas
Accumulation
Urban
Rural
Start-ups
Percentage by
urban, rural and
transition areas
Accumulation
Transition
Daoism & Urbanization

Christianity in Western China
Inner Mongolia
Ningxia
Xinjiang
Transition
Urban
Rural
Transition
Urban
Rural
Transition
Urban
Rural
Christianity in Central China
Transition
Urban
Rural
Transition
Urban
Rural
Transition
Urban
Rural
Hubei
Jiangxi
Hunan

Zhejiang
Shandong
Jiangsu
Transition
Urban
Rural
Transition
Urban
Rural
Transition
Urban
Rural
Christianity in Eastern China
Guangdong
Guangxi
Yunnan
Transition
Urban
Rural
Transition
Urban
Rural
Transition
Urban
Rural
Christianity in Southern China

Religion and International Trade
Literature: International trade help spread religion
Test: The impact of international trade on religious distribution and growth

Spatial Patterns Analysis of Religious Denominations
Literature: The spatial-temporal process can be identified with the spatial
frequency of family names
Test: The spatial process of different religions with the family names of
Temple abbot.

Discussion and Summary
Positive impact of balance religious structure
on regional development
Positive correlations between Buddhism,
Daoism and Christianity; and negative
correlation with Islam.
Positive correlation between Christianity and
International trade in western China
Dynamic growth of Christianity in rural areas.

Online Demonstrations:
China Geo-Explorerhttp://chinadataonline.org/cge
US Geo-Explorer http://chinadataonline.org/uge
Spatial Explorer of Religionhttp://chinadataonline.org/religionexplorer3