Embed Size (px)
Citation preview

99 Tricks and Traps
for
Microsoft® Project
2013 and 2016
The Casual User’s “Survival Guide”
By
Paul E Harris
of
Eastwood Harris Pty Ltd
Sample
Boo
k two c
hapte
rs on
ly

ii © Eastwood Harris
©Copyright 2016 by Eastwood Harris Pty Ltd. No part of this publication may be reproduced or used in any form or by any method without the written permission of the author.
Windows, XP, Microsoft® Project 2000, Microsoft® Project Standard 2003, Microsoft® P33roject Professional 2003, Microsoft® Project Standard 2007, Microsoft® Project Professional 2007, Microsoft® Project Standard 2010, Microsoft® Project Professional 2010, Microsoft® Project Standard 2013, Microsoft® Project Professional 2013, Microsoft® Project Standard 2016, Microsoft® Project Professional 2016, PowerPoint, Word, Visio and Excel are registered trademarks of Microsoft Corporation.
Adobe® and Acrobat® are registered trademarks of Adobe Systems Incorporated.
All other company or product names may be trademarks of their respective owners.
Screen captures were reprinted with authorization from Microsoft Corporation.
This publication was created by Eastwood Harris Pty Ltd and is not a product of Microsoft Corporation.
DISCLAIMER
The information contained in this book is to the best of the author’s knowledge true and correct. The author has made every effort to ensure accuracy of this publication, but cannot be held responsible for any loss or damage arising from any information in this book.
AUTHOR AND PUBLISHER
Paul E Harris Eastwood Harris Pty Ltd PO Box 4032 Doncaster Heights 3109 Victoria Australia
http://www.eh.com.au
Tel: +61 (0)4 1118 7701
Please send any comments on this publication to the author.
I would like to thank Jesica Paula Yabo for her assistance in updating this book from Microsoft Project 2007 and Martin Vaughn for proof reading and valuable suggestions.
ISBN: 978-1-925185-33-1 Paperback
ISBN: 978-1-925185-34-8 eBook
29 February 2016
Sample
Boo
k two c
hapte
rs on
ly

iii © Eastwood Harris
CURRENT BOOKS PUBLISHED BY EASTWOOD HARRIS 99 Tricks and Traps for Microsoft Office Project - Including Microsoft Project 2000 to 2007
Planning Using Primavera Project Planner P3 Version 3.1 - Revised 2006
Planning Using Primavera SureTrak Project Manager Version 3.0 - Revised 2006
Project Planning and Scheduling Using Primavera Contractor Version 6.1 - Including Versions 4.1, 5.0 and 6.1
Planning and Scheduling Using Microsoft Office Project 2007 - Including Microsoft Project 2000 to 2003 - Revised 2009
Planning and Control Using Microsoft Project and PMBOK® Guide Fourth Edition
Planning and Control Using Microsoft Project 2010 and PMBOK® Guide Fourth Edition
Project Planning & Control Using Primavera P6 Version 7 - For all industries including Versions 4 to 7 Updated 2012
Planning and Scheduling Using Microsoft Project 2010 - Updated 2013 Including Revised Workshops
Planning and Control Using Microsoft Project 2010 & PMBOK® Guide Fifth Edition
Planning and Control Using Microsoft Project 2013
Planning and Control Using Microsoft Project 2013 & PMBOK® Guide Fifth Edition
Planning and Control Using Microsoft Project 2013
Planning and Control Using Microsoft Project 2013 or 2016 & PMBOK® Guide Fifth Edition
Planning and Control Using Oracle Primavera P6 - Versions 8.2 & 8.3 EPPM Web
99 Tricks and Traps for Microsoft Project 2013 and 2016
Oracle Primavera P6 Version 8 and 15 EPPM Web Administrators Guide
Planning and Control Using Oracle Primavera P6 Versions 8.1 to 15.2 PPM Professional
Planificación y Control Usando Oracle Primavera P6 Versiones 8.1 a 15.1 PPM Profesional
规划和控制Oracle Primavera P6 应用 版本 8.1-15.1 PPM 专业版
Planning and Control Using Oracle Primavera P6 - Versions 8.2 to 15.1 EPPM Web Sample
Boo
k two c
hapte
rs on
ly

iv © Eastwood Harris
SERVICES OFFERED BY EASTWOOD HARRIS PTY LTD
Eastwood Harris specializes in setting up and running project controls systems with a focus on Primavera Systems and Microsoft Project software; we offer the following services:
Project Planning and Scheduling Training Courses using Oracle Primavera P6 and Microsoft Office Project
Eastwood Harris offers one-to-one training to get your new schedulers up and running quickly, without the delay of waiting for the next course and at the same time building up your own project schedule.
We also run in-house training courses on any of these software packages. This is a very cost efficient method of training your personnel.
We are able to assist you in setting up a scheduling environment. This includes designing coding structures, writing procedures, training and other implementation processes.
Eastwood Harris can write specialized training material that will incorporate your organization’s methodology into the Eastwood Harris training manuals and develop student workshops tailored to your requirements. Project personnel will be able to use these books as reference books after the course.
Selection and Implementation of Project Management Systems
Eastwood Harris will assist you by conducting an internal review of your requirements and match this requirement analysis against the functionality of packaged software.
We are then able to assist you in the implementation of these systems, including writing policies and procedures and training personnel, to ensure a smooth transition to your new system.
Dispute Resolution
Eastwood Harris is able to analyze your subcontractor’s schedules in the event of claims and provide you with a clear picture of the schedule in relation to the claim.
Schedule Conversion
Eastwood Harris is able to convert your schedules from one software package to another. The conversion of schedules is often time consuming, so let us do it for you.
Please contact the author for more information on these services.
Sample
Boo
k two c
hapte
rs on
ly
v © Eastwood Harris
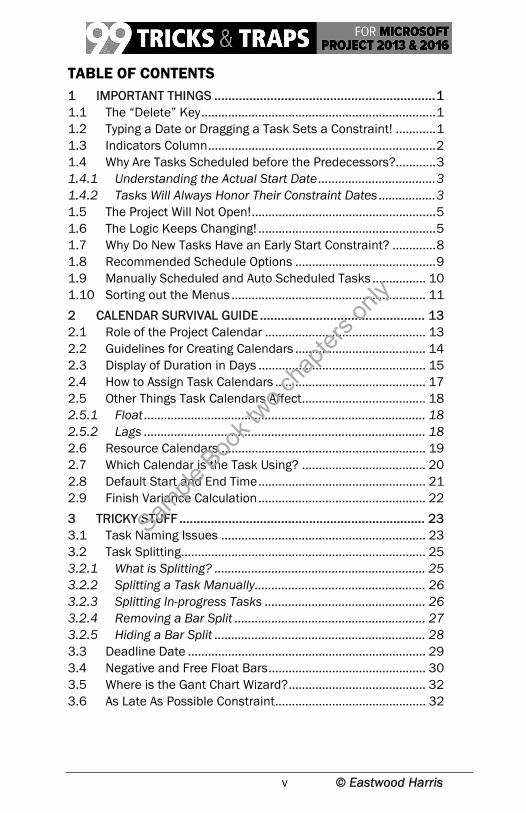
TABLE OF CONTENTS 1 IMPORTANT THINGS ............................................................... 1 1.1 The “Delete” Key ...................................................................... 1 1.2 Typing a Date or Dragging a Task Sets a Constraint! ............ 1 1.3 Indicators Column .................................................................... 2 1.4 Why Are Tasks Scheduled before the Predecessors?............ 3 1.4.1 Understanding the Actual Start Date ................................... 3 1.4.2 Tasks Will Always Honor Their Constraint Dates ................. 3 1.5 The Project Will Not Open! ....................................................... 5 1.6 The Logic Keeps Changing! ..................................................... 5 1.7 Why Do New Tasks Have an Early Start Constraint? ............. 8 1.8 Recommended Schedule Options .......................................... 9 1.9 Manually Scheduled and Auto Scheduled Tasks ................ 10 1.10 Sorting out the Menus .......................................................... 11 2 CALENDAR SURVIVAL GUIDE ............................................... 13 2.1 Role of the Project Calendar ................................................ 13 2.2 Guidelines for Creating Calendars ....................................... 14 2.3 Display of Duration in Days .................................................. 15 2.4 How to Assign Task Calendars ............................................. 17 2.5 Other Things Task Calendars Affect ..................................... 18 2.5.1 Float .................................................................................... 18 2.5.2 Lags .................................................................................... 18 2.6 Resource Calendars ............................................................. 19 2.7 Which Calendar is the Task Using? ..................................... 20 2.8 Default Start and End Time .................................................. 21 2.9 Finish Variance Calculation .................................................. 22 3 TRICKY STUFF ...................................................................... 23 3.1 Task Naming Issues ............................................................. 23 3.2 Task Splitting ......................................................................... 25 3.2.1 What is Splitting? ............................................................... 25 3.2.2 Splitting a Task Manually ................................................... 26 3.2.3 Splitting In-progress Tasks ................................................ 26 3.2.4 Removing a Bar Split ......................................................... 27 3.2.5 Hiding a Bar Split ............................................................... 28 3.3 Deadline Date ....................................................................... 29 3.4 Negative and Free Float Bars ............................................... 30 3.5 Where is the Gant Chart Wizard? ......................................... 32 3.6 As Late As Possible Constraint ............................................. 32
Sample
Boo
k two c
hapte
rs on
ly

vi © Eastwood Harris
4 INTERESTING FEATURES ..................................................... 34 4.1 Wildcard Filters for Text Searching....................................... 34 4.2 Interactive Filters................................................................... 35 4.3 AutoFilters .............................................................................. 35 4.4 Selecting Dates ..................................................................... 37 4.5 Understanding Start and Finish Milestones ........................ 37 4.6 Converting a Finish Milestone into a Start Milestone ......... 39 4.7 Creating a Hammock or a LEO Task .................................... 40 4.8 Elapsed Durations, Leads and Lags .................................... 41 4.8.1 Elapsed Durations .............................................................. 41 4.8.2 Float on Tasks with Elapsed Durations ............................. 41 4.8.3 Elapsed Leads and Lags .................................................... 42 4.9 Establishing Two Relationships between Two Tasks .......... 42 4.10 Ladder scheduling ................................................................. 43 4.11 % Lags .................................................................................... 44 4.12 Tracing Logic.......................................................................... 45 4.12.1 Task Drivers and Task Inspector ....................................... 45 4.12.2 Tracing the Logic ................................................................ 47 4.12.3 Task Path ............................................................................ 48 5 MAKING IT LOOK RIGHT....................................................... 49 5.1 Date Format Dangers ............................................................ 49 5.2 Preventing the Date Format from Changing on
Other Computers ................................................................... 50 5.3 The Smart Way to Create Views ........................................... 51 5.4 Bar Formatting ...................................................................... 52 5.4.1 Bar Date Format ................................................................. 52 5.4.2 Bar Heights ......................................................................... 53 5.4.3 Always Roll Up Gantt Bars ................................................. 53 5.4.4 Round Bars to Whole Days ................................................ 54 5.5 Putting Text on Bars .............................................................. 55 5.6 Format Colors ........................................................................ 55 5.7 How to Stop Text Wrapping ................................................... 56 5.8 Display Tasks without Successors as Critical ...................... 57 5.9 Preventing Descriptions from Indenting .............................. 58 5.10 Reducing Column Widths ..................................................... 59 5.11 How to Display a Task ID that Will Not Change ................... 60 5.12 Hiding Task Information ........................................................ 61 5.12.1 Hiding Bars ......................................................................... 61 5.12.2 Hiding Text .......................................................................... 61 5.12.3 Marking Tasks Inactive ...................................................... 61 5.13 Anchor a Vertical Line to a Milestone .................................. 62 5.14 Zoom Slider Dangers............................................................. 63
Sample
Boo
k two c
hapte
rs on
ly

vii © Eastwood Harris
5.15 Why is the Non-working Time Displayed Incorrectly? ......... 64 5.16 Displaying an S-Curve ........................................................... 65 5.17 Displaying Cumulative Histogram ........................................ 66 5.18 Displaying a Project Summary Task ..................................... 66 6 GETTING IT OUT - PRINTING ................................................ 67 6.1 Printing to One Page Wide .................................................... 67 6.2 Printing a Date Range ........................................................... 68 6.3 Printing a Gantt Chart and Resource Graph or
Usage Table on One Page .................................................... 69 6.4 Printing the Calendar ............................................................ 69 6.5 Hiding Unwanted Bars in the Legend .................................. 70 6.6 What has Happened to the Manual Page Breaks? ............. 70 7 RESOURCE BASICS .............................................................. 71 7.1 How Many Resources Should I Have? ................................. 71 7.2 The Balance Between the Number of Activities
and Resources ...................................................................... 72 7.3 Durations and Assignments Change as Resources
are Assigned .......................................................................... 73 7.3.1 Task Type – Fixed Duration, Fixed Units, Fixed Work ...... 73 7.3.2 Effort driven or Non Effort driven? .................................... 75 7.3.3 Task Type and Effort driven Options ................................. 76 7.4 Assigning Resources to Tasks .............................................. 77 7.5 Resources and Summary Tasks........................................... 77 8 UPDATING ESSENTIALS ....................................................... 78 8.1 Baselines and Updating a Project ........................................ 78 8.2 Which Baseline Should Be Used? ........................................ 79 8.3 Principles of Updating a Program ........................................ 80 8.4 In-progress Task Finish Date Calculation ............................ 81 8.5 Current Date and Status Date.............................................. 82 8.6 Auto Updating Using Update Project .................................... 83 8.7 Moving Incomplete Work into the Future by Splitting ......... 84 8.8 Where is the Tracking Toolbar?............................................ 85 8.9 Why Do Calculation Options – Move end of completed
parts Not Work? .................................................................... 87 8.10 Comparing Progress with Baseline ...................................... 89 8.11 Progress Lines ....................................................................... 89 8.12 Simple Procedure for Updating a Schedule –
Using Auto Status ................................................................. 90 8.13 Procedure for Detailed Updating .......................................... 92 8.14 Preparing to Update with Resources ................................... 94 8.15 Updating Resources.............................................................. 97
Sample
Boo
k two c
hapte
rs on
ly
viii © Eastwood Harris
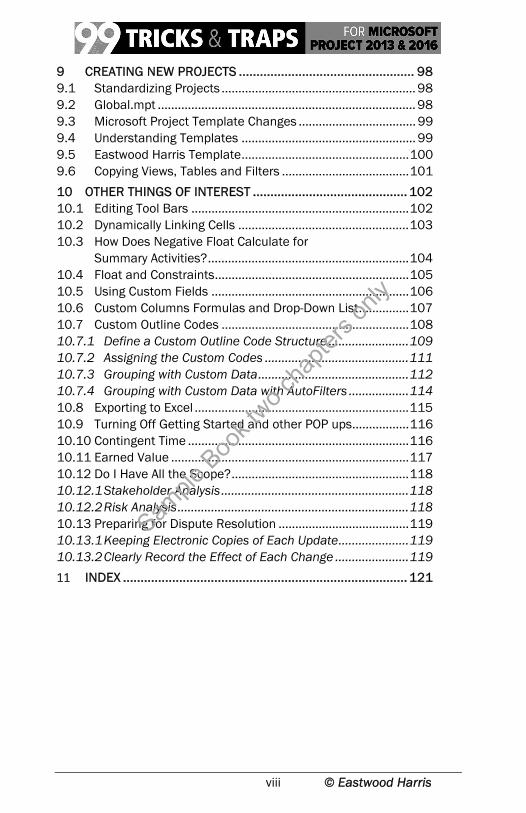
9 CREATING NEW PROJECTS .................................................. 98 9.1 Standardizing Projects .......................................................... 98 9.2 Global.mpt ............................................................................. 98 9.3 Microsoft Project Template Changes ................................... 99 9.4 Understanding Templates .................................................... 99 9.5 Eastwood Harris Template .................................................. 100 9.6 Copying Views, Tables and Filters ...................................... 101 10 OTHER THINGS OF INTEREST ............................................ 102 10.1 Editing Tool Bars ................................................................. 102 10.2 Dynamically Linking Cells ................................................... 103 10.3 How Does Negative Float Calculate for
Summary Activities? ............................................................ 104 10.4 Float and Constraints .......................................................... 105 10.5 Using Custom Fields ........................................................... 106 10.6 Custom Columns Formulas and Drop-Down List ............... 107 10.7 Custom Outline Codes ........................................................ 108 10.7.1 Define a Custom Outline Code Structure ........................ 109 10.7.2 Assigning the Custom Codes ........................................... 111 10.7.3 Grouping with Custom Data ............................................. 112 10.7.4 Grouping with Custom Data with AutoFilters .................. 114 10.8 Exporting to Excel ................................................................ 115 10.9 Turning Off Getting Started and other POP ups ................. 116 10.10 Contingent Time .................................................................. 116 10.11 Earned Value ....................................................................... 117 10.12 Do I Have All the Scope? ..................................................... 118 10.12.1 Stakeholder Analysis ........................................................ 118 10.12.2 Risk Analysis ..................................................................... 118 10.13 Preparing for Dispute Resolution ....................................... 119 10.13.1 Keeping Electronic Copies of Each Update ..................... 119 10.13.2 Clearly Record the Effect of Each Change ...................... 119 11 INDEX ................................................................................. 121
Sample
Boo
k two c
hapte
rs on
ly

78 © Eastwood Harris
8 UPDATING ESSENTIALS
8.1 Baselines and Updating a Project After a schedule has been reviewed and approved, it should be baselined before it is updated for the first time. Setting the Baseline copies the Early Start and Early Finish, the Original Duration and each resource’s Costs and Work into Baseline fields.
A Microsoft Project Baseline is not a complete baseline because it does not record Constraints, Relationships, Float or the Critical Path.
Once the Baseline is set you will be able to update your plan and compare the progress with the original plan and be able to see:
If the planned progress has been achieved,
If the project is ahead or behind schedule, and
By how much in time and cost.
A Baseline is set by selecting PROJECT, Schedule group, Set Baseline.
There are a number of options and forms available to update project tasks after setting the Baseline.
Irrespective of which forms are used, there are two main methods to update a project:
Auto Status the schedule by allowing the software to automatically update the tasks, as if the project progressed exactly according to schedule. Then, if required, adjust tasks to reflect actual events and revisions, or
Update each task one by one.
Sample
Boo
k two c
hapte
rs on
ly

79 © Eastwood Harris
8.2 Which Baseline Should Be Used? After a project has progressed it may be necessary to set a new Baseline.
This may occur when the scope of a project has changed and a new baseline is required to measure progress against, but at the same time you may also want to keep a copy of the original baseline.
A new Baseline may be used to display the effect of scope changes on a plan by setting a Baseline, adding the scope change and comparing the revised schedule with the Baseline.
The Baseline data may be reviewed in some Views such as the Task Details Form, in columns and on the Bar Chart. You will be able to display the Baseline 1 to 10 and Interim Plan dates and durations in columns and as bars on the Gantt Chart but not in the forms. Baseline 1 to 10 also do not have variance columns.
Therefore, it is recommended that the current baseline be saved as the Baseline since the data is more accessible from the Baseline than Baseline 1 to 10. Previous baselines should be copied to Baselines 1 to 10 and preserved as a record.
Another benefit of using Baseline is that it has Variance Start, Variance Finish and Variance Duration columns that are not available with other Baselines, but may be calculated using a Calculated Field.
Note: The downside of using one of the Baselines 1 to 10 is that it is not possible to easily identify what the Baseline was set for as there is not inbuilt way of naming these baselines.
Sample
Boo
k two c
hapte
rs on
ly

80 © Eastwood Harris
8.3 Principles of Updating a Program Ideally, scheduling software has one current Data Date and the function of it is to:
Separate the completed parts of tasks from incomplete parts of tasks,
Calculate or record all costs and hours to date before the Data Date, and to forecast costs and hours to go after the Data Date,
Calculate the Finish Date of an in-progress task from the Data Date plus the Remaining Duration over the Task Calendar.
Therefore a properly updated Microsoft Project program the Status Date should be used as the Data Date:
Completed Tasks would have Actual Start and Actual Finish Dates in the past.
In progress tasks would have the Actual Start and Actual Duration in the past, and the Early Finish and Remaining Duration in the Future.
Unstarted tasks should be in the future.
In Microsoft Project is relatively simple to be in a situation where you have complete or in-progress tasks with start dates later than the Status Date, and/or incomplete or un-started tasks with a finish date earlier than the Status Date. This is an unrealistic situation, which is more difficult to achieve in other scheduling software packages. Care should be taken to avoid this situation and checks made after the schedule has been updated.
Sample
Boo
k two c
hapte
rs on
ly

81 © Eastwood Harris
Note: The Eastwood Harris template found at the www.eh.com.au website Software & Downloads page has a Tracking Table with an additional column showing what is required to do to ensure the tasks are correctly updated.
8.4 In-progress Task Finish Date Calculation Many planning and scheduling packages calculate a task Finish Date from the Data Date plus the Remaining Duration over the Task or Resource Calendar, whichever is applicable.
Unlike most planning and scheduling software packages, Microsoft Project ignores the Current Date and Status Date when calculating an in-progress task. It calculates a task Finish Date from the Actual Start Date plus the Duration and effectively ignores the Remaining Duration for normal progress calculation.
There is an in-built proportional link between Duration, % Complete, Actual Duration and Remaining Duration. It is not possible to unlink these fields (as in other scheduling software) and therefore not possible to enter the Remaining Duration independently of the % Complete.
Thus % Complete field is the % Duration of a task.
Sample
Boo
k two c
hapte
rs on
ly

82 © Eastwood Harris
8.5 Current Date and Status Date Microsoft Project has two project data date fields that may be displayed as vertical lines on the schedule. These dates may be edited from the PROJECT, Properties, Project Information form:
Current Date – This date is set to the computer’s date each time a project file is opened. It is used for calculating Earned Value data when a Status Date has not been set. The time of the Current Date is set by default to the start time of a day, see the picture below.
Status Date – This field is blank by default with a value of NA. The Status Date will not change when the project is saved and reopened at a later date. It overrides the Current Date for calculating Earned Value data and is set by default to the finish time of a day, see the picture below.
Note: It is recommend that the Status Date is set and displayed as a vertical line on a progressed schedule and the Current Date not displayed, because the Current Date represents the date today and does not normally represent any scheduling significance.
Sample
Boo
k two c
hapte
rs on
ly

102 © Eastwood Harris
10 OTHER THINGS OF INTEREST
10.1 Editing Tool Bars It is recommend you customize your menus by:
Firstly to allow more buttons to be displayed on the Quick Access Toolbar, right click on the Toolbar and select Show Quick Access Toolbar Below the Ribbon to move the Quick Access Toolbar below the Ribbon Toolbar.
Secondly it is recommend that you hide the Ribbon Toolbar by Right-clicking on the Ribbon Toolbar and display the Ribbon Toolbar Menu. Then click on Collapse the Ribbon to hide the Ribbon Toolbar. When you click in the Gantt Chart area the Ribbon will minimize and more work area will be available allowing you to see more tasks.
Thirdly it is recommend that you download the Microsoft Project Quick Access Toolbar from the www.eh.com.au website Software & Downloads page, unzip it by double clicking on the file and dragging it to your Desk top. Then import the toolbar using FILE, Options, Quick Access Toolbar, Import/Export. This has all the commonly used commands on the Quick Access Toolbar.
To do further editing to the Tool bar icons:
Right-Click in the toolbar area,
Select Customize the Ribbon…,
Select the All Commands option,
Drag icons onto the required tool bar, or
Drag icons off the toolbar to remove them.
Note: Unfortunately Microsoft Project 2016 has wide spacing between the Quick Access Toolbar and thus
Sample
Boo
k two c
hapte
rs on
ly

103 © Eastwood Harris
displays less buttons than Microsoft Project 2016 making the Quick Access Toolbar less useful.
10.2 Dynamically Linking Cells It is also possible to dynamically link data to other programs such as an Excel spreadsheet:
Copy the data from the spreadsheet,
Select the cell position in the table where the data is to be pasted in Microsoft Project,
Select Paste Special and then select the Paste Link and Text Data options,
The data will be pasted into the cell(s) and changes to linked cells in the spreadsheet or other program will be reflected in Microsoft Project.
The linked cell will have a little triangle in the bottom right-hand side:
Be careful when linking date fields as this may set an unwanted constraint.
When you reopen the project schedule at a later date you will be asked if you wish to refresh the data from the other application.
Delete or change the cell data to remove a link.
Double-click on the little triangle in the bottom right hand side of the cell to open the link.
It is also possible to link one or more cells in a schedule with another cell in the same schedule so a change in one cell will change all the other linked cell(s). Again use the Paste Link option.
Sample
Boo
k two c
hapte
rs on
ly

104 © Eastwood Harris
10.3 How Does Negative Float Calculate for Summary Activities?
The lowest value of the Total Float of incomplete tasks is adopted by the summary task, Sub Task 1 in the picture below and has adopted 3 days:
In the picture below, Task C is the latest task under Sub Task 1 and has Float, but Sub Task 1 has adopted zero float from Task D the lowest float value.
Sample
Boo
k two c
hapte
rs on
ly

105 © Eastwood Harris
Now the project has progressed and the task with zero float is complete. Sub Task 1 has 3 days’ Float:
10.4 Float and Constraints The following principles apply to constraints:
Early constraints operate on Early dates,
Late constraints operate on Late dates,
Start constraints operate on Start dates, and
Finish constraints operate on Finish dates.
The picture below demonstrates how constraints affect Total Float (Slack) calculations of tasks (without predecessors or successors) against the first task of 10 days duration.
Tasks 9 and 10 have a Deadline Date assigned which allows a second constraint to be applied to a task and operates like a Finish No Later Than constraint.
Sample
Boo
k two c
hapte
rs on
ly

106 © Eastwood Harris
The Late constraints reduce the amount of Total Float (Slack) a task has and may generate Negative Float.
The Must constraints act like an Early and Late constraint in one.
10.5 Using Custom Fields Select the PROJECT, Properties, Custom Fields to open the Custom Fields form. This function includes a number of predefined fields for both Task and Resources.
Task fields may be used for recording additional information about Tasks (such as responsibility, location, floor, system) and may be displayed in Task Views such as the Gantt Chart.
Resource fields may record information such as telephone number, address, office and skills and may be displayed in Resource Views such as the Resource Sheet.
The fields may be renamed. For example, the Task Text 1 field may be renamed “Responsibility” and the name of the person responsible for the task (this may not be the resource assigned to the task) placed in the Responsibility (Text 1) column.
A renamed field is then available in the Task Information or Resource Information Custom Fields tab.
Formulas may be created to populate the task fields with calculated data.
Tasks and Resources may be Grouped using Custom Fields.
These predefined fields fall into the following categories: Cost, Date, Duration, Finish (date), Flag, Number, Outline Code, Start (date) and Text.
Sample
Boo
k two c
hapte
rs on
ly

107 © Eastwood Harris
10.6 Custom Columns Formulas and Drop-Down List
The Custom Attributes section of the Custom Fields form is used to define Lookup lists and Formulas:
The option None allows data to be entered, without any restrictions, from either a column or the Task or Resource Information forms.
opens the Edit Lookup Table where a table of values and descriptions may be entered. The Value is displayed in columns and Description in bands when the tasks are grouped by this field. Data entry restrictions may be set here.
allows the assigning of formulas for the calculation of field values from other task and project fields.
The Calculation for task and group summary rows specifies how Summary Tasks calculate their values, such as Maximum, Minimum, Sum, None and Average:
Dates could be Minimum or Maximum, and
Cost would use Sum.
Calculation for assignment rows determines if the field value is displayed against the resource or the resource and assignment in Task Usage and Resource Usage fields.
Value to display allows the options of displaying the value in the cell or generating graphical indicators such as traffic lights.
Sample
Boo
k two c
hapte
rs on
ly

108 © Eastwood Harris
10.7 Custom Outline Codes There are ten hierarchical Task Custom Outline Codes and ten hierarchical Resource Custom Outline Codes that may be renamed to suit the project requirements.
Task Custom Outline Codes may be used for any hierarchical project breakdown structure, such as a PRINCE2 Product Breakdown Structure, Contract Breakdown Structure, Work Breakdown Structure and
Resource Custom Outline Codes may be used for organizational breakdown structures such as the hierarchy of authority, locations and departments.
The process to use this function has the following steps:
Define the new Outline Code structure,
Assign the codes to the tasks or resources, and
Create a Group to organize the tasks under the new Custom Outline Code structure.
Sample
Boo
k two c
hapte
rs on
ly

109 © Eastwood Harris
10.7.1 Define a Custom Outline Code Structure
Select the PROJECT, Properties, Custom Fields:
An Outline Code may be created for either Task or Resource data by clicking on the appropriate radio button under the title Field.
Select the Outline Code the drop-down box in top right hand side.
The function allows you to copy a code structure from another project in a method similar to Organizer.
The button opens a form to edit the name of the Outline Code.
The button in Microsoft Project 2013 and 2016 opens the Edit Look Up Table form for the selected Outline Code to create the Lookup table.
Define the Mask or code structure by clicking on the button at the top right-hand side in 2007-
2016, before entering the codes. This will open the Outline Code Definition form where the code structure is defined:
Each Level is assigned a number.
The Sequence defines the type of text that may be entered for the code: Numbers, Upper Case, Lower Case or Characters (text).
The Length specifies how many characters the Code Level may have: any, or a number between 1 and 10.
The Separator defines the character that separates each level in the structure.
Sample
Boo
k two c
hapte
rs on
ly

110 © Eastwood Harris
The picture displays 4 levels each using a different option for their code:
Click the button to return to the Edit Lookup
Table form where the Code Values and Descriptions are entered. The picture shows two levels for a Power Station Unit and Equipment:
Sample
Boo
k two c
hapte
rs on
ly

111 © Eastwood Harris
10.7.2 Assigning the Custom Codes
The codes are assigned by:
Displaying the appropriate column:
Or by opening the Task Information or Resource
Information form:
Sample
Boo
k two c
hapte
rs on
ly

112 © Eastwood Harris
10.7.3 Grouping with Custom Data
Grouping allows grouping of tasks under data items such as Customized fields, Durations, Constraints, etc. This function is useful to group related tasks that are spread throughout a project schedule.
The Grouping function works in a similar way to Filters and Tables. A predefined Group may be assigned by:
Selecting VIEW, Data, Group by: dropdown to open up a sub menu,
Then either:
Selecting a group from the list, or
Selecting More Groups… to open the More Groups form, clicking on the Task or Resource radio button, and then selecting one from the list, or
Note: Fields are sorted alphabetically when displayed on the screen so you may need to be careful with your Code Values and consider prefixing them with a number so they sort in the order you desire.
Sample
Boo
k two c
hapte
rs on
ly

113 © Eastwood Harris
To create a new Group:
Select VIEW, Data, Group by: dropdown, New Group By… to open the Group Definition form,
Now create a “Grouping” which may be reapplied at a later date or copy to another project using Organizer.
The Define Group Interval form is available with
additional Group By options for certain fields, such as Start or Finish. This allows further formatting by defining the intervals of the banding. For example all the tasks that start in a week or month may be banded together:
Sample
Boo
k two c
hapte
rs on
ly

114 © Eastwood Harris
The picture below shows a project Grouped by two text fields that have been renamed Systems and Building. Note the order of the Task IDs:
10.7.4 Grouping with Custom Data with AutoFilters
Grouping with one band may also be achieved by turning on the AutoFilter function by either:
Selecting VIEW, Data, Filter: and selecting Display AutoFilter at the bottom of the list, or add the
AutoFilter button to the Quick Assess toolbar and clicking on it.
There will now be a down arrow▼ in the column header,
Click on the column header to open the menu,
Click on Group by,
Depending on the data contained in the column you will be offered logical data options to group your tasks,
Sample
Boo
k two c
hapte
rs on
ly

115 © Eastwood Harris
The picture below displays the options when Grouping by Duration:
10.8 Exporting to Excel The Analysis toolbar is designed to export time-phased data to Excel in earlier versions of Microsoft Project is no longer available in Version 2010 and later.
The options to export to Excel are:
Select the data in Microsoft Project and Cut and Paste and you have the option of keeping or not keeping the formatting when Pasting.
Timescale data may be copied and pasted from the Resource Usage and Task Usage views but the date information must be manually added to the Excel Spreadsheet,
The REPORT, Export, Visual Reports export to Excel in Pivot Table format, so you will need to hone up on your Pivot Table skills to use this function.
The FILE, Save As, Excel format allows the mapping of specific fields to and from an Excel Spreadsheet. Maps made be set up and used to map data to and from Microsoft Project and Excel.
Sample
Boo
k two c
hapte
rs on
ly

116 © Eastwood Harris
10.9 Turning Off Getting Started and other POP ups
These guides often slow down experienced users as they have to be continually closed:
To prevent the pane titled Getting Started from appearing every time Microsoft Project is opened, select FILE, Options, General and uncheck the Show the start screen when this application starts box.
The Help suggestions offered by Microsoft project is often misleading, these should be switched off by selecting FILE, Options, Schedule and unchecking:
Show scheduling Messages,
Show task schedule warnings and
Show task schedule suggestions.
The select the Advanced tab and uncheck Advice from Planning Wizard.
10.10 Contingent Time This topic should be considered and Contingent Time may be included using a number of techniques:
Adding one or more tasks that may be reduced in duration to keep the project end date constant as the project progresses and incurs delays.
Increasing all task durations by a factor.
Making some calendar work days non work.
Sample
Boo
k two c
hapte
rs on
ly

117 © Eastwood Harris
10.11 Earned Value The method that Microsoft Project uses to calculate the Earned Value data is documented in the Help file and should be read carefully, as different versions of Microsoft calculate these fields differently. Should different Earned Value calculations be required then Custom Data Fields should be considered as an alternative.
The column calculations should be checked and you will see the way Microsoft Project calculates the values and you may disagree with their method.
You may wish to use Custom Fields or third party software to calculate these EV fields.
Sample
Boo
k two c
hapte
rs on
ly

118 © Eastwood Harris
10.12 Do I Have All the Scope? Many schedules are unrealistic or do not calculate a realistic Critical Path because the whole scope has not been entered into a schedule. There are a couple of techniques that may be employed to ensure the whole scope has been included:
Stakeholder Analysis, and
Risk Analysis.
10.12.1 Stakeholder Analysis
Many project managers conduct a Stakeholder Analysis at the start of a project. This process identifies all the people and organizations with an interest in the project and their interests.
You may use a stakeholder analysis to identify all the stakeholders and their associated activities. The activities must be included in the schedule.
Key project success factors may be identified from the interests of the most influential stakeholders.
The stakeholder analysis may be used as the basis of a communications plan.
10.12.2 Risk Analysis
The process of planning a project may identify risks and a formal risk analysis should be considered. A risk analysis may identify risk mitigation activities that should be added to the schedule before it is submitted for approval.
Sample
Boo
k two c
hapte
rs on
ly
119 © Eastwood Harris
10.13 Preparing for Dispute Resolution Dispute resolution is becoming more frequent. There are some steps that may be taken to prepare for this eventuality which should reduce the cost of this process.
10.13.1 Keeping Electronic Copies of Each Update
Each time you report to the client or management, it is recommended that you save a copy of your project and change the file name (perhaps by appending a date to the file name or using a revision or version number) or create a subdirectory for each version of the project. This allows you to reproduce these reports at any time in the future and an electronic copy will be available for dispute resolution purposes.
10.13.2 Clearly Record the Effect of Each Change
Each change should be clearly recorded. Consider if you should:
Create a copy of the schedule for each scope change analysis,
Set the Baseline before entering scope changes,
For clarity add new task/s for the scope changes and do not extend existing tasks,
Show delays as tasks, not as lags or constraints,
Ensure when the elapsed duration of the delay is required calculate this by placing a delay Milestone on a 7day per week calendar.
Sample
Boo
k two c
hapte
rs on
ly

120 © Eastwood Harris
Sample
Boo
k two c
hapte
rs on
ly

121 © Eastwood Harris
11 INDEX % Lags ............................................ 44 Actual costs are always calculated by
Microsoft Project? .............. 96, 97 Add Progress Line .......................... 86 Add space before label ............ 59, 67 Add to Quick Access Toolbar ......... 12 Always roll up Gantt bars ............... 53 Analysis toolbar .............................. 65 As Late As Possible Constraint ...... 32 Auto Scheduled .............................. 10 AutoFilters ...................................... 35 Autolink inserted or moved tasks 5, 9 Bars
Baseline................................... 89, 90 Format Style ................................... 30 Height ............................................. 53 Negative Float ................................ 31 Styles .............................................. 70 Text ................................................. 55
Baseline .......................................... 79 Calculate multiple critical paths .... 57 Calculated Filters ........................... 33 Calendar Non Work Days .................. 5 Calendar Task ................................ 17 Change Working Time .............. 14, 19 Change working time form ............ 21 Collapse the Ribbon… .................... 11 Colors Format ................................. 55 Concatenate ................................... 24 Contingent Time ........................... 116 Current Date ................................... 82 Custom Outline Codes ................. 108 Customize Fields Form ................ 106 Customize Quick Access Toolbar… 12 Customize the Ribbon…, .............. 102 Date
Format ..................................... 49, 52 On Bars ........................................... 52
Deadline Date ................................ 29 Default end time: ........................... 21 Default start time: .......................... 21 Default task type: ........................... 74 Define Group Interval form .......... 113 Delete Key ......................................... 1 Dispute Resolution ....................... 119 Driving Relationships ..................... 45 Duration is entered in: ................... 16 Dynamically Linking Cells............. 103 Earned Value ......................... 82, 117 Effort driven .................................... 75 Elapsed Durations .......................... 41 Elapsed Leads and Lags ................ 42 Excel ............................................. 115
Exporting ...................................... 115 Featured Templates .................... 100 Filter Calculated .............................. 33 Finish No Earlier Than constraint ..... 1 Fixed
Duration Task Type........................ 73 Units Task Type ............................. 73 Work Task Type ............................. 73
Float ................................................ 18 Float Bars ........................................ 31 Form
Customize Fields ......................... 106 Define Group Interval .................. 113 Format Bar ..................................... 30 More Groups ................................ 112 Project Statistics ............................ 86 Timescale ....................................... 64
Format Bar Style ......................................... 30 Baseline Bar ..................... 89, 90, 92 Date................................................ 49 Nonworking Time ........................... 64
Free Float ........................................ 30 Gantt Chart Wizard ............32, 89, 90 Global.mpt.............................. 98, 101 Gridlines Colors ............................... 55 Hide rollup bars when summary
expanded .................................. 53 Hide task bar .................................. 61 Hiding Text ...................................... 61 Hours per day: ......................... 15, 16 Hyperlink Colors .............................. 55 Import/Export ................................. 12 Indent Name ............................ 58, 59 Indicators column ...................... 2, 17 Interactive Filters ............................ 35 Interim Plan ..................................... 79 Ladder scheduling .......................... 43 Lags ................................................. 18 Legacy Format .................................. 5 Legend ............................................ 70 Macros ......................................... 101 Manual Page Breaks ...................... 70 Manually Scheduled ....................... 10 Maps ....................................101, 115 Mark as a milestone ....................... 38 Milestones....................................... 37 Modules ....................................... 101 Move start of remaining parts before
status date forward to status date 88 mpt File Type................................... 99 Multiple Critical Paths ..................... 57 Negative Float ................................. 30
Sample
Boo
k two c
hapte
rs on
ly

122 © Eastwood Harris
New tasks created: ......................... 10 Non Effort driven ............................ 75 Non-driving Relationships .............. 45 Nonworking Time ............................ 64 Nonworking Time Colors ................ 55 Organizer Overview....................... 101 Page Breaks ................................... 70 Paste Link ..................................... 103 Personal Template ................ 99, 100 Predecessor Unique ID .................. 60 Progress Lines ......................... 86, 89 Project Information form ................ 13 Project Start Date ............................. 8 Project, Project Information form .. 20 Quick Access Toolbar ..................... 11 Relationship Diagram ..................... 47 Relationships Driving ..................... 45 Remaining Duration ....................... 81 Reports ......................................... 115 Reschedule uncompleted tasks to start
after: ......................................... 96 Reschedule Work .................... 85, 93 Resource Assignment Unique ID ... 60 Retained Logic ................................ 26 Risk Analysis ................................. 118 Roll up Gantt bar to summary ........ 54 Round Bars to Whole Days ............ 54 Schedule Options ............................. 9 Scheduling ignores resource calendars
.............................. 14, 17, 19, 20 S-Curve ............................................ 65 Show project summary task .......... 66 Show Quick Access Toolbar Below the
Ribbon ...................................... 11 Show scheduling Messages ......... 116 Show task schedule suggestions 116 Show task schedule warnings ..... 116 Split
Removing a Bar Split ..................... 27 Show Bar Splits ............................. 28 Task ............................................... 26
Split in-progress tasks3, 9, 26, 84, 85, 87
Stakeholder Analysis.................... 118 Start No Earlier Than constraint ....... 1 Start on Current Date........................ 8 Start on Project Start Date ............... 8 Status Date ................................ 8, 82 Task Calendar ................................ 17 Task Drivers ................................... 45 Task Information ............................ 17 Task Inspector ................................ 46 Task Path ........................................ 46 Task Splitting .................................. 25 Task Type
Fixed Duration ................................ 73 Fixed Units ...................................... 73 Fixed Work ..................................... 73
Tasks will always honor their constraint dates............................ 3, 4, 9, 88
Templates ....................................... 99 Text Colors ...................................... 55 Text Wrapping ................................ 56 Timescale ....................................... 64 Timescale Format Colors ............... 55 Tracking Toolbar ............................ 85 Unique ID ........................................ 60
Predecessor ................................... 60 Successor ....................................... 60
Unique Resource Assignment ID ... 60 Unique Resource ID ....................... 60 Units ................................................ 59 Units per Time Period .............. 73, 74 Update as Scheduled ........ 85, 91, 93 Update Project form ................. 83, 90 Update Tasks ................................. 86 Updating task status updates resource
status .................................. 87, 95 Visual Basic Macros ..................... 101 Visual Reports .............................. 115 Wildcard .......................................... 34 Wrap Text ....................................... 56 Zoom Slider .................................... 63
Sample
Boo
k two c
hapte
rs on
ly