Embed Size (px)
Citation preview
Technical Brief
Removing poverty traps in the tax-transfer system
Technical Brief No. 7 October 2010 ISSN 1836-9014
David Ingles


About TAI
The Australia Institute is an independent public policy think tank based in Canberra. It is funded by donations from philanthropic trusts and individuals, memberships and commissioned research. Since its launch in 1994, the Institute has carried out highly influential research on a broad range of economic, social and environmental issues.
Our philosophy
As we begin the 21st century, new dilemmas confront our society and our planet. Unprecedented levels of consumption co-exist with extreme poverty. Through new technology we are more connected than we have ever been, yet civic engagement is declining. Environmental neglect continues despite heightened ecological awareness. A better balance is urgently needed.
The Australia Institute’s directors, staff and supporters represent a broad range of views and priorities. What unites us is a belief that through a combination of research and creativity we can promote new solutions and ways of thinking.
Our purpose—‘Research that matters’
The Institute aims to foster informed debate about our culture, our economy and our environment and bring greater accountability to the democratic process. Our goal is to gather, interpret and communicate evidence in order to both diagnose the problems we face and propose new solutions to tackle them.
The Institute is wholly independent and not affiliated with any other organisation. As an Approved Research Institute, donations to its Research Fund are tax deductible for the donor. Anyone wishing to donate can do so via the website at https://www.tai.org.au or by calling the Institute on 02 6162 4140. Our secure and user-friendly website allows donors to make either one-off or regular monthly donations and we encourage everyone who can to donate in this way as it assists our research in the most significant manner.
PO Box 4345 Manuka ACT 2603 Tel: (02) 6162 4140 Fax: (02) 6162 4144 Email: [email protected] Website: www.tai.org.au

Poverty traps
Glossary
CCB Childcare benefit
DSP Disability Support Pension
EATR Effective Average Tax Rate
EITC Earned Income Tax Credit
EMTR Effective Marginal Tax Rate
FTB-A Family Tax Benefit Part A
FTB-B Family Tax Benefit Part B
GDP Gross Domestic Product
GMI Guaranteed Minimum Income
GST Goods and Services Tax
HECS Higher Education Contribution Scheme
HELP Higher Education Loan Program
LITO Low-Income Tax Offset
MITTS Melbourne Institute Tax and Transfer Simulator
NATSEM National Centre for Social and Economic Modelling
NIT Negative Income Tax
NSA Newstart Allowance
PTR Participation Tax Rate
RA Rent Assistance
RTR Required Tax Rate
SHRR State Housing Rental Rebates
YA Youth Allowance

Poverty traps
1
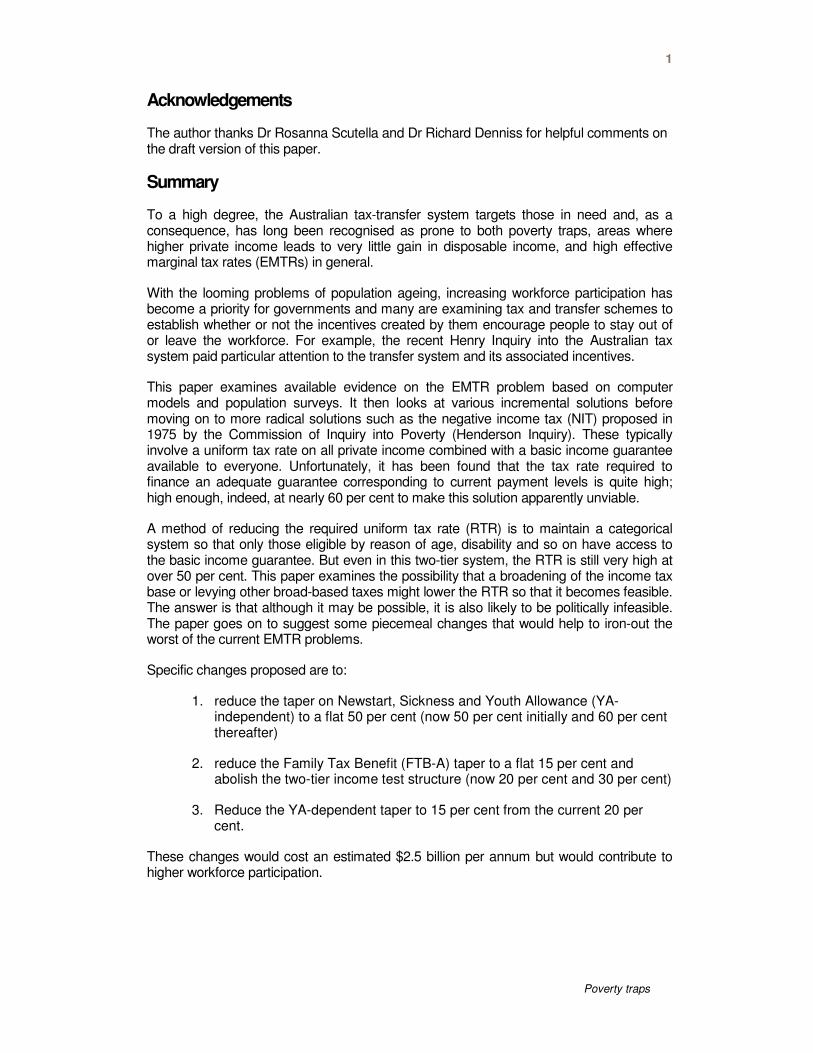
Acknowledgements
The author thanks Dr Rosanna Scutella and Dr Richard Denniss for helpful comments on the draft version of this paper.
Summary
To a high degree, the Australian tax-transfer system targets those in need and, as a consequence, has long been recognised as prone to both poverty traps, areas where higher private income leads to very little gain in disposable income, and high effective marginal tax rates (EMTRs) in general.
With the looming problems of population ageing, increasing workforce participation has become a priority for governments and many are examining tax and transfer schemes to establish whether or not the incentives created by them encourage people to stay out of or leave the workforce. For example, the recent Henry Inquiry into the Australian tax system paid particular attention to the transfer system and its associated incentives.
This paper examines available evidence on the EMTR problem based on computer models and population surveys. It then looks at various incremental solutions before moving on to more radical solutions such as the negative income tax (NIT) proposed in 1975 by the Commission of Inquiry into Poverty (Henderson Inquiry). These typically involve a uniform tax rate on all private income combined with a basic income guarantee available to everyone. Unfortunately, it has been found that the tax rate required to finance an adequate guarantee corresponding to current payment levels is quite high; high enough, indeed, at nearly 60 per cent to make this solution apparently unviable.
A method of reducing the required uniform tax rate (RTR) is to maintain a categorical system so that only those eligible by reason of age, disability and so on have access to the basic income guarantee. But even in this two-tier system, the RTR is still very high at over 50 per cent. This paper examines the possibility that a broadening of the income tax base or levying other broad-based taxes might lower the RTR so that it becomes feasible. The answer is that although it may be possible, it is also likely to be politically infeasible. The paper goes on to suggest some piecemeal changes that would help to iron-out the worst of the current EMTR problems.
Specific changes proposed are to:
1. reduce the taper on Newstart, Sickness and Youth Allowance (YA-independent) to a flat 50 per cent (now 50 per cent initially and 60 per cent thereafter)
2. reduce the Family Tax Benefit (FTB-A) taper to a flat 15 per cent and abolish the two-tier income test structure (now 20 per cent and 30 per cent)
3. Reduce the YA-dependent taper to 15 per cent from the current 20 per cent.
These changes would cost an estimated $2.5 billion per annum but would contribute to higher workforce participation.
2
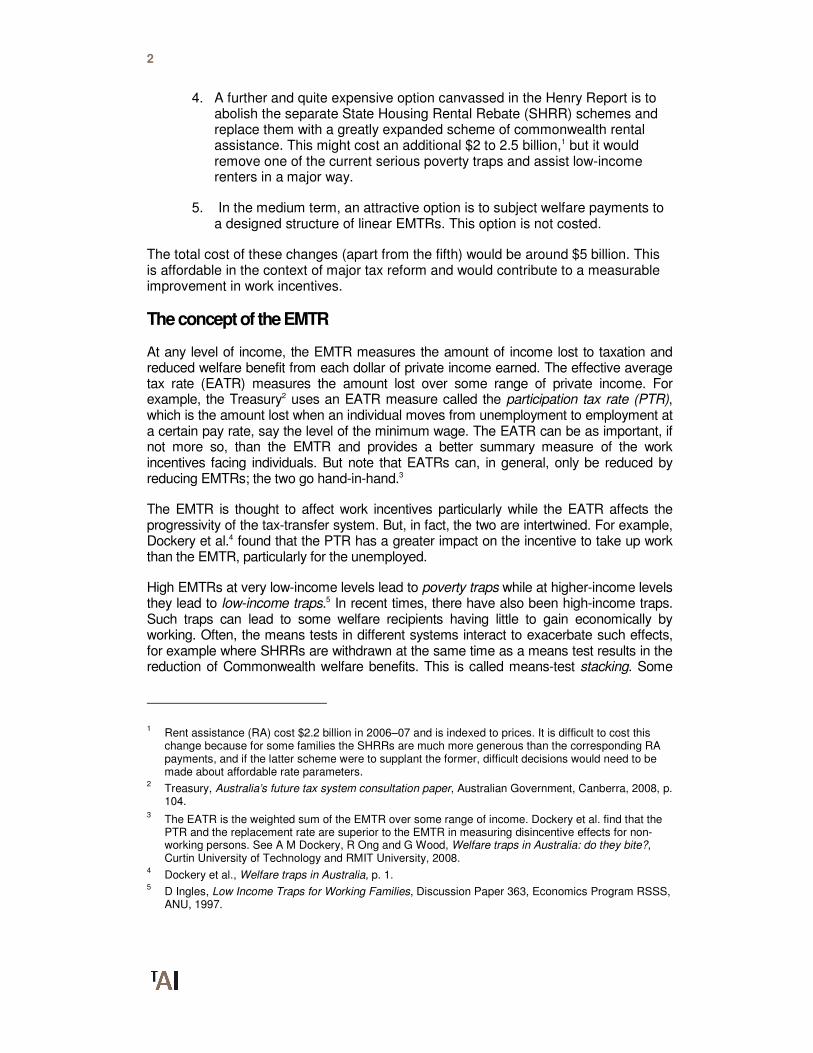
4. A further and quite expensive option canvassed in the Henry Report is to abolish the separate State Housing Rental Rebate (SHRR) schemes and replace them with a greatly expanded scheme of commonwealth rental assistance. This might cost an additional $2 to 2.5 billion,1 but it would remove one of the current serious poverty traps and assist low-income renters in a major way.
5. In the medium term, an attractive option is to subject welfare payments to a designed structure of linear EMTRs. This option is not costed.
The total cost of these changes (apart from the fifth) would be around $5 billion. This is affordable in the context of major tax reform and would contribute to a measurable improvement in work incentives.
The concept of the EMTR
At any level of income, the EMTR measures the amount of income lost to taxation and reduced welfare benefit from each dollar of private income earned. The effective average tax rate (EATR) measures the amount lost over some range of private income. For example, the Treasury2 uses an EATR measure called the participation tax rate (PTR), which is the amount lost when an individual moves from unemployment to employment at a certain pay rate, say the level of the minimum wage. The EATR can be as important, if not more so, than the EMTR and provides a better summary measure of the work incentives facing individuals. But note that EATRs can, in general, only be reduced by reducing EMTRs; the two go hand-in-hand.3
The EMTR is thought to affect work incentives particularly while the EATR affects the progressivity of the tax-transfer system. But, in fact, the two are intertwined. For example, Dockery et al.4 found that the PTR has a greater impact on the incentive to take up work than the EMTR, particularly for the unemployed.
High EMTRs at very low-income levels lead to poverty traps while at higher-income levels they lead to low-income traps.5 In recent times, there have also been high-income traps. Such traps can lead to some welfare recipients having little to gain economically by working. Often, the means tests in different systems interact to exacerbate such effects, for example where SHRRs are withdrawn at the same time as a means test results in the reduction of Commonwealth welfare benefits. This is called means-test stacking. Some
1 Rent assistance (RA) cost $2.2 billion in 2006–07 and is indexed to prices. It is difficult to cost this
change because for some families the SHRRs are much more generous than the corresponding RA payments, and if the latter scheme were to supplant the former, difficult decisions would need to be made about affordable rate parameters.
2 Treasury, Australia’s future tax system consultation paper, Australian Government, Canberra, 2008, p.
104. 3 The EATR is the weighted sum of the EMTR over some range of income. Dockery et al. find that the
PTR and the replacement rate are superior to the EMTR in measuring disincentive effects for non-working persons. See A M Dockery, R Ong and G Wood, Welfare traps in Australia: do they bite?, Curtin University of Technology and RMIT University, 2008.
4 Dockery et al., Welfare traps in Australia, p. 1.
5 D Ingles, Low Income Traps for Working Families, Discussion Paper 363, Economics Program RSSS,
ANU, 1997.
3
Poverty traps
commonwealth payments stack with each other; for example the YA and the FTB-A and FTB-B.
Certain groups, such as families with children, are more exposed to high EMTRs than others and, in recent times, policy measures have been directed to reducing EMTRs for these groups. In general, the changes have been helpful in reducing zones of high EMTRs. For example, the taper rate on:
• FTB-A reduced from 50 per cent to 30 per cent and then 20 per cent on the maximum rate and 30 per cent on the base rate (in 2004)
• the pension reduced from 50 per cent to 40 per cent in 2000 but has now reverted to 50 per cent (but effectively only 25 per cent on the first tranche of earned income, since half is disregarded)
• The Newstart Allowance (NSA) reduced from 70 per cent to 50 and 60 per cent in 2006.
The problem of high EMTRs remains a considerable one, however, as illustrated by the Treasury in its 2008 tax consultation paper.6
A few caveats
When looking at specific examples of high EMTRs, it needs to be borne in mind that the problem is analogous to a balloon that bulges in places; if one of the bulges is pushed in, the rest of the balloon bulges further out. It was calculated a decade ago that if EMTRs were to be levelled at one single rate, the RTR on the whole population would be in the order of 57 per cent.7 This rate may now be slightly higher.8
Trade-offs loom large in decisions about reducing welfare tapers. Typically, these reductions lower EMTRs for the client group, thus improving incentives, but they also enlarge the client group and EMTRs rise for those so introduced. For these new members, a net work-disincentive is produced, a situation that has arisen in the case of the family-payments system as tapers have been eased on the basic FTB-A payment over the past decade, leading to higher EMTRs in the middle-income ranges. What this means is that the incentive effects of a particular taper change can only be estimated with the aid of computer modelling that measures the impact both on the current client group and on those newly brought into the group and their likely responses (called labour-supply elasticities) to the new average and marginal tax rates they face.
In theory, the aggregate work response can be optimised by imposing lower tax rates on those with high supply elasticities (typically secondary earners such as part-time females)
6 Treasury, Australia’s future tax system consultation paper.
7 P Dawkins, G Beer, A Harding, D Johnson and R Scutella, Towards a negative income tax system,
Melbourne Institute of Applied Economic and Social Research, University of Melbourne, 1997. For a more recent costing, see R Scutella, Moves to a Basic Income-Flat Tax System in Australia: Implications for the Distribution of Income and Supply of Labour, Melbourne Institute Working Paper No. 5/04, Melbourne Institute of Applied Economic and Social Research, The University of Melbourne, 2004.
8 The recent real increases in the pension will have raised the RTR, while some changes in coverage
and lower unemployment will have reduced it. The overall impact cannot be assessed without a full-scale costing exercise based on current income data.
4
and high rates on those with low elasticities (typically prime-aged males). But the informational requirements of such an optimising policy are considerable and, in addition, the policy can lead to outcomes that many people would regard as unfair. Taken as a whole, there seems to be a reasonable theoretical case for aiming at approximate linearity in marginal tax rates across the whole population, a case supported by the general presumption that the welfare cost of taxation rises in relation to the square of the marginal tax rate. Welfare costs can therefore be minimised by having the EMTR everywhere the same or at least a reasonable approximation thereto. This is the reason that the NIT and proportional tax rate approach is so popular among academics.
EMTRs for hypothetical household types
So-called hypothetical studies are usually based on computer spreadsheet models incorporating the parameters of the tax and welfare systems. They show the EMTRs faced by a hypothetical person or family at different levels of private income and the disposable income after taxes and transfers. There is a certain element of approximation inherent in such models because taxes and transfers have different income definitions and also time periods. Nonetheless, such models are a useful means of examining incentive issues.
EMTRs calculated in this sort of modelling tend to be underestimates because they typically exclude such items as increases in rents for public-housing tenants, child-support payments, HECS and HELP repayments,9 the value of lost concession cards and the costs of child care necessary to facilitate work.10 On the other hand, there is a new working credit for most workforce-age payments, which is not incorporated in the majority of EMTR studies as it is time dependent.11 There is also a new discount for earnings (Work Bonus) in the age-pension means test, so that for age pensioners the EMTR depends on the source of income.12
In addition, there are also barriers to work that cannot be measured financially, for example the risk that, upon taking up a job, an individual might lose a benefit such as the Disability Support Pension (DSP) and be unable to resume it at a later date. There are
9 HECS is the income-contingent student loans scheme. HELP is the Higher Education Loan Program.
10 Treasury, Australia’s future tax system consultation paper.
11 See Centrelink, Working credit, Australian Government, 2008. ‘When your total income from all
sources is less than $48 a fortnight, you will automatically build up working credits. When you have income from work, you can use your credits to reduce the effect that income has on your Centrelink payment.
Under Working Credit one credit equals one dollar. You are able to collect up to 1000 credits, and for every credit you have you can earn one extra dollar before your Centrelink payment is reduced. For example, if you have 450 working credits, you can earn an extra $450 before your Centrelink payment is reduced.’
12 See Centrelink, ‘Work bonus’, Australian Government, 2009. ‘There will be a Work Bonus for
pensioners over age pension age. Under the new Work Bonus, half of the first $500 of fortnightly employment income will be disregarded from the income test for pensioners over Age Pension age. This means the maximum that can be disregarded is $250. This is in addition to the normal allowable income free area. Once the employment income has received the 50% discount, it is added to the rest of the income and the normal allowable income threshold applies. Any employment earnings over $500 gross a fortnight and any other income will be counted as usual.’
5
Poverty traps
also welfare ‘locks’, documented by Dockery et al.,13 whereby people on public-housing waiting lists are reluctant to take jobs because it would jeopardise their place on the list.
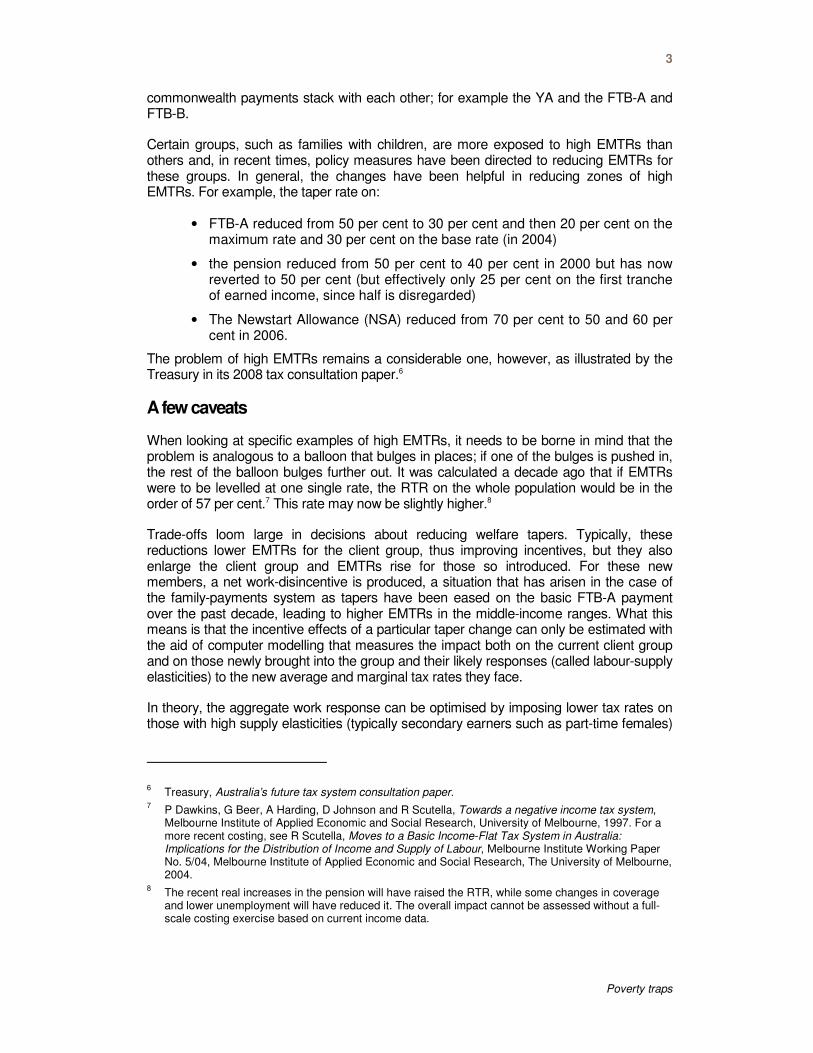
Figure 1 is illustrative of the EMTR issue in general. It shows EMTRs for a single-earner couple with children in 2009; at low-income levels it is assumed that this couple would be eligible for NSA.
Figure 1: EMTRs and disposable income for a single-earner couple with two children
Source: Treasury, Australia’s future tax system consultation paper, Chart 4.5, p. 94.
The areas of high EMTRs in this figure relate first to the high rates of taper on NSA (50 and 60 per cent),14 and secondly to its interaction with the tax system, which creates very high EMTRs at the bottom end of the income range. At higher-income levels, EMTRs are affected by the loss of family payments (FTB-A and FTB-B), with an income test that ‘stacks’ with the normal marginal tax schedule. There are also ‘spikes’ where the Medicare surcharge cuts in and where FTB-B cuts out.
FTB-A, worth about $5,500 per annum,15 has a two-part taper. The taper is 20 per cent above a combined family income of $44,165 until the higher-rate payment falls to a base
13 A M Dockery, S Feeny, K Hulse, R Ong, L Saugeres, H Spong, S Whelan and G Wood, Housing
assistance and economic participation, National Research Venture 1: Housing assistance and economic participation, Final Research Paper, Australian Housing and Urban Research Institute, Melbourne, 2008.
14 An NSA customer can earn up to $62 gross a fortnight before payment is affected; income between
$62 and $250 reduces the fortnightly payment by 50 cents in the dollar. Income above $250 reduces the payment by 60 cents in the dollar and partner income, which exceeds the cutout point, also reduces payment by 60 cents in the dollar.
15 The rates vary with the age of the child; from $4,803, if the child is under 13, to $6,033 if the child is
between 13 and 15, $2,018 if between 16 and 17 and $2,467 if between 18 and 24. The base rates are $2,018 for under-18s and $2,467 for children between 18 and 24. There is also an FTB-A
6
rate, which is then withdrawn above a combined family income of $94,316 at a rate of 30 per cent.
FTB-B, worth about $3,000 per annum,16 is normally payable to a non-working spouse or a single parent. It also has a two-part taper, being withdrawn at a rate of 20 per cent when the income of the spouse rises above $4,526 per annum and lost when this income exceeds around $20,000. It is lost completely if the family income exceeds $150,000.
Do the hills and valleys in the EMTR schedule really matter? Certainly, clients are unlikely to be fully aware of them because they are extremely difficult to compute and the effects only manifest after the event. For example, a welfare client might take on a job only to find that after some months, when all benefits have been adjusted, they are not much better off. The EMTR schedule is perhaps less important than the disposable income graph, which, in the example above, rises more or less with increasing private income, suggesting that there is a continuous incentive to earn extra income. There are only a couple of places in Figure 1 where disposable income actually declines.
Nonetheless, it is relevant to ask why such an apparently arbitrary pattern of EMTRs in the welfare system is tolerated when it is surely within the wit of policymakers to design a system that claws back welfare entitlements and extracts tax in a smooth and consistent manner. The ideal schedule of EMTRs is not known but for the family type in the example it might look like a straight line drawn horizontally through the graph at around the 50 per cent mark. This would provide a continuous incentive to earn extra income.
Another indicator of work disincentives is found in Treasury’s Architecture of Australia’s tax and transfer system,17 which shows EMTRs for a secondary-income earner. This graph is not actually as alarming as the one in Figure 1 because the scale is different and the highest EMTR is only 65 per cent as opposed to nearly 100 per cent for the allowee couple. But it is well-known that secondary-income earners are particularly susceptible to work disincentives from high tax rates because their labour supply is responsive (elastic) to changes in the effective tax rate; that is, they have relatively high labour-supply elasticities.
supplement of $712, payable after the end of the financial year. The supplement helps to avoid situations arising where money may be owed to the Australian Taxation Office (ATO).
16 These rates vary with the age of the youngest child from $3,829 if the child is under five to $2,774 if
the child is between five and 18. The cutouts are $23,817 if the youngest child is under five and $18,542 if the child is aged between five and 18.
17 Treasury, Architecture of Australia’s tax and transfer system, Australian Government, Canberra, 2008.
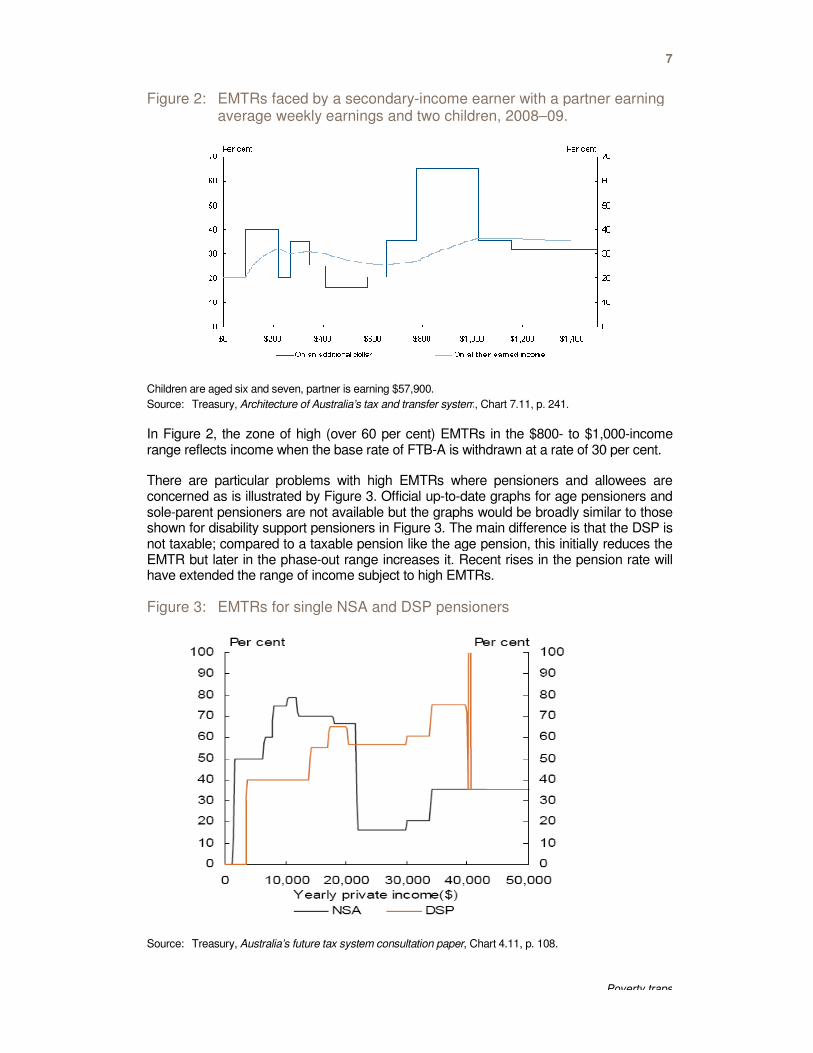
Figure 2: EMTRs faced by a average weekly earnings and
Children are aged six and seven, partner is earning $57,900.
Source: Treasury, Architecture of Australia’s tax and transfer system
In Figure 2, the zone of high range reflects income when the base rate of FTB
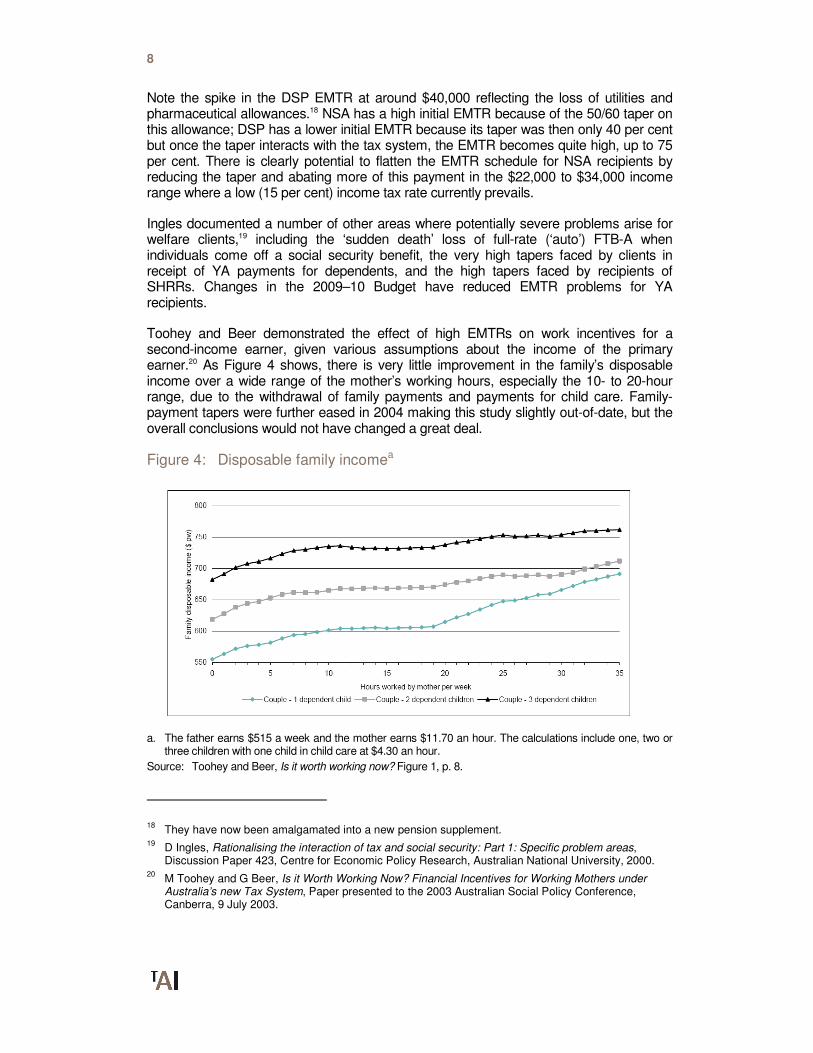
There are particular problems withconcerned as is illustrated by Figure 3sole-parent pensioners are not availableshown for disability support pensioners not taxable; compared to a taxable pension like the age pensionEMTR but later in the phase-have extended the range of income subject to high EMTRs.
Figure 3: EMTRs for single NSA
Source: Treasury, Australia’s future tax system consultation paper
Poverty traps
faced by a secondary-income earner with a partner earning average weekly earnings and two children, 2008–09.
, partner is earning $57,900.
Architecture of Australia’s tax and transfer system, Chart 7.11, p. 241.
the zone of high (over 60 per cent) EMTRs in the $800- to $1,000the base rate of FTB-A is withdrawn at a rate of 30 per
There are particular problems with high EMTRs where pensioners and allowees illustrated by Figure 3. Official up-to-date graphs for age pensioners and
not available but the graphs would be broadly similar to those disability support pensioners in Figure 3. The main difference is that the
not taxable; compared to a taxable pension like the age pension, this initially reduces the -out range increases it. Recent rises in the pension rate will
have extended the range of income subject to high EMTRs.
Rs for single NSA and DSP pensioners
Australia’s future tax system consultation paper, Chart 4.11, p. 108.
7
Poverty traps
income earner with a partner earning
000-income A is withdrawn at a rate of 30 per cent.
pensioners and allowees are for age pensioners and
but the graphs would be broadly similar to those in Figure 3. The main difference is that the DSP is
this initially reduces the Recent rises in the pension rate will
8
Note the spike in the DSP EMTR at around $40,000 reflecting the loss of utilities and pharmaceutical allowances.18 NSA has a high initial EMTR because of the 50/60 taper on this allowance; DSP has a lower initial EMTR because its taper was then only 40 per cent but once the taper interacts with the tax system, the EMTR becomes quite high, up to 75 per cent. There is clearly potential to flatten the EMTR schedule for NSA recipients by reducing the taper and abating more of this payment in the $22,000 to $34,000 income range where a low (15 per cent) income tax rate currently prevails.
Ingles documented a number of other areas where potentially severe problems arise for welfare clients,19 including the ‘sudden death’ loss of full-rate (‘auto’) FTB-A when individuals come off a social security benefit, the very high tapers faced by clients in receipt of YA payments for dependents, and the high tapers faced by recipients of SHRRs. Changes in the 2009–10 Budget have reduced EMTR problems for YA recipients.
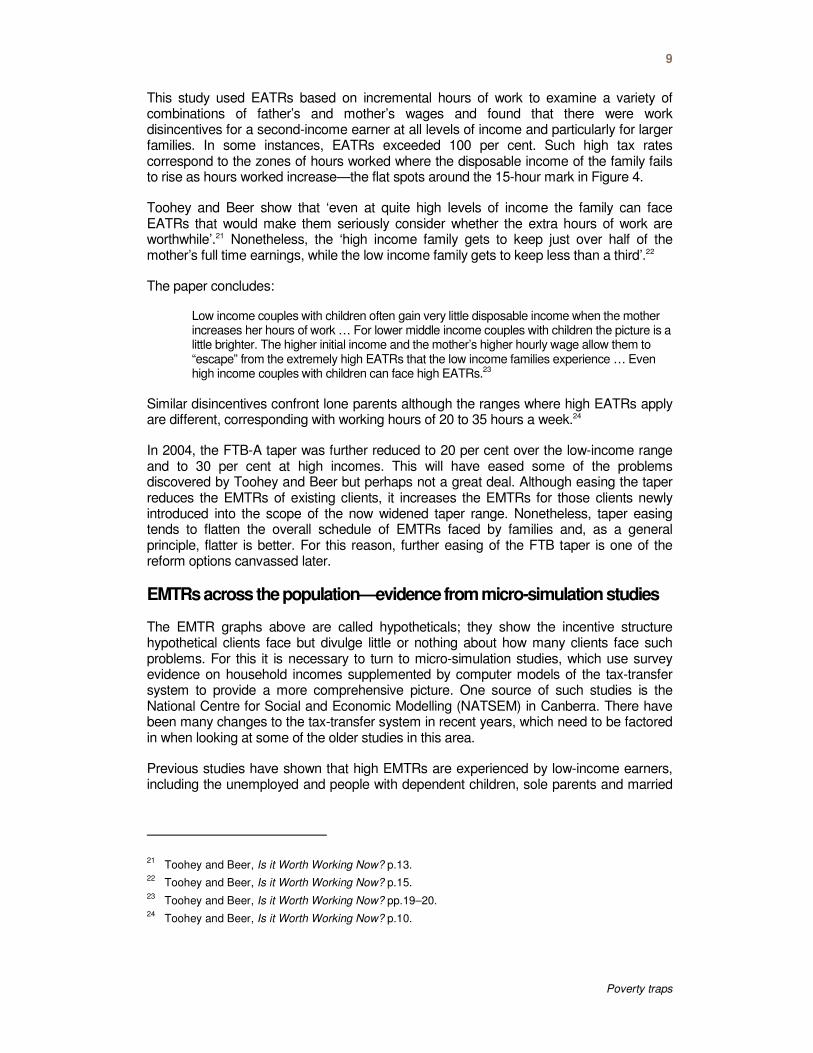
Toohey and Beer demonstrated the effect of high EMTRs on work incentives for a second-income earner, given various assumptions about the income of the primary earner.20 As Figure 4 shows, there is very little improvement in the family’s disposable income over a wide range of the mother’s working hours, especially the 10- to 20-hour range, due to the withdrawal of family payments and payments for child care. Family-payment tapers were further eased in 2004 making this study slightly out-of-date, but the overall conclusions would not have changed a great deal.
Figure 4: Disposable family incomea
a. The father earns $515 a week and the mother earns $11.70 an hour. The calculations include one, two or three children with one child in child care at $4.30 an hour.
Source: Toohey and Beer, Is it worth working now? Figure 1, p. 8.
18 They have now been amalgamated into a new pension supplement.
19 D Ingles, Rationalising the interaction of tax and social security: Part 1: Specific problem areas,
Discussion Paper 423, Centre for Economic Policy Research, Australian National University, 2000. 20
M Toohey and G Beer, Is it Worth Working Now? Financial Incentives for Working Mothers under Australia’s new Tax System, Paper presented to the 2003 Australian Social Policy Conference, Canberra, 9 July 2003.
9
Poverty traps
This study used EATRs based on incremental hours of work to examine a variety of combinations of father’s and mother’s wages and found that there were work disincentives for a second-income earner at all levels of income and particularly for larger families. In some instances, EATRs exceeded 100 per cent. Such high tax rates correspond to the zones of hours worked where the disposable income of the family fails to rise as hours worked increase—the flat spots around the 15-hour mark in Figure 4.
Toohey and Beer show that ‘even at quite high levels of income the family can face EATRs that would make them seriously consider whether the extra hours of work are worthwhile’.21 Nonetheless, the ‘high income family gets to keep just over half of the mother’s full time earnings, while the low income family gets to keep less than a third’.22
The paper concludes:
Low income couples with children often gain very little disposable income when the mother increases her hours of work … For lower middle income couples with children the picture is a little brighter. The higher initial income and the mother’s higher hourly wage allow them to “escape” from the extremely high EATRs that the low income families experience … Even high income couples with children can face high EATRs.23
Similar disincentives confront lone parents although the ranges where high EATRs apply are different, corresponding with working hours of 20 to 35 hours a week.24
In 2004, the FTB-A taper was further reduced to 20 per cent over the low-income range and to 30 per cent at high incomes. This will have eased some of the problems discovered by Toohey and Beer but perhaps not a great deal. Although easing the taper reduces the EMTRs of existing clients, it increases the EMTRs for those clients newly introduced into the scope of the now widened taper range. Nonetheless, taper easing tends to flatten the overall schedule of EMTRs faced by families and, as a general principle, flatter is better. For this reason, further easing of the FTB taper is one of the reform options canvassed later.
EMTRs across the population—evidence from micro-simulation studies
The EMTR graphs above are called hypotheticals; they show the incentive structure hypothetical clients face but divulge little or nothing about how many clients face such problems. For this it is necessary to turn to micro-simulation studies, which use survey evidence on household incomes supplemented by computer models of the tax-transfer system to provide a more comprehensive picture. One source of such studies is the National Centre for Social and Economic Modelling (NATSEM) in Canberra. There have been many changes to the tax-transfer system in recent years, which need to be factored in when looking at some of the older studies in this area.
Previous studies have shown that high EMTRs are experienced by low-income earners, including the unemployed and people with dependent children, sole parents and married
21 Toohey and Beer, Is it Worth Working Now? p.13.
22 Toohey and Beer, Is it Worth Working Now? p.15.
23 Toohey and Beer, Is it Worth Working Now? pp.19–20.
24 Toohey and Beer, Is it Worth Working Now? p.10.
10
mothers whose partners work. Beer25 demonstrates that the presence of children is one of the main causes of high (above 60 per cent) EMTRs, with 15 per cent of couples with children and 23 per cent of sole parents included in this group in 2002. By contrast, the incidence of high EMTRs among single people was just three per cent and among couples without children only one per cent.
The fact that the majority of people who face high EMTRs have dependent children was, according to Beer,26 primarily due to the taper on FTB-A. Beer also found that income-test stacking was the principal cause of high EMTRs over 60 per cent.
One of Beer’s more striking findings was that those in the middle of the equivalised family income distribution (deciles 4 to 6) were the ones most likely to face high EMTRs (over 60 per cent in this study). By contrast, very few individuals in the top two deciles faced high EMTRs,27 while those in the lowest two deciles typically faced EMTRs of zero as their incomes were below the social-security-free areas or were not in the welfare system at all.28
A more recent study is that of Harding et al. published in 2006 for the AMP and NATSEM, which analysed trends in EMTRs between 1996–97 and 2006–07 and found that the overwhelming majority of working-age people, almost 90 per cent, face an EMTR of 40 per cent or less.29 However, an estimated 7.1 per cent of working-age people face an EMTR of over 50 per cent, which is higher than the ostensible top marginal tax rate of 46.5 per cent inclusive of the Medicare levy. Almost two-thirds of these 910,000 people are parents living with a partner and dependent children. Fewer than four per cent of working-age people face EMTRs of 60 per cent or more and less than one per cent face EMTRs of 80 per cent or more.30
The problem with this sort of information is that it is not known whether people’s behaviour changes to reflect the existing structure of incentives so that they avoid working hours that put them into the regions of high EMTRs. For example, it is well-known that the incomes of pensioners cluster below the free areas; what is not known is whether this would still be true without means testing.
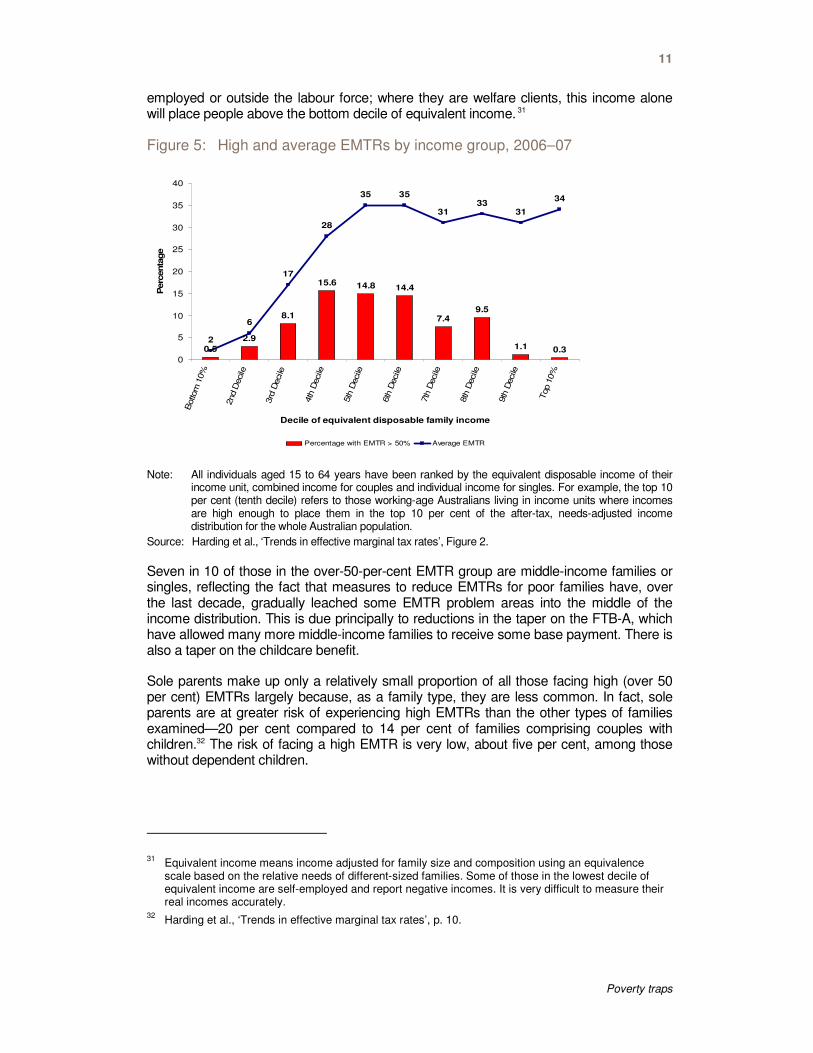
Figure 5 shows the percentage of the population in each income decile with an EMTR higher than 50 per cent and clearly demonstrates that high EMTRs are increasingly an issue for the middle-income groups. (Note that the Harding et al. study defines high EMTRs as those over 50 per cent in contrast to the Beer study, which uses 60 per cent.) It should be borne in mind that many of those in the bottom deciles of income are self-
25 G Beer, ‘Work Incentives Under a New Tax System: The Distribution of Effective Marginal Tax Rates
in 2002’, Paper presented to the 2002 Conference of Economists, Canberra, 30 September—3 October (Revised November 2002).
26 Beer, ‘Work Incentives Under a New Tax System’, p. 25.
27 Beer, ‘Work Incentives Under a New Tax System’, Table 8, p. 18.
28 Some of those in the lowest-income decile are self-employed with very low or even negative reported
incomes. 29
A Harding, Q H Vu, A Payne and R Percival, ‘Trends in effective marginal tax rates 1996–97 to 2006–07’, AMP Natsem Income and Wealth Report, Issue 14, September 2006.
30 Harding et al., ‘Trends in effective marginal tax rates’, p. 7.
11
Poverty traps
employed or outside the labour force; where they are welfare clients, this income alone will place people above the bottom decile of equivalent income. 31
Figure 5: High and average EMTRs by income group, 2006–07
Note: All individuals aged 15 to 64 years have been ranked by the equivalent disposable income of their income unit, combined income for couples and individual income for singles. For example, the top 10 per cent (tenth decile) refers to those working-age Australians living in income units where incomes are high enough to place them in the top 10 per cent of the after-tax, needs-adjusted income distribution for the whole Australian population.
Source: Harding et al., ‘Trends in effective marginal tax rates’, Figure 2.
Seven in 10 of those in the over-50-per-cent EMTR group are middle-income families or singles, reflecting the fact that measures to reduce EMTRs for poor families have, over the last decade, gradually leached some EMTR problem areas into the middle of the income distribution. This is due principally to reductions in the taper on the FTB-A, which have allowed many more middle-income families to receive some base payment. There is also a taper on the childcare benefit.
Sole parents make up only a relatively small proportion of all those facing high (over 50 per cent) EMTRs largely because, as a family type, they are less common. In fact, sole parents are at greater risk of experiencing high EMTRs than the other types of families examined—20 per cent compared to 14 per cent of families comprising couples with children.32 The risk of facing a high EMTR is very low, about five per cent, among those without dependent children.
31 Equivalent income means income adjusted for family size and composition using an equivalence
scale based on the relative needs of different-sized families. Some of those in the lowest decile of equivalent income are self-employed and report negative incomes. It is very difficult to measure their real incomes accurately.
32 Harding et al., ‘Trends in effective marginal tax rates’, p. 10.
0.5
2.9
8.1
15.6 14.8 14.4
7.49.5
1.1 0.32
6
17
28
35 35
3133
31
34
0
5
10
15
20
25
30
35
40B
otto
m 1
0%
2nd D
ecile
3rd
Deci
le
4th
Deci
le
5th
Deci
le
6th
Deci
le
7th
Deci
le
8th
Deci
le
9th
Deci
le
Top 1
0%
Decile of equivalent disposable family income
Perc
enta
ge
Percentage with EMTR > 50% Average EMTR
12
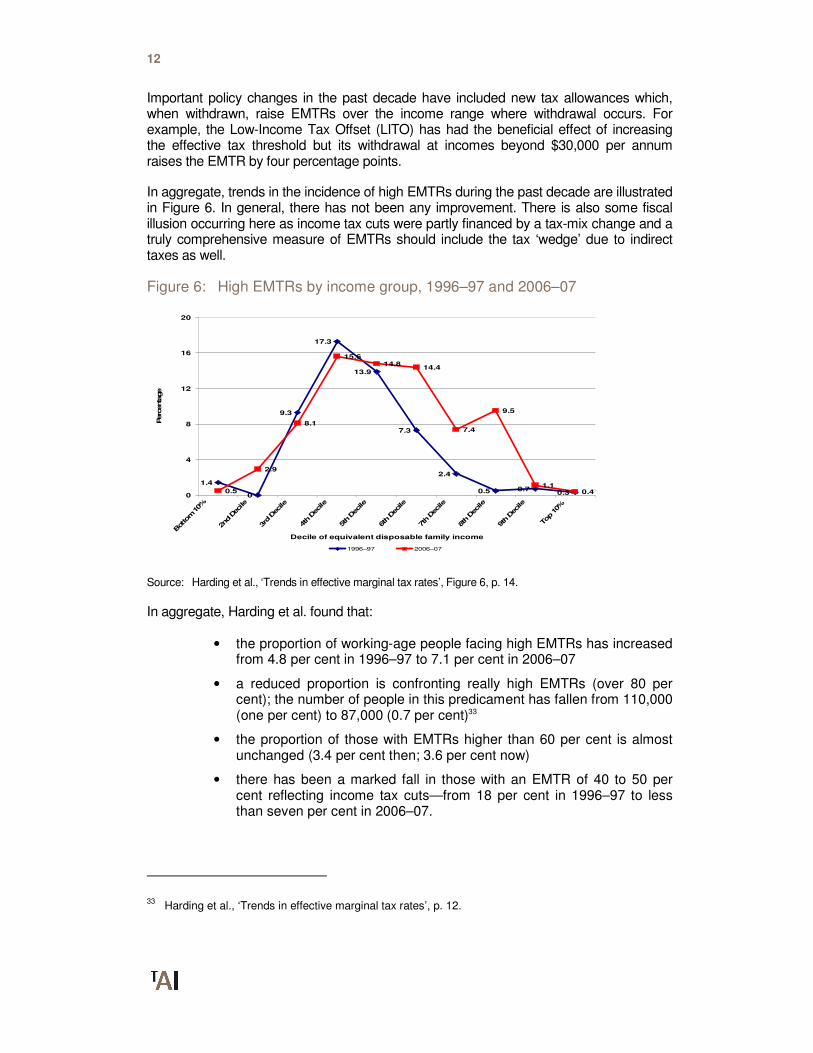
Important policy changes in the past decade have included new tax allowances which, when withdrawn, raise EMTRs over the income range where withdrawal occurs. For example, the Low-Income Tax Offset (LITO) has had the beneficial effect of increasing the effective tax threshold but its withdrawal at incomes beyond $30,000 per annum raises the EMTR by four percentage points.
In aggregate, trends in the incidence of high EMTRs during the past decade are illustrated in Figure 6. In general, there has not been any improvement. There is also some fiscal illusion occurring here as income tax cuts were partly financed by a tax-mix change and a truly comprehensive measure of EMTRs should include the tax ‘wedge’ due to indirect taxes as well.
Figure 6: High EMTRs by income group, 1996–97 and 2006–07
Source: Harding et al., ‘Trends in effective marginal tax rates’, Figure 6, p. 14.
In aggregate, Harding et al. found that:
• the proportion of working-age people facing high EMTRs has increased from 4.8 per cent in 1996–97 to 7.1 per cent in 2006–07
• a reduced proportion is confronting really high EMTRs (over 80 per cent); the number of people in this predicament has fallen from 110,000 (one per cent) to 87,000 (0.7 per cent)33
• the proportion of those with EMTRs higher than 60 per cent is almost unchanged (3.4 per cent then; 3.6 per cent now)
• there has been a marked fall in those with an EMTR of 40 to 50 per cent reflecting income tax cuts—from 18 per cent in 1996–97 to less than seven per cent in 2006–07.
33 Harding et al., ‘Trends in effective marginal tax rates’, p. 12.
1.4
0
9.3
17.3
13.9
7.3
2.4
0.5 0.70.30.5
2.9
8.1
15.614.8
14.4
7.4
9.5
1.10.4
0
4
8
12
16
20
Bottom 10%
2nd Dec
ile
3rd
Dec
ile
4th D
ecile
5th D
ecile
6th D
ecile
7th D
ecile
8th D
ecile
9th D
ecile
Top 10%
Decile of equivalent disposable family income
Perc
enta
ge
1996–97 2006–07
13
Poverty traps
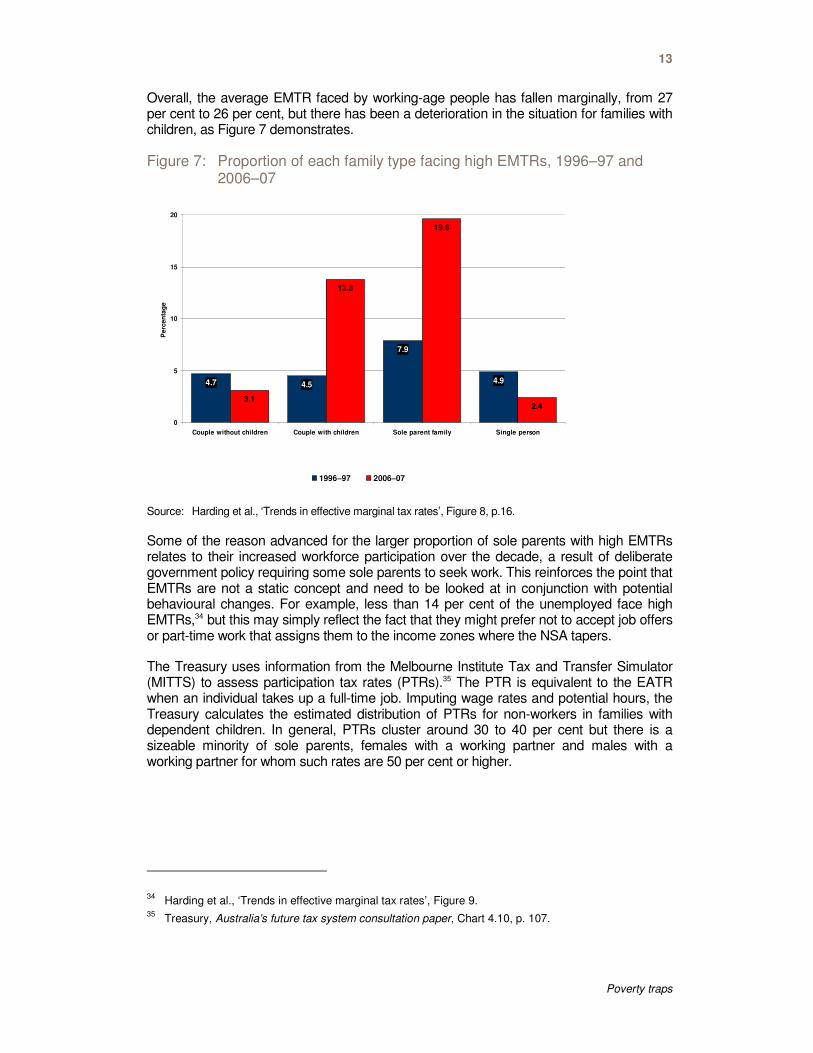
Overall, the average EMTR faced by working-age people has fallen marginally, from 27 per cent to 26 per cent, but there has been a deterioration in the situation for families with children, as Figure 7 demonstrates.
Figure 7: Proportion of each family type facing high EMTRs, 1996–97 and 2006–07
Source: Harding et al., ‘Trends in effective marginal tax rates’, Figure 8, p.16.
Some of the reason advanced for the larger proportion of sole parents with high EMTRs relates to their increased workforce participation over the decade, a result of deliberate government policy requiring some sole parents to seek work. This reinforces the point that EMTRs are not a static concept and need to be looked at in conjunction with potential behavioural changes. For example, less than 14 per cent of the unemployed face high EMTRs,34 but this may simply reflect the fact that they might prefer not to accept job offers or part-time work that assigns them to the income zones where the NSA tapers.
The Treasury uses information from the Melbourne Institute Tax and Transfer Simulator (MITTS) to assess participation tax rates (PTRs).35 The PTR is equivalent to the EATR when an individual takes up a full-time job. Imputing wage rates and potential hours, the Treasury calculates the estimated distribution of PTRs for non-workers in families with dependent children. In general, PTRs cluster around 30 to 40 per cent but there is a sizeable minority of sole parents, females with a working partner and males with a working partner for whom such rates are 50 per cent or higher.
34 Harding et al., ‘Trends in effective marginal tax rates’, Figure 9.
35 Treasury, Australia’s future tax system consultation paper, Chart 4.10, p. 107.
4.7 4.5
7.9
4.9
3.1
13.8
19.6
2.4
0
5
10
15
20
Couple without children Couple with children Sole parent family Single person
Pe
rce
nta
ge
1996–97 2006–07
14
EMTRs across the population—evidence from longitudinal data
Dockery et al. model the impact of EMTRs, PTRs and replacement rates (RRs) on workforce participation using longitudinal data..36 Their study is innovative in that it also includes the impact of withdrawing state public housing rental subsidies. However, the overall findings are similar to the other studies; ‘the “typical” working age Australian faced an EMTR of around 30 per cent in the years from 2000–01 to 2003–04, and only around 5 per cent faced EMTRs in excess of 60 per cent’. 37 A high proportion of sole parents and public housing tenants (two groups which overlap) were in this group.
This study also attempted to directly measure work disincentives. It suggests that ‘the PTR and RR are found to be superior to the EMTR in measuring disincentive effects for non-working persons. Second, these effects do matter. High PTRs or RRs have a moderate but significant effect on the probability that women will enter employment from outside the labour force, and a very large (negative) effect on the probability that an unemployed person will find work’.38 A notable finding from the work of Dockery et al. is the adverse impact on effective tax rates arising from the withdrawal of state housing rental rebates, which have a means test which ‘stacks’ with all Commonwealth means tests.
Main options to improve EMTRs
1 Piecemeal change
The first set of options involves piecemeal change with measures such as reducing the taper on the NSA, addressing instances of means-test stacking and effecting changes to family-payment tapers. Families can be subject to up to five different payments all tapering at once: FTB-A, FTB-B, RA (state or Commonwealth), YA and Childcare Benefit (CCB). However, because CCB raises complex issues,39 it will be omitted from this analysis with the assumption that the CCB means test will continue to stack.
The Henry Tax Review makes three recommendations that impact particularly on EMTRs. They are that:
• all welfare payments should be made non-taxable
• a higher income tax threshold of $25,000 should be established, allied with a standard rate of 35 per cent
• the family-payment income test should become a standard taper of 15 or 20 per cent applying to an integrated family payment.
The effect of the first two changes is that the EMTR structure for pensioners would become zero, 50 and 85 per cent. The 85 per cent rate particularly affects one-income
36 The replacement rate compares the wage of a working individual, inclusive of in-work benefits, with
the benefits received by a non-working individual. 37
Dockery et al., Welfare Traps In Australia, p. 7. 38
Dockery et al., Welfare Traps In Australia. 39
The main issue is that while the CCB taper can be a work disincentive, its actual existence is a work incentive. There are also interactions from the presence of the Childcare Rebate.
15
Poverty traps
families. The tax-free status of the pension at first reduces the EMTR but later raises it,40 so the EMTR structure becomes less smooth. It is not clear that this is a net improvement. There is a net improvement for allowees since the large rise in the tax threshold means that most will not pay tax until after their allowance is exhausted, so their EMTR schedule aligns with the means-test taper of zero, 50 and 60 per cent.
There would be a net improvement for families, which are not affected by tax exemption as family payments are already exempt. The single taper of 15 or 20 per cent replaces existing tapers of 20 and then 30 per cent so EMTRs are generally improved, particularly for secondary earners whose income puts the family into income zones where the base rate of FTB-A is lost. As described earlier, the recommendation to integrate the FTB-B into the family payment has an ambiguous impact on EMTRs.
In general, the recommendations of the Henry Tax Review are a slight improvement on the current situation but they do not address really fundamental issues and lack a coherent underlying rationale.
1.1 Reform YA for dependents
YA for dependents is approximately $5,500 per annum, slightly higher than the basic rate of FTB-A.41 In 2000, Ingles noted that for many families the presence of a YA child in addition to other children can result in income ranges where EMTRs exceed 100 per cent.42 Furthermore, the YA parental income test could stack on itself when there is more than one YA child in the family, an issue recognised by the Reference Group on Welfare Reform (McClure Report 2000), which made a recommendation that it be fixed.43
However, nothing was done until the 2009–10 Budget, following the Bradley Review of Australian Higher Education. As a result, the parental income-test threshold has been substantially raised bringing it to parity with the FTB-A threshold and the taper reduced to
40 This is mathematically necessary since the EATR is the same at the pension cutout whether or not
the pension is taxable. If the pension is non-taxable, the income tax and the pension taper are additive; if the pension is taxable the EMTR rises sooner in the income schedule but is not additive. So a pension taper of 50 per cent and tax rate of 35 per cent give rise to an EMTR of 50 + (35*.5 = 17.5) = 67.5 per cent.
41 YA rates for 2010:
If you are: The maximum fortnightly payment is
single with no children, under 18 years and living at home $206.30
single with no children, under 18 years and not living at home $377.00
single with no children, 18 years and over and living at home $248.10
single with no children, 18 years and over and not living at home $377.00
single with children $493.90
partnered with no children $377.00
partnered with children $413.90
You may qualify for RA.
Source: Centrelink website 42
Ingles, Rationalising the interaction of tax and social security, Part 1. 43
P McClure, Participation support for a more equitable society, Final Report of the Reference Group on Welfare Reform, Department of Family and Community Services, 2000.
16
a single rate of 20 per cent on parental income. These changes have partly addressed the problems identified by Ingles.44
Problems of stacking continue to persist where a family with YA children is eligible for FTB-A. In this circumstance, both income tests can operate simultaneously adding 40 per cent to EMTRs over the relevant income ranges, which are now relatively wide. There is also a notch problem when full-rate YA is payable to a family on a welfare benefit such as DSP; the cutouts for these payments exceed the YA thresholds and the family can therefore suffer a sudden-death loss of YA income when coming off the welfare benefit. This is analogous to the problem of ‘auto’ FTB-A being lost when coming off a pension because of rising income.
One option is to reduce the FTB-A taper further and allow the tapers to continue to stack. It may also be beneficial to abolish the auto-payment of YA to recipients on welfare and instead apply the rate appropriate to their income. This would eliminate the notch problem but at the cost of raising EMTRs on welfare incomes above the YA family-income thresholds, a result that is probably better than retaining the notch problem. The same solution could apply to the FTB-A notch for pensioners.
If the FTB-A taper is reduced to a flat 15 per cent as recommended here, the same reduction should apply to the YA taper.
1.2 Rent Assistance
Commonwealth RA is subject to two different means tests. For childless singles or couples on a pension or allowance, the payment is added to the basic payment and tapered away after the base payment exhausts. RA is payable to families if they receive more than the base rate of FTB-A; it is added to FTB-A and tapered away after the initial FTB-A taper so that, in some cases, families quite high up the family income scale can receive RA.
SHRRs are potentially much more valuable than RA but taper away more quickly. A typical formula is that rent payable is 25 per cent of income so that the taper can add up to 25 percentage points to the EMTR otherwise applicable.45 In this manner, SHRRs can produce extremely high EMTRs when they stack with welfare payments. There has been official consideration of options for making SHRRs and RA more similar but no progress has been made. The Henry Tax Review has recommended that SHRRs be abolished and replaced by an expanded RA scheme, which would be a sensible change.
This change could be accompanied by a large increase in the rate of RA, which manifestly fails to meet realistic costs of rented accommodation in the major population centres. With payment parameters so reformed, SHRRs could be entirely abolished and replaced with a single Commonwealth system. This would be expensive (costing perhaps $2 billion to $2.5 billion) but is a comprehensive way of addressing one of the largest welfare trap problems in the current system.
44 Ingles, Rationalising the interaction of tax and social security. Part 1.
45 The taper is not simply additive. If the welfare taper is 50 per cent, $10 of extra income raises net
income by $5 and SHRR reduces it by $1.25, making the EMTR 62.5 per cent.
17
Poverty traps
1.3 Changes to FTB-A tapers
Harding et al. propose reducing the tapers on family assistance to provide better incentives for working mothers.46 Currently, a 20 per cent taper applies above a family income threshold of $44,165 and reduces the payment until it reaches a base rate. Then a 30 per cent taper applies to the base rate above a second threshold of $94,316 plus $3,796 for each child after the first.
Harding et al. consider two policy options. The first reduces the initial taper to 10 per cent while leaving the second taper at 30 per cent. The second reduces both tapers by 10 percentage points, to 10 and 20 per cent respectively. These policies improve work incentives for both mothers and fathers because the income tests are based on joint family income. Option 1 is estimated to cost $1.71 billion and Option 2, $1.74 billion; FTB-B is not affected by this proposal. These costs compare with existing FTB-A spending of $12 billion and represent a 14 per cent increase.
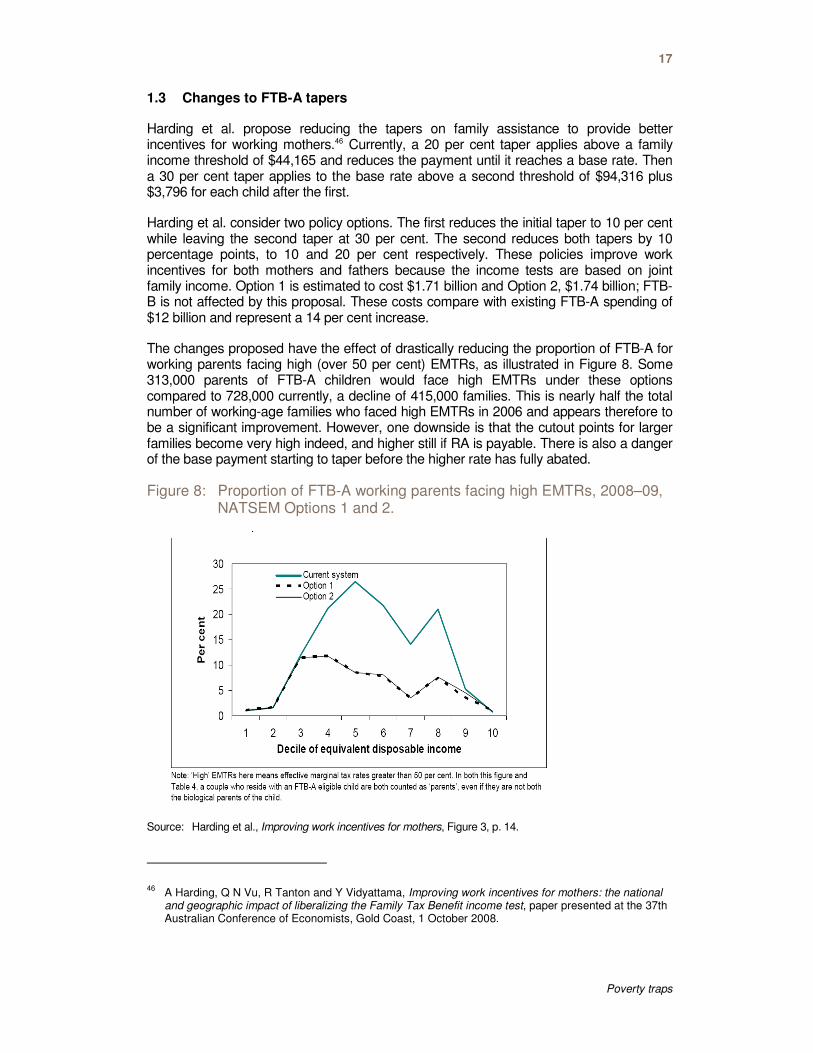
The changes proposed have the effect of drastically reducing the proportion of FTB-A for working parents facing high (over 50 per cent) EMTRs, as illustrated in Figure 8. Some 313,000 parents of FTB-A children would face high EMTRs under these options compared to 728,000 currently, a decline of 415,000 families. This is nearly half the total number of working-age families who faced high EMTRs in 2006 and appears therefore to be a significant improvement. However, one downside is that the cutout points for larger families become very high indeed, and higher still if RA is payable. There is also a danger of the base payment starting to taper before the higher rate has fully abated.
Figure 8: Proportion of FTB-A working parents facing high EMTRs, 2008–09, NATSEM Options 1 and 2.
Source: Harding et al., Improving work incentives for mothers, Figure 3, p. 14.
46 A Harding, Q N Vu, R Tanton and Y Vidyattama, Improving work incentives for mothers: the national
and geographic impact of liberalizing the Family Tax Benefit income test, paper presented at the 37th Australian Conference of Economists, Gold Coast, 1 October 2008.
18
Reducing tapers on family payments can be an efficient reform because of two factors. First, as noted earlier, secondary-income earners tend to have fairly high elasticities of labour-force participation with respect to the net wage rate. Second, it is known that the efficiency costs of high marginal tax rates are more than proportionate; instead, such costs are a quadratic function of the tax rate. So, prima facie, imposing a very high tax on families in order to lower taxes slightly on everyone else makes little economic sense.
FTB-A costs $12 billion per annum and its taper saves a roughly similar amount.47 If the taper were abolished and $12 billion raised from the rest of the taxpaying population, average income tax rates would need to rise by around three percentage points. But the taper on FTB-A raises taxes on families by 20 to 30 percentage points. On the face of it, this would seem a good argument for non-means-tested family payments but there is fierce resistance in the Australian community to the concept of middle-class welfare and a 10/20 taper like that proposed by NATSEM might be a reasonable compromise. If the taper is to be reduced in this manner however, it might seem more logical to abolish the current two-part taper completely and substitute a single continuous taper above the $44,165 threshold. Most families would be net winners.
The Henry Tax Review recommended a single taper on family payments of either 15 or 20 per cent to replace the existing two-part taper, a recommendation that also included a proposal to incorporate FTB-B into a single family payment, thus avoiding the problem of stacking FTB-A and FTB-B tapers. However, a problem with this second part of the proposal is that the FTB-B taper actually occupies an income zone which is lightly taxed (spousal incomes below the tax threshold) and thus tends to smooth EMTRs.
Proposals to reduce the FTB-A taper imply very high income cutouts for families in receipt of RA. For this reason, a single taper of 15 per cent, rather than the 10 and 20 per cent suggested by Harding et al., is preferable. Combined with the Henry Tax Review’s recommended income tax rate of 35 per cent, the EMTR for low- and some middle-income families is stabilised at 50 per cent—high, but in line with the rate indicated by a feasible linear tax system.
1.4 Raise the income tax threshold?
High EMTRs can be experienced by those who are subject to pension and allowance tapers interacting with income tax. Special tax allowances operate to exempt full-rate beneficiaries from tax but these then have to be pulled back so that EMTRs actually increase in the phase-out zones. The effect of this is illustrated in Figure 3 above, which shows that the actual EMTR facing a pensioner or allowee is not the relevant taper but rather an unpredictable rate resulting from tax interactions.
Raising the income tax threshold is one option for addressing this problem but marginal tax rates would need to be universally higher in order to fund the increase, a significant downside. In addition, these thresholds have been considerably raised in recent years due to the expansion of the LITO.
47 This is an estimate. Two-thirds of those potentially eligible receive FTB-A but some would receive only
a part benefit.
19
Poverty traps
In general, there seems little reason for thresholds to be higher than the incomes deemed adequate as a basic minimum, assumed to be around the basic rate of the pension, which is currently $18,228 for singles and $27,482 for couples.48 These rates are only slightly higher than the current tax threshold inclusive of the LITO at $16,000 per person.49 Accordingly, there appears to be a need for only modest increases in tax thresholds in order to keep them in line with pension rates but pension and allowance tapers do need to be designed to reflect the fact that taper and tax can operate simultaneously.
This argument is strengthened by the recent increase in the pension taper to 50 per cent, which will raise EMTRs for many pensioners.50
There is an argument for incorporating the LITO into the normal structure of marginal tax rates as withdrawing it adds four percentage points to tax rates above $30,000 per annum. There is a similar case for incorporating the Medicare levy into the normal marginal rate structure as it creates higher EMTRs over the income zones where it phases in.51
The Henry Tax Review recommended the incorporation of existing tax allowances and surcharges into a simple two-step tax structure, cutting in at $25,000 per annum and having a first marginal rate of 35 per cent. This is a sensible reform that helps to ameliorate tax/taper interactions. Sub-options might include a threshold of, say, $20,000 and a marginal rate around 33 per cent.
The Henry Tax Review also recommended that all pensions and allowance be non-taxable. An adverse implication is that for some clients the EMTR actually rises; the EMTR for a pensioner rises from 50 to 85 per cent when their taxable income reaches the tax threshold, similar to the current situation for DSP recipients (DSP is non-taxable). This
48 These rates include the pension supplement of $1,479 single and $2,231 couples.
49 If the partners in a couple both work, their effective tax threshold is double $16,000; it is much less if
only one works. The proposal for a standard work deduction of $1,000 will involve a de facto rise in the tax threshold to $17,000 for those with earnings. Various special rebates ensure that age pensioners in particular can enjoy a substantial private income before paying tax.
50 However, the effect is attenuated by the new Work Bonus that treats earned income more generously.
Under the new arrangements, only half of the first $500 of fortnightly employment income will be included in the income test so that as a person's employment income increases, their pension will reduce at half the rate it otherwise would have. Pensioners can receive a maximum benefit of $125 a fortnight under the Work Bonus. For earned income, the effect is that the initial taper becomes 25 per cent and the free area is doubled.
51 Harding et al. make a case for replacing the allowance tax offset with the more generous pensioner
tax offset in order to mitigate the large increases in EMTRs for sole parents and disabled people who are forced on to NSA as a result of the Howard Government’s ‘welfare to work’ reforms. The effect of this proposal is to increase tax thresholds for such clients materially. Sole parents on NSA face EMTRs of 65 per cent or more over a broad band of income, while for public housing tenants, EMTRs can exceed 80 per cent. The Harding et al. proposals also increase the Medicare levy threshold to equality with the pensioner threshold.
The downside of these proposals is that when people coming off NSA lose the increased tax offset, a ‘sudden-death’ loss of disposable income, or a notch, is created. The notch problem, in the view of Harding et al., can be ameliorated by allowing the pensioner tax offset to those sole parents and people with disabilities who lose NSA in the financial year they cease receipt and in the one following. See A Harding, Q N Vu and R Percival, Options for Reducing the Adverse Impact of the Proposed Welfare-to-Work Reforms upon People with Disabilities and Sole Parents, report to the National Foundation for Australian Women, November 2005. p10. This is a complex proposal, which seems inferior to a simple reduction in the taper on NSA.
20
high rate can apply over a substantial range of private income, particularly for a one-earner couple.
Whether or not a payment is taxable is actually not particularly important. If taxable, the taper needs to be designed to reflect the lower effective tax threshold, and vice versa. What is important is that the joint impact of taxing and means testing results in a rational EMTR structure.
1.5 Reduce the taper on allowances
It is difficult to reduce pension tapers because the EMTRs for pensioners are already at levels consistent with or even, in some cases, less than those of an affordable linear tax system. Age pensioners in particular are already protected from tax interactions by virtue of special rebates and so face an initial EMTR of zero then 25 and 50 per cent.52
Currently, there is a two-part 50 and 60-per-cent taper on NSA, YA-independent and the Sickness Allowance, which is harsher than the 50 per cent taper applicable to pensions. The free areas are also much lower. As Figure 3 shows, the effective tax rate across the NSA withdrawal zone is in the order of 65 per cent, which might not really encourage a low-wage earner to work part-time in this range. Such tax rates, if applied to the very well-off, would nowadays be regarded as punitive. The effect is that there is limited incentive for individuals to work their way out of unemployment by taking part-time work. However, there is an incentive for an NSA recipient to take full-time work as the minimum wage of $29,635 per annum is more than double the single NSA.
If the NSA taper were reduced, it would improve the incentive for people to take part-time work and would perhaps give them a foothold into the labour market. There is a risk, however, as it could create a situation where some people are happy to remain in part-time work supplemented by NSA income. There is also the possibility of a situation arising where a couple, one of whom is a minimum-wage earner, has a hypothetical entitlement to part NSA due to the cutouts exceeding the minimum wage. Neither of these risks is material, particularly given the current low level of the NSA and the NSA-free areas. In general, lowering tapers is better policy than raising free areas as it results in a better incentive to earn at the margin.
Accordingly, the recommendation is that the NSA, YA-independent and Sickness Allowance tapers be reduced to a single rate of 50 per cent, which would impact inside the tax thresholds recommended by the Henry Tax Review and would, in the main, keep EMTRs at 50 per cent.53 The NSA single cutouts would rise from $22,481 to $25,678 (still well below the minimum wage) and the couple cutouts from $20,527 to $23,332 each ($46,664 combined if both work). There would be a case for a slight consequent increase in the FTB-A threshold to prevent a notch problem arising.54
52 The 25-per-cent rate applies to the initial tranche of earned income and the 50-per-cent rate to other
income. 53
The calculation is as follows: earn $100, lose NSA of $50, income gain equals $50. Tax at 15 per cent equals $7.50. EMTR is 57.5 per cent. This is complicated by loss of the LITO and the phase-in of the Medicare levy.
54 Recall that the full (auto) rate of FTB-A is paid to allowees and pensioners whereas a part rate is paid
as soon as they come off allowance.
21
Poverty traps
1.6 Earned Income Tax Credit
The Earned Income Tax Credit (EITC) is an important part of family assistance in the US and there have been proposals to adopt it in Australia. Buddelmeyer et al. modelled the impact of an EITC on EMTRs in 2004.55 The policy proposed is a maximum $30-a-week payment tapering in at five per cent from the first dollar of family earnings and reaching a maximum of $1,560 per annum at an income of $31,200 per annum. It then phases out at 30 per cent after the first tier of FTB-A is abated. Essentially, the proposal slightly reduces EMTRs at low incomes but increases them in the middle-income ranges. This is an inherent trade-off in the design of an EITC and would exacerbate EMTR problems in Australia now that the taper on the FTB-A extends so far into the middle-income range.
Ingles examined EITCs and found that their relevance to the Australian tax-transfer system is unclear due to its comprehensive nature,56 which permits any desired structure of marginal rates to be achieved by manipulating the parameters of the system. The situation in the US is dissimilar in that the only assistance provided to working families with children consists of EITC and food stamps via the tax code.
Ingles concluded that the EITC may be good policy in the US, which lacks a comprehensive welfare safety net but in Australia there are other options available for achieving the goal of reducing EMTRs on the working poor. In addition, the EITC in the US is bedevilled by compliance problems and is not particularly well-targeted. Moreover, the Australian Taxation Office (ATO) might not be the best place for making an assessment of need since the social-security definition of income is much stricter. On balance, an Australian EITC seems likely to be an unnecessary complication to an already very complex system.
That is not to deny that there may be theoretical attractions in a system where benefits are conditional on workforce participation. In their review of the UK situation, Brewer et al. argue that ‘instead of traditional welfare programs with high withdrawal rates, large in-work benefits such as Working Tax Credit in the UK or the Earned Income Tax Credit from the US, which can have low or negative withdrawal rates, can be optimal’.57 But this is a complex further option and is not examined here.
2. Radical reform options: Guaranteed minimum income, negative income tax and demogrants
In its pure form, a negative income tax (NIT) or demogrant seeks to guarantee a minimum income to the whole population, irrespective of the reasons for any individual’s low income. These schemes are also known as basic income or participation income schemes,58 and they are very costly in terms of the RTR, which can be as high as 60 per
55 H Buddelmeyer, P Dawkins, J Freebairn and K Guyonne, ‘Bracket Creep, Effective Marginal Tax
Rates and Alternative Tax Packages’, A report by the Melbourne Institute in association with The Australian, Melbourne, 2004.
56 D Ingles, ‘Earned income tax credits: do they have any role to play in Australia?’, Australian Economic
Review 34:1, March 2001, pp. 14–32. 57
M Brewer, E Saez and A Shephard, Means-testing and tax rates on earnings, prepared for the Report of a Commission on Reforming the Tax System for the 21st Century, chaired by Sir James Mirrlees, The Institute for Fiscal Studies, 2008.
58 For a survey see J Tomlinson, Income Insecurity: The Basic Income Alternative, Queensland
University of Technology ebook, Carseldine, 2001.
22
cent. This imposes such adverse work incentives that most official and academic proposals in Australia settle on a hybrid approach with a higher level of income guarantee for those who fit into existing categorical groups (the aged, the disabled and so on) and a lower level of guarantee (or none) for those who do not. But even with this change, the RTR is still over 50 per cent.59
There are two broad approaches to this sort of scheme, demogrants and NITs. Demogrants are payments to the whole population regardless of income. People pay a proportional tax on every dollar of other income, offsetting the value to themselves of the demogrant so that at low incomes they receive net transfers from government and at high incomes they pay net tax. This creates a lot of churn, a term used when people pay tax and receive benefits at the same time. Paradoxically, the process makes for administrative economy but means that the apparent size of government is increased.
Churn can be largely eliminated by having a NIT or tax credit, whereby the tax and income guarantee payments are netted out and only the residual is then paid to low-income households. The net income received from or paid to government is exactly the same as under the demogrant proposal and the work incentives are approximately the same, but the apparent size of government is much less. For this reason the NIT (or tax credit) is generally preferred to a demogrant scheme.
Australia already has a form of NIT scheme insofar as most welfare payments are means tested and the combination of means tests and tax is such that clients with incomes exceeding the ‘free areas’ face high but (on average) broadly proportional effective tax rates over wide ranges of private income. However, it is a categorical scheme in that those not in welfare categories, the aged or the disabled for example, receive no basic income guarantee. However, they do receive the benefit of a substantial tax-free threshold and their disposable incomes eventually converge with the incomes of the favoured categories when the welfare payment is fully phased out. As Australia has, in effect, a categorical NIT, the question that arises is why not formalise and rationalise it so that all welfare clients and taxpayers face a designed structure of marginal rates?
These ideas have been around for a long time. In Australia, the most comprehensive proposal was that of the Henderson Poverty Inquiry, 1972–75, which costed a flat tax combined with universal demogrants set at the poverty level.60 At the time, the required tax rate was found to be 50 per cent on the whole population and was rejected as infeasible. Instead, the Henderson Inquiry proposed a two-tier demogrant with the lower tier being available to those not qualifying for inclusion in a categorical group. This and some other variations allowed the general tax rate to be lowered to 40 per cent. But the recommendations in this area that came out of the Henderson Inquiry were not taken up and its costings are no longer applicable, being now much too low.
This sort of guaranteed minimum income (GMI) has several implications:
59 Scutella models a system where the payment rates are set at those prevailing for pensioners and
allowees in 2001, basically a two-tier system. The RTR is 55 per cent without allowing for adverse labour-supply responses, which add about $9 billion to the cost of the scheme. In other words, the equilibrium RTR is some 57 per cent. See Scutella, Moves to a Basic Income-Flat Tax System in Australia, p. 23.
60 Australia, Commission of Inquiry into Poverty, Poverty in Australia, Vols. I and II, R Henderson
(chairman), AGPS, Canberra, 1975.

23
Poverty traps
1. The tax rate applicable applies to every dollar of income, in effect abolishing pension ‘free areas’; current concessional treatments for earned income would disappear.61
2. Because welfare payments are based on family income, tax thresholds are also based on family income and are exactly equal to the income levels where net welfare payments cease, thus creating a linear tax rate for welfare recipients.
3. Additional payments for children and possibly rent effectively become universal; means testing them would impose higher effective tax rates on families and therefore vitiate the supposed uniformity in marginal tax rates at all levels of income.62
Dawkins et al. re-worked the recommendations made by the Henderson Inquiry and found that the RTR for a non-categorical GMI had risen to 57 per cent by 1997.63,64 They examined a number of options for reducing the RTR, including a two-tier GMI where the lower tier was 25 per cent of the higher (similar to the original proposal of the Henderson Inquiry). Dawkins’ two-tier GMI proposal had an RTR of 52 per cent. Other sub-options further reduced the RTR but at the cost of a higher effective tax rate at some points in the income distribution. With no lower tier, the RTR was 50 per cent.
More recently, Humphreys of the Centre for Independent Studies has proposed a GMI ‘30/30’ scheme with:
• basic income guarantees of $9,000 a head for all low-income earners
• welfare payments that taper at 30 per cent
• tax thresholds set at the cutouts for welfare payments ($30,000 each)
• a linear tax rate of 30 per cent above the thresholds.65
This scheme does not rely on the family unit because income guarantees and therefore the tax schedules are based on the individual’s income. Partly paid for by the abolition of tax expenditures, the scheme also delivers a hoped-for efficiency dividend.
61 The work bonus for pensioners exempts the half the first $500 of fortnightly employment income. The
Working Credit scheme for other income support recipients allows a person to accrue up to $1,000 of credits to offset employment income once they commence work. The Student Income Bank allows the accumulation of up to $6,000 in credits to offset income above the free area. The NIT approach treats employment and asset income the same, although asset income can be deemed, which is the approach currently used for financial assets and which the Henry Tax Review has suggested should be extended. It has also recommended that the different free areas for pensioners and allowees should be retained.
62 A second proposal for a GMI was made in 1975. See Australia, The Priorities Review Staff,
Possibilities for Social Welfare in Australia, AGPS, Canberra, 1975. For a history, see Tomlinson, Income Insecurity.
63 P Dawkins, G Beer, A Harding, D Johnson, and R Scutella, Towards a negative income tax system, a
report to the Full Employment Project by the Melbourne Institute of Applied Economic and Social Research, University of Melbourne, 1997.
64 P Dawkins, G Beer, A Harding, D Johnson, and R Scutella, ‘Towards a negative income tax system
for Australia’, Australian Economic Review 31:3, 1998, pp. 237–257. 65
J Humphreys, Reform 30/30: rebuilding Australia’s tax and welfare systems, Perspectives on tax reform 10, Policy Monograph 70, Centre for Independent Studies, 2005.
24
However, the required tax rate if such a scheme is not to disadvantage the lowest-income welfare clients is at least 57 per cent, not 30 per cent.66 Welfare spending has been a relatively constant share of GDP in the last 10 years and thus it is likely that this remains a relevant costing,67 perhaps even an understatement given recent rises in the base pension. The Humphreys plan would appear to have the effect of almost halving the maximum payments (inclusive of supplements), especially for singles.68 Modelling by Scutella indicates that ‘a decline in the level of basic income of at least half is required to fund a reduction in the marginal tax rate to thirty percent. While the distortions to behaviour are minimal, it is extremely inequitable and social welfare reducing, even after accounting for changes in labour supply’.69
Therefore, the question posed in this paper is how can the RTR be reduced materially below 50 per cent without disadvantaging welfare clients? This is a big ask as something like $6 billion to 7 billion is required to finance a one-percentage-point reduction in the RTR.70
2.1 A note on convergence
Convergence is a desirable attribute of a categorical GMI. Basically, it means that there is a level where the disposable incomes of those in the favoured categories and those in the non-categorical group converge. This appears to be equitable insofar as people with categorical characteristics such as age might not be deemed to need extra welfare assistance once they reach a certain level of private income.
In the current system, convergence is achieved at the pension and allowance cutouts and at much higher incomes for families. In a categorical NIT, convergence can be achieved by setting the tax thresholds equal to the welfare cutouts, resulting in very high tax thresholds although not quite so high as the current pension cutouts of $40,149 for singles and $61,412 for couples.71 This is one reason for the RTRs being so high in the NIT proposal.
If the NIT is two-tiered, convergence can be achieved in several ways. One way is for the initial taper to be lower than the normal taper in proportion to the ratio between the upper-tier and lower-tier payments. For example, if the lower-tier payment were half the upper, the tax rate on the lower tier could apply from the first dollar of income but be halved up to the income where the categorical group reached break-even (the pension cutouts, in other words). Thereafter, the full tax rate would apply.
66 Dawkins et al., Towards a negative income system.
67 See also Scutella, Moves to a Basic Income-Flat Tax System in Australia.
68 Not quite half, as Humphreys’ plan also eliminates tax expenditures and this finances some part of the
new transfers. 69
Scutella, Moves to a Basic Income-Flat Tax System in Australia. 70
In 2009, the income tax base was $0.6 trillion per annum compared with GDP of $1.1 trillion per annum. The income tax base is less than GDP for a number of reasons; for example, GDP includes depreciation and some income flows to overseas asset holders while the income tax base does not include retained earnings of corporations, contributions to super and to workers compensation, imputed income from housing, or earnings in super funds.
71 The tax thresholds in the NIT are lower as in the base case there is no pension-free area.
25
Poverty traps
It is generally assumed in this paper that there would be no lower tier and the tax threshold would equal the pension cutout. The Henry Tax Review proposed three tiers of payments in the welfare system, pensions, ‘participation payments’ and youth payments at progressively lower levels. This structure, in fact, lacks theoretical underpinning since it basically reflects, and actually entrenches, existing disparities in the payment system. However, assuming that such differentiation is to continue under a GMI, the neatest manner in which it can be made to work is to set the taper on each sort of payment lower in proportion to the rate of the payment.
For example, if the participation payment is 80 per cent of the pension, the taper can be 40 per cent and the cutout point will stay the same as that for the pension. A second option for those on the lower tier is to have a high free area before tax begins to apply but the use of free areas is economically inferior to lower tapers in promoting workforce participation. A third option is for participation and youth payments to cut out at income levels well below the pension cutouts but as this results in a high-low-high EMTR structure, the resulting system is inefficient relative to the use of lower tapers.
2.2 A note on the family unit assessment basis
As noted above, a logical way to dovetail the tax and social-security income units is to move the tax system to a family-unit basis but if this were to be regarded as undesirable, it can be avoided. One method would be to pay single payments at half the married rate (and apply the same relativity in tax thresholds), together with a living-alone supplement to bring the single relativity up to some level such as the existing 66 per cent ratio in the pension system.72 This supplement could then be means tested so that it would be wholly exhausted by the time the pension taper ceased.
The required supplement would be $4,487 per annum and the basic individual rate $13,741, making the supplement 33 per cent of the pension. It follows that the supplement taper would bear a similar relationship to the pension taper, making the necessary rate 16 per cent. But having a pension taper of 66 per cent for singles and 50 per cent for couples might seem inefficient and unfair.73 Also, the proposal for a living-alone allowance to replace the differential single rate raises some thorny issues. On balance, the family-unit approach seems simpler and, because of the nearly linear tax rates, is not very different from an individual system in terms of incentives.
Options for reducing the RTR
There are a number of options for reducing the RTR but the simplest, reducing payment rates, can be ruled out for equity reasons. Options relating to tightening categorical eligibility are also found to be unviable. If, for example, the number of age pensioners is reduced by further increasing the pension age, their numbers might optimistically be cut by, say, a fifth. Without going into the merits of such a change, it is sufficient to note that this would trim only one percentage point from the RTR. Similar mathematics applies to
72 In New Zealand, the single rate of pension is 60 per cent of the couple rate and there is also a living-
alone supplement, which brings this to 65 per cent for some singles. 73
Currently, the system reconciles this tension by subjecting singles to a longer taper and, over this income range, the individuals in the couple catch up; this is not feasible in a system where the EMTR is everywhere the same.
26
other possible changes in eligibility. The RTR is largely a function of the maximum pension rate and its relationship to average community income.
It would be possible to reduce the average EMTR by imposing very high initial EMTRs. For example, welfare tapers could be very high and coupled with a lower linear rate after an individual leaves the welfare system. This is not regressive as long as the average tax rate, taking transfers into account, is rising. But on equity grounds it seems somewhat perverse for work disincentives to be greater for low-income earners than for high-income earners.74
The following options are discussed in more detail. Option 1 is to broaden the income tax base radically, which might include heavier taxation of owner-occupied housing.
Option 2 is to rely more heavily on indirect taxes, which helps to conceal the true size of the tax ‘wedge’ and has possible benefits. But it tends to be regressive unless accompanied by other more progressive tax changes such as income tax base broadening. It may also be necessary to establish a lower tier to the NIT to protect the position of those whose incomes are too low to be compensated with income tax cuts.
Option 3 is to take some welfare payments (notably family payments) out of the NIT linear tax system so that their means tests ‘stack’ with the linear tax, subjecting their clients to a higher EMTR over the relevant income range. However, this is found not to be particularly effective and creates work disincentives for secondary-income earners.
Option 4 involves a combination of income tax and consumption tax base broadening. It appears to resolve the difficulties with either approach taken by itself but involves significant political obstacles.
Option 5 is to set tax thresholds for ordinary taxpayers at lower levels than the pension cutouts, with a broad middle tax rate lower than the linear tax rate in the welfare system. This moves the scheme closer to the existing system and appears to bring some advantages as there seems little reason in principle not to tax people whose incomes exceed some sort of poverty-line minimum. The task then becomes one of modifying EMTR schedules for welfare clients to make them more rational.
In all the options canvassed below it is assumed that the Henry Tax Review’s suggestion for a $25,000 tax threshold and a wide 35–per-cent marginal rate are taken up, as this is a sensible and obvious reform, which allows the removal of various ad hoc special rebates.
Option 1: Income tax base broadening
It is arguable that earlier NIT or GMI schemes implied RTRs that were unacceptable, in part because they relied too heavily on using narrowly defined taxable income as the tax base even though, in some cases, forms of base broadening were proposed, for example
74 In a report for the Mirrlees Review, Brewer et al. suggest that for the UK, the optimal structure of
marginal rates may be U-shaped. At very low levels of earnings, the optimal marginal tax rate is computed to be around 70 per cent but it falls rapidly, reaching 36 per cent as incomes approach £30,000 per annum, eventually settling around 64 per cent for incomes around £200,000. Results from such ‘optimal tax’ analysis need to be taken with a grain of salt however. See Brewer et al., Means-testing and tax rates on earnings, p. 20 and p. 55.
27
Poverty traps
by the Henderson Inquiry. This paper therefore examines what could be done if radical income tax base broadening were to be contemplated.75
In recent papers, The Australia Institute has examined possible income tax base broadening reforms with options that include a dramatic reduction in super concessions (raising up to $21 billion) and the abolition of capital gains discounts ($9 billion).76,77 Together, these sorts of major changes could raise $30 billion and reduce the RTR from 50 to 45 per cent.
Even more dramatic base broadening is possible if, under a fully fledged comprehensive income approach, owner-occupied housing were to be included in the capital gains tax base ($20 billion net).78 This measure, together with the other capital gains and superannuation changes, could reduce the RTR to 42 per cent.
Going further and including imputed rent in the capital gains tax base ($15 billion net revenue) may be good tax policy but is actually counterproductive where the RTR is concerned because it impacts on low-income owner-occupiers whose welfare payments would need to rise to maintain their standard of living.79 The cost of such compensation adds to the RTR and takes it back over 50 per cent.80
75 It is a feature of NIT approaches that they tend to have the same income definition in the tax system
as they do in the welfare system, which allows for seamless integration of the two. But it can create problems as the welfare system typically uses a tighter definition of income, disallowing negative gearing and including salary sacrifice amounts for example. It also incorporates a separate assets test. One option is simply to live with different income bases in the negative and positive parts of the tax system and the Henry Tax Review suggested that this was actually desirable. Another option is to tighten income definitions in the tax system so that they become similar to the welfare system. Sufficiently wide base broadening measures might allow the separate social security assets test to be abolished. Alternatively the tax system could be made more like the welfare system by deeming income from assets at rates reflective of long-run average returns from the various asset classes. The Henry Tax Review recommended that the separate welfare asset test be abolished and replaced by a wider use of deeming.
76 D Ingles, The great superannuation tax concession rort, Research Paper 61, The Australia Institute,
February 2009. 77
D Ingles, Tax equity: Reforming capital gains taxation in Australia, Technical Brief 1, The Australia Institute, April 2009.
78 Treasury, Tax Expenditures Statement 2009, Australian Government, Canberra, 2010. Interest and
other costs totalling $19 billion are apportioned between capital gains and imputed rent in proportion to the size of these gross items ($31.5 billion and $23.5 billion respectively) in order to give the net figures in the text. The figure assumes abolition of the 50 per cent CGT discount.
79 The other option is that pensioners would be able to incur a debt against the value of their houses.
80 The Treasury tax expenditure estimate appears to impute approximately 2.25 per cent of house
values as imputed income, or possibly three per cent if there is no mortgage. On a median $450,000 home, this would add $13,500 per annum to assessable income and result in a cost to pensioners of some $6,000 per annum or $115 a week. If base pension rates were grossed up to cover this, the average increase in the pension would be 30 per cent (more for singles, less for couples) and, accordingly, the RTR blows out to 50 per cent.
The mathematics is as follows. Base-broadening measures raise $65 billion at, say, an average 35 per cent marginal tax rate. Therefore the potential tax base is $600 billion plus $185 billion, equalling $785 billion. Required revenue is $300 billion, 38 per cent of $785 billion (50 per cent of $600 billion). But compensating for imputed rent taxation raises all basic payments by 30 per cent and increases the RTR back to 50 per cent.
The family home is by far the biggest asset concessionally treated under the current income tax and welfare systems and there are arguments for bringing it into the tax net in some form. Proposals have
28
This paper suggests using the 42 per cent linear rate as the base, which supposes a radical base broadening but no tax on imputed rent. The linear tax assumes no free areas but if they are retained, the tax rate for welfare clients needs to come up to, say, 47 per cent. This is still a substantial improvement for allowees; pensioners would experience a higher taper on earned income but a lower taper on asset income, compared to the current system. If some surcharge were to be maintained for high-income earners, the result would possibly be a 47/42/47 tax-rate structure so that, overall, the effective tax rate is more nearly linear and no low-income earners would face an EMTR higher than the highest-income earners.
The income tax thresholds become very high, equal to the cutouts on the pension means test at $40,149 per annum for singles and $61,412 per annum for couples. Thus, although the standard tax rate is raised from 35 to 42 per cent, the average tax rate is actually lowered by virtue of the much higher thresholds.
These appear to be very high tax thresholds but recall that they are levied on a much broader base than that currently applying. The inclusion of housing in the tax base effectively lowers tax thresholds for homeowners, particularly those with substantial equity. The median homeowner is left unaffected but those with substantial housing assets are worse off in what amounts to a large redistribution in favour of renters and new homebuyers.
Overall, however, it is difficult to see this as a practical program. Resistance to the sort of base broadening measures proposed here would be fierce. In addition, the rationale for the very high tax thresholds involved in this plan would not be very apparent; it was argued earlier that net tax payments should probably commence at around a poverty-line level of income in order to reduce marginal tax rates on average.
Option 2: Emphasis placed on broad-based consumption and wage taxes
Another alternative is to rely more heavily on broad-based consumption taxes such as the GST or payroll tax. Although the Henry Tax Review suggested that alternative forms of consumption taxation be considered, its terms of reference ruled out the first option. However, while payroll tax and GST are owned by the states, this situation is not immutable.
If the GST rate were to be doubled and the exemptions removed, the extra revenue would be $65 billion, allowing the RTR to reduce by 11 percentage points to 39 per cent. Payroll tax raises $15 billion, 3.7 per cent of the potential tax base of $560 billion.81 A 10–per-cent flat payroll tax would raise up to $55 billion ($40 billion extra), allowing the RTR to fall to
been made to include it in the pension means test (see S Kelly, Reform of the Australian Retirement Income System, NATSEM research report, prepared for the Brotherhood of St Laurence, NATSEM, Canberra, 2009) and base broadening is another way of achieving this. A particular attraction of this option is that the inclusion of imputed rent allows, indeed forces, the base rate to be raised and then separate rent assistance can be abolished, a move which greatly simplifies the system as the RA scheme is quite complex. There is no tax equity case for specific rent assistance when housing is properly taxed or means-tested. But, as noted above, the EMTR gains from dramatic base broadening incorporating imputed rent are substantially unwound by the scale of assistance necessary to recompense low-income homeowners.
81 The wage bill is $560 billion inclusive of SG super contributions and Workers Compensation
premiums. The typical rate is 5.5 per cent but there are large exclusions for smaller employers.
29
Poverty traps
43 per cent. Combined, the two tax measures would allow the RTR to fall to around 32 per cent.82 This looks encouraging but the adjustment path is, to say the least, difficult.
Note that this reform in no way reduces the aggregate tax ‘wedge’ from the NIT proposal, which in a wage sense is the difference between the net pay to the worker and what it costs a company to hire the worker. In a consumption sense, it is the difference between the employer’s costs and the worker’s real level of available consumption. But tax-mix change makes the wedge less apparent and may thereby improve the political acceptability and also the work incentives of the reform. Although this relies on a degree of fiscal illusion, a bit of smoke and mirrors may be no bad thing in tax policy.
There are a number of objections to raising indirect taxes in this manner. First, it tends to increase wage costs and inflation and a measured phase-in would be essential. Second, the overall tax incidence tends to become less progressive so the proposals would need to be counterbalanced by income tax base broadening pitched particularly at the well-off.83
Third, it raises the net tax burden on people with very low incomes who are nonetheless outside the categorical system (those within the system will be compensated by appropriate indexation), so a new lower-tier payment would be needed. For example, if the effective tax rate on wages plus consumption were to be lifted from 10 to 30 per cent, a single taxpayer on the poverty line of approximately $17,000 per annum could be compensated by way of a refundable tax credit of about $3,400 per annum. Any such new tax credit would raise the RTR from 32 per cent to around 34 per cent. Nonetheless, on balance this approach to introducing a NIT has some attraction.
82 The aggregate numbers used are as follows:
• GDP is $1.2 trillion
• taxable income is $660 billion
• GST-taxable consumption is $500 billion
• GST revenue is $50 billion
• non-taxable consumption is $110 billion
• GST tax expenditure on exempt items like food and healthcare is $11 billion
• income tax revenue is $140 billion, 21 per cent of taxable income
total revenue recouped from taxing and means testing must be in the order of $330 billion. 83
A measure that would have a similar effect to the indirect tax option involves applying income tax at around 20 per cent from the first dollar of private income. In order for people on the poverty line to be left in a neutral position, this would suggest the need for a lower tier of non-categorical payments of about $65 a week. The pension taper would become a flat 32 per cent, and would operate in tandem with the 20-per-cent base income tax rate, giving an EMTR of 52 per cent. At the pension cutouts, very high at $53,000 for singles and $80,000 for couples, the income tax rate would rise to 52 per cent.
The net result would be to have breakeven points (where payments in equalled taxes out) at around the existing tax thresholds so that the effect is similar to the existing system. However, there seems little advantage in levying a broad, universal 20-per-cent tax directly whereas levying it indirectly would prevent millions of people from being caught up in the administrative hassles of the direct tax net. A further benefit of the indirect tax option is that the total tax wedge is concealed and this may have work-incentive benefits not achievable if reliance is placed only on income tax. There are also compliance benefits to be gained from spreading the tax base into several different taxes as it would be difficult for a person to avoid all three categories.
30
Option 3: Remove some payments from the linear tax system
A further option is to remove certain payments from the linear system and allow the tapers to stack. FTB-A is the obvious candidate, together with Commonwealth RA. The linear tax effectively removes the taper on these payments by making the same amount payable at every level of private income.84
There are some five million dependent children and students in Australia with an average maximum benefit of around $5,000 per annum. If all these payments were means-test-free, the cost would be some $25 billion or, say, $30 billion inclusive of RA.85 A separate means test86 reduces the cost to, say, $15 billion, a saving of $15 billion, which makes a small, 2.5-percentage-point drop to the RTR but requires families to face a higher rate of around 68 per cent. The cost, therefore, is the much higher tax rate that would need to apply to families. Because the rate would apply to all family income, it would impact secondary-income earners and affect their work incentives. This option, therefore, has little appeal from a tax-efficiency perspective.
Option 4: Combination of base-broadening approaches
Addressing only the indirect tax options, the narrowness of the tax bases (payroll, value added, and taxable income) results in the RTRs being higher than they really need to be. Combining the approaches might prove more efficient.
By analogy, the RTRs under the income tax base-broadening option (1) can be further reduced by measures on the indirect tax side, which has the advantage of imposing some tax on incomes below the income tax thresholds for those not in the welfare system. This makes sense given the high thresholds implicit in the NIT proposal. If the option to double payroll tax and the GST is included and exemptions removed, extra revenue of $105 billion is raised and the RTR reduced from 42 per cent, as in the basic income tax base-broadening proposal, to 25 per cent.87 A lower tier to the NIT raises the RTR to 27 per cent.
Retaining the pension-free areas raises the required pension taper to, say, 32 per cent and a surcharge on high incomes gives a direct tax rate structure of, say, 32/27/32. In this combination, the overall tax system retains its progressivity by virtue of the significant increases in tax thresholds and the income tax base-broadening measures and, together with the low NIT first-tier payment, offsets the regressivity of the big increases in indirect taxation. But whether this would be widely perceived as an improvement on the current
84 This is necessary because otherwise families and renters would face higher effective tax rates than
the linear rate applicable to everyone else. However, the Australian public is resolutely opposed to so-called ‘middle-class welfare’.
85 The Budget puts assistance to families with children at $30 billion but this includes payments to
single-parent families and payments for child care. Spending on FTB-A is $13 billion. RA costs $2.5 billion.
86 The assumption here is that the differential would remain at the 20-per-cent rate broadly applicable
under the current complex set of means tests. 87
This is an approximation as there would be some feedback between the various taxes. A full-scale modelling exercise is necessary to cost the changes properly, a task beyond the scope of the present paper.
31
Poverty traps
system is the key issue; the ‘standard’ income tax rate is only slightly reduced even though the increases in the tax thresholds are significant.
Most taxpayers would not face income tax at all. The resulting system looks attractive to tax theorists but could it be sold to the public?
Option 5: Retain multi-rate income tax system
A final option, which does not involve base broadening or indirect taxes, is to set tax thresholds for ordinary taxpayers at lower levels than the pension cutouts, with a broad, middle tax rate lower than the linear tax rate in the welfare system. This avoids the need for a lower tier to the NIT and moves the scheme closer to the existing system.
The rationale is that when the idea of a non-categorical NIT is abandoned, the basic simplicity of having a single marginal rate on the entire population is lost. Achieving convergence, requires the income tax structure for the non-categorical group to appear quite strange, with a very large threshold and then a very high single marginal rate
Alternatively, convergence can be delivered by setting an intermediate tax rate for non-pensioners that extends beyond the pension cutouts, only rising to the pension (standard) tax rate well above this level. To achieve the goal of a fixed proportional tax rate for pensioners (for example, the aged) and other welfare clients, there would need to be special tax rebates, which would prevent tax being payable up to the pension cutouts.
Much the same effect can be achieved in the existing system by having tax rebates for pensioners that prevent them paying tax prior to income levels corresponding to the pension cutouts; such rebates would phase out beyond the cutouts at a 15 per cent rate under the income tax system proposed by Henry, thus maintaining the EMTR for pensioners at 50 per cent both before and after the pension cutouts. A similar system could apply to other welfare clients.
The effect would be that people receiving payments would not face EMTRs higher than 50 per cent. They would either receive means-tested payments from the government and pay no income tax, or pay income tax and receive no payments. Such as system, described by Ingles88 as ‘full separation’, almost eliminates welfare ‘churn’ (the situation where clients both receive benefits and pay tax at the same time). However, it does raise some difficult implementation issues.
Another approach, called harmonisation, involves setting welfare tapers by reference to income taxes, such that the combined taper is sensible. For example, if the pension is taxable and the tax threshold is roughly equal to the pension rate, the pension taper could be 25 per cent, resulting in a combined EMTR of 51.25 per cent.89 Similar mathematics could apply to family payments if their taper were 15 per cent.90 The main drawback of the harmonisation approach is that it relies on the income tax to effect half the clawback and
88 D Ingles, Rationalising the interaction of tax and social security: Part 2: Fundamental Reform Options,
Discussion Paper 424, Centre for Economic Policy Research, Australian National University, 2000. 89
Since the payment is taxable, the EMTR is 25 per cent plus 35 per cent of 75 = 26.25+25 = 51.25 per cent.
90 Recall that family payments are not taxable so the tax and taper rates are additive; 15 plus 35 equals
50-per-cent EMTR.
32
its base is less comprehensive than the means test. However, income tax base broadening would mitigate this disadvantage.
These sorts of options indicate that it is possible to achieve the goal of a single marginal tax rate for welfare clients without implementing the full NIT approach. Nevertheless, there will be cost involved.
Conclusion
This paper concludes that the NIT approach, while it has theoretical attractions, requires such high tax rates that it is probably not practical. This is particularly true of its non-categorical form but also appears true of its categorical form. In fact, these high tax rates already exist but they are concealed by the complexity of the system and by the fact that people probably fail to realise that they face them.
The high tax rates necessary under the NIT can be reduced by income tax base-broadening measures, but these are so extensive and require such a strong political will that they may not be feasible.
A way to reduce the RTR materially is by base broadening on the indirect tax side but this is also politically difficult and tends to be regressive unless counterbalanced by direct income tax base broadening. A combination of these two approaches is feasible and produces a system that may be quite attractive overall but, again, would require a political will that may not materialise.
Hence, the best that can realistically be hoped for at present is a combination of measures designed to address the worst of the current EMTR problems, financed by modest base-broadening measures focused on superannuation, capital gains, negative gearing and fringe benefits.
The measures specifically recommended are as follows:
• reduce the NSA and YA (unemployed) taper to a flat 50 per cent
• reduce the FTB-A taper to a flat 15 per cent and abolish the two-tier structure
• reduce the YA-dependent taper to 15 per cent
• abolish ‘auto’ max-rate FTB-A and YA for welfare recipients and instead pay the rate appropriate to their income, thus avoiding the ‘notch’ problem.
NSA costs $5 billion per annum and the reduced taper might add $.5 billion to its cost. There would also be flow-on costs for YA (independent). Changes to the FTB-A taper are costed by NATSEM at $1.7 billion and the modification suggested might reduce this to $1.5 billion. Reducing the YA-dependent taper might cost $.5 billion.91 Abolishing ‘auto’
91 Ingles’ YA unstacking proposal cost $200 to $300 million in 2000. Reducing the YA taper to 15 per
cent might be expected to double the cost. See Ingles, Rationalising the interaction of tax and social security, part 1.
33
Poverty traps
FTB-A does not involve a cost. In total, the suggested changes could probably be implemented for around $2.5 billion net.92
The further option of abolishing SHRRs and replacing them with an expanded scheme of Commonwealth RA might cost an additional $2 billion.93
The government should also examine the option of introducing a linear effective-tax-rate structure for welfare clients using the device of tax rebates that prevent anyone receiving a part-pension or allowance from paying tax. This approach, while further improving work and saving incentives, is likely to be costly. However, these sorts of monies can be readily found in the context of major tax reform. For example, the Henry Tax Review recommended income tax scale might commence at $24,000 rather than $25,000, thus raising some $3.5 billion, which might suffice to fund the changes suggested.
These options would result in a more efficient and fairer system. It is also possible that there would be some net efficiency dividend (increased work hours) from these changes, although this would require a full-scale modelling exercise to calculate. The gain would mainly come from substituting lower tax rates on low-income, secondary earners with slightly higher tax rates on primary earners.
More substantive changes towards adopting a NIT are a theoretical possibility and should reap efficiency dividends but will require a willingness to consider policy options that are extremely difficult politically, notably a much greater reliance on payroll and consumption taxes and/or an extensive income tax base-broadening exercise. The case for or against such changes should be based on their intrinsic merits and not on perceptions of the desirability of an NIT. Most of the benefits of a NIT are achievable by sensible structural reform of existing tax and means-test interactions.
92 The option of raising RA and abolishing SHRRs has not been costed. This could be up to $2.5 billion,
depending on the rates adopted. 93
The RA scheme costs $2.3 billion and assists 940,000 recipients. SHRRs cost around $1.6 billion and assist 330,000 households, so the implicit SHRR subsidy is roughly double that under RA. (Figures in K Henry, J Harmer, J Piggott, H Ridout and G Smith, Australia's Future Tax System: Report to the Treasurer, Part Two: Detailed Analysis, Canberra, 2009, p. 599.) The costing assumes that state spending on SHRRs is clawed back under an expanded Commonwealth RA scheme.
34
Bibliography
ACOSS (2008). Strong foundations: Reforming the tax and social security systems, Submission to the Taxation Review Panel, October. Available at: http://acoss.org.au/upload/publications/submissions/5252__ACOSS%20Submission%20-%20Directions%20for%20tax.pdf
Australia, Commission of Inquiry into Poverty (1975). Poverty in Australia, Vols. I and II, R Henderson (chair), AGPS, Canberra.
Australia, Priorities Review Staff (1975). Possibilities for Social Welfare in Australia, AGPS, Canberra.
Beer, G. (2002). Work Incentives Under a New Tax System: The Distribution of Effective Marginal Tax Rates in 2002, paper presented to the 2002 Conference of Economists, Canberra, 30 September—3 October (Revised November 2002). Available at: http://www.canberra.edu.au/centres/natsem/publications?sq_content_src=%2BdXJsPWh0dHAlM0ElMkYlMkZhbmltYWwuY2FuYmVycmEuZWR1LmF1JTNBNTgwJTJGbmF0c2VtJTJGaW5kZXgucGhwJTNGbW9kZSUzRHB1YmxpY2F0aW9uJTI2cHVibGljYXRpb24lM0Q4MjAmYWxsPTE%3D
Brewer, M, Saez, E and Shephard, A (2008). Means-testing and tax rates on earnings, prepared for the Report of a Commission on Reforming the Tax System for the 21st Century, Sir James Mirrlees (chair), The Institute for Fiscal Studies. Available at: http://www.econ.berkeley.edu/~saez/brewer-saez-shephardIFS08taxrates.pdf
Buddelmeyer, H, Dawkins, P, Freebairn, J and Guyonne, K (2004). Bracket Creep, Effective Marginal Tax Rates and Alternative Tax Packages, A report by the Melbourne Institute in association with The Australian, Melbourne. Available at: http://melbourneinstitute.com/labour/downloads/WebReport.pdf
Centrelink (2008). Working credit, Australian Government. Available at: http://www.centrelink.gov.au/internet/internet.nsf/filestores/lw015_0809/$file/lw015_0809en.pdf
Centrelink, (2009). ‘Parental income test’. Available at: http://www.centrelink.gov.au/internet/internet.nsf/payments/parent_income_iat.htm
Centrelink (2009). ‘Work bonus’, Australian Government. Available at: http://www.centrelink.gov.au/internet/internet.nsf/individuals/ssp_work_bonus.htm
Colombino, U, Locatelli, M, Narazani, E, O’Donoghue, C and Shima, I (2008). Behavioural and Welfare Effects of Basic Income Policies: A Simulation for European Countries, EUROMOD Working Paper No. EM5/08, European Centre for Social Welfare Policy and Research, Vienna.
Dawkins, P, Beer, G, Harding, A, Johnson, D and Scutella, R (1997). Towards a negative income tax system, a report to the Full Employment Project by the Melbourne Institute of Applied Economic and Social Research, University of Melbourne.
Dawkins P, Beer, G, Harding, A, Johnson, D and Scutella, R (1998). ‘Towards a negative income tax system for Australia’, Australian Economic Review 31:3, pp. 237–257.
35
Poverty traps
Dockery A M, Ong, R and Wood, G (2008). Welfare Traps In Australia: Do They Bite? Centre for Labour Market Research, Curtin Business School, Curtin University of Technology, CLMR Discussion Paper Series 08/02.
Dockery A M, Feeny, S, Hulse, K, Ong, R, Saugeres, L, Spong, H, Whelan, S and Wood, G (2008). Housing assistance and economic participation, National Research Venture 1: Housing assistance and economic participation, Final Research Paper, Australian Housing and Urban Research Institute, Melbourne. Available at: http://www.ahuri.edu.au/nrv/nrv1/nrv1_docs.html
Harding, A, Vu, Q N and Percival, R (2005). Options for Reducing the Adverse Impact of the Proposed Welfare-to-Work Reforms upon People with Disabilities and Sole Parents, report to the National Foundation for Australian Women, November. Available at: http://www.canberra.edu.au/centres/natsem/publications?sq_content_src=%2BdXJsPWh0dHAlM0ElMkYlMkZ6aWJvLndpbi5jYW5iZXJyYS5lZHUuYXUlMkZuYXRzZW0lMkZpbmRleC5waHAlM0Ztb2RlJTNEcHVibGljYXRpb24lMjZwdWJsaWNhdGlvbiUzRDc4MCZhbGw9MQ%3D%3D
Harding, A, Vu, Q H, Payne, A and Percival, R (2006). ‘Trends in effective marginal tax rates 1996–97 to 2006–07’, AMP Natsem Income and Wealth Report, Issue 14, September. Available at: http://www.amp.com.au/dafiles/AU%20Retail/AU%20Retail/Files/StaticFiles/183330_NATSEM_Issue_14_Effective_Marg.pdf
Harding, A, Vu, Q N, Tanton R and Vidyattama, R (2008). Improving work incentives for mothers: the national and geographic impact of liberalizing the Family Tax Benefit income test, paper presented at the 37th Australian Conference of Economists, Gold Coast, 1 October. Available at: http://www.canberra.edu.au/centres/natsem/publications?sq_content_src=%2BdXJsPWh0dHAlM0ElMkYlMkZhbmltYWwuY2FuYmVycmEuZWR1LmF1JTNBNTgwJTJGbmF0c2VtJTJGaW5kZXgucGhwJTNGbW9kZSUzRHB1YmxpY2F0aW9uJTI2cHVibGljYXRpb24lM0QxMTI1JmFsbD0x
Henry, K, Harmer, J, Piggott, J, Ridout, H and Smith, G, (2009). Australia's Future Tax System: Report to the Treasurer. Part One, Overview, Canberra. Available at: http://taxreview.treasury.gov.au.
Henry, K, Harmer, J, Piggott, J, Ridout, H and Smith, G, (2009). Australia's Future Tax System: Report to the Treasurer. Part Two, Detailed Analysis, Canberra. Available at: http://taxreview.treasury.gov.au.
Humphreys, J (2005). Reform 30/30: rebuilding Australia’s tax and welfare systems, Perspectives on tax reform 10, Policy Monograph 70, Centre for Independent Studies. Available at: http://www.cis.org.au/policy_monographs/pm70.pdf
Ingles, D (1997). Low Income Traps for Working Families, Discussion Paper no. 363, Centre for Economic Policy Research, Australian National University, April.
Ingles, D (2000). Rationalising the interaction of tax and social security: Part 1: Specific problem areas, Discussion Paper 423, Centre for Economic Policy Research, Australian National University. Available at: http://econrsss.anu.edu.au/pdf/DP423.pdf.
Ingles, D (2000). Rationalising the interaction of tax and social security: Part 2: Fundamental Reform Options, Discussion Paper 424, Centre for Economic Policy Research, Australian National University. Available at: http://econrsss.anu.edu.au/pdf/DP424.pdf.
36
Ingles, D (2001). ‘Earned income tax credits: do they have any role to play in Australia?’, Australian Economic Review 34:1, March, pp. 14–32.
Ingles, D (2009). The great superannuation tax concession rort, Research Paper 61, The Australia Institute, February. Available at: https://www.tai.org.au/index.php?q=node%2F19&act=display&type=1&pubid=540
Ingles, D (2009). Tax equity: Reforming capital gains taxation in Australia, Technical Brief 1, The Australia Institute, April. Available at: https://www.tai.org.au/index.php?q=node%2F19&act=display&type=1&pubid=545
Kelly, S (2009). Reform of the Australian Retirement Income System, NATSEM research report, prepared for the Brotherhood of St Laurence, NATSEM, Canberra. Available at: http://www.bsl.org.au/pdfs/NATSEM_BSL_Reform_of_Australian_retirement_income_system.pdf
McClure, P (2000). Participation support for a more equitable society, Final Report of the Reference Group on Welfare Reform, Department of Family and Community Services, Canberra.
Scutella, R (2004). Moves to a Basic Income-Flat Tax System in Australia: Implications for the Distribution of Income and Supply of Labour, Melbourne Institute Working Paper No. 5/04, Melbourne Institute of Applied Economic and Social Research The University of Melbourne. Available at: http://www.melbourneinstitute.com/wp/wp2004n05.pdf
Tomlinson, J (2001). Income Insecurity: The Basic Income Alternative, Queensland University of Technology ebook, Carseldine. Available at: http://www.geocities.com/ubinz/JT/IncomeInsecurity/
Toohey, M and Beer, G (2003). Is it Worth Working Now? Financial Incentives for Working Mothers under Australia’s new Tax System, paper presented to the 2003 Australian Social Policy Conference, Canberra, 9 July. Available at: http://www.canberra.edu.au/centres/natsem/publications?sq_content_src=%2BdXJsPWh0dHAlM0ElMkYlMkZhbmltYWwuY2FuYmVycmEuZWR1LmF1JTNBNTgwJTJGbmF0c2VtJTJGaW5kZXgucGhwJTNGbW9kZSUzRHB1YmxpY2F0aW9uJTI2cHVibGljYXRpb24lM0Q5MDAmYWxsPTE%3D
Treasury (2008). Architecture of Australia’s tax and transfer system, Australian Government, Canberra. Available at: http://taxreview.treasury.gov.au/content/Paper.aspx?doc=html/Publications/papers/report/index.htm
Treasury (2008). Australia’s future tax system consultation paper, Australian Government, Canberra. Available at: http://taxreview.treasury.gov.au/Content/Content.aspx?doc=html/pubs_reports.htm
Treasury (2009). Tax Expenditures Statement 2008, Australian Government, Canberra. Available at: http://treasury.gov.au/contentitem.asp?NavId=&ContentID=1465
Whiteford, P (2009). ‘Family joblessness in Australia’, SPRC Newsletter 102, May. Available at: http://www.sprc.unsw.edu.au/nl/NL102/Family-joblessness.pdf.