Embed Size (px)
Citation preview
The Case forTransport Electrification:A View from the Finance Sector
Dr Gary Kendall16 October 2014
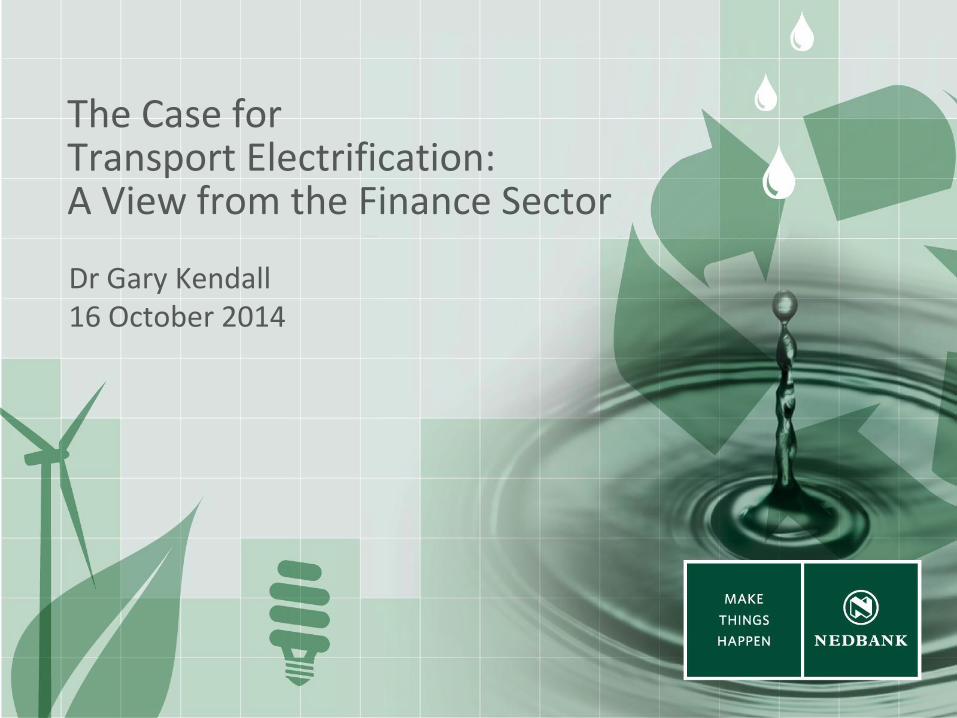
Situation
• Transport determines the shape and size of the economy
• Shape: societies and economies develop around the primary modes of transport
• Size: real economic activity is underpinned by the physical movement of goods and people
• Today, transport is extremely reliant on a single source of primary energy – crude oil
• For more than a century, supplies of relatively cheap oil have increased to support economic growth
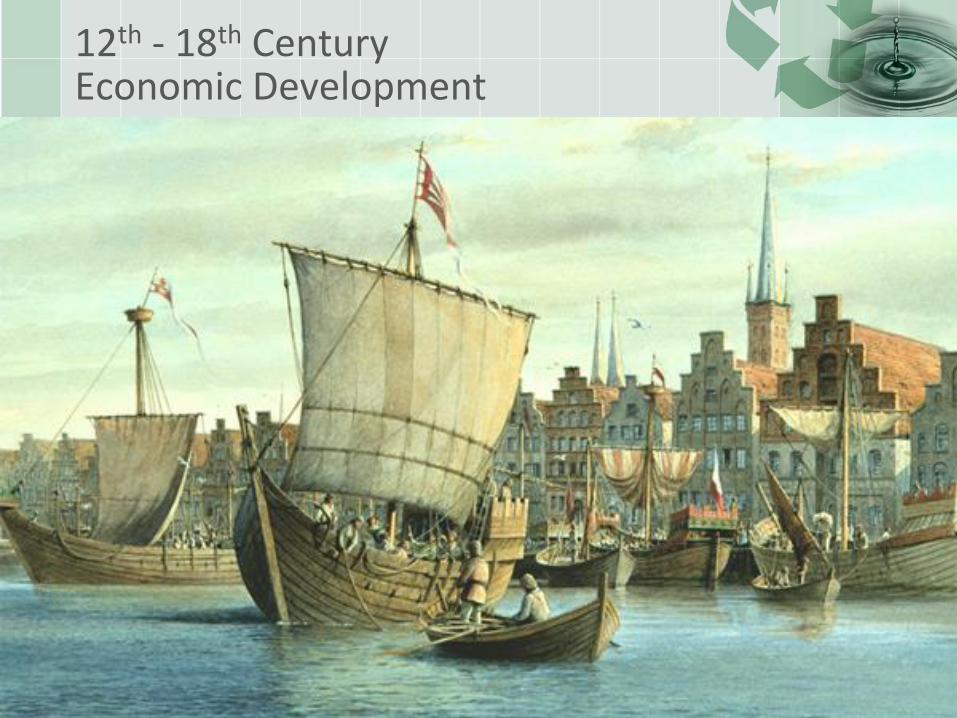
12th - 18th CenturyEconomic Development
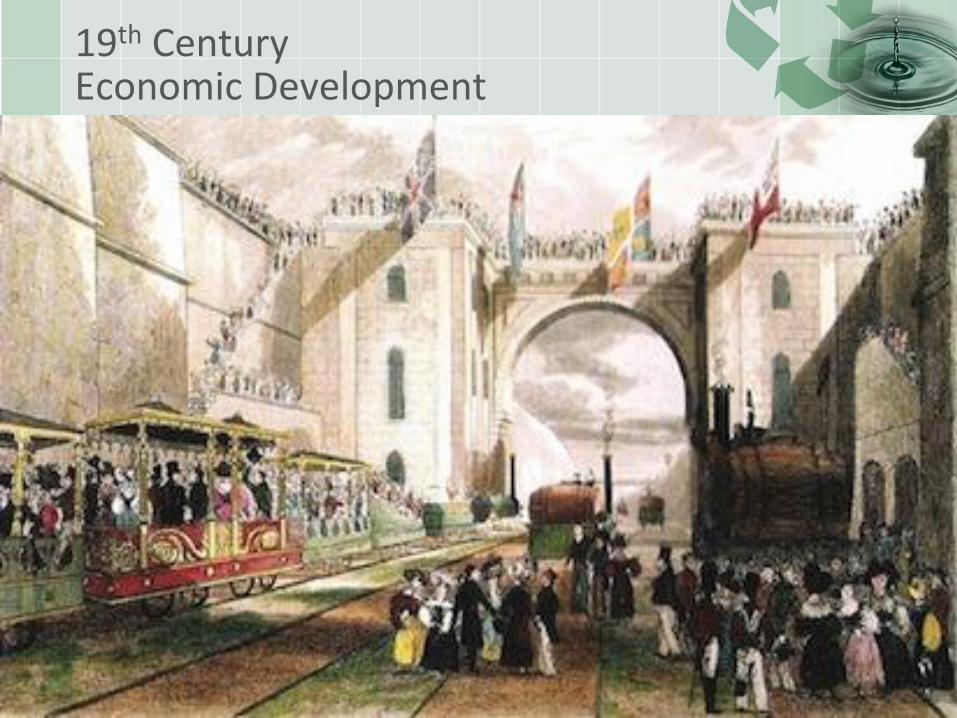
19th CenturyEconomic Development
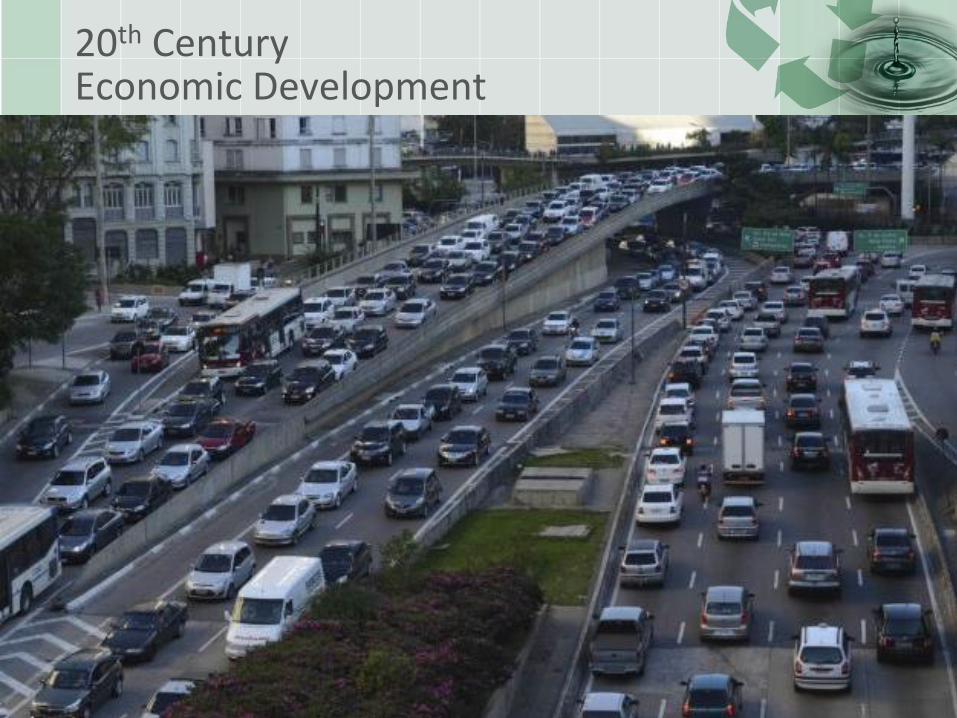
20th CenturyEconomic Development
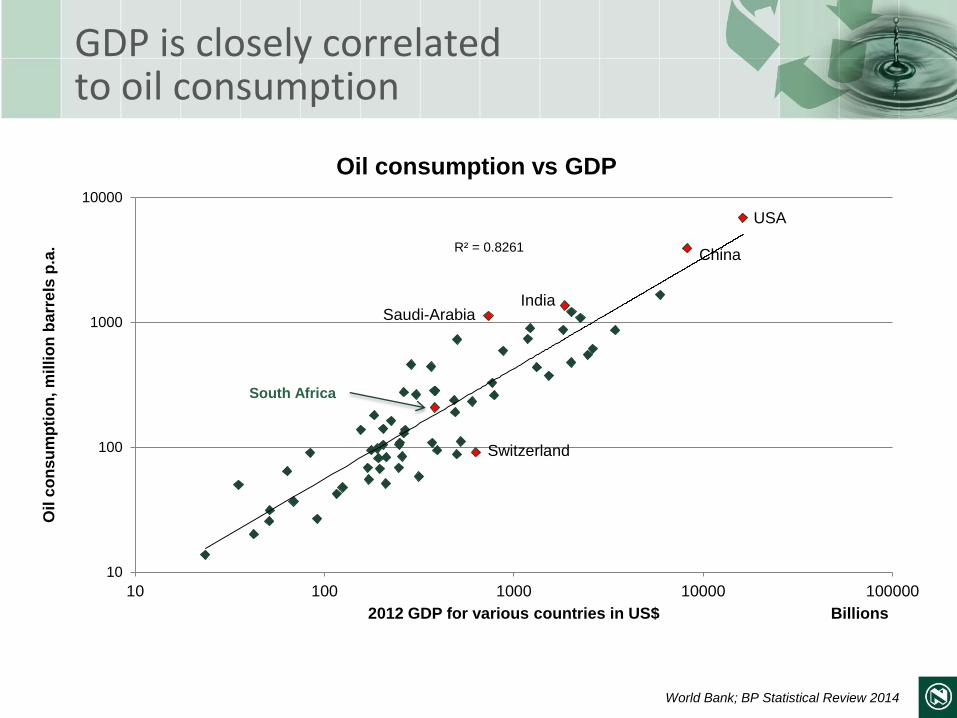
GDP is closely correlatedto oil consumption
R² = 0.8261
10
100
1000
10000
10 100 1000 10000 100000
Oil
co
nsu
mp
tio
n, m
illi
on
ba
rre
ls p
.a.
2012 GDP for various countries in US$ Billions
Oil consumption vs GDP
Saudi-ArabiaIndia
Switzerland
USA
China
South Africa
World Bank; BP Statistical Review 2014
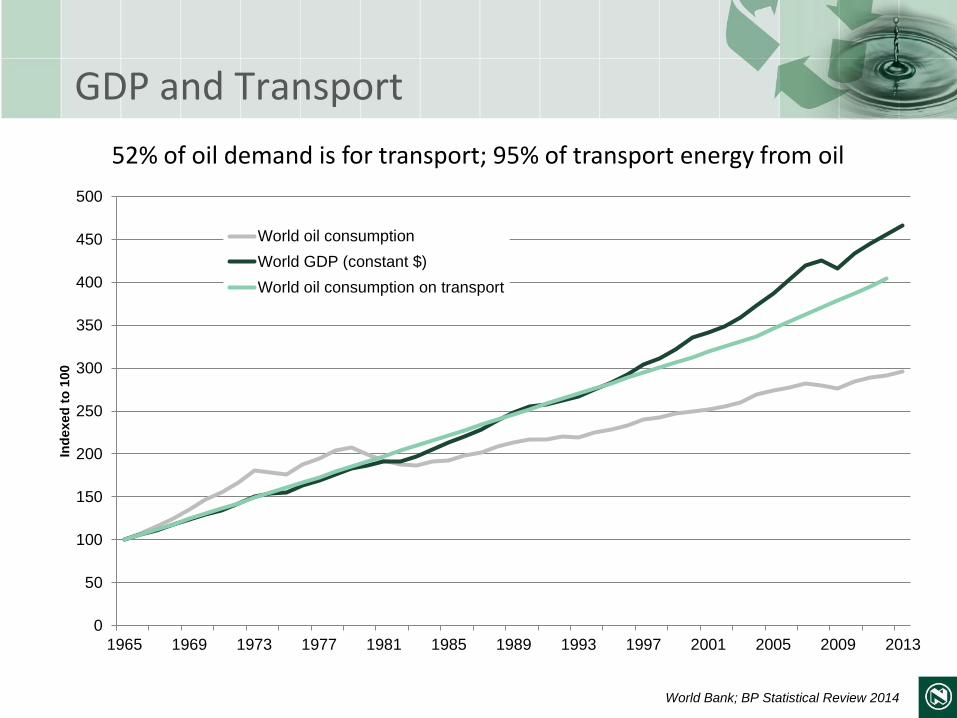
GDP and Transport
0
50
100
150
200
250
300
350
400
450
500
1965 1969 1973 1977 1981 1985 1989 1993 1997 2001 2005 2009 2013
Ind
exed
to
100
World oil consumption
World GDP (constant $)
World oil consumption on transport
52% of oil demand is for transport; 95% of transport energy from oil
World Bank; BP Statistical Review 2014
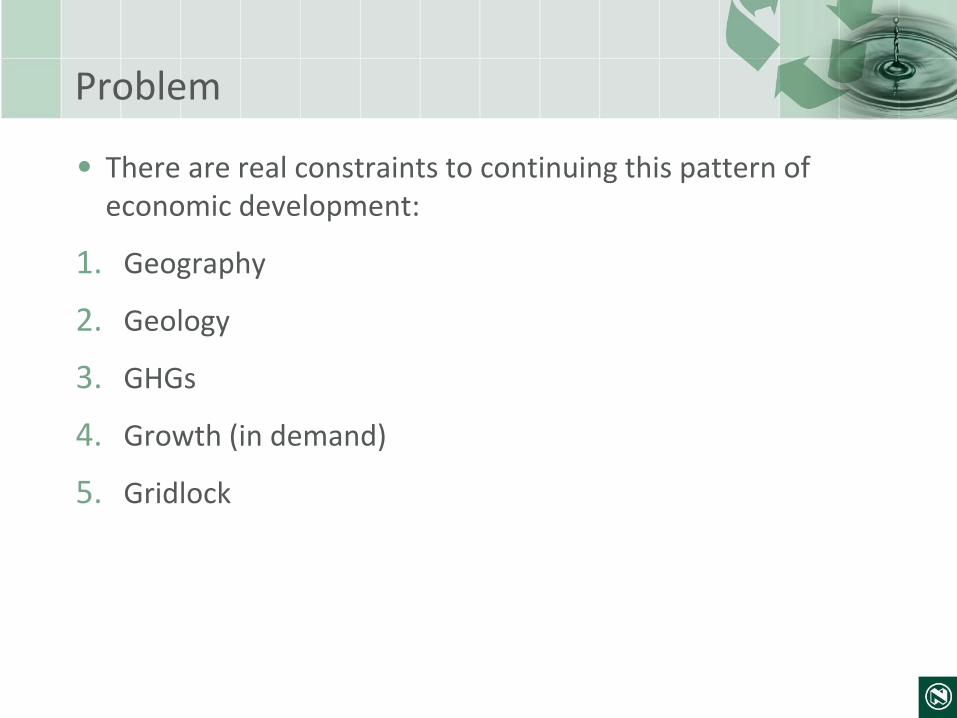
Problem
• There are real constraints to continuing this pattern of economic development:
1. Geography
2. Geology
3. GHGs
4. Growth (in demand)
5. Gridlock
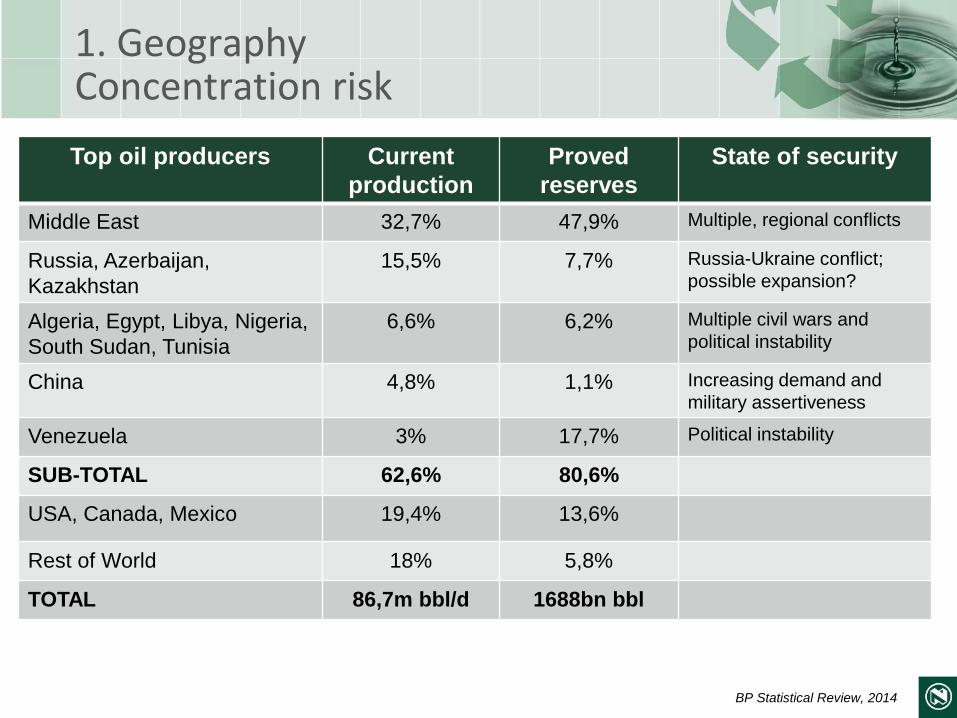
1. GeographyConcentration risk
Top oil producers Current
production
Proved
reserves
State of security
Middle East 32,7% 47,9% Multiple, regional conflicts
Russia, Azerbaijan,
Kazakhstan
15,5% 7,7% Russia-Ukraine conflict;
possible expansion?
Algeria, Egypt, Libya, Nigeria,
South Sudan, Tunisia
6,6% 6,2% Multiple civil wars and
political instability
China 4,8% 1,1% Increasing demand and
military assertiveness
Venezuela 3% 17,7% Political instability
SUB-TOTAL 62,6% 80,6%
USA, Canada, Mexico 19,4% 13,6%
Rest of World 18% 5,8%
TOTAL 86,7m bbl/d 1688bn bbl
BP Statistical Review, 2014
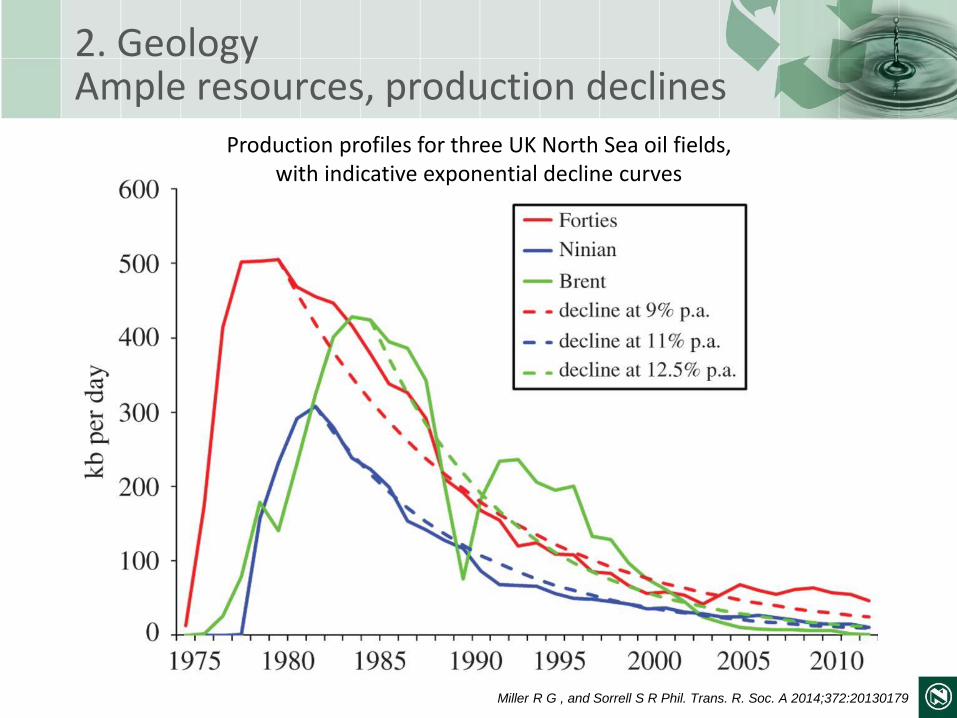
Miller R G , and Sorrell S R Phil. Trans. R. Soc. A 2014;372:20130179
2. GeologyAmple resources, production declines
Production profiles for three UK North Sea oil fields,with indicative exponential decline curves
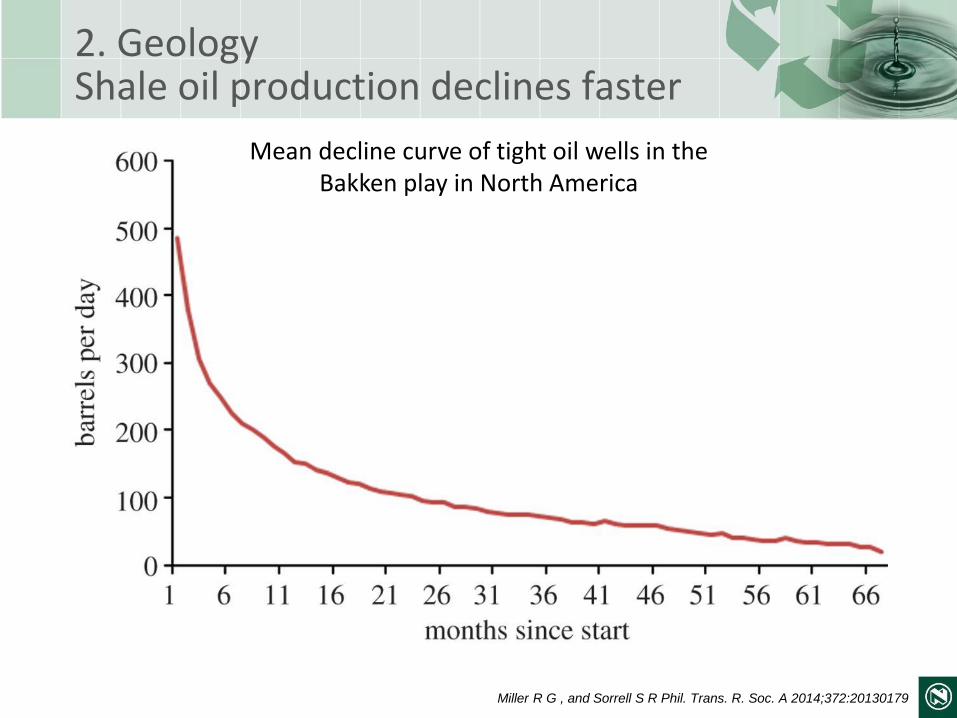
Mean decline curve of tight oil wells in theBakken play in North America
2. GeologyShale oil production declines faster
Miller R G , and Sorrell S R Phil. Trans. R. Soc. A 2014;372:20130179
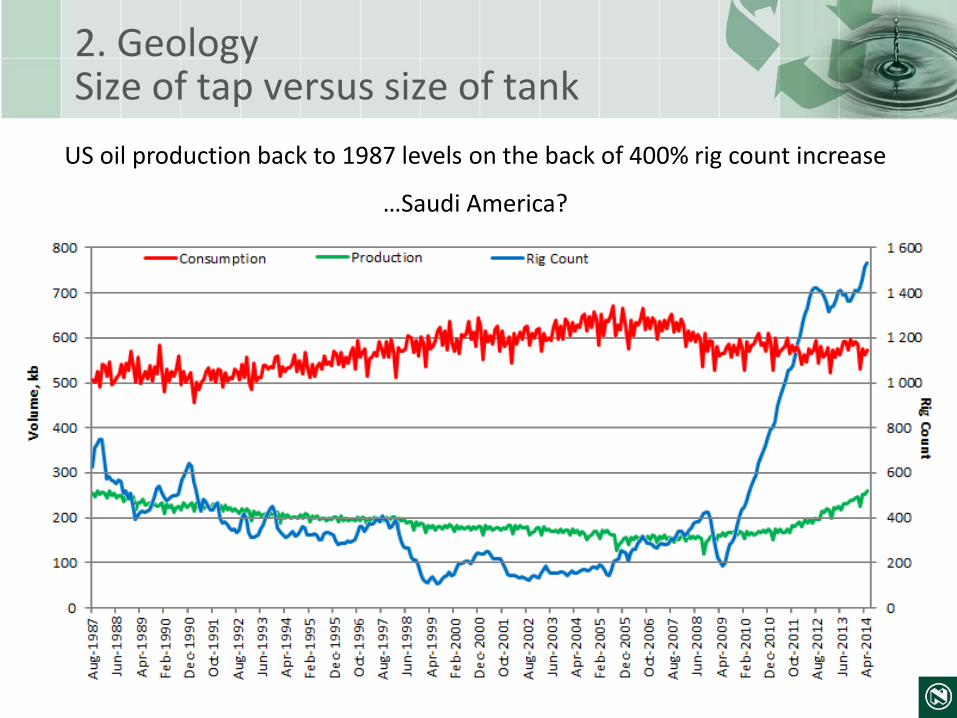
2. GeologySize of tap versus size of tank
US oil production back to 1987 levels on the back of 400% rig count increase
…Saudi America?
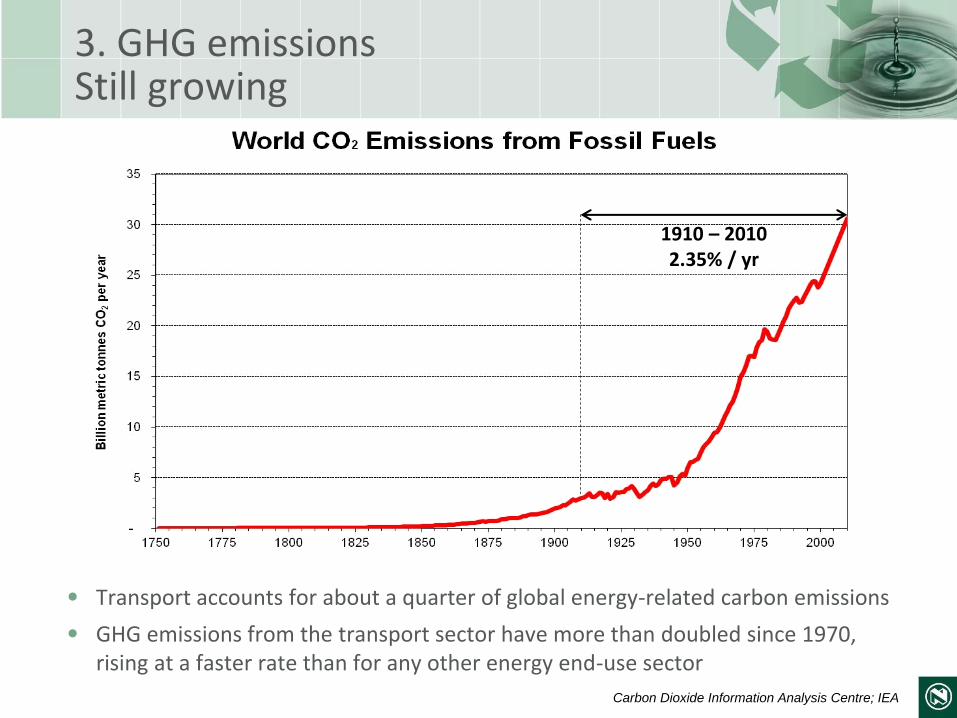
1910 – 20102.35% / yr
3. GHG emissionsStill growing
• Transport accounts for about a quarter of global energy-related carbon emissions
• GHG emissions from the transport sector have more than doubled since 1970, rising at a faster rate than for any other energy end-use sector
Carbon Dioxide Information Analysis Centre; IEA
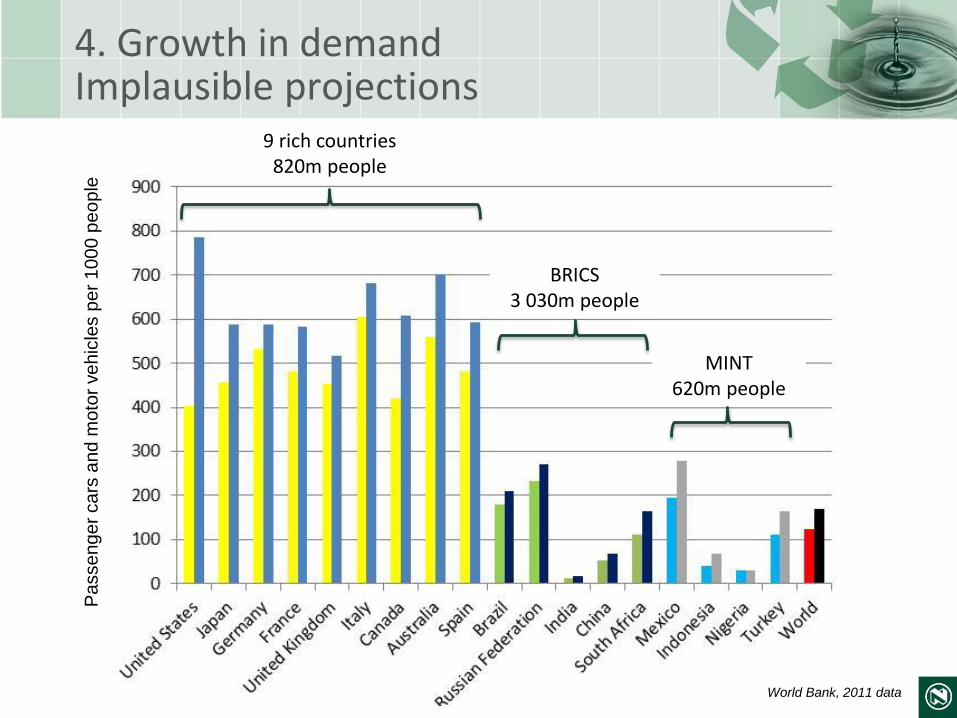
4. Growth in demandImplausible projections
9 rich countries 820m people
BRICS3 030m people
MINT620m people
World Bank, 2011 data
Pa
sse
ng
er
ca
rs a
nd
mo
tor
ve
hic
les p
er
10
00
pe
op
le
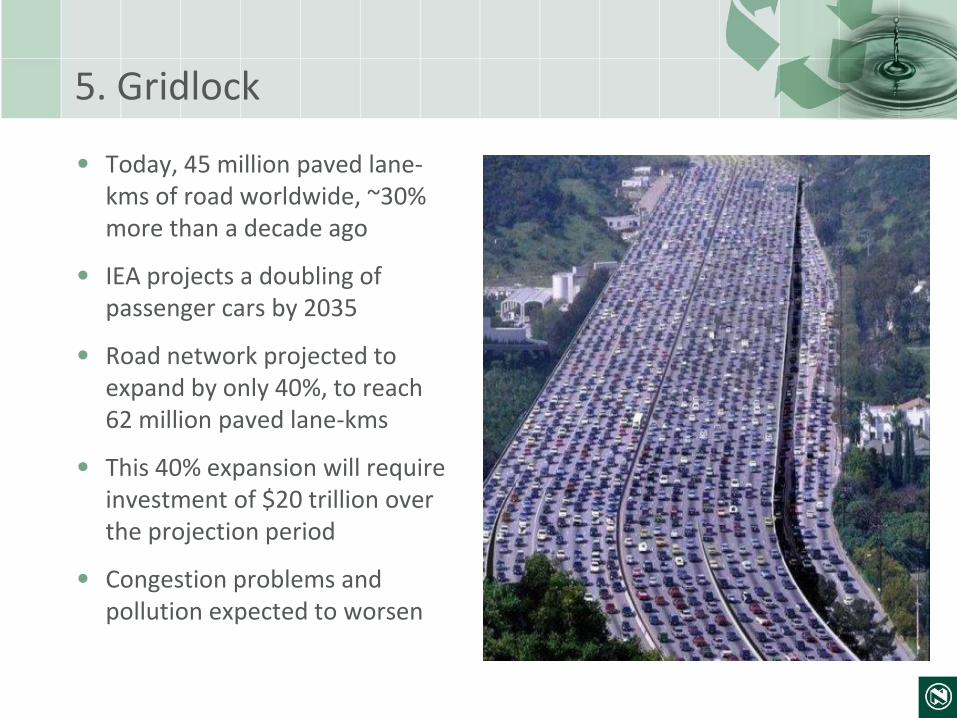
5. Gridlock
• Today, 45 million paved lane-kms of road worldwide, ~30% more than a decade ago
• IEA projects a doubling of passenger cars by 2035
• Road network projected to expand by only 40%, to reach 62 million paved lane-kms
• This 40% expansion will require investment of $20 trillion over the projection period
• Congestion problems and pollution expected to worsen
IEA, World Energy Outlook, 2013
Implication
• In the prevailing development model: cars beget roads beget sprawl beget roads and cars
• The answer: grow supplies of liquid fuel for transport?
• There are no easy alternatives to cheap crude oil
– Alternatives are worse from an energy, cost, risk and GHG perspective
– Shale oil, tar sands, extra-heavy oil, CTL / GTL, biofuels
– Alternatives probably can’t scale sufficiently unless very high oil price
– But, a very high oil price sinks the economy
• Implication: severe economic impacts ahead?
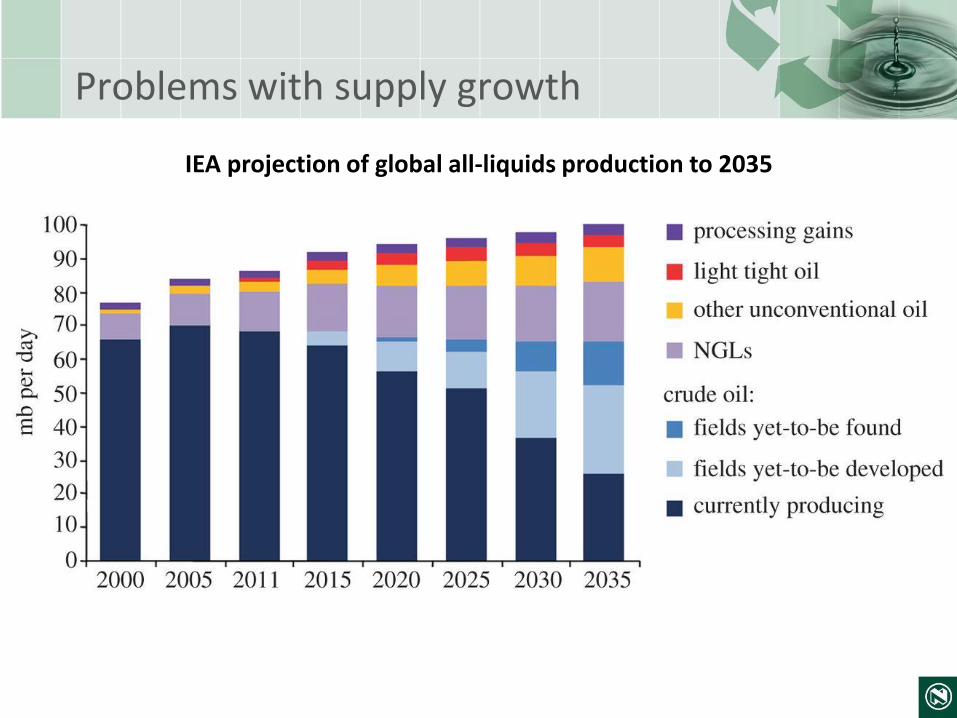
IEA projection of global all-liquids production to 2035
Problems with supply growth
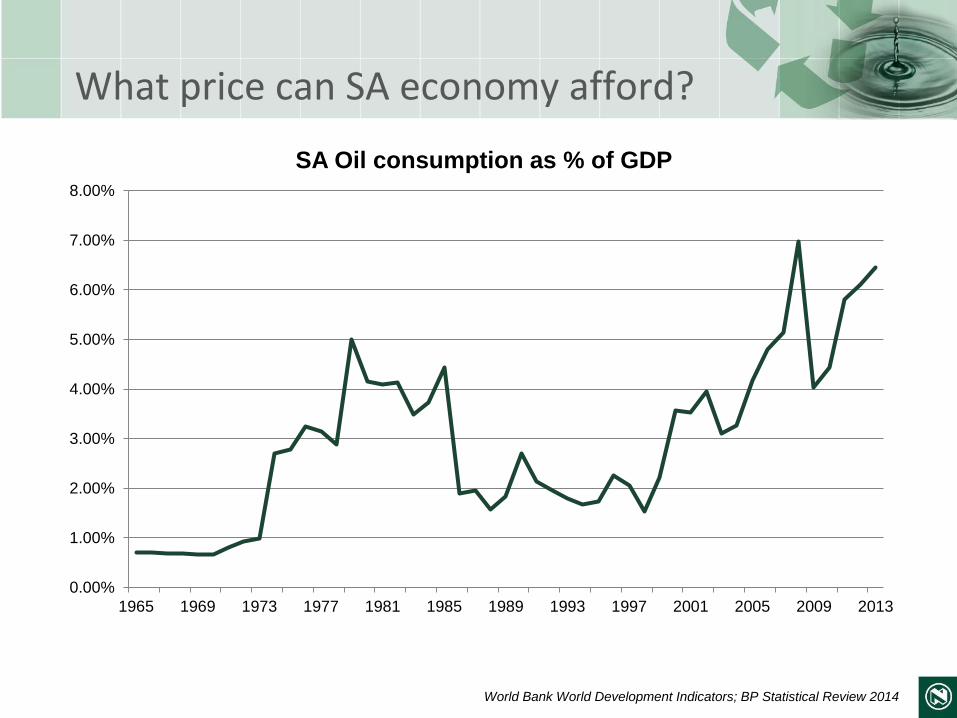
What price can SA economy afford?
World Bank World Development Indicators; BP Statistical Review 2014
0.00%
1.00%
2.00%
3.00%
4.00%
5.00%
6.00%
7.00%
8.00%
1965 1969 1973 1977 1981 1985 1989 1993 1997 2001 2005 2009 2013
SA Oil consumption as % of GDP
Conclusion on future of oil supply
• Avoiding severe economic impacts requires prioritizing of demand-side options and far-reaching changes in global transport systems
• Climate-friendly solutions are available, but they will not be easy, they will not be quick and they appear unlikely to allow the majority of the world’s population to achieve the levels of mobility currently enjoyed in the West
• Lower mobility, in turn, implies a very different trajectory for future economic development
• Adapting rapidly and peacefully to oil scarcity in a manner that does not destroy the global environment provides humanity with a formidable challenge
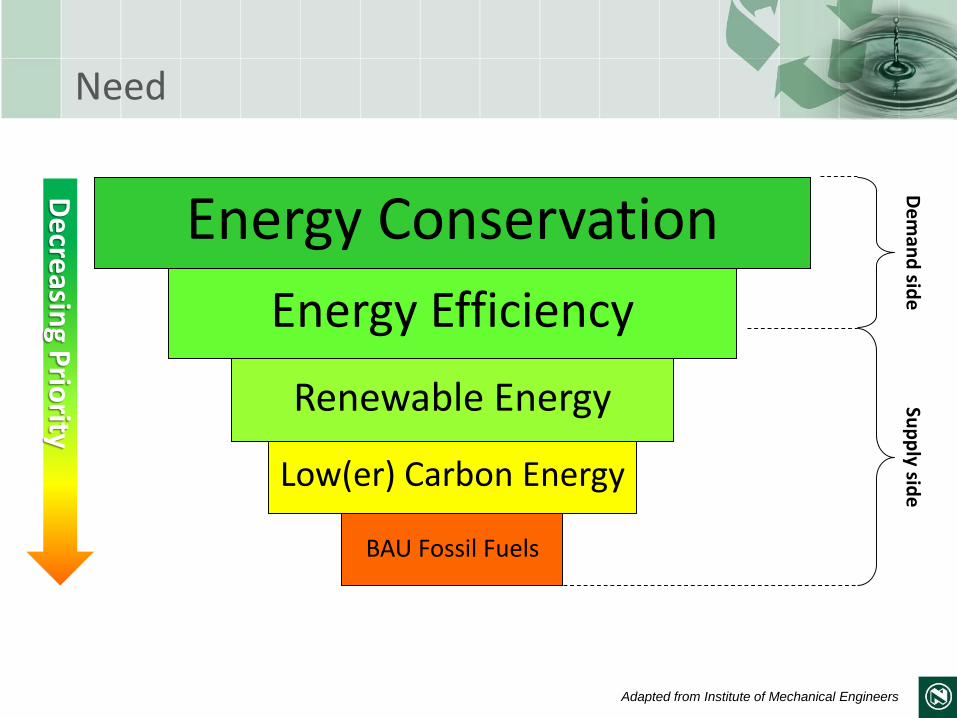
Need
Energy Conservation
Energy Efficiency
Renewable Energy
Low(er) Carbon Energy
BAU Fossil Fuels
De
man
d sid
eSu
pp
ly side
Adapted from Institute of Mechanical Engineers
De
creasin
g Prio
rity
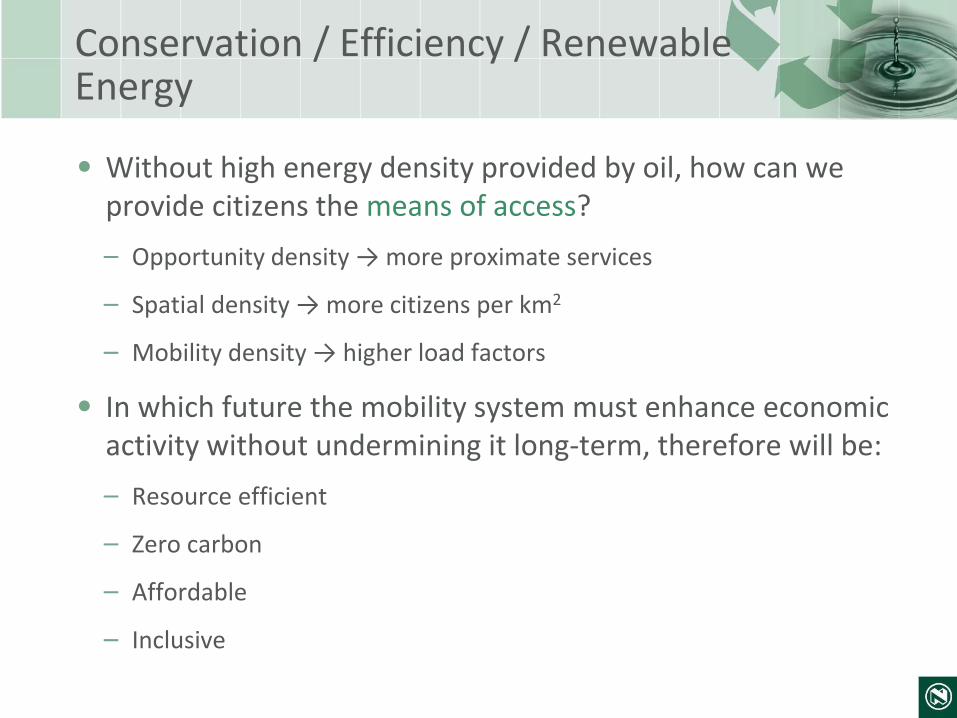
Conservation / Efficiency / Renewable Energy
• Without high energy density provided by oil, how can we provide citizens the means of access?
– Opportunity density → more proximate services
– Spatial density → more citizens per km2
– Mobility density → higher load factors
• In which future the mobility system must enhance economic activity without undermining it long-term, therefore will be:
– Resource efficient
– Zero carbon
– Affordable
– Inclusive
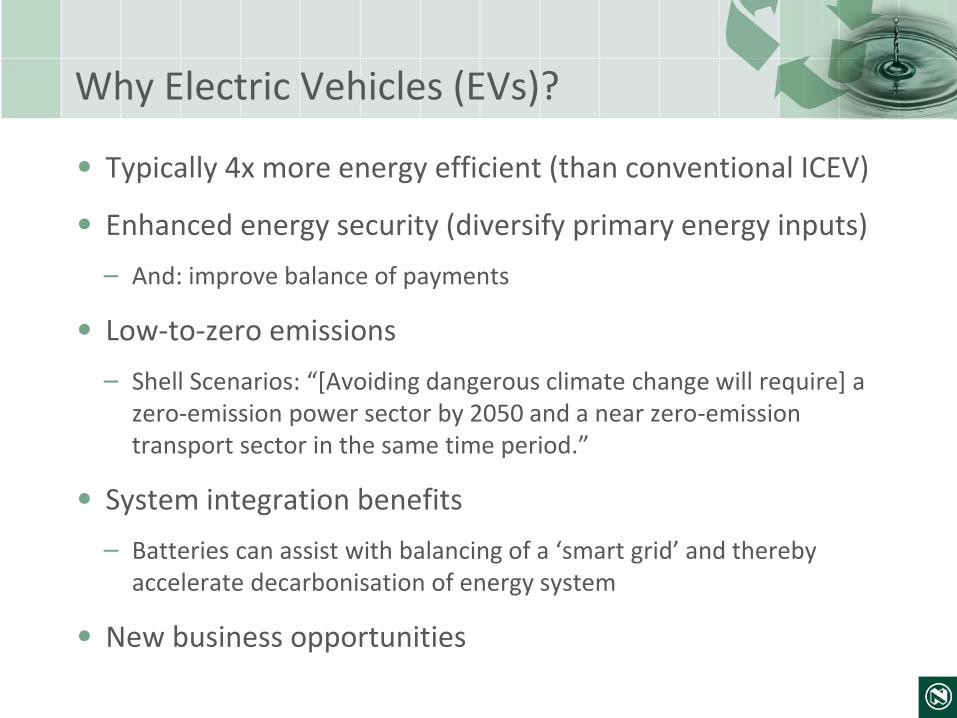
Why Electric Vehicles (EVs)?
• Typically 4x more energy efficient (than conventional ICEV)
• Enhanced energy security (diversify primary energy inputs)
– And: improve balance of payments
• Low-to-zero emissions
– Shell Scenarios: “[Avoiding dangerous climate change will require] a zero-emission power sector by 2050 and a near zero-emission transport sector in the same time period.”
• System integration benefits
– Batteries can assist with balancing of a ‘smart grid’ and thereby accelerate decarbonisation of energy system
• New business opportunities
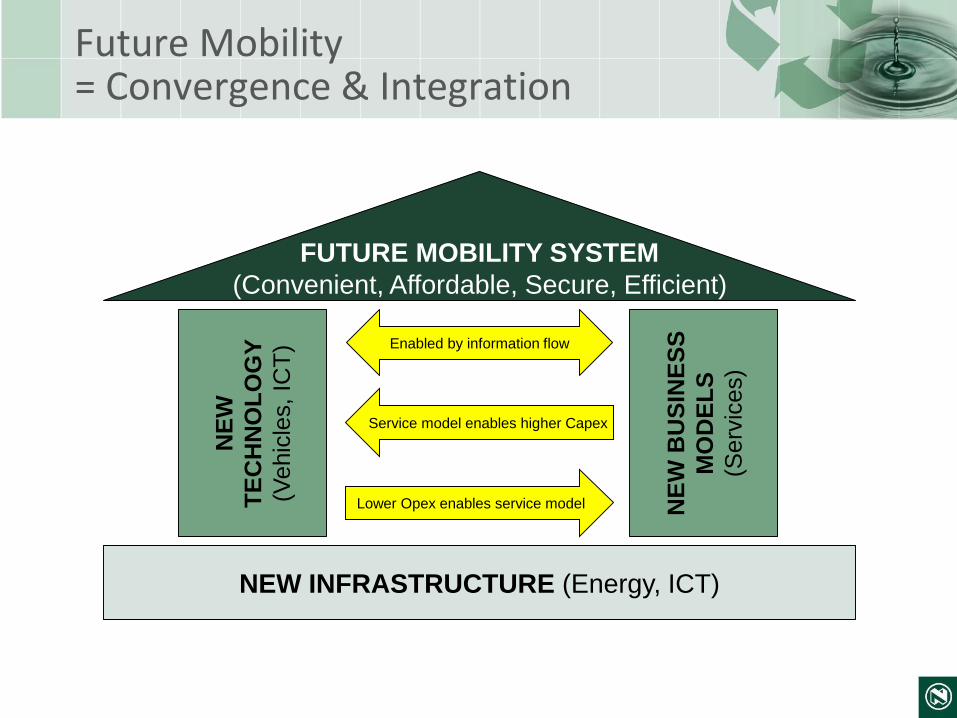
Future Mobility= Convergence & Integration
NEW INFRASTRUCTURE (Energy, ICT)
NE
W
TE
CH
NO
LO
GY
(Vehic
les,
ICT
)
NE
W B
US
INE
SS
MO
DE
LS
(Serv
ices)
FUTURE MOBILITY SYSTEM
(Convenient, Affordable, Secure, Efficient)
Lower Opex enables service model
Service model enables higher Capex
Enabled by information flow
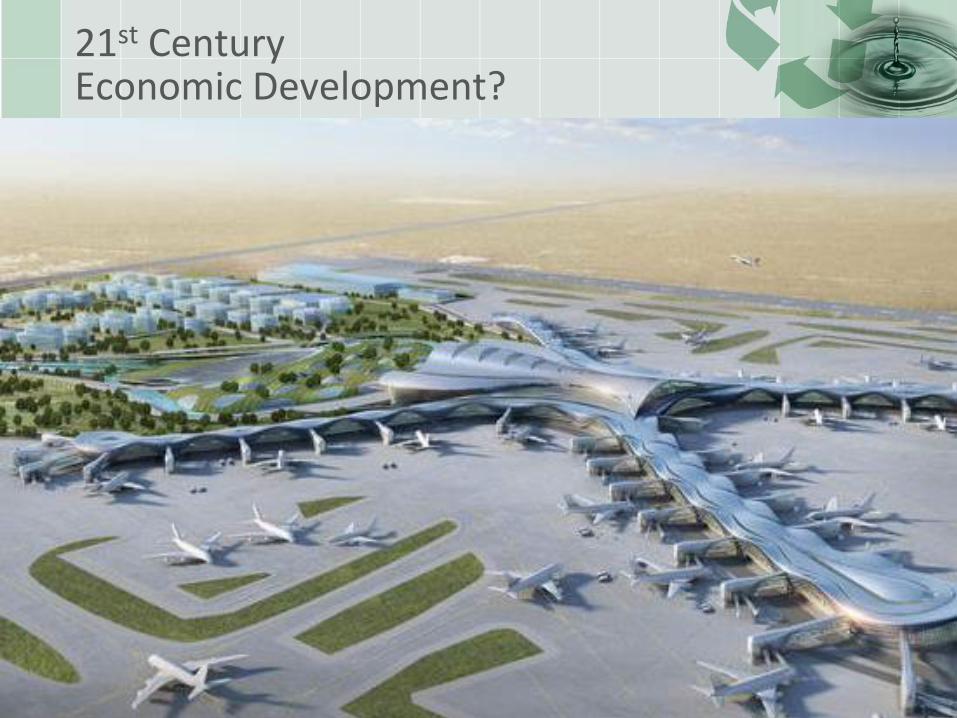
21st CenturyEconomic Development?
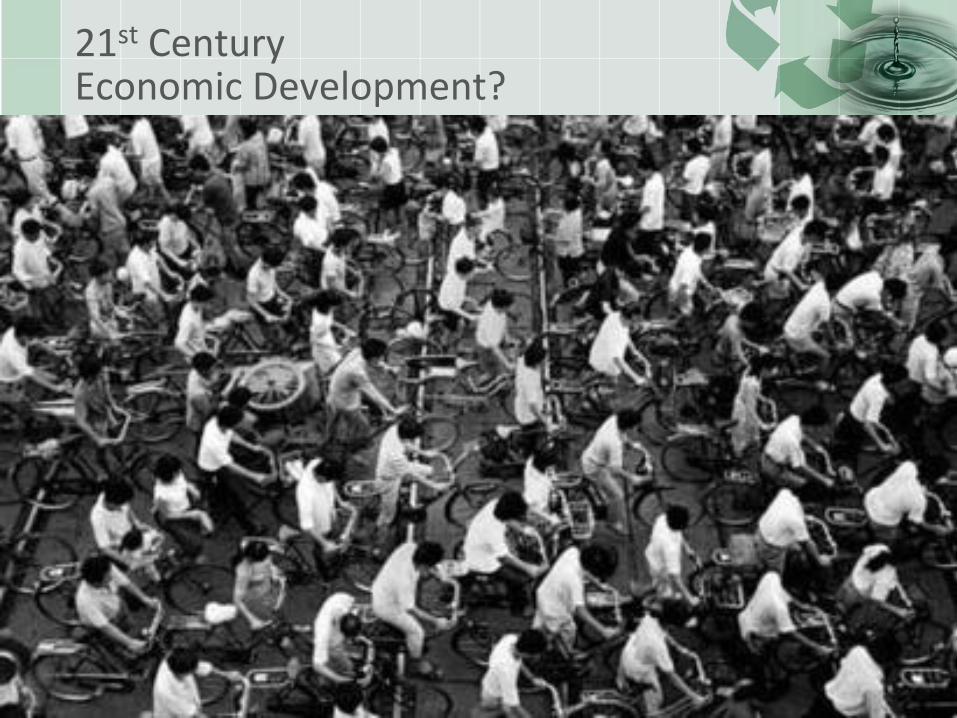
21st CenturyEconomic Development?
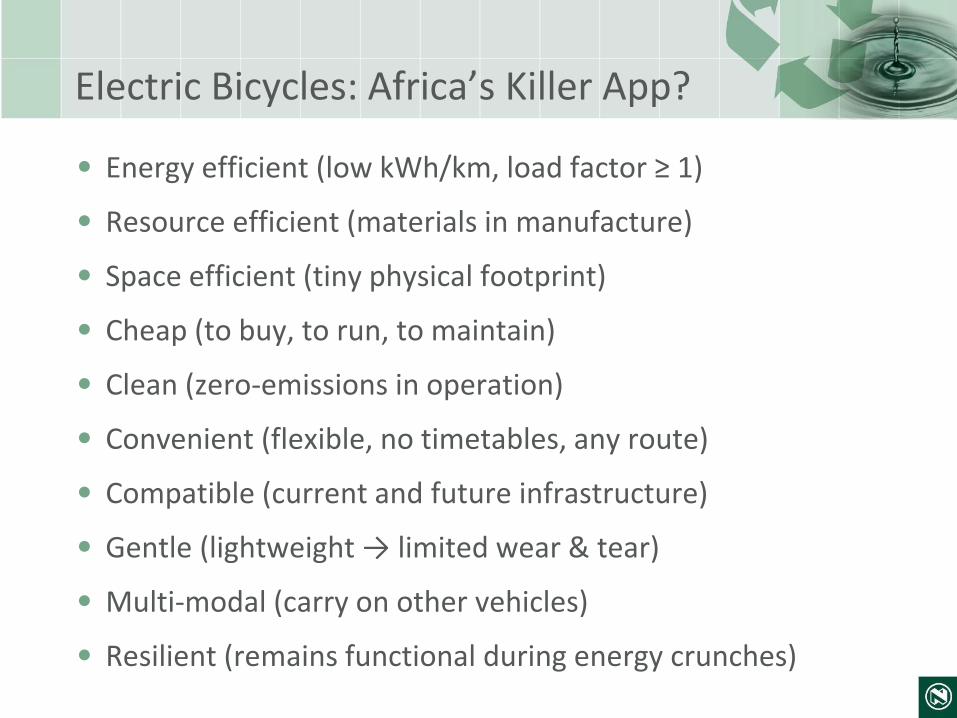
Electric Bicycles: Africa’s Killer App?
• Energy efficient (low kWh/km, load factor ≥ 1)
• Resource efficient (materials in manufacture)
• Space efficient (tiny physical footprint)
• Cheap (to buy, to run, to maintain)
• Clean (zero-emissions in operation)
• Convenient (flexible, no timetables, any route)
• Compatible (current and future infrastructure)
• Gentle (lightweight → limited wear & tear)
• Multi-modal (carry on other vehicles)
• Resilient (remains functional during energy crunches)