Embed Size (px)
Citation preview
Caribbean Regional Headquarters Hastings House Balmoral Gap Christ Church
Barbados West Indies
Tel: +1 246 426 2042
UK Office Almond House
Betteshanger Business Park Deal
Kent CT14 0LX United Kingdom
Tel: +44 (0) 1304 619 929
[email protected] ~ www.caribsave.org
Protecting and enhancing the livelihoods, environments and economies of the Caribbean Basin
Caribbean Climate Change & Livelihoods: A sectoral approach to vulnerability and resilience Water, Energy, Biodiversity, Tourism, Agriculture, Human Health, Infrastructure and Settlement, Gender, Comprehensive Disaster Management
A Not-For-Profit Company
THE CARIBSAVE CLIMATE CHANGE RISK
ATLAS (CCCRA)
Climate Change Risk Profile for Belize
Prepared by The CARIBSAVE Partnership with funding from UKaid from the Department for International Development (DFID) and the
Australian Agency for International Development (AusAID)
March 2012

i
TABLE OF CONTENTS
LIST OF FIGURES ..................................................................................................................................... V
LIST OF TABLES ......................................................................................................................................VII
ACKNOWLEDGEMENTS........................................................................................................................... X
PROJECT BACKGROUND AND APPROACH ............................................................................................... XI
LIST OF ABBREVIATIONS AND ACRONYMS ............................................................................................. XIV
EXECUTIVE SUMMARY ........................................................................................................................ XVIII
1. GLOBAL AND REGIONAL CONTEXT ................................................................................................. 1
1.1. Climate change impacts on tourism ............................................................................................. 2
2. NATIONAL CIRCUMSTANCES ......................................................................................................... 4
2.1. Geography and climate ................................................................................................................. 4
2.2. Socio-economic profile ................................................................................................................. 5
2.3. Importance of tourism to the national economy ......................................................................... 8
3. CLIMATE MODELLING ................................................................................................................. 13
3.1. Introduction to Climate Modelling Results ................................................................................. 13
3.2. Temperature ............................................................................................................................... 14
3.3. Precipitation ................................................................................................................................ 15
3.4. Wind Speed ................................................................................................................................. 18
3.5. Relative Humidity ........................................................................................................................ 19
3.6. Sunshine Hours ........................................................................................................................... 21
3.7. Sea Surface Temperatures .......................................................................................................... 22
3.8. Temperature Extremes ............................................................................................................... 23
3.9. Rainfall Extremes ........................................................................................................................ 25
3.10. Hurricanes and Tropical Storms .............................................................................................. 27
3.11. Sea Level Rise ........................................................................................................................... 29
3.12. Storm Surge ............................................................................................................................. 30
4. VULNERABILITY AND IMPACTS PROFILE FOR BELIZE ..................................................................... 31
4.1. Water Quality and Availability .................................................................................................... 31
4.1.1. Background .................................................................................................................... 31
4.1.2. Vulnerability of Water Availability and Quality Sector to Climate Change ................... 35
4.2. Energy Supply and Distribution ................................................................................................... 42
4.2.1. Background .................................................................................................................... 42
4.2.2. Belize .............................................................................................................................. 44
4.2.3. Vulnerability of the energy sector to climate change.................................................... 55
4.3. Agriculture and Food Security..................................................................................................... 63
4.3.1. Background .................................................................................................................... 63
4.3.2. The importance of agriculture to national development .............................................. 63

ii
4.3.3. An analysis of the agricultural sector in Belize .............................................................. 64
4.3.4. Women and youth in Belizean agriculture .................................................................... 64
4.3.5. Climate change related issues and agricultural vulnerability in Belize .......................... 65
4.3.6. Vulnerability enhancing factors: Agriculture, land use and soil degradation in Belize . 66
4.3.7. Social vulnerability of agricultural communities in Belize ............................................. 66
4.3.8. Economic Vulnerability: Climate change & agricultural outputs in Belize .................... 67
4.4. Human Health ............................................................................................................................. 69
4.4.1. Background .................................................................................................................... 69
4.4.2. Direct Impacts ................................................................................................................ 70
4.4.3. Indirect Impacts ............................................................................................................. 70
4.5. Marine and Terrestrial Biodiversity and Fisheries ...................................................................... 76
4.5.1. Background .................................................................................................................... 76
4.5.2. Vulnerability of biodiversity and fisheries to climate change........................................ 84
4.6. Sea Level Rise and Storm Surge Impacts on Coastal Infrastructure and Settlements ................ 90
4.6.1. Background .................................................................................................................... 90
4.6.2. Vulnerability of coastal infrastructure and settlements to climate change .................. 91
4.7. Comprehensive Natural Disaster Management ......................................................................... 98
4.7.1. History of disaster management globally ...................................................................... 98
4.7.2. Natural hazards in the Caribbean and Belize ................................................................. 99
4.7.3. Case study examination of vulnerability ...................................................................... 100
4.7.4. Vulnerability of the tourism industry in Belize ............................................................ 102
4.8. Community Livelihoods, Gender, Poverty and Development .................................................. 104
4.8.1. Background .................................................................................................................. 104
4.8.2. Climate change vulnerability: Implications for community livelihoods, gender, poverty and development ...................................................................................................................... 106
4.8.3. Case Study: Placencia, Belize ....................................................................................... 109
5. ADAPTIVE CAPACITY PROFILE FOR BELIZE .................................................................................. 115
5.1. Water Quality and Availability .................................................................................................. 116
5.1.1. Policy ............................................................................................................................ 116
5.1.2. Management ................................................................................................................ 117
5.1.3. Technology ................................................................................................................... 118
5.2. Energy Supply and Distribution ................................................................................................. 119
5.2.1. Policy ............................................................................................................................ 119
5.2.2. Management ................................................................................................................ 120
5.2.3. Technology ................................................................................................................... 123
5.2.4. Summary ...................................................................................................................... 125
5.3. Agriculture and Food Security................................................................................................... 126
5.3.1. Policy ............................................................................................................................ 126

iii
5.3.2. Technology ................................................................................................................... 126
5.3.3. Farmers’ adaptation - Initiatives and actions .............................................................. 126
5.4. Human Health ........................................................................................................................... 128
5.4.1. Policy ............................................................................................................................ 128
5.4.2. Management ................................................................................................................ 129
5.5. Marine and Terrestrial Biodiversity and Fisheries .................................................................... 133
5.5.1. Policy ............................................................................................................................ 133
5.5.2. Management ................................................................................................................ 134
5.5.3. Technology ................................................................................................................... 136
5.6. Sea Level Rise and Storm Surge Impacts on Coastal Infrastructure and Settlements .............. 137
5.6.1. Technology – Hard engineering ................................................................................... 139
5.6.2. Technology – Soft engineering .................................................................................... 139
5.6.3. Policy ............................................................................................................................ 140
5.7. Comprehensive Natural Disaster Management ....................................................................... 142
5.7.1. Management of natural hazards and disasters ........................................................... 142
5.7.2. Management of disasters in Belize .............................................................................. 145
5.7.3. Technology ................................................................................................................... 147
5.7.4. Policy ............................................................................................................................ 148
5.8. Community Livelihoods, Gender, Poverty and Development .................................................. 151
5.8.1. Demographic profile of respondents ........................................................................... 151
5.8.2. Household form and structure .................................................................................... 152
5.8.3. Household headship .................................................................................................... 153
5.8.4. Education and livelihoods ............................................................................................ 154
5.8.5. Food security ................................................................................................................ 156
5.8.6. Financial security and social protection....................................................................... 156
5.8.7. Asset base .................................................................................................................... 159
5.8.8. Power and decision making ......................................................................................... 161
5.8.9. Social networks and social capital ............................................................................... 162
5.8.10. Use of natural resources ............................................................................................ 162
5.8.11. Knowledge, exposure and experience of climate related events .............................. 166
6. RECOMMENDED STRATEGIES AND INITIAL ACTION PLAN ........................................................... 172
6.1. Cross-Cutting Actions ................................................................................................................ 172
6.1.1. Implementing and Strengthening Data Collection, Monitoring and Evaluation Activities 172
6.1.2. Mainstreaming Climate Change in Planning, Policy and Practice ................................ 174
6.1.3. Building and Strengthening Information Sharing and Communication Systems and Networks ................................................................................................................................... 176
6.1.4. Climate Change Education and Awareness ................................................................. 177
iv
6.2. Water Quality and Availability .................................................................................................. 177
6.3. Energy Supply and Distribution ................................................................................................. 179
6.4. Agriculture and Food Security................................................................................................... 180
6.5. Human Health ........................................................................................................................... 180
6.6. Marine and Terrestrial Biodiversity and Fisheries .................................................................... 181
6.7. Sea Level Rise and Storm Surge Impacts on Coastal Infrastructure and Settlements .............. 182
6.8. Comprehensive Natural Disaster Management ....................................................................... 183
6.9. Community Livelihoods, Gender, Poverty and Development .................................................. 184
7. CONCLUSION ............................................................................................................................ 187
7.1. Climate Modelling ..................................................................................................................... 187
7.2. Water Quality and Availability .................................................................................................. 188
7.3. Energy Supply and Distribution ................................................................................................. 189
7.4. Agriculture and Food Security................................................................................................... 189
7.5. Human Health ........................................................................................................................... 189
7.6. Marine and Terrestrial Biodiversity and Fisheries .................................................................... 190
7.7. Sea Level Rise and Storm Surge Impacts on Coastal Infrastructure and Settlements .............. 191
7.8. Comprehensive Natural Disaster Management ....................................................................... 192
7.9. Community Livelihoods, Gender, Poverty and Development .................................................. 192
REFERENCES ....................................................................................................................................... 194
v
LIST OF FIGURES
Figure 2.2.1: Sector contribution to GDP (%) .................................................................................................... 6
Figure 2.3.1: Arrivals and expenditure ............................................................................................................ 10
Figure 4.1.1: Belize Hydrological Regions ........................................................................................................ 32
Figure 4.1.2: Belize roads and major cities ...................................................................................................... 33
Figure 4.1.3: Schematic diagram of the Stakeholders in the Belize Water Sector .......................................... 34
Figure 4.2.1: Global CO2 emission pathways versus unrestricted tourism emissions growth. ....................... 43
Figure 4.2.2: Per capita emissions of CO2 in selected countries in the Caribbean, 2005 ................................ 44
Figure 4.2.3: Primary energy sources and final energy uses, 2002 ................................................................. 45
Figure 4.2.4: Distribution of electricity providers 2010................................................................................... 46
Figure 4.2.5: Crude oil prices 1869 - 2009 ....................................................................................................... 55
Figure 4.2.6: Fuel costs as part of a worldwide operating cost ....................................................................... 57
Figure 4.2.7: Vulnerability of selected countries, measured as eco-efficiency and revenue share ................ 59
Figure 4.3.1: Belize Key Crops.......................................................................................................................... 68
Figure 4.4.1: Seasonal variation of Dengue in Belize – 2002, 2005, 2007 ....................................................... 72
Figure 4.4.2: Seasonal variation of Dengue cases and rainfall in Belize .......................................................... 72
Figure 4.5.1: The Jaguar – Belize’s top forest predator ................................................................................... 77
Figure 4.5.2: Protected Areas of Belize ........................................................................................................... 78
Figure 4.5.3: Coastal and marine habitats of Belize ........................................................................................ 80
Figure 4.5.4: Photo of the beach at Placencia (Belize) in 2008 where active erosion is reported .................. 81
Figure 4.5.5: Map of sediment delivery to Meso-American Barrier Reef ....................................................... 82
Figure 4.5.6: Coastal defences in San Pedro (Belize) built to prevent further beach erosion ........................ 87
Figure 4.6.1: Belize - Overview Map ................................................................................................................ 91
Figure 4.6.2: Evidence of Erosion and SLR in Caye Caulker, Belize ................................................................. 92
Figure 4.6.3: Staff from the Hol Chan Marine Reserve learning how to use the High Resolution
Coastal Profile Surveying with an RTK GPS System. ................................................................. 94
Figure 4.6.4: Total Land and Beach Loss due to SLR, Caye Caulker Village, Caye Caulker .............................. 95
Figure 4.6.5: Total Land and Beach Loss due to SLR, Rocky Point, North Ambergris Caye ............................. 96
Figure 4.6.6: Total Land and Beach Loss due to SLR, San Pedro Town, Ambergris Caye ................................ 96
Figure 4.7.1: Damaged housing from Hurricane Richard in Belize 2010 ....................................................... 101
Figure 4.7.2: Map of areas worst affected by Hurricane Richard ................................................................. 101
Figure 4.8.1: Individual Poverty in Belize, 2002 and 2009 ............................................................................ 105
Figure 4.8.2: The Impacts of Climate Change on Poverty ............................................................................. 107
vi
Figure 5.2.1: Eco-efficiencies of different source markets, Amsterdam ....................................................... 122
Figure 5.7.1: Relationship of the Disaster Management System and Society .............................................. 142
Figure 5.8.1: Age of Respondents .................................................................................................................. 152
Figure 5.8.2: Relationship Status of Respondents ......................................................................................... 153
Figure 5.8.3: Sample Distribution by Average Monthly Earnings .................................................................. 155
Figure 5.8.4: Financial Security: Job Loss or Natural Disaster ....................................................................... 158
Figure 5.8.5: Perception of Risk for Climate Related Events ......................................................................... 170
Figure 5.8.6: Support during Climate Related Events ................................................................................... 171
vii
LIST OF TABLES
Table 2.2.1: Gross Domestic Product for Belize, 2002 - 2009 ........................................................................... 5
Table 2.2.2: Sector contribution to GDP at constant 2000 market prices (BZ $ million). ................................. 6
Table 2.3.1: Visitor Arrivals to Belize and expenditure 2000 - 2009 ............................................................... 10
Table 3.1.1: Earliest and latest years respectively at which the threshold temperatures are
exceeded in the 41 projections* .............................................................................................. 14
Table 3.2.1: Observed and GCM projected changes in temperature for Belize. ............................................. 15
Table 3.2.2: GCM and RCM projected changes in Belize under the A2 scenario. .......................................... 15
Table 3.3.1: Observed and GCM projected changes in precipitation for Belize. ............................................ 16
Table 3.3.2: GCM and RCM projected changes in Belize under the A2 scenario. ........................................... 17
Table 3.3.3: Observed and GCM projected changes in precipitation (%) for Belize. ...................................... 17
Table 3.3.4: GCM and RCM projected changes in Belize under the A2 scenario. ........................................... 18
Table 3.4.1: Observed and GCM projected changes in wind speed for Belize. ............................................... 19
Table 3.4.2: GCM and RCM projected changes in Belize under the A2 scenario. ........................................... 19
Table 3.5.1: Observed and GCM projected changes in relative humidity for Belize. ...................................... 20
Table 3.5.2: GCM and RCM projected changes in Belize under the A2 scenario. ........................................... 21
Table 3.6.1: Observed and GCM projected changes in sunshine hours for Belize. ......................................... 22
Table 3.6.2: GCM and RCM projected changes in Belize under the A2 scenario. ........................................... 22
Table 3.7.1: Observed and GCM projected changes in sea surface temperature for Belize. ......................... 23
Table 3.8.1: Observed and GCM projected changes in temperature extremes for Belize.............................. 24
Table 3.9.1: Observed and GCM projected changes in rainfall extremes for Belize. ...................................... 26
Table 3.10.1: Changes in Near-storm rainfall and wind intensity associated with Tropical storms
in under global warming scenarios. ......................................................................................... 29
Table 3.11.1: Sea level rise rates at observation stations surrounding the Caribbean Basin ......................... 29
Table 3.11.2: Projected increases in sea level rise from the IPCC AR4 ........................................................... 30
Table 4.1.1: Tariff Rates for Belize Water Services .......................................................................................... 35
Table 4.2.1: Total primary energy use, 2002 ................................................................................................... 45
Table 4.2.2: Growth trends in energy consumption in Belize, 1990 - 2009 .................................................... 47
Table 4.2.3: Growth trends in electricity consumption in Belize, 2001 - 2010 ............................................... 48
Table 4.2.4: Assessment of CO2 emissions from tourism in Belize, 2009........................................................ 49
Table 4.2.5: UK air passenger duty as of November 1, 2009 .......................................................................... 58
Table 4.3.1: Climate Change Impact on Agriculture & Fisheries Sector – Belize ............................................ 65
Table 4.3.2: Recent natural disasters and their impact on agriculture sector in Belize .................................. 67

viii
Table 4.3.3: Summary of damage and losses to agricultural sector by district following
Hurricane Dean ......................................................................................................................... 67
Table 4.4.1: Selected statistics relevant to the Health Sector of Belize .......................................................... 70
Table 4.4.2: Confirmed malaria confirmed and suspected cases in Belize between 2000 and
2009 .......................................................................................................................................... 71
Table 4.4.3: Dengue fever cases between 1995 and 2009 in Belize ............................................................... 73
Table 4.4.4: Fever and respiratory symptoms (acute respiratory infections) under and over 5
years and influenza-like illnesses between 2006 - 2009 in Belize ............................................ 74
Table 4.4.5: Reported cases of gastroenteritis in Belize between 1999 and 2009 ......................................... 74
Table 4.6.1: Impacts associated with 1 m and 2 m SLR and 50 m and 100 m beach erosion in
Belize ........................................................................................................................................ 93
Table 4.6.2: Beach Area Losses at Three Beach Areas in Belize ...................................................................... 97
Table 4.7.1: Types of Hazards in the Caribbean Basin ..................................................................................... 99
Table 4.8.1: Unemployment in Belize, 2002-2009 ........................................................................................ 104
Table 4.8.2: Examples of Gender Differences in Response to Natural Disasters in the Caribbean .............. 108
Table 4.8.3: Local resilience building initiatives for the natural and built environment ............................... 114
Table 5.2.1: Average weighted emissions per tourist by country and main market, 2004 .......................... 121
Table 5.2.2: Arrivals to emissions ratios ........................................................................................................ 121
Table 5.2.3: Jamaican case studies for resource savings............................................................................... 124
Table 5.4.1: NPESAP Strategic Thrusts and Strategies related to the health sector of Belize ...................... 128
Table 5.4.2: Total expenditure on health as a % of GDP from 1995 – 2009 in Belize ................................... 129
Table 5.4.3: Health facilities in Belize in 2007 ............................................................................................... 130
Table 5.5.1: Principles for Climate Change Adaptation ................................................................................. 133
Table 5.6.1: Summary of Adaptation Policies to reduce the vulnerability of Belize to SLR and
SLR induced beach erosion ..................................................................................................... 138
Table 5.7.1: Enhanced Comprehensive Disaster Management Programme Framework 2007-
2012 ........................................................................................................................................ 144
Table 5.8.1: Length of Residency in Community ........................................................................................... 151
Table 5.8.2: Age Distribution of Sample ........................................................................................................ 151
Table 5.8.3: Relationship Status of Respondents .......................................................................................... 152
Table 5.8.4: Perception of Headship of Household ....................................................................................... 153
Table 5.8.5: Household Headship by Gender .............................................................................................. 153
Table 5.8.6: Household Size by Sex of Head of Household ........................................................................... 154
Table 5.8.7: Sample Distribution by Education and Training ........................................................................ 154
Table 5.8.8: Labour Market Participation: Involvement in Tourism Sector .................................................. 155
Table 5.8.9: Labour Market Participation: Involvement in Non-Tourism Sectors ......................................... 156

ix
Table 5.8.10: Source of Food Supply ............................................................................................................. 156
Table 5.8.11: Adequacy of Food Supply ........................................................................................................ 156
Table 5.8.12: Distribution by Financial Responsibility for House (Receive support) ..................................... 157
Table 5.8.13: Distribution by Financial Responsibility for House (Give support) .......................................... 157
Table 5.8.14: Distribution by Access to Credit .............................................................................................. 157
Table 5.8.15: Sample Distribution by Financial Security: Job Loss ................................................................ 158
Table 5.8.16: Sample Distribution by Financial Security: Natural Disaster ................................................... 159
Table 5.8.17: Sample Distribution by Social Protection Provisions ............................................................... 159
Table 5.8.18: Sample Distribution by Ownership of Assets: Capital Assets .................................................. 160
Table 5.8.19: Sample Distribution by Ownership of Assets: Appliances / Electronics .................................. 160
Table 5.8.20: Sample Distribution by Ownership of Assets: Transportation ................................................ 161
Table 5.8.21: Sample Distribution by Ownership of Assets: House Material ................................................ 161
Table 5.8.22: Sample Distribution by Ownership of Assets: Access to Sanitation Conveniences ................. 161
Table 5.8.23: Power and Decision Making .................................................................................................... 161
Table 5.8.24: Power and Decision Making: Intra Household ........................................................................ 162
Table 5.8.25: Social Networks: Community Involvement ............................................................................. 162
Table 5.8.26: Social Networks: Support Systems .......................................................................................... 162
Table 5.8.27: Use and Importance of Natural Resources .............................................................................. 164
Table 5.8.28: Use and Importance of Natural Resources, by Sex of Respondent ......................................... 165
Table 5.8.29: Involvement in Agriculture: Access to Water .......................................................................... 166
Table 5.8.30: Knowledge of Climate Related Events ..................................................................................... 166
Table 5.8.31: Knowledge of Appropriate Response to Climate Related Events ............................................ 167
Table 5.8.32: Perceived Level of Risk of Climate Related Events: Household ............................................... 168
Table 5.8.33: Perceived Level of Risk of Climate Related Events: Community ............................................. 169
x
ACKNOWLEDGEMENTS
The CARIBSAVE Partnership wishes to thank all the people across Belize and in the Caribbean who have
contributed to this National Risk Profile and to the Risk Atlas as a whole. There have been a multitude of
people who have provided their time, assistance, information and resources to making the Risk Atlas
effective and successful, so many people that it makes it impossible to mention all of them here on this
page. We would, therefore, like to thank some of the key people and organisations here that have made
the Risk Atlas and this National Profile possible. The CARIBSAVE Partnership wishes to thank the Belize
Tourism Board for its support and assistance, in particular Ms. Seleni Matus, Director; as well as Mr. Yashin
Dujon of the Ministry of Tourism, Civil Aviation & Culture.
We wish to express great thanks the Caribbean Community Climate Change Centre, the Caribbean Tourism
Organisation and the Association of Caribbean States for their collaboration and support.
Additionally, we wish to thank the following institutions:
The Climate Studies Group, Department of Physics, University of the West Indies, Mona Campus
The Meteorological Institute of the Republic of Cuba
The University of Waterloo
The Anton de Kom University of Suriname
The Institute for Gender and Development Studies, University of the West Indies, Mona Campus
The Health Research Resource Unit, Faculty of Medical Science, University of the West Indies,
Mona Campus
The Public Utilities Commission
The Placencia Tourism Center
The CARIBSAVE Partnership would also like to extend its thanks to the Oxford University Centre for the
Environment. Finally, last and by no means least, many thanks to the vision and commitment of the UK
Department for International Development (DFID) and the Australian Agency for International
Development (AusAID) for funding the CARIBSAVE Climate Change Risk Atlas.
This publication is to be cited as follows:
Simpson, M. C., Clarke, J. F., Scott, D. J., New, M., Karmalkar, A., Day, O. J., Taylor, M., Gossling, S., Wilson,
M., Chadee, D., Stager, H., Waithe, R., Stewart, A., Georges, J., Hutchinson, N., Fields, N., Sim, R., Rutty, M.,
Matthews, L., Charles, S., and Agosta G’meiner, A. (2012). CARIBSAVE Climate Change Risk Atlas (CCCRA) -
Belize. DFID, AusAID and The CARIBSAVE Partnership, Barbados, West Indies.

xi
PROJECT BACKGROUND AND APPROACH
Contribution to climate change knowledge and understanding
Climate change is a serious and substantial threat to the economies of Caribbean nations, the livelihoods of
communities and the environments and infrastructure across the region. The CARIBSAVE Climate Change
Risk Atlas (CCCRA) Phase I, funded by the UK Department for International Development (DFID/UKaid) and
the Australian Agency for International Development (AusAID), was conducted from 2009 – 2011 and
successfully used evidence-based, inter-sectoral approaches to examine climate change risks,
vulnerabilities and adaptive capacities; and develop pragmatic response strategies to reduce vulnerability
and enhance resilience in 15 countries across the Caribbean (Anguilla, Antigua & Barbuda, The Bahamas,
Barbados, Belize, Dominica, The Dominican Republic, Grenada, Jamaica, Nevis, Saint Lucia, St. Kitts, St.
Vincent & the Grenadines, Suriname and the Turks & Caicos Islands).
The primary basis of the CCCRA work is the detailed climate modelling projections done for each country
under three scenarios: A2, A1B and B1. These scenarios effectively capture the range of likely emissions
and have therefore received the focus of attention by the modelling community. Consequently, most of the
discussion in the IPCC AR4 report is based on these scenarios, for which model data is available. Climate
models have demonstrable skill in reproducing the large scale characteristics of the global climate
dynamics; and a combination of multiple Global Climate Model (GCM) and downscaled Regional Climate
Model (RCM) projections was used in the investigation of climatic changes for all 15 countries. RCMs
simulate the climate at a finer spatial scale over a small area, like a country, acting to ‘downscale’ the GCM
projections and provide a better physical representation of the local climate of that area. As such, changes
in the dynamic climate processes at a national or community scale can be projected.
SRES storylines and scenario families used for calculating future greenhouse gas and other pollutant emissions
Storyline and scenario family
Description
A2 A very heterogeneous world; self reliance; preservation of local identities; continuously increasing global population; economic growth is regionally oriented and per capita economic growth and technological change are slower than in other storylines.
A1B The A1 storyline and scenario family describes a future world of very rapid economic growth, global population that peaks in mid-century and declines thereafter, and the rapid introduction of new and more efficient technologies. The three A1 groups are distinguished by their technological emphasis. A1B is balanced across all sources - not relying too heavily on one particular energy source, on the assumption that similar improvement rates apply to all energy supply and end use technologies.
B1 A convergent world with the same global population that peaks in mid-century and declines thereafter, as in the A1 storyline, but with rapid changes in economic structures toward a service and information economy, with reductions in material intensity, and the introduction of clean and resource-efficient technologies. The emphasis is on global solutions to economic, social, and environmental sustainability, including improved equity, but without additional climate initiatives.
(Source: Adapted from the IPCC Special Report on Emissions Scenarios, 2000)
The CCCRA provides robust and meaningful new work in the key sectors and focal areas of: Community
Livelihoods, Gender, Poverty and Development; Agriculture and Food security; Energy; Water Quality and
Availability; Sea Level Rise and Storm Surge Impacts on Coastal Infrastructure and Settlements;
Comprehensive Disaster Management; Human Health; and Marine and Terrestrial Biodiversity and
Fisheries. This work was conducted through the lens of the tourism sector; the most significant socio-
economic sector to the livelihoods, national economies and environments of the Caribbean and its' people.

xii
The field work components of the research and CARIBSAVE’s commitment to institutional strengthening in
the Caribbean have helped to build capacity in a wide selection of ministries, academic institutions,
communities and other stakeholders in the areas of: climate modelling, gender and climate change, coastal
management methods and community resilience. Having been completed for 15 countries in the
Caribbean Basin, this work allows for inter-regional and cross-regional comparisons leading to lesson
learning and skills transfer.
A further very important aspect of the CCCRA is the democratisation of climate change science. This was
conducted through targeted awareness, tools (e.g. data visualisation, GIS imagery, animated projections
and short films), and participatory approaches (workshops and vulnerability mapping) to improve
stakeholder knowledge and understanding of what climate change means for them. Three short films, in
high-resolution format of broadcast quality, are some of the key outputs. These films are part of the
Partnerships for Resilience series and include: ‘Climate Change and Tourism’; ‘Caribbean Fish Sanctuaries’;
and ‘Living Shorelines’. They are available at www.youtube.com/Caribsave.
Project approach to enhancing resilience and building capacity to respond to climate change
across the Caribbean
Processes and outputs from the CCCRA bridge the gap between the public and private sectors and
communities; and their efforts to address both the physical and socio-economic impacts of climate change,
allowing them to better determine how current practices (which in fact are not isolated in one sector
alone) and capacities must be enhanced. The stages of the CCCRA country profile protocol (see Flow Chart
on following page) are as follows: a) Climate Modelling and Data Analysis (including analysis of key ‘Tier 1’
climate variables linking the climate modelling to physical impacts and vulnerabilities) b) Physical Impacts
and Vulnerability Assessment c) Tourism and Related Sector Vulnerability Assessments (including
examination of the sectors of water, energy, agriculture, biodiversity, health, infrastructure and settlement,
and comprehensive disaster management) d) Development of Vulnerability Profile with stakeholders taking
account of socio-economic, livelihood and gender impacts (including evaluation of ‘Tier 2’ linking variables
and indicators such as coastal inundation) e) Adaptive Capacity Assessment and Profiling f) Development of
Adaptation and Mitigation Strategies and Policy Recommendations (action planning). The final stages
depicted in the flow chart focusing on the implementation of policies and strategies at
ministerial/government level and the implementation of actions at community level, using a community-
based adaptation approach, are proposed to be implemented as part of the forthcoming CCCRA process as
projects to be funded by other donors post the country profile stage.
The work of the CCCRA is consistent with the needs of Caribbean Small Island and Coastal Developing
States identified in the document, “Climate Change and the Caribbean: A Regional Framework for
Development Resilient to Climate Change (2009-2015)”, published by the Caribbean Community Climate
Change Centre (CCCCC); and supports each of the key strategies outlined in the framework’s Regional
Implementation Plan.

xiii
CCCRA Profiling Flow Chart
The CCCRA continues to provide assistance to the governments, communities and the private sector of the
Caribbean at the local destination level and at national level through its primary outputs for each of the 15
participating countries: National Climate Change Risk Profiles; Summary Documents; and high-resolution
maps showing sea level rise and storm surge projections under various scenarios for vulnerable coastal
areas. It is anticipated that this approach will be replicated in other destinations and countries across the
Caribbean Basin.
The CCCRA explored recent and future changes in climate in each of the 15 countries using a combination
of observations and climate model projections. Despite the limitations that exist with regards to climate
modelling and the attribution of present conditions to climate change, this information provides very useful
indications of the changes in the characteristics of climate and impacts on socio-economic sectors.
Consequently, decision makers should adopt a precautionary approach and ensure that measures are taken
to increase the resilience of economies, businesses and communities to climate-related hazards.
This report was created through an extensive desk research, participatory workshops, fieldwork, surveys
and analyses with a wide range of public and private sector, and local stakeholders over 18 months.

xiv
LIST OF ABBREVIATIONS AND ACRONYMS
AIC -------------------- Aviation-induced clouds AOSIS ---------------- Alliance of Small Island States APAMO -------------- Association of Protected Areas Management Organization APD ------------------- Air Passenger Duty AR4 ------------------- Fourth Assessment Report ASTER --------------- Advanced Spaceborne Thermal Emission and Reflection Radiometer AT --------------------- Ambergris Today AusAID --------------- Australian Agency for International Development BAL ------------------- Belize Aquaculture Ltd BAS ------------------- Belize Audubon Society BAU ------------------ Business as usual BECOL ---------------- Belize Electrical Company Ltd BEL ------------------- Belize Electricity Ltd BERDS --------------- Biodiversity and Environmental Resource Data System of Belize BEST ----------------- Belize Enterprise for Sustainable Technology BSI -------------------- Belize Sugar Industries BTB ------------------- Belize Tourism Board BUN-CA -------------- Biomass Users Network in Central America BWS ----------------- Belize Water Services Ltd. CAD ------------------- Caribbean Application Document CAPRA --------------- Central American Probabilistic Risk Assessment CAREC --------------- Caribbean Epidemiology Centre CARICOM ----------- Caribbean Community CATHALAC --------- Water Center for the Humid Tropics of Latin America and the Caribbean CBB ------------------- Central Bank of Belize CBD ------------------- Convention on Biological Diversity CBO ------------------- Community-Based Organisation CCB ------------------- Caye Caulker Belize CCCCC---------------- Caribbean Community Climate Change Centre CCCRA --------------- CARIBSAVE Climate Change Risk Atlas CCD ------------------- Convention to Combat Desertification CDEMA -------------- Caribbean Disaster Emergency Management Agency CDM ------------------ Clean Development Mechanism (in the context of energy) CDM ------------------ Comprehensive Disaster Management CDMP ---------------- Caribbean Disaster Mitigation Project CEHI ----------------- Caribbean Environmental Health Institute CEIS ------------------- Caribbean Energy Information System CEMP ---------------- Comprehensive Emergency Management Plan CITES ----------------- Convention on International Trade in Endangered Species OLADE --------------- Latin American Energy Organisation COP ------------------- Conference of the Parties CPA ------------------- Country Poverty Assessment CREDP --------------- Caribbean Renewable Energy Development Project CRFM ---------------- Caribbean Regional Fisheries Mechanism CROSQ --------------- Caribbean Regional Organisation for Standards and Quality CTA ------------------- Technical Centre for Agricultural and Rural Cooperation CTO ------------------- Caribbean Tourism Organization CUBiC ---------------- Caribbean Uniform Building Code CW -------------------- Consolidated Water (Belize) Ltd. CZM ----------------- Coastal Zone Management CZMAI --------------- Coastal Zone Management Authority and Institute

xv
DANA ---------------- Damage and Needs Assessment DEEPC ---------------- Caribbean Energy Efficiency Development Project DFID ------------------ Department for International Development DJF -------------------- December, January, February DMC ------------------ Disaster Management Committee DOE ------------------ Department of the Environment DRM ------------------ Disaster Risk Management DRR ------------------- Disaster Risk Reduction ECLAC --------------- United Nations Economic Commission for Latin America and the Caribbean ECE ------------------- Energy Conservation Efficiency EIA -------------------- Environmental Impact Assessment ENSO ----------------- El Nino Southern Oscillation EOC ------------------- Emergency Operations Centre ETS-------------------- Emission Trading Scheme EU--------------------- European Union EWS ------------------ Early Warning System FAO ------------------ Food and Agriculture Organization GCM ----------------- Global Circulation Model GCP ------------------- Ground Control Point GDEM ---------------- Global Digital Elevation Model GDP ------------------ Gross Domestic Product GFDRR --------------- Global Facility for Disaster Reduction and Recovery GGCA ---------------- Global Gender and Climate Alliance GGHE ---------------- General Government Expenditure on Health GHG ------------------ Greenhouse gas GIS ------------------- Geographic Information System (GIS) GOB ------------------ Government of Belize GPS ------------------- Global Positioning System GWI ------------------ Global Water Intelligence HFA ------------------- Hyogo Framework for Action IAASTD--------------- International Assessment of Agricultural Knowledge, Science and Technology for
Development IATA ------------------ International Air Transport Association ICC -------------------- International Code Council ICIMOD -------------- International Centre for Integrated Mountain Development ICZM ----------------- Integrated Coastal Zone Management IDB -------------------- Inter American Development Bank IEA -------------------- International Energy Agency IFAD ------------------ International Fund for Agricultural Development IFRC ------------------ International Federation of the Red Cross and Red Crescent Societies IIC --------------------- Inter-American Investment Corporation IICA ------------------- Inter-American Institute for Cooperation on Agriculture INSMET -------------- Meteorological Institute of the Republic of Cuba IPCC ----------------- Intergovernmental Panel on Climate Change ISCCP ----------------- International Satellite Cloud Climatology Project ISDR ------------------ International Strategy for Disaster Reduction ITZC------------------- Inter-Tropical Convergence Zone IVM ------------------- Integrated Vector Management JJA -------------------- June, July, August LIC -------------------- Land Information Centre LPG ------------------- Liquefied Petroleum Gas LSMS ----------------- Living Standards Measurement Survey MAM ----------------- March, April, May MDG ----------------- Millennium Development Goal
xvi
MNRE --------------- Ministry of Natural Resources and the Environment MONRECI ----------- Ministry of Natural Resources, the Environment, Commerce and Industry,
Government of Belize MPA ------------------ Marine Protected Area MT -------------------- Ministry of Tourism MWh ----------------- Megawatt hours NASA ----------------- National Aeronautics and Space Administration NEC ------------------- National Emergency Coordinator NEMO ---------------- National Emergency Management Organization NGO ------------------ Non-Governmental Organisation NIWRM -------------- National Integrated Water Resource Management Policy NMS ------------------ National Meteorological Service, Belize NPDC ----------------- National Policy Development Committee OE -------------------- Operating Entities OECD ----------------- Organization of Economic Co-operation and Development OECS ---------------- Organization of Eastern Caribbean States OLADE --------------- Latin America Energy Organisation PACT ----------------- Protected Areas Conservation Trust PAHO ---------------- Pan-American Health Organization PCSD ----------------- Peninsula Citizens for Sustainable Development PH--------------------- Paradise Hunter PTWC ---------------- Pacific Tsunami Warning Center PUC ------------------ Public Utilities Commission RCM ------------------ Regional Climate Model RCMRD -------------- Regional Centre for Mapping of Resources for Development REAP ----------------- Rural Education & Agriculture Programme REDD ----------------- Reducing Emissions from Deforestation and Forest Degradation REM ------------------ Riley Encased Methodology RH -------------------- Relative Humidity RNAT ----------------- Regional Needs Assessment Team RTK ------------------- Real Time Kinematic RWU ----------------- Rural Water Unit SERVIR -------------- Regional Visualization & Monitoring System SIB -------------------- Statistical Institute of Belize SIDS ------------------ Small Island Developing States SLR ------------------- Sea Level Rise SON ------------------ September, October, November SST -------------------- Sea Surface Temperatures STP ------------------- Sustainable Tourism Program TIN ------------------- Triangular Irregular Network TOR ------------------- Terms of Reference UKERC --------------- UK Energy Research Centre UNCCD--------------- United Nations Convention to Combat Desertification UNDAF -------------- United Nations Development Assistance Framework UNDP ---------------- United Nations Development Programme UNEP ----------------- United Nations Environment Programme UNESCO ------------- United Nations Educational, Scientific and Cultural Organisation UNFCCC ------------- United Nations Framework Convention on Climate Change UNFPA --------------- United Nations Population Fund UNIFEM ------------- United Nations Development Fund for Women UN-OHRLLS --------- United Nations Office of the High Representative for the Least Developed
Countries, Landlocked Developing Countries and Small Island Developing States UNWTO ------------- United Nations World Tourism Organization USAID ---------------- United States Agency for International Development

xvii
UWI ------------------ University of the West Indies VCA ------------------- vulnerability and capacity assessment WAAS ---------------- Wide Area Augmentation System WASA ---------------- Water and Sewerage Authority WCS ------------------ Wildlife Conservation Society WHO ----------------- World Health Organization WMB ----------------- Water Missions in Belize WMO ---------------- World Meteorological Organization WWF ----------------- World Wildlife Fund

xviii
EXECUTIVE SUMMARY
A practical evidence-based approach to
building resilience and capacity to
address the challenges of climate
change in the Caribbean
Climate change is a serious and substantial threat to
the economies of Caribbean nations, the livelihoods
of communities and the environments and
infrastructure across the region. The CARIBSAVE
Climate Change Risk Atlas (CCCRA) Phase I, funded
by the UK Department for International
Development (DFID/UKaid) and the Australian
Agency for International Development (AusAID), was
conducted from 2009 – 2011 and successfully used
evidence-based, inter-sectoral approaches to
examine climate change risks, vulnerabilities and
adaptive capacities; and develop pragmatic
response strategies to reduce vulnerability and
enhance resilience in 15 countries across the
Caribbean (Anguilla, Antigua & Barbuda, The
Bahamas, Barbados, Belize, Dominica, The
Dominican Republic, Grenada, Jamaica, Nevis, Saint
Lucia, St. Kitts, St. Vincent & the Grenadines,
Suriname and the Turks & Caicos Islands).
The CCCRA provides robust and meaningful new
work in the key sectors and focal areas of:
Community Livelihoods, Gender, Poverty and
Development; Agriculture and Food security;
Energy; Water Quality and Availability; Sea Level
Rise and Storm Surge Impacts on Coastal
Infrastructure and Settlements; Comprehensive
Disaster Management; Human Health; and Marine
and Terrestrial Biodiversity and Fisheries. This work
was conducted through the lens of the tourism
sector; the most significant socio-economic sector to
the livelihoods, national economies and
environments of the Caribbean and its people.
SELECTED POLICY POINTS
Regional Climate Models, downscaled to
national level in the Risk Atlas, have provided
projections for Caribbean SIDS and coastal
states with enough confidence to support
decision-making for immediate adaptive action.
Planned adaptation must be an absolute
priority. New science and observations should
be incorporated into existing sustainable
development efforts.
Economic investment and livelihoods,
particularly those related to tourism, in the
coastal zone of Caribbean countries are at risk
from sea level rise and storm surge impacts.
These risks can encourage innovative
alternatives to the way of doing business and
mainstreaming of disaster risk reduction across
many areas of policy and practice.
Climate change adaptation will come at a cost
but the financial and human costs of inaction
will be much greater.
Tourism is the main economic driver in the
Caribbean. Primary and secondary climate
change impacts on this sector must both be
considered seriously. Climate change is
affecting related sectors such as health,
agriculture, biodiversity and water resources
that in turn impact on tourism resources and
revenue in ways that are comparable to direct
impacts on tourism alone.
Continued learning is a necessary part of
adaptation and building resilience and capacity.
There are many areas in which action can and
must be taken immediately.
Learning from past experiences and applying
new knowledge is essential in order to avoid
maladaptation and further losses.

xix
Vulnerable community livelihoods
The town of Placencia is located on a
low-lying peninsula.
A significant percentage of livelihoods,
such as tour operations, water-sports,
accommodation facilities, food and
beverage operations, are related – and
therefore dependant on tourism.
Residents have noted an increase in the
incidence of ‘freak storms’, or localised
tropical storm-type conditions which
affect livelihoods directly and indirectly.
There is only one road in and out of
Placencia and for the duration of any
flood, there is no access to and from the
community.
Vulnerable coastlines
1 m SLR places 73% of the major tourism
properties at risk; increasing to 86%
under a 2 m SLR scenario.
At 0.5 m SLR scenario, Rocky Point is
projected to lose 75% of its beach area,
followed by San Pedro (19%) and Caye
Caulker (17%).
With a 1 m SLR, Caye Caulker would lose
almost its entire beach area (96%),
followed by Rocky Point (90%) and Sand
Pedro (45%).
With a 2 m SLR, both Caye Caulker and
Rocky Point would lose all (100%) of its
beach area, with San Pedro losing its
beach area with a 3 m SLR scenario.
Overview of Climate Change Issues in Belize
Previous assessments of the tourism sector in Belize have acknowledged that as a tropical, coastal nation,
Belize is highly vulnerable to variable climate and weather patterns as well as tropical cyclones. In fact, the
country is already experiencing some of the effects of climate variability and change through damages from
severe weather systems and other extreme events, as well as more subtle changes in temperatures.
Detailed climate modelling projections for Belize predict:
an increase in average atmospheric temperature;
reduced average annual rainfall;
increased Sea Surface Temperatures (SST); and
the potential for an increase in the intensity of tropical storms.
And the extent of such changes is expected to be worse than what is being experienced now.
To capture local experiences and observations; and to determine the risks to coastal properties and
infrastructure, selected sites were analysed to:
1. assess the vulnerability of the livelihoods of community residents in Placencia area to climate
change; and
2. project sea level rise and storm surge impacts on Caye Caulker, Rocky Point and San Pedro.
The sites were selected by national stakeholders and represent areas of the country which are important to
the tourism sector and the economy as a whole, and are already experiencing adverse impacts from
climate-related events.
Climate change effects are evident in the decline of some coastal tourism resources, but also in the
socioeconomic sectors which support tourism, such as agriculture, water resources, health and
biodiversity.
xx
Climate Change Projections for Belize
The projections of temperature, precipitation, sea surface temperatures; and tropical storms and hurricanes
for Belize are indicated in Box 1 and have been used in making expert judgements on the impacts on
various socio-economic sectors and natural systems, and their further implications for the tourism industry.
Stakeholders consulted in the CCCRA have shared their experiences and understanding about climate-
related events, and this was generally consistent with observational data.
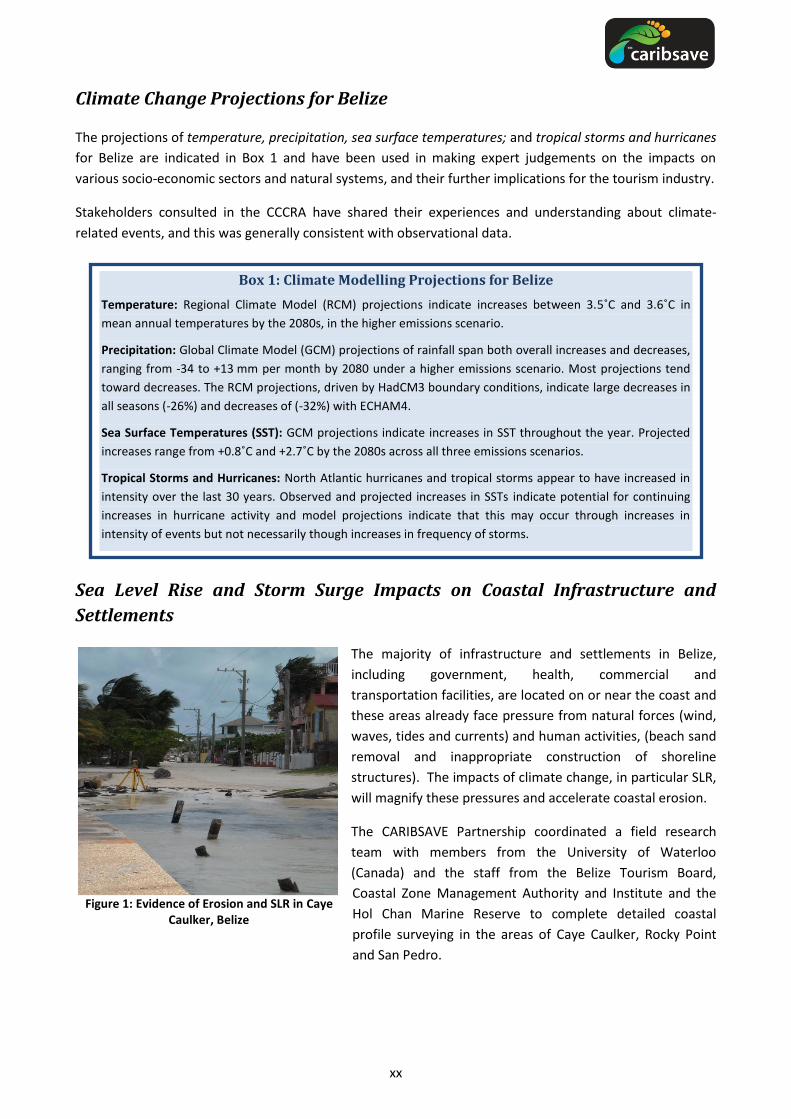
Sea Level Rise and Storm Surge Impacts on Coastal Infrastructure and
Settlements
The majority of infrastructure and settlements in Belize,
including government, health, commercial and
transportation facilities, are located on or near the coast and
these areas already face pressure from natural forces (wind,
waves, tides and currents) and human activities, (beach sand
removal and inappropriate construction of shoreline
structures). The impacts of climate change, in particular SLR,
will magnify these pressures and accelerate coastal erosion.
The CARIBSAVE Partnership coordinated a field research
team with members from the University of Waterloo
(Canada) and the staff from the Belize Tourism Board,
Coastal Zone Management Authority and Institute and the
Hol Chan Marine Reserve to complete detailed coastal
profile surveying in the areas of Caye Caulker, Rocky Point
and San Pedro.
Box 1: Climate Modelling Projections for Belize
Temperature: Regional Climate Model (RCM) projections indicate increases between 3.5˚C and 3.6˚C in
mean annual temperatures by the 2080s, in the higher emissions scenario.
Precipitation: Global Climate Model (GCM) projections of rainfall span both overall increases and decreases,
ranging from -34 to +13 mm per month by 2080 under a higher emissions scenario. Most projections tend
toward decreases. The RCM projections, driven by HadCM3 boundary conditions, indicate large decreases in
all seasons (-26%) and decreases of (-32%) with ECHAM4.
Sea Surface Temperatures (SST): GCM projections indicate increases in SST throughout the year. Projected
increases range from +0.8˚C and +2.7˚C by the 2080s across all three emissions scenarios.
Tropical Storms and Hurricanes: North Atlantic hurricanes and tropical storms appear to have increased in
intensity over the last 30 years. Observed and projected increases in SSTs indicate potential for continuing
increases in hurricane activity and model projections indicate that this may occur through increases in
intensity of events but not necessarily though increases in frequency of storms.
Figure 1: Evidence of Erosion and SLR in Caye Caulker, Belize
xxi
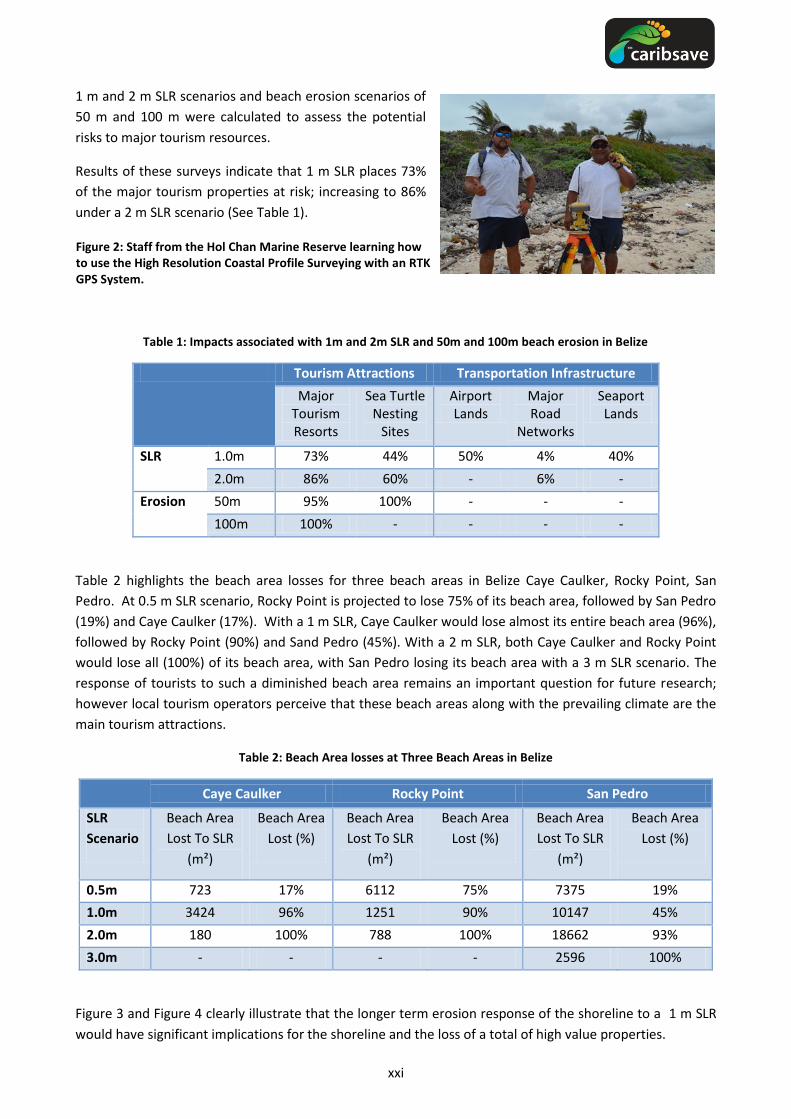
1 m and 2 m SLR scenarios and beach erosion scenarios of
50 m and 100 m were calculated to assess the potential
risks to major tourism resources.
Results of these surveys indicate that 1 m SLR places 73%
of the major tourism properties at risk; increasing to 86%
under a 2 m SLR scenario (See Table 1).
Table 1: Impacts associated with 1m and 2m SLR and 50m and 100m beach erosion in Belize
Tourism Attractions Transportation Infrastructure
Major Tourism Resorts
Sea Turtle Nesting
Sites
Airport Lands
Major Road
Networks
Seaport Lands
SLR 1.0m 73% 44% 50% 4% 40%
2.0m 86% 60% - 6% -
Erosion 50m 95% 100% - - -
100m 100% - - - -
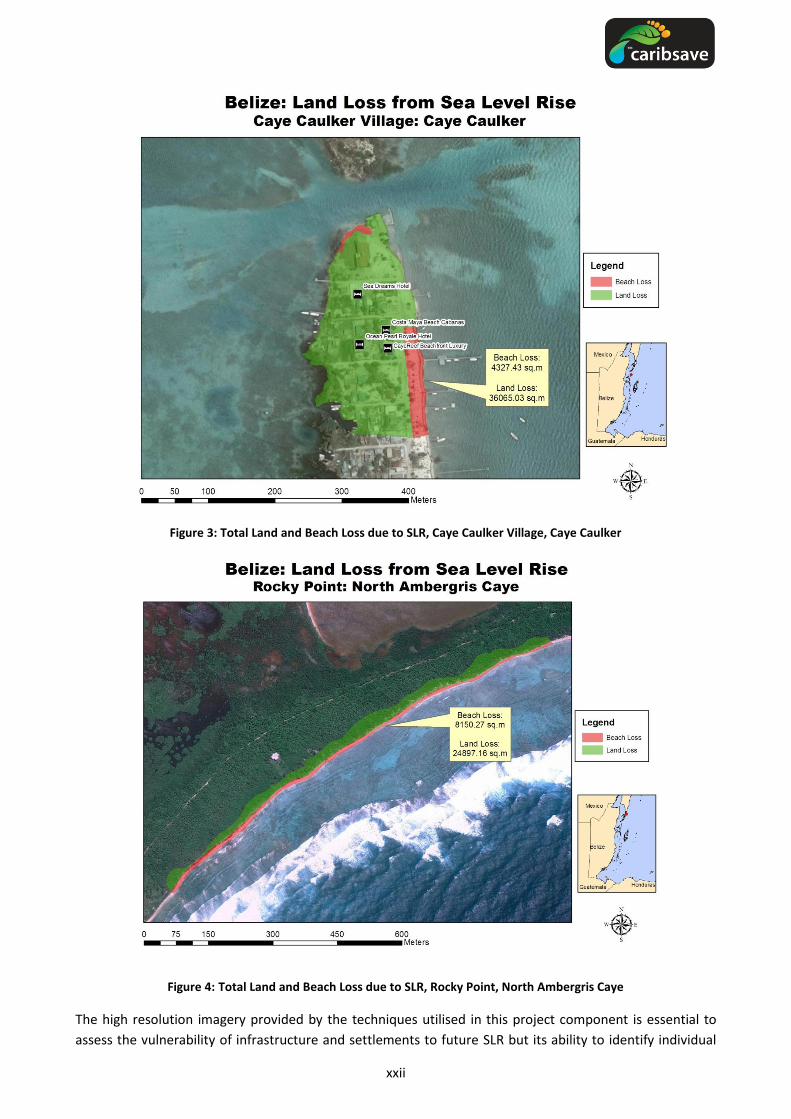
Table 2 highlights the beach area losses for three beach areas in Belize Caye Caulker, Rocky Point, San
Pedro. At 0.5 m SLR scenario, Rocky Point is projected to lose 75% of its beach area, followed by San Pedro
(19%) and Caye Caulker (17%). With a 1 m SLR, Caye Caulker would lose almost its entire beach area (96%),
followed by Rocky Point (90%) and Sand Pedro (45%). With a 2 m SLR, both Caye Caulker and Rocky Point
would lose all (100%) of its beach area, with San Pedro losing its beach area with a 3 m SLR scenario. The
response of tourists to such a diminished beach area remains an important question for future research;
however local tourism operators perceive that these beach areas along with the prevailing climate are the
main tourism attractions.
Table 2: Beach Area losses at Three Beach Areas in Belize
Caye Caulker Rocky Point San Pedro
SLR
Scenario
Beach Area
Lost To SLR
(m²)
Beach Area
Lost (%)
Beach Area
Lost To SLR
(m²)
Beach Area
Lost (%)
Beach Area
Lost To SLR
(m²)
Beach Area
Lost (%)
0.5m 723 17% 6112 75% 7375 19%
1.0m 3424 96% 1251 90% 10147 45%
2.0m 180 100% 788 100% 18662 93%
3.0m - - - - 2596 100%
Figure 3 and Figure 4 clearly illustrate that the longer term erosion response of the shoreline to a 1 m SLR
would have significant implications for the shoreline and the loss of a total of high value properties.
Figure 2: Staff from the Hol Chan Marine Reserve learning how to use the High Resolution Coastal Profile Surveying with an RTK GPS System.
xxii
Figure 3: Total Land and Beach Loss due to SLR, Caye Caulker Village, Caye Caulker
Figure 4: Total Land and Beach Loss due to SLR, Rocky Point, North Ambergris Caye
The high resolution imagery provided by the techniques utilised in this project component is essential to
assess the vulnerability of infrastructure and settlements to future SLR but its ability to identify individual

xxiii
properties also makes it a very powerful risk communication tool. Having this information available for
community / resort level dialogue on potential adaptation strategies is highly valuable.
Given the historical damage caused by event driven coastal erosion, as well as slow-onset SLR, the need to
design and implement better strategies for mitigating their impacts is becoming apparent. There are a
number of solutions that can be used to tackle beach erosion. Unfortunately, most of the common
solutions, such as beach replenishment and groynes, are only temporary and their cost makes them
unaffordable.
There are three main types of adaptation policies that can be implemented to reduce the vulnerability of
the tourism sector in Belize to SLR and improve the adaptive capacity of the country: (1) Hard engineering
defences and (2) soft engineering defences, which both aim to protect existing infrastructure and the land
on which the infrastructure is built, as well as (3) retreat policies, which aim to establish setbacks and
thereby move people and/or infrastructure away from risk.
Adaption options should be implemented in the framework of integrated coastal zone management (ICZM)
and all decisions need to take into account the broad range of stakeholders involved in decision-making in
the coastal zone. Adaptations should benefit coastlines in light of both climate and non-climate stresses
and adaptations will be promoted as a process towards ICZM rather than an endpoint.
All levels of government and administration in Belize need to embark on a coordinated communication
campaign to inform and raise awareness of SLR impacts and costs for decision makers within the tourism
sector including operators, investors, planners, developers, policy makers, architects and communities.
Community Livelihoods, Gender, Poverty and Development
More than 50 residents and workers from
Placencia participated in research which
included vulnerability mapping, focus-
groups and household surveys which were
developed according to a sustainable
livelihoods framework. This provided an
understanding of: how the main tourism-
related activities, including fishing and
other micro- and medium-sized
commercial activities located along the
coast and have been affected by climate-
related events; the community’s adaptive
capacity and the complex factors that
influence their livelihood choices; and the
differences in the vulnerability of men and
women.
Placencia is a small town located in the Stann Creek District, where tourism is a major part of the local
economy. It is the most southern town on the largest peninsula of the Gulf of Mexico. The eastern side of
the Peninsula is a long expanse of white sand beach as well as mangrove in some areas; the western side is
bounded by a long narrow north-south trending bay of the Caribbean Sea.
The Stann Creek District employs the largest percentage (14%) of the labour force in the tourism sector,
compared to other districts and undoubtedly most of the tourism employees are concentrated in Placencia.
Figure 5: A craft and souvenir stall on the beach in Placencia

xxiv
Owing to the growth of tourism in the community, a number of residents – especially fishermen – have
changed their livelihoods to engage in tourism-based activities which require similar skills as their former
job. Tourism-related jobs mainly revolve around tour operator / guide enterprises and popular activities
include manatee watching, whale shark watching, fly-fishing, sailing, SCUBA diving and snorkelling. Tour
guide and tour operator positions are mainly filled by men. Other areas of work include low-paid, low-
skilled positions such as table waiting, ancillary work and cooks at restaurants/hotels as well as in home
based businesses, much of which are conducted by women. Craft vending is also another tourism-based
activity, although the market also include locals.
Community Characteristics and Experiences
Some of the observed changes in climate noted by residents in Placencia include:
more extreme high and low ambient temperatures, especially uncommonly low temperatures (i.e.
below 50°F);
the apparent merging of wet and dry seasons;
an increase in the incidence of ‘freak storms’, or localised tropical storm-type conditions; and
an increase in the severity of direct and indirect hurricane impacts over the past few years.
In particular, the southern end of peninsula seems to be more susceptible to storm surge impacts and there
are reports of more intense flooding in the area. There are also concerns that changes in tidal patterns
(higher than normal tides) and SLR are causing salt water intrusion into groundwater aquifers on both sides
of the lagoon.
Hurricanes are the most destructive climate-related events impacts on the community. Hurricane Iris in
2001 was one of the most severe systems to affect Belize, causing widespread damage and destruction
throughout, including Placencia. Persons were out of work for several weeks either because of repairs to
be made, or lack of business (possibly due to access challenges, unawareness of the resumption of
operations, others attending to their own response / rehabilitation efforts). Placencia has also experienced
flooding resulting from heavy, continuous rainfall. Fortunately, flooding events are mostly short-lived,
because the sandy substrate allows water to infiltrate through the ground quickly. However, there is only
one road in and out of Placencia and for the duration of any flood, there is no access to and from the
Figure 6: A group creating a vulnerability map of Placencia

xxv
community. Previous torrential rainfall events filled fishing and tour boats with water and caused some of
them to sink.
Within the community, there are several relatively strong factors contributing to adaptive capacity.
Knowledge of climate change and climate related events is relatively high and informed residents can
prepare better for what is to come. Ownership of and access to assets are moderate to high, which follows
the same trend in household income levels and financial security. Most households are also relatively small
(more than 90% have three occupants or less), which would imply that burden-of-care is low and social
support linkages exist amongst households. However, other elements of adaptive capacity are fairly low,
including financial support linkages and a high dependence on an external food.
Some differences exist between male and female headed households, including household income levels,
financial security and ownership/access to assets. In particular, the only household surveyed with a food
shortage was headed by a female. Otherwise, female-headed households are not distinctly disadvantaged
to male-headed households, or vice-versa.
With the constant threat and impact of hurricanes and flooding, community residents have adopted various
coping strategies given that residents suggest that the sandy substrate makes it difficult to build hurricane-
proof structures. Since heavy rains have proven disastrous for fishermen before, sterns (one of the
heaviest parts of the boat) are removed from the boats to protect against sinking. This has proven useful as
the boats are generally not removed from the water.
To address water scarcity problems, rainwater harvesting would provide households in the community with
an alternative source of water for non-potable uses (for toilets, irrigation, washing cars, etc.). Consideration
can also be given to implementing energy saving practices (e.g. using fluorescent light bulbs) widely. These
activities will have multiple results, but most importantly resource conservation and less demand on the
public supply, which also translates to less expenditure on public amenities.
Residents are concerned that the only access road to and from the community is extremely vulnerable to
flooding and in the event that the bridge is inundated, the entire community is relatively cut off from the
remainder of the country, unless water transport can be provided. The current condition of the access
road/bridge should be assessed to determine if any remedial actions can be taken to resolve the poor
drainage issue.
There is no facility for small vessel storage or shelter in the event of inclement weather. Assistance is
needed for boat owners to acquire the necessary equipment which can be used to haul vessels out of the
water in advance of storm activity. An area will also need to be designated for storing these vessels. There
are many concerns regarding the pollution and solid waste disposal issues that plague the community and
surrounding natural environment. Therefore a greater effort should be placed on regulating the disposal
practices of the shrimp farms and exploring more suitable, less damaging alternatives for disposal of other
waste where possible.
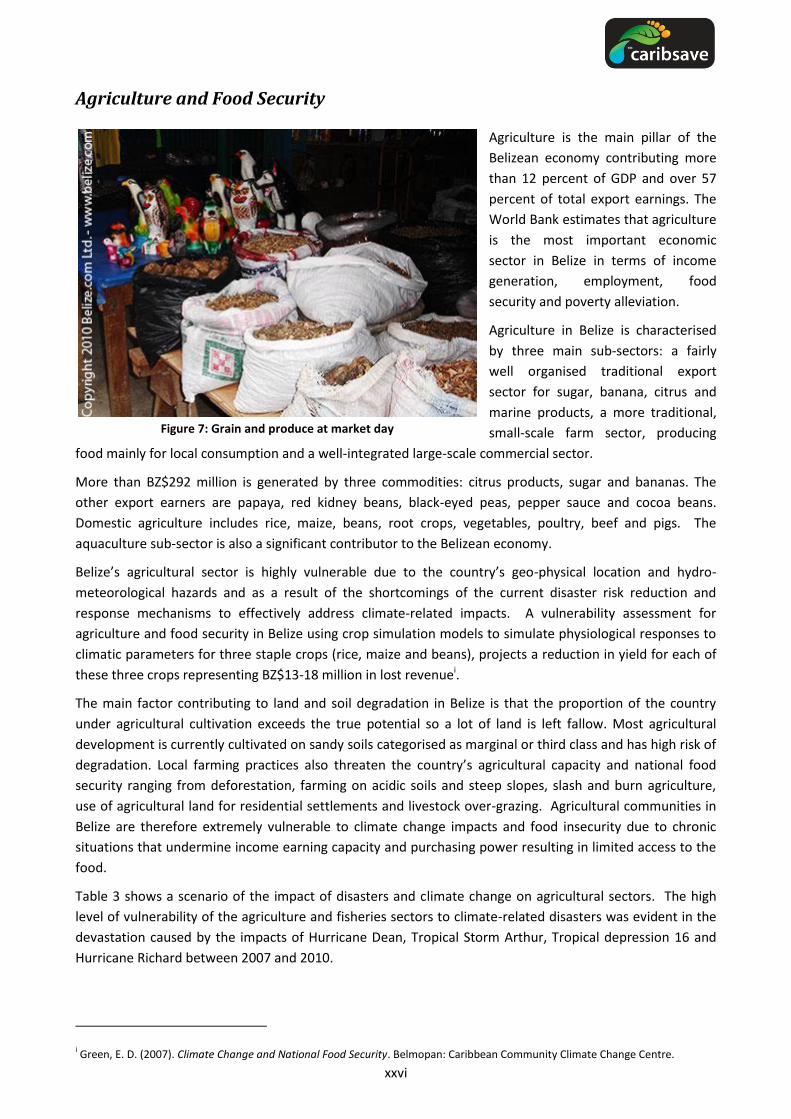
xxvi
Agriculture and Food Security
Agriculture is the main pillar of the
Belizean economy contributing more
than 12 percent of GDP and over 57
percent of total export earnings. The
World Bank estimates that agriculture
is the most important economic
sector in Belize in terms of income
generation, employment, food
security and poverty alleviation.
Agriculture in Belize is characterised
by three main sub-sectors: a fairly
well organised traditional export
sector for sugar, banana, citrus and
marine products, a more traditional,
small-scale farm sector, producing
food mainly for local consumption and a well-integrated large-scale commercial sector.
More than BZ$292 million is generated by three commodities: citrus products, sugar and bananas. The
other export earners are papaya, red kidney beans, black-eyed peas, pepper sauce and cocoa beans.
Domestic agriculture includes rice, maize, beans, root crops, vegetables, poultry, beef and pigs. The
aquaculture sub-sector is also a significant contributor to the Belizean economy.
Belize’s agricultural sector is highly vulnerable due to the country’s geo-physical location and hydro-
meteorological hazards and as a result of the shortcomings of the current disaster risk reduction and
response mechanisms to effectively address climate-related impacts. A vulnerability assessment for
agriculture and food security in Belize using crop simulation models to simulate physiological responses to
climatic parameters for three staple crops (rice, maize and beans), projects a reduction in yield for each of
these three crops representing BZ$13-18 million in lost revenuei.
The main factor contributing to land and soil degradation in Belize is that the proportion of the country
under agricultural cultivation exceeds the true potential so a lot of land is left fallow. Most agricultural
development is currently cultivated on sandy soils categorised as marginal or third class and has high risk of
degradation. Local farming practices also threaten the country’s agricultural capacity and national food
security ranging from deforestation, farming on acidic soils and steep slopes, slash and burn agriculture,
use of agricultural land for residential settlements and livestock over-grazing. Agricultural communities in
Belize are therefore extremely vulnerable to climate change impacts and food insecurity due to chronic
situations that undermine income earning capacity and purchasing power resulting in limited access to the
food.
Table 3 shows a scenario of the impact of disasters and climate change on agricultural sectors. The high
level of vulnerability of the agriculture and fisheries sectors to climate-related disasters was evident in the
devastation caused by the impacts of Hurricane Dean, Tropical Storm Arthur, Tropical depression 16 and
Hurricane Richard between 2007 and 2010.
i Green, E. D. (2007). Climate Change and National Food Security. Belmopan: Caribbean Community Climate Change Centre.
Figure 7: Grain and produce at market day

xxvii
Table 3: Climate Change Impact on Agriculture & Fisheries Sector – Belize
SECTORS DISASTER CLIMATE CHANGE
Agriculture
Sugarcane crop is exposed to flood damage in Orange Walk and Corozal.
Citrus and banana crops are especially vulnerable to wind and flood damage in Stann Creek.
Expected increases of 1-2°C and rainfall changes of 10% are predicted to lower productivity of beans, corn and rice by 10%.
Banana, citrus and emerging vegetable crops face same threats as above.
Fisheries
Exports of shrimp and other marine products are at risk to being affected by tropical storms and storm surges.
Habitats such as sea grass beds, mangroves and coral reefs are vulnerable to storms and siltation.
Traditional catches are expected to migrate as Belizean water warms up.
SLR and coral bleaching also threaten habitats for fish nurseries, such as mangroves and coral reefs.
At the farm level, there are some standard practices for successful small farming systems in Belize in
pursuit of enhanced climate resilience and sustainable livelihoods, namely common vision, teamwork,
mixed farming and natural resource management. Most farms have some form of mixed farming as a
coping strategy, but natural resource management is generally weak to non-existent and there is a
tendency towards the unsustainable and heavy use of fertilizers and chemicals in crop production.
The Belizean farmers should benefit from a “Crop-growing for Climate Change” project to build their
capacity to grow produce using good agricultural practices and to introduce them to new technologies that
will improve the quality and yield of their crops under existing pedoclimatic conditions. They could also
reactivate the “Rural Education Agricultural Programme” to revive the interest of young persons in
agriculture and to build entrepreneurial skills for at-risk youth.
Energy and Tourism
Tourism is an increasingly significant energy consumer and emitter of greenhouse gases (GHGs) both
globally (5% of CO2) and in the Caribbean, with aviation the most important sub-sector. According to
available statistics Belize is emitting lower levels of CO2 than the global annual average of 4.3 t CO2 per
capita (3.1 t CO2). Current tourism related energy use and associated emissions are estimated to be the
equivalent of 31% of estimated national emissions of CO2, though there are considerable uncertainties
associated with these estimates.
Energy audits will help to identify major energy consuming sub-sectors and to develop appropriate
strategies for energy and emissions reductions. Cruise ships (39%), aviation (33%) and accommodation
(12%) were identified as the major direct consumers of energy and emissions. A detailed energy
assessment of the tourism sector is needed however, to confirm these figures, which in part are based on
estimates with considerable uncertainties in assumptions.
Climate change can have both direct and indirect impacts on energy generation, distribution and
transmission infrastructure, with implications for existing traditional (fossil fuel based) energy systems, as
well as proposed renewable energy initiatives. An increase in the intensity (and possibly frequency) of
severe low pressure systems, such as hurricanes, has the potential to affect both traditional and renewable
energy production and distribution infrastructure, including generating plants, transmission lines and
pipelines. Power generating stations and other major infrastructure located on the coastline are highly
vulnerable to damage from flooding and inundation resulting from SLR and storm induced surges.
Temperature increases have been shown to reduce the efficiency of energy generation at thermal power

xxviii
plants and reduced precipitation may affect water availability for non-contact cooling of power generators.
Alternative energy sources, while they are environmentally more sustainable, also face challenges from
physical climate change impacts and these must be considered in energy sector planning.
Total installed capacity in Belize was 117 MW in 2009, comprised of traditional fossil fuel based production,
biomass, hydropower and small contributions from solar and wind power. Additional electricity is
purchased from Mexico and crude oil production averaged 2,500 barrels per day in 2006. Energy is mostly
used for transport (57%), followed by the industrial and commercial sector (22%) and residential uses
(20%). There are 6 main companies contributing electricity to the grid. Consumption of fossil fuels has more
than tripled between 1990 and 2009 and electricity has doubled between 2001 and 2010.
As shown in Table 4, there has been continuous growth in fossil fuel consumption in Belize, from 2,216 bbls
per day in 1990, to about 7,250 bbls per day in 2009. Corresponding emissions have grown from 313,000 t
CO2 in 1990 to 994,000 t CO2 in 2008. There has been a decline in fuel use (and emissions) from 2008 to
2009, which may be a result of the global financial crisis or a reflection of the increased role played by
renewable energy sources in electricity generation.
Table 4: Growth trends in fossil fuel-based energy consumption in Belize, 1990-2009
Oil (bbls per
day)
Metric Tons of CO2
1990 2,216 313,000
1991 2,472 350,000
1992 2,116 304,000
1993 2,108 301,000
1994 1,999 285,000
1995 2,294 329,000
1996 1,936 271,000
1997 3,191 439,000
1998 3,210 439,000
1999 3,257 445,000
2000 4,706 660,000
2001 6,262 863,000
2002 6,008 808,000
2003 6,285 849,000
2004 6,754 906,000
2005 7,122 966,000
2006 7,204 968,000
2007 7,300 981,000
2008 7,400 994,000
2009 7,248 973,583* * own calculation
(Source: Energy Information Administration of the US Department of Energy, 2010)
Along with the growth in tourism and the economy more generally, there has also been a growth trend in
energy consumption. The size of the contribution from tourism to energy consumption and therefore
emissions is however unknown. Preliminary estimations based on a more detailed analysis of tourism
related emissions have indicated that emissions from tourism accounted for 304,862 t CO2 in 2009. In

xxix
comparison to national emissions of 973,583 t CO2, emissions caused by the tourism system are responsible
for the equivalent of about 31% of national emissions.
It is advisable for all destinations in the Caribbean to initiate discussions on new tourism management
models to reduce energy use and emissions, with a focus on market structure and average length of stay.
This is because some markets are economically more beneficial, while consuming considerably less energy
and causing lower emissions. The analysis of markets based on a combined assessment of their economics
and energy intensity should thus be a key priority.
The Belize Tourist Board (BTB) has intensified its marketing to focus on Europe and the emerging markets
of Mexico and Central America (CBB, 2010; BTB, 2010). Long-haul flights increase average emissions per
tourist therefore a focus on Europe will increase vulnerabilities in the energy sector. Furthermore, average
length of stay is declining throughout the region and to maintain a stable number of bednights tourist
volumes would have to continuously grow in the future. This would consequently make countries more
vulnerable to energy prices and climate policy. While statistics on international tourists’ average length of
stay in Belize or its development over time could not be found, efforts to increase average length of stay
should nevertheless be considered. Evidence from a case study in Barbados suggests that this is indeed
feasible and there is also scope to increase spending. A strong focus on Mexico and Central America (closer
markets) as well as alternative marketing strategies with a focus on average length of stay should thus be
envisaged.
Fossil fuel consumption can be substituted through technological innovation that reduces energy needs as
well as renewable energies. Surveys of tourism businesses in Belize showed that approximately 30% would
support the promotion of energy efficiency and only 22% would support alternative energy sources
(Richardson, 2007). The introduction of many technologies is economically feasible in tourism, while new
financing mechanisms such as the Clean Development Mechanism (CDM) and voluntary carbon offsetting
schemes can make contributions to implementing new and innovative technical solutions. Belize has
identified the potential advantages of getting involved with regional and international programmes,
including the CDM.
A number of recommendations are proposed that reflect many of the guidance statements made by the
Public Utilities Commission (2003) for a National Energy Policy. As a strategy to achieve low-energy, low-
emission societies in the Caribbean, the following specific measures are recommended.
Measures to improve knowledge and awareness of energy consumption, emissions of GHG and
climate change among stakeholders;
Energy audits to better understand where energy is used and where emissions occur;
The definition of action plans to avoid unnecessary energy use, increase efficiencies and develop
renewable energies;
Pursue the concept of a ‘Green Economy’ to boost tourism and further reduce dependence on
imported energy;
Pricing of energy through taxes and emission trading to convey clear, long-term market signals; and
Regulation of carbon intense activities in combination with incentives for low-carbon technology
and consumption.

xxx
Water Quality and Availability
Belize is a country rich in surface water sources including streams and rivers as well as many groundwater
aquifers found in calcareous rock. The main source of freshwater in rural areas is predominantly
groundwater, where approximately 95% of freshwater is extracted from groundwater supplies. Freshwater
supplies are sufficient for the current population, though there is an increased stress on these supplies due
to population growth, increases in economic and agricultural activities, as well as an increase in droughts
(BEST, 2009). One desalinisation plant is operating in the country.
Since the Belize Water Services (BWS) took over water distribution from what used to be the Water and
Sewerage Authority (WASA), the rates have either doubled or increased many folds for tariffs and
connection rates (Mustafa and Reeder, 2009). The water cost for San Pedro (where water is sourced from
desalinisation) is BZD 0.20 per gallon for the first 1,000 gallons per month. In Belize City, the rate is BZD
0.10 per gallon, with an added 20% cost for sewerage service, mainly in Belize City and Belmopan. For
other areas, the rate is BZD 0.075 per gallon (See Table 5).
Table 5: Tariff Rates for Belize Water Services
Areas of Supply Rates BZ$ ($US)1 and Conditions
Belize City & Belmopan - Water &
Sewer Zones
2.(a) In any one month for less than 1,001 gallons a fee of $10.34 ($5.21)
(b) Proportionate fee for every gallon thereafter up to 2,000 gallons inclusive at the rate per 1,000 gallons of $17.81 ($8.97)
(c) Proportionate fee for every gallon above 2,000 gallons and up to 3,000 gallons inclusive at the rate per 1,000 gallons of $19.54 ($9.84) (etc. Increase in price for up to 5,000 gallons)
Water ONLY Areas - 14 municipalities - Those areas of Belize City
and Belmopan outside of sewer zones
- All other sub-urban and villages serviced by Belize Water Services Limited.
2.(a)In any one month for less than 1,001 gallons a fee of $8.62 ($4.34)
(b) Proportionate fee for every gallon thereafter up to 2,000 gallons inclusive at the rate per 1,000 gallons of $13.79 ($6.95)
(c) Proportionate fee for every gallon above 2,000 gallons and up to 3,000 gallons inclusive at the rate per 1,000 gallons of $14.94 (14.92) (etc. Increase in price for up to 5,000 gallons)
San Pedro, Ambergris Caye 2.(a)In any one month for less than 1,001 gallons a fee of $25.27 ($12.73)
(b) Proportionate fee for every gallon thereafter up to 2,000 gallons inclusive at the rate per 1,000 gallons of $29.87 ($15.04)
(c) Proportionate fee for every gallon above 2,000 gallons and up to 3,000 gallons inclusive at the rate per 1,000 gallons of $32.17 ($16.20) (etc. Increase in price for up to 5,000 gallons)
Caye Caulker 2.(a)In any one month for less than 1,001 gallons a fee of $23.00 (11.58)
(b) Proportionate fee for every gallon thereafter up to 2,000 gallons inclusive at the rate per 1,000 gallons of $26.45 ($13.32)
(c) Proportionate fee for every gallon above 2,000 gallons and up to 3,000 gallons inclusive at the rate per 1,000 gallons of $29.03 ($14.62) (etc. Increase in price for up to 5,000 gallons)
1Exchange rate used BZ$1.00 = US$0.50
(Source: Belize Water Services, 2009)
Despite its water abundance, recent issues with water scarcity in some areas and water quality have
become more commonplace as various stresses on water resources increase. Key issues with water
vulnerability in Belize are the uneven distribution of water resources. The southern region has the lowest
population, with the highest amount of freshwater availability, whereas the central and northern regions
both have much larger populations and much less water resources. Several Cayes have become popular

xxxi
tourist destinations but have low availabilities of freshwater. In particular, Caye Caulker is vulnerable to
contamination of its underground water through poor sewer construction and intrusion of salt water into
aquifers. It has also been noted that there has been changes in precipitation and that this has led to severe
droughts that have affected many parts of the country.
In Belize, the distribution of all wells that have been drilled or dug out by hand is unknown. There is a lack
of coordination between the BWS and the local village water boards, of which there approximately 90 and
thus no concrete number existsii,iii. Under the village board, the households are usually charged a flat rate
per month as these are not often metered. Where there is no access to piped water service, or no local
provider, then the water is accessed using hand pumps.
There is no fully operational central administration for water resources management (BEST, 2009). Because
of this main issue, financial resources for water management have been minimal and have been focused on
the delivery end primarily for residential/domestic use.
The institutional capacity of Belize is quite large in this sector. However it is underfunded and at times not
adequately coordinated which results in overlapping government agencies and a lack of clear resource
management (BEST, 2009). Belize has an aging water infrastructure and BWS has several ongoing projects
to renew and maintain this (BWS, 2009). The creation of a Leak Detection Unit was crucial to savings both
BWS and more importantly for customers who were saved from paying for lost water (Ibid).
The possibility of broad scale implementation of rain water harvesting, localised waste water recycling
schemes and legislation, including for agricultural irrigation should be considered. Detailed surveying of
groundwater resources and well infrastructure and an increase in the coordination between the BWS and
local village water boards would contribute to sustainable water use.
The lack of information regarding groundwater leads to a difficulty in the management of future water
resources under climate change and increases the vulnerability of communities. The government could also
develop pilot projects to assess artificial recharge of aquifers and conduct feasibility studies explore the
possibility of additional projects. The development of mechanisms to facilitate Integrated Water Resources
Management (IWRM) should be considered. Such an approach allows an equitable management of water
resources, which will be particularly important with declining water resources under climate change.
Comprehensive Natural Disaster Management
Belize has experienced losses and damages from recent disasters that are worth examining in order to
identify vulnerabilities in the country. Specifically, the post-disaster time period is one where
vulnerabilities can be identified and addressed through adaptation and recovery efforts. In October 2010
Hurricane Richard, a category 1 storm, passed over a large area of Belize, affecting 4 districts. Total direct
losses are estimated at BZ $49.2 million including 831 destroyed houses, damages to the electricity and
ii BEST. (2009). National Adaptation Strategy to Address Climate Change in the Water Sector in Belize Strategy and Action Plan.
Belmopan, Belize: Belize Enterprise for Sustainable Technology (BEST). iii Mustafa, D. & Reeder, P. (2009). ‘People Is All That Is Left to Privatize’: Water Supply Privatization, Globalization and Social Justice
in Belize City, Belize. International Journal of Urban and Regional Research, 33(3), 789-808.

xxxii
water distribution systems and minor damages to education infrastructure from wind impactsiv. Figure 8
shows a house that was damaged during Hurricane Richard.
Figure 8: Damaged housing from Hurricane Richard in Belize 2010
(Source: NEMO, 2010a)
Agriculture and fisheries were also impacted by Hurricane Richard. The vulnerability of these two industries
is tied to weather systems in both the long and the short term. The citrus trees that were damaged by the
storm were full of fruit too immature for harvest at the time of the storm. The losses in the citrus industry
were estimated to be 30% of the season’s crop, or BZ $29.1 millioniv. The papaya industry also experienced
losses. These agricultural losses may only last one season, though fisheries, in contrast, experienced
indirect impacts from damaged eco-systems (mangroves, corals and sea grasses) that will affect fish catches
in the long term. Direct losses to equipment and vessels affected both artisanal and commercial fishers at
an estimated cost of BZ $4.28 millioniv.
Disaster management in Belize is led by the National Emergency Management Organization (NEMO),
located in Belmopan. NEMO is comprised of the Cabinet, with the Prime Minister as chairperson and Chief
Executive Officers who chair the 10 operational committees. Further to these national level committees,
there are 9 District Emergency Committees (chaired by the senior Minister in each District) representing
Belize, Corozal, Orange Walk, Cayo, Stann Creek, Toledo, Belmopan, San Pedro and Caye Caulkerv. There
are activities within each district geared at all phases of the disaster management cycle from conducting
preparedness work through public education and training to participation in response activities. These
activities would include those in the watershed flood management project, funded by the Japanese
Government, to provide warnings to communities along the Mopan and Belize Rivers (GFDRR, 2010). The
Belize Electricity Company Limited (BECOL) also has a similar early warning system for the Macal River, a
tributary of the Belize River, where it has 3 hydroelectric generating facilities (GFDRR, 2010). Through an
information management project, NEMO is also working on enhancing early warning systems and the
UNDP has financed an Information Manager to permit better identification, assessment and monitoring of
disaster risk (GFDRR, 2010).
The most comprehensive policy document for disaster risk reduction is the Belize National Hazard
Mitigation Policy and associated Plan. The Hazard Mitigation Policy was developed after two major storms
created economic challenges in Belize and this was also a time when the importance of mainstreaming
iv NEMO. (2010b). Damage Assessment and Needs Analysis: Initial Damage Assessment Report Hurricane Richard. Belize City:
National Emergency Management Organization. v NEMO. (2011). Belize National Emergency Management Organization. Retrieved 11/14/2011, from http://www.nemo.org.bz/
xxxiii
disaster risk reduction into all areas and sectors to permit sustainable development was realised. The
policy concentrates on the need for integrated hazard risk management at all levels, sectors and
communities. Given the recent debt troubles in Belize, a hazard mitigation policy must include
considerations for reducing economic impacts. Other deficiencies relate to lack of power to enforce
legislation, overlapping regulation and mitigation tools under different government agencies, a skew of
legislation toward preparedness and response, the need for greater resources in government agencies and
the need for better integration of the information on environment, development and vulnerability into
decision making. These deficiencies are slow to change and require financial and technical resources,
however, NEMO is working to address them through project funding.
The formulation of an interactive and innovative community education and capacity building programme
designed to reach all levels of Belizean society will enable individuals to manage their own risk levels and
also build resilience to natural hazard events. It is also important for the Government of Belize works with
relevant tourism stakeholders to develop and implement the existing sustainable tourism plans with a
focus on diversification of the tourism product toward the interior and the development of more specific
disaster risk reduction efforts. Capacity building and technical training programmes for NEMO employees
could remedy current technical deficiencies and skills gained. Building regulations should be updated and
inspectors hired, in permanent positions to review all construction in the country.
Human Health
Health is an important component of the tourist industry because tourists are susceptible to both acquiring
diseases and being carriers of diseases. The potential effects of climate change on public health can be
direct or indirect and can affect visitors to a given destination (Confalonieri et al., 2007; Ebi et al., 2006;
Gubler, 2002; Patz et al., 2000). While the acquisition of infection may be serious for visitors it can also
devastate small economies because of the bad publicity it engenders.
An increase in the incidence of infectious diseases has been observed in recent years in Belize. In the Belize
Second National Communication to the UNFCCC, the first modelling study on dengue fever and the effects
of its transmission due to socio-economic, climatic and environmental factors was undertaken partly based
on research by Vanzie (2008). This study found that for 8 communities the probability of dengue
transmission and therefore dengue outbreaks was very high. While other infectious diseases (such as
malaria) represent a public health concern in Belize no other diseases were explored in the study. Belize
had the third highest incidence of malaria in Caribbean Epidemiological Centre (CAREC) Member countries
after Guyana and Suriname, with 11% of cases occurring between 1995 and 2005vi.
Belize has experienced a number of severe droughts in recent times that have affected the various parts of
the country as well as the economy. Acute respiratory infections are particularly important in Belize
because they constitute one of the main causes of morbidity and mortality in the country. Influenza-like
illnesses are also on the rise and there are also public health issues related to the quality of water supply.
There are a number of policies geared towards addressing climate change and health issues either directly
or indirectly. Some of these include:
the National Poverty Elimination Strategy and Action Plan 2007 – 2011;
vi CAREC. (2008c). Malaria - Morbidity Review of Communicable Diseases in CAREC Member Countries, 1980 – 2005, Morbidity
Reviews (pp. 6): Caribbean Epidemiology Centre, CAREC/PAHO/WHO.

xxxiv
the National Food and Nutrition Policy;
the (Avian) Influenza Pandemic Preparedness and Response Operation plan (2007); and
the Policy on Adoption of National Water Quality Standards and the Development of Human
Resources.
The majority (94%) of Belizeans are satisfied with their level of health care; a statistic which is reflected in
all income brackets in the societyvii. However in rural areas health facilities are sparsely distributed and
offer only primary health care since no general hospitals are provided in these areas. The need for this to
be addressed is particularly relevant in the south of the country where water supply, sanitation and
nutrition levels are generally lower than the national standard. Unfortunately, deficiencies in the health
sector such as insufficient staff, inadequate outreach to rural areas for the collection of basic items and
samples due to transportation limitations, insufficient pharmaceuticals and problems with buildings and
equipment, make this need unlikely to be met in the near term. However, the Ministry of Health considers
the programme to manage communicable diseases as “functioning well and require[ing] continued
upgrading and incremental improvement, rather than major new initiatives”.
Another important area that seeks to address vulnerability to climate change in Belize are programmes
geared towards increasing food security. These include the development of a Food-borne Disease
surveillance manual, budgetary allocation to the Food Assistance Programme and an increase in the
allocation of funding to small scale farmers in the 2010/2011 Budget. These projects target specific
communities or districts in Belize.
To enhance Belize’s efforts in maintaining a high standard of public health in the face of climate change it is
important to improve the use of technology with regard to vector-borne diseases. An Early Disease
Warning System that considers temperature signatures for vector borne diseases can be considered,
however this must be validated. Also, given the importance of tourism to the economy, an assessment of
tourism, health and climate change linkages would provide an indication of destination substitution if
tourism related health problems increased as a result of climate change.
Marine and Terrestrial Biodiversity and Fisheries
Belize is home to a rich and diverse biodiversity and to marine and terrestrial eco-systems that are of global
importance. Belize has two large blocks of intact virgin rainforest that are perhaps some of the last
strongholds for species that require large, undisturbed areas for their long-term survival, such as the jaguar.
The Mesoamerican Barrier Reef System, stretching the full length of the country's coastline, is the largest
unbroken coral reef complex in the Western hemisphere and a World Heritage Site, in recognition of its
global importance.
These natural resources are critically important to the economy and communities of Belize and need to be
protected from the increasing pressures placed on them from unsustainable practices and from the impacts
of climate change. According to a recent economic valuation (Cooper, Burke and Bood, 2009) the value of
the products and services provided by Belize’s coral reefs and mangroves in relation to fisheries, tourism
and shoreline protection is estimated to be US$395–$559 million per year (Belize’s GDP was US$1.3 billion
vii Government of Belize. (2011). Belize Second National Communication to the Conference of the Parties of the United Nations
Framework Convention on Climate Change. Belmopan: Ministry of Natural Resources and the Environment.

xxxv
in 2007) viii.
Pine forests in Belize are already struggling to recover
from a devastating plague of pine beetles of the
Dendroctonus family. These small pine beetles have
destroyed up to 70,000 acres (80%) of the Mountain Pine
Ridge Forest near Belize’s border with Guatemala.
According to unpublished reports, unusually long and
severe droughts associated with climate change
weakened the trees, leaving them susceptible to beetle
attacks. Replanting has been hindered by ferocious
forest fire that wiped out close to 20,000 acres of forest
from a biosphere reserve.
An unusually high frequency of intense storms in the last few years, including Hurricane Mitch (1998),
Hurricane Keith (2000), Hurricane Iris (2001), Hurricane Dean (2007) and Hurricane Richard (2010); have
had serious impacts on the coral reefs, mangroves and beaches. A 2006 survey of 140 reefs throughout
Belize found that live coral cover has declined from a level of 25 – 30 percent in the mid-1990’s to an
average of 11 percent in 2006ix. The net loss of mangroves from 1980 to 2010 has been low, but it is worth
noting that 90.9% of the mangroves lost were ecologically important mangroves with ‘marine
connectivity’x. Low-lying coastal areas of Belize and offshore cayes and atolls, are very vulnerable to the
projected acceleration in SLR and are perhaps impossible to save.
Figure 10 represents the coastal and marine habitats of Belize. Belize has launched a major effort to
completely rewrite its fisheries legislation (which dates back to 1948), to be renamed the Aquatic Living
Resources Act rather than the Fisheries Act. The purpose of the new law is to mandate long-term
sustainable use of Belize‘s aquatic resources and it will provide a broad framework for specific regulations
including marine reserves, cooperation with other countries in managing aquatic resources, international
agreements and treaties, scientific research and monitoring and the control and enforcement of the law.
viii Cooper, E., L. Burke and N. Bood. 2009. “Coastal Capital: Belize. The Economic Contribution of Belize’s Coral Reefs and
Mangroves.” WRI Working Paper. World Resources Institute, Washington DC. 53 pp. Available online at
http://www.wri.org/publications ix McField, M. and N. Bood. 2007. “Our reef in peril – Can we use it without abusing it?” Chapter 6 in B. Balboni and J. Palacio (eds).
Taking stock: Belize at 25 years of Independence: Economy, Environment, Society and Culture. x Cherrington, E.A., Hernandez, B.E., Trejos, N.A., Smith, O.A. Anderson, E.R., Flores, A.I. and B.C. Garcia. (2010b). "Identification of
Threatened and Resilient Mangroves in the Belize Barrier Reef System." Technical report to the World Wildlife Fund. Water Center
for the Humid Tropics of Latin America and the Caribbean (CATHALAC) / Regional Visualization & Monitoring System (SERVIR). 28
pp.
Figure 9: Mountain Pine Ridge Forest Reserve
Source: www.reforestbelize.com
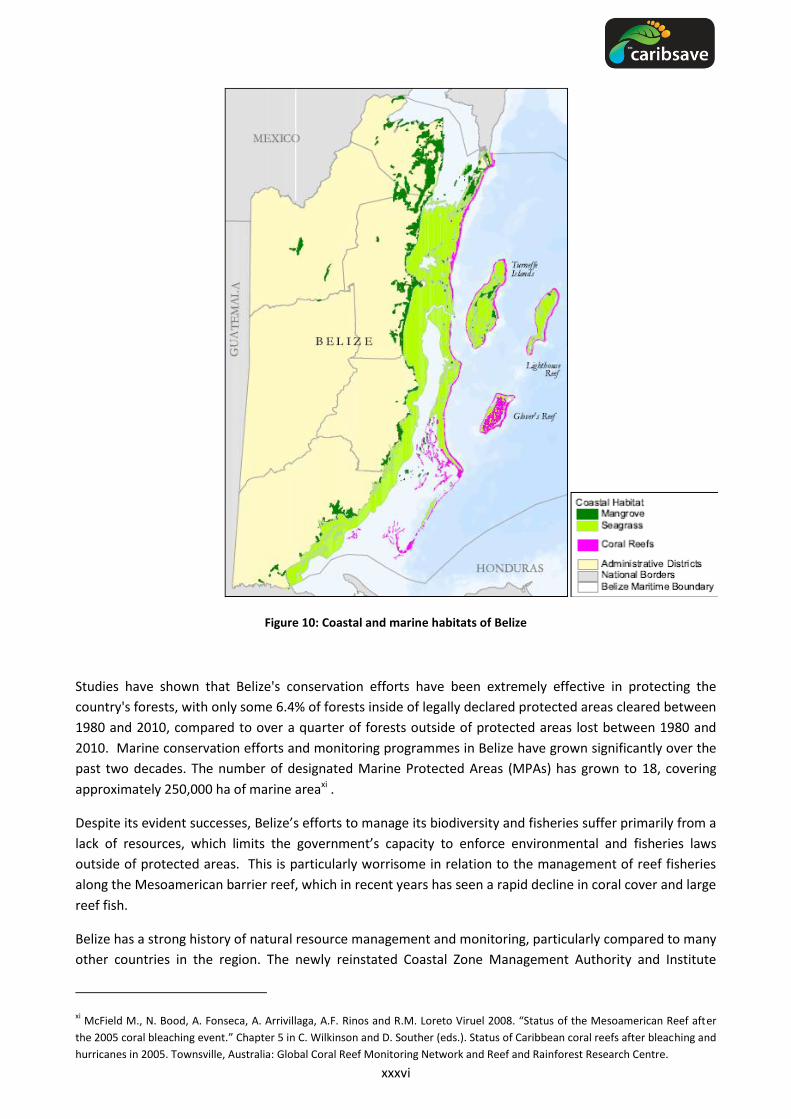
xxxvi
Figure 10: Coastal and marine habitats of Belize
Studies have shown that Belize's conservation efforts have been extremely effective in protecting the
country's forests, with only some 6.4% of forests inside of legally declared protected areas cleared between
1980 and 2010, compared to over a quarter of forests outside of protected areas lost between 1980 and
2010. Marine conservation efforts and monitoring programmes in Belize have grown significantly over the
past two decades. The number of designated Marine Protected Areas (MPAs) has grown to 18, covering
approximately 250,000 ha of marine areaxi .
Despite its evident successes, Belize’s efforts to manage its biodiversity and fisheries suffer primarily from a
lack of resources, which limits the government’s capacity to enforce environmental and fisheries laws
outside of protected areas. This is particularly worrisome in relation to the management of reef fisheries
along the Mesoamerican barrier reef, which in recent years has seen a rapid decline in coral cover and large
reef fish.
Belize has a strong history of natural resource management and monitoring, particularly compared to many
other countries in the region. The newly reinstated Coastal Zone Management Authority and Institute
xi McField M., N. Bood, A. Fonseca, A. Arrivillaga, A.F. Rinos and R.M. Loreto Viruel 2008. “Status of the Mesoamerican Reef after
the 2005 coral bleaching event.” Chapter 5 in C. Wilkinson and D. Souther (eds.). Status of Caribbean coral reefs after bleaching and
hurricanes in 2005. Townsville, Australia: Global Coral Reef Monitoring Network and Reef and Rainforest Research Centre.
xxxvii
(CZMAI) is gradually building capacity for monitoring and research, although additional resources and
technologies are badly needed. Belize also benefits from the presence of several regional agencies that
operate under official CARICOM mandates. These include the Caribbean Community Climate Change
Centre (CCCCC) and the Caribbean Regional Fisheries Mechanism (CRFM), which provide the country with
additional human and technical capacity to examine key issues relevant to natural resource management,
climate change and development. Belize also has an active NGO community with considerable scientific
expertise and international networks of scientists and volunteers.
To avoid a continuing decline in the health of coral reefs and fish populations in MPAs, Belize should
increase overall investment, improve fee collection, strengthen monitoring and enforcement efforts and
establish a permanent source of funding to support the valuable MPA system. Strategic planning at the
system level is also needed to address disparities and gaps in the current structure.
Reforestation of the mangrove stands will protect coastal areas and also improve the health of fish
nurseries and coral reefs thus benefitting the livelihoods of those engaged in marine-based activities.
Proposed MPAs will benefit from the presence of mangrove trees, which filter pollutants and provide
protection to fish and crustaceans allowing them to increase in size and abundance. The Riley Encased
Methodology (REM) for mangrove replantation has proven successful in Belize and overcomes some of the
difficulties experienced in rehabilitation efforts in exposed locations.
Conclusion
The CCCRA explored recent and future changes in climate in Belize using a combination of observations and
climate model projections. Despite the limitations that exist with regards to climate modelling and the
attribution of present conditions to climate change, this information can provide very useful indications of
the changes in the characteristics of regional climate that one might expect under a warmer global climate.
Consequently, decision makers should adopt a precautionary approach and ensure that measures are taken
to increase the resilience of economies, businesses and communities to climate-related hazards.
Belize has a history of damages and losses from natural disasters. Disasters not only interrupt development
progress at the national level, but they also cause individuals to invest time and resources into rebuilding
their homes and livelihoods after an impact. Since it is predicted that under climate change hurricanes may
increase in intensity and, extreme rainfall events may increase in intensity preparedness for disasters (e.g.
flooding or drought) and climate change adaptation become common goals.
The Belize Climate Change Adaptation Policy has been drafted with the goal of getting all government
agencies to incorporate climate change into their activities and policies. Furthermore, there is a heavy focus
on public awareness and education to empower all Belizeans to build their resilience to extreme events.
The sector-specific activities and the inclusion of a monitoring and review process strengthens the policy
and provides a firm foundation for climate change adaptation in the country.
1
1. GLOBAL AND REGIONAL CONTEXT
The Intergovernmental Panel on Climate Change (IPCC) Fourth Assessment Report (AR4), published in 2007,
provides undisputable evidence that human activities are the major reason for the rise in greenhouse gas
emissions and changes in the global climate system (Simpson M. , et al., 2010). Notably, climate change is
ongoing, with “observational evidence from all continents and oceans … that many natural systems are
being affected by regional climate changes, particularly temperature increases” (IPCC, 2007b, p. 8).
Observed and projected climate change will in turn affect socio-economic development (Global
Humanitarian Forum, 2009; Stern, 2006); with some 300,000 deaths per year currently being attributed to
climate change (Global Humanitarian Forum, 2009). Mitigation (to reduce the speed at which the global
climate changes) as well as adaptation (to cope with changes that are inevitable) are thus of great
importance (Parry, et al., 2009).
The IPCC (IPCC, 2007a, p. 5) notes that “warming of the climate system is unequivocal, as it is now evident
from observations of increases in global average air and ocean temperatures, widespread melting of snow
and ice and rising global average sea level”. Climate change has started to affect many natural systems,
including hydrological systems (increased runoff and earlier spring peak discharge, warming of lakes and
rivers affecting thermal structure and water quality), terrestrial ecosystems (earlier spring events including
leaf-unfolding, bird migration and egg-laying, biodiversity decline and pole ward and upward shifts in the
ranges of plants and animal species), as well as marine systems (rising water temperatures, changes in ice
cover, salinity, acidification, oxygen levels and circulation, affecting shifts in the ranges and changes of
algae, plankton and fish abundance).
The IPCC (IPCC, 2007b) also notes that small islands are particularly vulnerable to the effects of climate
change, including SLR and extreme events. Deterioration in coastal conditions is expected to affect fisheries
and tourism, with SLR being “expected to exacerbate inundation, storm surge, erosion and other coastal
hazards, threatening vital infrastructure, settlements and facilities that support the livelihood of island
communities” (IPCC, 2007b, p. 15). Climate change is projected to reduce water resources in the Caribbean
to a point where these become insufficient to meet demand, at least in periods with low rainfalls (IPCC,
2007b). Together, these changes are projected to severely affect socio-economic development and well-
being in the world (Stern, 2006), with the number of climate change related deaths expected to rise to
500,000 per year globally by 2020 (Global Humanitarian Forum, 2009). However, not all regions are equally
vulnerable to climate change. The Caribbean needs to be seen as one of the most vulnerable regions, due
to their relative affectedness by climate change, but also in terms of their capacity to adapt (Bueno,
Herzfeld, Stanton, & Ackerman, 2008). This should be seen in the light of (Dulal, Shah, & Ahmad, 2009, p.
371) conclusion that:
If the Caribbean countries fail to adapt, they are likely to take direct and substantial
economic hits to their most important industry sectors such as tourism, which depends on
the attractiveness of their natural coastal environments and agriculture (including
fisheries), which are highly climate sensitive sectors. By no incidence, these two sectors are
the highest contributors to employment in the majority of these countries and significant
losses or economic downturn attendant to inability to adapt to climate change will not
increase unemployment but have potentially debilitating social and cultural consequences
to communities.
Climate change has, since the publication of the Intergovernmental Panel on Climate Change’s 4th
Assessment Report (IPCC, 2007b), been high on the global political agenda. The most recent UN Conference
2
of the Parties (COP) in Mexico in December 2010 agreed that increases in temperature should be stabilised
at a maximum of 2°C by 2100. Notably, the 39 member states of the Alliance of Small Island States (AOSIS)
have called in a recent Declaration to the United Nations for a new climate change agreement that would
ensure global warming to be kept at a maximum of 1.5°C; (AOSIS, 2009).
So far, the European Union is the only region in the world with a legally binding target for emission
reductions, imposed on the largest polluters. Some individual countries are taking action, such as the
Australian Government’s comprehensive long-term plan for tackling climate change and securing a clean
energy future. The plan outlines the existing policies already underway to address climate change and cut
carbon pollution and introduces several critical new initiatives and has four pillars: a carbon price;
renewable energy; energy efficiency; and action on land. As a group, AOSIS member states account for less
than 1% of global greenhouse gas emissions (UN-OHRLLS, 2009). However, according to a recent report of
the IPCC the projected impacts of global climate change on the Caribbean region are expected to be
devastating (IPCC, 2007c).
An analysis of the vulnerability of CARICOM nations to SLR and associated storm surge by The CARIBSAVE
Partnership in 2010 found that large areas of the Caribbean coast are highly susceptible to erosion and
beaches have experienced accelerated erosion in recent decades. It is estimated that with a 1 m SLR and a
conservative estimate of associated erosion, 49% of the major tourism resorts in CARICOM countries would
be damaged or destroyed. Erosion associated with a 2 m SLR (or a high estimate for a 1 m SLR), would
result in an additional 106 resorts (or 60% of the region’s coastal resorts) being at risk. Importantly, the
beach assets so critical to tourism would be affected much earlier than the erosion damages to tourism
infrastructure, affecting property values and the competitiveness of many destinations. Beach nesting sites
for sea turtles were also at significant risk to beach erosion associated with SLR, with 51% significantly
affected by erosion from 1 m SLR and 62% by erosion associated with 2 m SLR (Simpson et al., 2010).
In real terms, the threats posed to the region’s development prospects are severe and it is now accepted
that adaptation will require a sizeable and sustained investment of resources. Over the last decade alone,
damages from intense climatic conditions have cost the region in excess of half a trillion US dollars (CCCCC,
2009).
Belize has prepared a Policy on Adaptation to Global Climate Change(Government of Belize, 2008) that
encourages all agencies to explore and access the opportunities being developed by the climate change
negotiation process such as capacity building, new sources of funding and technology transfer. It also
mandates the relevant government agencies to prepare adaptation policy options for their sectors.
Vulnerability and adaptation assessments have been completed for the coastal zone, fisheries and
aquaculture, tourism, agriculture, health and technology. It has been recognised that the land-use and
forestry projects present the greatest opportunity for Belize in terms of receiving financial support for
sustainable development (MONRECI, 2002).
1.1. Climate change impacts on tourism
Direct and indirect climatic impacts: The Caribbean’s tourism resources, the primary one being the climate
itself, are all climate sensitive. When beaches and other natural resources undergo negatives changes as a
result of climate and meteorological events, this can affect the appeal of a destination – particularly if these
systems are slow to recover. Further, studies indicate that a shift of attractive climatic conditions for
tourism towards higher latitudes and altitudes is very likely as a result of climate change. Projected
increases in the frequency or magnitude of certain weather and climate extremes (e.g. heat waves,

3
droughts, floods, tropical cyclones) as a result of projected climate change will affect the tourism industry
through increased infrastructure damage, additional emergency preparedness requirements, higher
operating expenses (e.g. insurance, backup water and power systems and evacuations) and business
interruptions (Simpson, Gossling, & Scott, 2008).
In contrast to the varied impacts of a changed climate on tourism, the indirect effects of climate induced
environmental change are likely to be largely negative.
Impacts of mitigation policies on tourist mobility: Scientifically, there is general consensus that ‘serious’
climate policy will be paramount in the transformation of tourism towards becoming climatically
sustainable, as significant technological innovation and behavioural change demand strong regulatory
environments (e.g. Barr, Shaw, Coles, & Prillwitz, 2010; Bows anderson, & Footitt, 2009; Hickman &
Banister, 2007; see also Giddens, 2009). As outlined by (Scott, Peeters, & Gössling, 2010), “serious” would
include the endorsement of national and international mitigation policies by tourism stakeholders, a global
closed emission trading scheme for aviation and shipping, the introduction of significant and constantly
rising carbon taxes on fossil fuels, incentives for low-carbon technologies and transport infrastructure and
ultimately, the development of a vision for a fundamentally different global tourism economy. The
Caribbean is likely to be a casualty of international mitigation policies that discourage long-haul travel.
Pentelow and Scott (Pentelow & Scott, 2010) concluded that a combination of low carbon price and low oil
price would have very little impact on arrivals growth to the Caribbean region through to 2020, with arrivals
1.28% to 1.84% lower than in the business as usual (BAU) scenario (the range attributed to the price
elasticities chosen). The impact of a high carbon price and high oil price scenario was more substantive,
with arrivals 2.97% to 4.29% lower than the 2020 BAU scenario depending on the price elasticity value
used. The study concluded:
It is important to emphasize that the number of arrivals to the region would still be
projected to grow from between 19.7 million to 19.9 million in 2010 to a range of 30.1
million to 31.0 million in 2020 (Pentelow & Scott, 2010).
Indirect societal change impacts: Climate change is believed to pose a risk to future economic growth of
some nations, particularly for those where losses and damages are comparable to a country’s GDP. This
could reduce the means and incentive for long-haul travel and have negative implications for anticipated
future growth in this sector in the Caribbean. Climate change associated security risks have been identified
in a number of regions where tourism is highly important to local-national economies (e.g. Stern, 2006;
Barnett & Adger, 2007; German Advisory Council, 2007; Simpson, Gossling, & Scott, 2008). International
tourists are averse to political instability and social unrest and negative tourism-demand repercussions for
climate change security hotspots, many of which are believed to be in developing nations, are already
evident (Hall, Waugh, Haine, Robbins, & Khatiwala, 2004).
The Policy on Adaptation to Global Climate Change mandates the Ministry of Tourism to look at
vulnerability and adaptation options for the sector; promote initiatives that could benefit from the climate
change flexibility mechanisms and report annually on climate change related activities(Government of
Belize, 2008). A tourism vulnerability and adaptation assessment has been completed (Richardson, 2007)
and the findings are referred to within the relevant sectors.
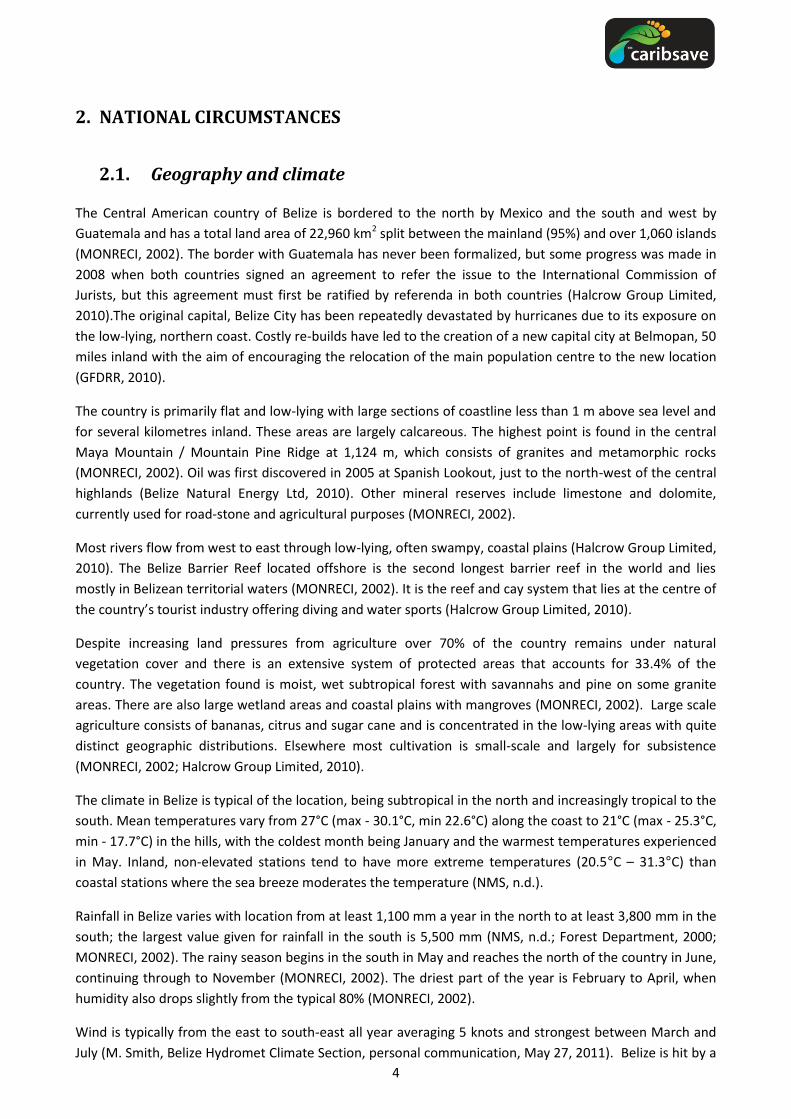
4
2. NATIONAL CIRCUMSTANCES
2.1. Geography and climate
The Central American country of Belize is bordered to the north by Mexico and the south and west by
Guatemala and has a total land area of 22,960 km2 split between the mainland (95%) and over 1,060 islands
(MONRECI, 2002). The border with Guatemala has never been formalized, but some progress was made in
2008 when both countries signed an agreement to refer the issue to the International Commission of
Jurists, but this agreement must first be ratified by referenda in both countries (Halcrow Group Limited,
2010).The original capital, Belize City has been repeatedly devastated by hurricanes due to its exposure on
the low-lying, northern coast. Costly re-builds have led to the creation of a new capital city at Belmopan, 50
miles inland with the aim of encouraging the relocation of the main population centre to the new location
(GFDRR, 2010).
The country is primarily flat and low-lying with large sections of coastline less than 1 m above sea level and
for several kilometres inland. These areas are largely calcareous. The highest point is found in the central
Maya Mountain / Mountain Pine Ridge at 1,124 m, which consists of granites and metamorphic rocks
(MONRECI, 2002). Oil was first discovered in 2005 at Spanish Lookout, just to the north-west of the central
highlands (Belize Natural Energy Ltd, 2010). Other mineral reserves include limestone and dolomite,
currently used for road-stone and agricultural purposes (MONRECI, 2002).
Most rivers flow from west to east through low-lying, often swampy, coastal plains (Halcrow Group Limited,
2010). The Belize Barrier Reef located offshore is the second longest barrier reef in the world and lies
mostly in Belizean territorial waters (MONRECI, 2002). It is the reef and cay system that lies at the centre of
the country’s tourist industry offering diving and water sports (Halcrow Group Limited, 2010).
Despite increasing land pressures from agriculture over 70% of the country remains under natural
vegetation cover and there is an extensive system of protected areas that accounts for 33.4% of the
country. The vegetation found is moist, wet subtropical forest with savannahs and pine on some granite
areas. There are also large wetland areas and coastal plains with mangroves (MONRECI, 2002). Large scale
agriculture consists of bananas, citrus and sugar cane and is concentrated in the low-lying areas with quite
distinct geographic distributions. Elsewhere most cultivation is small-scale and largely for subsistence
(MONRECI, 2002; Halcrow Group Limited, 2010).
The climate in Belize is typical of the location, being subtropical in the north and increasingly tropical to the
south. Mean temperatures vary from 27°C (max - 30.1°C, min 22.6°C) along the coast to 21°C (max - 25.3°C,
min - 17.7°C) in the hills, with the coldest month being January and the warmest temperatures experienced
in May. Inland, non-elevated stations tend to have more extreme temperatures (20.5°C – 31.3°C) than
coastal stations where the sea breeze moderates the temperature (NMS, n.d.).
Rainfall in Belize varies with location from at least 1,100 mm a year in the north to at least 3,800 mm in the
south; the largest value given for rainfall in the south is 5,500 mm (NMS, n.d.; Forest Department, 2000;
MONRECI, 2002). The rainy season begins in the south in May and reaches the north of the country in June,
continuing through to November (MONRECI, 2002). The driest part of the year is February to April, when
humidity also drops slightly from the typical 80% (MONRECI, 2002).
Wind is typically from the east to south-east all year averaging 5 knots and strongest between March and
July (M. Smith, Belize Hydromet Climate Section, personal communication, May 27, 2011). Belize is hit by a

5
major storm on average every 3 years(GFDRR, 2010) and hurricanes are more frequent in the north
(MONRECI, 2002). Hurricane Mitch (1998), Hurricane Keith (2000), Hurricane Iris (2001), Hurricane Dean
(2007) and Hurricane Richard (2010) have caused major damage (GFDRR, 2010).
2.2. Socio-economic profile
Belize is categorized as a developing country with a small, open economy based primarily on agriculture,
agro-industry, mining and services (mainly tourism) (MONRECI, 2002). The 2010 census calculated the
population at 312,698 with a gender ratio of 50.5:49.5 male to female(Statistical Institute of Belize, 2011).
The urban population was estimated to be 52.3% in 2010 and Belize City is estimated to contain 20% of the
population (ECLAC, 2010a), (GFDRR, 2010) and (Halcrow Group Limited, 2010). Belize’s long, low-lying
coastline accommodates approximately 45% of its total population in coastal urban centres that lie
approximately one to two feet below sea level (GFDRR, 2010). The population is culturally diverse with 14%
immigrants from neighbouring Central American countries (MONRECI, 2002) and one fifth of heads of
households not born in Belize (Halcrow Group Limited, 2010).
The vulnerability of the economy was demonstrated in 1994 when the British Garrison that was stationed
in the country withdrew, leading to an immediate reduction in gross domestic expenditure of 5%
(MONRECI, 2002). Natural disasters have also impacted negatively on the economy with reconstruction
after hurricane damage in 2000 and 2001 being blamed for the large fiscal deficits and debt accumulations
that in 2006 required are structuring operation for public debt (GFDRR, 2010). Devastating floods in 2008
impacted the economy in that year and the effects have spilt over into 2009, on top of the global economic
recession that has impacted on key tourism markets (ECLAC, 2010b; CBB, 2010). Table 2.2.1 shows that the
GDP for Belize has grown year-on-year, until 2009 when it stalled with zero growth. This was after a 3.6%
increase in the previous year (CBB, 2010). The fact that Belize has managed to maintain its GDP in 2009
even in light of the global economic crisis makes Belize one of the better performers in the Caribbean, given
the pervasive downturn in the region (ECLAC, 2010b).
Table 2.2.1: Gross Domestic Product for Belize, 2002 - 2009
YEAR Gross Domestic Product In Constant Market Prices, 2000
US $ (millions)
2002 917.9
2003 1,003.4
2004 1,049.8
2005 1,081.6
2006 1,131.9
2007 1,145.7
2008 1,188.9
2009 1,188.5
(Source: ECLAC, 2010a)
The impact of the withdrawal of the British Garrison lent further urgency to the long recognized need to
diversify the market base and as can be seen from the discussion above efforts have been somewhat
successful(MONRECI, 2002). Table 2.2.2 and Figure 2.2.1 show how the different sectors contribute to
overall GDP and it is clear that agriculture, manufacturing (including mining) and the wholesale and retail
trade are the key drivers of the economy. Details on the importance of tourism are given in Section 2.3.
6
Table 2.2.2: Sector contribution to GDP at constant 2000 market prices (BZ $ million).
2000 2001 2002 2003 2004 2005 2006 2007 2008 2009
Agriculture, hunting & forestry
181.6 178.0 183.9 212.4 237.6 235.5 233.7 230.4 232.1 220.2
Fishing 62.2 64.9 60.3 126.9 133.8 146.9 124.4 53.5 52.0 56.9
Manufacturing (incl. mining and quarrying)
168.2 167.4 169.3 168.6 187.5 179.9 234.8 254.2 268.2 286.7
Construction 82.8 83.9 87.0 71.5 74.7 72.0 70.6 68.5 93.0 110.5
Wholesale & retail trade
270.5 290.2 301.8 306.1 306.1 322.6 326.6 332.9 347.7 323.0
Hotels & restaurants 58.5 66.4 68.0 77.9 84.4 88.1 87.5 91.4 87.2 83.3
Electricity & Water 58.4 58.6 60.2 65.3 64.3 64.0 90.4 92.5 95.4 111.7
(Source: CBB, 2005; CBB, 2010; Halcrow Group Limited, 2010)
Figure 2.2.1: Sector contribution to GDP (%)
The relative contribution from the wholesale and retail trade has declined during the last decade with a
period of some stability between 2004 and 2008. Activity has contracted in 2009 as a result of a fall-off in
cross border trade with Mexico via the commercial free zone and weak domestic consumption due to
reduced remittance inflows and increased unemployment (ECLAC, 2010b; CBB, 2010).
As described above, the primary agricultural crops in Belize are citrus, banana and sugar cane, but with only
33% of the land (6,880 km2) suitable for agriculture and half of that needing careful management there are
increasing pressures on land-use (MONRECI, 2002). In the 1990s agriculture accounted for 30% of the
economy and employed 40% of the workforce (Forest Department, 2000), but it now accounts for about
10% of GDP (Halcrow Group Limited, 2010). Performance in the sector in 2009 declined because of
continuing impacts from the floods in 2008, especially on the major export crops and improvements in
grain production (rice and corn) was insufficient to offset this decline (ECLAC, 2010b; CBB, 2010). Banana
production decreased by 15% between 2003 and 2007, while cane production in 2007/08 was over 20%
lower compared with 2006/07 (Halcrow Group Limited, 2010).
Fishing has had considerable variations in fortunes over the last decade with rapid growth in 2003 following
the introduction of a resistant strain of farmed shrimp and an increase in the active pond acreage, which
resulted in a doubling of the farmed shrimp output(CBB, 2004). In 2007 the aquaculture industry went
0.0
2.0
4.0
6.0
8.0
10.0
12.0
14.0
16.0
2000 2001 2002 2003 2004 2005 2006 2007 2008 2009
% c
on
trib
uti
on
to
GD
P
Agriculture, hunting & forestry Fishing
Manufacturing (incl. mining & quarrying) Construction
Wholesale & retail trade Hotels & restaurants
Electricity & Water

7
bankrupt (Halcrow Group Limited, 2010), but is now showing signs of recovery with the increase in
contribution in 2009 attributable to increased production of farmed shrimp and conch(ECLAC, 2010b).
Contributions from manufacturing have exhibited strong growth since 2005 when the first economically
viable oil wells were identified at Spanish Lookout (Belize Natural Energy Ltd, 2010). This increase in
contribution from the manufacturing sector is the main structural shift in the economy in recent times
(Halcrow Group Limited, 2010). There was a levelling off in oil production in 2007 and 2008, but a 24.3%
expansion in petroleum production to 1,608,864 barrels, an average of 4,390 barrels a day, was achieved in
2009 as three additional wells were brought on line (ECLAC, 2010b). Petroleum remains the main export
earner and is expected to increase by a further 2.0% in 2010 with the stabilisation of output from the
Spanish Lookout field and the start-up of pumping from the Never Delay field in the latter half of the year
(CBB, 2010). The remote location of the oil fields means that there is a limited multiplier effect in the wider
economy (Halcrow Group Limited, 2010). Other areas of manufacturing include sugar and molasses, which
improved in 2009 despite a smaller tonnage of cane, because dry weather had increased the sucrose
content and purity of the crop. Manufacture of juices was reduced by 2.5%, but by-product production of
citrus oil and pulp increased by 17.5% and 58.2% respectively. Production of soft drinks, beer and fertiliser
declined, while that of cigarettes and flour expanded (CBB, 2010).
Construction and the utilities have contributed to stabilizing the economy in 2009 with both showing
growth (18.8% and 17.1% respectively). Construction has been driven by primarily private sector credit in
San Pedro, the Cayes and to a lesser extent, Placencia, which, due to their location, meant there was a
limited multiplier impact on the wider economy (Halcrow Group Limited, 2010). Diversification in domestic
electricity production with the addition of generation capacity from a local shrimp farm and the start of
operations from Belize Sugar Industries (BSI) cogeneration plant were responsible for the growth in the
utilities sector (CBB, 2010). It is anticipated that further growth will be seen in 2010 with a 32.0% increase
in domestic electricity generation as the cogeneration plant and Vaca Dam hydroelectric plant add some 25
Megawatt hours (MWh) to national capacity(CBB, 2010).
As a consequence of the economic downturn in 2009, the unemployment rate increased from 8.2% (May
2008) to 13.1% (April 2009), with an 11.2% expansion in the labour force outpacing a 5.3% growth in jobs
(CBB, 2010).There was however a slight recovery towards the end of the year with unemployment at 12.6%
by September 2009 (ECLAC, 2010b). Female participation has gradually increased from 30% of the labour
force in 1994 to 41% in 1998 and 47% in 2009, indicating that there are increased opportunities for women
to work (MONRECI, 2002; Halcrow Group Limited, 2010). The level of female unemployment has also
proved more volatile implying that women are more likely to be affected during economic downturns
(Halcrow Group Limited, 2010).
The services sector provides almost two-thirds of jobs in Belize (80% of female employment) with the retail
sector alone providing one-fifth of all jobs (23% for women and 17% for men). Agriculture accounts for 26%
of male employment and about one fifth of all employment, which is a significant decline from the situation
in 2000. Construction accounts for 12% of male employment (Halcrow Group Limited, 2010). The economic
slowdown had affected employment in the textile industry (74% decline), oil industry (48% decline), citrus
farming (45% decline) and fishing (34% decline). Areas of growth include banana cultivation, construction
and service industries (excluding tourism) (Halcrow Group Limited, 2010).
In 1994, 25% of households were considered poor and 10% extremely poor (MONRECI, 2002). According to
the April 2009 Living Standards Measurement Survey the level of indigence in Belize had increased to 15.8%
and poverty to 25.5% with 13.8% considered vulnerable to poverty making a total of 55.1% of the
population poor or vulnerable (Halcrow Group Limited, 2010). The survey also showed that 29% of poor

8
heads of household are employed suggesting that although working they are not earning enough to
support their household (Halcrow Group Limited, 2010). In 1994 severe poverty was most common
amongst the recent Central American immigrants and the Maya communities (MONRECI, 2002), this
remained true in the 2009 study with Mayans accounting for 34% of the indigent population and Mestizos
for 40% (Halcrow Group Limited, 2010).
The increase in poverty and indigence has been blamed on the higher unemployment described above; the
reduction in value of production of major crops like sugar cane, bananas and fishing; the global economic
recession; and impacts from Hurricane Dean in 2007 and the floods in 2008. It is noted that these are
largely caused by external factors outside the control of the Government such as reductions in preferential
quotas by the European Union (EU), the global economic recession and natural disasters. The result is that
although there has been a gradual increase in GDP, real per capita income has barely increased since
2003(Halcrow Group Limited, 2010).
This high level of poverty is a key concern for the Government of Belize which faces a number of issues
including high spending on social services (1/3 of budget in early 2000s); unsustainably high levels of public
debt, which consumes increasingly greater portions of national income1; limited access to capital2;trade
uncertainty because of free trade policies and the erosion of trade pacts enforced by the World Trade
Organisation (MONRECI, 2002; Richardson, 2007). The population across the country is vulnerable because
of the relative lack of transport and flood protection infrastructure; high levels of poverty; concentration of
urban centres in low-lying coastal areas; high levels of linguistic and cultural diversity; and poor access to
information and health care (GFDRR, 2010). These factors combined mean that Belize has limited capacity
to adapt any sector to the impacts of climate change including tourism (Richardson, 2007).
2.3. Importance of tourism to the national economy
Caribbean tourism is based on the natural environment and the region’s countries are known primarily as
beach destinations. The tourism product therefore depends on favourable weather conditions as well as on
an attractive and healthy natural environment, particularly in the coastal zone. Both of these are
threatened by climate change. The Caribbean is the most tourism-dependent region in the world with few
options to develop alternative economic sectors and is one of the most vulnerable regions in the world to
the impacts of climate change including SLR, coastal erosion, flooding, biodiversity loss and impacts on
human health.
Belize has completed a vulnerability and capacity assessment for the tourism sector in which it is
acknowledged that as a tropical, coastal nation, Belize is highly vulnerable to variable climate and weather
patterns as well as tropical cyclones. This vulnerability is particularly relevant for the tourism sector, given
the small scale and nature-based character of tourism in Belize and stems from three bio-geophysical
impacts:
1The 2007 debt re-structuring created a temporary reduction in the debt burden until 2019 and enabled government spending on
social sectors to increase in the last 3 years. This situation is, however, likely to be threatened by the current deterioration in the economic situation, which has resulted in a decrease in government revenues while debt repayments still need to increase (Halcrow Group Limited, 2010). 2Transparency International rates countries on a scale of 10 for its Corruption Perceptions Index (www.transparency.org). Belize’s
score has declined from 4.5 in 2003 to 2.9 in 2008. Scoring less than 3 out of ten indicates rampant corruption. The perception that corruption has increased substantially since 2003 is arguably a more serious issue than its current ranking (Halcrow Group Limited, 2010).
9
Rising sea levels pose risks for flooding, inundation, saltwater intrusion and erosion, which threaten
water supplies, infrastructure and coastal areas (the offshore cays and atolls of Belize rarely exceed
3-4 m above sea level).
Warmer sea water threatens the coral reefs along the coast of Belize that comprise the longest
barrier reef in the western hemisphere and attract thousands of tourists (80%) for snorkelling and
scuba diving activities.
Warmer sea surface temperatures are associated with increasing frequency and intensity of
tropical cyclones or hurricanes, which threaten coastal settlements and infrastructure (25.3% of
tourism businesses on Ambergris Caye and 45.7% of tourism businesses in the Cayo District lack
insurance protection against natural disasters).
Based on present spending levels, it is estimated that 45% to 70% of the tourism sector is highly vulnerable
to the effects of climate change. At current spending levels, this corresponds to BZ $180 to BZ $280 million
(or US $90 to $140 million) and is related to the proportion of tourism that is centred on the cays, atolls and
coastal zones (Richardson, 2007).
Although tourism only contributes about 4% of GDP, Figure 2.2.1, it is one of the most important sectors for
Belize, representing approximately 25% of Belize’s foreign exchange. Over the last 20 years, the tourism
industry has created employment and professional development for many Belizeans and is a key driver of
foreign investment and an important source of tax revenues that help to finance the nation’s infrastructure
(BTB, 2010).
The industry has developed around small-scale, adventure or nature-based recreation activities with the
second-largest barrier reef system in the world, numerous limestone caves and tropical rainforests
providing the attractions. Development of the islands of Ambergris Caye, Caye Caulker and the coastal
village of Placencia provide accessibility for visitors interested in snorkelling, underwater diving, deep sea
fishing and other water-based recreation activities. The small size of the country allows for tourists to visit
both coastal / island and inland destinations within a small time frame. The popularity of cave tours in the
Cayo district has flourished, but only less than half of visitors reported that they visited inland attractions.
More recently there has been significant resort and hotel development in the town of San Pedro making it
the country’s largest tourist destination and a destination for foreign retirees and migrant expatriates. The
scale of development of hotels, resorts and other infrastructure generally reflects the ecotourism niche
(Richardson, 2007). In 2008, there were 620 hotels with 6,536 rooms, which illustrates the small-scale
nature of tourism in Belize (average property size is 10.5 rooms and 67% of hotels have between 1 and 10
rooms) (BTB, 2009; Caribbean Tourism Organisation, n.d.).
Table 2.3.1 shows the patterns of tourist arrivals over the last decade and is shown graphically in Figure
2.3.1. Stopover visitors have increased steadily over the last decade until 2007, when numbers started to
fall. In 2009 there was a 5.6% decline in stay-over tourist arrivals and a fall in the number of nights spent in
the country, which resulted in a 4.5% decline in the hotels & restaurants sector in 2009 (CBB, 2010; ECLAC,
2010b).
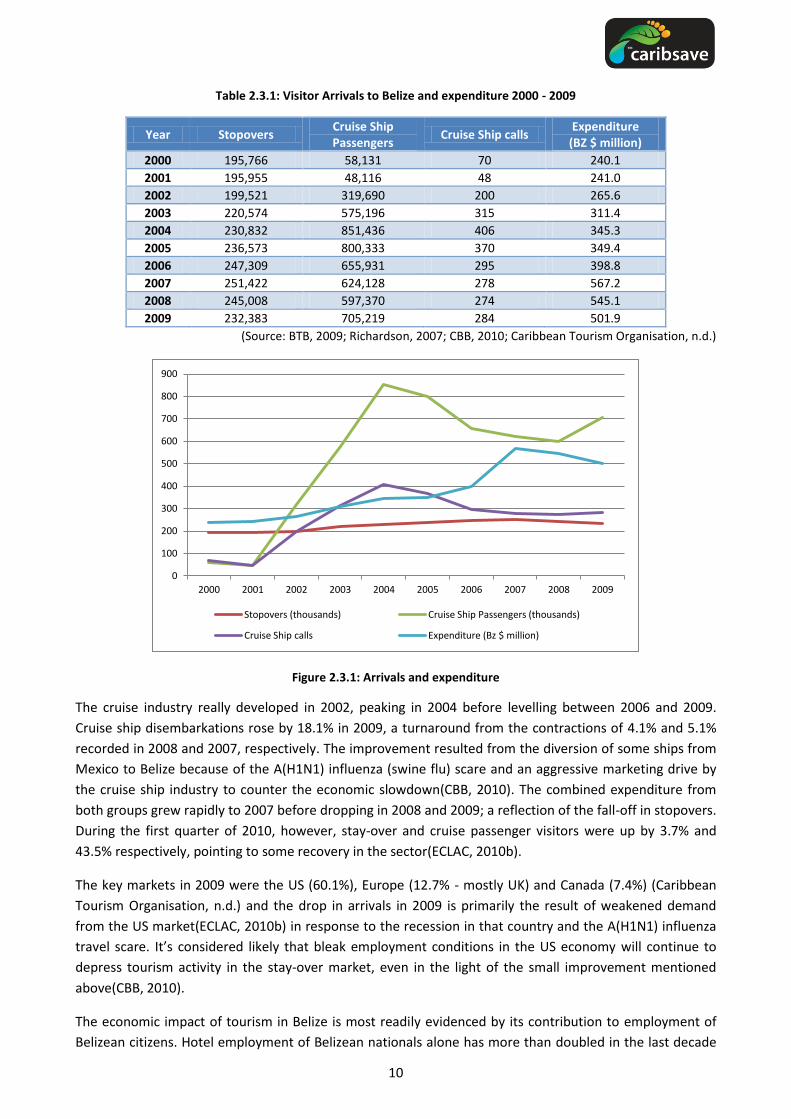
10
Table 2.3.1: Visitor Arrivals to Belize and expenditure 2000 - 2009
Year Stopovers Cruise Ship Passengers
Cruise Ship calls Expenditure
(BZ $ million)
2000 195,766 58,131 70 240.1
2001 195,955 48,116 48 241.0
2002 199,521 319,690 200 265.6
2003 220,574 575,196 315 311.4
2004 230,832 851,436 406 345.3
2005 236,573 800,333 370 349.4
2006 247,309 655,931 295 398.8
2007 251,422 624,128 278 567.2
2008 245,008 597,370 274 545.1
2009 232,383 705,219 284 501.9
(Source: BTB, 2009; Richardson, 2007; CBB, 2010; Caribbean Tourism Organisation, n.d.)
Figure 2.3.1: Arrivals and expenditure
The cruise industry really developed in 2002, peaking in 2004 before levelling between 2006 and 2009.
Cruise ship disembarkations rose by 18.1% in 2009, a turnaround from the contractions of 4.1% and 5.1%
recorded in 2008 and 2007, respectively. The improvement resulted from the diversion of some ships from
Mexico to Belize because of the A(H1N1) influenza (swine flu) scare and an aggressive marketing drive by
the cruise ship industry to counter the economic slowdown(CBB, 2010). The combined expenditure from
both groups grew rapidly to 2007 before dropping in 2008 and 2009; a reflection of the fall-off in stopovers.
During the first quarter of 2010, however, stay-over and cruise passenger visitors were up by 3.7% and
43.5% respectively, pointing to some recovery in the sector(ECLAC, 2010b).
The key markets in 2009 were the US (60.1%), Europe (12.7% - mostly UK) and Canada (7.4%) (Caribbean
Tourism Organisation, n.d.) and the drop in arrivals in 2009 is primarily the result of weakened demand
from the US market(ECLAC, 2010b) in response to the recession in that country and the A(H1N1) influenza
travel scare. It’s considered likely that bleak employment conditions in the US economy will continue to
depress tourism activity in the stay-over market, even in the light of the small improvement mentioned
above(CBB, 2010).
The economic impact of tourism in Belize is most readily evidenced by its contribution to employment of
Belizean citizens. Hotel employment of Belizean nationals alone has more than doubled in the last decade
0
100
200
300
400
500
600
700
800
900
2000 2001 2002 2003 2004 2005 2006 2007 2008 2009
Stopovers (thousands) Cruise Ship Passengers (thousands)
Cruise Ship calls Expenditure (Bz $ million)
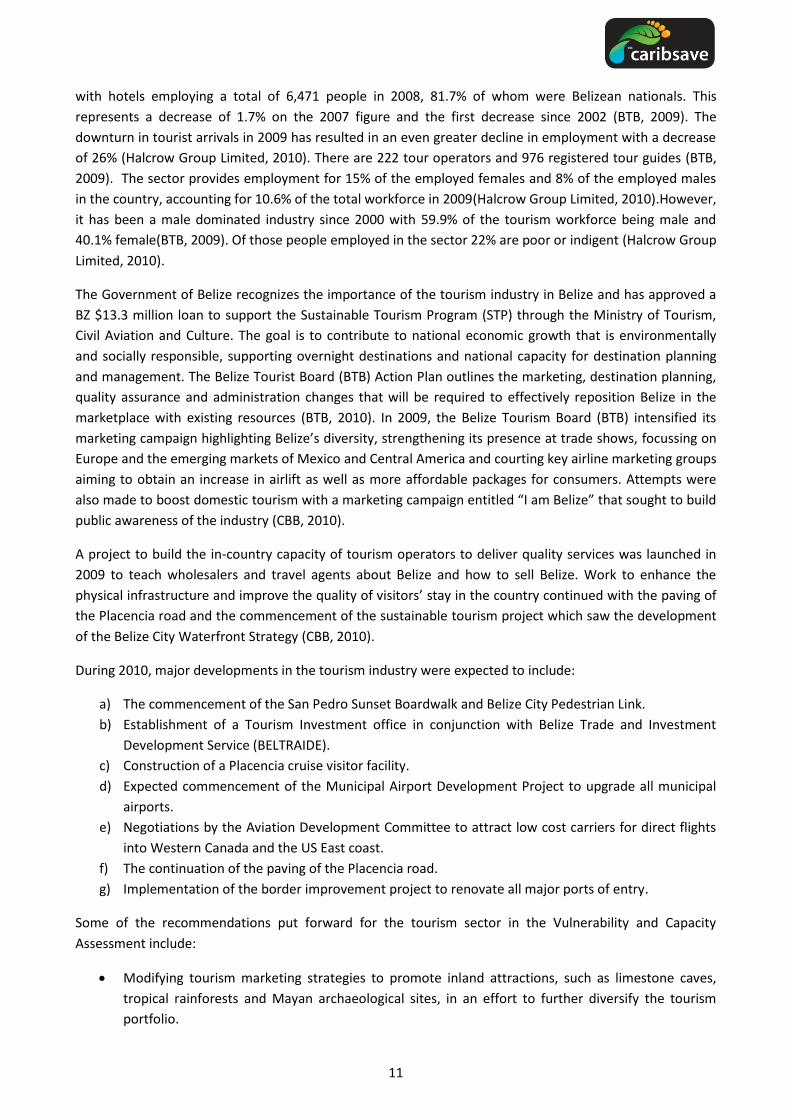
11
with hotels employing a total of 6,471 people in 2008, 81.7% of whom were Belizean nationals. This
represents a decrease of 1.7% on the 2007 figure and the first decrease since 2002 (BTB, 2009). The
downturn in tourist arrivals in 2009 has resulted in an even greater decline in employment with a decrease
of 26% (Halcrow Group Limited, 2010). There are 222 tour operators and 976 registered tour guides (BTB,
2009). The sector provides employment for 15% of the employed females and 8% of the employed males
in the country, accounting for 10.6% of the total workforce in 2009(Halcrow Group Limited, 2010).However,
it has been a male dominated industry since 2000 with 59.9% of the tourism workforce being male and
40.1% female(BTB, 2009). Of those people employed in the sector 22% are poor or indigent (Halcrow Group
Limited, 2010).
The Government of Belize recognizes the importance of the tourism industry in Belize and has approved a
BZ $13.3 million loan to support the Sustainable Tourism Program (STP) through the Ministry of Tourism,
Civil Aviation and Culture. The goal is to contribute to national economic growth that is environmentally
and socially responsible, supporting overnight destinations and national capacity for destination planning
and management. The Belize Tourist Board (BTB) Action Plan outlines the marketing, destination planning,
quality assurance and administration changes that will be required to effectively reposition Belize in the
marketplace with existing resources (BTB, 2010). In 2009, the Belize Tourism Board (BTB) intensified its
marketing campaign highlighting Belize’s diversity, strengthening its presence at trade shows, focussing on
Europe and the emerging markets of Mexico and Central America and courting key airline marketing groups
aiming to obtain an increase in airlift as well as more affordable packages for consumers. Attempts were
also made to boost domestic tourism with a marketing campaign entitled “I am Belize” that sought to build
public awareness of the industry (CBB, 2010).
A project to build the in-country capacity of tourism operators to deliver quality services was launched in
2009 to teach wholesalers and travel agents about Belize and how to sell Belize. Work to enhance the
physical infrastructure and improve the quality of visitors’ stay in the country continued with the paving of
the Placencia road and the commencement of the sustainable tourism project which saw the development
of the Belize City Waterfront Strategy (CBB, 2010).
During 2010, major developments in the tourism industry were expected to include:
a) The commencement of the San Pedro Sunset Boardwalk and Belize City Pedestrian Link.
b) Establishment of a Tourism Investment office in conjunction with Belize Trade and Investment
Development Service (BELTRAIDE).
c) Construction of a Placencia cruise visitor facility.
d) Expected commencement of the Municipal Airport Development Project to upgrade all municipal
airports.
e) Negotiations by the Aviation Development Committee to attract low cost carriers for direct flights
into Western Canada and the US East coast.
f) The continuation of the paving of the Placencia road.
g) Implementation of the border improvement project to renovate all major ports of entry.
Some of the recommendations put forward for the tourism sector in the Vulnerability and Capacity
Assessment include:
Modifying tourism marketing strategies to promote inland attractions, such as limestone caves,
tropical rainforests and Mayan archaeological sites, in an effort to further diversify the tourism
portfolio.

12
Increase education and public awareness of the vulnerability to climate change, both in the public
sector as well as among private businesses. Those business survey respondents, who indicated that
they had not considered the potential impacts of climate change in their business plans or
strategies, cited a lack of expertise, knowledge and technology as their reasons. Responses to many
of the survey questions revealed insufficient awareness and understanding of climate change and
its potential impacts, which underscores the need for greater education and outreach (Richardson,
2007).

13
3. CLIMATE MODELLING
3.1. Introduction to Climate Modelling Results
This summary of climate change information for Belize is derived from a combination of recently observed
climate data sources and climate model projections of future scenarios using both a General Circulation
Model (GCM) ensemble of 15 models and the Regional Climate Model (RCM), PRECIS.
General Circulation Models (GCMs) provide global simulations of future climate under prescribed
greenhouse gas scenarios. These models are proficient in simulating the large scale circulation patterns
and seasonal cycles of the world’s climate, but operate at coarse spatial resolution (grid boxes are typically
around 2.5 degrees latitude and longitude). This limited resolution hinders the ability for the model to
represent the finer scale characteristics of a region’s topography and many of the key climatic processes
which determine its weather and climate characteristics. Over the Caribbean, this presents significant
problems as most of the small islands are too small to feature as a land mass at GCM resolution.
Regional Climate Models (RCMS), which have been used in the CCCRA, are often nested in GCMs to
simulate the climate at a finer spatial scale over a small region of the world, acting to ‘downscale’ the GCM
projections and provide a better physical representation of the local climate of that region. RCMs enable
the investigation of climate changes at a sub-GCM-grid scale, as such changes in the dynamic climate
processes at a community scale or tourist destination can be projected.
For each of a number of climate variables (average temperature, average rainfall, average wind speed,
relative humidity, sea-surface temperature, sunshine hours, extreme temperatures and extreme rainfalls)
the results of GCM multi-model projections under three emissions scenarios at the country scale and RCM
simulations from single model driven by two different GCMs for a single emissions scenario at the
destination scale, are examined. Where available, observational data sources are drawn upon to identify
changes that are already occurring in the climate, at both the country and destination scale.
In this study, RCM simulations from PRECIS, driven by two different GCMs (ECHAM4 and HadCM3) are used
to look at projected climate for each country and at the community level. Combining the results of GCM
and RCM experiments allows the use of high-resolution RCM projections in the context of the uncertainty
margins that the 15-model GCM ensemble provides.
The following projections are based on the IPCC standard ‘marker’ scenarios – A2 (a ‘high’ emissions
scenario), A1B (a medium high scenario, where emissions increase rapidly in the earlier part of the century
but then plateau in the second half) and B1 (a ‘low’ emissions scenario). Climate projections are examined
under all three scenarios from the multi-model GCM ensemble, but at present, results from the regional
models are only available for scenario A2. Table 3.1.1 outlines the time line on which various temperature
thresholds are projected to be reached under the various scenarios according to the IPCC.

14
Table 3.1.1: Earliest and latest years respectively at which the threshold temperatures are exceeded in the 41 projections*
SRES Scenario
1.5C Threshold 2.0C Threshold 2.5C Threshold
Earliest Latest Earliest Latest Earliest Latest
A1B 2023 2050 2038 2070 2053 Later than 2100
A2 2024 2043 2043 2060 2056 2077
B1 2027 2073 2049 Later than 2100 2068 Later than 2100 *NB: In some cases the threshold is not reached prior to 2100, the latest date for which the projections are available.
The potential changes in hurricane and tropical storm frequency and intensity, SLR and storm surge
incidence are also examined for the Caribbean region. For these variables, existing material in the
literature is examined in order to assess the potential changes affecting the tourist destinations.
3.2. Temperature
Observations from the gridded temperature datasets indicate that mean annual temperatures over Belize
have increased at an average rate of 0.11˚C per decade over the period 1960 - 2006. The observed
increases have been more rapid in the seasons JJA and SON at the rate of 0.15˚C and 0.16˚C per decade
respectively.
General Circulation Model (GCM) projections from a 15-model ensemble indicate that Belize can be
expected to warm by 0.8˚C to 2.3˚C by the 2050s and 1.0˚C to 4.1˚C by the 2080s, relative to the 1970 -
1999 mean. The range of projections across the 15 models for any one emissions scenario spans around 1.5
- 2˚C. Projected mean temperature increase is similar throughout the year.
Regional Climate Model (RCM) projections indicate much more rapid increases in temperatures over Belize
compared to the GCM ensemble median projections for the A2 scenario. RCM projections indicate
increases of 3.6˚C and 3.5˚C in mean annual temperatures by the 2080s, when driven by the ECHAM4 and
HadCM3 respectively, compared with GCM ensemble projections of 2.3 - 4.1˚C for that period.
The improved spatial resolution in the RCM allows the land mass of the larger Caribbean islands to be
represented, whilst the region is represented only by ‘ocean’ grid boxes at GCM resolution. Land surfaces
warm more rapidly than ocean due to their lower capacity to absorb heat energy and therefore more rapid
warming is seen over Belize in RCM projections than in GCMs.
15
Table 3.2.1: Observed and GCM projected changes in temperature for Belize.
Belize: Country Scale Changes in Temperature
Observed Mean
1970-99
Observed Trend 1960-2006
Projected changes by the 2020s
Projected changes by the
2050s
Projected changes by the 2080s
Min Median Max Min Median Max Min Median Max
(˚C) (change in ˚C per
decade)
Change in ˚C Change in ˚C Change in ˚C
A2 0.5 0.9 1.3 1.2 1.8 2.3 2.3 3.3 4.1
Annual 24.9 0.11* A1B 0.5 0.9 1.3 1.1 2 2.1 1.6 2.7 3.6
B1 0.4 0.9 1.1 0.8 1.3 1.9 1 1.8 2.5
A2 0.4 0.9 1.1 0.8 1.4 2.3 2.1 2.8 4
DJF 22.8 0.07 A1B 0.5 0.7 1.2 1 1.6 2.3 1.3 2.3 3.6
B1 0.5 0.8 1.2 0.7 1.2 1.7 0.9 1.5 2.5
A2 0.4 0.9 1.5 1.4 1.8 2.6 2.2 3.2 4.1
MAM 25.7 0.07 A1B 0.3 0.8 1.4 1.1 1.9 2.5 1.5 2.7 3.5
B1 0.2 0.8 1.2 0.8 1.4 1.8 1 1.9 2.4
A2 0.5 1 1.4 1.2 2.1 2.7 2.5 3.6 4.4
JJA 26.1 0.15* A1B 0.4 1.1 1.8 1.3 2.2 2.6 1.8 2.9 4
B1 0.4 1 1.4 1 1.5 2 1.1 2 2.9
A2 0.5 0.9 1.5 1.1 1.8 2.5 2.4 3.4 4.1
SON 24.9 0.16* A1B 0.4 1 1.4 1.1 1.8 2.2 1.8 2.7 3.6
B1 0.3 0.8 1.3 0.7 1.5 2.3 1.1 1.6 2.7
Table 3.2.2: GCM and RCM projected changes in Belize under the A2 scenario.
Projected changes by the 2080s SRES A2
Min Median Max
Change in ˚C
GCM Ensemble Range 2.3 3.3 4.1 Annual RCM (ECHAM4)
3.6
RCM (HadCM3)
3.5 GCM Ensemble Range 2.1 2.8 4
DJF RCM (ECHAM4)
3 RCM (HadCM3)
3.4
GCM Ensemble Range 2.2 3.2 4.1 MAM RCM (ECHAM4)
3.7
RCM (HadCM3)
3.4 GCM Ensemble Range 2.5 3.6 4.4
JJA RCM (ECHAM4)
3.9 RCM (HadCM3)
3.7
GCM Ensemble Range 2.4 3.4 4.1 SON RCM (ECHAM4)
3.9
RCM (HadCM3)
3.6
3.3. Precipitation
Gridded observations of rainfall over Belize do not show statistically significant trends over the period 1960
- 2006. Long-term trends are difficult to identify due to the large inter-annual variability in rainfall in Belize.
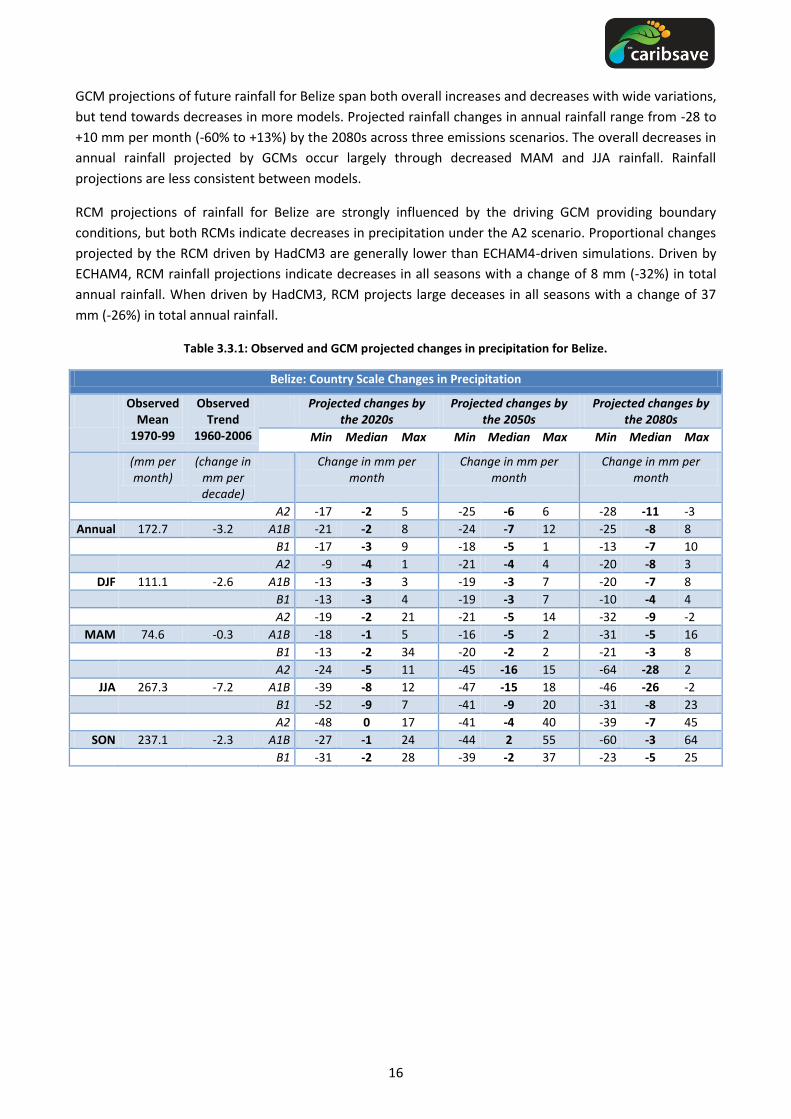
16
GCM projections of future rainfall for Belize span both overall increases and decreases with wide variations,
but tend towards decreases in more models. Projected rainfall changes in annual rainfall range from -28 to
+10 mm per month (-60% to +13%) by the 2080s across three emissions scenarios. The overall decreases in
annual rainfall projected by GCMs occur largely through decreased MAM and JJA rainfall. Rainfall
projections are less consistent between models.
RCM projections of rainfall for Belize are strongly influenced by the driving GCM providing boundary
conditions, but both RCMs indicate decreases in precipitation under the A2 scenario. Proportional changes
projected by the RCM driven by HadCM3 are generally lower than ECHAM4-driven simulations. Driven by
ECHAM4, RCM rainfall projections indicate decreases in all seasons with a change of 8 mm (-32%) in total
annual rainfall. When driven by HadCM3, RCM projects large deceases in all seasons with a change of 37
mm (-26%) in total annual rainfall.
Table 3.3.1: Observed and GCM projected changes in precipitation for Belize.
Belize: Country Scale Changes in Precipitation
Observed Mean
1970-99
Observed Trend
1960-2006
Projected changes by the 2020s
Projected changes by the 2050s
Projected changes by the 2080s
Min Median Max Min Median Max Min Median Max
(mm per month)
(change in mm per decade)
Change in mm per month
Change in mm per month
Change in mm per month
A2 -17 -2 5 -25 -6 6 -28 -11 -3
Annual 172.7 -3.2 A1B -21 -2 8 -24 -7 12 -25 -8 8
B1 -17 -3 9 -18 -5 1 -13 -7 10
A2 -9 -4 1 -21 -4 4 -20 -8 3
DJF 111.1 -2.6 A1B -13 -3 3 -19 -3 7 -20 -7 8
B1 -13 -3 4 -19 -3 7 -10 -4 4
A2 -19 -2 21 -21 -5 14 -32 -9 -2
MAM 74.6 -0.3 A1B -18 -1 5 -16 -5 2 -31 -5 16
B1 -13 -2 34 -20 -2 2 -21 -3 8
A2 -24 -5 11 -45 -16 15 -64 -28 2
JJA 267.3 -7.2 A1B -39 -8 12 -47 -15 18 -46 -26 -2
B1 -52 -9 7 -41 -9 20 -31 -8 23
A2 -48 0 17 -41 -4 40 -39 -7 45
SON 237.1 -2.3 A1B -27 -1 24 -44 2 55 -60 -3 64
B1 -31 -2 28 -39 -2 37 -23 -5 25

17
Table 3.3.2: GCM and RCM projected changes in Belize under the A2 scenario.
Projected changes by the 2080s SRES A2
Min Median Max
Change in mm
GCM Ensemble Range -28 -11 -3 Annual RCM (ECHAM4)
-8
RCM (HadCM3)
-37 GCM Ensemble Range -20 -8 3
DJF RCM (ECHAM4)
-10 RCM (HadCM3)
-21
GCM Ensemble Range -32 -9 -2 MAM RCM (ECHAM4)
-5
RCM (HadCM3)
-17 GCM Ensemble Range -64 -28 2
JJA RCM (ECHAM4)
-13 RCM (HadCM3)
-67
GCM Ensemble Range -39 -7 45 SON RCM (ECHAM4)
-3
RCM (HadCM3)
-42
Table 3.3.3: Observed and GCM projected changes in precipitation (%) for Belize.
Belize: Country Scale Changes in Precipitation
Observed Mean
1970-99
Observed Trend
1960-2006
Projected changes by the 2020s
Projected changes by the 2050s
Projected changes by the 2080s
Min Median Max Min Median Max Min Median Max
(mm per month)
(change in % per
decade)
% Change % Change % Change
A2 -31 -4 4 -40 -9 9 -60 -17 -1
Annual 172.7 -1.9 A1B -21 -5 6 -28 -9 16 -55 -13 11
B1 -23 -8 11 -40 -8 1 -47 -9 13
A2 -21 -6 2 -23 -7 11 -52 -14 3
DJF 111.1 -2.4 A1B -17 -4 10 -24 -9 14 -40 -11 16
B1 -28 -6 10 -22 -8 14 -25 -8 4
A2 -40 -9 16 -58 -19 10 -61 -28 -7
MAM 74.6 -0.4 A1B -28 -8 6 -45 -12 15 -50 -30 12
B1 -40 -6 25 -45 -9 17 -53 -21 7
A2 -64 -9 12 -64 -16 7 -84 -33 1
JJA 267.3 -2.7 A1B -36 -13 9 -58 -16 7 -83 -33 -4
B1 -46 -16 21 -68 -11 8 -77 -8 28
A2 -31 -1 11 -28 -3 37 -48 -4 29
SON 237.1 -1 A1B -19 -2 15 -28 1 36 -39 -1 41
B1 -20 -3 17 -45 -1 24 -33 -9 16

18
Table 3.3.4: GCM and RCM projected changes in Belize under the A2 scenario.
Projected changes by the 2080s SRES A2
Min Median Max
% Change
GCM Ensemble Range -60 -17 -1 Annual RCM (ECHAM4)
-32
RCM (HadCM3)
-26 GCM Ensemble Range -52 -14 3
DJF RCM (ECHAM4)
-32 RCM (HadCM3)
-25
GCM Ensemble Range -61 -28 -7 MAM RCM (ECHAM4)
-19
RCM (HadCM3)
-11 GCM Ensemble Range -84 -33 1
JJA RCM (ECHAM4)
-62 RCM (HadCM3)
-37
GCM Ensemble Range -48 -4 29 SON RCM (ECHAM4)
-16
RCM (HadCM3)
-30
3.4. Wind Speed
The available observations are insufficient to determine trends in winds speeds around Belize.
Mean wind speeds over Belize generally show a very small increase in GCM projections. Projected changes
in annual average wind speed range between -0.1 and +0.6 ms-1 by the 2080s across the three emission
scenarios. Both increases and decreases are seen in all seasons across the 15-model ensemble.
RCM projections based on two driving GCMs lie within the range of changes indicated by the GCM
ensemble, but are higher than the GCM median projections. RCM simulations project increases in wind
speeds in all seasons by the 2080s under the A2 scenario. The RCM projected increase in the mean annual
wind speeds is 0.4 ms-1 when driven by ECHAM4 and 0.6 ms-1 when driven by HadCM3.

19
Table 3.4.1: Observed and GCM projected changes in wind speed for Belize.
Belize: Country Scale Changes in Wind Speed
Observed Mean
1970-99
Observed Trend
1960-2006
Projected changes by the 2020s
Projected changes by the 2050s
Projected changes by the 2080s
Min Median Max Min Median Max Min Median Max
(ms-1
) (change in ms
-1 per
decade)
Change in ms-1
Change in ms-1
Change in ms-1
A2 -0.1 0 0.1 0 0.1 0.3 0.1 0.3 0.6
Annual 5.6
A1B -0.1 0.1 0.2 0 0.1 0.3 0 0.2 0.4
B1 -0.1 0.1 0.1 -0.1 0.1 0.2 -0.1 0.1 0.3
A2 -0.2 0 0.3 -0.2 0 0.3 -0.2 0.1 0.3
DJF 5.5
A1B -0.2 0.1 0.3 0 0.1 0.2 -0.1 0.1 0.3
B1 -0.1 0 0.1 -0.2 0.1 0.2 -0.1 0.1 0.2
A2 -0.1 0 0.3 0 0.1 0.5 0.1 0.3 0.6
MAM 5.6
A1B -0.1 0.1 0.3 0 0.1 0.4 -0.2 0.2 0.4
B1 -0.1 0.1 0.2 0 0.1 0.3 0 0.2 0.2
A2 -0.1 0.1 0.2 -0.1 0.1 0.4 0 0.4 0.8
JJA 6
A1B -0.2 0 0.4 0 0.2 0.5 -0.1 0.4 0.9
B1 -0.1 0.2 0.2 0 0.1 0.3 -0.1 0.2 0.5
A2 -0.2 0 0.1 -0.2 -0.1 0.2 -0.2 0.1 0.6
SON 5.3 0.09 A1B -0.1 0 0.1 -0.2 0 0.1 -0.2 0 0.5
B1 -0.1 0 0.1 -0.3 0 0.1 -0.2 0 0.2
Table 3.4.2: GCM and RCM projected changes in Belize under the A2 scenario.
Projected changes by the 2080s SRES A2
Min Median Max
Change in ms-1
GCM Ensemble Range 0.1 0.3 0.6 Annual RCM (ECHAM4)
0.4
RCM (HadCM3)
0.6 GCM Ensemble Range -0.2 0.1 0.3
DJF RCM (ECHAM4)
0.2 RCM (HadCM3)
0.2
GCM Ensemble Range 0.1 0.3 0.6 MAM RCM (ECHAM4)
0.5
RCM (HadCM3)
0.5 GCM Ensemble Range 0 0.4 0.8
JJA RCM (ECHAM4)
0.6 RCM (HadCM3)
1.3
GCM Ensemble Range -0.2 0.1 0.6 SON RCM (ECHAM4)
0.4
RCM (HadCM3)
0.5
3.5. Relative Humidity
Observations from the HadCRUH show statistically significant decreasing trend in relative humidity over the
period 1973 - 2003 in Belize only in the MAM season (-0.47% per decade).
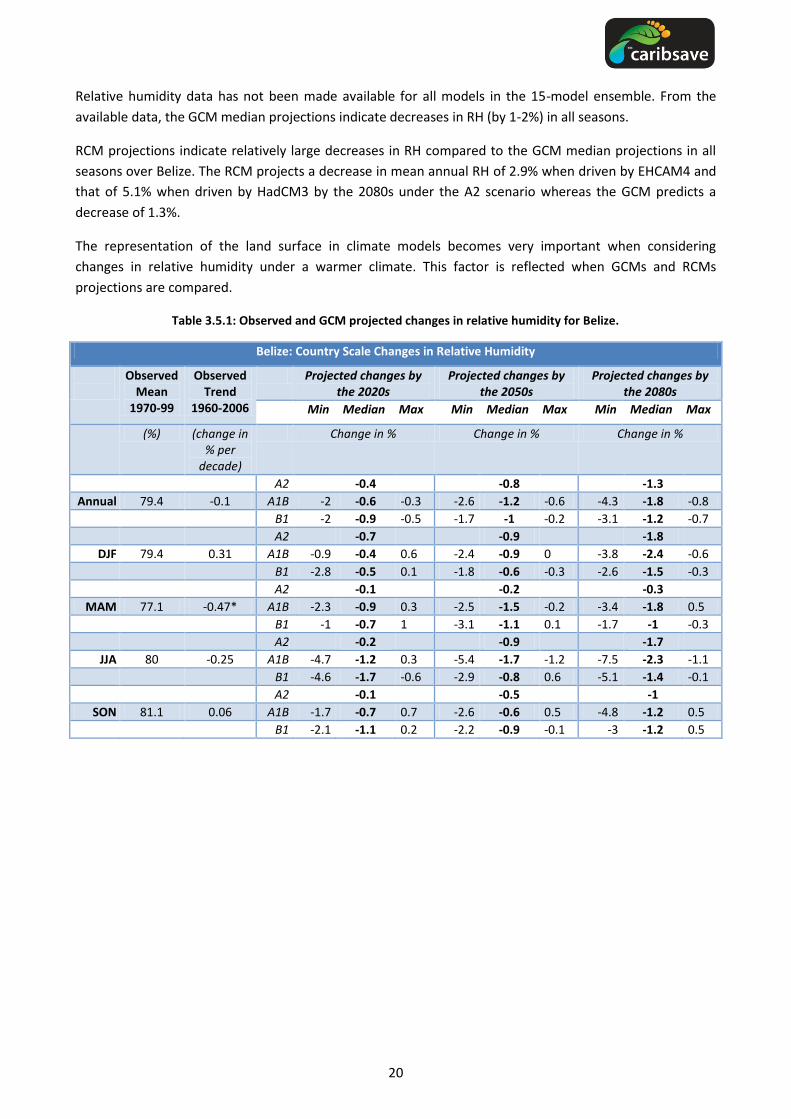
20
Relative humidity data has not been made available for all models in the 15-model ensemble. From the
available data, the GCM median projections indicate decreases in RH (by 1-2%) in all seasons.
RCM projections indicate relatively large decreases in RH compared to the GCM median projections in all
seasons over Belize. The RCM projects a decrease in mean annual RH of 2.9% when driven by EHCAM4 and
that of 5.1% when driven by HadCM3 by the 2080s under the A2 scenario whereas the GCM predicts a
decrease of 1.3%.
The representation of the land surface in climate models becomes very important when considering
changes in relative humidity under a warmer climate. This factor is reflected when GCMs and RCMs
projections are compared.
Table 3.5.1: Observed and GCM projected changes in relative humidity for Belize.
Belize: Country Scale Changes in Relative Humidity
Observed Mean
1970-99
Observed Trend
1960-2006
Projected changes by the 2020s
Projected changes by the 2050s
Projected changes by the 2080s
Min Median Max Min Median Max Min Median Max
(%) (change in % per
decade)
Change in % Change in % Change in %
A2
-0.4
-0.8
-1.3 Annual 79.4 -0.1 A1B -2 -0.6 -0.3 -2.6 -1.2 -0.6 -4.3 -1.8 -0.8
B1 -2 -0.9 -0.5 -1.7 -1 -0.2 -3.1 -1.2 -0.7
A2
-0.7
-0.9
-1.8 DJF 79.4 0.31 A1B -0.9 -0.4 0.6 -2.4 -0.9 0 -3.8 -2.4 -0.6
B1 -2.8 -0.5 0.1 -1.8 -0.6 -0.3 -2.6 -1.5 -0.3
A2
-0.1
-0.2
-0.3 MAM 77.1 -0.47* A1B -2.3 -0.9 0.3 -2.5 -1.5 -0.2 -3.4 -1.8 0.5
B1 -1 -0.7 1 -3.1 -1.1 0.1 -1.7 -1 -0.3
A2
-0.2
-0.9
-1.7 JJA 80 -0.25 A1B -4.7 -1.2 0.3 -5.4 -1.7 -1.2 -7.5 -2.3 -1.1
B1 -4.6 -1.7 -0.6 -2.9 -0.8 0.6 -5.1 -1.4 -0.1
A2
-0.1
-0.5
-1 SON 81.1 0.06 A1B -1.7 -0.7 0.7 -2.6 -0.6 0.5 -4.8 -1.2 0.5
B1 -2.1 -1.1 0.2 -2.2 -0.9 -0.1 -3 -1.2 0.5

21
Table 3.5.2: GCM and RCM projected changes in Belize under the A2 scenario.
Projected changes by the 2080s SRES A2
Min Median Max
Change in %
GCM Ensemble Range
-1.3 Annual RCM (ECHAM4)
-2.9
RCM (HadCM3)
-5.1 GCM Ensemble Range
-1.8
DJF RCM (ECHAM4)
-3.7 RCM (HadCM3)
-4.7
GCM Ensemble Range
-0.3 MAM RCM (ECHAM4)
-2.3
RCM (HadCM3)
-3.8 GCM Ensemble Range
-1.7
JJA RCM (ECHAM4)
-2.8 RCM (HadCM3)
-6.9
GCM Ensemble Range
-1 SON RCM (ECHAM4)
-3
RCM (HadCM3)
-5.1
3.6. Sunshine Hours
The number of ‘sunshine hours’ per day are calculated by applying the average clear-sky fraction from
cloud observations to the number of daylight hours for the latitude of the location and the time of the year.
The observed number of sunshine hours, based on ISCCP satellite observations of cloud coverage, indicates
statistically significant increase only in DJF sunshine hours in Belize by 0.57 hours per decade over the
period 1983 - 2001.
The number of sunshine hours is projected to increase slightly into the 21st Century in Belize by most GCMs,
particularly in the wet season reflecting reduction in average cloud fractions. The model ensemble,
however, spans both increases and decreases in all seasons and across emissions scenarios. Changes in
annual average sunshine hours span -0.2 to +1.1 hours per day by the 2080s under scenario A2. The median
increases projected by the GCM ensemble are large in JJA, with changes spanning -0.8 to +1.9 hours per
day.
Comparison between GCM and RCM projections of sunshine hours for Belize shows that the RCM
projections generally lie toward the higher end of the range of changes projected by the GCM ensemble.
Driven by ECHAM4, the RCM projects 0.4 – 1.1 hour per day increase in sunshine hours by the 2080s across
all seasons. Driven by HadCM3, the RCM projects an increase of 1.4 hours per day in annual sunshine hours
with the largest increase in JJA (2.3 hours per day).
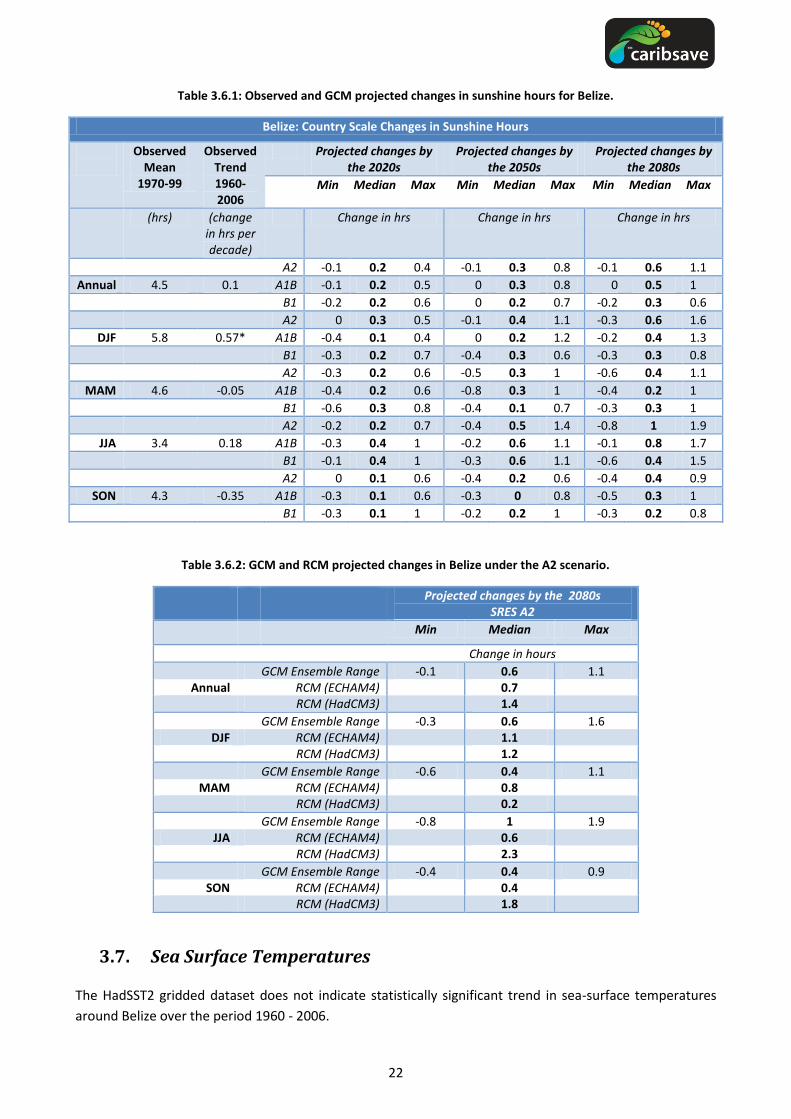
22
Table 3.6.1: Observed and GCM projected changes in sunshine hours for Belize.
Belize: Country Scale Changes in Sunshine Hours
Observed Mean
1970-99
Observed Trend 1960-2006
Projected changes by the 2020s
Projected changes by the 2050s
Projected changes by the 2080s
Min Median Max Min Median Max Min Median Max
(hrs) (change in hrs per decade)
Change in hrs Change in hrs Change in hrs
A2 -0.1 0.2 0.4 -0.1 0.3 0.8 -0.1 0.6 1.1
Annual 4.5 0.1 A1B -0.1 0.2 0.5 0 0.3 0.8 0 0.5 1
B1 -0.2 0.2 0.6 0 0.2 0.7 -0.2 0.3 0.6
A2 0 0.3 0.5 -0.1 0.4 1.1 -0.3 0.6 1.6
DJF 5.8 0.57* A1B -0.4 0.1 0.4 0 0.2 1.2 -0.2 0.4 1.3
B1 -0.3 0.2 0.7 -0.4 0.3 0.6 -0.3 0.3 0.8
A2 -0.3 0.2 0.6 -0.5 0.3 1 -0.6 0.4 1.1
MAM 4.6 -0.05 A1B -0.4 0.2 0.6 -0.8 0.3 1 -0.4 0.2 1
B1 -0.6 0.3 0.8 -0.4 0.1 0.7 -0.3 0.3 1
A2 -0.2 0.2 0.7 -0.4 0.5 1.4 -0.8 1 1.9
JJA 3.4 0.18 A1B -0.3 0.4 1 -0.2 0.6 1.1 -0.1 0.8 1.7
B1 -0.1 0.4 1 -0.3 0.6 1.1 -0.6 0.4 1.5
A2 0 0.1 0.6 -0.4 0.2 0.6 -0.4 0.4 0.9
SON 4.3 -0.35 A1B -0.3 0.1 0.6 -0.3 0 0.8 -0.5 0.3 1
B1 -0.3 0.1 1 -0.2 0.2 1 -0.3 0.2 0.8
Table 3.6.2: GCM and RCM projected changes in Belize under the A2 scenario.
Projected changes by the 2080s SRES A2
Min Median Max
Change in hours
GCM Ensemble Range -0.1 0.6 1.1 Annual RCM (ECHAM4)
0.7
RCM (HadCM3)
1.4 GCM Ensemble Range -0.3 0.6 1.6
DJF RCM (ECHAM4)
1.1 RCM (HadCM3)
1.2
GCM Ensemble Range -0.6 0.4 1.1 MAM RCM (ECHAM4)
0.8
RCM (HadCM3)
0.2 GCM Ensemble Range -0.8 1 1.9
JJA RCM (ECHAM4)
0.6 RCM (HadCM3)
2.3
GCM Ensemble Range -0.4 0.4 0.9 SON RCM (ECHAM4)
0.4
RCM (HadCM3)
1.8
3.7. Sea Surface Temperatures
The HadSST2 gridded dataset does not indicate statistically significant trend in sea-surface temperatures
around Belize over the period 1960 - 2006.

23
GCM projections indicate increases in sea-surface temperatures throughout the year. Projected increases
range between +0.8˚C and +2.7˚C by the 2080s across all three emissions scenarios. The range of
projections under any single emissions scenario spans roughly around 1.0 to 1.5˚C.
Table 3.7.1: Observed and GCM projected changes in sea surface temperature for Belize.
Belize: Country Scale Changes in Sea Surface Temperature
Observed Mean 1970-99
Observed Trend
1960-2006
Projected changes by the 2020s
Projected changes by the 2050s
Projected changes by the 2080s
Min Median Max Min Median Max Min Median Max
(˚C) (change in ˚C per
decade)
Change in ˚C Change in ˚C Change in ˚C
A2 0.5 0.6 0.9 0.9 1.3 1.7 1.8 2.3 2.7
Annual 27.8 -0.02 A1B 0.3 0.7 0.8 0.9 1.4 1.7 1.2 2.2 2.6
B1 0.3 0.6 0.7 0.6 1 1.1 0.8 1.3 1.8
A2 0.3 0.7 1.1 0.7 1.4 1.8 1.8 2.3 2.7
DJF 26.7 -0.04 A1B 0.4 0.6 0.8 0.9 1.3 1.6 1.2 2.1 2.6
B1 0.3 0.7 0.9 0.6 1 1.3 0.8 1.3 1.9
A2 0.5 0.6 0.9 0.9 1.2 1.8 1.7 2.3 2.7
MAM 27.4 -0.02 A1B 0.2 0.6 0.9 0.7 1.4 1.6 1.1 2.2 2.5
B1 0.2 0.5 0.6 0.6 0.9 1.2 0.7 1.3 1.7
A2 0.5 0.7 0.7 1 1.3 1.6 1.8 2.5 2.5
JJA 28.8 0 A1B 0.3 0.7 0.9 0.9 1.4 1.7 1.3 2 2.4
B1 0.2 0.6 0.6 0.6 1 1.1 0.9 1.2 1.7
A2 0.5 0.7 1 1.1 1.4 1.6 1.6 2.3 2.8
SON 28.5 -0.01 A1B 0.4 0.7 0.8 0.9 1.4 1.8 1.3 2.3 2.8
B1 0.3 0.7 0.8 0.6 1 1.1 0.9 1.3 1.8
3.8. Temperature Extremes
Extreme hot and cold values are defined by the temperatures that are exceeded on 10% of days in the
‘current’ climate or reference period. This allows us to define ‘hot’ and ‘cold’ relative to the particular
climate of a specific region or season and determine relative changes in extreme events.
The frequency of 'hot' days and 'hot' nights has increased significantly since 1960 in all seasons in Belize.
The frequency of mean annual 'hot' days has increased at the rate of 4.25% hot days per decade with the
strongest increase in JJA (by 4.99% of hot days per decade) between 1960 and 2006. The frequency of
mean annual 'hot' nights has increased by 2.37% of hot nights per decade with the strongest increase in DJF
(by 3.56% of hot nights per decade).
GCM projections indicate increases in the frequency of ‘hot’ days by 23-70% of days and ‘hot’ nights by 35-
80% of nights annually by the 2080s. The rate of increase varies substantially between models and is higher
in JJA compared to other seasons. ‘Cold’ days/nights diminish in frequency, occurring only 0-4% days/nights
in most models by the 2080s.

24
Table 3.8.1: Observed and GCM projected changes in temperature extremes for Belize.
Belize: Country scale changes in Temperature Extremes
Observed Mean
1970-99
Observed Trend
1960-2006
Projected changes by the 2020s
Projected changes by the 2050s
Projected changes by the 2080s
Min Median Max Min Median Max Min Median Max
% Frequency
Change in frequency
per decade
Future % frequency Future % frequency
Frequency of Hot Days (TX90p)
A2
25 41 53 34 58 70
Annual 14 4.25* A1B
28 39 51 30 52 62
B1
20 30 44 23 37 48
A2
24 40 51 31 54 72
DJF 12.3 2.76* A1B
25 40 54 26 59 70
B1
19 27 40 25 31 53
A2
29 47 61 39 64 80
MAM 13.6 3.64* A1B
32 45 55 37 62 78
B1
25 34 50 26 47 55
A2
40 68 82 62 90 96
JJA 14.4 4.99* A1B
52 67 78 53 83 95
B1
34 55 72 39 66 83
A2
20 49 69 36 69 84
SON 13.8 4.73* A1B
19 50 65 25 67 77
B1
21 39 55 16 53 65
Frequency of Hot Nights (TN90p)
A2
40 50 58 58 74 80
Annual 11.2 2.37* A1B
40 50 59 49 64 79
B1
31 39 48 35 48 57
A2
30 50 61 46 76 85
DJF 12 3.56* A1B
40 55 66 38 65 85
B1
28 40 49 36 48 67
A2
39 57 61 59 81 86
MAM 11.6 1.92* A1B
37 55 64 48 73 86
B1
25 39 47 35 52 58
A2
69 84 92 94 99 99
JJA 11.3 2.73* A1B
67 81 92 82 97 98
B1
46 60 81 54 78 90
A2
54 67 78 79 89 93
SON 12.3 4.22* A1B
54 67 76 67 79 92
B1
41 50 64 44 64 77

25
Belize: Country scale changes in Temperature Extremes (continued)
Observed Mean
1970-99
Observed Trend
1960-2006
Projected changes by the 2020s
Projected changes by the 2050s
Projected changes by the 2080s
Min Median Max Min Median Max Min Median Max
% Frequency
Change in frequency
per decade
Future % frequency Future % frequency
Frequency of Cold Days (TX10p)
A2
1 5 5 0 2 4
Annual 8.4 -1.33* A1B
1 4 6 0 3 5
B1
3 5 6 2 4 6
A2
1 2 6 0 1 3
DJF 8.2 -1.09* A1B
1 4 5 0 2 6
B1
3 4 7 1 3 6
A2
1 2 5 0 1 3
MAM 8.9 -1.08* A1B
1 3 5 0 1 4
B1
2 4 7 1 3 6
A2
0 1 3 0 0 1
JJA 8.3 -1.60* A1B
0 1 2 0 0 1
B1
0 2 5 0 2 3
A2
0 2 5 0 1 3
SON 9.1 -0.81 A1B
1 1 5 0 1 4
B1
1 2 5 1 2 7
Frequency of Cold Nights (TN10p)
A2
1 4 7 0 2 4
Annual 7.5 -1.44* A1B
1 3 6 0 3 6
B1
3 4 6 1 4 6
A2
0 4 6 0 1 2
DJF 8 -1.74* A1B
0 3 4 0 2 4
B1
3 3 6 1 4 5
A2
0 3 4 0 1 2
MAM 8.4 -1.02 A1B
0 2 5 0 1 3
B1
1 4 5 0 3 6
A2
0 0 0 0 0 0
JJA 6.6 -1.35* A1B
0 0 0 0 0 0
B1
0 0 0 0 0 0
A2
0 2 4 0 0 2
SON 7.3 -1.52* A1B
0 1 5 0 1 3
B1
0 3 5 1 2 6
3.9. Rainfall Extremes
Changes in rainfall extremes, based on 1- and 5-day rainfall totals, as well as exceedance of a relative
threshold for ‘heavy’ rain, were examined. ‘Heavy’ rain is determined by the daily rainfall totals that are
exceeded on 5% of wet days in the ‘current’ climate or reference period, relative to the particular climate
of a specific region or season.
There is insufficient daily observational data to identify trends in all expects of rainfall extremes in Belize.
The magnitude of maximum 5-day rainfall shows increasing trend of 5.37 mm per decade over the period
1960 - 2006.
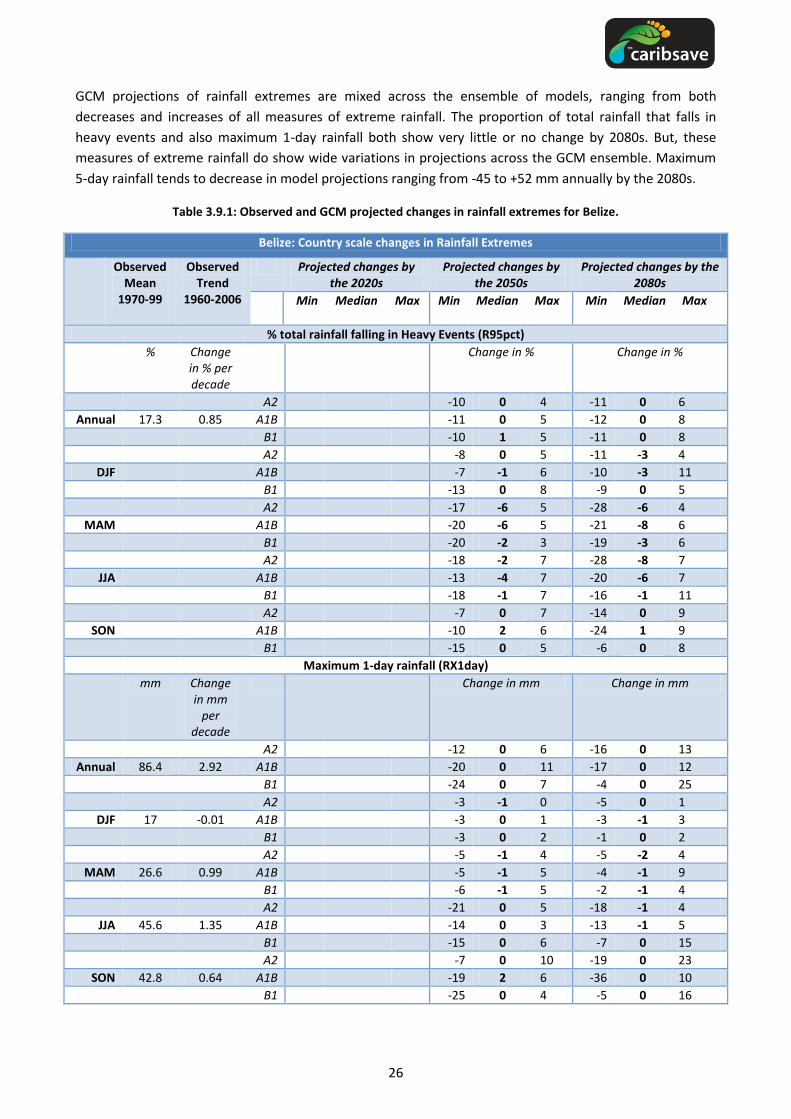
26
GCM projections of rainfall extremes are mixed across the ensemble of models, ranging from both
decreases and increases of all measures of extreme rainfall. The proportion of total rainfall that falls in
heavy events and also maximum 1-day rainfall both show very little or no change by 2080s. But, these
measures of extreme rainfall do show wide variations in projections across the GCM ensemble. Maximum
5‐day rainfall tends to decrease in model projections ranging from ‐45 to +52 mm annually by the 2080s.
Table 3.9.1: Observed and GCM projected changes in rainfall extremes for Belize.
Belize: Country scale changes in Rainfall Extremes
Observed Mean
1970-99
Observed Trend
1960-2006
Projected changes by the 2020s
Projected changes by the 2050s
Projected changes by the 2080s
Min Median Max Min Median
Max Min Median Max
% total rainfall falling in Heavy Events (R95pct)
% Change in % per decade
Change in % Change in %
A2
-10 0 4 -11 0 6
Annual 17.3 0.85 A1B
-11 0 5 -12 0 8
B1
-10 1 5 -11 0 8
A2
-8 0 5 -11 -3 4
DJF
A1B
-7 -1 6 -10 -3 11
B1
-13 0 8 -9 0 5
A2
-17 -6 5 -28 -6 4
MAM
A1B
-20 -6 5 -21 -8 6
B1
-20 -2 3 -19 -3 6
A2
-18 -2 7 -28 -8 7
JJA
A1B
-13 -4 7 -20 -6 7
B1
-18 -1 7 -16 -1 11
A2
-7 0 7 -14 0 9
SON
A1B
-10 2 6 -24 1 9
B1
-15 0 5 -6 0 8
Maximum 1-day rainfall (RX1day)
mm Change in mm
per decade
Change in mm Change in mm
A2
-12 0 6 -16 0 13
Annual 86.4 2.92 A1B
-20 0 11 -17 0 12
B1
-24 0 7 -4 0 25
A2
-3 -1 0 -5 0 1
DJF 17 -0.01 A1B
-3 0 1 -3 -1 3
B1
-3 0 2 -1 0 2
A2
-5 -1 4 -5 -2 4
MAM 26.6 0.99 A1B
-5 -1 5 -4 -1 9
B1
-6 -1 5 -2 -1 4
A2
-21 0 5 -18 -1 4
JJA 45.6 1.35 A1B
-14 0 3 -13 -1 5
B1
-15 0 6 -7 0 15
A2
-7 0 10 -19 0 23
SON 42.8 0.64 A1B
-19 2 6 -36 0 10
B1
-25 0 4 -5 0 16

27
Belize: Country scale changes in Rainfall Extremes
Observed Mean
1970-99
Observed Trend
1960-2006
Projected changes by the 2020s
Projected changes by the 2050s
Projected changes by the 2080s
Min Median Max Min Median
Max Min Median Max
Maximum 5-day Rainfall (RX5day)
mm Change in mm
per decade
Change in mm Change in mm
A2
-32 3 16 -45 -3 16
Annual 159.9 5.37* A1B
-40 1 19 -45 -4 18
B1
-53 -2 27 -12 0 52
A2
-7 -2 3 -12 0 7
DJF 29.5 1.12 A1B
-6 -2 3 -8 -1 7
B1
-7 -1 3 -4 0 4
A2
-13 -3 10 -12 -6 6
MAM 43.4 2.72* A1B
-13 -4 10 -15 -3 24
B1
-13 -2 7 -7 -4 9
A2
-42 -3 10 -45 -11 7
JJA 94.6 1.39 A1B
-27 -3 15 -28 -6 11
B1
-32 -1 24 -22 -1 30
A2
-21 0 29 -48 0 30
SON 83.7 1.63 A1B
-36 1 16 -74 0 24
B1
-50 -1 13 -11 -1 30
3.10. Hurricanes and Tropical Storms
Historical and future changes in tropical storm and hurricane activity have been a topic of heated debate in
the climate science community. Drawing robust conclusions with regards to changes in climate extremes is
continually hampered by issues of data quality in observations, the difficulties in separating natural
variability from long-term trends and the limitations imposed by spatial resolution of climate models.
Tropical storms and hurricanes form from pre-existing weather disturbances where sea surface
temperatures (SSTs) exceed 26˚C. Whilst SSTs are a key factor in determining the formation, development
and intensity of tropical storms, a number of other factors are also critical, such as subsidence, wind shear
and static stability. This means that whilst observed and projected increases in SSTs under a warmer
climate potentially expand the regions and periods of time when tropical storms may form, the critical
conditions for storm formation may not necessarily be met (e.g. Veccchi and Soden, 2007; Trenberth et al.,
2007) and increasing SSTs may not necessarily be accompanied by an increase in the frequency of tropical
storm incidences.
Several analyses of global (e.g. Webster et al., 2005) and more specifically North Atlantic (e.g. Holland and
Webster, 2007; Kossin et al., 2007; Elsner et al., 2008) hurricanes have indicated increases in the observed
record of tropical storms over the last 30 years. It is not yet certain to what degree this trend arises as part
of a long-term climate change signal or shorter-term inter-decadal variability. The available longer term
records are riddled with in homogeneities (inconsistencies in recording methods through time) - most
significantly, the advent of satellite observations, before which storms were only recorded when making
landfall or observed by ships (Kossin et al., 2007). Recently, a longer-term study of variations in hurricane
frequency in the last 1,500 years based on proxy reconstructions from regional sedimentary evidence

28
indicate recent levels of Atlantic hurricane activity are anomalously high relative to those of the last one-
and -a -half millennia (Mann et al., 2009).
Climate models are still relatively primitive with respect to representing tropical storms and this restricts
the ability to determine future changes in frequency or intensity. Changes in background conditions that
are conducive to storm formation (boundary conditions) can be analysed (e.g. Tapiador, 2008), or applied
to embedded high-resolution models which can credibly simulate tropical storms (e.g. Knutson and Tuleya,
2004; Emanuel et al., 2008). Regional Climate Models are able to simulate weak ‘cyclone-like’ storm
systems that are broadly representative of a storm or hurricane system but are still considered coarse in
scale with respect to modelling hurricanes.
The IPCC AR4 (Meehl et al., 2007b) concludes that models are broadly consistent in indicating increases in
precipitation intensity associated with tropical storms (e.g. Knutson and Tuleya, 2004; Knutson et al., 2008;
Chauvin et al., 2006; Hasegawa and Emori, 2005; Tsutsui, 2002). The higher resolution models that
simulate storms more credibly are also broadly consistent in indicating increases in associated peak wind
intensities and mean rainfall (Knutson and Tuleya, 2004; Oouchi et al., 2006). The projected changes in
wind and precipitation intensities from a selection of these modelling experiments are summarised in Table
3.10.1 to give an indication of the magnitude of these changes.
With regards to the frequency of tropical storms in future climate, models are strongly divergent. Several
recent studies (e.g. Vecchi and Sodon, 2007; Bengtssen et al., 2007; Emanuel et al., 2008, Knutson et al.,
2008) have indicated that the frequency of storms may decrease due to decreases in vertical wind shear in
a warmer climate. In several of these studies, intensity of hurricanes still increases despite decreases in
frequency (Emanuel et al., 2008; Knutson et al., 2008). In a recent study of the PRECIS regional climate
model simulations for Central America and the Caribbean, Bezanilla et al., (2009) found that the frequency
of ‘Tropical -Cyclone-like –Vortices’ increases on the Pacific coast of Central America, but decreases on the
Atlantic coast and in the Caribbean.
When interpreting the modelling experiments it should be remembered that the models remain relatively
primitive with respect to the complex atmospheric processes that are involved in hurricane formation and
development. Hurricanes are particularly sensitive to some of the elements of climate physics that these
models are weakest at representing and are often only included by statistical parameterisations.
Comparison studies have demonstrated that the choice of parameterisation scheme can exert a strong
influence on the results of the study (e.g. Yoshimura et al., 2006). It should also be recognised that the El
Niño Southern Oscillation (ENSO) is a strong and well established influence on Tropical Storm frequency in
the North Atlantic and explains a large proportion of inter-annual variability in hurricane frequency (among
other things). This means that the future frequency of hurricanes in the North Atlantic is likely to be
strongly dependent on whether the climate state becomes more ‘El-Niño-like’, or more ‘La-Niña-like’, an
issue upon which models are still strongly divided and suffer from significant deficiencies in simulating the
fundamental features of ENSO variability (e.g. Collins et al., 2005).

29
Table 3.10.1: Changes in Near-storm rainfall and wind intensity associated with Tropical storms in under global warming scenarios.
Reference GHG scenario
Type of Model Domain Change in near-storm rainfall intensity
Change in peak wind intensity
Knutson et al. (2008)
A1B Regional Climate Model Atlantic (+37, 23, 10)% when averaged within 50, 100 and 400 km of the storm centre
+2.9%
Knutson and Tuleya (2004)
1% per year CO2 increase
9 GCMs + nested regional model with 4 different moist convection schemes.
Global +12-33% +5-7%
Oouchi et al. (2006)
A1B High Resolution GCM Global
N/A +14%
North Atlantic +20%
3.11. Sea Level Rise
Observed records of sea level from tidal gauges and satellite altimeter readings indicate a global mean SLR
of 1.8 (+/- 0.5) mm yr-1 over the period 1961 - 2003 (Bindoff et al., 2007). Acceleration in this rate of
increase over the course of the 20th Century has been detected in most regions (Woodworth et al., 2009;
Church and White, 2006).
There are large regional variations superimposed on the mean global SLR rate. Observations from tidal
gauges surrounding the Caribbean basin (Table 3.11.1) indicate that SLR in the Caribbean is broadly
consistent with the global trend (Table 3.11.2).
Table 3.11.1: Sea level rise rates at observation stations surrounding the Caribbean Basin
Tidal Gauge Station Observed trend (mm yr-1
) Observation period
Bermuda 2.04 (+/- 0.47) 1932-2006
San Juan, Puerto Rico 1.65 (+/- 0.52) 1962-2006
Guantanamo Bay, Cuba 1.64 (+/- 0.80) 1973-1971
Miami Beach, Florida 2.39 (+/1 0.43) 1931-1981
Vaca Key, Florida 2.78 (+/- 0.60) 1971-2006
(Source: NOAA, 2009)
Projections of future SLR associated with climate change have recently become a topic of heated debate in
scientific research. The IPCC’s AR4 report summarised a range of SLR projections under each of its standard
scenarios, for which the combined range spans 0.18-0.59 m by 2100 relative to 1980 - 1999 levels (see
ranges for each scenario in Table 3.11.2). These estimates have since been challenged for being too
conservative and a number of studies (e.g. Rahmstorf, 2007; Rignot and Kanargaratnam, 2006; Horton et
al., 2008) have provided evidence to suggest that their uncertainty range should include a much larger
upper limit.
Total sea level rises associated with atmospheric warming appear largely through the combined effects of
two main mechanisms: (a) thermal expansion (the physical response of the water mass of the oceans to
atmospheric warming) and (b) ice-sheet, ice-cap and glacier melt. Whilst the rate of thermal expansion of
the oceans in response to a given rate of temperature increase is projected relatively consistently between
GCMs, the rate of ice melt is much more difficult to predict due to the incomplete understanding of ice-
sheet dynamics. The IPCC total SLR projections comprise of 70-75% (Meehl et al., 2007b) contribution from
thermal expansion, with only a conservative estimate of the contribution from ice sheet melt (Rahmstorf,
2007).
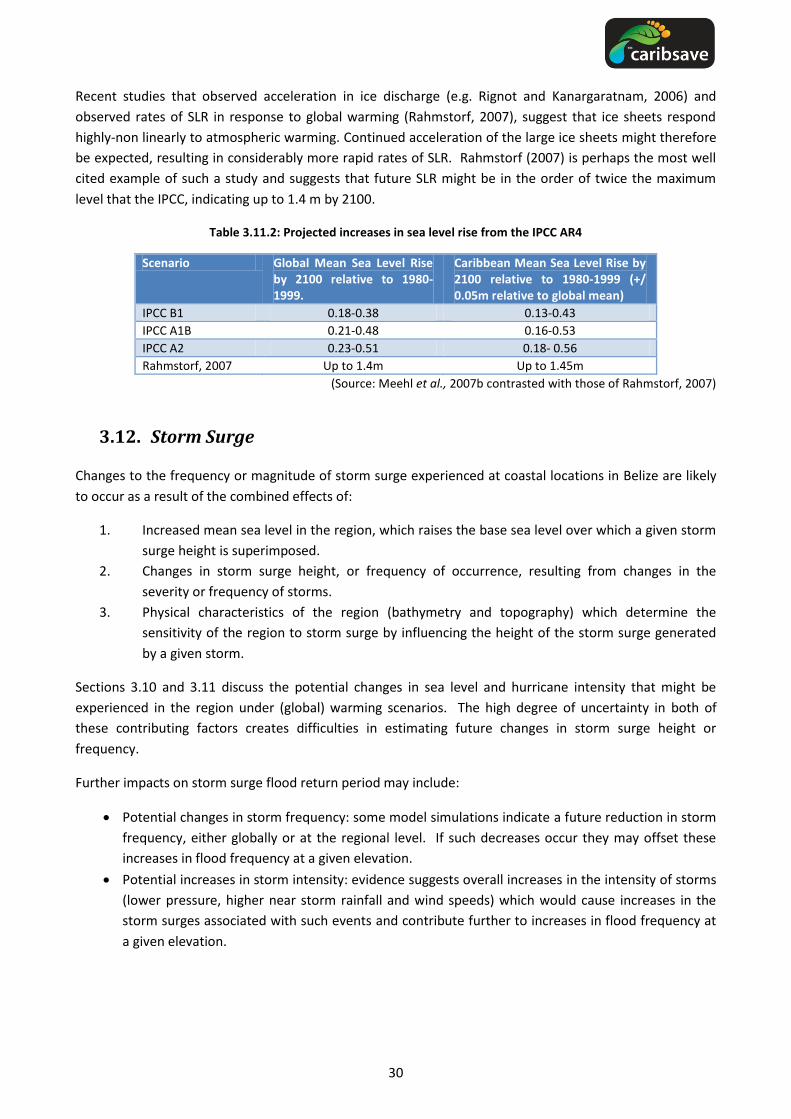
30
Recent studies that observed acceleration in ice discharge (e.g. Rignot and Kanargaratnam, 2006) and
observed rates of SLR in response to global warming (Rahmstorf, 2007), suggest that ice sheets respond
highly-non linearly to atmospheric warming. Continued acceleration of the large ice sheets might therefore
be expected, resulting in considerably more rapid rates of SLR. Rahmstorf (2007) is perhaps the most well
cited example of such a study and suggests that future SLR might be in the order of twice the maximum
level that the IPCC, indicating up to 1.4 m by 2100.
Table 3.11.2: Projected increases in sea level rise from the IPCC AR4
Scenario Global Mean Sea Level Rise by 2100 relative to 1980-1999.
Caribbean Mean Sea Level Rise by 2100 relative to 1980-1999 (+/ 0.05m relative to global mean)
IPCC B1 0.18-0.38 0.13-0.43
IPCC A1B 0.21-0.48 0.16-0.53
IPCC A2 0.23-0.51 0.18- 0.56
Rahmstorf, 2007 Up to 1.4m Up to 1.45m
(Source: Meehl et al., 2007b contrasted with those of Rahmstorf, 2007)
3.12. Storm Surge
Changes to the frequency or magnitude of storm surge experienced at coastal locations in Belize are likely
to occur as a result of the combined effects of:
1. Increased mean sea level in the region, which raises the base sea level over which a given storm
surge height is superimposed.
2. Changes in storm surge height, or frequency of occurrence, resulting from changes in the
severity or frequency of storms.
3. Physical characteristics of the region (bathymetry and topography) which determine the
sensitivity of the region to storm surge by influencing the height of the storm surge generated
by a given storm.
Sections 3.10 and 3.11 discuss the potential changes in sea level and hurricane intensity that might be
experienced in the region under (global) warming scenarios. The high degree of uncertainty in both of
these contributing factors creates difficulties in estimating future changes in storm surge height or
frequency.
Further impacts on storm surge flood return period may include:
Potential changes in storm frequency: some model simulations indicate a future reduction in storm
frequency, either globally or at the regional level. If such decreases occur they may offset these
increases in flood frequency at a given elevation.
Potential increases in storm intensity: evidence suggests overall increases in the intensity of storms
(lower pressure, higher near storm rainfall and wind speeds) which would cause increases in the
storm surges associated with such events and contribute further to increases in flood frequency at
a given elevation.
31
4. VULNERABILITY AND IMPACTS PROFILE FOR BELIZE
Vulnerability is defined as the “inherent characteristics or qualities of social systems that create the
potential for harm. Vulnerability is a function of exposure… and sensitivity of [the] system” (Adger, 2006;
Cutter, 1996 cited in Cutter et al. 2008, p. 599). Climate change is projected to be a progressive process and
therefore vulnerability will arise at different time and spatial scales affecting communities and sectors in
distinct ways. Participatory approaches to data collection were implemented in Placencia to provide
additional community-level data and field surveys in Caye Caulker, Rocky Point and San Pedro enabled the
creation of sea level rise impact data and maps. To help in the identification and analysis of vulnerability,
the following sections discuss the implications and impacts of climate change on key sectors as they relate
to tourism in Belize.
Belize is already experiencing some of the effects of climate variability through damages from severe
weather systems and the decline of some coastal tourism attractions. According to the Government of
Belize, the major issues of climate change are SLR and the likelihood of more intense weather systems and
loss of biodiversity. The Coastal Zone Management Authority and Institute (CZMAI) is the government
agency responsible for implementing and regulating the Coastal Zone Management Act, which makes
provision for protection of coastal ecosystems and habitats that directly and indirectly contribute to the
stabilisation and protection of the coastline from extreme climatic events.
4.1. Water Quality and Availability
4.1.1. Background
Belize is a country rich in surface water sources including streams and rivers as well as many groundwater
aquifers found in calcareous rock (Tollner, 2007). The main source of freshwater in rural areas is
predominantly groundwater, where approximately 95% of freshwater is extracted from groundwater
supplies (Frutos, 2003). In the cities of the Corozal, Orange Walk, Cayo and Toledo Districts, groundwater is
also used as a main source of drinking water (FAO, 2000). In other urban areas, 70% of the total water used
comes from surface water. Surface water is abundant in every region except on the Vaca Plateau where
streams disappear into porous limestone (Tollner, 2007). In 1995, Belize had the highest total volume of
freshwater available per capita, at 80.8 thousand cubic meters (Frutos, 2003; BEST, 2009). Rainwater is also
collected for use mainly in agricultural irrigation projects (BEST, 2009). It has been noted that freshwater
supplies are sufficient for the current population, though there is an increased stress on these supplies due
to population growth, increases in economic and agricultural activities, as well as an increase in droughts
(BEST, 2009). One desalinization plant is operating in the country and is located on Ambergris Caye, a
barrier reef island known as an important tourist destination (Consolidated Water (Belize) Limited, 2011).
This plant produces 470 thousand gallons of freshwater per day using the technique of reverse osmosis.
Reverse osmosis has also been installed recently in Caye Caulker, another popular tourist destination.
Belize is divided into 39 watersheds, 18 of them considered major watersheds (Figure 4.1.1; BEST 2009).
Numerous swamps, wetlands and mangroves form a transition between freshwater supplies and the coast.
These also act as filters for runoff before it drains into the Caribbean Sea. The main sources of population
are located along the Mopan branch of the Belize River, which is also the largest watershed at
approximately 1,570,000 acres and along the Rio Hondo, the second largest watershed at approximately
670,000 acres (BEST, 2009; BERDS, 2011). These two watersheds supply the majority of potable and

32
agricultural water needs in Belize (BEST, 2009; see Figure 4.1.1 and Figure 4.1.2). All of the watersheds in
Belize empty into the Caribbean Sea. The rivers in the northern region are mainly slow-flowing and
estuarine for a large portion of their lengths (Neal et al., 2007). In the central and southern regions, the
rivers tend to be shorter and faster flowing until they enter the coastal plain where they also become more
estuarine (Neal et al., 2007).
The distribution of freshwater usage in Belize was the following in 2005: 43.7% agricultural (% of total
demand), 36.5% industrial and 19.7% domestic/residential (BEST, 2009). Domestic water usage is
approximately 240-280 litres per day in urban areas and 160 litres per day in rural areas (FAO, 2000). In
2007 alone, approximately 15.3 billion gallons of water were used (BEST, 2009). This is mainly used by the
industrial and agricultural sector which makes up about 80% of demand.
In general, access to safe water is limited, particularly in rural areas (BEST, 2009; WMB, 2011). Belize Water
Services Ltd. (BWS), is the sole service provider in Belize, providing water and sewerage to 46610 (BWS,
2010) and accounts for an approximate demand of some 150 million US gallons of water per month (BWS,
2009). Most villages are otherwise serviced by a village water board and some also have access to a water
tower (Mustafa and Reeder, 2009; WMB, 2011). Water not provided through piping is usually collected
rainwater or river water treated with bleach (WMB, 2011). In the 2010 population census, it was noted that
the use of unsafe water sources such as waterways, standpipes, public wells and private catchments had
been cut by half, but was still high in certain districts such as Corozal, Orange Walk and Toledo (SIB, 2010).
The total water production for the fiscal year of 2010 was tallied at US $2.81 billion gallons (BWS, 2009).
Figure 4.1.1: Belize Hydrological Regions

33
(Source: BEST, 2009)
Figure 4.1.2: Belize roads and major cities
(Source: BERDS, 2011)
Tourism is the largest contributor to GDP in Belize. Tourist expenditures reached BZ $400 million dollars in
2006, which is approximately 16.8% of GDP (BTB, 2008). Combined, tourists visiting by cruise ships and
overnight visitors reached almost one million in 2006. The largest tourism destinations in Belize are
Ambergris Caye, Caye Caulker and the Cayo District. Ambergris Caye and Caye Caulker are the locations of
the two desalinization plants in Belize, built predominantly to fulfil the growing water demand from the
tourism industry. The plant at Ambergris Caye is operated by Consolidated Water (Belize) Limited (CW,
2011). Caye Caulker is a smaller island once known for its availability of freshwater (CCB, 2004) and now has
a thriving tourism industry. Until recently it was largely dependent on underground water sources from
wells, which can become contaminated due to inadequate sewers (BEST, 2009). All three locations are
serviced by the Belize Water Services Ltd. (BWS). At Ambergris Caye, a twenty-three year agreement was
signed between Consolidated Water and Belize Water Services Limited in 2003 (CW, 2011). In this
agreement, it was noted that:
“The contract also ensures that the capacity of the plant will keep pace with the growing
demands of Ambergris Caye and that a sufficient supply of high quality drinking water will
not be a factor limiting growth of the island.” (CW, 2011)
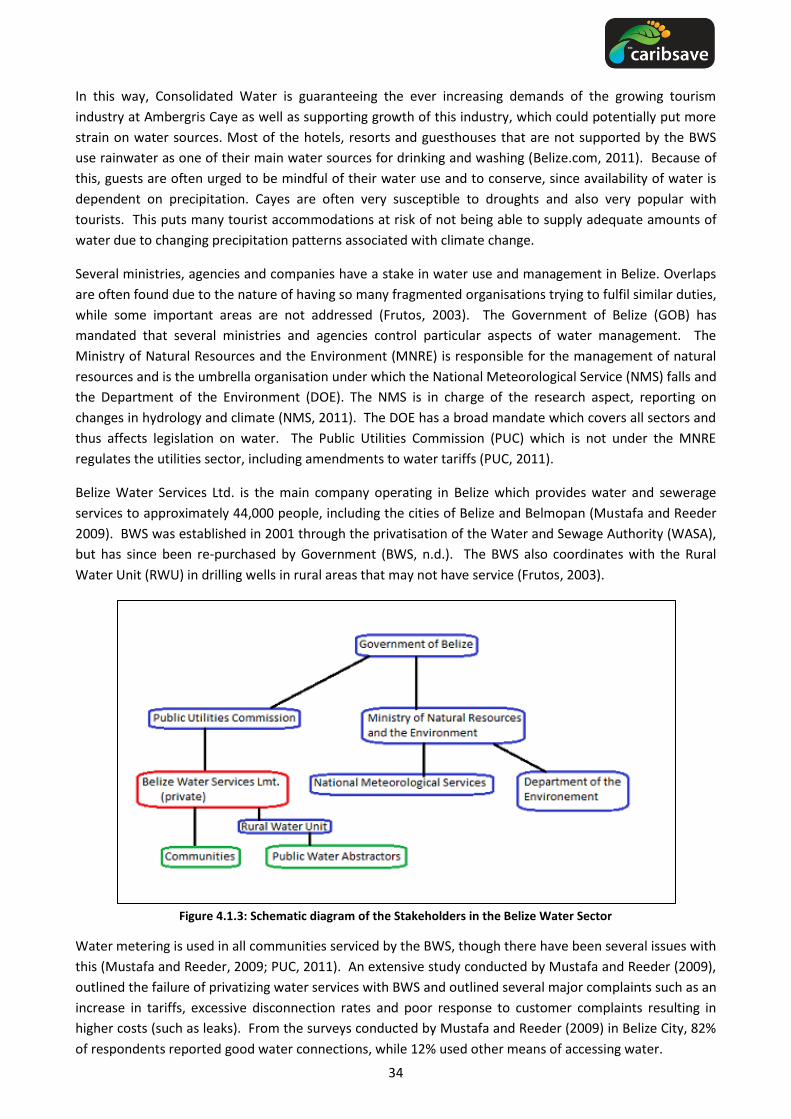
34
In this way, Consolidated Water is guaranteeing the ever increasing demands of the growing tourism
industry at Ambergris Caye as well as supporting growth of this industry, which could potentially put more
strain on water sources. Most of the hotels, resorts and guesthouses that are not supported by the BWS
use rainwater as one of their main water sources for drinking and washing (Belize.com, 2011). Because of
this, guests are often urged to be mindful of their water use and to conserve, since availability of water is
dependent on precipitation. Cayes are often very susceptible to droughts and also very popular with
tourists. This puts many tourist accommodations at risk of not being able to supply adequate amounts of
water due to changing precipitation patterns associated with climate change.
Several ministries, agencies and companies have a stake in water use and management in Belize. Overlaps
are often found due to the nature of having so many fragmented organisations trying to fulfil similar duties,
while some important areas are not addressed (Frutos, 2003). The Government of Belize (GOB) has
mandated that several ministries and agencies control particular aspects of water management. The
Ministry of Natural Resources and the Environment (MNRE) is responsible for the management of natural
resources and is the umbrella organisation under which the National Meteorological Service (NMS) falls and
the Department of the Environment (DOE). The NMS is in charge of the research aspect, reporting on
changes in hydrology and climate (NMS, 2011). The DOE has a broad mandate which covers all sectors and
thus affects legislation on water. The Public Utilities Commission (PUC) which is not under the MNRE
regulates the utilities sector, including amendments to water tariffs (PUC, 2011).
Belize Water Services Ltd. is the main company operating in Belize which provides water and sewerage
services to approximately 44,000 people, including the cities of Belize and Belmopan (Mustafa and Reeder
2009). BWS was established in 2001 through the privatisation of the Water and Sewage Authority (WASA),
but has since been re-purchased by Government (BWS, n.d.). The BWS also coordinates with the Rural
Water Unit (RWU) in drilling wells in rural areas that may not have service (Frutos, 2003).
Figure 4.1.3: Schematic diagram of the Stakeholders in the Belize Water Sector
Water metering is used in all communities serviced by the BWS, though there have been several issues with
this (Mustafa and Reeder, 2009; PUC, 2011). An extensive study conducted by Mustafa and Reeder (2009),
outlined the failure of privatizing water services with BWS and outlined several major complaints such as an
increase in tariffs, excessive disconnection rates and poor response to customer complaints resulting in
higher costs (such as leaks). From the surveys conducted by Mustafa and Reeder (2009) in Belize City, 82%
of respondents reported good water connections, while 12% used other means of accessing water.

35
Since BWS took over water distribution from what used to be the Water and Sewerage Authority (WASA),
the rates have either doubled or increased many fold for tariffs and connection rates (Mustafa and Reeder,
2009). The desalinization plant operating in Belize has rates subsidised by the Government. The water
costs for San Pedro (where water is sourced from desalinization) are BZ $0.20 per gallon for the first 1,000
gallons per month (GWI, 2011). In Belize City, the rate is BZ $0.10 per gallon, with an added 20% cost for
sewerage service, mainly in Belize City and Belmopan. For other areas, the rate is BZ $0.075 per gallon (See
Table 4.1.1).
Table 4.1.1: Tariff Rates for Belize Water Services
Areas of Supply Rates BZ $ (US$)1 and Conditions
Belize City & Belmopan - Water &
Sewer Zones
2.(a) In any one month for less than 1,001 gallons a fee of $10.34 ($5.21)
(b) Proportionate fee for every gallon thereafter up to 2,000 gallons inclusive at the rate per 1,000 gallons of $17.81 ($8.97)
(c) Proportionate fee for every gallon above 2,000 gallons and up to 3,000 gallons inclusive at the rate per 1,000 gallons of $19.54 ($9.84) (etc. Increase in price for up to 5,000 gallons)
Water ONLY Areas - 14 municipalities - Those areas of Belize City
and Belmopan outside of sewer zones
- All other sub-urban and villages serviced by Belize Water Services Limited.
2.(a)In any one month for less than 1,001 gallons a fee of $8.62 ($4.34)
(b) Proportionate fee for every gallon thereafter up to 2,000 gallons inclusive at the rate per 1,000 gallons of $13.79 ($6.95)
(c) Proportionate fee for every gallon above 2,000 gallons and up to 3,000 gallons inclusive at the rate per 1,000 gallons of $14.94 (14.92) (etc. Increase in price for up to 5,000 gallons)
San Pedro, Ambergris Caye 2.(a)In any one month for less than 1,001 gallons a fee of $25.27 ($12.73)
(b) Proportionate fee for every gallon thereafter up to 2,000 gallons inclusive at the rate per 1,000 gallons of $29.87 ($15.04)
(c) Proportionate fee for every gallon above 2,000 gallons and up to 3,000 gallons inclusive at the rate per 1,000 gallons of $32.17 ($16.20) (etc. Increase in price for up to 5,000 gallons)
Caye Caulker 2.(a)In any one month for less than 1,001 gallons a fee of $23.00 (11.58)
(b) Proportionate fee for every gallon thereafter up to 2,000 gallons inclusive at the rate per 1,000 gallons of $26.45 ($13.32)
(c) Proportionate fee for every gallon above 2,000 gallons and up to 3,000 gallons inclusive at the rate per 1,000 gallons of $29.03 ($14.62) (etc. Increase in price for up to 5,000 gallons)
1Exchange rate used BZ $1.00 = US $0.50
(Source: Belize Water Services, 2009)
4.1.2. Vulnerability of Water Availability and Quality Sector to Climate Change
Belize is a country well endowed with water resources. However, recent issues with water scarcity and
water quality have become more commonplace as various stresses on water resources increase. Key issues
with water vulnerability in Belize are the uneven distribution of water resources. The southern region has
the lowest population, with the highest amount of freshwater availability, whereas the central and
northern regions both have much large populations and much less water resources (BEST, 2009). Several
Cayes have become popular tourist destinations but have low availabilities of freshwater. In particular,
Caye Caulker is vulnerable to contamination of its underground water through poor sewer construction and
intrusion of salt water into aquifers (BEST, 2009). It has also been noted that there has been changes in
precipitation (NMS, 2011) and that this has led to severe droughts that have affected many parts of the
country and the economy (BEST, 2009).
36
The water infrastructure can also at times be an issue, as most of the rural areas do not have piped water
supply and have to rely on drilled wells for freshwater, which can be low in times of drought or low
precipitation (BEST, 2009). Most major cities have adequate piping and distribution, although the tariffs
can be high at times and many poorer communities choose to get their own water from local wells
(Mustafa and Reeder, 2009).
Drought in Belize
Decreases in precipitation are projected for many sub-tropical areas including the Caribbean region, which
is also likely to experience shorter rainy seasons and precipitation in shorter duration, intense events
interspersed with longer periods of relatively dry conditions (Bates et al., 2008). A significant increase in the
number of consecutive dry days has been found for the Caribbean region (Bates et al., 2008), indicating
that periods of drought are becoming increasingly common. As a result, drought management will become
a progressively large challenge, requiring a multifocal approach due to its non-structural nature and
complex spatial patterns. This makes it a difficult task to find suitable solutions to adapt to the problems
created by drought conditions (e.g. Campbell et al., 2010). Good management of the water supply system is
critical for drought mitigation, needing careful operation of water supply infrastructure to be effective (e.g.
Shih and ReVelle, 1994; Hyde et al., 2004; Fang, 2011). Measures taken to mitigate the effects of drought
conditions in the Caribbean region have included the use of truck water for in-country redistribution, the
rotation of water supply, increased desalination and the importation of water from other countries using
barges.
Recent changes have been observed in temperatures, with the overall result being an increase in the
frequency of warm days and nights and a decrease in the frequency of cool days and nights (BEST, 2009;
UNDP Country Profile, 2011). The largest observed change was in the increase of night-time temperatures,
where it was observed that the increase in night-time temperatures contributed more to the overall
increase in temperature than the increase in daytime temperatures (BEST, 2009). In the period from 1961
to 2005, an overall increase of 0.9°C was observed. Projections for changes in temperature and rainfall
throughout the country are similar to what is projected for other Caribbean countries (McSweeney, New
and Lizcano, 2011). There are several regions in Belize which are somewhat uniform in physical
characteristics and as thus will be examined separately.
The northern region is projected to experience a decrease in precipitation which would put more stress on
the recharging of groundwater aquifers. This region also has less water resources and these are already
used extensively in agricultural irrigation of papaya and rice fields, as well as sugar (BEST, 2009). In this
region, rainfall is projected to increase by 3.8% in the 2015s and then fall to 1% below the baseline of 1971
- 2000. The dry season is projected to experience above normal runoff until the 2070’s and then a decrease
in runoff until the end of the century. It is projected that by 2080, the temperature in this region will
increase by 5.0°C over the baseline period from 1960 – 2005.
The central region is one of the most populated regions and similarly is projected to experience a decrease
in precipitation, which combined would lead to stresses on groundwater replenishment. Rainfall is
projected to fall by 18% below the baseline along the coast and by 23.1% below the baseline inland (BEST,
2009). The decrease in the average annual precipitation as compared to the 1971 - 2000 period, is
significantly lower in the central region as compared to the other regions (BEST 2009; UNDP Country
Report, 2011). This region is projected to also experience above normal water runoff for the remainder of
this century. Temperature trends are similar to the northern region, where temperatures are projected to
increase by 3.1°C by 2080 along the coastline and by 5.0°C above the baseline period of 1960 - 2005.

37
The southern region is projected to experience the least amount of adverse changes due to the fact that it
has the lowest population in the country and is also endowed with majority of the water resources. In this
region rainfall will initially fall by 16.9% and will continue decreasing to 18.3% by the 2080s (BEST, 2009).
With regards to temperature, this region will experience a cooling rather than a warming trend, but not a
very strong one.
Overall, Belize is projected to experience an increase in temperatures, a decrease in overall precipitation
events, but an increase in heavy precipitation events which would lead to more flooding events and reduce
water quality and availability (See Climate Modelling Section).
The NMS which is responsible for doing the research on drought conditions, reports that the GOB has not
adopted a definition for drought. However, droughts can be described as ‘extensions or intensifications of
the dry seasons when rainfall is unusually low or delayed’ (Green 2000, pg 11). The United Nations
Convention to Combat Desertification (UNCCD), in their first national report with Belize used three various
categories for drought depending on the existing conditions (Green, 2000). These categories are as follows:
“(i) Atmospheric drought is a condition, occurring over a wide area, where there is a significant decrease of
precipitation from the climatologically expected normal, such that natural vegetation does not flourish and
agricultural crops fail.
(ii) Agricultural drought occurs when the available soil moisture at the root zone during the growing season is
inadequate for healthy crop growth and causes extreme water stress. Non-irrigated crops decrease in yields.
(iii) Hydrological drought is associated with long-duration periods of low discharge insufficient to meet the
demand of specific users. This situation leads to water quality degradation.” (Green 2000; pg 12)
In Belize droughts have become more common occurrences, though are not considered epidemic yet
(Green, 2000). Historically, Belize has experienced several periods of drought. The two notable drought
events were in 1975 and in 2004/2005 (BEST, 2009). However, as discussed above, there has been an
increase in temperatures, causing heat waves and drought conditions which have negatively affected
agriculture, livestock and the availability of potable water (BEST, 2009). In 1998, surface and groundwater
sources were recorded to be below average and since 2003 (2001 in some regions) rainfall has been
recorded as being below average (ECLAC, 2006).
The impacts of the drought in 1975 resulted in loss of agriculture, loss of cattle and the reduced availability
of potable water. The drought in 2004/2005 had severely stronger impacts. Rainfall was recorded at 20% to
30% below average, particularly in the northern regions (BEST, 2009). The impacts resulted in low river
levels, increased water demand and sales, increase in electricity use for water production, decrease in
hydro power, increased water costs, higher operational costs, increased pumping costs and sever losses in
both the agriculture and livestock sectors (BEST, 2009).
In May of 2011, the NMS issued a drought report for the months of March, April and May (AT, 2011). This
most recent drought has had negative impacts particularly on the livestock industry, where farmers are
unable to find adequate water supplies and pastures to sustain them (7 News, 2011). With the start of the
rainy season and hurricane season, the threat of drought had been lifted, though severe economic losses
were still felt throughout the country, particularly by rural cattle farmers (7 News, 2011).
As demand increases and population continues to grow this will result in an increased stress on water
availability. An increase in population will also increase demand in food and thus agricultural growth, which
has been shown to contribute to drought incidences.

38
Seawater intrusion of ground water resources
Coastal aquifers are threatened by seawater intrusion with rising sea levels, exacerbated by a decrease in
groundwater recharge through over-abstraction and decreasing precipitation (Lewsey et al., 2004; Bates et
al. 2008; Werner and Simmons, 2009). A rise in sea level as low as 0.1 m may cause a decrease in aquifer
thickness of more than 10 m (Bobba et al., 2002) leading to substantial declines in freshwater availability.
Reductions in groundwater recharge to inland aquifers can also lead to seawater intrusion if they are next
to saline aquifers (Chen et al., 2004), indicating a potential knock-on effect where coastal aquifers become
saline due to SLR, then neighbouring aquifers experience saltwater intrusion during dry periods with low
groundwater recharge. With global average sea levels found to be rising at a rate of 1.8 ± 0.3 mm per year
(White et al., 2005) and with rates increasing (Church and White, 2006), coastal aquifers may be severely
impacted by saltwater intrusion and many countries may lose vital water resources. Storm surges from
hurricanes can cause extensive damage to aquifers (Anderson, 2002), the risk of which will increase as
higher sea-levels reduce the level of the storm-surge required for contamination to occur. In the Caribbean,
sea levels have been observed to have risen between 1.5 and 3 mm per year (see Climate Modelling
Section). Factors which increase the vulnerability of aquifers to saline intrusion include (i) their proximity to
the sea, (ii) increasing abstractions due to rising demand from domestic, agricultural and industrial uses
(Karanjac, 2004) and (iii) declining groundwater recharge through reduced precipitation or an increased
proportion of surface runoff through precipitation occurring in higher-intensity, shorter-duration events
(Bates et al., 2008) or decreased infiltration of water through land-cover changes agriculture (Scanlon et al.,
2005; Zhang and Schilling, 2006).
In Belize, the distribution of all wells that have been drilled or dug out by hand is unknown (FAO, 2000;
BEST, 2009). The only well distribution that is known and updated is that of the BWS. There is a lack of
coordination between the BWS and the local village water boards, of which there approximately 90 and
thus no concrete number exists (BEST, 2009; Mustafa and Reeder, 2009). Under the village board, the
households are usually charged a flat rate per month as these are not often metered. If there is no access
to piped water service, or no local provider, then the water is accessed using hand pumps (BEST, 2009).
The importance of groundwater is significant: 95% of rural communities depend on groundwater as their
primary source of freshwater. In the cities of Corozal, Orange Walk, Cayo and the Toledo Districts,
groundwater is also used as a source of drinking water (Tollner, 2007). Groundwater is mainly used for
residential or industrial purposes (such as bottled water companies, irrigation for certain crops) and does
not make up large percentage of the overall water used (BEST, 2009). The total amount of groundwater
available has not been quantified and thus it is not clear what percentage of total water supply this
amounts to (BEST, 2009).
The mean annual rainfall in Belize has decreased by an average rate of 3.1 mm per month every decade
since 1960 (McSweeney, New and Lizcano, 2011). In general, rainfall has been below average in all regions
since 2003 (ECLAC, 2006). This has resulted in water deficits for many economic activities such as
agriculture and industry (ECLAC, 2006). When rainfall is decreased, groundwater aquifers as well as surface
water are stressed and do not replenish at the rates necessary to support demand which results in reduced
recharge (ECLAC, 2006). During drought periods, such as the 2004 - 2005 drought, demand for water
increased due to higher air temperatures. This was met by an increase in hours and cost of operation of its
plants, while no rationing was put in place, deepening the water stress felt by groundwater and surface
waters (ECLAC, 2006).
Groundwater has been declining steadily in recent years, due to several factors. Some of these factors
include intensive uses of water resources by sectors such as agriculture and industry and a growing tourist
39
industry (BEST, 2009). However, the amount of decline has not been quantified as it is unclear what the
extent of underground aquifers is (ECLAC, 2006; BEST, 2009). In groundwater aquifers that are in use,
particularly in coastal aquifers, issues of over-abstraction are important to take into account. Groundwater
sources are reported to be low during dry season, which leads to an increase in the possibility of salt water
intrusion and thus the up taking of brackish water rather than freshwater.
Belize has over 220 kilometres of coastline, most of it low lying and on average less than 30 cm above sea
level (Neal et al., 2007). Beaches, cayes and low lying areas are at risk from SLR which could lead to salt
water intrusion in underground aquifers, particularly in cayes that use groundwater sources (Neal et al.,
2007; BEST, 2009). The northern half and the majority of the southern half of the country are flat low lying
areas (NMS, 2011). The northern half is also highly populated and has a large agricultural sector. Also of
importance to coastlines, is that large sections are at elevations of less than 1 meter that go inland several
miles (NMS, 2011). This poses a risk to populations in these areas, as well as water quality issues in the
event that open sewers are inundated (BEST, 2009). Belize City is situated in a low lying area and already
experiences flooding at spring high tides, putting it at a higher risk of contamination of its water both
through salt water intrusion as well as risk of contamination through sewers (BEST, 2009). It is also
important to note that approximately 38% of the population is situated on or near the coast and cayes
(Neal et al., 2007). The tourism industry also has recently developed mainly on the coast or the cayes,
making SLR an issue that would also threaten this industry (Neal et al., 2007).
Irrigation efficiency in the agriculture sector
Globally, agricultural water use comprises around 70% of total water extractions (Wisser et al., 2008) yet, in
the drier, warmer environment expected under climate change in the Caribbean, irrigation water demand
is likely to increase, exacerbating the effects of decreases in water availability (Döll, 2002). Increased
evaporative demands under climate change may lead to reductions in irrigation efficiency (Fischer et al.,
2007). Careful consideration will need to be given to efficient irrigation practices and technology to reduce
wastage and increase the amount of water reaching the crop, estimated to be as low as 40% worldwide
(Pimentel et al., 1997).
Irrigation is generally not used extensively, due to generally adequate levels of precipitation (BEST, 2009).
The irrigation of rice, papayas and sugar is intensive in the northern regions of Belize (BEST, 2009). There is
however, no data on irrigation and thus it is not known what amount of water goes into this sector (BEST,
2009). Surface waters are the main sources of irrigation use, though groundwater and rain water can also
be used in times of drought, or if surface water is not available nearby (Green, 2000; BEST, 2009).
Agriculture, as previously mentioned, is one of the biggest contributions to water demand at 43.7 %
(Green, 2000; BEST, 2009). The majority of this demand stems from the intensive agriculture practices in
the northern regions. This is significant since this region also has less water resources and it is projected to
have a decrease in rainfall. This will increase the threat to the already overused water resources and could
create potentially further problems of over-extraction. The northern region has river systems that are more
estuarine in nature and therefore may contain more brackish water which would be inadequate for
irrigation purposes.
Due to the above conditions, it is therefore necessary for the northern region to find alternate means of
irrigation and particularly to have the amount of water used for irrigation quantified in order that this be
monitored more closely (Green, 2000).

40
There does not exist a fully operating central administration for water resources management (BEST, 2009).
Because of this main issue, financial resources for water management have been minimal and have been
focused on the delivery end primarily for residential/domestic use (BEST, 2009).
Flooding
Intense rainfall from storm events may only last a few hours, but can result in serious rapid-onset flooding,
particularly when they occur in catchments that are small, steep or highly urbanised, as is the case in the
much of the Caribbean region. Floods are a particular problem for water resources because, aside from the
potential for loss of life and property, they can affect water quality and have implications for sanitation and
cause serious soil erosion. Flooding erodes topsoil along with animal waste, faeces, pesticides, fertilizers,
sewage and garbage, which may then contaminate groundwater sources as well as marine areas. Erosion
may lead to the formation and deepening of gullies which, if they develop in hill slope areas with temporary
water tables, may lead to enhanced drainage leading to groundwater discharge (Poesen, 2003).
While GCM modelling projections indicate an overall tendency for decreases in overall precipitation across
the Caribbean region (see Climate Modelling Section), excluded from these projections is the potential of
an increase in the frequency and intensity of storm events with associated heavy rainfall (Frei et al., 1998;
Min et al., 2011), including those associated with hurricanes. Research by Emanuel (2005) shows a strong
correlation between hurricane size and sea surface temperature, suggesting an upward trend in hurricane
destructive potential. Statistical analysis (Trenberth, 2005) and modelling (Knutson and Tuleya, 2004)
suggest that hurricane intensity will increase, with the north Atlantic Ocean in particular showing an
increasing trend in storm frequency (Deo et al., 2011).
Between 1980 and 2007, Belize experienced five hurricanes and three tropical storms, two of which were
category 3, as well as the threat of two stronger hurricanes of category 5 (BEST, 2009). It has been noted by
NMS that tropical storms and hurricanes affect the country once every three years (NMS, 2011). Belize City,
which was formerly the capital city, was moved to Belmopan after being destroyed twice by strong
hurricanes in the 20th Century. Tropical storms and hurricanes can hit anywhere, but most often hit the
northern region (NMS, 2011).
Belize has experienced recurrent flooding, particularly during the wet season or from the passing of tropical
storms (BEST, 2009). Due to the recent changes in climate, it has been forecasted that Belize will
experience a higher number of extreme tropical storms leading and higher overall rainfall, both of which
will lead to frequent flooding events (BEST, 2009). As previously described, much of the northern and
southern coastal areas, all of the islands and cayes, as well as several miles inland are flat low lying areas
(NMS, 2011). This puts a considerable amount of land area at risk of frequent flooding. Most of the flooding
experienced in Belize is either due to high precipitation levels or to tropical waves, depressions or storms
(NMS, 2011). High precipitation levels in a short period of time are common during the wet season (May to
November). This often leads to flooding and is often a result of tropical systems passing through. These can
also create storm surges that flood cayes, islands and low lying coastal areas (NMS, 2011). Annual floods
cause significant losses in the agriculture, livestock and transportation infrastructure sector (ECLAC, 2006).
Flooding in Belize has been known to affect the water availability and quality (BEST, 2009). Storm surges
can contaminate surface and groundwater wells through saltwater intrusion (BEST, 2009). Outdoor latrines
can also overflow during flooding events and can contaminate various water sources (WMB, 2011). It is
however unknown what the full impact on water quality is during flood events since there is no
comprehensive water quality monitoring program in place (BEST, 2011).
41
The Hydromet office located at the NMS is the primary office responsible for the flood warning system in
Belize, along with the National Emergency Management Organization (http://www.nemo.org.bz/; NMS,
2011). Flood warnings are broadcasted on the national radio and television, as well as being updated on the
NMS website (NMS, 2011). NEMO is “established to preserve life and property throughout the country of
Belize in the event of an emergency, threatened or real” (NEMO, 2011) and is thus not in charge of the
warning system, but is in charge of providing guidelines for hurricane preparedness and providing shelters
when required (NEMO, 2011).

42
4.2. Energy Supply and Distribution
4.2.1. Background
A global perspective
Tourism is a significant user of energy and a concomitant contributor to emissions of greenhouse gases. In
various national comparisons, tourism has been identified as one of the most energy-intense sectors, which
moreover is largely dependent on fossil fuels (e.g. Gössling et al., 2005; Gössling 2010). Likewise, the
growing energy intensity of economies in the Caribbean has caused concern among researchers (e.g.
Francis et al., 2007).
Globally, tourism causes 5% of emissions of CO2, the most relevant greenhouse gas. Considering the
radiative forcing of all greenhouse gases, tourism’s contribution to global warming increases to 5.2 - 12.5%
(Scott et al., 2010). The higher share is a result of emissions of nitrous oxides (NOx) as well as water leading
to the formation of aviation-induced clouds (AIC), which cause additional radiative forcing. The range in the
estimate is primarily attributed to uncertainties regarding the role of AIC in trapping heat (Lee et al., 2009).
Aviation is consequently the most important tourism-subsector in terms of its impact on climate change,
accounting for at least 40% (CO2) of the contribution made by tourism to climate change. This is followed
by cars (32% of CO2), accommodation (21%), activities (4%) and other transport (3%), notably cruise ships
(1.5%).
In the future to 2050, emissions from tourism are expected to grow considerably. Based on a business-as-
usual scenario for 2035, which considers changes in travel frequency, length of stay, travel distance and
technological efficiency gains, UNWTO-UNEP-WMO (2008) estimate that emissions will increase by about
135% compared to 2005. Similar figures have been presented by the World Economic Forum (WEF, 2009).
Aviation will remain the most important emissions sub-sector of the tourism system, with expected
emission growth by a factor 2-3. As global climate policy will seek to achieve considerable emission
reductions in the order of 50% of 1990 emission levels by 2050, aviation and tourism more generally, will
be in stark conflict with achieving global climate goals, possibly accounting for a large share of the
sustainable emissions budget, Figure 4.2.1.

43
Lines A and B in Figure 4.2.1: represent emission pathways for the global economy under a -3% per year (A) and -6% per year (B) emission reduction scenario, with emissions peaking in 2015 (A) and 2025 (B) respectively. Both scenarios are based on the objective of avoiding a +2°C warming threshold by 2100 (for details see Scott et al. 2010). As indicated, a business-as-usual scenario in tourism, considering current trends in energy efficiency gains, would lead to rapid growth in emissions from the sector (line C). By 2060, the tourism sector would account for emissions exceeding the emissions budget for the entire global economy (intersection of line C with line A or B).
Figure 4.2.1: Global CO2 emission pathways versus unrestricted tourism emissions growth. (Source: Scott et al., 2010)
Achieving emission reductions in tourism in line with global climate policy will consequently demand
considerable changes in the tourism system, with a reduction in overall energy use and a switch to
renewable energy sources. Such efforts will have to be supported through technology change, carbon
management, climate policy, behavioural change, education and research (Gössling, 2010). Carbon taxes
and emissions trading are generally seen as key mechanisms to achieve emissions reductions. Destinations
and tourism stakeholders consequently need to engage in planning for a low-carbon future.
The Caribbean perspective
It is widely acknowledged that the Caribbean accounts for only 0.2% of global emissions of CO2, with a
population of 40 million, i.e. 0.6% of the world’s population (Dulal et al., 2009). Within the region,
emissions are however highly unequally distributed between countries, Figure 4.2.2. For instance, Trinidad
& Tobago, as an oil producing country, has annual per capita emissions reaching those of high emitters such
as the A (25 t CO2). The Cayman Islands (7 t CO2 per capita per year) are emitting in the same order as
countries such as Sweden. Belize is, so far, emitting considerably less (with emissions of 873,583 t CO2 in
2009, the population of 312,698 caused average per capita emissions of 3.1 t CO2) on a per capita basis
than the world annual average of 4.3 t CO2. In the future, global emissions have to decline considerably
below 4.3 t CO2 per year, the Intergovernmental Panel on Climate Change (IPCC) suggests a decline in
emissions by 20% by 2020 (IPCC, 2007b), corresponding to about 3 t CO2 per capita per year, a figure that
also considers global population growth. While there is consequently room for many countries in the region
to increase per capita emissions, including in particular Haiti, many of the more developed countries in the

44
Caribbean will need to adjust per capita emissions budgets downwards, i.e. reduce national emissions in
the medium-term future. Belize’s current emissions would be in line with this medium-term goal.
Figure 4.2.2: Per capita emissions of CO2 in selected countries in the Caribbean, 2005 (Source: Hall et al. 2009)
Important in the context of this report is that in most Caribbean countries, tourism is a major contributor to
emissions of greenhouse gases (Simpson et al., 2008; see also country reports in the Risk Atlas). As these
emissions are not usually quantified, however, the purpose of this assessment is to look in greater detail
into energy use by sector.
4.2.2. Belize
In 2003, the National Energy Plan Project found that Belize’s energy system is based on four main sources:
imported fossil fuels (66%); biomass (traditional biomass and bagasse; 26%); hydropower (3%); and
imported electricity (5%; Figure 4.2.3) (Public Utilities Commission, 2003a). Crude oil production in Belize
was recently established owing to the discovery of commercial quantities in 2005, however most of the
traditional fuel used is imported, Table 4.2.1. Exploration and production of crude oil (and gas) is managed
by Belize Natural Energy Ltd. (Belize Natural Energy Ltd., 2010). According to CIPORE (2009), Belize is one of
two oil-producing countries in Central America and averaged crude oil production of approximately 2,500
barrels per day for most of 2006. The main petroleum based sub-products are gasoline, kerosene and diesel
(Public Utilities Commission, 2003a). With regard to energy use, most is used for transport (57%), followed
by the industrial and commercial sector (22%) and residential uses (20%; Figure 4.2.3). Table 4.2.1 further
details primary energy use.
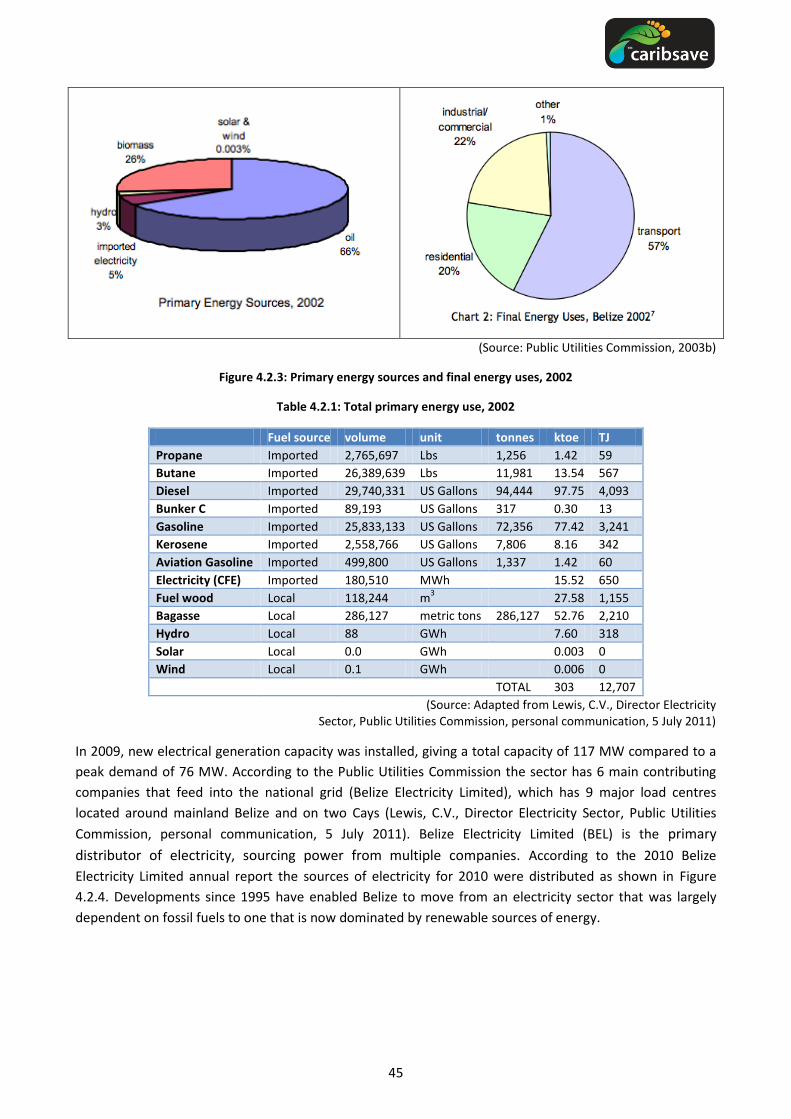
45
(Source: Public Utilities Commission, 2003b)
Figure 4.2.3: Primary energy sources and final energy uses, 2002
Table 4.2.1: Total primary energy use, 2002
Fuel source volume unit tonnes ktoe TJ
Propane Imported 2,765,697 Lbs 1,256 1.42 59
Butane Imported 26,389,639 Lbs 11,981 13.54 567
Diesel Imported 29,740,331 US Gallons 94,444 97.75 4,093
Bunker C Imported 89,193 US Gallons 317 0.30 13
Gasoline Imported 25,833,133 US Gallons 72,356 77.42 3,241
Kerosene Imported 2,558,766 US Gallons 7,806 8.16 342
Aviation Gasoline Imported 499,800 US Gallons 1,337 1.42 60
Electricity (CFE) Imported 180,510 MWh 15.52 650
Fuel wood Local 118,244 m3 27.58 1,155
Bagasse Local 286,127 metric tons 286,127 52.76 2,210
Hydro Local 88 GWh 7.60 318
Solar Local 0.0 GWh 0.003 0
Wind Local 0.1 GWh 0.006 0
TOTAL 303 12,707
(Source: Adapted from Lewis, C.V., Director Electricity Sector, Public Utilities Commission, personal communication, 5 July 2011)
In 2009, new electrical generation capacity was installed, giving a total capacity of 117 MW compared to a
peak demand of 76 MW. According to the Public Utilities Commission the sector has 6 main contributing
companies that feed into the national grid (Belize Electricity Limited), which has 9 major load centres
located around mainland Belize and on two Cays (Lewis, C.V., Director Electricity Sector, Public Utilities
Commission, personal communication, 5 July 2011). Belize Electricity Limited (BEL) is the primary
distributor of electricity, sourcing power from multiple companies. According to the 2010 Belize
Electricity Limited annual report the sources of electricity for 2010 were distributed as shown in Figure
4.2.4. Developments since 1995 have enabled Belize to move from an electricity sector that was largely
dependent on fossil fuels to one that is now dominated by renewable sources of energy.

46
Figure 4.2.4: Distribution of electricity providers 2010
(Based on data in BEL, 2011)
BECOL is a hydro-electricity facility in the west of Belize with three separate components: the Mollejon
Generating Facility was built between 1992/5 and is a run-of-river facility with three 8.25 MW units; the
Chalillo Dam was built later between 2002/5 to provide storage for Mollejon and also includes a 7 MW unit
at the toe of the dam; the Vaca run-of-the-river plant is approximately three miles downstream of the
Mollejon hydroelectric facility on the Macal River. The 19 MW VACA generating facility was started in
2007 and was completed in March 2010 (BEL, 2009; BEL, 2011). Comisión Federal de Electricidad (CFE
Mexico) has been feeding into the grid in the north for several years, but in 2009 cancelled the Firm Power
Purchase Agreement with BEL, as a result of limited generation capacity. They continue to supply BEL with
power as available (approximately 50% of CFE generation is from fossil fuel). Belize Cogeneration Energy
Limited (BELCOGEN) is a 13.5 MW bagasse to energy facility that was established with the support of a
number of financial institutions, including the Caribbean Development Bank, the Dutch Development Bank
and the Inter-American Investment Corporation (IIC) of the Inter-American Development Bank (CIPORE,
2009). Hydro Maya is a 3 MW run-of-river facility located in Toledo and connected to the National Grid.
Belize Aquaculture Limited’s (BAL) heavy fuel oil-fired generating plant, located in the Stann Creek District,
was interconnected in April 2009 and is providing backup power to improve system reliability and reduce
transmission losses. It supplies up to 15 MW to the National Grid and uses the remaining 7 MW for a Fish
Farm. BAL ceased generation of power in April 2010, due to fuel supply issues and only supplied 4.5
GWh in 2010 as compared to 48.8 GWh in 2009. BEL also has generating capacity of 34 MW with a 22
MW diesel powered gas turbine located 8 miles west of Belize City that was intended for black start,
emergency and peaking coverage. The use is kept low, because operating costs are high (most expensive
source in 2010). They also have a few other diesel units for emergency and standby use (BEL, 2009; 2011)
Trends in the energy sector
As shown in Table 4.2.2, there has been continuous growth in fossil fuel consumption in Belize, from 2,216
bbls per day in 1990, to about 7,250 bbls per day in 2009. Corresponding emissions have grown from
313,000 t CO2 in 1990 to 994,000 t CO2 in 2008. There has been a decline in fuel use (and emissions) from
2008 to 2009, which may be a result of the global financial crisis or a reflection of the increased role played
1% 1%
3%
10%
33%
52%
BAL
BEL
Hydro Maya
Belcogen
CFE
BECOL
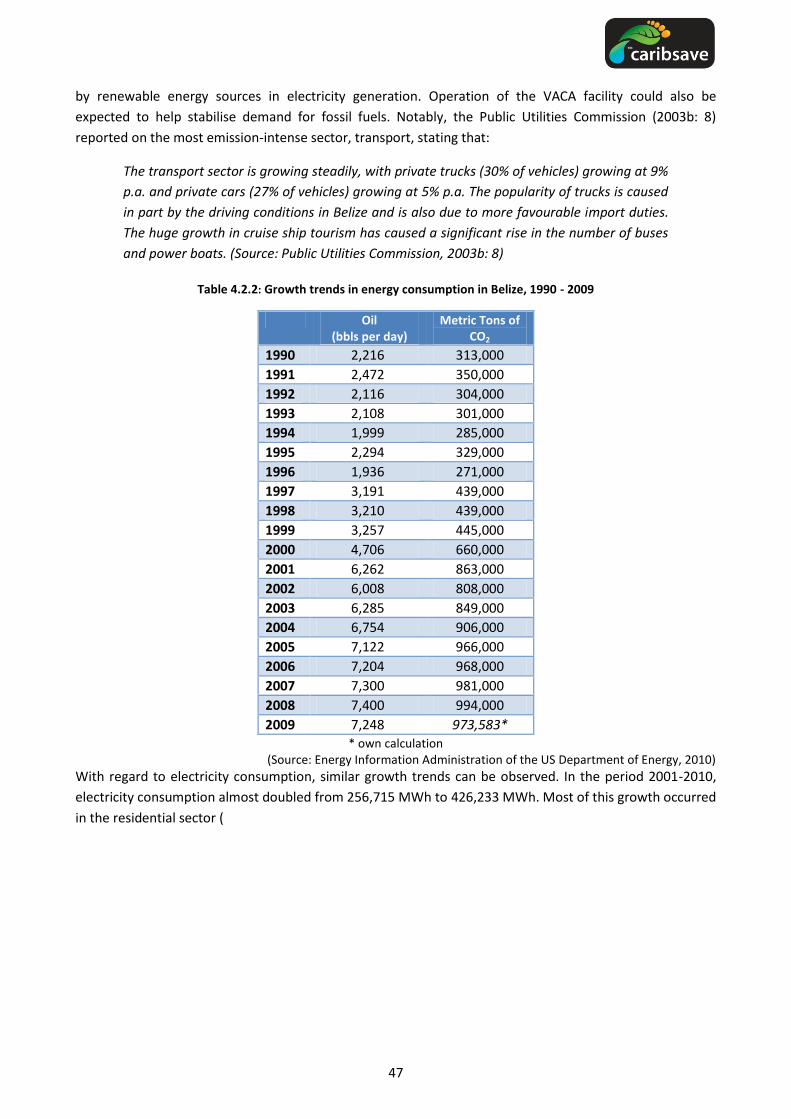
47
by renewable energy sources in electricity generation. Operation of the VACA facility could also be
expected to help stabilise demand for fossil fuels. Notably, the Public Utilities Commission (2003b: 8)
reported on the most emission-intense sector, transport, stating that:
The transport sector is growing steadily, with private trucks (30% of vehicles) growing at 9%
p.a. and private cars (27% of vehicles) growing at 5% p.a. The popularity of trucks is caused
in part by the driving conditions in Belize and is also due to more favourable import duties.
The huge growth in cruise ship tourism has caused a significant rise in the number of buses
and power boats. (Source: Public Utilities Commission, 2003b: 8)
Table 4.2.2: Growth trends in energy consumption in Belize, 1990 - 2009
Oil (bbls per day)
Metric Tons of CO2
1990 2,216 313,000
1991 2,472 350,000
1992 2,116 304,000
1993 2,108 301,000
1994 1,999 285,000
1995 2,294 329,000
1996 1,936 271,000
1997 3,191 439,000
1998 3,210 439,000
1999 3,257 445,000
2000 4,706 660,000
2001 6,262 863,000
2002 6,008 808,000
2003 6,285 849,000
2004 6,754 906,000
2005 7,122 966,000
2006 7,204 968,000
2007 7,300 981,000
2008 7,400 994,000
2009 7,248 973,583* * own calculation
(Source: Energy Information Administration of the US Department of Energy, 2010)
With regard to electricity consumption, similar growth trends can be observed. In the period 2001-2010,
electricity consumption almost doubled from 256,715 MWh to 426,233 MWh. Most of this growth occurred
in the residential sector (

48
Table 4.2.3).
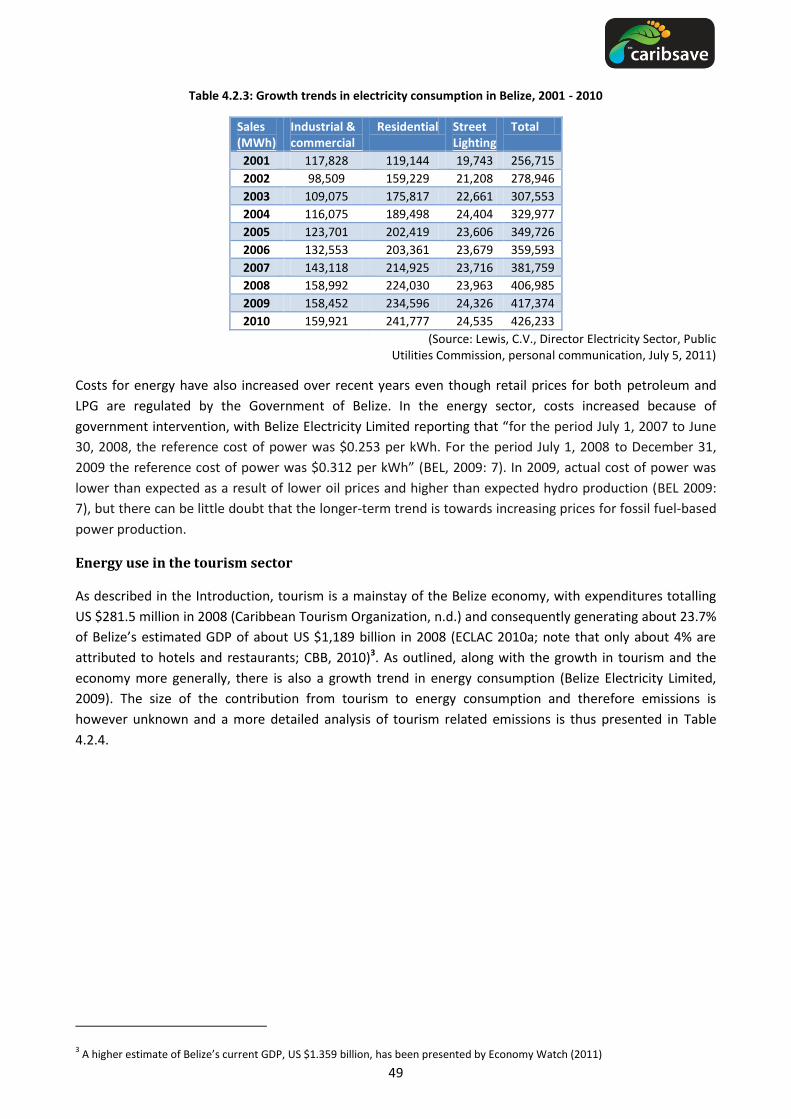
49
Table 4.2.3: Growth trends in electricity consumption in Belize, 2001 - 2010
Sales (MWh)
Industrial & commercial
Residential Street Lighting
Total
2001 117,828 119,144 19,743 256,715
2002 98,509 159,229 21,208 278,946
2003 109,075 175,817 22,661 307,553
2004 116,075 189,498 24,404 329,977
2005 123,701 202,419 23,606 349,726
2006 132,553 203,361 23,679 359,593
2007 143,118 214,925 23,716 381,759
2008 158,992 224,030 23,963 406,985
2009 158,452 234,596 24,326 417,374
2010 159,921 241,777 24,535 426,233
(Source: Lewis, C.V., Director Electricity Sector, Public Utilities Commission, personal communication, July 5, 2011)
Costs for energy have also increased over recent years even though retail prices for both petroleum and
LPG are regulated by the Government of Belize. In the energy sector, costs increased because of
government intervention, with Belize Electricity Limited reporting that “for the period July 1, 2007 to June
30, 2008, the reference cost of power was $0.253 per kWh. For the period July 1, 2008 to December 31,
2009 the reference cost of power was $0.312 per kWh” (BEL, 2009: 7). In 2009, actual cost of power was
lower than expected as a result of lower oil prices and higher than expected hydro production (BEL 2009:
7), but there can be little doubt that the longer-term trend is towards increasing prices for fossil fuel-based
power production.
Energy use in the tourism sector
As described in the Introduction, tourism is a mainstay of the Belize economy, with expenditures totalling
US $281.5 million in 2008 (Caribbean Tourism Organization, n.d.) and consequently generating about 23.7%
of Belize’s estimated GDP of about US $1,189 billion in 2008 (ECLAC 2010a; note that only about 4% are
attributed to hotels and restaurants; CBB, 2010)3. As outlined, along with the growth in tourism and the
economy more generally, there is also a growth trend in energy consumption (Belize Electricity Limited,
2009). The size of the contribution from tourism to energy consumption and therefore emissions is
however unknown and a more detailed analysis of tourism related emissions is thus presented in Table
4.2.4.
3 A higher estimate of Belize’s current GDP, US $1.359 billion, has been presented by Economy Watch (2011)

50
Table 4.2.4: Assessment of CO2 emissions from tourism in Belize, 2009
Tourism sub-sector
Energy use Emissions % Assumptions
Aviation1) Road transport2)
Cruise ships3)
Accommodation4)
Activities5)
31,494 t fuel 1,452 t fuel
37,244 t fuel
35,8MWh -
99,206 t CO2
4,648 t CO2
119,182 t CO2
35,787 t CO2
6,274 t CO2
33 2 39 12 2
Bottom-up analysis based on main markets Including tourists, not day visitors Bunkers for cruise ships, bottom-up approach Based on energy statistics from Barbados Global average
Sub-total 265,097 t CO2 87
Indirect energy use (factor 1.15)
39,765 t CO2 15 To account for life-cycle emissions
Total 304,862 CO2 100 1) As it is unknown which volumes of aviation fuels are imported by Belize, a bottom-up analysis is here
presented based on the major markets, which include the USA (60.1%; New York, one-way distance 2,962 km), Canada (7.4%; Montreal, one-way distance 3,453 km), Europe (12.7%; London, one-way distance 8,406 km), other (19.8%, assumed one-way distance 2,000 km, due to a considerable share of cross-border arrivals). With 232,383 international arrivals, total emissions would be in the order of 198,413 t CO2 (2 x 2962 pkm (return) x 139,662 x 0.122 kg CO2 = 100,938 t CO2 – USA, plus 2 x 3,453 pkm x 17,196 x 0.122 kg CO2 = 14,488 t CO2 – Canada, plus 2 x 8,406 x 29,513 x 0.122 kg CO2= 60,533 t CO2– Europe, plus 2 x 2,000 km x 46,012 x 0.122 kg CO2= 22,454 t CO2–other).In a bunker-fuel approach, about half of this would fall on Belize, i.e. half of the fuel use and emissions associated with the tourism system of the country. Emissions are consequently in the order of 99,206 t CO2, corresponding to a fuel use of about 31,494 t.
2) Road Transport: 232,383international tourist arrivals in 2009 (Caribbean Tourism Organization, n.d.) with each tourist travelling an assumed 150 pkm in Belize during the stay. At an assumed average of 0.133 kg CO2 per pkm (50% occupancy rate; UNWTO-UNEP-WMO, 2008), emissions are in the order of 20 kg CO2 (corresponding to about 8 l of diesel) per tourist, totalling 4,648t CO2, or about 1,452t of fuel. Cruise tourists are not included, as these are day visitors not likely to engage in longer trips.
3) On the basis of the number of cruise passengers arriving to Belize (705,129 in 2009), emissions from cruise tourism would be in the order of 119,182 t CO2 – using the standard per day value (global average) of 169 kg CO2 per passenger (Eijgelaar et al., 2010).
4) According to a study carried out in Barbados in 2010, hotels (n=22) used on average 22 kWh of energy per guest night. This value is also used for Belize. In the absence of any data on average length of stay, an average of 7 days is assumed here as the basis for calculation, i.e. considering that many arrivals may be shorter because of options to access the country on land. The 232,383 tourists would consequently have stayed a total of 1.627 million nights, with a corresponding energy use of 35.8 MWh. Electricity production is assumed to be less efficient in Belize and a value of 1 kg CO2 per kWh is assumed here, resulting in emissions of 35,787 t CO2. It is unknown, however, whether there is additional significant electricity production in self-sustained hotels on the basis of generators.
5) Activities are included with the global assumption of 27 kg CO2 per tourist, as provided in UNWTO-UNEP-WMO, 2008. Given the energy-intense character of many activities in tropical environments, including boat trips, scenic drives, helicopter flights, diving, the use of jet skis, or water skiing, this value may be conservative. The 232,383 tourists would thus have caused emissions from activities corresponding to 6,274 t CO2. As energy use for activities will be partially fossil fuel and partly electricity based, it is difficult to translate these values into energy use.
(Source: DEFRA, 2010; UNWTO-UNEP-WMO, 2008; UNWTO, 2010)
Results indicate that emissions from tourism accounted for 304,862 t CO2 in 2009. In comparison to
national emissions of 973,583 t CO2, emissions caused by the tourism system are responsible for the
equivalent of about 31% of national emissions (a share of these emissions is accounted for in both national
economy and tourism-system estimates and an exact comparison is therefore difficult).
National energy policy and initiatives
Belize does not have an established Energy Policy, but in 2003, a review by the Public Utilities Commission
concluded that:
51
Given the current energy mix (imports 71%, indigenous 29%), energy security and improving
energy autarky should be significant issues for policymakers:
Belize does not have a formally stated energy sector strategy nor policy, although
an argument could be made that there is an implicit one;
The current electricity mix with 50% imported from Mexico is not sustainable given
that demand is growing at 9% p.a. The Mexican supply is currently limited and if
additional supply can be negotiated (under a new contract) it is likely to be
significantly more expensive;
The use of renewable energies is technically, environmentally and economically
feasible and given the exigencies of the internal and external environment, is highly
recommended;
There are barriers to the use of Renewable Energy Technologies and to the
development and implementation of a formal energy policy;
Policymakers cannot afford to disregard regional and international agreements and
the significance of existing and future commitments (particularly in trade) to the
development of the energy sector;
Belize needs to take immediate and decisive action if it is to comfortably meet
electricity and energy demand forecasts without increasing its vulnerability and/or
compromising its future development;
(Source: Public Utilities Commission, 2003a:7)
The Public Utilities Commission (2003b) also made policy recommendations of great relevance for the
development of a national energy policy:
1. Energy Policy, Coordination and Oversight
Develop a comprehensive National Energy Policy, using a multi- stakeholder
dialogue process.
Mandate within the policy that a 10-12 year National Energy Implementation Plan
be created (and regularly updated) detailing potential energy sources and
technologies, timescales and investments required to service Belize’s growing
energy demands in a sustainable manner.
An Office of Energy should be created under the Office of the Prime Minister, within
the Government of Belize, with responsibility for the oversight and planning of the
Government’s approach on energy issues. The Office would be responsible for the
National Energy Policy and Implementation Plan and for overseeing and
coordinating their implementation within the various Government Departments.
The Office of Energy should be staffed with technically qualified personnel and
advised by a multi-sectoral committee of energy stakeholders from industry and
civil society.
Energy data should be collected and analysed on a regular basis and a national
energy balance produced annually for supply to regional and world energy
organisations. The responsibility for energy data should be placed with the Office of
Energy.
Identify regional energy networks and initiatives that have potential benefit to
Belize (such as the Caribbean Energy Efficiency Development Project (DEEPC), the
Caribbean Renewable Energy Development Project (CREDP), the Finnish

52
Government’s Energy and Environment Partnership with Central America, the
Caribbean Energy Information System (CEIS), the Latin American Energy
Organization (OLADE) and the Biomass Users Network in Central America (BUN-
CA)). Proactively participate, by ensuring qualified personnel attend meetings and
liase with the secretariats and project managers.
2. Fossil Fuels
Petroleum exploration and development in Belize should continue to be supported
and encouraged, in an environmentally sound manner; as a potential source of
revenue and a national supply of fuel which translates to increased fuel security,
fuel price stability and a reduction in foreign currency requirements.
A single grade of unleaded gasoline should be used in order to achieve volume
purchase benefits and to realize cost savings from the consolidation of storage and
supply. These savings should be used to reduce the consumer price of fuel (with the
legislated price formula adjusted accordingly).
Considering the negative impact of illegal fuel sales, these sales should be stopped
(through diligent policing) in order to reduce the fuel tax burden on the customers
of legal supplies.
3. Transport
The use of fuel-efficient vehicles should be encouraged, for example through
incentives to promote the importation of newer, small-engine, more fuel efficient
vehicles. At the same time a public awareness campaign should be conducted on
the benefits of fuel economy.
Belize should initiate a programme of baseline pollution monitoring, so that
emissions and their impacts can be measured over time. On the basis of the
pollution monitoring, Belize should set emissions standards for motor vehicles and
should work towards emissions testing vehicles. The testing should be introduced in
a structured manner over an extended period of time, allowing the public and
relevant authorities to prepare. A public awareness campaign should be a key
element of the process.
The improvement of public (mass) transport should be encouraged (fuel economy,
emissions, quality of service) and the public should then be encouraged to use this
form of transport.
Conduct a study on the environmental impact of high speed power boats in Belize.
4. Electricity Services
Generation should continue to be unbundled and sourced through appropriate
competitive bidding procedures with oversight responsibility provided by the PUC.
Bids should continue to be evaluated using country specific evaluation criteria such
as seeking the lowest real electricity prices attainable, tempered as required by
environmental and social considerations.
53
Based on the comprehensive renewable energy resource assessment and the long
term projected generation requirements, establish a Renewable Energy Portfolio
Standard (RPS) as a target for the percentage of electricity that must be generated
using renewable sources and a minimum local generation standard for the
percentage of electricity that must be generated using local sources.
Develop generation plant standards, in addition to the Pollution Regulations and
the required Environmental Impact Assessment (EIA), which ensure that operations
comply with international environmental standards.
5. Renewable Energy Initiatives
Conduct renewable energy resource assessments for hydro, wind, biomass,
geothermal and solar energy and compile these into a single Renewable Energy
Resource Database for use in promoting Belize as a destination for renewable-
energy investments. The database should not only identify resources, but should
contain potential project proposals. An accompanying investor’s information pack
should be developed, targeted to local investors as a priority.
Design and initiate a national renewable energy education and awareness
programme aimed at all sectors of civil society, to communicate the overall goals of
the Government with respect to the country’s economic development, protection of
the environment and the links to and advantages of renewables. This programme
should include an extra curricular component, including activity development to
introduce energy issues to young people.
Establish a comprehensive renewable energy training initiative to compliment the
resources identified, with the purpose of increasing the capacity to develop and
utilise these resources among the utility staff and potential project developers. This
effort should be conducted in cooperation with other countries in the region, in
particular as part of the Caribbean Renewable Energy Development Project
(CREDP).
Where companies install and utilise renewable energy technologies in Belize, they
should be required to train local personnel at all levels in the management,
installation, operation and maintenance of the equipment.
Conduct a gender and culture sensitive analysis on traditional biomass use. The
analysis should determine the impact of traditional biomass use on human health,
the environment and the economy. In particular, the issues of deforestation and
health threats resulting from the use of fuel wood for cooking and small industry
should be examined. Recommendations should be made for energy patterns based,
in part, on the analysis (e.g. replacement of fuel wood with liquid petroleum gas,
biogas, etc.), or alternative options (such as the promotion of more efficient,
appropriate and culturally sensitive biomass technologies for cooking and the
replanting of fast growing, appropriate trees). The analysis should also contain long
term implementation plans, learning from previous initiatives conducted in rural
areas.
The logistics and feasibility of the creation of a dedicated renewable energy fund for
renewable energy project feasibility studies and for project investment should be
investigated.
A detailed knowledge of the Clean Development Mechanism (CDM) should be
developed centrally, as an advisory service to renewable energy project developers,

54
to ensure that Belize gains maximum benefit from the CDM and associated
initiatives.
Create a National Solar Water Heating Initiative. This would involve an awareness
programme to educate both the commercial and the residential sectors (especially
targeting the tourism industry), creating financial incentives for the purchase of
solar water heaters (e.g. tax rebates) and providing assistance to manufacturers
and vendors of solar water heaters to enter Belize’s marketplace.
Conduct an assessment of the potential for solar and wind pumps in rural water
systems. The assessment should cover total lifecycle cost and maintenance and
operational requirements.
Review available wind assessment reports to date and conduct an up-to-date
analysis of wind generation on Baldy Beacon. Based on this analysis conduct a pre-
feasibility study for a grid-connected wind farm.
Any benefits of using ethanol to reduce emissions, increase fuel security and
increase price stability, whilst utilizing and investing in the local agricultural
industry should be evaluated against the total cost of producing the ethanol and
adapting the existing gasoline infrastructure to accommodate an ethanol blend.
6. Energy Efficiency Initiatives
Implement a comprehensive energy efficiency training program for utility
personnel, hotel developers and engineers, potential entrepreneurs and other
relevant stakeholders.
The Belize Building Codes should be reviewed to include potential energy saving
design features.
Appliance importers should be educated about energy efficiency and encouraged to
import energy efficient appliances.
Design and initiate a national energy-efficiency education and awareness
programme aimed at all sectors of civil society, to communicate the overall goals of
the Government with respect to the country’s economic development, protection of
the environment and the links to and advantages of energy-efficiency. This
programme can be conducted in conjunction with the awareness programme on
renewable energy.
A study of energy end use practices in all sectors (public, commercial, residential,
etc.) of the economy should be conducted in collaboration with BEL and an
organisation experienced in conducting surveys. This study will highlight key
opportunities for energy savings.
A survey/analysis of the market potential for energy efficiency measures should be
undertaken. This will review generation and consumption patterns throughout
Belize in each of the key sectors. These analyses will be used in the design of
appropriate energy-efficiency measures and in efforts to attract entrepreneurial
initiatives focused on energy savings.
Incentives should be provided such as reduction in import duties for energy efficient
equipment (e.g. compact fluorescent bulbs) to encourage their importation and use.
Support the creation of Energy Service Companies (ESCOs) in Belize through
workshops, information provision and linkages to countries with ESCO experience.
55
Assess the potential for energy efficiency practices in all Government buildings.
Based on this assessment, develop a standards manual for use by all government
agencies describing recommended and/or required practices for existing and new
buildings and equipment. Conduct energy audits in all Government buildings.
(Source: Public Utilities Commission, 2003b)
Subsequently, a project was implemented called “Formulation of a National Energy Plan for Belize” as a
precursor to the crafting of the national energy policy, where a diagnostic study of the energy sector was
conducted and a document of policy recommendations was produced (Belize Public Utilities Commission,
2005). It is intended that these documents would guide and feed into the development of the National
Energy Policy. However, although CIPORE (2009) indicates that a draft policy has been completed, there
does not appear to be a copy of the draft online.
In 2006, in response to price cuts in sugar by major export markets, the Caribbean Development Bank (CDB)
and the Caribbean Renewable Energy Development Program (CREDP) within the Caribbean Community
Secretariat (CARICOM) developed a technical cooperation called “Expanding bio-fuel opportunities through
carbon finance in three Caribbean Countries – Jamaica, Barbados and Guyana” (CTA & IICA, 2007). The
objective was to analyse viable alternatives to conventional sugar production, such as bio-fuels,
cogeneration with bagasse and efficient sugar production. The assessment included a thorough review of
the state of the art bio-fuels in these three countries and the carbon finance opportunities that could be
obtained in relation to the possible bio-fuel projects. Specifically, the announcement of a target of a 20%
reduction of gasoline usage over the next 20 years in the US is seen as an opportunity for exports, as up to
7% of total US ethanol consumption can be imported without import duties. This corresponds to 340
million gallons per year and is expected to reach 525 million gallons by 2012, a threefold increase over the
current level of Caribbean ethanol exports to the US.
To achieve this goal, several steps are seen as necessary:
There has to be availability of raw material (i.e. sugarcane, cassava, sugar beet,
African palm, jatropha) at a competitive cost of production.
Use has to be made of the possibility to sell carbon credits derived from the
reductions of CO2 emissions, in response to mitigation of climate change in
compliance with the Kyoto Protocol.
The launching of the Caribbean, Renewable Energy, Energy Efficiency and Bioenergy
Action Program (CREBAP) must be followed up by governments, which need to
“establish targets, such as blending mandates or percentage of electricity
generation with renewable sources”.
(Source: CTA & IICA, 2007)
In 2009, the Organization of American States (2009) presented the results of a feasibility study on the
Cellulosic Ethanol Market Potential in Belize. The study concludes that there are considerable quantities of
biomass that could be used for ethanol production, with 1.4 million tons of cellulose feedstocks produced
in 2004 and a similar amount in 2005, which could be used to produce 85.6 – 89.6 million gallons of ethanol
per year, though the realistic volume is estimated at 46 million gallons per year in the initial stages of
production. Commercially attractive ethanol production technology is however not expected to become
available before 2012. The feasibility study also notes that the price competitiveness of ethanol is highly
dependent on the price of oil.
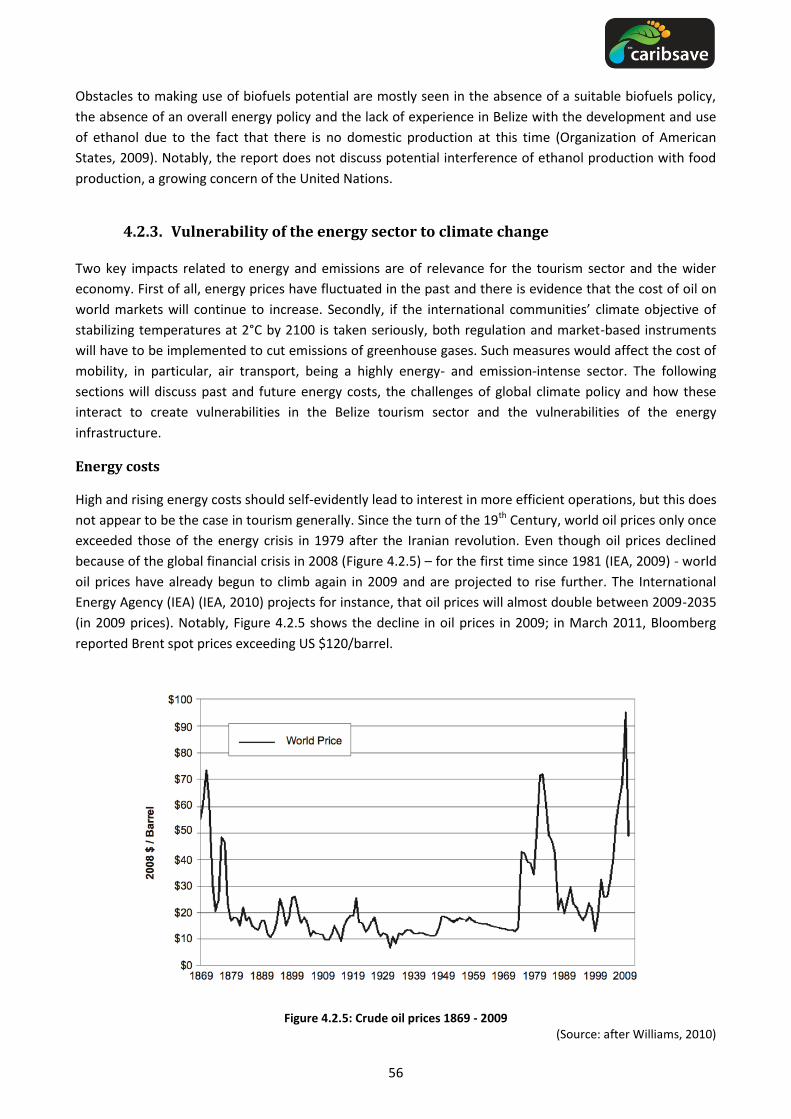
56
Obstacles to making use of biofuels potential are mostly seen in the absence of a suitable biofuels policy,
the absence of an overall energy policy and the lack of experience in Belize with the development and use
of ethanol due to the fact that there is no domestic production at this time (Organization of American
States, 2009). Notably, the report does not discuss potential interference of ethanol production with food
production, a growing concern of the United Nations.
4.2.3. Vulnerability of the energy sector to climate change
Two key impacts related to energy and emissions are of relevance for the tourism sector and the wider
economy. First of all, energy prices have fluctuated in the past and there is evidence that the cost of oil on
world markets will continue to increase. Secondly, if the international communities’ climate objective of
stabilizing temperatures at 2°C by 2100 is taken seriously, both regulation and market-based instruments
will have to be implemented to cut emissions of greenhouse gases. Such measures would affect the cost of
mobility, in particular, air transport, being a highly energy- and emission-intense sector. The following
sections will discuss past and future energy costs, the challenges of global climate policy and how these
interact to create vulnerabilities in the Belize tourism sector and the vulnerabilities of the energy
infrastructure.
Energy costs
High and rising energy costs should self-evidently lead to interest in more efficient operations, but this does
not appear to be the case in tourism generally. Since the turn of the 19th Century, world oil prices only once
exceeded those of the energy crisis in 1979 after the Iranian revolution. Even though oil prices declined
because of the global financial crisis in 2008 (Figure 4.2.5) – for the first time since 1981 (IEA, 2009) - world
oil prices have already begun to climb again in 2009 and are projected to rise further. The International
Energy Agency (IEA) (IEA, 2010) projects for instance, that oil prices will almost double between 2009-2035
(in 2009 prices). Notably, Figure 4.2.5 shows the decline in oil prices in 2009; in March 2011, Bloomberg
reported Brent spot prices exceeding US $120/barrel.
Figure 4.2.5: Crude oil prices 1869 - 2009 (Source: after Williams, 2010)

57
The IEA anticipates that even under its New Policies Scenario, which favours energy efficiency and
renewable energies, energy demand will be 36% higher in 2035 than in 2008, with fossil fuels continuing to
dominate demand (IEA, 2010). At the same time there is reason to believe that ‘peak oil’, i.e. the maximum
capacity to produce oil, may be passed in the near future. The UK Energy Research Centre, for instance,
concludes in a review of studies that a global peak in oil production is likely before 2030, with a significant
risk of a peak before 2020 (UKERC, 2009). Note that while there are options to develop alternative fuels,
considerable uncertainties are associated with these options, for instance with regard to costs, safety,
biodiversity loss, or competition with food production (e.g. Harvey and Pilgrim, 2011). Fuel costs in Belize
are regulated by the Government. Rising costs for conventional fuels will therefore become increasingly
relevant, particularly for transport, the sector most dependent on fossil fuels with the least options to
substitute energy sources. Within the transport sector, aviation will be most affected due to limited options
to use alternative fuels, which have to meet specific demands regarding safety and energy-density (cf.
Nygren et al., 2009; Upham et al., 2009). Likewise, while there are huge unconventional oil resources,
including natural gas, heavy oil and tar sands, oil shales and coal, there are long lead times in development,
necessitating significant investments. The development of these oil sources is also likely to lead to
considerably greater environmental impacts than the development of conventional oil resources (IEA,
2009).
These findings are relevant for the tourism system as a whole because mobility is a precondition for
tourism. Rising oil prices will usually be passed on to the customer, a situation evident in 2008, when many
airlines added a fuel surcharge to plane tickets in order to compensate for the spike in oil prices. Increased
travel costs can lead to a shift from long haul- to shorter-haul destinations. The cost of energy is one of the
most important determinants in the way people travel and the price of oil will influence travel patterns,
with some evidence that in particular low-fare and long-haul flights are susceptible to changes in prices
(e.g. Mayor and Tol, 2008). Moreover, it deserves mention that oil prices are not a simple function of
supply and demand, involving different parameters such as long-term contracts and hedging strategies,
social and political stability in oil producing countries as well as the global security situation generally. This
is well illustrated in the volatility of oil prices in the five-year period 2002 - 2009, when the world market
price of aviation fuel oscillated between a low of US $25 in 2002 (Doganis, 2006) and US $147 in mid-2008
(Gössling and Upham, 2009).
The huge rise in oil prices, which was not expected by most actors in tourism, had a severe impact
particularly on aviation. As late as December 2007, IATA projected the average 2008-price of a barrel of oil
at US $87, up 6 per cent from the average price level in 2007 (IATA, 2007). In early 2008, IATA corrected its
projection of fuel prices to an average of US $106 per barrel for 2008, an increase of 22% over its previous
estimate. However, in July 2008, oil prices reached US $147 per barrel and IATA corrected its forecast for
average oil prices in 2008 to almost US $142 per barrel, a price 75% higher than a year ago (IATA, 2008). In
autumn 2008, again seemingly unexpected by the overwhelming majority of actors in tourism, the global
financial system collapsed due to speculation of financial institutions with various forms of investment. As a
result, the global economy went into recession and by the end of 2008, oil prices had reached a low of
US $40 per barrel.
Fuel price volatility, in late 2008 exceeding 30% of operational costs (IATA 2009, see Figure 4.2.6), had a
range of negative impacts for airlines. Before the financial crisis, it appeared as if low-fare carriers would be
severely affected by high fuel prices, with even profitable airlines reporting falling profits, grounded aircraft
and cancelled routes: high fuel prices had clearly affected the perception of travellers to fly at quasi-zero
costs (cf. Gössling and Upham, 2009). However, when fuel costs declined because of the financial crisis, low
cost carriers were apparently seen by many travellers as the only airlines still offering flights at reasonable
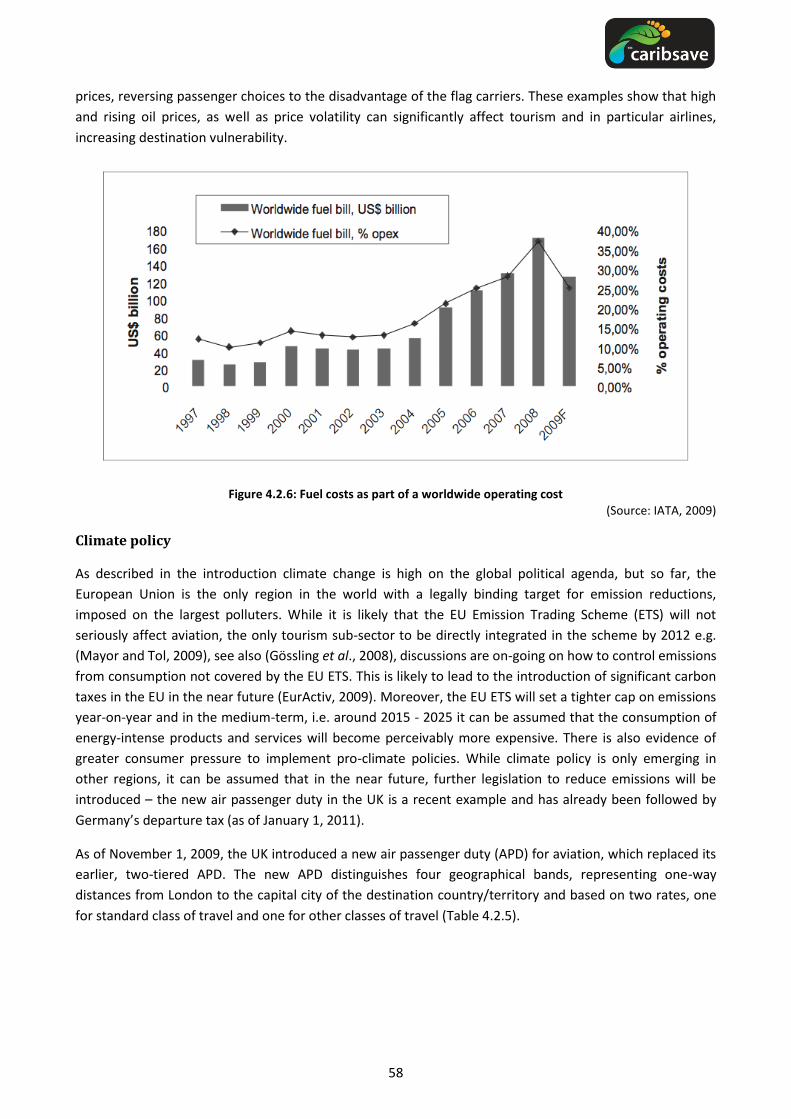
58
prices, reversing passenger choices to the disadvantage of the flag carriers. These examples show that high
and rising oil prices, as well as price volatility can significantly affect tourism and in particular airlines,
increasing destination vulnerability.
Figure 4.2.6: Fuel costs as part of a worldwide operating cost (Source: IATA, 2009)
Climate policy
As described in the introduction climate change is high on the global political agenda, but so far, the
European Union is the only region in the world with a legally binding target for emission reductions,
imposed on the largest polluters. While it is likely that the EU Emission Trading Scheme (ETS) will not
seriously affect aviation, the only tourism sub-sector to be directly integrated in the scheme by 2012 e.g.
(Mayor and Tol, 2009), see also (Gössling et al., 2008), discussions are on-going on how to control emissions
from consumption not covered by the EU ETS. This is likely to lead to the introduction of significant carbon
taxes in the EU in the near future (EurActiv, 2009). Moreover, the EU ETS will set a tighter cap on emissions
year-on-year and in the medium-term, i.e. around 2015 - 2025 it can be assumed that the consumption of
energy-intense products and services will become perceivably more expensive. There is also evidence of
greater consumer pressure to implement pro-climate policies. While climate policy is only emerging in
other regions, it can be assumed that in the near future, further legislation to reduce emissions will be
introduced – the new air passenger duty in the UK is a recent example and has already been followed by
Germany’s departure tax (as of January 1, 2011).
As of November 1, 2009, the UK introduced a new air passenger duty (APD) for aviation, which replaced its
earlier, two-tiered APD. The new APD distinguishes four geographical bands, representing one-way
distances from London to the capital city of the destination country/territory and based on two rates, one
for standard class of travel and one for other classes of travel (Table 4.2.5).

59
Table 4.2.5: UK air passenger duty as of November 1, 2009
Band and approximate distance in miles from
In the lowest class of travel (reduced rate)
In other than the lowest class of travel*
(Standard rate)
From November 1, 2009 to October 31, 2010
From November 1, 2010
From November 1, 2009 to October 31, 2010
From November 1, 2010
Band A (0-2000) £11 £12 £22 £24
Band B (2001-4000) £45 £60 £90 £120
Band C (4001-6000) £50 £75 £100 £150
Band D (over 6000) £55 £85 £110 £170 *The reduced rates apply where the passengers are carried in the lowest class of travel on any flight unless the seat
pitch exceeds 1.016 metres (40 inches), in which case, whether there is one or more than one class of travel the standard rates apply.
(Source: HM Revenue & Customs, 2008)
Scientifically, there is general consensus that a “serious” climate policy approach will be paramount in the
transformation of tourism towards becoming climatically sustainable, as significant technological
innovation and behavioural change will demand strong regulatory environments (e.g. Barr et al., 2010;
Bows et al., 2009; Hickman and Banister, 2007; see also Giddens, 2009). As outlined by (Scott et al., 2010),
“serious” would include the endorsement of national and international mitigation policies by tourism
stakeholders, a global closed emission trading scheme for aviation and shipping, the introduction of
significant and constantly rising carbon taxes on fossil fuels, incentives for low-carbon technologies and
transport infrastructure and, ultimately, the development of a vision for a fundamentally different global
tourism economy.
While this would demand a rather radical change from current business models in tourism, all of these
aspects of a low-carbon tourism system are principally embraced by business organisations. For instance,
the World Economic Forum (WEF, 2009) suggests as mechanisms to achieve emission reductions i) a carbon
tax on non-renewable fuels, ii) economic incentives for low-carbon technologies, iii) a cap-and-trade system
for developing and developed countries and iv) the further development of carbon trading markets.
Furthermore, evidence from countries seeking to implement low-carbon policies suggests that the tourism
businesses themselves also call for the implementation of legislation to curb emissions, a result of the wish
for “rules for all”, with pro-climate oriented businesses demanding regulation and the introduction of
market-based instruments to reduce emissions (cf. Ernst & Young, 2010; PricewaterhouseCoopers, 2010).
There is consequently growing consensus among business leaders and policy makers that emissions of
greenhouse gases represent a market failure. The absence of a price on pollution encourages pollution,
prevents innovation and creates a market situation where there is little incentive to innovate (OECD, 2010).
While governments have a wide range of environmental policy tools at their disposal to address this
problem, including regulatory instruments, market-based instruments, agreements, subsidies, or
information campaigns, the fairest and most efficient way of reducing emissions is increasingly seen in
higher fuel prices, i.e. the introduction of a tax on fuel or emissions (e.g. Sterner, 2007; Mayor and Tol,
2007, 2008, 2009, 2010a, b; see also OECD, 2009 and 2010; WEF, 2009; PricewaterhouseCoopers, 2010).
Compared to other environmental instruments, such as regulations concerning emission
intensities or technology prescriptions, environmentally related taxation encourages both
the lowest cost abatement across polluters and provides incentives for abatement at each
unit of pollution. These taxes can also be a highly transparent policy approach, allowing
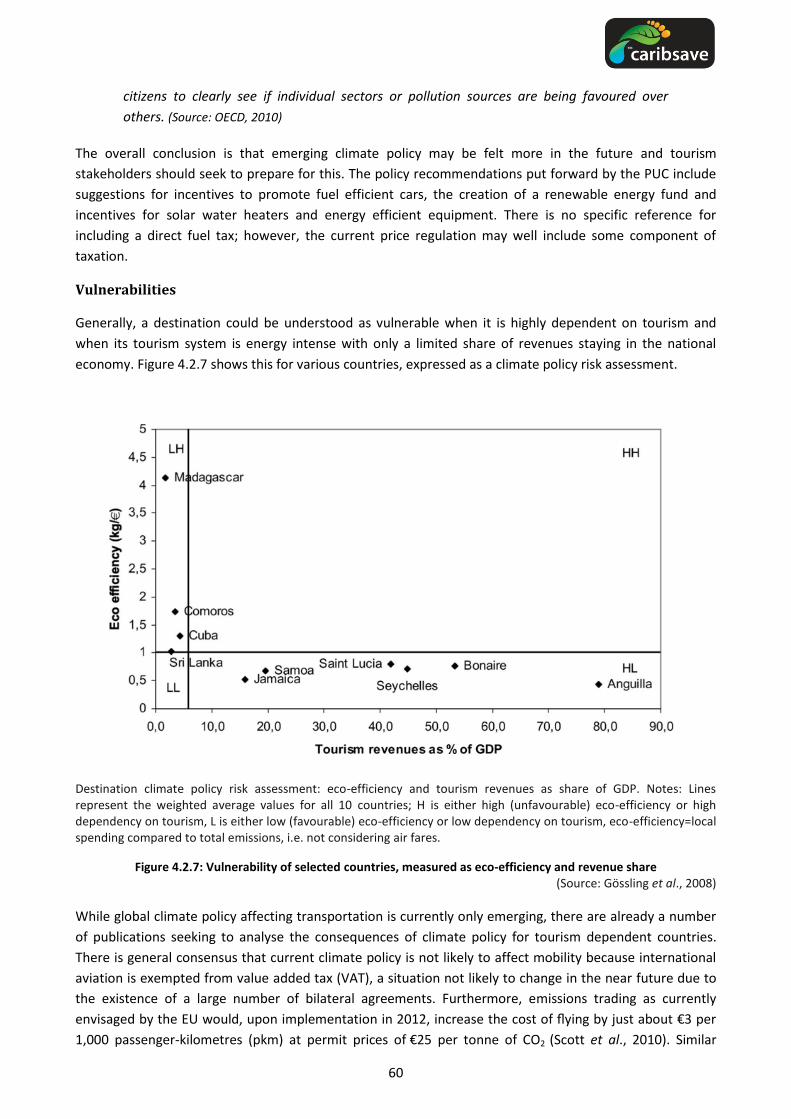
60
citizens to clearly see if individual sectors or pollution sources are being favoured over
others. (Source: OECD, 2010)
The overall conclusion is that emerging climate policy may be felt more in the future and tourism
stakeholders should seek to prepare for this. The policy recommendations put forward by the PUC include
suggestions for incentives to promote fuel efficient cars, the creation of a renewable energy fund and
incentives for solar water heaters and energy efficient equipment. There is no specific reference for
including a direct fuel tax; however, the current price regulation may well include some component of
taxation.
Vulnerabilities
Generally, a destination could be understood as vulnerable when it is highly dependent on tourism and
when its tourism system is energy intense with only a limited share of revenues staying in the national
economy. Figure 4.2.7 shows this for various countries, expressed as a climate policy risk assessment.
Destination climate policy risk assessment: eco-efficiency and tourism revenues as share of GDP. Notes: Lines represent the weighted average values for all 10 countries; H is either high (unfavourable) eco-efficiency or high dependency on tourism, L is either low (favourable) eco-efficiency or low dependency on tourism, eco-efficiency=local spending compared to total emissions, i.e. not considering air fares.
Figure 4.2.7: Vulnerability of selected countries, measured as eco-efficiency and revenue share (Source: Gössling et al., 2008)
While global climate policy affecting transportation is currently only emerging, there are already a number
of publications seeking to analyse the consequences of climate policy for tourism dependent countries.
There is general consensus that current climate policy is not likely to affect mobility because international
aviation is exempted from value added tax (VAT), a situation not likely to change in the near future due to
the existence of a large number of bilateral agreements. Furthermore, emissions trading as currently
envisaged by the EU would, upon implementation in 2012, increase the cost of flying by just about €3 per
1,000 passenger-kilometres (pkm) at permit prices of €25 per tonne of CO2 (Scott et al., 2010). Similar
61
findings are presented by Mayor and Tol (2010b), who model that a price of €23/t CO2 per permit will have
a negligible effect on emissions developments. Other considerable increases in transport costs due to
taxation are not currently apparent in any of the 45 countries studied by OECD & UNEP (2011), though such
taxes may be implemented in the future. The example of the UK has been outlined above and Germany
introduced a departure tax of €8, €25 and €45 for flights <2000 km, 2000-4000 km and >4,000 km as of 1
January 2011.
The implications of the EU ETS for tourism in some countries were modelled by Gössling et al. (2008). The
study examined the implications of the EU-ETS for European outbound travel costs and tourism demand for
ten tourism-dependent less developed countries with diverse geographic and tourism market
characteristics. It confirmed that the EU-ETS would only marginally affect demand to these countries, i.e.
causing a slight delay in growth in arrival numbers from Europe through to 2020, when growth in arrivals
would be 0.2% to 5.8% lower than in the baseline scenario (Gössling et al., 2008).
As the (Gössling et al.,2008) study only looked at climate policy, but omitted oil prices, (Pentelow and Scott,
2010) modelled the consequences of a combination of climate policy and rising oil prices. A tourist arrivals
model was constructed to understand how North American and European tourist demand to the Caribbean
region would be affected. A sensitivity analysis that included 18 scenarios with different combinations of
three GHG mitigation policy scenarios for aviation (represented by varied carbon prices), two oil price
projections and three price elasticity estimates was conducted to examine the impact on air travel arrivals
from eight outbound market nations to the Caribbean region. Pentelow and Scott (2010) concluded that a
combination of low carbon price and low oil price would have very little impact on arrivals growth to the
Caribbean region through to 2020, with arrivals 1.28% to 1.84% lower than in the BAU scenario (the range
attributed to the price elasticities chosen). The impact of a high carbon price and high oil price scenario was
more substantive, with arrivals 2.97% to 4.29% lower than the 2020 BAU scenario depending on the price
elasticity value used. The study concluded:
It is important to emphasize that the number of arrivals to the region would still be
projected to grow from between 19.7 million to 19.9 million in 2010 to a range of 30.1
million to 31.0 million in 2020 (Source: Pentelow and Scott, 2010).
A detailed case study of Jamaica further revealed the different sensitivity of market segments (package
vacations) to climate policy and oil price related rises in air travel costs (Pentelow and Scott, 2010); see also
(Schiff and Becken, 2010) for a New Zealand study of price elasticities. (Pentelow and Scott, 2010)
concluded that further research is required to understand the implications of oil price volatility and climate
policy for tourist mobility, tour operator routing and the longer- term risks to tourism development in the
Caribbean. Overall, current frameworks to mitigate GHG emissions from aviation do not seem to represent
a substantial threat to tourism development (Mayor and Tol, 2007; Gössling et al., 2008; Rothengatter,
2009), but new regulatory regimes and market based instruments to reduce emissions in line with global
policy objectives would cause changes in the global tourism system that could affect in particular SIDS. To
anticipate these changes and to prepare the vulnerable tourism economies in the Caribbean to these
changes should thus be a key management goal for tourism stakeholders.
Climate change impacts on energy generation, distribution and infrastructure
A report on the potential impacts of climate change on the energy sector published by the U.S. Department
of Energy distinguishes between direct impacts: which affect energy resource availability, fuel and power
production, transmission and distribution processes; and indirect impacts which are brought on by other
sectors through forward or reverse linkages with the energy sector and may include competition for shared

62
resources, trends in demand and supply and pricing. These impacts are not only limited to traditional (fossil
fuel based) energy systems, but renewable systems as well. While direct impacts are more visible, the costs
of indirect impacts can be difficult to quantify and often exceed those of direct impacts, given the inter-
relationships between energy and other sectors (U.S. Department of Energy/National Energy Technology
Laboratory, 2007). Similarly, Contreras-Lisperguer and de Cuba (2008) have outlined a number of potential
impacts of climate change on both traditional and renewable energy systems, with varying consequences
for energy production and transmission efficiency, energy prices and trends in demand and consumption.
Belize’s energy production is a mix of fossil fuel powered plants, biomass, hydropower and imported
electricity (Public Utilities Commission, 2003a). There is also a considerable amount of effort being focussed
on expansion into ethanol production (Organization of American States, 2009; CTA & IICA, 2007). Solar and
wind power are also highlighted as areas for potential expansion (Public Utilities Commission, 2003b).
Potential physical climate change impacts specific to traditional energy production systems as well as the
identified renewable technologies being considered are outlined below. Special consideration should be
given to the physical impacts of climate change that can affect these systems in the planning process.
An increase in the intensity (and possibly frequency) of severe low pressure systems, such as hurricanes,
has the potential to affect both traditional and renewable energy production and distribution
infrastructure, including generating plants, transmission lines and pipelines. The energy-based
infrastructure in Belize is therefore vulnerable to impacts from tropical storms and hurricanes during any
given year. Some of the more vulnerable components of the energy system include transmission lines,
poles and other relatively light, above ground infrastructure, which can suffer significant damage from high
winds. Hurricane Richard in 2010 impacted power supply for several days and damages were estimated at
BZ $250,000. Loss of power also impacted the water supply in some rural communities where there are no
back-up generators for water pumps (NEMO, 2010b) (see Comprehensive Natural Disaster Management
section). Modern wind turbines stop rotating when wind speed exceeds approximately 55 mph to protect
the equipment and the structures are typically designed to withstand winds in excess of 150 mph. Other
installations are designed to be winched down in the event of an approaching hurricane. These types of
problems should be carefully considered during the planning of any wind farm developments. In the
aftermath of extreme weather, the process of restoring transmission and proper operation of generating
facilities depends on road access and the amount of supplies available to replace infrastructure
components that have been damaged or destroyed. The vulnerability of the sector to extreme weather
events therefore has even greater implications for increasing the recovery period and extending the loss of
productivity in all other sectors within the country following an event (U.S. Department of Energy/National
Energy Technology Laboratory, 2007; IPCC, 2007b; Contreras-Lisperguer & de Cuba, 2008). Belize has a
Hazard Mitigation Plan that speaks to the vulnerability of key infrastructure and identifies specific electrical
facilities that are vulnerable to hazards (Development Solutions Ltd, 2006).
Model projections for Belize suggest an increase in mean annual temperatures, as well as the number of
‘hot’ days and nights to as much as 80% of the days per year by 2080 and a possible disappearance of ‘cold’
nights (see Climate Modelling section). National energy demand and consumption for cooling purposes
may increase in response to extremes in diurnal temperatures. Higher temperatures have also been shown
to reduce the efficiency of energy generation at thermal power plants, similar to those in Belize. The
climate modelling projections also indicate a decrease in mean annual rainfall, (although these predictions
are more uncertain than temperature changes) which may affect water availability for non-contact cooling
of power generators (Contreras-Lisperguer & de Cuba, 2008; also see Water Quality and Availability
section). Similar impacts are likely to apply to biomass systems.
63
Belize has additional capacity from hydropower, is investigating the feasibility of developing a bio-fuel
industry to supply ethanol and looking at potential expansion into wind and solar power. Alternative energy
sources, while they are environmentally more sustainable, also face challenges from climate variability.
Hydro power systems depend on levels of precipitation, temperature and evapo-transpiration. Extremes in
any of these variables have implications for stream flow and water availability and flow quality for hydro
power generation (Contreras-Lisperguer & de Cuba, 2008). Therefore low water quantity and a low flow
quality will prohibit optimum production from hydro-power systems. Conversely, excessive water levels
and rapid flows from flooding may exceed the maximum capacity of hydro-power systems to operate
effectively (see Water Quality and Availability section). The combined effects of temperature and rainfall
variability will also impact on biofuel production systems. Changes in temperature and rainfall over time
and changes in seasonal weather patterns will affect the yield of dedicated energy crops (e.g. sugar cane)
and result in lower biofuel production with a decline in crop production.
Wind is generated by temperature gradients which result from differential heating of the earth’s surface.
Based on this relationship, changes in spatial temperature gradients caused by land use change, reductions
in solar incidence and changes in atmospheric circulation can be argued to result in wind pattern shifts and
therefore wind energy potential. Climate models project increases in wind speed for Belize, which augers
well for expansion in this area (see Climate Modelling section). Similarly, changes in solar radiation
incidence and increases in temperature can impact the effectiveness of electrical generation by
photovoltaic cells and solar thermal energy collection. The projected increase in the number of sunshine
hours for Belize over the next few decades, however, increases the viability of using photovoltaic
technology – even if only on the basis of increasing incidence of sunshine (IPCC, 2007b; Contreras-
Lisperguer & de Cuba, 2008).
Climate change, ocean-based impacts on the energy system include storm surge events and SLR. These
processes are a threat primarily to infrastructure located within the coastal zone and within the impact
range of these events. (Simpson et al., 2010) highlight that some key impact scenarios for Belize,
considering their geophysical nature; include flooding caused by storms and SLR, salt water intrusion,
erosion of mangroves, coral bleaching and coral erosion from storms and tsunamis. Power generating
stations and other major infrastructure located on the coastline are therefore highly vulnerable to impacts
resulting from SLR and storm induced surges.
The likelihood of climate change impacting on energy systems will vary. However, an assessment of the
vulnerability of Belize’s systems should be prioritised, especially in the case of renewable energy sources
that are being planned and which depend on specific climate parameters and priority coastal infrastructure
such as power plants. Some of this has already been undertaken as part of the Hazard Mitigation Planning,
but should be expanded and standardised in the processes for all future planning (Development Solutions
Ltd, 2006).

64
4.3. Agriculture and Food Security
4.3.1. Background
Climate change related impacts on agriculture have in recent times been the focus of discussion and
research on an international level. It is anticipated that climatic change will diminish agricultural potentials
in some regions thereby affecting the global food system. The IAASTD Global Report (International
Assessment of Agricultural Knowledge, Science and Technology for Development, 2009) stresses the need
to adopt a more practical approach to agricultural research that requires participation from farmers who
hold the traditional knowledge in food production.
This research examines the relationship between agriculture and tourism within the framework of climate
change and seeks to develop adaptations options to support national food security based on experience
and knowledge gained from local small-scale farmers and agricultural technicians. The study is exploratory
in nature and the findings will be assimilated to develop national and regional projects that promote
climate conscious farms and sustainable food production in the Caribbean.
4.3.2. The importance of agriculture to national development
Agriculture is the bedrock of the Belizean economy. According to the World Bank (2009), agriculture is the
most important economic sector in Belize in terms of income generation, employment, food security and
poverty alleviation. The Belize Audubon Society, (2008) indicates that the economic value of primary
agriculture products exceeded BZ $373 million in 2007, while for primary non-traditional (fruits, vegetables
and livestock) agriculture exceeded $182.6 million. Agriculture contributes 12% of GDP and over 57% of
total export earnings. In 2006, 18.5% of GDP and 23.5% of total employment was either directly or
indirectly dependent on agricultural production and the food processing industry.
More than $292 million (88% of export earnings in agriculture) is generated by three commodities: citrus
products, sugar and bananas (The Belize Audubon Society, 2008). The remaining main export earners are
papaya, red kidney beans, black-eyed peas, with pepper sauce and cocoa beans being minor earners.
(Singh et al., 2005) explain that domestic agriculture includes rice, maize, beans, root crops, vegetables,
poultry, beef and pigs.
A report from the Ministry of Agriculture and Fisheries (Merrill, 2010) states that the Ministry’s goals are to
create year-round employment for farm families, increase farm income, alleviate poverty, minimise youth
migration to urban areas, seek new markets for produce, continue market-driven research and
development, build capacity in the sector and provide access to affordable credit. The Ministry’s mandate is
to maintain agriculture as the economic pillar of Belize and to ensure food security, develop risk
management, generate income and foreign exchange, create employment and conserve natural resources.
To this end, the Government of Belize has invested in projects aimed at increasing production, productivity
and quality of produce for basic food items including corn, rice, beans, eggs and meat.
Additionally, protected agriculture systems, irrigation systems and the development of integrated farming
systems were promoted to provide alternative sources of income for farmers. The aquaculture sub-sector is
now firmly established as a significant contributor to the Belizean economy; and the full scope for
aquaculture development has been estimated at BZ $908,200,000 per annum. The fishing industry
contributes significantly to the economy of Belize mostly from exports of lobster, conch and shrimp.

65
4.3.3. An analysis of the agricultural sector in Belize
Historically, Belizean agriculture has been heavily export oriented, with long-standing industries for sugar,
bananas and citrus products. These industries continue to dominate Belize‘s agricultural exports, with
modest gains achieved in export diversification through a small but competitive papaya export sector and a
still small but growing level of trade in beans, peas and various condiments (World Bank, 2009). A once
vibrant trade in shrimp and other fish products (exceeding US $50 million per annum in the early 2000s) has
substantially contracted in recent years (with 2008 exports of US $22 million) due to price competition from
East Asian countries in the main destination markets.
FAO (2011) explains that agriculture in Belize is characterized by three main sub-sectors: a) a fairly well
organized traditional export sector for sugar, banana, citrus and marine products, b) a more traditional,
small-scale farm sector, producing food mainly for local consumption and c) a well integrated large-scale
commercial sector.
Research by IFAD (2008) reveals that the majority of small farmers mainly produce maize, beans and rice. In
remote rural areas, small farmers practice a traditional shifting (slash & burn) cultivation system called
Milpa which contributes significantly to domestic food production. Milpa cultivation is predominantly found
in indigenous communities in the southern districts. Singh et al., (2005) assert that farming in Belize is
uniquely distinct from the rest of CARICOM with respect to its major farming systems – the Milpa and the
Mennonite farming systems. The Milpa system is one of shifting cultivation on a rotational basis for each
production cycle. Small farmers, primarily of indigenous origin grow corn and beans in sparsely populated
areas, traditionally for their own consumption. Alternatively the Mennonites use a farming system which is
more cooperative and community driven in scope. Major commodities grown by the Mennonites include
poultry, dairy-based products, corn and other grains, vegetables and beans.
The farming population consists of approximately 11,000 farmers, operating on about 5% of the agricultural
land area. Small farmers in Belize account for more than 75% of the farming population. A large
percentage of these small farms produce primary export crops such as sugar, bananas and citrus, while
others concentrate on domestic food crops, viz., rice, maize, beans, root crops and vegetables.
4.3.4. Women and youth in Belizean agriculture
In Belize women are more oriented to organic farming than traditional methods. However, they struggle
more with access to land and access to credit. Female farmers also tend to organize themselves into
women’s groups with collective ownership to resources in contrast to the male farmers who operate as
individual entities with individual or family ownership to property (Barnett et al., 2010).
Women groups occasionally receive financial and technical support mainly from non-government
organisations and they come together for training and other support services through the Agriculture
Department. Through discussions on The National Development Consultation for Belize, (Barnett et al.,
2010) discovered that the situation of organic cacao production in Toledo differs from this overall pattern.
A positive observation is that men farmers, even those who resist women’s political leadership, show
acceptance and support for women farmers in their district.
The second progress report on the National Development Consultations for Belize relates that there is a
declining level of appreciation of young people for the natural environment and lack of respect for
agriculture as a desirable career. Attempts to re-introduce gardening and agriculture into the primary and
secondary school curriculum are ad hoc and poorly funded.
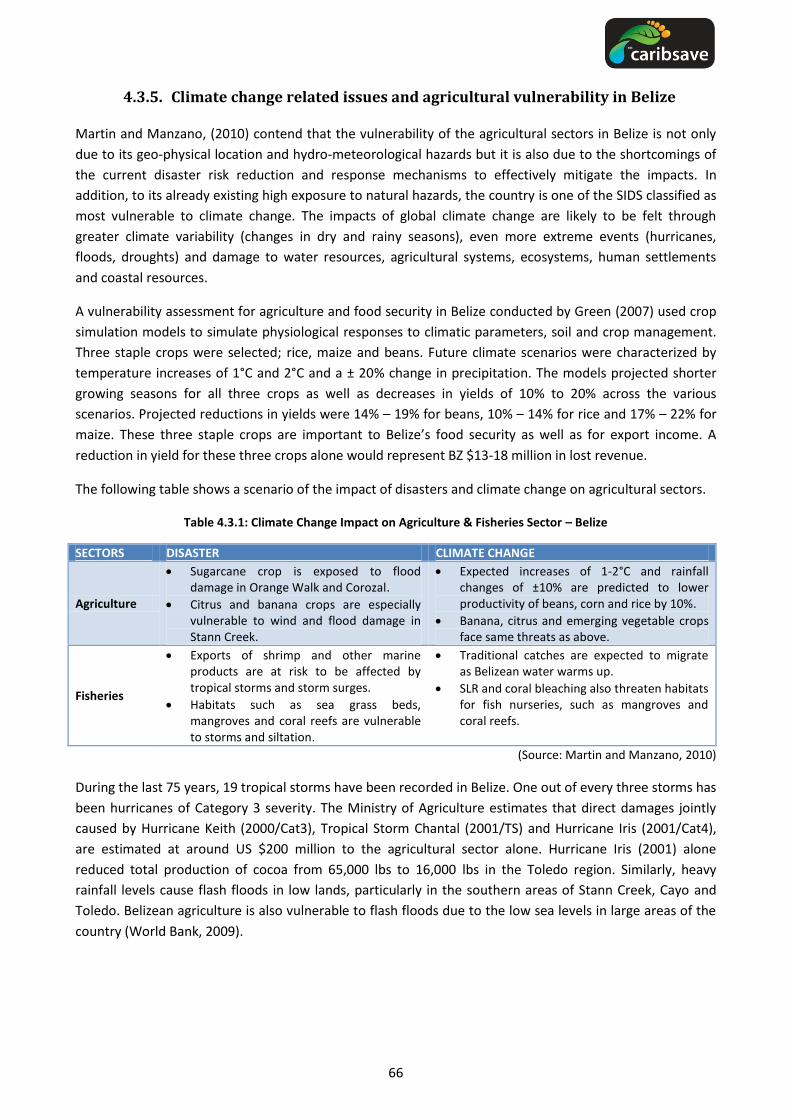
66
4.3.5. Climate change related issues and agricultural vulnerability in Belize
Martin and Manzano, (2010) contend that the vulnerability of the agricultural sectors in Belize is not only
due to its geo-physical location and hydro-meteorological hazards but it is also due to the shortcomings of
the current disaster risk reduction and response mechanisms to effectively mitigate the impacts. In
addition, to its already existing high exposure to natural hazards, the country is one of the SIDS classified as
most vulnerable to climate change. The impacts of global climate change are likely to be felt through
greater climate variability (changes in dry and rainy seasons), even more extreme events (hurricanes,
floods, droughts) and damage to water resources, agricultural systems, ecosystems, human settlements
and coastal resources.
A vulnerability assessment for agriculture and food security in Belize conducted by Green (2007) used crop
simulation models to simulate physiological responses to climatic parameters, soil and crop management.
Three staple crops were selected; rice, maize and beans. Future climate scenarios were characterized by
temperature increases of 1°C and 2°C and a ± 20% change in precipitation. The models projected shorter
growing seasons for all three crops as well as decreases in yields of 10% to 20% across the various
scenarios. Projected reductions in yields were 14% – 19% for beans, 10% – 14% for rice and 17% – 22% for
maize. These three staple crops are important to Belize’s food security as well as for export income. A
reduction in yield for these three crops alone would represent BZ $13-18 million in lost revenue.
The following table shows a scenario of the impact of disasters and climate change on agricultural sectors.
Table 4.3.1: Climate Change Impact on Agriculture & Fisheries Sector – Belize
SECTORS DISASTER CLIMATE CHANGE
Agriculture
Sugarcane crop is exposed to flood damage in Orange Walk and Corozal.
Citrus and banana crops are especially vulnerable to wind and flood damage in Stann Creek.
Expected increases of 1-2°C and rainfall changes of 10% are predicted to lower productivity of beans, corn and rice by 10%.
Banana, citrus and emerging vegetable crops face same threats as above.
Fisheries
Exports of shrimp and other marine products are at risk to be affected by tropical storms and storm surges.
Habitats such as sea grass beds, mangroves and coral reefs are vulnerable to storms and siltation.
Traditional catches are expected to migrate as Belizean water warms up.
SLR and coral bleaching also threaten habitats for fish nurseries, such as mangroves and coral reefs.
(Source: Martin and Manzano, 2010)
During the last 75 years, 19 tropical storms have been recorded in Belize. One out of every three storms has
been hurricanes of Category 3 severity. The Ministry of Agriculture estimates that direct damages jointly
caused by Hurricane Keith (2000/Cat3), Tropical Storm Chantal (2001/TS) and Hurricane Iris (2001/Cat4),
are estimated at around US $200 million to the agricultural sector alone. Hurricane Iris (2001) alone
reduced total production of cocoa from 65,000 lbs to 16,000 lbs in the Toledo region. Similarly, heavy
rainfall levels cause flash floods in low lands, particularly in the southern areas of Stann Creek, Cayo and
Toledo. Belizean agriculture is also vulnerable to flash floods due to the low sea levels in large areas of the
country (World Bank, 2009).
67
4.3.6. Vulnerability enhancing factors: Agriculture, land use and soil
degradation in Belize
FAO (2011) statistics indicate that around 2 million acres, or 38% of the land area, are suitable for
agriculture and about 15% of this amount is under farming every year. A recent census of farms in Belize
shows that 24% of farms have less than 5 acres, 33% between 5 and 20 acres and 74% of farms in the
country are below 50 acres (MAF Farm Registry). Across districts, Toledo District has one fourth of all farms
in Belize and the highest level of concentration of small farms. Orange Walk is next with 22% of farms and
Corozal with 21%. It is estimated that 60,000 acres is in sugar cane, 46,000 in citrus, 38,000 in corn and
150,000 in pastures grazed by some 80,000 head of cattle.
Belize’s First National Report on the Implementation of the United Nations Convention to Combat
Desertification (Green, 2000) reveals that the main vulnerability enhancing factor for land and soil
degradation in Belize is that the proportion of the country under agricultural cultivation exceeds the true
potential. Much of the current agricultural development, including thousands of acres of citrus orchards,
are being cultivated on marginal (sandy) soils requiring increasing inputs of fertilizers and management
each year. Those soils are categorized as marginal or third class and have high risk of degradation. Since the
mainstay of the Belizean economy is agriculture, this situation poses a serious threat for the future of this
country.
Improper farming practices also significantly contribute to land and soil degradation. Banana crops, which
are planted near riverbeds, require frequent applications of pesticides in order that the fruit meet the
standards for export. The consistent applications of these chemicals accumulate in the soils and eventually
result in degradation and deterioration in the quality of water available for downstream users due to
runoff. Small scale farming operations also have a tendency to result inland degradation. The traditional
Milpa farming system utilises the same parcels of land for several rotations. With increasing populations
and higher demands for food, there is increasing pressure on the land which compromises the natural
nutrient cycling process. Both slash-and-burn and mechanized agriculture cause land degradation through
nutrient loss.
Meerman and Cherrington (2005) specifically identify several local farming practices that threaten the
country’s agricultural capacity and national food security including: deforestation and other land cover
conversions, farming on marginal land including on acidic soils, farming on steep slopes, slash and burn
agriculture, use of agricultural land for residential settlements, livestock over-grazing, logging and surface
mining.
4.3.7. Social vulnerability of agricultural communities in Belize
Agricultural communities in Belize are extremely vulnerable to climate change impacts and food insecurity.
The Ministry of Agriculture and Fisheries (2009) states that the risk of food insecurity in Belize arises from
two situations; firstly, chronic situations that undermine income earning capacity and purchasing power
resulting in limited access to the food that is needed. This is a poverty and income earning opportunity
problem and is evidenced by the more than 35% of the Belizean population that is estimated to be at risk of
food insecurity. Secondly, there are transitory situations that exacerbate the vulnerability of the
population, such as natural disasters that sharply increase the risks of food insecurity.
FAO (2009), reports that the incidence of poverty in Belize is predominantly rural and small subsistence
farmers exhibit the highest poverty rates. About 25,000 people are employed in primary agriculture in

68
Belize, with about one-half of these employed in the traditional export oriented sectors. Thousands more
are employed in agricultural processing operations. Given the weight that sugar and banana production
have played in agricultural GDP and employment, the impact of trade preference erosions could pose
sector-wide risks. The adjustment processes may involve some contraction in overall employment.
A third social vulnerability factor for agricultural communities in Belize relates to risks posed by porous
borders. Belize‘s borders with Mexico and Guatemala are rather porous, with considerable movements of
people, animals, plants and products taking place both at formal and informal crossing points. Such
movements constitute important economic activity but also expose Belizean farmers to new or formerly
controlled pests and diseases (World Bank, 2009).
4.3.8. Economic Vulnerability: Climate change & agricultural outputs in Belize
The main economic vulnerability factor for the agriculture and fisheries in Belize is the potential losses from
natural disasters. The high level of vulnerability of the agriculture and fisheries sectors was evident in the
devastation caused by the impacts of Hurricane Dean, Tropical Storm Arthur, Tropical depression 16 and
Hurricane Richard between 2007 and 2010. The massive impacts of three recent natural disasters on
agriculture are shown in the following table.
Table 4.3.2: Recent natural disasters and their impact on agriculture sector in Belize
Sl. Name of the Event Date & Year Agricultural Sector Damage Cost (BZD)
1 Hurricane Dean August 21, 2007 The total losses to this sector is approximately 131.1 million ($40.40 million in direct damage and $90.70 million in indirect losses)
2 Tropical Storm Arthur May 31, 2008 $25 million. This includes direct loss to the farmer (damage assessment), which is estimated at around $11.7 million and other losses.
3 Tropical Depression (TD)-16
October 30, 2008 $7.8 million (papaya and rice -30% of total major crops)
4 Hurricane Richard October 21, 2010 Direct damages to the agricultural sector is $34.68 million
(Source: DANA reports, NEMO)
The Corozal and Orange Walk Districts, the hub of the sugarcane and papaya industries, were significantly
affected. There was also significant damage to corn, vegetables, tree-crops and subsistence crops, with
some damage to livestock. The high loss to the agriculture sector is attributed to the strong winds which
accompanied hurricane Dean (Ministry of Natural Resources and the Environment, 2007). The damages are
summarized as follows:
Table 4.3.3: Summary of damage and losses to agricultural sector by district following Hurricane Dean
District Direct Damage (BZD) Economic Loss (BZD)
Corozal District 32,146,121.00 71,171,170.00
Orange Walk District 7,915,000.00 18,818,265.00
Belize District 331,593.75 710,115.13
Sub-total 40,392,714.00 90,699,550.13
Total 131,092,264.00
(Source: Ministry of Natural Resources and the Environment, 2007)
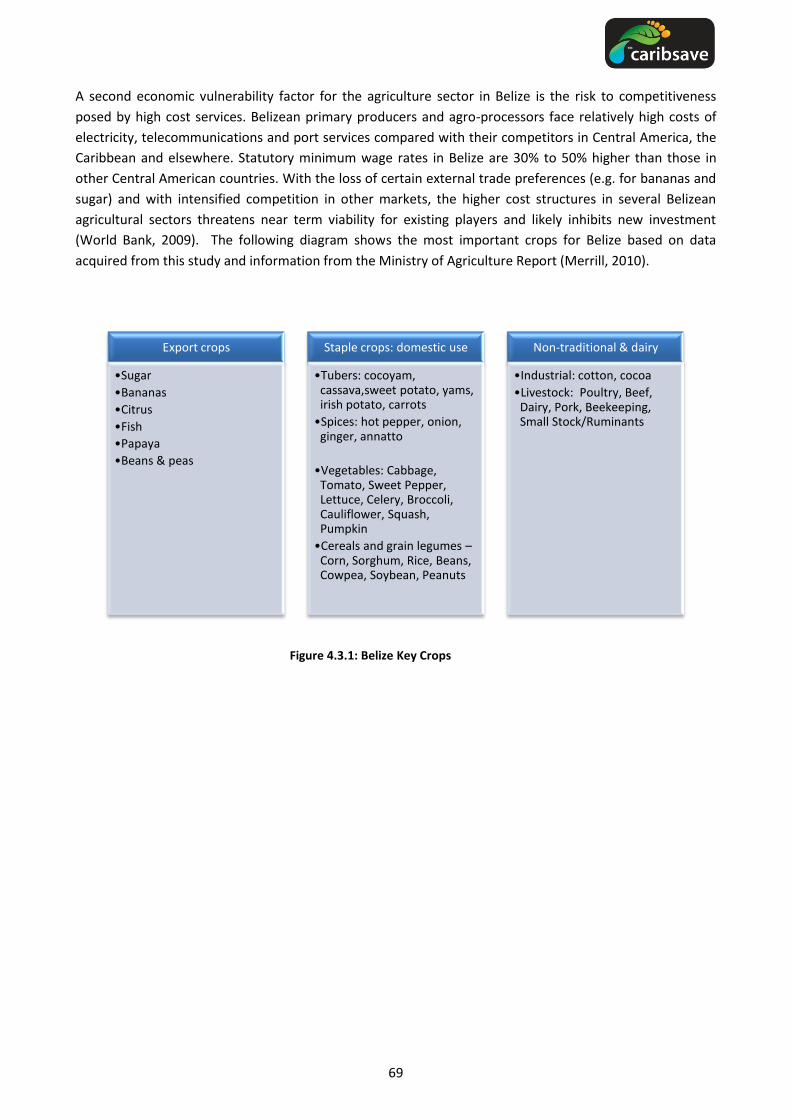
69
Export crops
•Sugar
•Bananas
•Citrus
•Fish
•Papaya
•Beans & peas
Staple crops: domestic use
•Tubers: cocoyam, cassava,sweet potato, yams, irish potato, carrots
•Spices: hot pepper, onion, ginger, annatto
•Vegetables: Cabbage, Tomato, Sweet Pepper, Lettuce, Celery, Broccoli, Cauliflower, Squash, Pumpkin
•Cereals and grain legumes – Corn, Sorghum, Rice, Beans, Cowpea, Soybean, Peanuts
Non-traditional & dairy
•Industrial: cotton, cocoa
•Livestock: Poultry, Beef, Dairy, Pork, Beekeeping, Small Stock/Ruminants
A second economic vulnerability factor for the agriculture sector in Belize is the risk to competitiveness
posed by high cost services. Belizean primary producers and agro-processors face relatively high costs of
electricity, telecommunications and port services compared with their competitors in Central America, the
Caribbean and elsewhere. Statutory minimum wage rates in Belize are 30% to 50% higher than those in
other Central American countries. With the loss of certain external trade preferences (e.g. for bananas and
sugar) and with intensified competition in other markets, the higher cost structures in several Belizean
agricultural sectors threatens near term viability for existing players and likely inhibits new investment
(World Bank, 2009). The following diagram shows the most important crops for Belize based on data
acquired from this study and information from the Ministry of Agriculture Report (Merrill, 2010).
Figure 4.3.1: Belize Key Crops
70
4.4. Human Health
4.4.1. Background
The Intergovernmental Panel on Climate Change (IPCC) Fourth Assessment Report (AR4) defines health as
“physical, social and psychological wellbeing” (Confalonieri et al., 2007). An understanding of the impacts of
climate change on human health is important because of the impact on the economy which ultimately
impacts people at the local, regional, national and international levels. Where diseases are endemic or
where environmental and social conditions make particular populations vulnerable, climate change has the
potential to impact on the quality of the environment and the resilience of the ecosystems thereby
increasing the disease incidence of the area.
Health is an important issue for the tourism industry because tourists are at risk of contracting infectious
diseases transmitted by insect vectors. In addition, air travel is responsible for a large number of diseases
which are carried from tourist destinations to Europe (Gössling, 2005) and elsewhere in the world. This is
highly relevant when one considers that as much as 75% of travellers become ill abroad; morbidity is most
often due to diarrhoea or respiratory infections (Sanford, 2004). Serious disease outbreaks can affect
tourism destination demand and negatively impact the economies of SIDS.
The potential effects of climate change on public health can be direct or indirect (Confalonieri et al., 2007;
Ebi et al., 2006; Patz et al., 2000). Direct effects include those associated with extreme weather events such
as heat stress, changes in precipitation, SLR and natural disasters or more frequent extreme weather
events. Both direct and indirect effects include the impact of climate change on the natural environment
which can affect food security, the agriculture sector and increase the susceptibility of populations to
respiratory diseases and food- and water-borne diseases (Confalonieri et al., 2007; Ebi et al., 2006; Patz et
al., 2000).
An increase in the incidence of infectious diseases has been observed in recent years in Belize (Government
of Belize, 2011). In the Belize Second National Communication to the UNFCCC, the first modelling study on
dengue fever and the effects of its transmission due to socio-economic, climatic and environmental factors
was undertaken based on research by (Vanzie, 2008). This study collected data on the frequency and spatial
distribution of Aedes aegypti larvae and determined the Breteau, House and Container indices throughout
the country. The results of the study were as follows “17% of surveyed communities had a Breteau index
below 2%. This is the threshold (even though disputed) below which dengue transmission is unlikely. 39%
had Breteau indexes between 2% and 5%; this level of larvae infestation supports the maintenance of
endemic dengue and low level outbreaks. Eight communities (44%) had larvae infestation as determined by
the Breteau index, between 6% and 24%; the probability of dengue outbreak is very high in these
communities” (Government of Belize, 2011). Based on the methodology used it is uncertain whether this
data is valid and can be interpreted in the manner reported.
While other infectious diseases represent a public health concern in Belize (Government of Belize, 2011)
no other diseases were explored in the study due to a lack of data. The vulnerability section of this report
highlights some of the potential health impacts that may arise due to climate change. Table 4.4.1 shows
selected statistics relevant to the health sector of Belize.
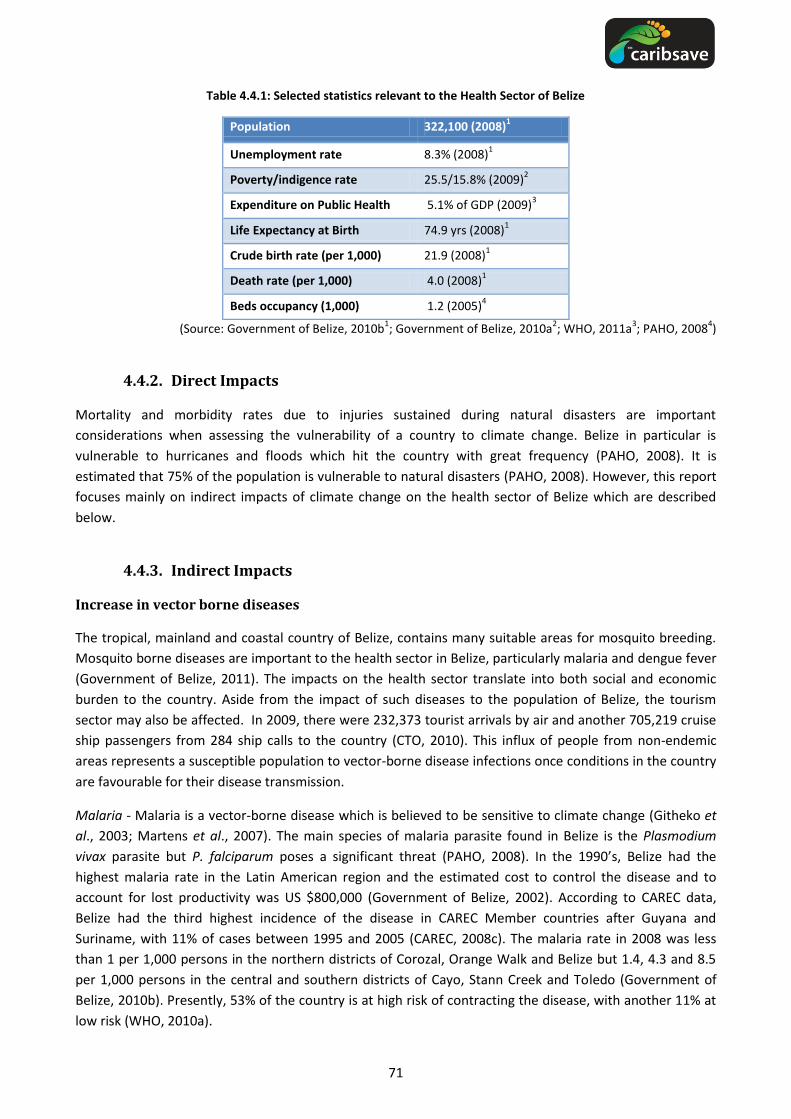
71
Table 4.4.1: Selected statistics relevant to the Health Sector of Belize
Population 322,100 (2008)1
Unemployment rate 8.3% (2008)1
Poverty/indigence rate 25.5/15.8% (2009)2
Expenditure on Public Health 5.1% of GDP (2009)3
Life Expectancy at Birth 74.9 yrs (2008)1
Crude birth rate (per 1,000) 21.9 (2008)1
Death rate (per 1,000) 4.0 (2008)1
Beds occupancy (1,000) 1.2 (2005)4
(Source: Government of Belize, 2010b1; Government of Belize, 2010a
2; WHO, 2011a
3; PAHO, 2008
4)
4.4.2. Direct Impacts
Mortality and morbidity rates due to injuries sustained during natural disasters are important
considerations when assessing the vulnerability of a country to climate change. Belize in particular is
vulnerable to hurricanes and floods which hit the country with great frequency (PAHO, 2008). It is
estimated that 75% of the population is vulnerable to natural disasters (PAHO, 2008). However, this report
focuses mainly on indirect impacts of climate change on the health sector of Belize which are described
below.
4.4.3. Indirect Impacts
Increase in vector borne diseases
The tropical, mainland and coastal country of Belize, contains many suitable areas for mosquito breeding.
Mosquito borne diseases are important to the health sector in Belize, particularly malaria and dengue fever
(Government of Belize, 2011). The impacts on the health sector translate into both social and economic
burden to the country. Aside from the impact of such diseases to the population of Belize, the tourism
sector may also be affected. In 2009, there were 232,373 tourist arrivals by air and another 705,219 cruise
ship passengers from 284 ship calls to the country (CTO, 2010). This influx of people from non-endemic
areas represents a susceptible population to vector-borne disease infections once conditions in the country
are favourable for their disease transmission.
Malaria - Malaria is a vector-borne disease which is believed to be sensitive to climate change (Githeko et
al., 2003; Martens et al., 2007). The main species of malaria parasite found in Belize is the Plasmodium
vivax parasite but P. falciparum poses a significant threat (PAHO, 2008). In the 1990’s, Belize had the
highest malaria rate in the Latin American region and the estimated cost to control the disease and to
account for lost productivity was US $800,000 (Government of Belize, 2002). According to CAREC data,
Belize had the third highest incidence of the disease in CAREC Member countries after Guyana and
Suriname, with 11% of cases between 1995 and 2005 (CAREC, 2008c). The malaria rate in 2008 was less
than 1 per 1,000 persons in the northern districts of Corozal, Orange Walk and Belize but 1.4, 4.3 and 8.5
per 1,000 persons in the central and southern districts of Cayo, Stann Creek and Toledo (Government of
Belize, 2010b). Presently, 53% of the country is at high risk of contracting the disease, with another 11% at
low risk (WHO, 2010a).

72
Malaria is endemic to the country. The status of the disease has been summarised by PAHO (2008) as
follows: “Malaria will continue to represent an important public health concern in Belize, especially in rural
areas of the southern districts, given that there is an active migrant population that works in the citrus and
banana industries and frequent population movements and substandard housing have provided favourable
environmental conditions for mosquito breeding”.
In a study of malaria vectors in the Caribbean, 9 of the 29 species of Anopheles present in the region were
identified in Belize (Rawlins et al., 2008). From 1995 to 2009 over 85,996 cases of malaria were reported,
with fluctuating trends in the prevalence in malaria cases observed, with as low as 10, 415 reported in 1995
to over 26,000 cases in 2009 (CAREC, 2008c; WHO, 2010a). Table 4.4.2 below shows malaria cases for Belize
between 2000 and 2009. The average number of cases per year for this period was 828, whereas for the
last thirty years spanning 1980 - 2009 it was 2,660 cases per year. There was only one death in the last ten
years which occurred in 2006 (WHO, 2010a).
Table 4.4.2: Confirmed malaria confirmed and suspected cases in Belize between 2000 and 2009
Year 2000 2001 2002 2003 2004 2005 2006 2007 2008 2009
No. (confirmed) cases
1,486 1,097 928 928 1,066 1,549 844 845 538 256
No. suspected (tested + probable) cases
18,559 18,173 15,480 15,480 17,358 25,119 25,755 22,134 25,550 26,051
(Source: WHO, 2010a)
At least one study has found that malaria is the most common cause of fever among tourists upon
returning from travel in infected areas (Wichmann et al., 2003). Additionally, it should be highlighted here
that malaria is the most reported cause of hospitalizations in tourists from malaria prone destinations
(Wilder-Smith and Schwartz, 2005). These results highlight the need for effective management of the
disease for future increases are anticipated due to climate change and its “knock on” effect on the tourist
industry of Belize.
Dengue Fever – Dengue fever is the most important arboviral disease and exists in tropical and subtropical
countries worldwide (Gubler, 2002; Patz et al., 2000; Rigau-Pérez et al., 1998). Population growth,
urbanization and modern transportation are believed to have contributed to its resurgence in recent times
(Gubler, 2002). It has been shown that dengue fever transmission is altered by increases in temperature
and rainfall (Hales et al., 1996) but further research on the association between these two variables is
needed. It has been found from modelled data and observations that changes in climate determine the
geographical boundaries of dengue fever (Epstein, 2001; Epstein et al., 1998; Hales, Wet, Maindonald, &
Woodward, 2002; Hsieh & Chen, 2009; Martens et al., 2007; Patz et al., 2000). The economic, social and
environmental factors can also affect the occurrence and transmission of the disease (Hopp and Foley,
2001).
Dengue fever is endemic to Belize and is transmitted by the Aedes aegypti mosquito to humans
(Government of Belize, 2011). The Belize Second National Communication to the UNFCCC has stated that
Belize has suitable environmental and socio‐economic conditions for dengue fever and dengue
haemorrhagic fever outbreaks (Government of Belize, 2011). Dengue fever cases prior to 2006 have been
inconsistently reported and therefore under-reported. For instance between 1995 and 2007, only four
years (1995, 2002, 2005 and 2007) have complete data sets by district (Government of Belize, 2011). In

73
2007, the incidence of dengue fever was 1.06 persons per 1,000 inhabitants and for all other years with
complete data it was estimated to be 1.057 persons per 1,000 inhabitants (Government of Belize, 2011).
Figure 4.4.1: Seasonal variation of Dengue in Belize – 2002, 2005, 2007 (Source: Government of Belize, 2011)
Dengue exhibits seasonal variability and its incidence has also shown some correlation with rainfall patterns
(Government of Belize, 2011). This is demonstrated in Figure 4.4.1 above. During 2009 a similar pattern
emerged with increasing numbers of cases reported during epidemiological weeks 27-32 and from weeks
35-49 (CAREC, 2010). Reported cases are lowest during the dry season, with a sudden increase and
decrease from June to October. It has also been observed that the increase in cases occurs two weeks
behind increase in rainfall and that overall dengue cases mirror rainfall patterns (See Figure 4.4.2)
(Government of Belize, 2011). These results are very similar to that reported in Trinidad during 2001 - 2004
by (Chadee et al., 2006).
Figure 4.4.2: Seasonal variation of Dengue cases and rainfall in Belize (Source: Government of Belize, 2011)
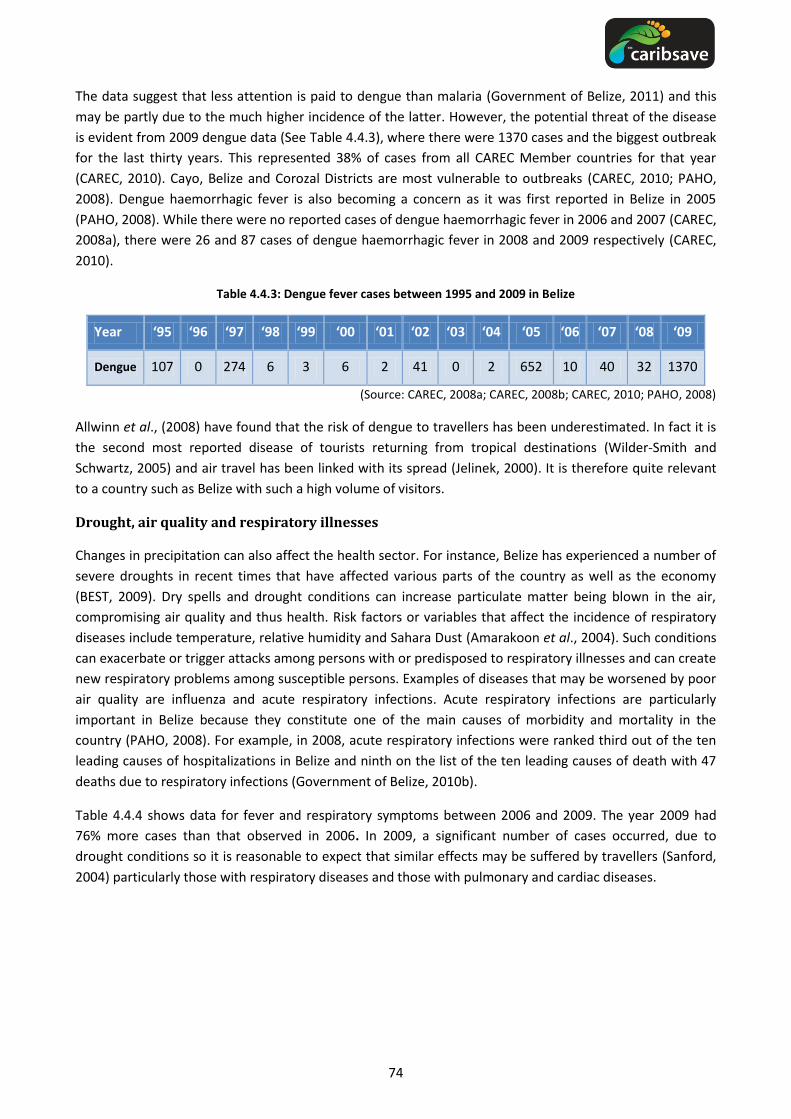
74
The data suggest that less attention is paid to dengue than malaria (Government of Belize, 2011) and this
may be partly due to the much higher incidence of the latter. However, the potential threat of the disease
is evident from 2009 dengue data (See Table 4.4.3), where there were 1370 cases and the biggest outbreak
for the last thirty years. This represented 38% of cases from all CAREC Member countries for that year
(CAREC, 2010). Cayo, Belize and Corozal Districts are most vulnerable to outbreaks (CAREC, 2010; PAHO,
2008). Dengue haemorrhagic fever is also becoming a concern as it was first reported in Belize in 2005
(PAHO, 2008). While there were no reported cases of dengue haemorrhagic fever in 2006 and 2007 (CAREC,
2008a), there were 26 and 87 cases of dengue haemorrhagic fever in 2008 and 2009 respectively (CAREC,
2010).
Table 4.4.3: Dengue fever cases between 1995 and 2009 in Belize
Year ‘95 ‘96 ‘97 ‘98 ‘99 ‘00 ‘01 ‘02 ‘03 ‘04 ‘05 ‘06 ‘07 ‘08 ‘09
Dengue 107 0 274 6 3 6 2 41 0 2 652 10 40 32 1370
(Source: CAREC, 2008a; CAREC, 2008b; CAREC, 2010; PAHO, 2008)
Allwinn et al., (2008) have found that the risk of dengue to travellers has been underestimated. In fact it is
the second most reported disease of tourists returning from tropical destinations (Wilder-Smith and
Schwartz, 2005) and air travel has been linked with its spread (Jelinek, 2000). It is therefore quite relevant
to a country such as Belize with such a high volume of visitors.
Drought, air quality and respiratory illnesses
Changes in precipitation can also affect the health sector. For instance, Belize has experienced a number of
severe droughts in recent times that have affected various parts of the country as well as the economy
(BEST, 2009). Dry spells and drought conditions can increase particulate matter being blown in the air,
compromising air quality and thus health. Risk factors or variables that affect the incidence of respiratory
diseases include temperature, relative humidity and Sahara Dust (Amarakoon et al., 2004). Such conditions
can exacerbate or trigger attacks among persons with or predisposed to respiratory illnesses and can create
new respiratory problems among susceptible persons. Examples of diseases that may be worsened by poor
air quality are influenza and acute respiratory infections. Acute respiratory infections are particularly
important in Belize because they constitute one of the main causes of morbidity and mortality in the
country (PAHO, 2008). For example, in 2008, acute respiratory infections were ranked third out of the ten
leading causes of hospitalizations in Belize and ninth on the list of the ten leading causes of death with 47
deaths due to respiratory infections (Government of Belize, 2010b).
Table 4.4.4 shows data for fever and respiratory symptoms between 2006 and 2009. The year 2009 had
76% more cases than that observed in 2006. In 2009, a significant number of cases occurred, due to
drought conditions so it is reasonable to expect that similar effects may be suffered by travellers (Sanford,
2004) particularly those with respiratory diseases and those with pulmonary and cardiac diseases.
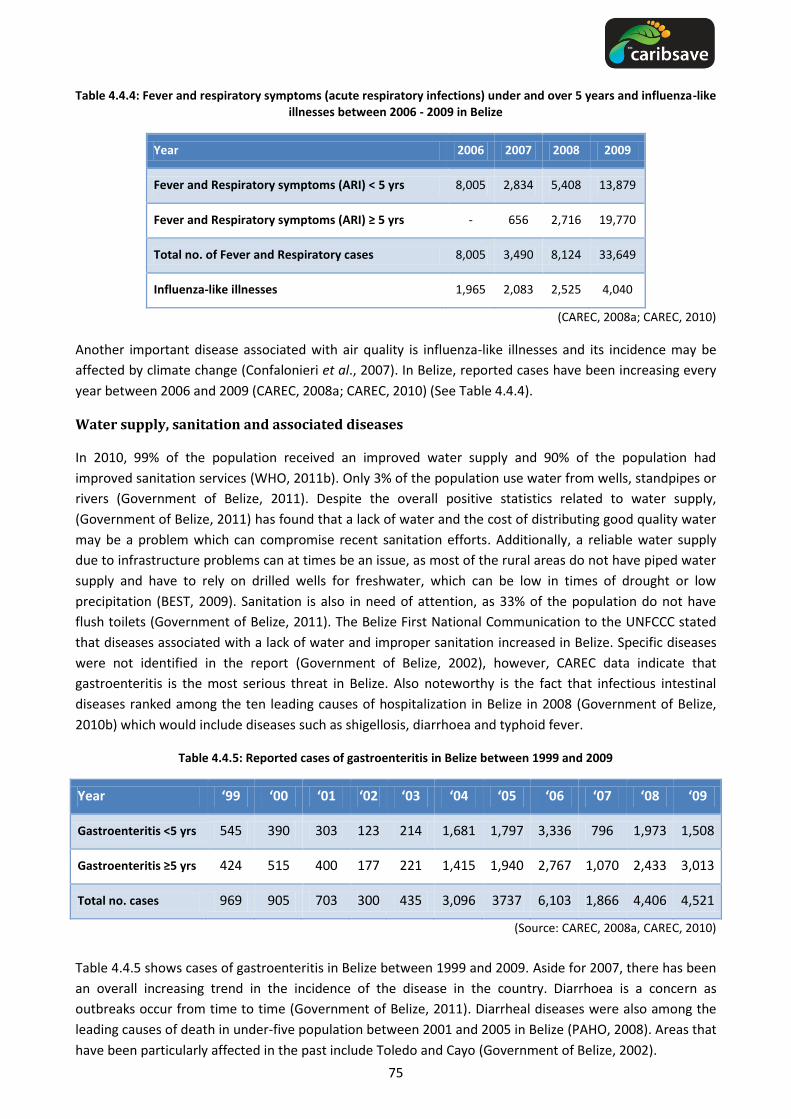
75
Table 4.4.4: Fever and respiratory symptoms (acute respiratory infections) under and over 5 years and influenza-like illnesses between 2006 - 2009 in Belize
Year 2006 2007 2008 2009
Fever and Respiratory symptoms (ARI) < 5 yrs 8,005 2,834 5,408 13,879
Fever and Respiratory symptoms (ARI) ≥ 5 yrs - 656 2,716 19,770
Total no. of Fever and Respiratory cases 8,005 3,490 8,124 33,649
Influenza-like illnesses 1,965 2,083 2,525 4,040
(CAREC, 2008a; CAREC, 2010)
Another important disease associated with air quality is influenza-like illnesses and its incidence may be
affected by climate change (Confalonieri et al., 2007). In Belize, reported cases have been increasing every
year between 2006 and 2009 (CAREC, 2008a; CAREC, 2010) (See Table 4.4.4).
Water supply, sanitation and associated diseases
In 2010, 99% of the population received an improved water supply and 90% of the population had
improved sanitation services (WHO, 2011b). Only 3% of the population use water from wells, standpipes or
rivers (Government of Belize, 2011). Despite the overall positive statistics related to water supply,
(Government of Belize, 2011) has found that a lack of water and the cost of distributing good quality water
may be a problem which can compromise recent sanitation efforts. Additionally, a reliable water supply
due to infrastructure problems can at times be an issue, as most of the rural areas do not have piped water
supply and have to rely on drilled wells for freshwater, which can be low in times of drought or low
precipitation (BEST, 2009). Sanitation is also in need of attention, as 33% of the population do not have
flush toilets (Government of Belize, 2011). The Belize First National Communication to the UNFCCC stated
that diseases associated with a lack of water and improper sanitation increased in Belize. Specific diseases
were not identified in the report (Government of Belize, 2002), however, CAREC data indicate that
gastroenteritis is the most serious threat in Belize. Also noteworthy is the fact that infectious intestinal
diseases ranked among the ten leading causes of hospitalization in Belize in 2008 (Government of Belize,
2010b) which would include diseases such as shigellosis, diarrhoea and typhoid fever.
Table 4.4.5: Reported cases of gastroenteritis in Belize between 1999 and 2009
Year ‘99 ‘00 ‘01 ‘02 ‘03 ‘04 ‘05 ‘06 ‘07 ‘08 ‘09
Gastroenteritis <5 yrs 545 390 303 123 214 1,681 1,797 3,336 796 1,973 1,508
Gastroenteritis ≥5 yrs 424 515 400 177 221 1,415 1,940 2,767 1,070 2,433 3,013
Total no. cases 969 905 703 300 435 3,096 3737 6,103 1,866 4,406 4,521
(Source: CAREC, 2008a, CAREC, 2010)
Table 4.4.5 shows cases of gastroenteritis in Belize between 1999 and 2009. Aside for 2007, there has been
an overall increasing trend in the incidence of the disease in the country. Diarrhoea is a concern as
outbreaks occur from time to time (Government of Belize, 2011). Diarrheal diseases were also among the
leading causes of death in under-five population between 2001 and 2005 in Belize (PAHO, 2008). Areas that
have been particularly affected in the past include Toledo and Cayo (Government of Belize, 2002).
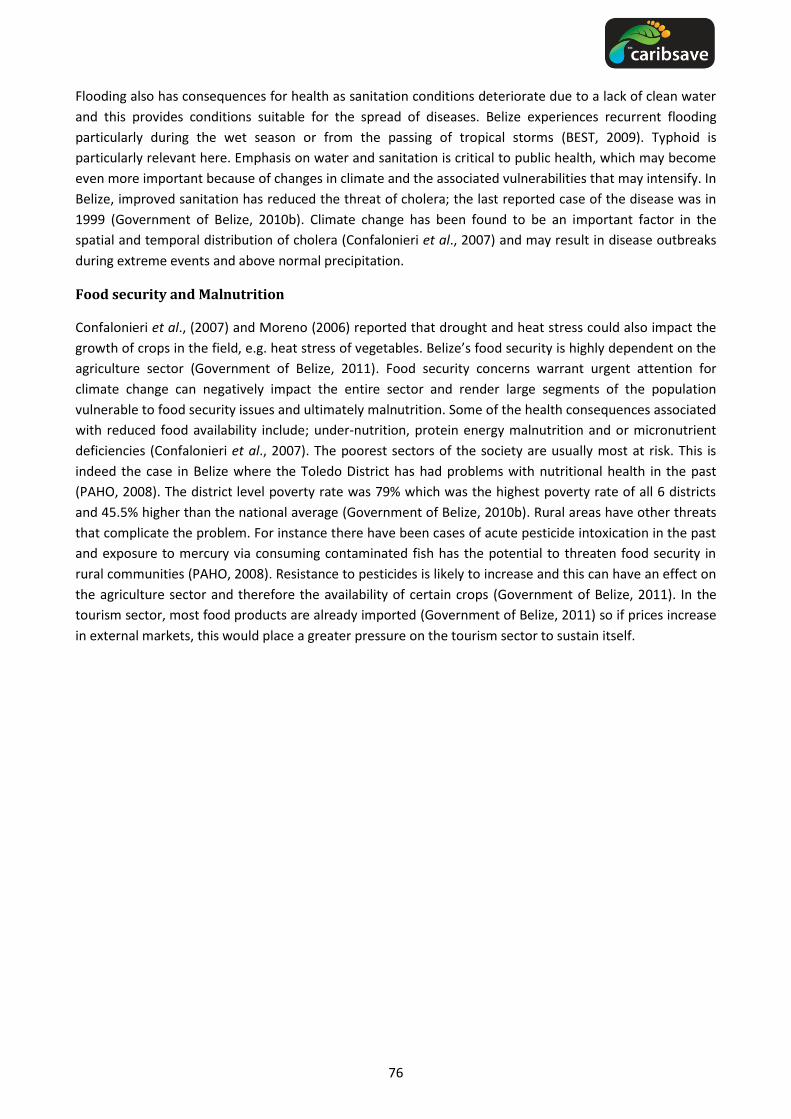
76
Flooding also has consequences for health as sanitation conditions deteriorate due to a lack of clean water
and this provides conditions suitable for the spread of diseases. Belize experiences recurrent flooding
particularly during the wet season or from the passing of tropical storms (BEST, 2009). Typhoid is
particularly relevant here. Emphasis on water and sanitation is critical to public health, which may become
even more important because of changes in climate and the associated vulnerabilities that may intensify. In
Belize, improved sanitation has reduced the threat of cholera; the last reported case of the disease was in
1999 (Government of Belize, 2010b). Climate change has been found to be an important factor in the
spatial and temporal distribution of cholera (Confalonieri et al., 2007) and may result in disease outbreaks
during extreme events and above normal precipitation.
Food security and Malnutrition
Confalonieri et al., (2007) and Moreno (2006) reported that drought and heat stress could also impact the
growth of crops in the field, e.g. heat stress of vegetables. Belize’s food security is highly dependent on the
agriculture sector (Government of Belize, 2011). Food security concerns warrant urgent attention for
climate change can negatively impact the entire sector and render large segments of the population
vulnerable to food security issues and ultimately malnutrition. Some of the health consequences associated
with reduced food availability include; under-nutrition, protein energy malnutrition and or micronutrient
deficiencies (Confalonieri et al., 2007). The poorest sectors of the society are usually most at risk. This is
indeed the case in Belize where the Toledo District has had problems with nutritional health in the past
(PAHO, 2008). The district level poverty rate was 79% which was the highest poverty rate of all 6 districts
and 45.5% higher than the national average (Government of Belize, 2010b). Rural areas have other threats
that complicate the problem. For instance there have been cases of acute pesticide intoxication in the past
and exposure to mercury via consuming contaminated fish has the potential to threaten food security in
rural communities (PAHO, 2008). Resistance to pesticides is likely to increase and this can have an effect on
the agriculture sector and therefore the availability of certain crops (Government of Belize, 2011). In the
tourism sector, most food products are already imported (Government of Belize, 2011) so if prices increase
in external markets, this would place a greater pressure on the tourism sector to sustain itself.

77
4.5. Marine and Terrestrial Biodiversity and Fisheries
4.5.1. Background
The Central American country of Belize is bordered to the north by Mexico and to the south and west by
Guatemala and has a total land area of 22,960 km2 split between the mainland (95%) and over 1,060 islands
(MONRECI, 2002). The original capital, Belize City has been repeatedly devastated by hurricanes due to its
exposure on the low-lying, northern coast (GFDRR, 2010). The country is primarily flat and low-lying with
large sections of coastline less than 1 m above sea level and for several kilometres inland. These areas are
largely calcareous. The highest point is found in the central Maya Mountain/Mountain Pine Ridge at 1,124
m (MONRECI, 2002). Most rivers flow from west to east through low-lying, often swampy, coastal plains
(Halcrow Group Limited, 2010).
The vegetation found is moist, wet subtropical forest with savannahs and pine on some granite areas.
Despite increasing land pressures from agriculture most of the country remains under natural vegetation
cover and there is an extensive system of protected areas that accounts for 33.4% of the country. Much of
the mainland of Belize forms part of the Mesoamerican Biological Corridor, which comprises a network of
protected areas linked by biological corridors, stretching from Mexico to Panamá. Belize has two large,
unified, blocks of intact virgin rainforest that are likely to be the last strongholds for species that require
large, undisturbed areas for their long-term survival, such as the jaguar.
The Mesoamerican Barrier Reef System, stretching the full length of the country's coastline, is the largest
unbroken coral reef complex in the Western hemisphere (MONRECI, 2002). In Belize, the reef's rich
diversity of corals and other marine life has qualified it to be designated a World Heritage Site, in
recognition of its consequent global importance. The Belize Barrier Reef includes offshore Cayes (islands),
of which only a few are inhabited and numerous lagoons. It is the reef and cay system that lies at the centre
of the country’s tourist industry offering diving and water sports (Halcrow Group Limited, 2010).
The country’s biodiversity and varied ecosystems form the foundation of its tourism industry which has
developed around small-scale, adventure or nature-based recreation activities with the second-largest
barrier reef system in the world, numerous limestone caves and tropical rainforests providing the
attractions. It is home to more than 150 species of mammals, 540 of birds, 150 of amphibians and reptiles,
nearly 600 species of freshwater and marine fish and 3,408 species of vascular plants. Despite the large
variety of species, the number of species endemic to Belize is low, since Belize is a small country and does
not have many habitats that are unique. Most of the few endemics are found in the Maya Mountains and in
the lowland savannas of Belize. The country contains a vast array of ecosystems, many of which are critical
habitats for threatened and endangered species.
Rainfall in Belize varies with location from at least 1,100 mm a year in the north to at least 3,800 mm in the
south; the largest value given for rainfall in the south is 5,500 mm(NMS, n.d.; MONRECI, 2002; Forest
Department, 2000). The rainy season begins in the south in May and reaches the north of the country in
June, continuing through to November (MONRECI, 2002). The driest part of the year is February to April,
when humidity also drops slightly from the typical 80% (MONRECI, 2002).
Forest
Belize is a highly forested country and is often cited as having the highest percentage of forest cover in
Central America with 62.7% of land area forested. The total area of forest is now estimated to be
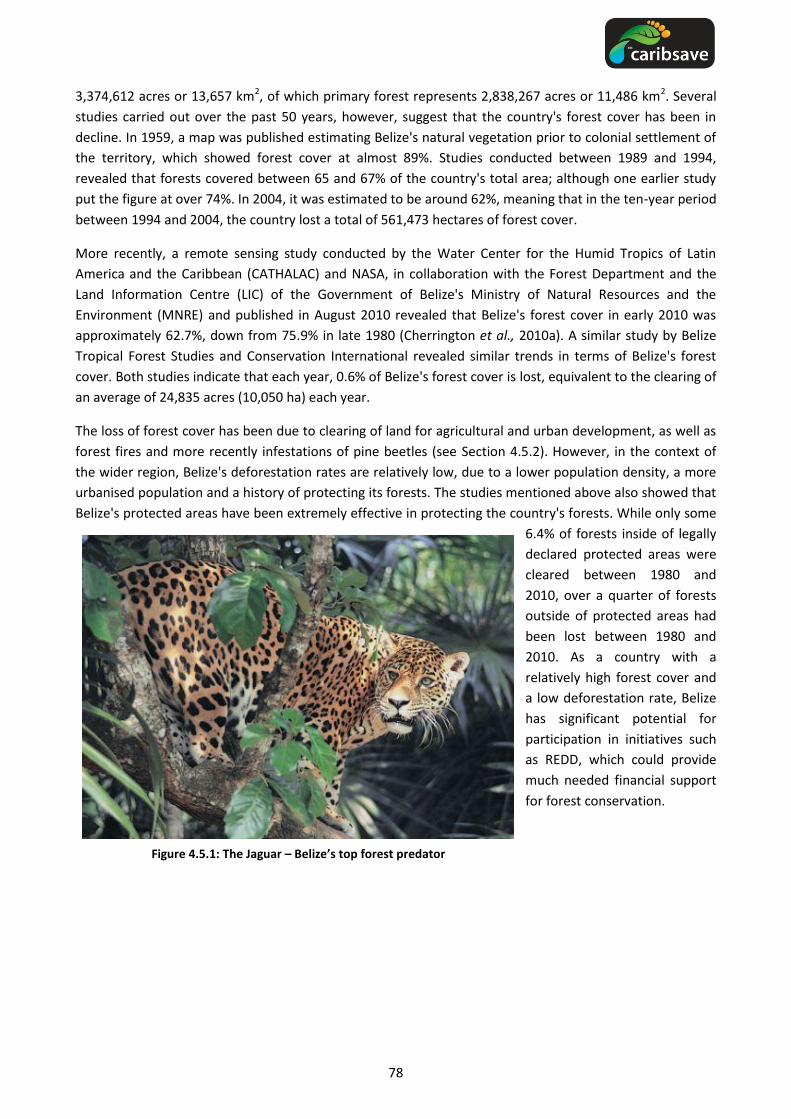
78
3,374,612 acres or 13,657 km2, of which primary forest represents 2,838,267 acres or 11,486 km2. Several
studies carried out over the past 50 years, however, suggest that the country's forest cover has been in
decline. In 1959, a map was published estimating Belize's natural vegetation prior to colonial settlement of
the territory, which showed forest cover at almost 89%. Studies conducted between 1989 and 1994,
revealed that forests covered between 65 and 67% of the country's total area; although one earlier study
put the figure at over 74%. In 2004, it was estimated to be around 62%, meaning that in the ten-year period
between 1994 and 2004, the country lost a total of 561,473 hectares of forest cover.
More recently, a remote sensing study conducted by the Water Center for the Humid Tropics of Latin
America and the Caribbean (CATHALAC) and NASA, in collaboration with the Forest Department and the
Land Information Centre (LIC) of the Government of Belize's Ministry of Natural Resources and the
Environment (MNRE) and published in August 2010 revealed that Belize's forest cover in early 2010 was
approximately 62.7%, down from 75.9% in late 1980 (Cherrington et al., 2010a). A similar study by Belize
Tropical Forest Studies and Conservation International revealed similar trends in terms of Belize's forest
cover. Both studies indicate that each year, 0.6% of Belize's forest cover is lost, equivalent to the clearing of
an average of 24,835 acres (10,050 ha) each year.
The loss of forest cover has been due to clearing of land for agricultural and urban development, as well as
forest fires and more recently infestations of pine beetles (see Section 4.5.2). However, in the context of
the wider region, Belize's deforestation rates are relatively low, due to a lower population density, a more
urbanised population and a history of protecting its forests. The studies mentioned above also showed that
Belize's protected areas have been extremely effective in protecting the country's forests. While only some
6.4% of forests inside of legally
declared protected areas were
cleared between 1980 and
2010, over a quarter of forests
outside of protected areas had
been lost between 1980 and
2010. As a country with a
relatively high forest cover and
a low deforestation rate, Belize
has significant potential for
participation in initiatives such
as REDD, which could provide
much needed financial support
for forest conservation.
Figure 4.5.1: The Jaguar – Belize’s top forest predator

79
Figure 4.5.2: Protected Areas of Belize
Mangroves
Spanning the intersection of land and sea, mangroves provide essential habitat for a wide diversity of
terrestrial and marine species. Mangrove stands buffer the impacts of storm surge and high-energy waves;
their root networks trap fine sediments and suspended particles thus contributing to the maintenance and
stabilization of shorelines. This function also serves to filter tidal waters reducing their turbidity and
improving water quality. Mangrove habitats provide breeding grounds for a host of economically important
marine organisms such as conch, lobster and fish. The forest canopy provides extensive habitat and
breeding areas for avian and reptilian species. Their high biological productivity provides a source for
available nutrients and forms a critical link between terrestrial and marine ecosystems, most notably coral
reefs and seagrass beds.

80
Mangroves provide an estimated US $174 – $249 million to the economy of Belize (Cooper, Burke, & Bood,
2009). The majority of Belize’s population and valuable real estate lies along coastal areas that are
sheltered by mangroves. Despite their importance to the country, Belize’s mangroves are facing a number
of threats, including pollution, deforestation, sedimentation and weak legislation. More recently, coastal
development has led to significant losses in mangrove cover, particularly near Placencia (Bood, 2008) and
Belize City on the mainland, as well as Ambergris Caye and other offshore cayes. Marine dredging in
sensitive areas such as the Pelican Cayes has led to smothering of reefs and damage to nursery habitats in
surrounding mangroves and seagrass beds (Melanie McField, Personal comm.).
A 2010 satellite-based study of Belize's mangroves by the World Wildlife Fund (WWF) and CATHALAC found
that in 2010, mangroves covered some 184,548 acres (74,684 hectares) or 3.4% of Belize's territory
(Cherrington et al., 2010b). In 1980, by contrast, mangrove cover stood at 188,417 acres (76,250 hectares),
also 3.4% of Belize's territory. Based on the work of Simon Zisman (1998) it is estimated Belize's mangrove
cover in 1980 represented 98.7% of the pre-colonial extent of those ecosystems, therefore Belize's
mangrove cover in 2010 was thus estimated to represent 96.7% of the pre-colonial cover. These figures
equate to a net loss of approximately 3,900 acres of mangrove cover over roughly 30 years, a loss of 2% of
the 1980 mangrove cover. The average annual net loss was estimated at 0.07%, or 125 acres.
In terms of the resilience of mangrove ecosystems, a mere 236 acres (96 hectares) of the area cleared
between 1980 and 2010 was detected to have grown back. It is also assumed that widespread mangrove
regrowth was likely not seen because land previously occupied by mangroves is permanently converted to
other land uses such as infrastructure for housing. Whereas recent publications such as the 2010 World
Mangrove Atlas indicate that a fifth of the world’s mangrove cover had been lost since 1980, the loss of 2%
of Belize’s overall mangrove cover between 1980 and 2010 can be considered low.
While the net loss is low, it is worth noting that the detailed assessment of 2010 (Cherrington et al., 2010b)
also revealed that 90.9% of mangroves cleared from 1980 - 2010 were very ecologically important
mangroves with ‘marine connectivity.’ It was also estimated that almost 90% of all mangrove clearing
occurred in four main areas: (i) the Belize City area and surrounding cayes, (ii) the Placencia peninsula and
surrounding cayes, (iii) Ambergris Caye and nearby islands and (iv) the Dangriga area and nearby cayes. At
the scale of 1:100,000, this assessment also reveals that land clearing resulted in fragmentation of some
2.1% of mangrove communities.
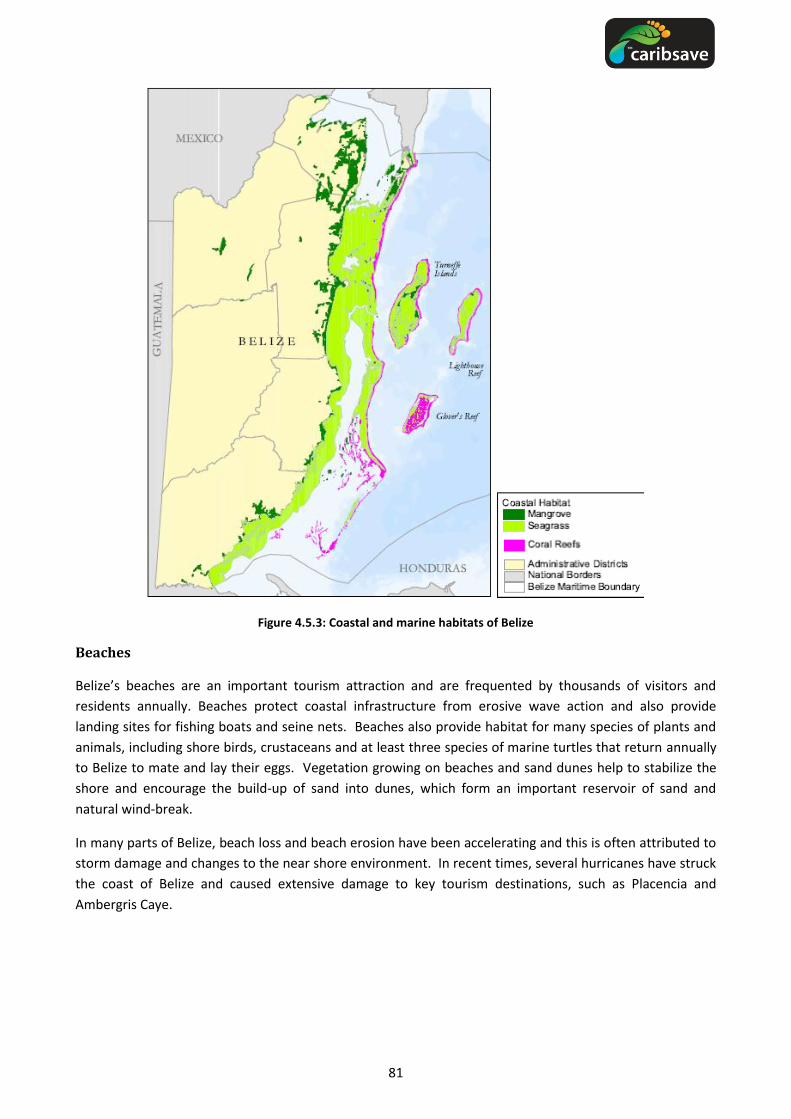
81
Figure 4.5.3: Coastal and marine habitats of Belize
Beaches
Belize’s beaches are an important tourism attraction and are frequented by thousands of visitors and
residents annually. Beaches protect coastal infrastructure from erosive wave action and also provide
landing sites for fishing boats and seine nets. Beaches also provide habitat for many species of plants and
animals, including shore birds, crustaceans and at least three species of marine turtles that return annually
to Belize to mate and lay their eggs. Vegetation growing on beaches and sand dunes help to stabilize the
shore and encourage the build-up of sand into dunes, which form an important reservoir of sand and
natural wind-break.
In many parts of Belize, beach loss and beach erosion have been accelerating and this is often attributed to
storm damage and changes to the near shore environment. In recent times, several hurricanes have struck
the coast of Belize and caused extensive damage to key tourism destinations, such as Placencia and
Ambergris Caye.
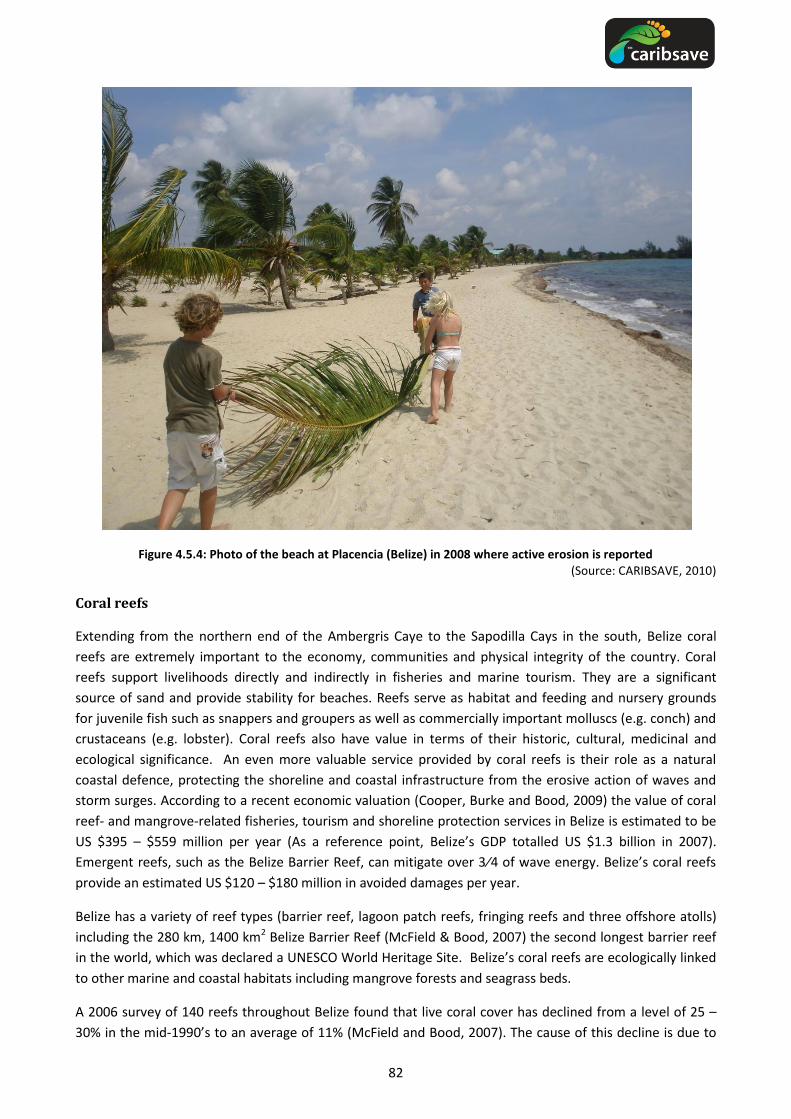
82
Figure 4.5.4: Photo of the beach at Placencia (Belize) in 2008 where active erosion is reported (Source: CARIBSAVE, 2010)
Coral reefs
Extending from the northern end of the Ambergris Caye to the Sapodilla Cays in the south, Belize coral
reefs are extremely important to the economy, communities and physical integrity of the country. Coral
reefs support livelihoods directly and indirectly in fisheries and marine tourism. They are a significant
source of sand and provide stability for beaches. Reefs serve as habitat and feeding and nursery grounds
for juvenile fish such as snappers and groupers as well as commercially important molluscs (e.g. conch) and
crustaceans (e.g. lobster). Coral reefs also have value in terms of their historic, cultural, medicinal and
ecological significance. An even more valuable service provided by coral reefs is their role as a natural
coastal defence, protecting the shoreline and coastal infrastructure from the erosive action of waves and
storm surges. According to a recent economic valuation (Cooper, Burke and Bood, 2009) the value of coral
reef- and mangrove-related fisheries, tourism and shoreline protection services in Belize is estimated to be
US $395 – $559 million per year (As a reference point, Belize’s GDP totalled US $1.3 billion in 2007).
Emergent reefs, such as the Belize Barrier Reef, can mitigate over 3⁄4 of wave energy. Belize’s coral reefs
provide an estimated US $120 – $180 million in avoided damages per year.
Belize has a variety of reef types (barrier reef, lagoon patch reefs, fringing reefs and three offshore atolls)
including the 280 km, 1400 km2 Belize Barrier Reef (McField & Bood, 2007) the second longest barrier reef
in the world, which was declared a UNESCO World Heritage Site. Belize’s coral reefs are ecologically linked
to other marine and coastal habitats including mangrove forests and seagrass beds.
A 2006 survey of 140 reefs throughout Belize found that live coral cover has declined from a level of 25 –
30% in the mid-1990’s to an average of 11% (McField and Bood, 2007). The cause of this decline is due to

83
over-fishing, pollution, sedimentation, increased population in coastal areas, weak legislation and the mass
coral bleaching events of 1995 and 1998.
Figure 4.5.5: Map of sediment delivery to Meso-American Barrier Reef (Source: http://archive.wri.org/pubs/pubs_description.cfm?pid=4256)
Seagrasses
Extensive seagrass beds are found along the entire length of Belize see Figure 4.5.3. The main species are
turtle grass (Thalassia testudinum) and manatee grass (Syringodium filiforme). These seagrass beds play an
important role as primary producers in the food chain of the reef community producing more than 4000 g
C/m2/yr. They also provide habitat, feeding, breeding, recruitment and nursery grounds for many marine
animals including the major commercial species. Seagrass beds also support large populations of manatees,
which are an important eco-tourism attraction in the tourism centres of San Pedro, Caye Caulker and
Placencia.
Seagrass beds also help in reducing sediment movement in near-shore waters and stabilize the coastline
during storms. These ecosystems are generally distributed along the coast in shallow water where sunlight
penetration is adequate to allow photosynthesis. Their location leaves them highly susceptible to run-off
from land based activities and to stressors arising from water sports activities.
Fisheries
The fisheries sector is primarily composed of small-scale artisanal fishers, who fish in the shallow waters off
the barrier reef and the three atolls (FAO, 2005). All of the major commercial species rely on reefs,
mangroves, or the sandy flats and seagrasses. Belize had over 2,000 licensed fishermen in 2006 and fishing
plays a significant role in both export and local markets, as well as a source of high quality protein for

84
coastal communities. Approximately 15% of the country’s licensed fishermen come from the northern
village of Sarteneja. In this village, fishing remains a family oriented activity, where boys begin working on
the family boat straight from school and later spend weeks at a time fishing sites up and down the Belize
coast (Kishore et al., 2006).
In recent years there have been increasing evidence of over-fishing in Belize and as yet unpublished studies
have shown a very marked decline in large reef fish (Prof. Peter Mumby, Pers. Communication). A 2007
study found a drop in catch per unit effort and landings per boat for the mutton snapper fishery at Gladden
Spit (Graham et al., 2007). Fishermen interviewed in a recent study (Cooper, Burke and Bood, 2009)
described a decline in catch and fish size over the past decade. Another study, of fish catch in Glover’s Reef
Marine Reserve during 2007, found that barracuda and parrotfish were the most frequently landed species
(WCS, 2008). The more desirable snapper and grouper species fell much further down on the list,
suggesting that populations of these key commercial species are declining in this area.
The reasons for the observed decline in fisheries landings are largely due to the increasing fishing effort,
which is now surpassing sustainable levels. The recent use of fish traps, which were brought to Belize by
fishermen from Jamaica, is also a major concern as this fishing technique is very unselective and damaging
to both fish stocks and benthic habitats. The use of gill nets, predominantly by Guatemalan fishermen, is
also a major concern for many fishermen and tour guides in Belize, who are concerned that the gillnet by-
catch of manatee, tarpon, permit and bonefish is threatening the sustainability of the valuable catch-and-
release fly fishing and ecotourism industries.
Catches of lobster and conch, after dropping from peaks in the early 1980s, have been relatively constraint
between 0.4 and 0.7 million pounds for both species in recent years (FAO, 2005; Belize Fisheries
Department, 2008). Some researchers argue that this may be primarily a result of increases in total effort
(Huitric, 2005). Belize has a five month closed season for lobster, lasting from February through June of
each year and a three month closed season for conch, beginning in July. Although the Fishermen’s
Cooperatives will not accept out of season or undersized catch, the common practice of selling directly to
restaurants and hotels (or over the border in Honduras and Guatemala) provides an easy market for illegal
catch (Heyman and Graham, 2000; Vernon, 2007). The fisheries department is also insufficiently funded to
enforce fishing regulations effectively across Belize’s entire marine area.
The recent arrival of the invasive lionfish (1st reported in Belize in 2008) is potentially a major threat to the
fisheries of Belize, as this rapidly expanding species is a voracious predator on small reef fish. To date very
few accounts of larger native fish predating on lionfish have been reported and local control measures are
unlikely to have a substantial impact on its population. Regional research on lionfish is increasing and
should be monitored closely for management recommendations. (see
http://www.gcfi.org/Lionfish/Lionfish.html for review of recent papers).
Aquaculture has had considerable variations in fortunes over the last decade with rapid growth in 2003
following the introduction of a resistant strain of farmed shrimp and an increase in the active pond acreage,
which resulted in a doubling of the farmed shrimp output(CBB, 2004). In 2007 the aquaculture industry
went bankrupt (Halcrow Group Limited, 2010), but is now showing signs of recovery since 2009 attributable
to increased production of farmed shrimp and conch(ECLAC, 2010b).
Marine Turtles
Three varieties of sea turtles (green, hawksbill and loggerhead) nest in Belize and are regularly located
between the coast and the barrier reef. Two out of three of the species found in Belize are considered
"Endangered" by the International World Conservation Union. Belize has laws to protect sea turtles, so that

85
harvesting of turtles or their eggs is illegal. The main threats are incidental capture and drowning of turtles
in gill nets and long lines. Shrimp trawlers also cause many turtle deaths as the Turtle Excluding Devices -
required for export of shrimp to the US - are often incorrectly installed. In 2007, shrimp trawlers in Belize
landed only 19 metric tons of shrimp (FAO) and discarded about 76 to 190 metric tons of other marine life,
including endangered turtles. The construction of sea walls, piers, tourist developments and coastal
properties, coupled with the use of dredging, anchoring and waste disposal, cause major destruction to sea
turtle habitat.
The Belize Turtle Watch Program was launched in March 2011 by ECOMAR, in partnership with the Belize
Fisheries Department, with support from WWF and PACT. The aim is to increase the level of knowledge on
sea turtles in Belize and to establish a baseline data set on abundance and nesting beach activity so that
changes over time, specifically those caused by climate change, can be measured. The Belize Turtle Watch
Program has many activities planned for 2011 that will involve the general public, coastal property owners,
recreational and professional divers and snorkelers, fishermen, marine protected area managers and other
NGOs.
The Sea Turtle Census 2011 consists of the In-Water and Nesting Beach Observation Programs where
marine guides and coastal property owners record their observations of sea turtles. The census relies on
interested business and individuals becoming supporters and volunteers in the project activities. Nesting
Beach Observations Kits will be prepared and distributed to Turtle Watch Volunteers that can monitor
beaches for nesting activity. Divers and snorkelers are encouraged to submit photos of any turtles they
have seen on the dives and especially those recorded in the logs that will be used in a photo ID program.
The photos will be used in a Belize Sea Turtle Photo Album to determine the range of resident turtles living
on the reefs.
4.5.2. Vulnerability of biodiversity and fisheries to climate change
Forest
While small changes in temperature and precipitation are known to have significant effects on forest
ecosystems, there has been little research focused on the projected impacts of climate change on
terrestrial biodiversity in the region. Climate change related variations in average daily temperature,
seasonal precipitation and extreme weather events will exacerbate the effects of existing human stressors
on forest ecosystems. Projected Annual changes in temperature by the 2080s indicate increase spanning
1.0 - 4.1˚C for the GCM ensemble Regional Climate Model (RCM) projections driven by ECHAM4 and
HadCM3 indicate more rapid increase in temperature over Belize than the median change projected by the
GCM ensemble under higher emissions scenario A2. RCM simulations driven by both ECHAM4 and HadCM3
boundary conditions indicate a decrease in mean annual rainfall for Belize by 22% and 29% respectively.
Annual observed trend for precipitation in Belize (1960 - 2006) is slightly negative, but not statistically
significant. On the other hand, GCM projections of future rainfall for Belize span both overall increases and
decreases, but tend towards decreases in most models. GCM projections of rainfall over Belize indicate
decreases in annual rainfall of -28 to +10 mm per month by 2080 under scenario A2. The projected changes
are higher during JJA and show wide variations in SON. The changes in seasonal precipitation simulated by
the RCM vary considerably depending on the driving GCM, but both RCMs indicate decreases in
precipitation under the A2 scenario. The RCM, driven by EHCAM4, indicates 32% decrease and, driven by
HadCM3, indicates 26% decrease in annual rainfall. The ECHAM4 driven RCM simulation indicates largest

86
proportional decrease of 67% in JJA. The HadCM3-driven RCM run indicates large proportional decrease in
rainfall for all seasons by 2080s with large proportional changes for JJA (-37%) and SON (-30%)
These projected changes in the average annual temperature and precipitation patterns will have profound
effects on the growth of trees and other plant species within Belize. Decreases in precipitation and
increased average daily temperatures could result in a loss of rainforest and an associated increase in the
tropical dry forest zones. Reduced moisture would result in forests becoming much drier, potentially
causing the wilting and death of epiphytes, which provide important habitat for birds, insects and reptiles
(Foster, 2001). The implications are a loss of habitat for many species, a loss of revenue for the eco-tourism
sector and a loss of other important ecosystem products and services. Assuming a cooling rate of 1oC per
150 m of altitude, a projected increase of 1.7oC would require vegetative zones to migrate vertically by 260
m and up to 530 m in a 3.5oC scenario (Day, 2009). The result could be a displacement of forests into
progressively smaller regions at the tops of mountains – possibly causing the loss of entire cloud forests if
vertical migration is not possible. One area that may be affected is the 400 km2 Cockscomb Basin Wildlife
Sanctuary in south-central Belize established to protect the forests, fauna and watersheds of the eastern
slopes of the Maya Mountains, including Victoria Peak the second highest mountain in Belize.
The loss of forest cover due to reduced soil moisture and forest fires will increase soil erosion. This will have
negative impacts on ecosystems downstream of their watersheds, such as mangroves, seagrass beds and in
particular coral reefs, where sedimentation and siltation rates will smother the polyps and reduce sunlight
penetration and their ability to photosynthesize.
Caribbean forests have always suffered physical damage from storms and there is evidence that the
increasing intensity of hurricanes is causing more severe damage, with potentially longer-term
consequences for the integrity of the forest structure and canopy. Severe damage to trees and animal
habitats may take years to return to normal.
Pine forests in Belize are struggling to recover from a devastating plague of pine beetles of the
Dendroctonus family. These small pine beetles have destroyed up to 70,000 acres (80%) of the Mountain
Pine Ridge Forest near Belize’s border with Guatemala. According to unpublished reports, droughts caused
by global warming weakened the trees, leaving them susceptible to beetle attacks. Moreover, rising
temperatures have also increased the reproduction rates of these beetles insects. Healthy pines can
tolerate the beetle attacks by secreting a substance that plugs the boreholes and drowns the beetles, but
unusually severe droughts for several years had weakened the trees in Belize. The blight attack was first
observed in 1999 and surged in 2003. Replanting of trees was to take place, but this was hindered by
ferocious forest fire that wiped out close to 20,000 acres of this natural biosphere reserve.
Mangroves
Observed and GCM ensemble projections of temperature change in the region will not likely have adverse
direct impacts on the country’s mangrove forests and wetlands. However, mangroves could be indirectly
impacted since increased temperatures will be damaging to coral reefs that mangroves depend on for
shelter from wave action and for interchange of nutrients. SLR is expected to pose the greatest climate
change threat to mangroves (McLeod & Salm, 2006). An estimated 2-8% of Belize’s wetlands are likely to be
impacted by 1-2 m SLR (Simpson et al., 2010). SLR and salt water intrusion will increase soil salinity and may
allow wetland vegetation to spread inland. However, if mangroves are obstructed from migrating inland
due to man-made infrastructure or the topography of the land, then they will eventually be overcome by
SLR and lost.

87
The location of mangrove stands along coastlines makes them particularly vulnerability to the impacts of
hurricane-force winds and storm surge. Extreme cyclonic events strip trees of their leaves, alter seed
dispersal and seedling recruitment and inundated root systems with sediment (Rathcke & Landry, 2003).
Mangrove species exhibit different responses to storm damage and a forest’s community structure could
thus be changed by tropical storms and hurricanes. The long term effects of extreme events on mangrove
stands are uncertain but will most likely mean a loss of the many essential services provided by these
ecosystems. A significant portion of fisheries catch may be negatively affected by the loss of mangroves.
The best approach is therefore to actively protect and replant mangrove forest where possible given the
economic and life saving benefits they offer. Community-led replanting activities in Placencia and Caye
Caulker have achieved positive results using new techniques such as the Riley-encasement methodology ,
see Recommendations.
Beaches
The beaches on the continental coastline and on the cayes of Belize have been damaged in recent years by
a series of violent and unusually frequent storms, including Hurricane Mitch (1998), Hurricane Keith (2000),
Hurricane Iris (2001), Hurricane Dean (2007) and Hurricane Richard (2010). While North Atlantic hurricanes
and tropical storms appear to have increased in intensity over the last 30 years, there is still debate
regarding whether this represents a long-term trend. Observed and projected increases in SSTs indicate
potential for continuing increases in hurricane activity and model projections (although still relatively
primitive) indicate that this may occur through increases in intensity of events (including increases in near
storm rainfalls and peak winds), but not necessarily though increases in frequency. RCM projections for the
Caribbean indicate potential decreases in the frequency of tropical cyclone-like vortices under warming
scenarios due to changes in wind shear.
Climate change, in particular the projected increase in SLR and extreme weather events, is likely to increase
rates of beach erosion. As sea levels rise gradually, shorelines retreat inland and beach area is reduced. A
reduction in the width of the beach buffer zone will leave coastal infrastructure more vulnerable to erosive
wave action and possibly result in the loss of critical fish landing sites.
Climate change impacts on beaches will also threaten the survival of species such as marine turtles, iguanas
and shore birds. A 1 to 2 m SLR is predicted to damage an astounding 44-60% of turtle nesting sites in
Belize (Simpson et al., 2010). Intense tropical cyclones and accompanying storm surges will also alter beach
profiles and impact on nesting areas (Simpson et al., 2010). Warmer average daily temperatures may skew
sex ratios in developing eggs and thereby reduced the reproductive capacity of sea turtles. Such impacts
will mean a disruption in marine ecosystem and a potential loss of revenue for the country’s expanding
ecotourism industry. As a signatory to the Convention on the International Trade of Endangered Species of
Wild Fauna and Flora (CITES), Belize has an obligation to protect these marine reptiles.
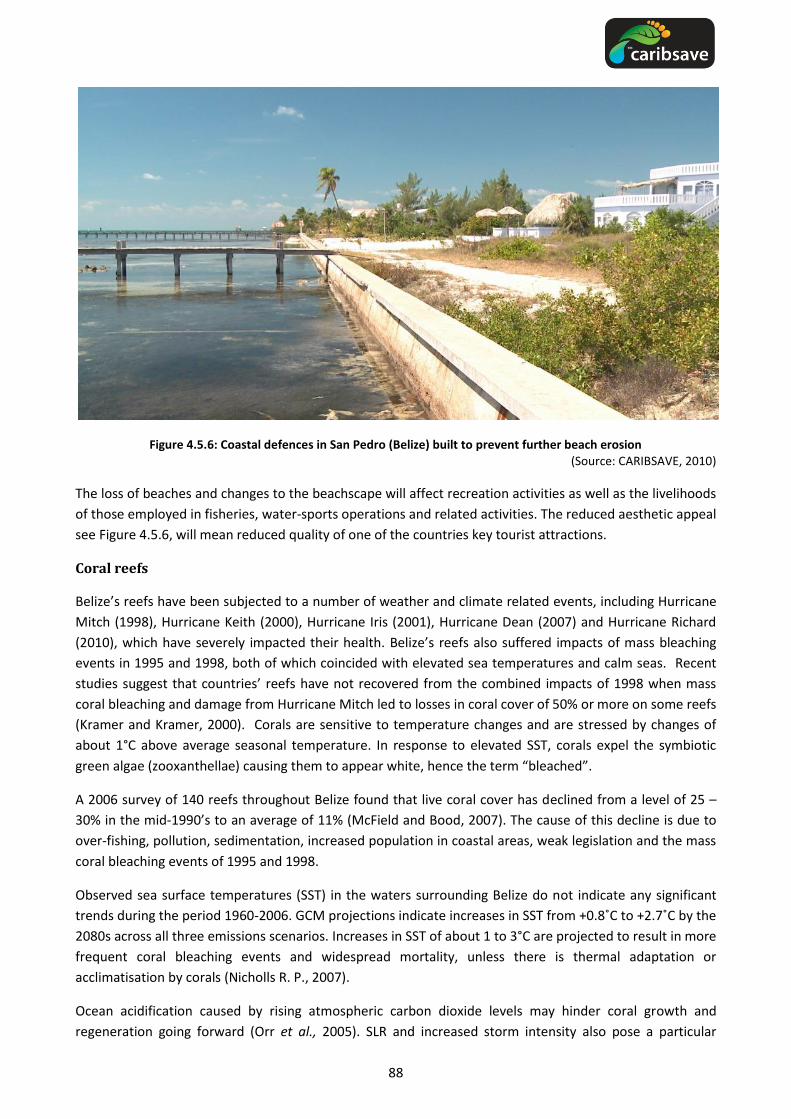
88
Figure 4.5.6: Coastal defences in San Pedro (Belize) built to prevent further beach erosion (Source: CARIBSAVE, 2010)
The loss of beaches and changes to the beachscape will affect recreation activities as well as the livelihoods
of those employed in fisheries, water-sports operations and related activities. The reduced aesthetic appeal
see Figure 4.5.6, will mean reduced quality of one of the countries key tourist attractions.
Coral reefs
Belize’s reefs have been subjected to a number of weather and climate related events, including Hurricane
Mitch (1998), Hurricane Keith (2000), Hurricane Iris (2001), Hurricane Dean (2007) and Hurricane Richard
(2010), which have severely impacted their health. Belize’s reefs also suffered impacts of mass bleaching
events in 1995 and 1998, both of which coincided with elevated sea temperatures and calm seas. Recent
studies suggest that countries’ reefs have not recovered from the combined impacts of 1998 when mass
coral bleaching and damage from Hurricane Mitch led to losses in coral cover of 50% or more on some reefs
(Kramer and Kramer, 2000). Corals are sensitive to temperature changes and are stressed by changes of
about 1°C above average seasonal temperature. In response to elevated SST, corals expel the symbiotic
green algae (zooxanthellae) causing them to appear white, hence the term “bleached”.
A 2006 survey of 140 reefs throughout Belize found that live coral cover has declined from a level of 25 –
30% in the mid-1990’s to an average of 11% (McField and Bood, 2007). The cause of this decline is due to
over-fishing, pollution, sedimentation, increased population in coastal areas, weak legislation and the mass
coral bleaching events of 1995 and 1998.
Observed sea surface temperatures (SST) in the waters surrounding Belize do not indicate any significant
trends during the period 1960-2006. GCM projections indicate increases in SST from +0.8˚C to +2.7˚C by the
2080s across all three emissions scenarios. Increases in SST of about 1 to 3°C are projected to result in more
frequent coral bleaching events and widespread mortality, unless there is thermal adaptation or
acclimatisation by corals (Nicholls R. P., 2007).
Ocean acidification caused by rising atmospheric carbon dioxide levels may hinder coral growth and
regeneration going forward (Orr et al., 2005). SLR and increased storm intensity also pose a particular

89
threat to coastal populations, which will make the buffering role played by coral reefs and mangroves
increasingly important as climate change intensifies.
Increased frequency of bleaching episodes means reduced recovery time for coral polyps, greater likelihood
of mortality and increased susceptibility to disease. Of further concern is that warmer oceanic waters will
facilitate the uptake of anthropogenic CO2, which creates additional stress on coral reefs. Increased CO2
fertilisation lowers seawater pH, potentially having a negative impact on coral and other calcifying
organisms since more acidic waters can dissolve and thus weaken the skeletal structure of such organisms
(Hofmann et al., 2010).
Other climate related impacts are expected from SLR and extreme events. Rising sea levels may reduce the
amount of available light necessary for the photosynthetic processes of corals and hurricanes can cause
extensive structural damage to coral reefs. The rugged nature of a reef helps to break up waves and
disperse wave energy, thereby protecting the shoreline from wave impact. However, in so doing, coral
reefs can be broken apart and even uprooted from the substrate. Climate change is expected to increase
the intensity of tropical cyclones and this will hinder the recovery of corals from damages experienced from
previous events.
The ability of coral reef ecosystems to withstand the impacts of climate change will depend on the extent
of degradation from other anthropogenic pressures and the frequency of future bleaching events (Donner,
2005). Coral reefs have been shown to keep pace with rapid postglacial SLR when not subjected to
environmental or anthropogenic stresses (Hallock, 2005). It is therefore increasingly important to reduce
the impacts of those local stressors over which there is a measure of control (e.g. overfishing, pollution,
siltation) in order to increase the resilience of coral reefs and hence their ability to adapt to the current and
future changes in their environment.
The increasing evidence of over-fishing in Belize (see section on Fisheries) and the recent shift towards
targeting parrotfish is a worrying trend that will reduce the health of coral reefs and their ability to
withstand and recover from the increasing impacts of climate change.
Figure 4.5.7: Coral reef near San Pedro (Belize) showing extensive mortality associated with pollution, over-fishing and mass coral bleaching events
(Source: CARIBSAVE, 2010)

90
Seagrasses
Climate change presents a relatively new threat to seagrass ecosystems and as such the impacts of climate
change on seagrass beds remain largely uncertain. Potential threats may arise from SLR, changes in
localised salinity, increased SST and intensity of extreme weather events. As with corals, SLR may reduce
the sunlight available to sea grass beds and hence reduce their productivity. While there is no consensus
amongst the models as to whether the frequencies and intensities of rainfall on the heaviest rainfall days
will increase or decrease in the region, increased rainfall could mean a localised decrease in salinity and
resulting decrease in productivity of sea grass habitats. On the other hand, CO2 enrichment of the ocean
may have a positive effect on photosynthesis and growth (Campbell, McKenzie, & Kerville, 2006).
Associated ocean acidification may not hamper primary productivity of sea grasses since photosynthetic
activity of dense sea grass stands have been shown to increase local pH. The impact of increased SST on
seagrass beds in the Caribbean is uncertain since studies have suggested that the photosynthetic
mechanism of tropical seagrasses becomes damaged at temperatures of 40 - 45°C (Campbell, McKenzie, &
Kerville, 2006).
Increasingly intense hurricanes can have severe impact on these ecosystems; after a hurricane, beaches are
often strewn with mats of dead seagrass. Periods of intense rainfall are likely to cause massive
sedimentation, thus increasing the turbidity of waters surrounding seagrass beds, smothering plants and
blocking essential light. Key economic sectors such as fisheries and dive tourism will likely suffer losses if
seagrass ecosystems are degraded.
Fisheries
Little is known about the long-term effects of climate change on the Caribbean Sea and on its fisheries. As
discussed in previous sections, climate change will generally have negative and possibly debilitating impacts
on those ecosystems that are important to various life stages of commercial fish, namely coral reefs,
seagrass beds and mangroves. Possible consequences are a reduction in the abundance and diversity of
reef fish, with implications for livelihoods, food security and the availability of seafood for the tourism
sector.
Increased periods of precipitation will increase the quantity of freshwater outflow into estuaries and the
near-shore areas causing localised desalination of coastal waters. The long-term effect of localised
desalination on fish, as well as on their critical habitats, is uncertain. Warmer waters may drive pelagic
species away from the tropics in search of cooler temperatures and could potentially alter breeding and
migration patterns.
Of further concern to the fisheries sector is the effect that global warming will have on the incidence of
vector borne diseases. Ciguatoxin infection tends to occur more frequently in northern Caribbean
countries. However, there is the concern that SST increases may expand the range of the infectious algae to
other parts of the Caribbean and increase the frequency of algal blooms that can contaminate some
seafood species (Confalonieri et al., 2007; Tester et al., 2010). Since 1980, a number of large-scale mass
mortalities of fish have occurred in the Caribbean Region but were poorly documented or researched
(Williams & Bunkley-Williams, 2000). The unprecedented scale of impacts from climate change on the
fisheries sector should give impetus to researching climate change impacts on regional fisheries and
motivate immediate action to build the resilience of the natural resources which support it and the
adaptive capacity of the people who depend on them.
91
4.6. Sea Level Rise and Storm Surge Impacts on Coastal Infrastructure
and Settlements
4.6.1. Background
Small islands and mainland territories have much of their infrastructure and settlements located on or near
the coast, including tourism, government, health, commercial and transportation facilities. With its high-
density development along the coast, the tourism sector is particularly vulnerable to climate change and
SLR. Belize is one of the Caribbean’s most important tourism destinations where the threat of SLR has been
identified as a particular concern in both the short and long-term. Belize relies on its tourist industry for
much of its national income and therefore the economic effects of SLR and storm induced erosions are very
significant. Of critical importance is the threat of beach erosion to the majority of existing and expected
tourism facilities sited in areas located near the coastline (e.g. Caye Caulker and San Pedro). This section of
the report will focus on the coastal vulnerabilities associated with ‘slow-onset’ impacts of climate change,
particularly inundation from SLR and SLR induced beach erosion, as they relate to tourism infrastructure
(e.g., resort properties), tourism attractions (e.g., sea turtle nesting sites) and related supporting tourism
infrastructure (e.g. transportation networks). These vulnerabilities will be assessed at both the national
(Belize) and local scale (Caye Caulker, Rocky Point, San Pedro), with adaptation and protection
infrastructure options discussed. Please refer to the Comprehensive Natural Disaster Management section
for climate change vulnerabilities and adaptation measures associated with event driven or ‘fast-onset’
hazards (e.g. hurricanes, storm surges, cyclones).

92
Figure 4.6.1: Belize - Overview Map
Coastal areas already face pressure from natural forces (wind, waves, tides and currents) and human
activities, (beach sand removal and inappropriate construction of shoreline structures). The impacts of
climate change, in particular SLR, will magnify these pressures and accelerate coastal erosion. Areas at
greatest risk in Belize are in Caye Caulker, Rocky Point and San Pedro, including notable resorts, tourist
attractions and transportation infrastructure that will therefore be affected by SLR. The estimated coastline
retreat due to SLR will have serious consequences for land uses along the coast (Mimura et al., 2007;
Simpson et al., 2010) including tourism development and infrastructure. A primary design goal of coastal
tourism resorts is to maintain coastal aesthetics of uninterrupted sea views and access to beach areas. As a
result, tourism resort infrastructure is highly vulnerable to SLR inundation and related beach erosion.
Moreover, the beaches themselves are critical assets for tourism in Belize, with a large proportion of
beaches being lost to inundation and accelerated erosion even before resort infrastructure is damaged.
4.6.2. Vulnerability of coastal infrastructure and settlements to climate change
As outlined in the Climate Modelling section, there is overwhelming scientific evidence that SLR associated
with climate change is projected to occur in the 21st Century and beyond, representing a chronic threat to
the coastal zones in Belize. The sea level has risen in the Caribbean at about 3.1 mm per year from 1950 to
2000 (Church, White, Coleman, Lambeck, & Mitrovica, 2004). Global SLR is anticipated to increase as much
as 1.5 m to 2 m above present levels in the 21st Century (Rahmstorf, 2007; Vermeer & Rahmstorf, 2009;
Grinsted, Moore, & Jevrejeva, 2009; Jevrejeva, Moore, & Grinsted, 2008; Horton, Herweijer, Rosenzweig,
Liu, Gornitz, & Ruane, 2008). It is also important to note that recent studies of the relative magnitude of

93
regional SLR also suggest that because of the Caribbean’s proximity to the equator, SLR will be more
pronounced than in some other regions (Bamber, Riva, Vermeersen, & LeBrocq, 2009; Hu, Meehl, Han, &
Yin, 2009).
Based on the SLR scenarios for the Caribbean (see SLR Modelling section) and consistent with other
assessments of the its potential impacts (e.g. Dasgupta et al., 2007), 1 m and 2 m SLR scenarios and beach
erosion scenarios of 50 m and 100 m were calculated to assess the potential vulnerability of major tourism
resources across Belize. Several beaches in the Caribbean have been monitored for several decades and
indicate there is change from season to season and from year to year, but the underlying trend in many
locations has been a loss of beaches due to accelerated erosion. Figure 4.6.2 illustrates that the impacts of
beach erosion and SLR are already occurring in Belize.
Figure 4.6.2: Evidence of Erosion and SLR in Caye Caulker, Belize
To examine the exposure of Belize to SLR, research grade Advanced Spaceborne Thermal Emission and
Reflection Radiometer (ASTER) Global Digital Elevation Model (GDEM) data sets that were recently
publically released by the National Aeronautics and Space Administration (NASA) and the Japanese Ministry
of Economy, Trade and Industry, were integrated into a Geographic Information System (GIS). The ASTER
GDEM was downloaded from Japan’s Earth Remote Sensing Data Analysis Centre using a rough outline of
the Caribbean to select the needed tiles, which were then loaded into an ArcMap document. The next step

94
was to mosaic the tiles into a larger analysis area, followed by the creation of the SLR scenarios as binary
raster layers to analyse whether an area is affected by SLR through the reclassification of the GDEM
mosaics (see Simpson et al., 2010 for a more detailed discussion of the methodology). These assessments
were used to calculate the impacts of SLR on Belize as a whole.
To examine SLR-induced coastal erosion, a simplified approximation of the Bruun Rule (shoreline recession
= SLR X 100) that has been used in other studies on the implications of SLR for coastal erosion was adopted
for this analysis. The prediction of how SLR will reshape coastlines is influenced by a range of coastal
morphological factors (coastal geology, bathymetry, waves, tidal currents, human interventions). The most
widely used method of quantifying the response of sandy coastlines to rising sea levels is the Bruun Rule.
This rule is appropriate for assessing shoreline retreat caused by the erosion of beach material from the
higher part of the beach and deposition in the lower beach zone, re-establishing an equilibrium beach
profile inland (Zhang, Douglas, & Leatherman, 2004).
Results from the calculated SLR-induced erosion for a 50 m and 100 m scenario on key tourism attractions
at the national level (resorts and sea turtle nesting sites) are provided in Table 4.6.1. Indeed if erosion is
damaging tourism infrastructure, it means that the beach will have essentially disappeared. With projected
50 m erosion almost all of the major tourism resorts would be impacted (95%), with all (100%) of the sea
turtle nesting sites impacted. With a 100 m erosion scenario, all (100%) of the major tourism resorts in
Belize will be at risk. Transportation infrastructure will also be negatively impacted, with a 1 m SLR
inundating 50% of the airport lands in Belize, 40% of the seaport lands and 4% of the major road networks.
Such impacts would transform coastal tourism, with implications for property values, insurance costs,
destination competitiveness, marketing and wider issues of local employment and the economic wellbeing
of thousands of employees.
Table 4.6.1: Impacts associated with 1 m and 2 m SLR and 50 m and 100 m beach erosion in Belize
Tourism Attractions Transportation Infrastructure
Major Tourism Resorts
Sea Turtle Nesting
Sites
Airport Lands
Major Road
Networks
Seaport Lands
SLR 1.0 m 73% 44% 50% 4% 40%
2.0 m 86% 60% - 6% -
Erosion 50 m 95% 100% - - -
100 m 100% - - - -
Belize is highly dependent on international tourism and the country will be particularly affected with annual
costs as a direct result of SLR. For instance, annual reductions in the contribution of tourism to Belize’s
national GDP as a result of reduced amenity value from beach loss due to SLR is estimated to be between
US $518 million in 2050 to over US $1.7 billion in 2080 (based on a mid-range scenario) (Simpson et al.,
2010). Infrastructure critical to the tourism sector that will be impacted by SLR will result in high capital
costs to rebuild the infrastructure. For example, to rebuild tourist resorts damaged and inundated by SLR is
estimated to amount to over US $2.1 billion in 2050, up to US $5 billion in 2080. Capital costs to rebuild
transportation infrastructure is also high, capital costs to rebuild airport lands is estimated to be between
US $57 million by 2050 to US $98 million by 2080. Capital costs to rebuild ports are estimated to be
between $38 million in 2050, to $66 million by 2080. Capital costs to rebuild major roads are estimated to
be between $11 million in 2050, to $19 million by 2080 (Simpson et al., 2010).
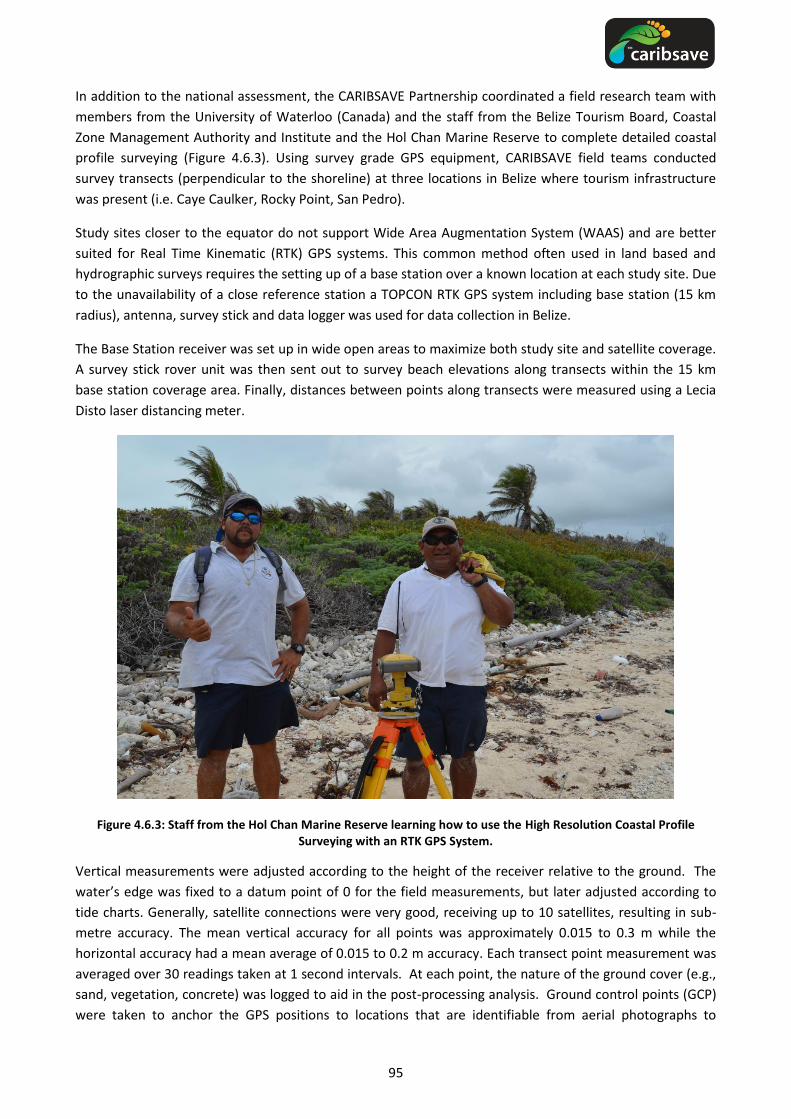
95
In addition to the national assessment, the CARIBSAVE Partnership coordinated a field research team with
members from the University of Waterloo (Canada) and the staff from the Belize Tourism Board, Coastal
Zone Management Authority and Institute and the Hol Chan Marine Reserve to complete detailed coastal
profile surveying (Figure 4.6.3). Using survey grade GPS equipment, CARIBSAVE field teams conducted
survey transects (perpendicular to the shoreline) at three locations in Belize where tourism infrastructure
was present (i.e. Caye Caulker, Rocky Point, San Pedro).
Study sites closer to the equator do not support Wide Area Augmentation System (WAAS) and are better
suited for Real Time Kinematic (RTK) GPS systems. This common method often used in land based and
hydrographic surveys requires the setting up of a base station over a known location at each study site. Due
to the unavailability of a close reference station a TOPCON RTK GPS system including base station (15 km
radius), antenna, survey stick and data logger was used for data collection in Belize.
The Base Station receiver was set up in wide open areas to maximize both study site and satellite coverage.
A survey stick rover unit was then sent out to survey beach elevations along transects within the 15 km
base station coverage area. Finally, distances between points along transects were measured using a Lecia
Disto laser distancing meter.
Figure 4.6.3: Staff from the Hol Chan Marine Reserve learning how to use the High Resolution Coastal Profile Surveying with an RTK GPS System.
Vertical measurements were adjusted according to the height of the receiver relative to the ground. The
water’s edge was fixed to a datum point of 0 for the field measurements, but later adjusted according to
tide charts. Generally, satellite connections were very good, receiving up to 10 satellites, resulting in sub-
metre accuracy. The mean vertical accuracy for all points was approximately 0.015 to 0.3 m while the
horizontal accuracy had a mean average of 0.015 to 0.2 m accuracy. Each transect point measurement was
averaged over 30 readings taken at 1 second intervals. At each point, the nature of the ground cover (e.g.,
sand, vegetation, concrete) was logged to aid in the post-processing analysis. Ground control points (GCP)
were taken to anchor the GPS positions to locations that are identifiable from aerial photographs to

96
improve horizontal accuracy. These were taken where suitable landmarks existed at each transect location
and throughout the country. GCP points were measured over 60 readings at 1 second intervals.
Following the field collection, all of the GPS points were downloaded on to a Windows PC, and converted
into several GIS formats. Most notably, the GPS points were converted into ESRI Shapefile format to be
used with ESRI ArcGIS suite. Aerial Imagery was obtained from Google Earth, and was geo‐referenced using
the GCPs collected. The data was then inspected for errors and incorporated with other GIS data collected
while in the field. Absolute mean sea level was determined by comparing the first GPS point (water’s edge)
to tide tables to determine the high tide mark. Three dimensional topographic models of each of the study
sites were then produced from a raster topographic surface using the GPS elevation points as base height
information. A Triangular Irregular Network (TIN) model was created to represent the beach profiles in
three dimensions. Contour lines were delineated from both the TIN and raster topographic surface model.
For the purpose of this study, contour lines were represented for every metre of elevation change above
sea level. Using the topographic elevation data, flood lines were delineated in one metre intervals. In an
effort to share the data with a wider audience, all GIS data will be compatible with several software
applications, including Google Earth.
The high resolution imagery provided by this technique is essential to assess the vulnerability of
infrastructure and settlements to future SLR in Belize. The imagery also has the ability to identify individual
properties, making it a very powerful risk communication tool. Having this information available for
community level dialogue on potential adaptation strategies is highly valuable. Detailed maps from the
three study locations in Belize are provided in Figure 4.6.4, Figure 4.6.5 and Figure 4.6.6, highlighting total
land and beach loss due to SLR.
Figure 4.6.4: Total Land and Beach Loss due to SLR, Caye Caulker Village, Caye Caulker

97
Figure 4.6.5: Total Land and Beach Loss due to SLR, Rocky Point, North Ambergris Caye
Figure 4.6.6: Total Land and Beach Loss due to SLR, San Pedro Town, Ambergris Caye

98
In Caye Caulker, total land loss due to SLR is projected to be 36,065.03 m2, with total beach losses of
4,327.43 m2, impacting several tourism properties including Caye Reef Beachfront Luxury, Ocean Pearl
Royale Hotel, Costa Maya Beach Cabanas and Sea Dreams Hotel (Figure 4.6.4). Rocky point is projected to
lose 24,897.16 m2 due to SLR, with almost double the total beach loss as Caye Caulker at 8,150.27 m2
(Figure 4.6.5). The greatest loss of total land and beach area to SLR is projected to occur in San Pedro
(Figure 4.6.6). Total land loss is estimated to be 101,068.19 m2, with a total beach loss of 38,779.16 m2. This
will impact a number of major tourism properties including Exotic Cay Resort, Belize Yacht Club, Ramon’s
Beach Resort, Sunbreeze Hotel, the Phoenix and Paradise Villas.
Beach area losses were calculated at the study sites in Belize for 0.5 m, 1 m, 2 m and 3 m scenarios (Table
4.6.2). At 0.5 m SLR scenario, Rocky Point is projected to lose 75% of its beach area, followed by San Pedro
(19%) and Caye Caulker (17%). With a 1 m SLR, Caye Caulker would lose almost its entire beach area (96%),
followed by Rocky Point (90%) and Sand Pedro (45%). With a 2 m SLR, both Caye Caulker and Rocky Point
would lose all (100%) of its beach area, with San Pedro losing its beach area with a 3 m SLR scenario.
Table 4.6.2: Beach Area Losses at Three Beach Areas in Belize
Caye Caulker Rocky Point San Pedro
SLR
Scenario
Beach Area
Lost To SLR
m²
Beach Area
Lost
(%)
Beach Area
Lost To SLR
m²
Beach Area
Lost
(%)
Beach Area
Lost To SLR
m²
Beach Area
Lost
(%)
0.5m 723 17% 6112 75% 7375 19%
1.0m 3424 96% 1251 90% 10147 45%
2.0m 180 100% 788 100% 18662 93%
3.0m - - - - 2596 100%

99
4.7. Comprehensive Natural Disaster Management
4.7.1. History of disaster management globally
Though natural hazards have been affecting populations and interrupting both natural and human
processes for millennia, only in the last several decades have concerted efforts to manage and respond to
their impacts on human populations and settlements become a priority. Most recently, these efforts have
been informed by work at the International Strategy for Disaster Reduction (ISDR), a United Nations agency
for disaster reduction created after the 1990s International Decade for Natural Disaster Reduction. After
several years of reporting on hazards and impacts, the ISDR created the Hyogo Framework for Action (HFA)
in 2005. This strategy aimed at preparing for and responding to disasters was adopted by many countries in
order to address a growing concern over the vulnerability of humans and their settlements. The HFA took
the challenges identified through disaster management research and practice and created five priorities:
Priority #1: Ensure that disaster risk reduction is a national and local priority with a strong
institutional basis for implementation
Priority #2: Identify, assess and monitor disaster risks and enhance early warning.
Priority #3: Use knowledge, innovation and education to build a culture of safety and resilience at
all levels
Priority #4: Reduce the underlying risk factors.
Priority #5: Strengthen disaster preparedness for effective response at all levels.
(ISDR, 2005)
Extensive elaboration of each priority is beyond the scope of this report. However, there are some key
points to discuss before moving forward to a discussion of the local disaster management context. Priority
#1 of the HFA can be thought of as the foundation for hazard and disaster management.
Given that governance and institutions also play a critical role in reducing disaster risk,…fully
engaging environmental managers in national disaster risk management mechanisms and
incorporating risk reduction criteria into environmental regulatory frameworks [are key options
for improving how institutions address disaster-related issues] (UNEP, 2007, p. 15).
The Hyogo Framework suggests strengthening effective and flexible institutions for enforcement and
balancing of competing interests (UNEP, 2007).
Priority #2 focuses on spatial planning to identify inappropriate development zones, appropriate buffer
zones, land uses or building codes and the use of technology to model, forecast and project risks (UNEP,
2007, p. 15). The development of technology for mapping, data analysis, modelling and measurement of
hazard information offers decision makers a much better understanding of the interaction hazards have
with their economy and society.
Priority #3 encourages the promotion and integration of hazard education within schools to spread
awareness of the risks and vulnerability to the individuals of at-risk communities. This relates to climate
change awareness as well. The countries of the Caribbean, including Belize, not only face annual hazards,
but will also be directly affected by changes in sea levels, more extreme temperatures and other predicted
climate changes. By educating children, hazard information will be transferred to adults and basic
knowledge about threats and proper response to hazards, as well as climate change, can help improve
community-level resilience. It is important that hazard and climate change awareness be promoted within

100
the tourism sector as well, since tourists may not be familiar with the hazards in their destination and will
thus require direction from their hosts.
Priority #4 of the HFA demands the synthesis of the previous three priorities: governance, education and
awareness and appropriate technologies. “To develop and implement effective plans aimed at saving lives,
protecting the environment and protecting property threatened by disaster, all relevant stakeholders must
be engaged: multi-stakeholder dialogue is key to successful emergency response” (UNEP, 2007). Not only is
this dialogue encouraged here; Goal 8 of the Millennium Development Goals (MDGs) also advocates for
participation and open communication. As climate change threatens the successful achievement of the HFA
and the MDGs, simultaneous dialogue about development and risk management will ensure continued
resilience in communities and countries across the Caribbean.
The final priority of the Hyogo Framework, Priority #5, is geared toward a more proactive plan of action,
rather than the reactive disaster management that has failed to save lives on many occasions in the past. It
is now commonplace to have this same proactive approach to disaster management. However, finding
ways to implement and execute these plans has proven more difficult (Clinton, 2006). As you will note,
managing disaster risks requires a cross-sectoral understanding of the interdependent pressures that
create vulnerability, as well as demanding cooperation of various sectors. It is unclear whether Belize has
adopted the HFA as they have not submitted a progress report. However, the framework monitoring and
reporting tools offer a guide that could be of use to Belize in assessing specific areas of the disaster
management system.
4.7.2. Natural hazards in the Caribbean and Belize
There are three broad categories of hazards and the countries in the Caribbean Basin could face all, or
most, of them at any given time.
Table 4.7.1: Types of Hazards in the Caribbean Basin
Hydro-meteorological Hurricane
Tropical Storm
Flooding
Drought
Storm Surge
Landslide/mud-flow
Geological Earthquake
Volcano
Tsunami
Biological Epidemic
Wildfire/Bushfire
Hydro-meteorological hazards: Belize is located in the hurricane belt and therefore has experienced many
hurricane and tropical storm impacts (Halcrow Group Limited, 2010). The primary hazards facing Belize are
hurricanes and tropical storms with high winds and flooding causing the principle damages to the country
(GFDRR, 2010). “Belize City is especially vulnerable to flood damage due to its very low-lying land and
exposed position on the coast... This spurred the Government to build a new capital at Belmopan, 50 miles
inland and to encourage the relocation of the main population centre. This move, although widely
commended, remains incomplete. The risk in Belize City therefore remains and it is estimated that the city
faces a 10% chance of hurricane storm wind speeds between 178 km/h-209 km/h during a ten-year period”

101
(GFDRR, 2010). While the Government would likely be able to still function from the new, safer location,
there remains a large population of persons still in the Belize City and a total of 45% of the population are
in low-lying, coastal areas.
Geological hazards: Belize is exposed only to a minor risk of earthquake and therefore, is also only exposed
to a small tsunami threat as well. The submarine volcano, Kick-‘em-Jenny near Grenada, has erupted 11
times since 1939, most recently in 2001; a Kick-‘em-Jenny eruption would generate waves that could reach
Belize (GFDRR, 2010).
Biological hazards: Health related disasters are possible in any country and there are vectors such as
mosquitoes that can transmit diseases. The mosquito population size is directly linked with climatological
factors and flooding or heavy rainfall can increase their nesting sites. Greater discussion of the links
between disasters, epidemics and climate is however, located in the section on Human Health
4.7.3. Case study examination of vulnerability
Belize has experienced losses and damages from recent disasters that are worth examining in order to
identify vulnerabilities in the country. Specifically, the post-disaster time period is one where vulnerabilities
can be identified and addressed through adaptation and recovery efforts. The following section will
describe some recent disaster events in Belize with the purpose of revealing the dynamic pressures that
generate and perpetuate vulnerability.
Hurricane Richard 2010
On October 21st 2010 Hurricane Richard, moving in a westerly direction, approached Belize as a Category 1
storm, with 90 mph winds (NEMO, 2010a). In preparation for landfall, 4,639 persons sought shelter and it is
suspected that even more coastal dwellers moved inland to be with family (NEMO, 2010a). Richard’s path
crossed through both Belize City and Belmopan, affecting some of the most populous towns and villages as
well in: Belize, Cayo, Orange Walk and Stann Creek Districts (NEMO, 2010a). Total direct losses from this
Category 1 storm are estimated at BZ $49.2 million including 831 destroyed houses (see Figure 4.7.1), 1,500
acres of unharvested orange and grapefruit trees (NEMO, 2010a).
The hurricane brought with it a storm surge of 3 to 5 feet that led to serious water damage to homes near
the coast (NEMO, 2010b). Infrastructure damages were seen in the public utility and tourism sector, among
other sectors. Damages to the electricity distribution system cost an estimated BZ $250,000 and resulted in
lost power over several days in parts of Belize (NEMO, 2010b). Water distribution systems were also
affected by the power loss. Damages to the tourism sector demanded reconstruction and repairs be
attempted in the short time left before the November start of the tourist season. Figure 4.7.2 shows the
worst affected areas and the wide coverage that Richard was able to reach due to the size of the cyclone.
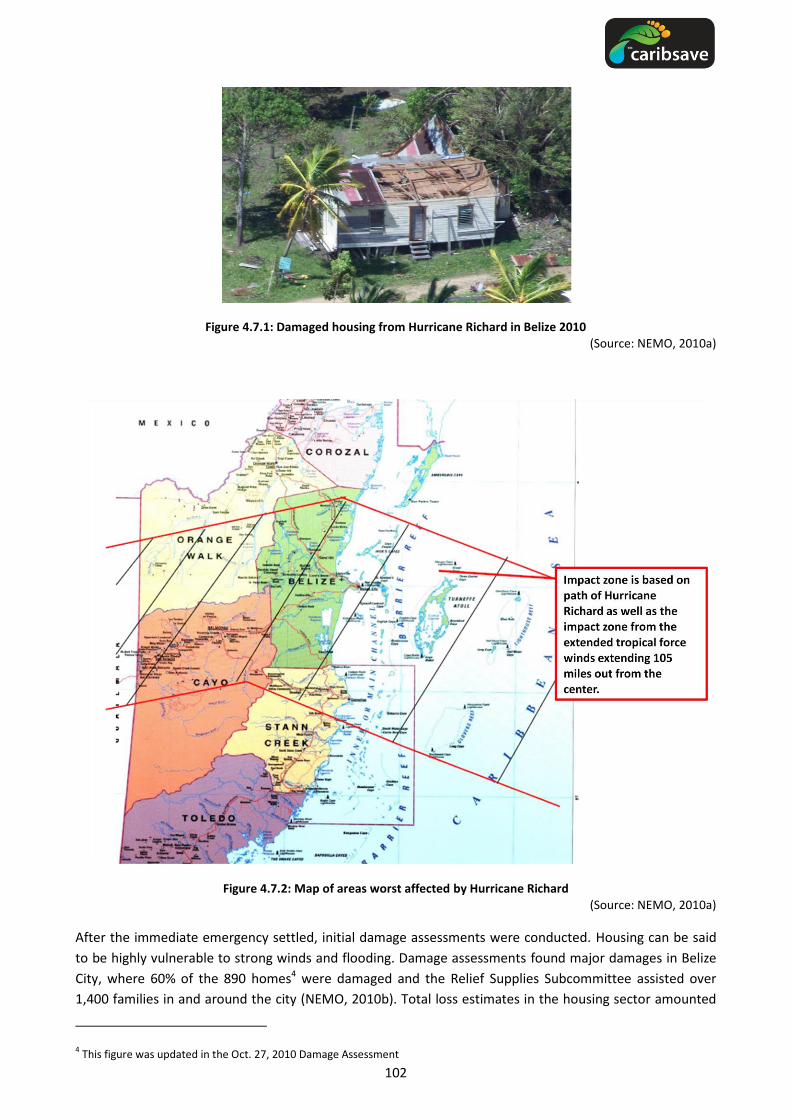
102
Figure 4.7.1: Damaged housing from Hurricane Richard in Belize 2010 (Source: NEMO, 2010a)
Figure 4.7.2: Map of areas worst affected by Hurricane Richard (Source: NEMO, 2010a)
After the immediate emergency settled, initial damage assessments were conducted. Housing can be said
to be highly vulnerable to strong winds and flooding. Damage assessments found major damages in Belize
City, where 60% of the 890 homes4 were damaged and the Relief Supplies Subcommittee assisted over
1,400 families in and around the city (NEMO, 2010b). Total loss estimates in the housing sector amounted
4 This figure was updated in the Oct. 27, 2010 Damage Assessment

103
to BZ $14.1 million. Health and Education sectors are less vulnerable to hurricanes as evidenced by the
minimal damages from wind impacts on windows and roofs, which subsequently resulted in water damages
to equipment and school supplies (NEMO, 2010b). There were no major interruptions to health services,
demonstrating the resilience and preparedness of the health sector.
Agriculture and fisheries were also impacted by Hurricane Richard. The vulnerability of these two industries
is tied to weather systems in both the long and the short term. The citrus trees damaged by the storm were
full of fruit that was quickly going to spoil if not retrieved from the ground and much of the fruit was too
immature for harvest at the time of the approaching storm. The losses in the citrus industry were estimated
to be 30% of the season’s crop, or BZ $29.1 million (NEMO, 2010b). The papaya industry also experienced
losses. These agricultural losses should only last one season, though Fisheries, in contrast, experienced
indirect impacts from damaged ecosystems (mangroves, corals and sea grasses). These damages will affect
fish catches long term. Direct losses to equipment and vessels affected both artisanal and commercial
fishers at an estimated cost of BZ $4.28 million (NEMO, 2010b). The specific discussion of vulnerability of
marine and terrestrial biodiversity and the agriculture sector are discussed in sections 4.5 and 4.3,
respectively.
Tsunami and Earthquakes
A tsunami is also possible in Belize and the earthquake near Honduras in 2009 stimulated wave action and
concern in the country. At the time of the 2009 earthquake, Belize did not have any seismological
monitoring, tsunami monitoring network, nor was there a tsunami early warning system in place (Williams
R. , 2009). As a result, Belize had to rely on the Pacific Tsunami Warning Center (PTWC) for information.
This system allowed tsunami warnings to reach coastal communities and towns within 15 minutes,
however no tsunami occurred and the warning was dropped after 90 minutes (Williams R. , 2009).
While there were no tsunami from the earthquake in 2009, many lessons were identified that could ensure
the development of an effective warning system following the event. Primary lessons related to the
communities’ lack of knowledge about what the alarms and sirens represented and their lack of knowledge
about how to react (evacuate) and where evacuation centres were located (Williams R. , 2009).
Furthermore, there are equipment needs that could improve the system – seismological monitoring
network and sea level monitoring are integral to rapid response (Williams R. , 2009). Vulnerability to
tsunamis in Belize is a concern, but efforts to learn the lessons identified after the 2009 earthquake have
started the process of vulnerability reduction. Across the Caribbean greater efforts are being made within
CDEMA and other agencies. The CARICOM Community Climate Change Centre (CCCCC), in Belize, have tidal
gauges that NEMO should have access to in real time as that would assist their national efforts (Williams R,
2009).
4.7.4. Vulnerability of the tourism industry in Belize
Belize has seen tropical storms, hurricanes and storm surge damage to its natural resources in the past and
although efforts to use structural protection (e.g. groynes and seawalls) have been attempted,
development has led to the degradation of many valuable natural protection elements. As a result, many
hotels and resorts remain vulnerable to disaster impacts (see detailed discussion in Section on Sea Level
Rise and Storm Surge Impacts on Coastal Infrastructure and Settlements).
To address the issue of disaster risk management (DRM) in the tourism industry, Belize’s Sustainable
Tourism Program has been initiated with specific DRM projects in some of the most tourism centred areas
of the country (Belize Sustainable Tourism Project, 2011). Throughout 2010 and 2011, National Stakeholder

104
Consultations have been conducted with the intention of creating site specific sustainable tourism plans
that coincide with the National Sustainable Tourism Master Plan. Disasters and emergencies have affected
many communities of Belize and thus DRM Plans are also being drafted for the communities of Placencia,
Cayo, Ambergris and Belize City (Belize Sustainable Tourism Project, 2011). The final part of the project is
an Institutional Strengthening and Capacity Building initiative.
Recognizing the need to further diversify the tourism product and promote a wider
distribution of benefits, complementary investments under the STP [sustainable tourism
project] will be made in developing new products, strengthening institutional capacity and
coordination (specifically targeting the way key institutions coordinate initiatives among
themselves and with private investors, conduct market research and monitor performance
of the sector) and in capacity building within two emerging destinations based on their
market potential and social needs (Belize Sustainable Tourism Project, 2011).
This project will assist in reducing vulnerability of the tourism industry and also help build resilience within
the institutions and businesses involved, directly and indirectly, in tourism activities. More on the adaptive
capacity that these and other plans offer Belize are included in the later policy discussions in section 5.7.

105
4.8. Community Livelihoods, Gender, Poverty and Development
Where disasters take place in societies governed by power relations based on gender, age
or social class, their impact will also reflect these relations and as a result, people’s
experience of the disaster will vary.
Madhavi Ariyabandu (ECLAC, UNIFEM and UNDP, 2005)
4.8.1. Background
The importance of tourism in Belize has increased significantly over traditionally central economic sectors
such as wood extraction, agriculture and fishing. Tourism depends heavily on the natural resource base and
in particular, marine resources are vital to the sustainability of the industry (Brune & Sanders, 2008). With
the growth in tourism, employment in this sector has increased commensurately. Several persons have
abandoned traditional economic activities to engage in tourism and young citizens joining the labour force
look to this sector for employment because it is perceived to be more lucrative. In Belize, as with other
Caribbean territories, women depend on tourism for employment more so than men. Approximately 15%
of employed women work in the tourism sector, compared to 8% of employed men (Halcrow Group
Limited, 2010). Males are more involved in the traditional economic activities (26% of employed males
work in agriculture) as well as construction (12% of employed males).
The recent global financial crisis affected several sectors and had a negative impact on employment.
Unemployment in Belize rose within the most recent years for which data is available and this incline is
more acute in the women and youth who are part of the labour force. Over half of the unemployed
population are under the age of 24. Women have historically recorded higher and more variable
unemployment rates than men and in 2009, unemployed women comprised 62% of the total unemployed
population in Belize (see Table 4.8.1). Women are more likely to be affected by economic shocks than men
(Halcrow Group Limited, 2010).
Table 4.8.1: Unemployment in Belize, 2002-2009
Year Unemployment (%) Women as % of
Unemployed Female Male Total
2002 15 7 10 50
2005 17 7 11 57
2007 10 8 9 43
2009 20 8 13 62
(Source: Halcrow Group Limited, 2010)
Poverty in Belize also appeared to have increased over the last decade. The Belize Country Poverty
Assessment (CPA; see Halcrow Group Limited, 2010) reported that in 2009, 31% of all households and 41%
of the Belizean population were deemed to be poor, which increased from approximately 25% and 34% of
households and population in 2002, respectively (see Figure 4.8.1 for individual poverty rates).

106
Figure 4.8.1: Individual Poverty in Belize, 2002 and 2009 (Source: Halcrow Group Limited, 2010)
Several reasons have been posited to rationalise the marked incline in poverty rates, but notably revolve
around (1) economic impacts and (2) weather and climate impacts which surfaced within the last 4-5 years:
The advent of the global financial crisis.
Slow economic growth and severe declines in agriculture (sugar cane, bananas) and fisheries,
coupled with a decrease in employment and corresponding increase in unemployment rates.
Limited multiplier effects from economic growth in some sectors.
The impacts of hurricanes (Hurricane Dean in 2007) and flooding (2008) on economic and social
sectors, but in particular, on agriculture (Halcrow Group Limited, 2010).
There is no direct relationship between gender and poverty. The difference in percentage of males (42%)
and females (40%) living in poverty is negligible. Female headed households (29%) are also less likely to be
poor compared to male headed households (32%), but only to a small degree. Approximately 60% of
female headed households also have no males of working age. Therefore, although women tend to have
heavier burdens as mothers and care givers, they demonstrate resilience in the absence of male support
(Halcrow Group Limited, 2010).
Other relationships between livelihoods, gender and poverty are highlighted in the 2009 CPA:
Households where heads are not employed are more likely to be poor.
Persons working in agriculture, manufacturing, construction and elementary (unskilled) sectors are
more likely to be living in poor households.
Male and female workers living in poor households are much more likely to be employed in
unskilled occupations and, conversely are much less likely to be employed in managerial and
professional occupations.
Female workers, whether poor or not poor, are concentrated in four occupational groupings:
managerial, etc., clerical, service workers and unskilled occupations; very few are employed as
agricultural, craft or skilled manual occupations. In contrast, male workers have a much more even
distribution of occupations.
Poverty rates of households where women are employed are generally lower than those with
working men. The implication is that households where women work are less likely to be poor. It
does not imply that women are earning more than men just that total household income will be
higher in these households.
66%
23%
11%
2002
58.7% 25.5%
15.8%
2009
Not poor
Poor, but not indigent
Indigent

107
If more women living in poor households are able to work, there is a greater likelihood that the
respective household can be lifted out of poverty. However, many of these women have full-time
responsibilities in child care and therefore are unable to be employed full-time (Halcrow Group
Limited, 2010).
Based on the existing conditions of these groups and the impacts that the recent economic downturn
would have had on the country, there are serious implications for individual, household and community
vulnerability to climate impacts; both gradual long-term changes and extreme short-term events.
4.8.2. Climate change vulnerability: Implications for community livelihoods,
gender, poverty and development
Belize is no stranger to severe weather and natural disasters. Some of the most significant events to impact
the country include Hurricane Hattie which destroyed the original capital (Belize City) in 1961, Hurricane Iris
in 2001, Hurricane Dean in 2007, major flood events in July and October 2008 (see Rappaport, Fernandez-
Partagas, & Beven, 1997; Halcrow Group Limited, 2010; Consejo Belize, 2011; also see the Vulnerability
Section on Comprehensive Natural Disaster Management). Vulnerability in the context of climate change is
a function of the level of exposure to climate change related or induced events, the level of sensitivity to
these events and the capacity to adapt. Climate and hydrological variability have both short and long term
manifestations at the global scale and is more often compounded by micro- and meso-scale human
activities and impacts. The observed and predicted impacts of climate change are widely acknowledged in
science and non-science circles, including communities who depend on natural resources.
Climate-sensitive or natural resource intensive livelihoods are very vulnerable to climate change impacts
because they depend so much on the stability of climate conditions or resources. As indicated previously,
groups predisposed to vulnerability include women, children and the poor, owing to their lack of access to
resources and opportunities which translates into low resilience and exposes them more to climate change
impacts than other groups. The impacts of climate change undeniably aggravate poverty in all societies and
especially where poverty is extreme and widespread (Figure 4.8.2 highlights some of these impacts). The
areas where impoverished persons reside are more often at greater risk when compared to areas inhabited
by stronger economic groups, particularly remote rural and coastal areas which are disconnected from
essential services and resources. The impacts and aftermath of extreme weather events (e.g. flooding,
drought, loss of lands and crops) and SLR (e.g. coastal erosion, salt water intrusion) deteriorate an already
dire situation and leave persons in poverty with even less resources to survive (Kettle, Hogan, & Saul, n.d.;
UNFPA, 2007).

108
Figure 4.8.2: The Impacts of Climate Change on Poverty
Gender is given special consideration in assessing human vulnerability owing to the different roles and
circumstances associated with men and women in society and especially in disaster preparation and
response. The Training Manual on Gender and Climate Change developed by the Global Gender and
Climate Alliance (GGCA) highlights that gender-based vulnerability is not influenced by a single factor, but
takes into account a number of factors, especially in the case of women who tend to have less or limited
access to assets when compared to men. These factors have been identified as determinant factors of
vulnerability and adaptive capacity and include physical location, resources, knowledge, technology, power,
decision-making, potential, education, health care and food (GGCA, 2009). The size and composition of an
individual or social group’s asset base (natural, physical, social, human and financial) will determine to what
extent they will be affected by and respond to climate change impacts. A larger quantity and/or diversity of
assets imply greater resilience and adaptive capacity. Conversely, a lack of assets will predispose individuals
to increased vulnerability.
While disasters create hardships for everyone, natural disasters kill, on average, more women than men or
kill women at a younger age than men (WHO, 2010b). In the Caribbean specifically, (Kambon, 2005)
highlighted the varied responses of gender to all stages of a natural disaster (predominantly hurricanes)
based on the observed social impacts of disasters following the 2004 Tropical Atlantic Hurricane season.
Some of these differences are highlighted in Table 4.8.2.
SEVERE WEATHER
•More frequent and intense floods
•Rising sea levels
•More frequent and intense storms
•More frequent and intense droughts
OUTCOMES
•Less land to use
•Loss of coastlines
•Loss of delta areas which are major sources of food production
•Spread of disease
•Increase in migration
IMPACTS ON POVERTY
•Increase in poverty owing to:
•less food and safe water
•less land for living and agriculture
•loss of livelihoods
•decline in health
•diversion of resources (people and money) away from fighting poverty to respond to disasters
(Source: Kettle, Hogan, & Saul, n.d.)

109
Table 4.8.2: Examples of Gender Differences in Response to Natural Disasters in the Caribbean
PHASE ISSUES FEMALE MALE
PRE-DISASTER
Differing Vulnerabilities
- Biological Reproductive health needs No special restrictions
- Social Restricted skill base Mobile skills
- Cultural Exclusion from home construction
Exclusion from child care responsibilities
- Attitudinal (risk perception) Low level of risk tolerance High level of risk tolerance
EMERGENCY
Different coping mechanisms Suffer higher incidence of depression (crying and suicide ideation)
Alcoholism, gambling and dysfunctional behaviour
Organizing community sing-alongs and storytelling
Rescuing villagers and clearing roads
TRANSITION (REHABILITATION AND RECOVERY)
Needs Social Composition
Weak access to wage earning possibilities
Easier access to wages/income
Women prepared one-pot meals for the community
Men engaged in ‘marooning’ teams for house rebuilding
Devoted more time to community and reproductive work
Spend more time in productive work; abandonment of families and domestic and/or other responsibilities
RECONSTRUCTION
Differing priorities Priorities for shelter, economic activity, food security and health care
Priorities for agriculture, infrastructural development and economic activity
Differing access to resources; Women slower to return to labour market
Men had easy access to the labour market
Reconstruction programmes that embark on development without the inclusion of gender analysis tools
Reconstruction programmes in construction and agricultural development that favour male participation
Differing access to power in the public sphere
Women’s lack of involvement in governance mechanisms
Gender neutral governance mechanisms that do not recognize changing gender roles and relationships and favour male participation
(Source: Kambon, 2005; adapted from ECLAC, UNIFEM and UNDP, 2005)
Outlined in the Climate Modelling Section of this document are the likely changes to occur for given climate
and ocean variables for Belize over the next few decades. The outputs produced for Belize by both the
RCMs and GCMs are very similar to those of other Caribbean territories. Some of the more outstanding
similarities include:
1. An increase in the mean annual temperature and the number of ‘hot’ days and nights.
2. The likelihood of more intense cyclones resulting from warmer sea surface temperatures, although
this is not conclusive.
3. The likelihood of a decline in mean annual rainfall and the total rainfall experienced during heavy
rainfall events.
4. The relative disappearance of ‘cold’ days and nights by the 2080s.
These projections are associated with different degrees of certainty, based on the availability of observed
(recorded) data, the outputs from model simulations and the fact that some physical processes are too

110
complex to be represented by these models. In light of this, current projections and the future reality may
be different. However, some of the trends indicated in these projections (up to 2080) are currently being
observed and therefore the likelihood of these projections taking effect should not be discounted. Based on
these projections, farmers in particular will face challenges in crop yields and outputs, having to deal with
drier conditions and variable rainfall. Hotter overall temperatures will also impact on general well-being
and comfort of citizens and variable rainfall will have implications for groundwater catchment and
availability if a decline prevails.
Simpson et al., (2010) mentions that some of Belize’s key vulnerabilities, with low-lying coastal plains and
extensive coral reef systems include coral bleaching, coastal erosion and inundation from SLR and storms
and salt water intrusion of ground water resources. SLR and storm surge impacts in particular pose
significant threats. Based on the same report, a 2 m SLR scenario could likely affect at least 44 (86%) major
tourism resorts, as well as local airport, seaport and energy infrastructure. When storm surge impacts are
superimposed on SLR effects, the consequences are much greater (Simpson et al., 2010). The projections
for climate and oceanic change have serious implications for tourism infrastructure (a large part of which is
coastal), the natural environment which supports tourism and fisheries activities and the preferred climate
for tourists, who may seek alternate destinations if conditions are continually less than favourable.
Other inferences can be made based on the projections outputted by both the Regional Climate Model and
Global Climate Models. What is certain is that current climate trends will change in one way or another and
will therefore affect those industries and activities that are climate sensitive and strongly dependent on
natural resources. Gradual weather changes, SLR and the potential for increasing intensity (and possibly
frequency which, although inconclusive, should remain a priority concern and be treated as such) of
extreme weather events will have substantial effects on livelihood assets and activities in Belize and in
particular - tourism and fisheries are extremely vulnerable. The current and future effects of climate change
will have significant implications for sector contributions to GDP, employment, existing poverty levels and
other facets of economic and social development (Alcamo, et al., 2007; Wilbanks, et al., 2007)
4.8.3. Case Study: Placencia, Belize
Overview
Placencia in Belize was selected as the community in which to implement the Community Vulnerability and
Adaptive Capacity Assessment methodology developed by The CARIBSAVE Partnership based on the
established criteria and recommendations from the Government of Belize. The Placencia community has
benefitted previously from vulnerability assessment work (see Bood, 2008; Brune & Sanders, 2008) and the
work of the CARIBSAVE Partnership adds to this by way of a tourism and gender lens in the context of
household and community vulnerability to climate change.
Placencia is a small town located in the Stann Creek District, where tourism is a major part of the local
economy. It is the most southern town on the largest peninsula of the Gulf of Mexico. The eastern side of
the Peninsula is a long expanse of white sand beach as well as mangrove in some areas; the western side is
bounded by a long narrow north-south trending bay of the Caribbean Sea. The District itself is the country’s
major producer of bananas and citrus fruits and there are several shrimp processing enterprises on the
coast, including in Placencia (Bood, 2008; Brune & Sanders, 2008). Tourism is a major part of the local
economy. The Stann Creek District employs the largest percentage (14%) of the labour force in the tourism
sector, compared to other districts and undoubtedly most of the tourism employees are concentrated in
Placencia (Halcrow Group Limited, 2010). Owing to the growth of tourism in the community, a number of

111
residents, especially fishermen, have changed their livelihoods to engage in tourism based activities which
require similar skills as their former job. Still, a number of the older fishermen have remained as traditional
fishermen (Brune & Sanders, 2008).
Despite the benefits that tourism has brought to the community, the environment is suffering as a result in
some cases. Brune and Sanders (2008) highlight that the deterioration of natural resources in Placencia and
surrounding areas are in part owed to the recently intense development of infrastructure, which rarely has
social or environmental benefits. Most developments are based around the establishment of large hotels
with little interest in community development or environmental protection. Additionally, some community
residents are dealing with pre-existing social and economic disadvantages, in terms of access to education,
employment and capital assets (land and housing have become much more expensive since the expansion
of tourism in the community). The unemployment rate in Stann Creek is fairly high (18% higher than the
national average for the same year) and women comprise a larger segment of the unemployed group
(Brune & Sanders, 2008; Halcrow Group Limited, 2010). These disadvantaged groups, as well as persons
working in tourism are some of the most vulnerable to the impacts of climate change.
The CARIBSAVE Community Vulnerability and Adaptive Capacity Assessment methodology employed
participatory tools to determine the context of these communities’ exposure to hazards and a livelihoods
framework to assess their adaptive capacity. All data were disaggregated by gender and the three main
means of data collection were: (i) a community vulnerability mapping exercise and discussion which were
the main activities in a participatory workshop; (ii) 3 focus groups (2 single-sex; and 1 for those in tourism-
related livelihoods); and (iii) household surveys to determine access to five livelihood assets (financial,
physical, natural, social and human). Livelihood strategies (combinations of assets) were evaluated to
determine the adaptive capacity of households and consequently the entire community. Even though
observations were specific to some parts within the study area, overall findings (assessments of
vulnerability and adaptive capacity) are assumed to be representative for the entire community.
Leadership and development in the community
Decisions on how the community is run and maintained are made by The Village Council, which falls under
the direction of Central Government. Where conflicts of interest may arise between the Council and
Government, Government’s decision remains final. The Council is elected and made up of roughly equal
numbers of men and women.
For residents, the cost of living in Placencia is perceived to be higher than in other regions of Belize.
Education is also considered to be “too expensive” and the education system is failing to adequately
prepare children for professional environments according to residents in Placencia.
Most upper-level management positions are held by non-locals who hire unskilled labour from outside of
the community to fill low-paying jobs. Education, qualifications and skill are very important if residents,
especially women, are to engage in a secondary or tertiary sector livelihood successfully.
Natural resources and community livelihoods
Placencia is surrounded by a number of natural resources, but most important of these are coastal and
marine resources, including the sea, beaches and marine life; which support important livelihood activities
in tourism and fishing. Mangroves are also important for fisheries, serving as nurseries for juvenile fish and
lobsters. Freshwater is sourced from aquifers and outlying areas have water towers. There is a piped water
supply for residents and businesses. However, water may be rationed during certain hours if availability is
limited.

112
Tourism is the community lifeline and any negative impacts on the industry would have ripple effects
throughout the community. Tourism related jobs mainly revolve around tour guiding and tour operator
enterprises and popular activities include manatee watching, whale shark watching, fly-fishing, sailing,
SCUBA diving and snorkelling. Tour guide and tour operator positions are mainly filled by men. Other areas
of work include low-paid, low-skilled positions such as table waiting, ancillary work and cooks at
restaurants/hotels as well as in home based businesses. These positions are mostly occupied by women.
Craft vending is also another tourism based activity, although the market also include locals.
Before tourism became the main activity in Placencia, the community was regarded as a fishing village.
Fishing is an important subsistence and livelihood activity, although there are fewer residents involved than
before. Most fishers are male, but there are some nearby areas (e.g. Riversdale) where there are more
female fishers. There is a local Fishing Co-operative with over 100 registered members (although only a
small percentage of the group are active members). There are plans to begin sea-weed processing in
Placencia, which would provide more employment opportunities for work in the community, especially for
women. Aside from tourism and fishing, community residents are also employed in the public and private
sector, working in areas such as education and office administration.
Despite the benefits of development, the community suggests that increasing technology has reduced
resource conservation. Previously, rainwater harvesting was a common practice and energy and water
conservation initiatives were employed because the resources were scare. However, with the introduction
of a piped water supply, easier access to electricity and electrical appliances, the community is now less
mindful of wastage. Livestock were also raised in the village previously, but this is now very rare, because of
limited space for these activities following continuous development. Crop cultivation is also uncommon as
space is limited and the soil is unsuitable for growth, resulting in heavy reliance on supermarkets and
groceries.
Community knowledge of climate change and observed changes to the natural environment
The term ‘climate change’ is not foreign in Placencia. The community in general is becoming more aware of
climate change and environmental issues through the media and television programmes such as National
Geographic, as well as recent work done in Placencia by the World Wildlife Fund (WWF) and the Belize
Tourism Board. Some residents also work with environmental awareness and protection groups. Most
residents therefore consider their knowledge of climate change to be average or above average and several
observations have been made of changing weather and climate patterns, as well as changes to the natural
environment.
Some changes include more extreme high and low ambient temperatures, especially uncommonly low
temperatures (i.e. below 50°F); and the apparent merging of seasons. Extremely high sea surface
temperatures are known to have caused the 2005 mass coral bleaching event in the Caribbean and the
lagoon is also much warmer than before. Residents also reported an increase in the incidence of ‘freak
storms’, or localised tropical storm-type conditions. There has also been an increase in the severity of direct
and indirect hurricane impacts over the past few years. In particular, the southern end of peninsula seems
to be more susceptible to storm surge impacts and there are reports of more intense flooding in the area.
There are also concerns that changes in tidal patterns (higher than normal tides) and SLR are causing salt
water intrusion into groundwater aquifers on both sides of the lagoon.
Fish stocks have decreased significantly, to the detriment of fishermen and dive operators. Previously
abundant marine species are either scarce or non-existent. For example, sea horses were once abundant in
Placencia’s coastal waters but are now rarely sighted. Additionally, manatees, stingrays and starfish are not

113
seen as frequently. However, new species of shark are increasingly sighted. More butterflies were also
observed this year (2011), believed to be as a result of colder weather.
While climate change is blamed in part for these trends, human development activities are blamed for
some of the observed changes in wildlife distribution. Overfishing and lack of enforcement of fisheries
regulations was cited as a problem. Increased sightings of crocodiles and racoons in urban areas are likely
because of disturbances to their natural habitats. Currently, there is no plan to address the increase in
crocodiles or other wildlife which are being displaced from their habitats. Development activities are also
blamed for some of the beach erosion trends that have been observed over recent years. There are
concerns about a solid waste dump at the northern end of the peninsula, as it is likely that seepage from
this dump can contaminate groundwater resources. Mangroves are cleared along lagoon to make room for
development although there is some replanting and regulating of mangrove use.
Impacts of weather and climate on community livelihoods and development
Tourism livelihoods are highly dependent on stable weather, calm seas, clear waters and healthy stocks of
marine species. Artisanal fishers who catch finfish as well as conch and lobster also depend on similar fair
weather conditions. With the occurrence of extreme weather, livelihood activities are interrupted and
families that depend on income made from these activities suffer as a result. At the household level, both
men and women are vulnerable to the same physical impacts. From the livelihood perspective, men are
vulnerable owing to greater numbers employed in tourism and fisheries. However, more women occupy
low-paying positions, which make it difficult for them to cope with and recover from a crisis.
Hurricanes are the most destructive weather impacts on the community. Hurricane Iris in 2001 was one of
the most severe systems to affect the country. Iris was a Category 4 system as it passed to the south of
Placencia, devastating the southern portion of the peninsula. Up to 95% of homes were significantly
damaged and extensive repairs were required. The local primary school was closed for a month and
telecommunications, water and electricity supplies were interrupted for months. The natural environment
was also negatively impacted, with high mortality amongst conch, fish and coral reefs. Businesses and
residences are located throughout the peninsula, but are mainly concentrated at the lower end, which is
more susceptible to storm damage.
Placencia has also experienced flooding resulting from heavy, continuous rainfall. Flooding events are
mostly short-lived, because the sandy substrate allows water to infiltrate through the ground quickly.
However, there is only one road in and out of Placencia and for the duration of any flood, there is no access
to and from the community. Newer housing developments with more impermeable foundations are also
believed to be exacerbating flood events. However, whereas these houses, mainly middle-income
households, are slightly raised above the ground, pre-existing housing structures are at ground level (some
occupied by the poorest residents in the community) and are more exposed to flooding impacts.
Previous torrential rainfall events filled fishing and tour boats with water and caused some of them to sink.
Engines had to be repaired or replaced, which a very costly exercise for artisanal fishers. Currently, there is
no shelter facility for small vessels during inclement weather. Heavy rains also increase the volume and
velocity of river flow, which flushes sediment and solid waste into the nearshore. This affects coral reefs
and particularly large debris (e.g. tree trunks) can damage small boats near the river mouth.
Local reefs, which are still recovering from the increasingly severe bleaching events within the last two
decades, remain threatened by increased storm events, natural diseases and fishing pressure. The good
health of reef systems is an important component of the tourism product and supports local fisheries. If
these reef systems are not allowed to recover, there will be serious consequences for these livelihoods.

114
There is a coral restoration project in the Laughing Bird Caye Marine Reserve which was implemented in
2006. The project had been successful thus far in re-growing reef-building coral, but has experienced set
backs from storm damage when rough seas break up new coral growth.
Temperature variability has implications for human health and comfort. With warmer days, the use of air-
conditioning units has become more popular and energy consumption is increasing as a result. Conversely,
extreme low temperatures are having detrimental impacts on agriculture, outside of the community but
within the District (a large percentage of the agriculture labour force are concentrated in Stann Creek and
some reside in Placencia; see Halcrow Group Limited, 2010). Warmer temperatures accelerate the life cycle
of mosquitoes, which causes them to breed faster and in larger numbers.
While not a result of climate change, earthquakes and other non-climate related issues can deepen the
community’s overall vulnerability to any economic or natural shock. The earthquake which occurred in
2009 caused significant damage to the community on the peninsula, weakening the structural integrity of
buildings and causing damage to property.
Coping strategies and disaster management in the community
With the constant threat and impact of hurricanes and flooding, community residents have adopted various
coping strategies and both men and women respond in similar ways to extreme weather, although few
appear to be gender-specific. Residents suggest that the sandy substrate makes it difficult to build
hurricane-proof structures. However, In the event of a hurricane, residents gather and store necessary
emergency supplies, food and important documents; and protect the house structure however possible. In
households with both able bodied men and women present, women take on more domestic preparation
tasks, whereas men attend to more physically-demanding tasks (affixing shutters, securing roofs). In
households with a single head (male or female) all responsibilities tend to fall on their shoulders.
At the community level, there are shelters provided by the Government in Independence and north-west
regions, which residents in Placencia can evacuate to in the event of a hurricane or tropical storm. It is also
known that there is a plan in place to evacuate Placencia by road and/or open seas if the need arises, which
fits into a larger National Emergency Plan. However, it is suggested that the plan is not widely adhered to.
In the aftermath of any event, if the community is affected significantly, residents come together in efforts
to restore the community to pre-event levels.
Water storage was previously done to cope with dry spells. However, since water is now readily available
and pumped into the homes, drought concerns have decreased. Likewise, flood waters that result from
heavy rains are not of much concern to most residents. However, heavy rains have proven disastrous for
fishermen before. Although boats are not hauled out of the water, fishers have adopted the practice of
removing the stern from the water (one of the heaviest parts of the boat) to protect against the likelihood
of sinking in heavy rainfall.
Several national and international agencies are implementing projects to protect and enhance the natural
environment and also to make the community more resilient to climate impacts. Some of these initiatives
are outlined in Table 4.8.3:
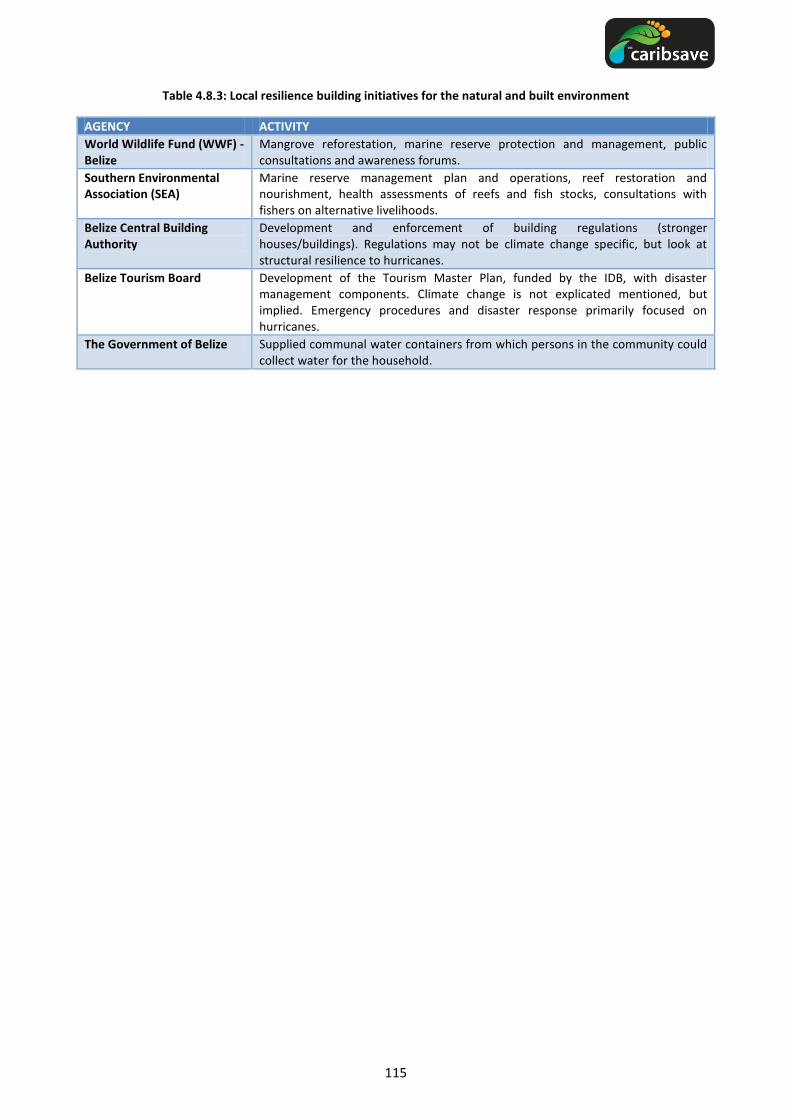
115
Table 4.8.3: Local resilience building initiatives for the natural and built environment
AGENCY ACTIVITY
World Wildlife Fund (WWF) - Belize
Mangrove reforestation, marine reserve protection and management, public consultations and awareness forums.
Southern Environmental Association (SEA)
Marine reserve management plan and operations, reef restoration and nourishment, health assessments of reefs and fish stocks, consultations with fishers on alternative livelihoods.
Belize Central Building Authority
Development and enforcement of building regulations (stronger houses/buildings). Regulations may not be climate change specific, but look at structural resilience to hurricanes.
Belize Tourism Board Development of the Tourism Master Plan, funded by the IDB, with disaster management components. Climate change is not explicated mentioned, but implied. Emergency procedures and disaster response primarily focused on hurricanes.
The Government of Belize Supplied communal water containers from which persons in the community could collect water for the household.

116
5. ADAPTIVE CAPACITY PROFILE FOR BELIZE
Adaptive capacity is the ability of a system to evolve in order to accommodate climate changes or to
expand the range of vulnerability to which it can cope (Nicholls et al., 2007). Many small island and low-
lying coastal developing states have low adaptive capacity and adaptation costs are high relative to GDP
(Mimura et al., 2007). Overall the adaptive capacity is low due to the physical size of nations, limited access
to capital and technology, shortage of human resource skills and limited access to resources for
construction (IPCC, 2001). Low adaptive capacity, amongst other things, enhances vulnerability and
reduces resilience to climate change. While even a high adaptive capacity may not translate into effective
adaptation if there is no commitment to sustained action (Luers and Moser, 2006). In addition, Mimura et
al. (2007) suggest that very little work has been done on adaptive capacity of small island and low-lying
coastal developing states; therefore this project aims to improve data and knowledge on both vulnerability
and adaptive capacity in the Caribbean to improve each country’s capacity to respond to climate change.
Information on the following factors was gathered, where possible to reflect adaptive capacity for each
socio-economic sector:
Resource availability (financial, human, knowledge, technical)
Institutional and governance networks and competence
Political leadership and commitment
Social capital and equity
Information technologies and communication systems
Health of environment
The information is arranged by sector, under the headings Policy, Management and Technology in order to
facilitate comparisons across sectors and help decision makers identify areas for potential collaboration
and synergy. Some of these synergies have been included in practical Recommendations and Strategies for
Action which is the following section of this report.

117
5.1. Water Quality and Availability
5.1.1. Policy
The policy history relevant to water resources is quite complex in Belize. This stems from the lack of a water
management programme and the lack of cohesiveness among various policies. There have been several
internationally funded projects that have brought forth a large quantity of information suitable for
development planning. However, this information is often not put to use and recommendations are often
not implemented (Green, 2000).
Several attempts have been made to draft water policies in Belize. The National Integrated Water Resource
Management Policy authored by BEST (Belize Enterprise for Sustainable Technology) (2008) goes through a
history of several previous attempts. These include drafts by Harrison in 1994, Cardona in 2005 and the
Hydromet office at the NMS which conducted national consultations during the period from 2006-2007.
Both Cardona and the Hydromet did not develop policy documents on their own, rather made changes and
recommendations to the original proposal by Harrison (BEST, 2008). The most recent document that has
been drafted is the National Integrated Water Resource Management Policy (NIWRM) (BEST, 2008). This
policy is fairly recent and takes into account impacts on water as a result of climate change. It has been
cited that this policy will be used to guide the “final actions of adoption and preparation of legislation” in
order to manage the nation’s water resources (BEST, 2008: pg. 6).
There are several acts that define provisions depending on whether rural water is supplied, or whether it is
supplied under BWS. BWS provides water and sewage services made by provisions under the Water
Industry Act and the local water boards supply water in rural areas under provisions from the Village
Councils Act (BEST, 2009). As discussed in the Vulnerability Section for Water Quality and Availability, BWS
has the exclusive contract and responsibility to provide urban water and sewage services, as well as similar
services in several rural areas. Town Councils also have a certain responsibility for water quality, such as
standing water and vector control, under the Public Health Act (BEST, 2009). It has been noted that this
responsibility held by the Town Councils is now outdated, since this was only relevant when drafting the
Public Health Act which has not been revised since BWS took over (BEST, 2009).
The GOB is working to adopt a Responsible Tourism Policy presented to the Ministry of Tourism in March of
2010 (PCSD, 2011). This policy would be key in protecting the natural resources of Belize when these are at
risk from tourism activities or development. In the draft document, the mission states:
“The GOB shall support and engage in responsible tourism as a preferred approach to the
management of Belize as a tourism destination in order that the integrity of Belize’s natural
resources and biodiversity be sustained [...] and that visitors to Belize act in an appropriate manner
that respect the natural resources and cultural heritage of the country.” (APAMO and MT, 2010)
This draft has several key points regarding water management issues. Some of the points are focused on
the safe keeping of local communities, in order that future tourist development should not impede on the
provision of basic services, such as water, to these communities (APAMO and MT, 2010). Other areas are
the safe keeping of the environment, which would be done by measuring the water use, indicating the
sources used and treating sewage water accordingly, in order to decrease overall consumption (APAMO
and MT, 2010).
118
The approved budget for water (as described under provisions for utilities) in the GOB annual report for the
fiscal year 2009/2010 was BZ $3,000,000, based on the actual expenditures from 2007/2008 which were
calculated at BZ $3,012,099 (Government of Belize, 2009). There are several budget constraints that can be
identified. Belize is considered a consumer and developing country and as such does not generate large
amounts of surplus revenue that could be channelled into sectors in need. The alleviation of poverty is also
a major concern of the GOB and it is believed that it is the main cause of several problems such as land
degradation and drought (Green, 2000). Improvements in this will thus bring improvements to other
sectors (Green, 2000).
Also of importance to note is that water resources have not always received the funding that they need,
since Belize was always considered to have abundant supplies (BEST, 2008). Increases in population,
agricultural demand, industry and tourism have all put a considerable stress on available resources and on
its quality (BEST, 2008).
5.1.2. Management
There are several institutions in charge of dealing with climate change issues and water resources. The
overarching ministry is the Ministry of Natural Resources and the Environment under which the
Department of Environment (DOE) and the National Meteorological Services (NMS) fall (BEST, 2008).
Likewise, different aspects of water resources management fall under several government agencies, such
as the DOE, PUC and NMS. There are also several NGO’s that are active, such as Water Missions in Belize
(WMB) that provide support to local communities (BEST, 2008; WMB, 2011). As discussed in Section 4.1.1,
Belize Water Services (BWS) is the company that is responsible for the provision of water to all urban areas.
Local water boards are responsible for those rural areas not covered by BWS (BEST 2009).
According to the National Adaptation Strategy for the water sector “Belize is a young nation and suffers
from limited institutional capacity and limited governance, financial and administrative resources” (BEST,
2009). The water sector is underfunded and not adequately coordinated which results in overlapping
government agencies and a lack of clear resource management (BEST, 2009). The fractured nature of the
legislation results in several government agencies and departments being legally responsible for the
management of water resources in their own sectors. This uncoordinated and overlapping management
increases the severity of unattended issues such as those of groundwater exploration and exploitation
(BEST, 2009).
Belize is a signatory to the UNCCD, which includes certain elements of drought, though at the time of the
publication of its first report in 2000, it was not clear if there was a body that was responsible for drought
management (Green, 2000). Within the first report, a national coordinating body was to be created, but it is
not clear if this has been undertaken (Green, 2000). NEMO is the organisation in charge of preserving life
and property in the event of an emergency and NMS is in charge of publishing drought forecasts (NMS,
2011).
In the UNCCD report (2000), it was discussed how change in various sectors has been slow and difficult to
achieve (Green, 2000). It was also discussed that the human resource base is limited and thus the same
group of professionals and technicians is often involved repeatedly in various management initiatives
(Green, 2000).
119
5.1.3. Technology
Resource monitoring in Belize has been said to be uncoordinated at times (BEST, 2009). However, the NMS
which is responsible for collecting hydrological data and climate data for Belize has been doing so since its
creation in 1966 (NMS, 2011). This is an ongoing task and part of the mission of the NMS (NMS, 2011).
There are approximately 30 hydrological stations located on various water courses in Belize, which also
report data to NMS.
Belize has an aging water infrastructure and BWS has several ongoing projects to renew and maintain this
(BWS 2009). The creation of a Leak Detection Unit was crucial to savings both BWS and more importantly
for customers who were saved from paying for lost water (BWS 2009). Several large projects were
undertaken in the 2010 fiscal year. These include completion of the Belize City water main refurbishment,
completion of Phase 1 of the Southside poverty alleviation project, installation of water mains and a
distribution network to the village of Caye Caulker, completion of water main and sewer main services in
San Pedro and water network expansions nationwide (BWS, 2009 – Annual Report). Several other large
technical and design projects are in place for the coming year and these are ongoing as BWS continues to
strive to provide adequate water supply to Belizeans.

120
5.2. Energy Supply and Distribution
5.2.1. Policy
As evident from current energy documents in many countries both in the Caribbean and outside, tourism is
not central in the consideration of wider strategies to reduce energy use (Brewster, 2005; Haraksingh,
2001). Yet, as this document has shown for Belize, its share in energy use and emissions is considerable and
likely to grow in the future, leading to growing vulnerabilities in a business as usual scenario. At the same
time, the sector holds great potential for energy reductions and should thus be one of the focus points of
policy considerations to de-carbonize economies.
It is vital for governments to engage in tourism climate policy, because tourism is largely a private sector
activity with close relationships with the public sector at supranational, national, regional and local
government levels and through politics, there is thus an outreach to all tourism actors. Furthermore,
governments are involved in creating infrastructure such as airports, roads or railways and they also
stimulate tourism development, as exemplified by marketing campaigns. The choices and preferences of
governments thus create the preconditions for tourism development and low-carbon economies. Finally,
there is growing consensus that climate policy has a key role to play in the transformation of tourism
towards sustainability, not least because technological innovation and behavioural change will demand
strong regulatory environments.
As described earlier and pointed out by (OECD, 2010), emissions of greenhouse gases essentially represent
a market failure where there is little incentive to innovate. It has been shown that the fairest and most
efficient way of reducing emissions is to consider increased fuel prices, i.e. to introduce a tax on fuel or
emissions. Carbon taxes may be feasible for accommodation, car transport and other situations where
tourism activities cause environmental problems. Taxation is generally more acceptable if taxes are
earmarked for a specific use, which in this case could for instance include incentives for the greening of
tourism businesses. Tax burdens would then be cost-neutral for tourism, but help to speed up the greening
of the sector. If communicated properly, businesses as well as tourists will accept such instruments and the
economic effect can be considerable. The Maldives charge, for instance, US $10 per bed night spent in
hotels, resorts, guesthouses and yachts, which accounts for 60% of Government revenue (McAlleret al.,
2005). The policy recommendations put forward by the Public Utilities Commission (2003b) and discussed
in the Vulnerability section for Energy Supply and Distribution make little reference to specific initiatives
that will target the tourism sector.
Money collected in various ways could be re-invested in sustainable energy development. Haraksingh
(2001), for instance, outlines that there is a huge potential to use solar energy. Both economical and non-
economical technical solutions to reduce the energy-dependency of countries in the Caribbean could thus
be implemented based on regulation, market-based approaches and incentives, as well as through
financing derived from voluntary and regulatory carbon markets. Policy intervention is however needed to
initiate these processes. Overall, Haraksingh (2001: 654; see also Headley, 1998) suggests that:
The Caribbean region is a virtual powerhouse of solar and other renewable sources of
energy waiting to be exploited. It has the advantage of not having winters when hot water
demands can increase from summer by approximately 70% in cold climates. Solar water
heaters for the tourism industry and domestic and commercial usage have perhaps the
greatest potential. There is a general commitment to the development of RE, but matters
have not gone very far beyond this. The movement towards greater implementation of RE

121
technologies is gaining strength, but there is a large gap between policy goals and actual
achievement. Clearly, much work still needs to be done. Government fiscal incentives,
greater infrastructure for policy development as well as joint venture partnerships are
needed in the Caribbean region for a smooth transition.
Lorde et al., (2010) suggest that Government policy should encourage efficiency and innovation in
electricity production and distribution, noting that in particular the residential sector should be addressed
in reducing electricity use. This is also true for Belize, where the ground work for future renewable energy
and energy efficiency initiatives has been done through the Public Utilities Commission’s (2003a, b)
recommendations for a National Energy Policy. While many of these recommendations are in line with
those made in this report, it should be noted, however, that suggestions to reduce either fossil fuel or
electricity prices are in stark contrast to this report’s recommendations: clearly, reducing energy prices
(including fuel for transport) will increase consumption and lead to growing emissions of greenhouse gases
if the increased demand is met from a fossil fuel source. Rather, price signals to support low-carbon
consumption should be given, for instance by granting price reductions to electric cars, photovoltaic
electricity production or solar heaters.
5.2.2. Management
Any action on reducing energy use and emissions of greenhouse gases has to begin with a review of
emission intensities, to ensure that the action taken will lead to significant reductions. From a systems
perspective, hundreds of minor actions will not yield anywhere near as much as one change in the major
energy consuming sub-sectors. Aviation is thus, as outlined earlier, a key sector to focus on, followed by
hotels, as these are comparably energy-intense, while car-travel is not as relevant. Cruise ships will often be
the most relevant energy sub-sector, but are more difficult to address.
Tourism management is primarily concerned with revenue management, as the ultimate goal of any
economic sector is to generate profits and jobs. A general critique of tourism management in this regard
must be that it is too occupied with revenue, rather than profits as well as multiplier effects in the
economy. This is an important distinction because profits have been declining in many tourism sub-sectors,
such as aviation, where revenues have been increasing through continuously growing tourist volumes,
while profits have stagnated. This is equally relevant for average length of stay, which is falling worldwide:
to maintain bed-night numbers, destinations have consequently had to permanently increase tourist
numbers. For instance, in the case of Saint Lucia, average length of stay has fallen 2 full days (from 10.6 to
8.6) in the period 2001 to 2010 (with ups and downs in between; (Research and Policy Unit, 2011)). Average
hotel occupancy in Saint Lucia has also been falling from 71.4% in 1997 to 54.4% in 2010. To obtain similar
figures for Belize should be a key priority and working pro-actively on these issues is consequently a highly
relevant management task. The tourism statistics available from the Belize Tourism Board show that
although the number of rooms has increased in recent years, there has been no consistent improvement in
occupancy rates (BTB, 2009).
In an attempt to look at both profits and emissions of greenhouse gases, a number of concepts have been
developed. One of the most important overall objectives can be defined as ‘reduce the average energy
use/emissions per tourist’. Table 5.2.1 illustrates the situation for a number of other countries in terms of
weighted average emissions per tourist (air travel only), as well as emissions per tourist for the main
market. The table can serve as a benchmark for comparison.
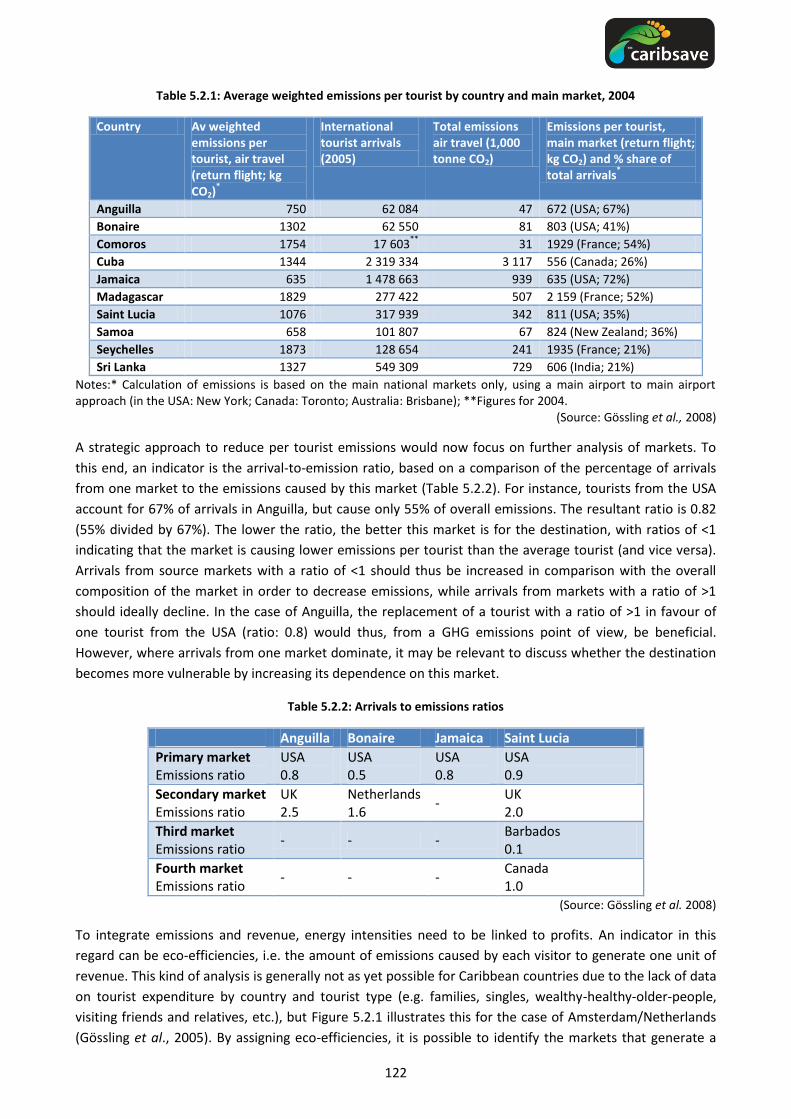
122
Table 5.2.1: Average weighted emissions per tourist by country and main market, 2004
Country Av weighted emissions per tourist, air travel (return flight; kg CO2)
*
International tourist arrivals (2005)
Total emissions air travel (1,000 tonne CO2)
Emissions per tourist, main market (return flight; kg CO2) and % share of total arrivals
*
Anguilla 750 62 084 47 672 (USA; 67%)
Bonaire 1302 62 550 81 803 (USA; 41%)
Comoros 1754 17 603**
31 1929 (France; 54%)
Cuba 1344 2 319 334 3 117 556 (Canada; 26%)
Jamaica 635 1 478 663 939 635 (USA; 72%)
Madagascar 1829 277 422 507 2 159 (France; 52%)
Saint Lucia 1076 317 939 342 811 (USA; 35%)
Samoa 658 101 807 67 824 (New Zealand; 36%)
Seychelles 1873 128 654 241 1935 (France; 21%)
Sri Lanka 1327 549 309 729 606 (India; 21%)
Notes:* Calculation of emissions is based on the main national markets only, using a main airport to main airport approach (in the USA: New York; Canada: Toronto; Australia: Brisbane); **Figures for 2004.
(Source: Gössling et al., 2008)
A strategic approach to reduce per tourist emissions would now focus on further analysis of markets. To
this end, an indicator is the arrival-to-emission ratio, based on a comparison of the percentage of arrivals
from one market to the emissions caused by this market (Table 5.2.2). For instance, tourists from the USA
account for 67% of arrivals in Anguilla, but cause only 55% of overall emissions. The resultant ratio is 0.82
(55% divided by 67%). The lower the ratio, the better this market is for the destination, with ratios of <1
indicating that the market is causing lower emissions per tourist than the average tourist (and vice versa).
Arrivals from source markets with a ratio of <1 should thus be increased in comparison with the overall
composition of the market in order to decrease emissions, while arrivals from markets with a ratio of >1
should ideally decline. In the case of Anguilla, the replacement of a tourist with a ratio of >1 in favour of
one tourist from the USA (ratio: 0.8) would thus, from a GHG emissions point of view, be beneficial.
However, where arrivals from one market dominate, it may be relevant to discuss whether the destination
becomes more vulnerable by increasing its dependence on this market.
Table 5.2.2: Arrivals to emissions ratios
Anguilla Bonaire Jamaica Saint Lucia
Primary market Emissions ratio
USA
0.8
USA
0.5
USA
0.8
USA
0.9
Secondary market Emissions ratio
UK
2.5
Netherlands
1.6 -
UK
2.0
Third market Emissions ratio
- - - Barbados
0.1
Fourth market Emissions ratio
- - - Canada
1.0
(Source: Gössling et al. 2008)
To integrate emissions and revenue, energy intensities need to be linked to profits. An indicator in this
regard can be eco-efficiencies, i.e. the amount of emissions caused by each visitor to generate one unit of
revenue. This kind of analysis is generally not as yet possible for Caribbean countries due to the lack of data
on tourist expenditure by country and tourist type (e.g. families, singles, wealthy-healthy-older-people,
visiting friends and relatives, etc.), but Figure 5.2.1 illustrates this for the case of Amsterdam/Netherlands
(Gössling et al., 2005). By assigning eco-efficiencies, it is possible to identify the markets that generate a

123
high yield for the destination, while only causing marginal emissions. For instance, in the case of
Amsterdam, a German tourist causes emissions of 0.16 kg CO2 per € of revenue, while a visitor from
Australia would emit 3.18 kg CO2 to create the same revenue.
Figure 5.2.1: Eco-efficiencies of different source markets, Amsterdam (Source: Gössling et al. 2005)
These indicators can serve as a basis for restructuring markets, possibly the most important single measure
to reduce the energy dependence of the tourism system. However, further analysis is required to
distinguish revenue/profit ratios, leakage factors/multipliers (to identify the tourist most beneficial to the
regional/national economy) and to integrate market changes into an elasticity analysis (to focus on stable,
price-inelastic markets) (see also Becken, 2008; Schiff and Becken, 2010). No study that integrates these
factors has been carried out so far, but further developing such strategic tools for revenue and energy
management would appear useful for the Caribbean.
As described in the introduction, the Belize Tourist Board (BTB) has intensified its marketing to focus on
Europe and the emerging markets of Mexico and Central America (CBB, 2010; BTB, 2010). While these
efforts are laudable, they will also increase vulnerabilities in the energy sector, as long-haul flights increase
average emissions per tourist. A strong focus on Mexico and Central America, as well as alternative
marketing strategies, also with a focus on average length of stay, should thus be envisaged.
In Barbados, a survey carried out in February 2011 to better understand tourist perspectives on spending,
length of stay, climate change and mitigation, yielded some interesting results. In this regard, 71% of
respondents stated that they would have liked to stay longer and 61% stated that they had spent less
money than planned. It is likely that similar results could be found throughout the region and further
research needs to be carried out to identify how this potential can be realized: longer stays increase the
124
share of money retained in the national economy, primarily in accommodation, while higher expenditure
also contributes to increasing national tourism revenue, notably with a lower leakage factor, as spending
for air travel will usually entail smaller profit shares and higher leakage. The Barbados study also revealed
that 73% of respondents are willing to drive less by car, 70% stated willingness to use smaller cars and 81%
are positive about electric cars. With regard to A/C use, one of the major factors in energy use in hotels,
tourists also support resource savings: 71% stated to be willing to use fans rather than air conditioning, 90%
agree that switching off air conditioning when leaving the room is acceptable and 65% agree on using air
conditioning at a 1°C higher temperature than the set room temperature actually used during the stay.
Further options to reduce energy use and emissions exist for businesses focusing on staff training. For
instance, Hilton Worldwide saved energy and water costs in the order of US $16 million in the period 2005 -
2008, primarily through behavioural change of employees as a result of a training in resource efficiency.
These measures have to be discussed on the business level and are mostly relevant to accommodation and
activities managers. As about 15% of a typical Caribbean hotel’s operating cost may be attributable to
energy usage (Pentelow and Scott, 2011), management-related reductions in energy use of 20% would
correspond to savings of 3% on the overall economic baseline. This should represent a significant incentive
to engage in energy management. For further details on energy management see Gössling (2010). Surveys
of tourism businesses in Belize showed that approximately 30% would support the promotion of energy
efficiency (Richardson, 2007).
5.2.3. Technology
The potential for saving energy through technological innovation has been documented for a growing
number of case studies. For instance, luxury resort chain Evason Phuket & Six Senses Spa, Thailand, reports
payback times of between 6 months and ten years for measures saving hundreds of thousands of Euros per
year. Examples of the economics of resource-savings from the Caribbean include five case studies in
Jamaica (Meade and Pringle, 2001). The results from this study are summarised in Table 5.2.3.

125
Table 5.2.3: Jamaican case studies for resource savings
Property Sandals Negril Couples Ocho Rios
Swept Away Negril Cabins Sea Splash
Number of rooms
215 172 134 80 15
Initial investment
$68,000 $50,000 ($20,000 in equipment, $30,000 in consulting fees)
$44,000 $34,670 $12,259
Water saved (m3) 45,000 31,000 95,000 11,400 7,600
Electricity saved (MWh)
444 174 436 145 154
Fuel saved (l) 100,000 (diesel) 172,000 (LPG) 325,000 (diesel)
Financial savings $261,000 $134,000 $294,000 $46,000 over 2.75 years. $5,000 on laundry chemicals since August 1998
$46,000 since July 1998
Return on investment
190% over 2 years
200% over 16 months
675% over 19 months
48% 151% over 2.5 years
Payback period 10 months 6 months 4 months
(Source: Meade and Pringle, 2001)
It is beyond the scope of this report to list all technical measures to reduce energy use and readers are
referred to (Gössling, 2010) for further guidance: case studies provided in this book indicate technology
based energy savings potentials of up to 90% for accommodation. Often, it is also economically feasible to
replace conventional, fossil-fuel based energy systems with renewable ones, with payback times of 3-7
years (e.g. Dalton et al., 2009). An example study in the Caribbean is provided by Bishop and Amaratunga
(2008). This study provides evidence on the economic suitability of technological innovation to generate
renewable energy in Barbados. Bishop and Amaratunga (2008) propose a 10MW wind energy scheme
based on micro wind turbines of both horizontal and vertical axis configurations and at costs as low as BDS
$0.19 per kWh. The scheme would also lead to savings of 6,000-23,000 t CO2 and avoided fuel costs of BDS
$1.5–5.3 million. The authors highlight that small wind turbines can be competitive with conventional wind
farms. The Richardson (2007) surveys of tourism businesses in Belize showed that only 22% would support
the development of alternative energy sources (Richardson, 2007).
As outlined, managers will usually be interested in any investment that has pay-back times as short as 5-7
years, while longer times are not favourable. While this would support investments into any technology
with payback times of up to 7 years, it also opens up opportunities to use the Clean Development
Mechanism (CDM) as an instrument to finance emission reductions. The CDM is one of the flexible
instruments of the Kyoto Protocol with two objectives:
to assist parties not included in Annex I in achieving sustainable development and in contributing to
the ultimate objective of the convention of cost-efficient emission reductions;
to assist parties included in Annex I in achieving compliance with their quantified emission
limitation and reduction commitments.
The CDM is the most important framework for the supply of carbon credits from emission reduction
projects, which are approved, validated and exchanged by the UNFCCC secretariat. CDM projects can be
implemented in all non-Annex I countries and are certified by operational entities (OE) designated by UN
COP (IPCC, 2007b). The CDM thus generates credits, typically from electricity generation from biomass,

126
renewable energy projects, or capture of CH4, often a problem in the context of waste management, which
can be sold in the regulatory or the voluntary carbon markets. As such, it is a novel instrument to
restructure countries towards low-carbon economies.
Discussions are already on-going in the Caribbean on how to use the CDM in restructuring energy systems.
It is worth noting, however, that emission reductions achieved through the CDM do not apply to national
economies, rather they apply to the purchaser’s economy. While the CDM is thus an instrument to achieve
technological innovation, it is not an instrument to achieve carbon neutral status. A potential problem is
that in mid-2011, it is unclear whether there will be a post-Kyoto protocol to continue the CDM past 2012.
Investigating the possible links that can be made with regional and international programmes, including
CDM, that would benefit Belize are highlighted as an area for action in the policy recommendations
discussed previously (Public Utilities Commission, 2003b).
Further funds can be derived through voluntary payments by tourists. For instance, Dalton et al. (2008)
found that 49% of Australian tourists were willing to pay extra for renewable energy systems, out of which
92% were willing to pay a premium corresponding to 1–5% above their usual costs. In another study,
Gössling and Schumacher (2010) found that 38.5% of a sample of international tourists in the Seychelles
expressed willingness to pay for carbon-neutrality of their accommodation, out of which 48% stated they
would be willing to pay a premium of at least €5 per night. While these values are not representative, they
nevertheless indicate that there is considerable potential to involve tourists emotionally and financially in
strategies to implement renewable energy schemes. Such options should be further explored.
5.2.4. Summary
Belize is vulnerable to rising oil prices and global climate policy. However, there are various tools that can
be employed to reduce energy use in the country, possibly in the order of an estimated 20% within two
years, though attention has to be paid to increasing tourist arrival numbers, which can outweigh
achievements in efficiency gains. Adaptation should focus on policy, management and technology.
Policy, including regulation, taxation and incentives, is important to increase pressure on
stakeholders to engage with energy management. This is an area that is generally seen as less
relevant and efforts to engage significant stakeholder numbers will demand strong policy
environments, as initiated through planning for a National Energy Policy.
Vast options exist to reduce energy demand through carbon management. In particular, this
includes a rethinking of markets based on their eco-efficiency, this can potentially lead to increasing
turnover and declining energy costs, while also bringing greater attention to the diversification of
markets. Carbon management also means to address average length of stay and measures to
stimulate spending: evidence indicates that there is considerable scope to increase both.
Maintaining bed night numbers without addressing losses in average length of stay does otherwise,
meaning to be stuck in a logic of volume growth, which is likely to prove a problem when the cost
of transport increases and when serious climate policy is introduced.
The introduction of low-carbon technology can both reduce energy demands (energy-efficiencies)
and the use of fossil fuels, which can be replaced by renewable energies. Often, restructuring
existing energy systems can be cost-effective and even lead to savings.
Finally, the Clean Development Mechanism and voluntary payments for carbon offsetting may be
used as means to reduce energy use and to increase the share of renewable energy in national
energy mixes.

127
5.3. Agriculture and Food Security
5.3.1. Policy
In August 2010, the Government of Belize published an updated policy statement which is to ensure food
security and sovereignty through sustainable production, supply, accessibility and use of safe, high quality,
nutritious, diversified and culturally acceptable foods for all Belizeans. The strategy comprises six basic
programs: information and communication; diversified food production, processing, marketing, storage and
credit; material and child care, school feeding and nutrition for the elderly and the indigent; creation of
employment and income generation at local levels; food safety; and analysis and reform of national policies
for food and nutrition security (FAO, 2011).
The National Food and Agricultural Policy of 2009 identified major objectives, such as greater efficiency in
resource allocation, minimizing sharp fluctuations in market prices and reducing investment risks and
uncertainty, promoting specific commodities for which there are identified and growing markets, achieving
a higher level of self-sufficiency in food production and increasing the country's competitiveness in regional
and extra-regional markets. The policy statements of the Ministry of Agriculture and Fisheries (2009)
highlight the critical importance of agricultural exports, farmer organisation, technological innovations,
extension and cross-cutting issues of gender, youth and disaster risk management, for the sustainable
growth with equity of agriculture.
5.3.2. Technology
Modern technology in Belizean agriculture is largely dependent on interventions and support from the
Ministry of Agriculture and Fisheries (Merrill, 2010). This is evident in the aquaculture/shrimp operations in
the country which benefitted from Government extension services and a small scale agriculture project. At
the end of 2009, there were 65 farmers engaged in small scale tilapia farming in the six districts with 14
acres in production units containing 213,782 red and grey tilapia. Production in 2009 was estimated to be
at 110,000 pounds.
The Ministry of Agriculture and Fisheries is also conducting continuous research to provide technical
assistance to farmers in the production of winter vegetables, like carrots, celery, broccoli and beets. As a
result of the Ministry’s Extension Programme vegetable production increased from BZ $15.6 m in 2008 to
$19.7 m in 2009, an increase of 26%. Other elements of the extension programme include training for
farmers in greenhouse technology, access to two commercial size vegetable seedling nurseries and an
onion drying demonstration unit.
5.3.3. Farmers’ adaptation - Initiatives and actions
Holder (2009) on conducting research on indigenous farming systems in Belize found that for the four
agricultural communities studied (Santa Martha, Concepcion, Calla Creek and El Progresso), all of the rural
villages exhibited weakness in the core characteristics essential for successful farming in pursuit of
enhanced climate resilience and sustainable livelihoods. However, each community displayed one or more
standard practices for successful small farming systems in Belize, namely common vision, teamwork, mixed
farming and natural resource management. The first two define the social character of the residents and
the community, while the latter two addresses the technical capabilities. All had some form of mixed
farming as a coping strategy, but integration was lacking. Natural resource management was weak to non-

128
existent and there was tendency towards the unsustainable and heavy use of fertilizers and chemicals in
crop production; primarily as a response to advice from agrochemical businesses, but also because
information of the dangers to the environment and its users, along with credible alternatives were lacking.
When suitable long-fallowed forest land for food production was becoming more limited and yields were
declining, the indigenous response in certain areas was to experiment with new ways of intensifying
production on the dry-season riverbank fields. Using seeds obtained from Maya farmers in other
communities, they tried planting different mulch and cover crops during the growing season and extending
the area of permanent cultivation. One crop in particular, the velvet bean (Mucuna spp.), proved extremely
useful, crowding out weeds, managing a number of pests and improving soil fertility without the use of
chemical fertilizers (Belize Development Trust, 2001).
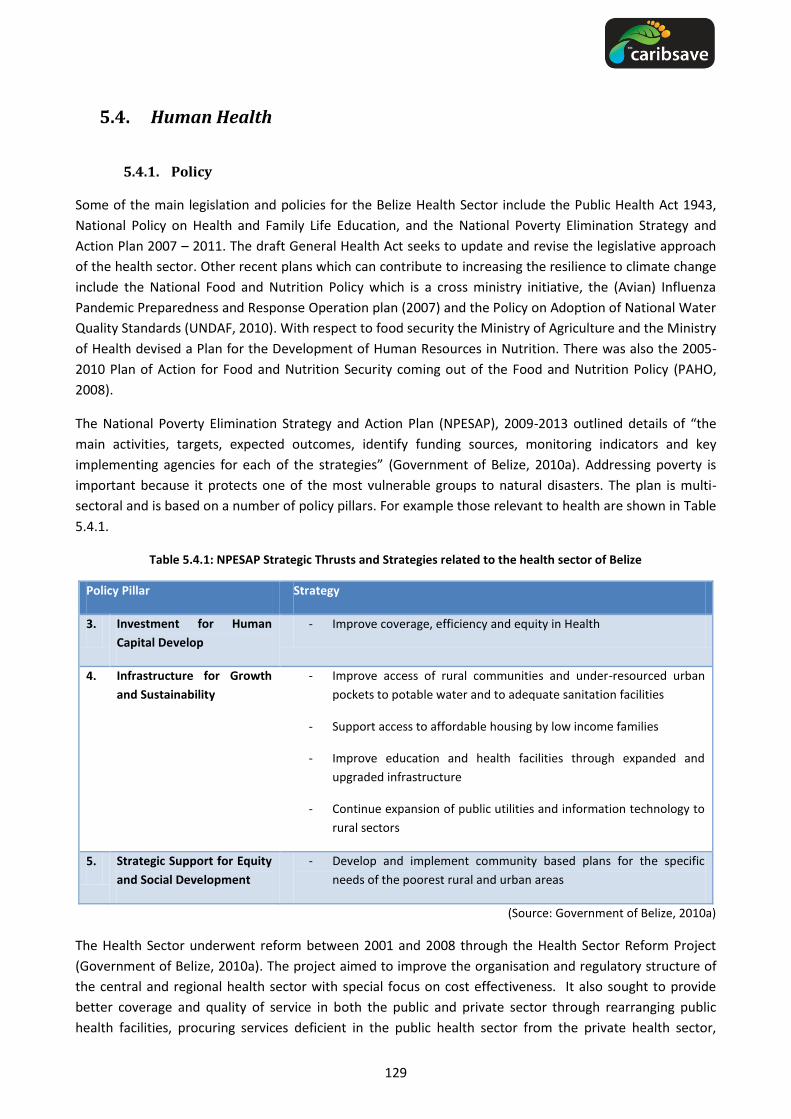
129
5.4. Human Health
5.4.1. Policy
Some of the main legislation and policies for the Belize Health Sector include the Public Health Act 1943,
National Policy on Health and Family Life Education, and the National Poverty Elimination Strategy and
Action Plan 2007 – 2011. The draft General Health Act seeks to update and revise the legislative approach
of the health sector. Other recent plans which can contribute to increasing the resilience to climate change
include the National Food and Nutrition Policy which is a cross ministry initiative, the (Avian) Influenza
Pandemic Preparedness and Response Operation plan (2007) and the Policy on Adoption of National Water
Quality Standards (UNDAF, 2010). With respect to food security the Ministry of Agriculture and the Ministry
of Health devised a Plan for the Development of Human Resources in Nutrition. There was also the 2005-
2010 Plan of Action for Food and Nutrition Security coming out of the Food and Nutrition Policy (PAHO,
2008).
The National Poverty Elimination Strategy and Action Plan (NPESAP), 2009-2013 outlined details of “the
main activities, targets, expected outcomes, identify funding sources, monitoring indicators and key
implementing agencies for each of the strategies” (Government of Belize, 2010a). Addressing poverty is
important because it protects one of the most vulnerable groups to natural disasters. The plan is multi-
sectoral and is based on a number of policy pillars. For example those relevant to health are shown in Table
5.4.1.
Table 5.4.1: NPESAP Strategic Thrusts and Strategies related to the health sector of Belize
Policy Pillar Strategy
3. Investment for Human
Capital Develop
- Improve coverage, efficiency and equity in Health
4. Infrastructure for Growth
and Sustainability
- Improve access of rural communities and under-resourced urban
pockets to potable water and to adequate sanitation facilities
- Support access to affordable housing by low income families
- Improve education and health facilities through expanded and
upgraded infrastructure
- Continue expansion of public utilities and information technology to
rural sectors
5. Strategic Support for Equity
and Social Development
- Develop and implement community based plans for the specific
needs of the poorest rural and urban areas
(Source: Government of Belize, 2010a)
The Health Sector underwent reform between 2001 and 2008 through the Health Sector Reform Project
(Government of Belize, 2010a). The project aimed to improve the organisation and regulatory structure of
the central and regional health sector with special focus on cost effectiveness. It also sought to provide
better coverage and quality of service in both the public and private sector through rearranging public
health facilities, procuring services deficient in the public health sector from the private health sector,

130
increasing accessibility particularly in rural areas and increasing staff training among a host of other
initiatives (Government of Belize, 2010a).
Table 5.4.2: Total expenditure on health as a % of GDP from 1995 – 2009 in Belize
Year ‘95 ‘96 ‘97 ‘98 ‘99 ‘00 ‘01 ‘02 ‘03 ‘04 ‘05 ‘06 ‘07 ‘08 ‘09
% of GDP 3.9 3.3 3.6 3.4 3.3 3.6 4.2 4.0 4.3 4.0 4.1 4.0 4.4 4.5 5.1
*GGEH as
% of GGE 10.5 8.2 8.9 7.7 6.1 6.5 7.4 7.4 8.9 8.0 9.3 9.4 10.9 10.8 12.2
* General Government Expenditure on Health (GGEH) as a % of General Government Expenditure (GGE)
(Source: WHO, 2011a)
Table 5.4.2 shows the total expenditure on health as a percentage of GPD between 1995 and 2009. In 2009,
total expenditure on health accounted for 5.1% of GDP which amounted to 12.2% of general government
expenditure on health. It is estimated that 60% of the health budget pays salaries and another 20% towards
pharmaceuticals. Therefore what is left is often insufficient to conduct maintenance or start developmental
work in the health sector which relies heavily on foreign loans and grants (Government of Belize, 2010a).
One of the negative aspects of Belize’s economy is the inability of the Government to make capital
investments and to direct more resources towards development of the social sector including the health
sector (Government of Belize, 2010a). However, it should also be noted that due to high numbers of
vacancies actual expenditure may be less than allocated. For instance in 2007/2008 21% of the Central
region’s and 30% of the Southern region’s budgets were not spent mainly due to this problem (Government
of Belize, 2010a). A significant proportion of expenditure that could be spent in the public sector is often
channelled in the private sector through preferential use of private health care services. For instance “in
2004, private health care expenditure was estimated to be around 1.5% of GDP, or two thirds the level of
public expenditure; much of which would have been spent by higher income groups on private health care
services” (Government of Belize, 2010a).
One of the negative aspects of Belize’s economy is the inability of the Government to make capital
investments and to direct more resources towards development of the social sector which includes the
health sector (Government of Belize, 2010a). This is partly due to the limited financial resources at the
disposal of the Government, which depends heavily on external sources for funding its project. The success
of the National Poverty Elimination Plan requires such funding (Government of Belize, 2010a). These effects
are even more evident because the global economic climate has affected the economy of Belize, resulting
in decreases in revenues (Government of Belize, 2009).
5.4.2. Management
Belize has a wide range of agencies that have a role in the provision of health services and health
protection in the country. The Ministry of Health has responsibility over “national health planning, public
health protection, regulation, research, quality and standards, international and regional collaboration and
monitoring of the overall performance of the national health system” (PAHO, 2008). Within the Ministry of
Health, the Department of Public Health, the Central Medical Laboratory and other laboratories and the
Public Health Bureau are responsible for regulation of the quality of potable water (BEST, 2009). The Belize
Health Information System is responsible for generating health statistics. Within the Ministry of Human
Development and Social Transformation there are three main departments - Human Services Department,

131
Women’s Department and the Community Rehabilitation Department which have roles in social
development. The Belize Agricultural Health Authority is important in food security and food safety
planning. Finally, the Health Education and Community Participation Bureau “is the health education and
promotion arm of the Ministry of Health with the responsibility to plan, coordinate and implement health
promotion programmes, projects, interventions and activities throughout the country” (Government of
Belize, 2010b).
The national health structure consists of four regions, Northern, Central, Western and Southern (PAHO,
2008). There are seven hospitals in the country; each of the six districts has a hospital, but Cayo has two
hospitals (Government of Belize, 2010b). Three of these hospitals are regional hospitals which cater for
both primary and secondary health care needs. Another three are community hospitals which provide
mainly primary health care services. The Karl Heusner Memorial Hospital is the general hospital of Belize
District and the main referral or tertiary care institution (PAHO, 2008). There are also four private hospitals
and a number of other private facilities (Government of Belize, 2010b). Table 5.4.3 summarizes the health
facilities in Belize in 2007. Despite the fact that health services are decentralized in rural areas, health
facilities are further apart and offer fewer services than general hospitals (Government of Belize, 2010a).
This is particularly relevant in the south of the country where water supply, hygiene and nutrition
conditions are generally lower than national standard (Government of Belize, 2010a).
Table 5.4.3: Health facilities in Belize in 2007
Region Districts Hospitals
Polyclinic Health
Centres
Health
Posts No. Beds
Northern Orange Walk, Corozal 2 81 0 11 15
Western Cayo 2 66 0 4 6
Central Belize City and rural district* 1 125 4 12 16
South Toledo, Stann Creek 2 82 3 15 19
Country 7 354 7 42 56
*28 rural villages are served by mobile clinics visiting monthly.
(Source: Government of Belize, 2010a)
Deficiencies in the health services include insufficient staff, inadequate outreach to rural areas for the
collection of basic statistics and samples due to transportation limitations, insufficient pharmaceuticals and
problems with buildings and equipment (Government of Belize, 2010a). With respect to staff shortages,
recruitment from abroad is often utilised. Such staff a most often placed in very rural areas where staff
shortages are most severe. It is important to note that “shortages are compounded by the active
recruitment of national health professionals, particularly nurses, by developed countries” (PAHO, 2008).
There were 11 physicians per 10,000 of the population between 2000 and 2009 (WHO, 2011b). The number
of beds per 1,000 person of the population is 1.2, which for comparison is lower than other Caribbean
territories such as Trinidad and Tobago and Jamaica at 2.7 and 2 respectively (Government of Belize,
2010a).
Cost of health care is generally free, but small contributions are required for a number of services. Some
areas that require a fee for service include “(i) prescribed drugs have to be purchased from private
pharmacies (owing to non-availability at health centres or hospitals; (ii) drugs are purchased through self-
medication; and (iii) health care is sought privately” (Government of Belize, 2011). The Belize 2009 Country
132
Poverty Assessment found that both health and medical costs could be reduced for “the poor, the elderly,
the disabled and the chronically sick” (Government of Belize, 2010a).
With a poverty rate of 25.5% and indigence at 15.8% the Government of Belize has the challenge to
develop the social capital in poor communities and among these groups in society. Aside from the National
Poverty Elimination Strategy and Action Plan mentioned above, the Belize Social Investment Fund has also
developed social services in the country (Government of Belize, 2010a). The poverty rate varies from
district to district in Belize. The Social Investment Fund which targeted 350 communities was involved in
the construction and installation of infrastructural projects in areas most in need. Through this fund, most
of the health centres that exist in rural areas were constructed. This fund has been very important to health
and sanitation in Belize because “around half the communities in the country have benefited from one or
more improved roads, water supply, electrification and new or extended primary schools, while around a
quarter have had new or upgraded health facilities” (Government of Belize, 2010a). It is interesting to note
that 20% of householders are foreign born and experience slightly higher rates of poverty than the national
average (PAHO 2008).
With respect to communicable diseases, the Ministry of Health regards their services to control of
communicable diseases as “functioning well and require[ing] continued upgrading and incremental
improvement, rather than major new initiatives” (Government of Belize, 2010a). The Second National
Communication to the UNFCCC has recommended increased utilization of integrated pest and pathogen
management. It also suggests varying the treatment applied to pests and diseases to counter resistance
and improve quarantine capabilities and monitoring programmes (Government of Belize, 2011).
A considerable amount of attention is given to vector borne diseases. There is a Vector Control Programme
which targets malaria, dengue fever and chagas disease. Some of the initiatives undertaken through this
programme include “active and passive case detection; presumptive and radical case treatment with a 14-
day treatment scheme (five of which are supervised); adult mosquito control via indoor house spraying and
spatial ULV spraying; chemical larvae control with Abate; and health education in schools” (Government of
Belize, 2011). Vector control also targets specific communities and there is a special surveillance system to
control the spread of Aedes aegypti vector which is responsible for the transmission of dengue. Malaria’s
surveillance is however more consistent than dengue, with cases not being fully reported from the private
sector for the latter (Government of Belize, 2011). For malaria, malaria nets were introduced on 2009 free
of charge. Their use is meant to compliment the use of indoor residual spraying. Additionally all patients
receive diagnostic tests free of charge (WHO, 2010a).
The majority (94%) of Belizeans are satisfied with their level of health care; a statistic which is reflective of
all income brackets in the society (Government of Belize, 2011). A Living Standards Measurement Survey
(LSMS) conducted in 2009 and involving over 2000 households in Belize found that the poor do not exhibit
signs of lower levels of health care nor do they have difficulty accessing health care services (Government
of Belize, 2011). For persons who did not seek health care, the main reasons were “cost, absence /distance
of services, poor quality, not enough time” (Government of Belize, 2011).
In 2007, Belize developed an integrated Food-borne Disease surveillance manual as part of their
communicable diseases programme (CAREC, 2007). This involved a sectoral approach which included the
health, agriculture and tourism sectors. With respect to food security, the Government of Belize in its
2010/2011 Budget, stated that it will allocate more funding to small scale farmers to increase food security
at the district level (Government of Belize, 2010c). Also in the budget there was an allocation of one million
dollars to the Food Assistance Programme which targets the elderly and marginalized women and children
(Government of Belize, 2010c). In the Toledo District, a programme was developed to address

133
“malnutrition, micronutrient deficiencies and other consequences of under-nutrition” that have been
reported. Some of the initiatives undertaken were “nutrition education, organic vegetable production, food
preparation and fruit and vegetable drying and preservation” (PAHO, 2008).
The 2009 Country Poverty Assessment for Belize made a number of recommendations that have some
relevance to strengthening the overall resilience within the Belizean society and specifically within the
health care system. These included “improving access to health services in rural areas… continuing to
improve access to potable water and sanitation services… improving the maintenance of infrastructure,
schools and health centres; providing more secondary and feeder roads required to get produce to
markets; improving garbage disposal [and] providing more social services” (Government of Belize, 2010a).

134
5.5. Marine and Terrestrial Biodiversity and Fisheries
Adaptation requires “adjustment in natural or human systems in response to actual or expected climatic
stimuli or their effects, which moderates harm or exploits beneficial opportunities” (IPCC, 2007b). The
adaptive capacity of ecosystems then is the property of a system to adjust its characteristics or behaviour,
in order to expand its coping range under existing climate variability, or future climate conditions (Brooks &
Adger, 2004). Despite global action to reduce greenhouse gases, climate change impacts on biodiversity are
unavoidable due to climate inertia. Natural ecosystems have long demonstrated the ability to adapt to
changes in their physical environment. However, the rate at which climate change is projected to occur
may exceed the rate at which ecosystems can adapt. Furthermore, natural environments, which are already
stressed by human activities, have compromised ability to cope with and to adapt to climate change. This
adaptive capacity assessment thus considers the country’s ability to conserve its biodiversity through
managing sustainable resource use and the capacity to implement strategies to protect its natural
environment.
Many small Caribbean states generally have low adaptive capacity for some of the same reasons that they
tend to be highly vulnerable to climate change, i.e. small physical size, limited access to capital and
technology, shortage of human and financial resources (Mimura et al., 2007). The ability of ecosystems to
adjust to projected climatic changes depends not only on their inherent resilience but also on the ability of
resource users to make required adjustments. By addressing shortcomings in the above indicators adaptive
capacity can be built.
Six principles for adaptation have been identified by Natural England, the UK Government’s advisor on the
natural environment. Many elements of these principles are neither new nor climate change specific and so
may be applied within the Caribbean context. The principles are as follows (not in order of priority):
Table 5.5.1: Principles for Climate Change Adaptation
BIODIVERSITY: SIX PRINCIPLES FOR CLIMATE CHANGE ADAPTATION
Conserve existing biodiversity
Reduce sources of harm not linked to climate
Develop ecologically resilient and varied landscapes
Establish ecological networks through habitat protection, restoration and creation
Make sound decisions based on analysis
Integrate adaptation and mitigation measures into conservation management, planning and practice
Source: (Hopkins et al., 2007)
5.5.1. Policy
The capacity of countries to implement climate change adaptation strategies will be enhanced by polices
that take advantage of linkages between socio-economic and environmental sectors. Up until the 1970s,
Belize, formerly British Honduras, had relatively relaxed environmental laws that went largely unenforced.
However, with the formation of the Belize Audubon Society in 1969, public awareness of the value of
conservation grew rapidly. After gaining independence in 1981, the Government passed both the National
Park System Act and the Wildlife Protection Act, designating an array of protected areas of different status

135
and providing a codification for the protection of the immense biodiversity of life contained in the parks.
These Acts were further revised in 2000.
Governmental departments such as the Department of the Environment and the Forests Department, both
under the Ministry of Natural Resources and the Environment, have been designated to research and
regulate the issues and laws concerning the country's protected areas. Soon following was the
Environmental Protection Act of 1992, which outlined the statutory powers of the Department of the
Environment.
Belize is party to a number of legally binding multilateral environmental agreements, many of which deal
with proper management of the country's natural resources. These include, most notably,
Convention on International Trade in Endangered Species (CITES)
Convention Concerning the Protection of the World Cultural and Natural Heritage
Convention on Biological Diversity (CBD)
Convention to Combat Desertification (CCD)
United Nations Framework Convention on Climate Change (UNFCCC)
Since its ratification of the Ramsar Convention in 1998, Belize has had two sites designated as wetlands of
international importance: Crooked Tree Wildlife Sanctuary, in 1998 and Sarstoon-Temash National Park, in
2005. To ensure proper financial backing for their extensive network of protected areas, the Protected
Areas Conservation Trust (PACT) was created in 1996. This trust is responsible for all fundraising and the
allocation of funds to protected areas – see Section 5.5.2 below.
Belize has launched a major effort to completely rewrite its fisheries laws (which date back to 1948 with
one small revision in 1989), which will be called the Aquatic Living Resources Act rather than the Fisheries
Act. The new legislation will ensure that all marine and inland aquatic resources are covered by the Act. The
purpose of the new law is long-term sustainable use of Belize‘s aquatic resources and it will adopt the
precautionary principle. Also, the new law states that Government can‘t use the absence of adequate
scientific information as a reason to postpone or fail to take conservation and management measures. In
addition, the new law will provide a broad framework for specific regulations, but the regulations
themselves will not be in the law. For example, gill netting is not specifically mentioned in the new law.
Instead, Fisheries will have the authority to pass regulations that might limit or even ban gill netting. Other
major areas addressed by the new law will include marine reserves, cooperation with other countries in
managing aquatic resources, international agreements and treaties, scientific research and monitoring and
the control and enforcement of the law. Passage of the new Fisheries Act is expected by the end of 2011.
5.5.2. Management
Successful implementation of international and national policies depends on related institutional
arrangement. A nation’s adaptive capacity is greater if the roles and responsibilities for implementation of
adaptation strategies are well delineated by central Governments and are clearly understood at national,
regional and local levels (Burton, 1996). Overall oversight of conservation and management of protected
areas in Belize is the responsibility of the Ministry of Natural Resources and the Environment.
While coastal development is an important part of economic growth, unchecked clearing of mangroves in
recent years has led to serious concerns about the loss of services this habitat provides. In 2008, the newly
elected Government enacted a temporary moratorium on mangrove clearing inside MPAs. The re-
instatement of the Coastal Zone Management Authority and Institute in 2009 was another important step
136
in managing Belize’s coastal environment and suggests that Belize may be moving towards sustainable
development in its coastal areas.
Belize has fairly many fisheries regulations, including size limits and closed seasons for the most heavily
exploited species and no-take zones in some MPAs that serve as replenishment areas – these are due to be
update in the new Aquatic Living Resources Act. However, there is inadequate financial support to ensure
effective enforcement of these regulations. Regulations to protect top predators as well as critically
important herbivores (parrotfishes, tangs and surgeonfish) are also needed, as over-fishing threatens the
delicate ecological balance on the reef. Equipment bans on spear fishing in MPAs and on shrimp trawling,
would also help maintain the health of Belize’s fisheries.
Protected areas
Strengthening protected area networks is one way of adopting an ecosystem-based approach to
adaptation, i.e. one that integrates biodiversity, ecosystem services and people into an overall strategy to
build resilience and reduce exposure to the adverse impacts of climate change (Colls, Ash, & Ikkala, 2009).
The country's system of private reserves is coordinated under the Belize Association of Private Protected
Areas. The Belize Audubon Society (BAS) was founded in 1969 and oversees a total of nine protected areas,
including 4 natural monuments, 2 national parks, 2 wildlife sanctuaries and 1 nature reserve. Belize is
fortunate to have many active and successful environmental NGOs, many of which are responsible for the
management of protected areas. These include WWF, TIDE, Oceana, TNC, BAS and others.
The Protected Areas Conservation Trust (PACT), founded in 1995, provides funds for the development of
conservation and the promotion of environmentally sound management of Belize's natural and cultural
resources. It is primarily financed by the collection of a conservation levy included in the country's airport
departure tax. PACT provides funds for supporting conservation and promoting environmentally sound
management of Belize's natural and cultural resources to foster sustainable development.
Marine conservation efforts and monitoring programs in Belize have grown significantly over the past two
decades. The number of designated Marine Protected Areas (MPAs) has grown to 18, covering
approximately 250,000 ha of marine area (McField et al., 2008). MPAs are a useful tool for addressing a
number of threats to coral reefs, particularly those related to tourism, development and over-exploitation
of commercial species. Unfortunately, some of Belize’s MPAs remain paper parks and the majority lack
sufficient funding and staff to effectively enforce fishing regulations and monitor use of the reef. Greater
and more reliable funding is needed for the system to function as it was intended. One of the most
successful marine parks in Belize – and the Caribbean - is the Hol Chan Marine Reserve in Ambergris Caye.
This MPA has been successful in part because it has created its own private fund, which receives revenue
from user fees and donations. The reserve attracts over 50,000 visitors a year and generates close to US
$500,000 per year in revenues from fees, allowing the park manager and his 14 staff to manage the park
effectively with the support of the fishermen and local community of San Pedro.
Approximately 115,000 visitors to MPAs in Belize in 2007 spent an estimated US $17 million on
accommodation, recreation, food and other expenses on days that they visited a reserve. Reef-related
tourism and fisheries at just one park - Glover’s Reef Marine Reserve - contributed an estimated US $4.9 to
$7.3 million per year to the national economy. The Fisheries Department is allocated roughly US $100,000
per year for each of the MPAs that it manages. Management levels at most of Belize’s marine parks fall well
below those needed to keep reefs healthy and attractive to visitors over the long-term. The economic and
environmental benefits provided by these parks may not prove sustainable without greater investment in
management (Cooper, Burke, & Bood, 2009).
137
Belize’s efforts to manage its biodiversity and fisheries suffer primarily from a lack of resources, which
limits the Government’s capacity to enforce environmental and fisheries laws outside of protected areas.
This is particularly worrisome in relation to the management of reef fisheries along the Mesoamerican
barrier reef, which in recent years has seen a rapid decline in coral cover and large reef fish.
5.5.3. Technology
A high degree of access to and training with, relevant technologies at various levels (i.e. from local to
national) and across sectors, will play a significant role in biodiversity adaptation to climate change (Burton,
1996). Belize has a strong history of environmental research and monitoring, particularly compared to
many other countries in the region. For instance, assessing changes in Belize's forest and mangrove cover
over a 30-year period was possible because of Belize's participation in the Regional Visualization &
Monitoring System (SERVIR, in Spanish) a regional observatory jointly implemented by CATHALAC, the
Regional Centre for Mapping of Resources for Development (RCMRD), the International Centre for
Integrated Mountain Development (ICIMOD), the National Aeronautics and Space Administration (NASA),
the United States Agency for International Development (USAID) and other partners.
The newly reinstated Coastal Zone Management Authority and Institute (CZMAI) is gradually building
capacity for monitoring and research, though additional resources and technologies are badly needed.
Belize also benefits from the presence of several regional agencies that operate under official CARICOM
mandates. These include the Caribbean Community Climate Change Centre (CCCCC) and the Caribbean
Regional Fisheries Mechanism (CRFM), which provide the country with additional human and technical
capacity to examine key issues relevant to natural resource management and climate change. Belize also
benefits from an active NGO community with considerable scientific expertise and international networks
of scientists and volunteers.
Despite these assets, policymakers and regulatory agencies still require up-to-date biological and socio-
economic information on the status of the countries biodiversity and key ecosystems, as well as robust
projections on the potential impacts of existing and future threats to their health. Further investment in
monitoring and research to inform good management should be a priority.
138
5.6. Sea Level Rise and Storm Surge Impacts on Coastal Infrastructure
and Settlements
Based on the above evaluation, actions need to be taken to minimize infrastructure losses in vulnerable
areas of Belize. The current and projected vulnerabilities of the tourism sector to SLR, including coastal
inundation and increased beach erosion, will result in economic losses for Belize and its people.
Adaptations to minimize vulnerabilities in Belize will require revisions to development plans and
investment decisions. These considerations must be based on the best available information regarding the
specific coastal infrastructure and ecosystem resources along the coast, in addition to the resulting
economic and non-market impacts.
Given the historical damage caused by event driven coastal erosion, as well as slow-onset SLR, the need to
design and implement better strategies for mitigating their impacts is becoming apparent. There are a
number of solutions that can be used to tackle beach erosion. Unfortunately, most of the common
solutions, such as beach replenishment and groynes, are only temporary and their cost makes them
unaffordable (Daniel, 2001). There are three main types of adaptation policies that can be implemented to
reduce the vulnerability of the tourism sector in Belize to SLR and improve the adaptive capacity of the
country: (1) Hard engineering defences and (2) soft engineering defences, which both aim to protect
existing infrastructure and the land on which the infrastructure is built, as well as (3) retreat policies, which
aim to establish setbacks and thereby move people and/or infrastructure away from risk. A summary of
examples for each of the three types of adaptation polices are provided in Table 5.6.1, along with a
summary of select advantages and disadvantages of each. Adaption options discussed in this report should
be implemented in the framework of integrated coastal zone management (ICZM) and all decisions need to
take into account the broad range of stakeholders involved in decision-making in the coastal zone.
Adaptations should benefit coastlines in light of both climate and non-climate stresses and adaptations will
be promoted as a process towards ICZM rather than an endpoint (Linham & Nicholls, 2010).
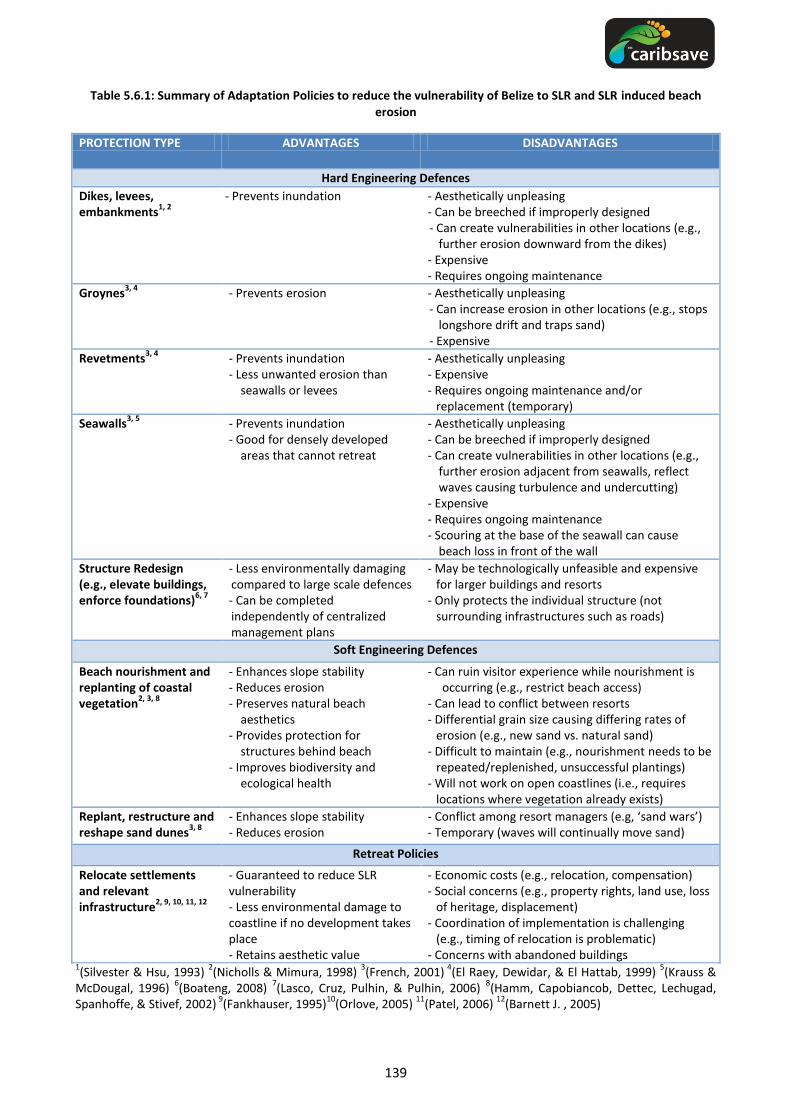
139
Table 5.6.1: Summary of Adaptation Policies to reduce the vulnerability of Belize to SLR and SLR induced beach erosion
PROTECTION TYPE ADVANTAGES DISADVANTAGES
Hard Engineering Defences
Dikes, levees, embankments
1, 2
- Prevents inundation - Aesthetically unpleasing - Can be breeched if improperly designed - Can create vulnerabilities in other locations (e.g.,
further erosion downward from the dikes) - Expensive - Requires ongoing maintenance
Groynes3, 4
- Prevents erosion
- Aesthetically unpleasing - Can increase erosion in other locations (e.g., stops
longshore drift and traps sand) - Expensive
Revetments3, 4
- Prevents inundation - Less unwanted erosion than
seawalls or levees
- Aesthetically unpleasing - Expensive - Requires ongoing maintenance and/or
replacement (temporary)
Seawalls3, 5
- Prevents inundation - Good for densely developed
areas that cannot retreat
- Aesthetically unpleasing - Can be breeched if improperly designed - Can create vulnerabilities in other locations (e.g.,
further erosion adjacent from seawalls, reflect waves causing turbulence and undercutting)
- Expensive - Requires ongoing maintenance - Scouring at the base of the seawall can cause
beach loss in front of the wall
Structure Redesign (e.g., elevate buildings, enforce foundations)
6, 7
- Less environmentally damaging compared to large scale defences - Can be completed independently of centralized management plans
- May be technologically unfeasible and expensive for larger buildings and resorts
- Only protects the individual structure (not surrounding infrastructures such as roads)
Soft Engineering Defences
Beach nourishment and replanting of coastal vegetation
2, 3, 8
- Enhances slope stability - Reduces erosion - Preserves natural beach
aesthetics - Provides protection for
structures behind beach - Improves biodiversity and
ecological health
- Can ruin visitor experience while nourishment is occurring (e.g., restrict beach access)
- Can lead to conflict between resorts - Differential grain size causing differing rates of
erosion (e.g., new sand vs. natural sand) - Difficult to maintain (e.g., nourishment needs to be
repeated/replenished, unsuccessful plantings) - Will not work on open coastlines (i.e., requires
locations where vegetation already exists)
Replant, restructure and reshape sand dunes
3, 8
- Enhances slope stability - Reduces erosion
- Conflict among resort managers (e.g, ‘sand wars’) - Temporary (waves will continually move sand)
Retreat Policies
Relocate settlements and relevant infrastructure
2, 9, 10, 11, 12
- Guaranteed to reduce SLR vulnerability - Less environmental damage to coastline if no development takes place - Retains aesthetic value
- Economic costs (e.g., relocation, compensation) - Social concerns (e.g., property rights, land use, loss
of heritage, displacement) - Coordination of implementation is challenging
(e.g., timing of relocation is problematic) - Concerns with abandoned buildings
1(Silvester & Hsu, 1993)
2(Nicholls & Mimura, 1998)
3(French, 2001)
4(El Raey, Dewidar, & El Hattab, 1999)
5(Krauss &
McDougal, 1996) 6(Boateng, 2008)
7(Lasco, Cruz, Pulhin, & Pulhin, 2006)
8(Hamm, Capobiancob, Dettec, Lechugad,
Spanhoffe, & Stivef, 2002) 9
(Fankhauser, 1995)10
(Orlove, 2005) 11
(Patel, 2006) 12
(Barnett J. , 2005)

140
5.6.1. Technology – Hard engineering
Hard engineering structures are manmade, such as dikes, levees, revetments and sea walls, which are used
to protect the land and related infrastructure from the sea. This is done to ensure that existing land uses,
such as tourism, continue to operate despite changes in the surface level of the sea. The capital investment
needed for engineered protection is expensive and not ideal in sparsely populated areas. For densely
populated cities such as Belize City and Dangriga, a seawall may be worth the investment when the costs of
the protected lands are taken into account. To protect Belize City, 40.1 km of new levees would need to be
constructed, costing nearly US $200 million, with annual maintenance of US $19 million. The cost for
building a seawall of 40 km in length would be US $684 million, with annual maintenance of US $17 million.
Dangriga would need a smaller seawall of 6.4 km, which would cost US $109 million for the initial
construction and US $2.7 million in annual maintenance costs. Levees for Dangriga would cost $31 million
to build and US $3.2 million in annual maintenance (Simpson et al., 2009).
Unfortunately, the effectiveness of this approach may not withstand the test of time nor withstand against
extreme events. Protective infrastructure not only requires expensive maintenance which can have long-
term implications for sustainability, but adaptations that are successful in one location may create further
vulnerabilities in other locations(IPCC, 2007b). For example, sea walls can be an effective form of flood
protection from SLR, but scouring at the base of the seawall can cause beach loss, a crucial tourism asset, at
the front of the wall (Krauss & McDougal, 1996). Moreover, hard engineering solutions are of particular
concern for the tourism sector because even if the structures do not cause beach loss, they are not
aesthetically pleasing, diminishing visitor experience. It is important for tourists that sight lines to the beach
not only be clear, but that access to the beach is direct and convenient (i.e. to not have to walk over or
around a long protective barrier). Smaller scale hard engineering adaptations offer an alternative solution
to large scale protection. Options include redesigning structures to elevate buildings and strengthen
foundations to minimize the impact of flooding caused by SLR.
5.6.2. Technology – Soft engineering
Protection can be implemented through the use of soft engineering methods which require naturally
formed materials to control and redirect erosion processes. For example, beaches, wetlands and dunes
have natural buffering capacity which can help reduce the adverse impacts of climate change (IPCC, 2007b).
Through beach nourishment and wetland renewal programmes, the natural resilience of these areas
against SLR impacts can be enhanced. Moreover, these adaptation approaches can simultaneously allow for
natural coastal features to migrate inland, thereby minimizing the environmental impacts that can occur
with hard engineering protection. Replenishing, restoring, replanting and reshaping sand dunes can also
improve the protection of a coastal area, as well as maintain and in some cases improve, the aesthetic
value of the site. Although less expensive and less environmentally damaging, soft engineering protection
is only temporary. For example, the ongoing maintenance required to upkeep sand dunes, such as sand
replenishment schemes, will create the periodic presence of sand moving equipment, subsequently
hindering visitor experience (e.g. eye and noise pollution, limit beach access). Conflicts can also arise
between resort managers resulting in ‘sand wars’, whereby sand taken to build up the beach at one given
resort may lead other resorts to ‘steal’ sand and place it on their own property.

141
5.6.3. Policy
Managed retreat is an adaptation measure that can be implemented to protect people and new
developments from SLR. Implementing setback policies and discouraging new developments in vulnerable
areas will allow for future losses to be reduced. Such an adaptation strategy raises important questions by
local stakeholders as to whether existing land uses, such as tourism, should remain or be relocated to
adjust to changing shorelines (e.g. inundation from SLR) (IPCC, 2007b). Adaptation through retreat can have
the benefit of saving on infrastructure defence costs (hard and soft engineering measures) while retaining
the aesthetic value of the coast, particularly in those areas that are uninhabited (i.e. little to no
infrastructure or populations along the coast). The availability of land to enable retreat is not always
possible, especially in highly developed areas where roads and infrastructures can impede setbacks or on
small islands where land resources are limited.
For many tourist destinations retreat is both difficult in terms of planning (and legally challenging) and
expensive to implement. Resorts and supporting tourism infrastructure are large capital investments that
cannot be easily uprooted to allow the sea to move inland. If the resorts cannot be moved, then the
alternative is to leave them damaged and eventually abandoned, degrading the aesthetics of the
destination coastline. It is important that the retreat policy be well organized, with plans that clearly outline
the land use changes and coordinate the retreat approach for all infrastructures within the affected areas.
Additional considerations of adaptation through retreat include loss of property, land, heritage and high
compensation costs that will likely be required for those business and home owners that will need to
relocate. Priority should be placed on transferring property rights to lesser developed land, allowing for
setback changes to be established in preparation for SLR (IPCC, 2007b).
The responsibility of managing the coastal areas of Belize is divided among numerous agencies, with
equally diverse legislation. Many non-governmental organisations participate as well. Such fragmentation
of management has created ad hoc decision making by various sectors and interests (Wells, n.d.). In 1999,
the Coastal Zone Management Act addressed this issue, providing institutional arrangements for CZM in
Belize through the establishment of the Coastal Zone Management Authority and its technical arm, the
Coastal Zone Management Institute.
The Act mandates the CZM Authority, an autonomous public statutory body, to address cross-sectoral
development of coastal resources. The CZM Institute undertakes research, monitoring, training and public
awareness activities of coastal resources and is responsible for the broad consultative and advisory role
with public and private sector agencies and of advising the Minister of polices relating to coastal
development of resource use. The Act also established an Advisory Council, which is appointed by the
Authority, comprising representation from the Government (e.g. Fisheries Administrator, Ports
Commissioner, and Chief Environmental Officer), private sector (e.g. Director of the Belize Tourism Board),
NGO community (e.g. conservation organisations) and academia (e.g. Director of the University of Belize
Marine Research Centre). The Council’s function is to advise the Institute on technical matters pertaining to
coastal issues and to facilitate coordination among agencies. Final decision making responsibility, however,
rests with other bodies of Government, not the CZM Authority, CZM Institute or the CZM Advisory Council.
CZM plans exist for all coastal areas in Belize, with the jurisdiction of the CZM Authority and Institute being
the area bounded by the shoreline up to the mean high water mark on its landward side and by the outer
limit of the territorial sea on its seaward side (CZMAI, 2000). The National Land Act requires that a 66 ft
wide strip of land should be left in its natural state, unless approval by the Minister is given otherwise. This
strip of land shall be reserved for the Government for public purposes, as stated in the 1886 Crown Lands
Act (CZMAI, 2010). The widespread clearance of riverine and coastal areas, in addition to construction

142
activities close to the shoreline, suggests that this setback policy is being applied unevenly, or that
provisions for approval of construction are being defied by developers. The policy occasionally varies in
relation to the cayes, whereby the reserve can be reduced to a 20 ft wide strip due to the server limitations
on land availability (CZMAI, 2010).
In terms of policies that directly address issues of climate change and SLR, the Government of Belize has
begun to encourage all agencies that execute policies or provide services in sectors to explore and access
the opportunities being developed by the climate change negotiation process. In 2008, the Belize Climate
Change Adaptation Policy was established, mandating government agencies to prepare adaptation policy
options for those sectors that may be impacted by global climate change—including coastal zone and
tourism. The Climate Change adaptation Policy states that the CZM Authority should (1) undertake climate
change vulnerability studies of the coastal zone; (2) prepare adaptation plans for the coastal zone to
address impacts of climate change; (3) maintain the inventory of coastal zone resources; (4) include climate
change in its annual report on the state of the coastal zone; (5) provide a report to the National Climate
Change Committee and the Chief Meteorologist on its climate change activities (Government of Belize,
2008).

143
5.7. Comprehensive Natural Disaster Management
Adaptive capacity can be measured through examination of policies and plans implemented for the
management of disasters, as well as the actions taken following a disaster. Being able to reduce the
impacts of natural disasters on a small nation is often difficult, especially when facing major hazard threats
on a regular basis. The post-disaster time period is a time when extra resources are needed to finance
imports of food, energy and inputs for the agricultural and manufacturing sectors. As a result, efforts to
build resilience or adaptive capacity gets put aside while immediate survival, shelter and health needs are
prioritised, along with the remedy of hazardous living conditions.
5.7.1. Management of natural hazards and disasters
The disaster management system can be thought of as a cycle where preparedness, mitigation5 and
adaptation activities (disaster prevention) are the focus prior to a disaster impact. Following an impact, the
management focus becomes response, recovery and reconstruction (disaster relief). These two parts of the
disaster management system work together and also impact the broader social, economic, ecological and
political system (see Figure 5.7.1).
Figure 5.7.1: Relationship of the Disaster Management System and Society
Caribbean disaster management and climate change
As a region, the Caribbean has made coordinated efforts to prepare for and respond to disasters. The
Caribbean Disaster Emergency Management Agency, CDEMA, (previously the Caribbean Disaster
Emergency Response Agency, CDERA) was created in 1991. CDEMA plays a leadership role in disaster
response, mitigation and information transfer within the region, operating the Regional Coordination
Centre during major disaster impacts in any of their 18 Participating States, while also generating useful
data and reports on hazards and climate change. The primary mechanism through which CDEMA has
influenced national and regional risk reduction activities is the Enhanced CDM Strategy (CDEMA, 2010). The
primary purpose of CDM is to strengthen regional, national and community level capacity for mitigation,
5 In the disaster management literature, ‘Mitigation’ refers to strategies that seek to minimise loss and facilitate recovery from
disaster. This is contrary to the climate change definition of mitigation, which refers to the reduction of GHG emissions.
Socio-ecological
System
Disaster Relief
System
Disaster Prevention
System
144
management and coordinated response to natural and technological hazards and the effects of climate
change (CDEMA, 2010) (emphasis added).
This regional disaster management framework is designed to inform national level disaster planning and
activities but also takes into consideration potential climate change impacts in its resilience building
protocols. The four Priority Outcomes of the CDM framework are:
1. Institutional capacity building at national and regional levels;
2. Enhanced knowledge management;
3. Mainstreaming of disaster risk management into national and sector plans; and
4. Building community resilience.
These outcomes have been further broken down into outputs that assist in the measurement of progress
towards the full implementation of CDM at the national and community level and within sectors (see Table
5.7.1). The CDM Governance Mechanism is comprised of the CDM Coordination and Harmonization Council
and six (6) Sector Sub-Committees. These sectors include – Education, Health, Civil Society, Agriculture,
Tourism and Finance. These six sectors have been prioritised in the Enhanced CDM Strategy as the focus
during the period from 2007 to 2012. CDEMA facilitates the coordination of these committees (CDEMA,
2010).
To address disaster management in the Caribbean tourism sector, CDEMA, with the support of the Inter-
American Development Bank (IDB) and in collaboration with the Caribbean Tourism Organization (CTO),
CARICOM Regional Organization for Standards and Quality and the University of the West Indies will be
implementing a Regional Disaster Risk Management (DRM) Project for Sustainable Tourism (The Regional
Public Good) over the period of January 2007 to June 2010. The project aims to reduce the Caribbean
tourism sector’s vulnerability to natural hazards through the development of a ‘Regional DRM Framework
for Tourism’. Under the Framework, a ‘Regional DRM Strategy and Plan of Action’ will be developed, with a
fundamental component being the development of standardised methodologies for hazard mapping,
vulnerability assessment and economic valuation for risk assessment for the tourism sector (CDERA, 2007;
CDERA, 2008).
Finally, the link between CDM and climate change cannot be ignored. Projections for the region suggest
that more extreme temperatures and more intense rainfall in certain seasons could lead to a greater
number of hydro-meteorological disasters. Many of the hazards facing Caribbean countries already pose
threats to lives and livelihoods and climate related events are regular occurrences. This has been
recognised with the mention of climate change in the CDM strategy. The CCCRA report will not only offer
improvements to the existing disaster management framework in the region, but will also offer pragmatic
strategies for action which will build resilience in the Caribbean to the predicted impacts from climate
change.

145
Table 5.7.1: Enhanced Comprehensive Disaster Management Programme Framework 2007-2012
GOAL Regional Sustainable Development enhanced through Comprehensive Disaster Management
PURPOSE To strengthen regional, national and community level capacity for mitigation, management and coordinated
response to natural and technological hazards and the effects of climate change. OUTCOME 1: Enhanced institutional support for CDM Program implementation at national and regional levels
OUTCOME 2: An effective mechanism and programme for management of comprehensive disaster management knowledge has been established
OUTCOME 3: Disaster Risk Management has been mainstreamed at national levels and incorporated into key sectors of national economies (including tourism, health, agriculture and nutrition)
OUTCOME 4: Enhanced community resilience in CDERA states/ territories to mitigate and respond to the adverse effects of climate change and disasters
OUTPUTS 1.1 National Disaster Organizations are strengthened for supporting CDM implementation and a CDM program is developed for implementation at the national level 1.2 CDERA CU is strengthened and restructured for effectively supporting the adoption of CDM in member countries 1.3 Governments of participating states/ territories support CDM and have integrated CDM into national policies and strategies 1.4 Donor programming integrates CDM into related environmental, climate change and disaster management programming in the region. 1.5 Improved coordination at national and regional levels for disaster management 1.6 System for CDM monitoring, evaluation and reporting being built
OUTPUTS 2.1 Establishment of a Regional Disaster Risk Reduction Network to include a Disaster Risk Reduction Centre and other centres of excellence for knowledge acquisition sharing and management in the region 2.2 Infrastructure for fact-based policy and decision making is established /strengthened 2.3 Improved under-standing and local /community-based knowledge sharing on priority hazards 2.4 Existing educational and training materials for Comprehensive Disaster Management are standardized in the region. 2.5 A Strategy and curriculum for building a culture of safety is established in the region
OUTPUTS 3.1 CDM is recognized as the roadmap for building resilience and Decision-makers in the public and private sectors understand and take action on Disaster Risk Management 3.2 Disaster Risk Management capacity enhanced for lead sector agencies, National and regional insurance entities and financial institutions 3.3 Hazard information and Disaster Risk Management is integrated into sectoral policies, laws, development planning and operations and decision-making in tourism, health, agriculture and nutrition, planning and infrastructure 3.4 Prevention, Mitigation, Preparedness, Response, recovery and Rehabilitation Procedures developed and Implemented in tourism, health, agriculture and nutrition, planning and infrastructure
OUTPUTS 4.1 Preparedness, response and mitigation capacity (technical and managerial) is enhanced among public, private and civil sector entities for local level management and response 4.2 Improved coordination and collaboration between community disaster organisations and other research/data partners including climate change entities for undertaking comprehensive disaster management 4.3 Communities more aware and knowledgeable on disaster management and related procedures including safer building techniques 4.4 Standardized holistic and gender-sensitive community methodologies for natural and anthropogenic hazard identification and mapping, vulnerability and risk assessments and recovery and rehabilitation procedures developed and applied in selected communities. 4.5 Early Warning Systems for disaster risk reduction enhanced at the community and national levels
(Source: CDEMA, 2010)

146
5.7.2. Management of disasters in Belize
Disaster management in Belize is led by the National Emergency Management Organization (NEMO),
located in Belmopan. The NEMO is comprised of the Cabinet, with the Prime Minister as chairperson and
the Chief Executive Officers, who chair the 10 operational committees. Those operational committees
include:
Education, Communication and Warning
Medical and Relief Measures
Housing and Shelter
Search, Rescue and Initial Clearance
Collection Control and Distribution of Food and Material
Assessment and Evaluation of Damage
Foreign Assistance; Transport
Environment and Utilities
Further to these national level committees, there are “9 District Emergency Committees (chaired by the
senior Minister in each District) representing Belize, Corozal, Orange Walk, Cayo, Stann Creek, Toledo,
Belmopan, San Pedro and Caye Caulker” (NEMO, 2011). There are activities within each district geared at all
phases of the disaster management cycle from conducting preparedness work through public education
and training to participation in response activities.
This tiered system of disaster management with responsibilities spread to the districts and communities is
an effective method for improving the capacity of the country to response and prepare for disasters. The
relocation of the capital and Government offices was a wise move, particularly for NEMO activities. While
having some district and community level efforts is important, having a lead organisation that is able to
maintain function will permit optimal disaster and emergency response. To continue strengthening national
disaster management capacity, the Government of Belize and the UNDP are working on a project entitled
“Strengthening of Disaster Preparedness and Emergency Response Capacity” (GFDRR, 2010). “In response
to the national need for holistic planning the project firstly proposes the collation, revision, updating and
possible consolidation of existing sectoral disaster management plans into a comprehensive National
Disaster Management Plan” (GFDRR, 2010).
Post-disaster Activities
In the Caribbean there is a Rapid Needs Assessment Team (RNAT), led by CDEMA, which is deployed to the
impacted state to conduct a Damage Assessment and Needs Analysis (DANA) (UNDP, 2011). This kind of
skilled assessment team is available to conduct a standard assessment procedure across many of the
CDEMA Participating States. However, the DANA process is only executed upon the request of the impacted
state. Therefore, the assessment information is not available following every disaster and as such, all
disaster offices should also have the capacity to execute a post-disaster assessment on their own. Under
the CDEMA system, coordinating activities across multiple countries builds response capacity by taking
advantage of the resources and personnel from neighbouring countries. This enhances response and
reconstruction efforts in Participating States. Nevertheless, the need to incorporate the principles of
‘building back better’ must also be a priority so that the post-disaster context becomes an opportunity for
building resilience and institutionalizing disaster risk reduction goals.
While there are major expenses associated with disasters, there are post-disaster funds available for
reconstruction and recovery. Recently Belize has experienced major losses due to hurricane impacts:
147
“Government expenditures associated with increased costs for emergency reconstruction
due to these events [hurricanes Keith and Iris] were approximately US $50 million, covering
three fiscal cycles. The Government of Belize has argued that these spending increases for
reconstruction led to large fiscal deficits and debt accumulations that in 2006 required a
restructuring operation for public debt” (GFDRR, 2010).
This expense and long term economic impact reinforces the importance of preparedness, mitigation and
reduction of risks. In addition, this can be viewed as a missed opportunity for vulnerability reduction. The
post-disaster context must be viewed as an opportunity to rebuild physical structures and socio-economic
systems with lower vulnerability and greater resilience. The ‘Building Back Better’ Propositions created
after the 2004 Tsunami in Asia offer guidance on how to do so. Some of those propositions have specific
relevance to this case in Belize:
Good recovery must leave communities safer by reducing risks and building resilience.
Good recovery planning and effective coordination depend on good information.
Governments, donors and aid agencies must recognize that families and communities drive their
own recovery.
Recovery must promote fairness and equity.
Governments must enhance preparedness for future disasters.
Local Governments must be empowered to manage recovery efforts and donors must devote
greater resources to strengthening Government recovery institutions, especially at the local level.
(Clinton, 2006, p. 3)
Some short term debt and fiscal deficits may be inevitable, but with the proper investment, the reduction
of risks and elimination of some unsafe conditions are achievable goals and should lead to lower economic
impacts in the future. To help achieve this,
An innovative system of Indicators of Risk and Risk Management is being developed for
Belize, financed by the Inter-American Development Bank as part of the CAPRA [Central
American Probabilistic Risk Assessment] project. These indicators ...cover the consequences
of major disaster impacts (Disaster Deficit index), local small-scale and frequent events
(Local disaster index), community’s vulnerability (Prevalent Vulnerability index) and risk
management (Risk Management index). The local disaster index will be developed from and
complement the data established by the DesInventar historical disaster losses record.
(GFDRR, 2010)
These types of assessments are much needed and complement one another. Capacity building efforts and
sourcing a reliable financing mechanism that will permit personnel to manage and keep record of the data
is an integral part of incorporating these indicator results into disaster planning and prevention activities.
Since many of the current projects are funded by donor Governments and agencies, Belize will therefore
have to seek out funding (whether through the national budget, or other donor projects) to continue the
important work being done in many areas from flood management and hazard planning, to capacity
building and risk assessment.
148
5.7.3. Technology
Technology in the field of disaster management can reduce vulnerabilities through structural protective
structures, by way of policies that control or guide development, or through public education that would
then change the behaviours that generate vulnerability.
Coastal Protection
In the Caribbean investments in structural protection are often used to protect coastlines. The use of
groynes, breakwaters and sea walls are popular methods to control coastal erosion processes and
safeguard development from damaging wave actions. Although these structures do provide some relief,
they generally offer only temporary benefits and sometimes also cause negative effects in other locations
along the coast. Disaster management practices have also found that structural protection is very expensive
and can sometimes worsen the impacts of a disaster when the size of the structure is incongruent with an
event (e.g. sea wall structures, if broken or damaged, can add debris and exacerbate flooding and erosion).
Further discussion of the structural responses to climate change and SLR and storm surge can be found in
the Sea Level Rise and Storm Surge Impacts on Coastal Infrastructure and Settlements section.
Technology and Public Education
Technology can enhance disaster management at all stages of the disaster management cycle. The national
operational committee for Education, Communication and Warning has, in recent year, been making efforts
to create an Education Sector disaster risk reduction (DRR) policy and plan (Babb, n.d.). As part of this
effort, public education has been executed through sensitisation campaigns, family disaster plan
competitions and literacy initiatives within elementary schools (Babb, n.d.). The role of the education
sector is acknowledged to go beyond simply providing information and building capacity, but schools are
also used as shelters and the education sector personnel can collect data or conduct surveys to verify data.
The International Federation of the Red Cross (IFRC) has also contributed to contingency planning by
conducting community vulnerability and capacity assessments (VCA) in 35 communities across Belize6. Few
specific public education projects were identified in Belize during this research. Their website does have
information about District Organizations, Emergency Shelters and news/press releases, however hazard-
specific information was limited primarily to information on hurricanes (NEMO, 2011). As a result, Belizeans
do not have a lot of information easily available to them through the website
(http://www.nemo.org.bz/index.php) and what is available under Publications could be more user friendly
for those looking to education themselves. Community awareness campaigns through the Education,
Communication and Warning committee may be more interactive and far reaching through the district
committees.
Early Warning Systems (EWS)
An EWS is commonly used in conjunction with an evacuation plan to guide at-risk persons to safety and
avoid losses of life from natural hazard events. The use of an EWS is an effective communication tool only
when the proper instrumentation for collection of the necessary weather data is present (i.e. rain gauges,
tidal gauges, weather stations etc.). Belize was funded for a watershed flood management project by the
Japanese Government to provide warnings to communities along the Mopan and Belize Rivers (GFDRR,
2010). The Belize Electricity Company Limited (BECOL) also has a similar early warning system for the Macal
6 These studies are available on the CCCCC website www.caribbeanclimate.bz.

149
River, a tributary of the Belize River, where it has 3 hydroelectric generating facilities (GFDRR, 2010).
Through an information management project, NEMO is also working on enhancing early warning systems
and the UNDP has financed an Information Manager to permit better identification, assessment and
monitoring of disaster risk (GFDRR, 2010).
These are 3 important projects that are making positive contribution to the disaster management system
and vulnerability reduction efforts. However, an integrated system of communication and information
dissemination is also required. The National Meteorological Service has a network of hydrological and
meteorological observation stations, as well as weather and flood forecasting systems. The Chief
Meteorologist is a member of NEMO and offers advice on all phases of the National Hurricane Emergency
Plan (National Meteorological Service, 2011).
A tsunami early warning system is also important given Belize’s vulnerability and exposure to earthquakes.
Following the 2009 earthquake, efforts are being made to install a National Tide Monitoring Network with
sea level gauges and improved liaison with the PTWC and CDEMA warning systems (Williams R. , 2009).
While no system exists within Belize now, there is capacity for such a system and the information officer
funded by UNDP is one person who could lead the development of the tsunami warning system. Further
efforts to collaborate with the CCCCC would allow NEMO and the country to take advantage of the Centre
and its climate related resources (sea level gauges).
5.7.4. Policy
Across the Caribbean policies to adapt to and manage climate change impacts are becoming more
common. The strong relationship between disasters and climate change creates a policy arena where both
issues can be managed under similar governance mechanisms.
The Belize National Hazard Mitigation Policy (2004) integrates hazard risk management and sustainable
development at the national, sectoral and community level (GFDRR, 2010). The Hazard Mitigation Policy
was developed after two major storms created economic problems in Belize and this was also a time when
disaster management thinking was beginning to realise the importance of mainstreaming disaster risk
reduction into all areas and sectors to permit sustainable development. The policy concentrates on the
need for integrated hazard risk management at all levels, sectors and communities (NPDC, 2004). Another
focus of the policy is on environmental management and conservation. This item will not only help with
disaster and hazard management, but will also improve climate change adaptation because a healthy
environment is more resilient to shocks (extreme events) and slow-onset changes, such as SLR. One
criticism of this policy is its omission of fiscal or economic tools for hazard mitigation (Development
Solutions Ltd., 2006). Given the recent debt troubles in Belize, a hazard mitigation policy must include
considerations for reducing economic impacts. One possible tool to be explored could be a tax incentive for
investments in protection equipment, such as hurricane shutters.
Hazard Mitigation Plan – In the development of the Hazard Mitigation Plan, an assessment of institutional
capability and legislative effectiveness was carried out. This assessment offers both positive and negative
outcomes from the Hazard Mitigation Plan development and offers numerous recommendations for action
that would improve hazard risk reduction in Belize. The major deficiencies relate to lack of power to
enforce legislation, overlapping regulation and mitigation tools under different government agencies, a
skew of legislation toward preparedness and response, the need for greater resources in government
agencies and the need for better integration of the information on environment, development and
vulnerability into decision making (Development Solutions Ltd., 2006). This assessment document is

150
presented in a format that should enable prioritisation of actions to improve hazard mitigation in Belize.
Furthermore, it touches on many diverse but linked concepts of vulnerability and development including
gender, poverty and education.
Disaster Preparedness and Response Act, Chapter 145 (2000): This Act is the primary legislation guiding
disaster management in Belize. The Act outlines the roles and functions of the National Emergency
Coordinator (NEC), NEMO and the Ministers that lead the operational committees. Further information on
shelters and the emergency operations centres (EOC), as well as outlining the process for specially
vulnerable areas (Government of Belize, 2000). The Act is weak in a few areas of disaster management,
simply because of its focus on only two phases of the disaster management cycle. The legislation also does
not discuss risk transfer (GFDRR, 2010).
Together the Hazard Mitigation Policy and Plan and the Disaster Preparedness and Response Act provide a
comprehensive policy framework to guide disaster management. The overlap of goals and legislation
between these and other environmental and development policies demands open communication and
information sharing across Government ministries.
Environmental Impacts and Development Planning
Separate from the policies and plans for emergency management, environmental policies and plans can
also affect a country’s ability to sustain impact from and respond to, disasters. Often in communities
around the world, a ‘disaster’ results when natural hazard events occur in areas where there is an absence
of land-use planning, or as a result of poor development planning.
The first part of successful land-use planning is to consider the environmental conditions and hazards along
with the desired socio-economic development goals. Environmental impact assessments (EIAs), when
clearly defined and legislated, can ensure development does not have serious negative environmental
impacts. In Belize, EIA Regulations are part of the Environmental Protection Act; however, a definition of an
EIA is not part of the Act (Trotz, Rogers, de Romilly, & Clarke, 2004). Nevertheless, the EIA Regulations
clearly outline the review procedure and the Department of Environment (DOE) has the authority to
request further studies if they are not satisfied with the initial EIA results (Trotz, Rogers, de Romilly, &
Clarke, 2004). The NEC is consulted for EIAs when it is deemed necessary by the DOE, therefore disaster risk
considerations can be included in development planning. Although the EIA procedures and guidelines are
quite good, their consideration of climate change impacts could be improved and a model terms of
reference (TOR) would allow for more consistency in the approach to EIAs in Belize (Trotz, Rogers, de
Romilly, & Clarke, 2004).
Finally, in relation to environmental planning,
There is no overarching land use policy to guide sectoral policy formulation and
implementation as it relates to the use of land, whether for protected areas, industry,
agriculture or human settlement, or for defining human resource needs to manage natural
resources. This has implications to hazard mitigation at the policy level (Development
Solutions Ltd., 2006)
Therefore, developers and planning activities do not take environmentally sustainable action, nor do they
have to consider hazards. Legislation is an effective tool for demanding environmental sustainability, but so
too are financial and tax incentives, for example. Use of more diverse tools to address hazards and
environmental conservation/protection is desired in the Belize context (Development Solutions Ltd., 2006).

151
Construction and safe building
As a region, relevant groups are working hard toward the development and application of a Caribbean
Building Code or Building Standards using the International Code Council (ICC) codes as the primary base
documents with additional input from the Caribbean Uniform Building Code (CUBiC) and earlier
assessments on wind load and seismic considerations. The Code has already been prepared and the next
step is for each of the 15 states involved to review the documents and prepare their own Caribbean
Application Document (CAD). This document will most likely be prepared by specialists who will determine
how the regional code should be applied given each country’s own peculiarities; for example some
countries will focus more heavily on flooding and less on seismic considerations. The CAD will then be
reviewed by all of the relevant stakeholders on the National Stakeholder Subcommittee who will provide
comments before it is submitted to CARICOM (Personal communication - Jonathan Platt, Barbados National
Standards Institute. May 4, 2011).
Belize City’s Building Code has been in place since 1963 and Belmopan building and planning regulations,
however there is no national building code (Wason, 2002). The objective during the Caribbean Disaster
Mitigation Project (CDMP) was to complete a national building code and residential construction guide by
1999 (Wason, 2002). The Building Act was then officially created in 2003 with the establishment of the
Central Building Authority (Titus, 2007). Hurricane and fire considerations are mentioned in the Building
Act, however, the primary consideration is for older buildings that may be in disrepair, rather than new
structures (Government of Belize, 2003). This again is evidence of Belize’s focus on response, rather than
mitigation or preparedness, because in order to identify buildings as unsafe, there must be a report. The
limited resources for building inspectors cannot ensure all hazardous buildings are found. A related policy,
is the Reconstruction and Development Corporation Act which is no longer under an administering unit
which means it has not been enforced since Hurricane Hattie in 1961 (GFDRR, 2010). There is an
acknowledgement in Belize that structures must be built to certain standards and some training of building
inspectors has occurred, but greater efforts at collaboration and cooperation across Government agencies
is needed, especially links with NEMO.
Catastrophe Insurance Coverage
Re-insurance within the Caribbean region has generally been provided by international insurance
companies. However, the classification of the region as a catastrophe zone, thus being high risk, means that
insurance premiums remain very high for those who seek insurance. The Caribbean is home to the first risk
pooling facility designed to limit financial impacts of catastrophic hurricanes and earthquakes in Caribbean
member countries, by providing short-term liquidity when the policy is triggered (Kambon et al., 2011).
Originally, the insurance index was based on degree of shaking during earthquakes or wind speed for
hurricane events and the member country would qualify for a pay-out based on their policy and the level of
damages deemed to be associated with either wind or shaking. Recently, the need to also consider water
damages has been noted. As a result, the CCRIF has continued to make progress on an ‘Excess Rainfall
product’ which is anticipated for the beginning of the 2011-2012 policy year starting on June 1, 2011
(CCRIF, 2011).

152
5.8. Community Livelihoods, Gender, Poverty and Development
As part of the CARIBSAVE Community Vulnerability and Adaptive Capacity Assessment methodology,
household surveys were conducted in the Placencia community to determine household and community
access to five livelihood assets (financial, physical, natural, social and human). Livelihood strategies
(combinations of assets) are evaluated to determine the adaptive capacity of households and consequently
communities. A total of 31 respondents were surveyed, 21 (68%) of whom were male and ten (32%) were
female.
5.8.1. Demographic profile of respondents
Residency in the Community
Overwhelmingly, respondents were long-time residents of Belize, with 84% (N= 26) of the sample indicating
that they had lived in their community for a minimum of 21 years. Female and male respondents, however,
displayed a similar distribution in terms of length of time in their community.
Table 5.8.1: Length of Residency in Community
Residency Male Female Total
1 - 5 years 1 4.8% 0 0.0% 1 3.2%
6 – 10 years 0 0.0% 0 0.0% 0 0.0%
11 - 15 years 1 4.8% 0 0.0% 1 3.2%
16 - 20 years 1 4.8% 2 20.0% 3 9.7%
21 - 25 years 18 85.7% 8 80.0% 26 83.9%
Age Distribution
The sample was a predominantly older sample, with 65% of respondents being over the age of 45.
Table 5.8.2: Age Distribution of Sample
Age Male Female TOTAL
Under 25 0 0.0% 1 10.0% 1 3.2%
25 - 34 6 28.6% 1 10.0% 7 22.6%
35 - 44 3 14.3% 0 .0% 3 9.7%
45 - 54 2 9.5% 3 30.0% 5 16.1%
55 - 59 4 19.0% 1 10.0% 5 16.1%
Over 60 6 28.6% 4 40.0% 10 32.3%

153
Figure 5.8.1: Age of Respondents
5.8.2. Household form and structure
Given the older demographic of the sample, nearly 26% of respondents were widowed. Half of female
respondents were widowed. 45% of respondents were married or in a common-law relationship.
Table 5.8.3: Relationship Status of Respondents
Status Male Female Total
Single 1 4.8% 1 10.0% 2 6.5%
Single (Visiting Relationship) 5 23.8% 0 0.0% 5 16.1%
Married 8 38.1% 2 20.0% 10 32.3%
Separated 1 4.8% 0 0.0% 1 3.2%
Other/Common Law 2 9.5% 2 20.0% 4 12.9%
Divorced 1 4.8% 0 0.0% 1 3.2%
Widowed 3 14.3% 5 50.0% 8 25.8%
When disaggregated on the basis of sex, a larger proportion of male respondents (N=8 / 38%) than female
respondents (N=2 / 20%) indicated that they were married, suggesting possibly stronger support systems
present for men. This is likely due to the age distribution of the sample.
.0%
5.0%
10.0%
15.0%
20.0%
25.0%
30.0%
35.0%
40.0%
Under 25 25 - 34 35 - 44 45 - 54 55 - 59 Over 60
Males Females
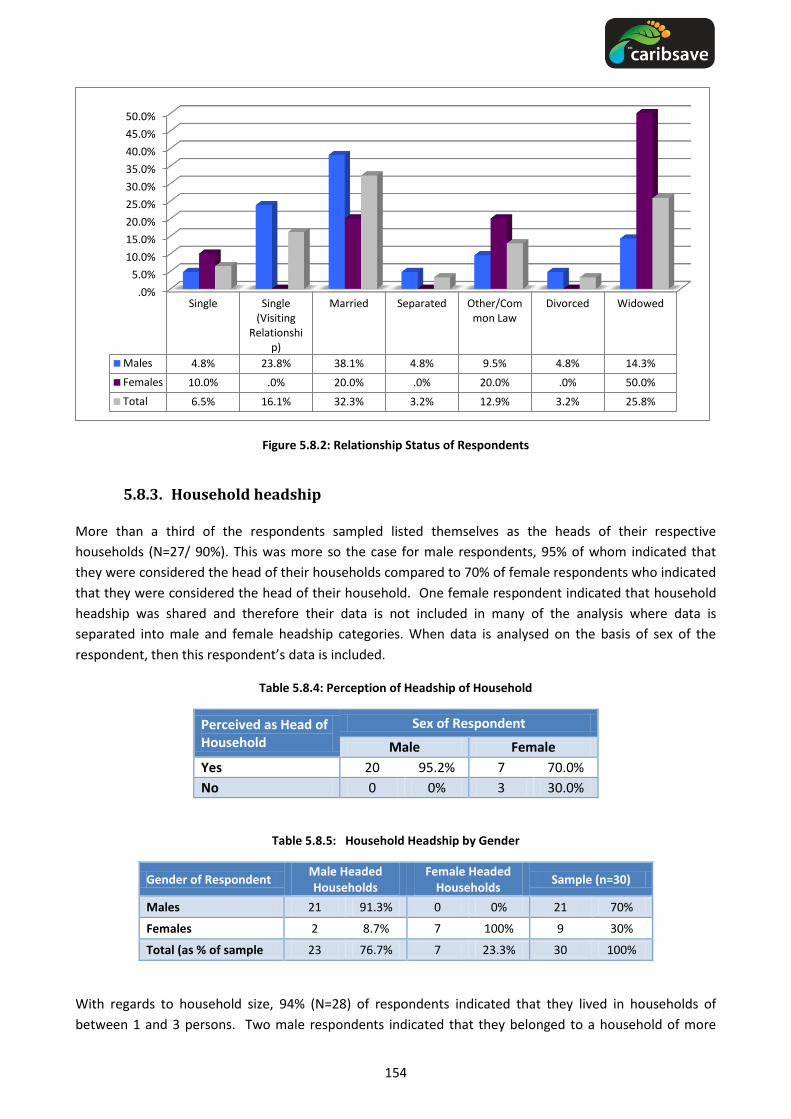
154
Figure 5.8.2: Relationship Status of Respondents
5.8.3. Household headship
More than a third of the respondents sampled listed themselves as the heads of their respective
households (N=27/ 90%). This was more so the case for male respondents, 95% of whom indicated that
they were considered the head of their households compared to 70% of female respondents who indicated
that they were considered the head of their household. One female respondent indicated that household
headship was shared and therefore their data is not included in many of the analysis where data is
separated into male and female headship categories. When data is analysed on the basis of sex of the
respondent, then this respondent’s data is included.
Table 5.8.4: Perception of Headship of Household
Perceived as Head of Household
Sex of Respondent
Male Female
Yes 20 95.2% 7 70.0%
No 0 0% 3 30.0%
Table 5.8.5: Household Headship by Gender
Gender of Respondent Male Headed Households
Female Headed Households
Sample (n=30)
Males 21 91.3% 0 0% 21 70%
Females 2 8.7% 7 100% 9 30%
Total (as % of sample 23 76.7% 7 23.3% 30 100%
With regards to household size, 94% (N=28) of respondents indicated that they lived in households of
between 1 and 3 persons. Two male respondents indicated that they belonged to a household of more
.0%
5.0%
10.0%
15.0%
20.0%
25.0%
30.0%
35.0%
40.0%
45.0%
50.0%
Single Single (Visiting
Relationship)
Married Separated Other/Common Law
Divorced Widowed
Males 4.8% 23.8% 38.1% 4.8% 9.5% 4.8% 14.3%
Females 10.0% .0% 20.0% .0% 20.0% .0% 50.0%
Total 6.5% 16.1% 32.3% 3.2% 12.9% 3.2% 25.8%

155
than 4 persons. Seven male respondents and 4 female respondents indicated they lived alone (37%; see
Table 5.8.6).
Table 5.8.6: Household Size by Sex of Head of Household
Size of Household Headship of Household
Male Female Total
1 7 30% 4 57% 11 37%
2 - 3 14 61% 3 43% 17 57%
4 - 5 1 4% 0 0% 1 3%
6 - 7 1 4% 0 0% 1 3%
8 - 9 0 0% 0 0% 0 0%
5.8.4. Education and livelihoods
The largest proportion of the sample (N=25 /80.6%) indicated that they had completed a secondary level of
education, 5 of whom had completed the advanced placement secondary education. Of note, there is a
slightly higher proportion of males who had undertaken community college or a tertiary sector education
(university, professional designation etc...).
Table 5.8.7: Sample Distribution by Education and Training
Highest Level of Education Male Female Total
Primary 1 4.8% 0 0% 1 3.2%
Secondary (Ordinary Level) 13 61.9% 7 70.0% 20 64.5%
Secondary (Advanced Level) 3 14.3% 2 20.0% 5 16.1%
Community College 1 4.8% 0 0% 1 3.2%
Tertiary 3 14.3% 1 10.0% 4 12.9%
Figure 5.8.3 shows that the sample is fairly evenly distributed between the lower three and higher three
income ranges. The largest portion of the sample fall within the highest income category (>US $1,500), and
conversely, the smallest portion of the sample fall in the lowest category (<US $500). In terms of gender,
male-headed households indicated higher average incomes than female-headed households, whereas
female-headed households dominate the lower household income brackets.

156
Figure 5.8.3: Sample Distribution by Average Monthly Earnings
Predominantly, respondents acquired their primary income from tourism. Only seven respondents (23%)
indicated that their primary household income wasn’t from tourism.
Table 5.8.8: Labour Market Participation: Involvement in Tourism Sector
Tourism Sector Involvement Male Female Total
Yes 16 76% 4 40% 20 65%
No 5 24% 2 20% 7 23%
Didn't respond 0 0% 4 40% 4 13%
The largest proportion of respondents (N=10) derived their primary source of income from privately owned
business in the tourism sector. Three respondents were informal tour guides and 6 respondents were tour
operators. Only six respondents worked in an employment sector outside of tourism, three of which
indicated they were self employed, two worked in transportation and only one was in the mechanical /
technical field.
0%
5%
10%
15%
20%
25%
30%
35%
<500 USD 500-750 USD
751-1000 USD
1001 - 1250 USD
1251-1500 USD
>1500
Male Headed Households Female Headed Households Total

157
Table 5.8.9: Labour Market Participation: Involvement in Non-Tourism Sectors
Employment Sector Male Female Total
Taxi Driver 1 4.8% 0 0.0% 1 3.2%
Tour Operator 5 23.8% 1 10.0% 6 19.4%
Hotel Workers 0 0.0% 0 0.0% 0 0.0%
Restaurant Workers 0 0.0% 0 0.0% 0 0.0%
Craft sellers or vendors 0 0.0% 0 0.0% 0 0.0%
Informal tour guides 3 14.3% 0 0.0% 3 9.7%
Privately owned business 6 28.6% 4 40.0% 10 32.3%
Other 1 4.8% 0 0.0% 1 3.2%
Did not answer 5 23.8% 5 50.0% 10 32.3%
5.8.5. Food security
Overwhelmingly respondents (80%) indicated that their food supply was procured from grocery stores or
super markets. Additional sources of food included Traditional Markets (16.7%) and Community Shops
(6.7%).
Table 5.8.10: Source of Food Supply
Source of Food Supply Male Headed Female Headed
Sample Male Female Male Female
Grown by Family 0 0.0% 0 0.0% 0 0.0% 0 0.0% 0 0.0%
Grocery store/Super market 18 85.7% 2 100% 0 0.0% 4 57.1% 24 80.0%
Open air/Traditional market 5 23.8% 0 0.0% 0 0.0% 0 0.0% 5 16.7%
Community 2 9.5% 0 0.0% 0 0.0% 0 0.0% 2 6.7%
Barter 0 0.0% 0 0.0% 0 0.0% 0 0.0% 0 0.0%
Other 0 0.0% 0 0.0% 0 0.0% 0 0.0% 0 0.0%
When asked about the adequacy of the household food supply, all but one respondent (female) indicated
an adequate supply throughout the year. Given the small sample size a definitive conclusion cannot be
made in regards to gender and food adequacy, but more research in this area could provide further
insights.
Table 5.8.11: Adequacy of Food Supply
Adequacy of Food Supply
Male Headed Female Headed Sample
Male Female Male Female
Yes 20 95.2% 2 100.0% 0 0.0% 6 85.7% 28 93.3%
No 0 0.0% 0 0.0% 0 0.0% 1 14.3% 1 3.3%
5.8.6. Financial security and social protection
Evidence of such networks is apparent, based on the ways in which households headed in different ways
received and offered support:
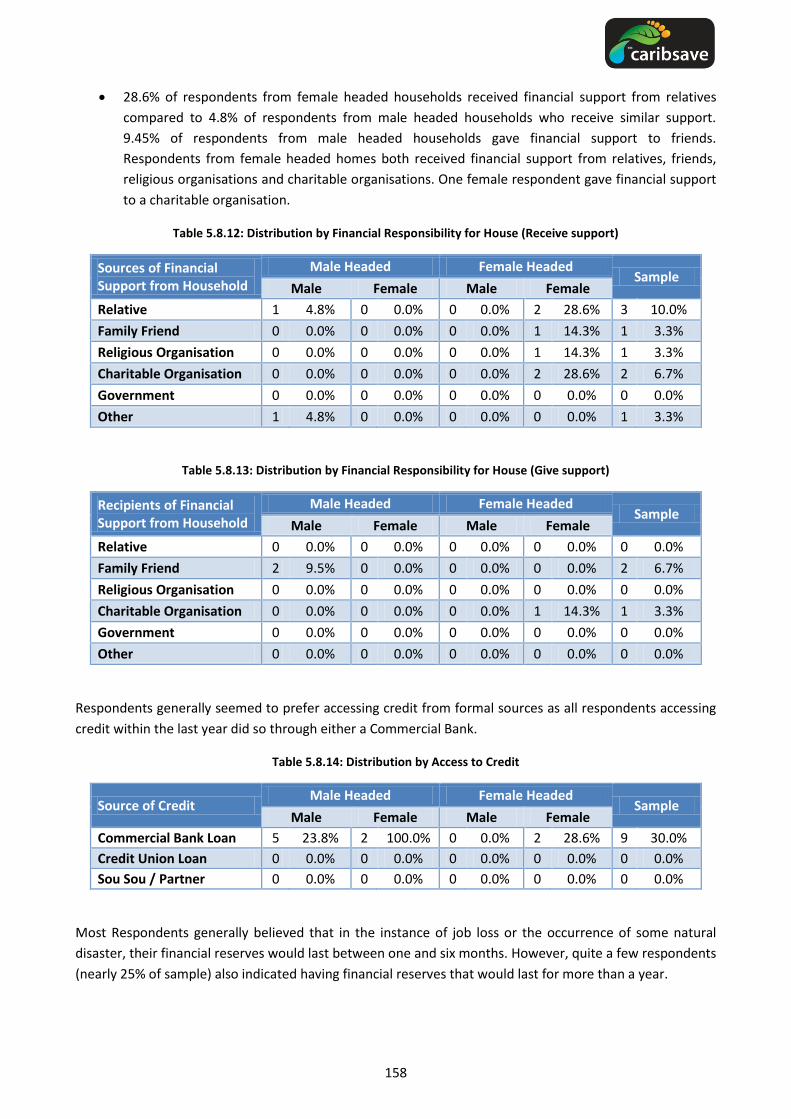
158
28.6% of respondents from female headed households received financial support from relatives
compared to 4.8% of respondents from male headed households who receive similar support.
9.45% of respondents from male headed households gave financial support to friends.
Respondents from female headed homes both received financial support from relatives, friends,
religious organisations and charitable organisations. One female respondent gave financial support
to a charitable organisation.
Table 5.8.12: Distribution by Financial Responsibility for House (Receive support)
Sources of Financial Support from Household
Male Headed Female Headed Sample
Male Female Male Female
Relative 1 4.8% 0 0.0% 0 0.0% 2 28.6% 3 10.0%
Family Friend 0 0.0% 0 0.0% 0 0.0% 1 14.3% 1 3.3%
Religious Organisation 0 0.0% 0 0.0% 0 0.0% 1 14.3% 1 3.3%
Charitable Organisation 0 0.0% 0 0.0% 0 0.0% 2 28.6% 2 6.7%
Government 0 0.0% 0 0.0% 0 0.0% 0 0.0% 0 0.0%
Other 1 4.8% 0 0.0% 0 0.0% 0 0.0% 1 3.3%
Table 5.8.13: Distribution by Financial Responsibility for House (Give support)
Recipients of Financial Support from Household
Male Headed Female Headed Sample
Male Female Male Female
Relative 0 0.0% 0 0.0% 0 0.0% 0 0.0% 0 0.0%
Family Friend 2 9.5% 0 0.0% 0 0.0% 0 0.0% 2 6.7%
Religious Organisation 0 0.0% 0 0.0% 0 0.0% 0 0.0% 0 0.0%
Charitable Organisation 0 0.0% 0 0.0% 0 0.0% 1 14.3% 1 3.3%
Government 0 0.0% 0 0.0% 0 0.0% 0 0.0% 0 0.0%
Other 0 0.0% 0 0.0% 0 0.0% 0 0.0% 0 0.0%
Respondents generally seemed to prefer accessing credit from formal sources as all respondents accessing
credit within the last year did so through either a Commercial Bank.
Table 5.8.14: Distribution by Access to Credit
Source of Credit Male Headed Female Headed
Sample Male Female Male Female
Commercial Bank Loan 5 23.8% 2 100.0% 0 0.0% 2 28.6% 9 30.0%
Credit Union Loan 0 0.0% 0 0.0% 0 0.0% 0 0.0% 0 0.0%
Sou Sou / Partner 0 0.0% 0 0.0% 0 0.0% 0 0.0% 0 0.0%
Most Respondents generally believed that in the instance of job loss or the occurrence of some natural
disaster, their financial reserves would last between one and six months. However, quite a few respondents
(nearly 25% of sample) also indicated having financial reserves that would last for more than a year.

159
Figure 5.8.4: Financial Security: Job Loss or Natural Disaster
More specifically: in relation to Job Loss, nearly half of male respondents indicated that they would have
financial coverage for 4-6 months (N=10/50%). Four male respondents and three female respondents
indicated that they would have financial resources for over one year. There were three male and three
female respondents who indicated they had financial reserves for 1-3 months. When looking at these data
it is important to remember the age of the respondents and note that many respondents are retired and
would therefore not be impacted by job loss.
Table 5.8.15: Sample Distribution by Financial Security: Job Loss
Financial Reserve Male Headed Female Headed
Sample Male Female Male Female
Less than 1 month 1 4.8% 0 0.0% 0 0.0% 0 0.0% 1 3.3%
1 - 3 months 3 14.3% 0 0.0% 0 0.0% 3 42.9% 6 20.0%
4 - 6 months 10 47.6% 1 50.0% 0 0.0% 2 28.6% 13 43.3%
7 - 9 months 2 9.5% 0 0.0% 0 0.0% 0 0.0% 2 6.7%
10 - 12 months 1 4.8% 0 0.0% 0 0.0% 0 0.0% 1 3.3%
More than 1 year 4 19.1% 1 50.0% 0 0.0% 2 28.56% 7 23.3%
Do not know 0 0.0% 0 0.0% 0 0.0% 0 0.0% 0 0.0%
Similarly, respondents from female headed households indicated the same periods of financial coverage for
a natural disaster as they had for job loss. Generally male respondents also indicated the similar, though
slightly shorter periods of financial coverage. In the event of a natural disaster, seven male respondents
indicated they had financial resources for 1-3 months and seven responded that they had resources for 4-6
months. It is possible that male respondents have a more thorough understanding of the impacts of natural
hazards and can therefore, more appropriately, appreciate the financial implications. This is an area that
needs further research to determine the extent to which awareness and knowledge of natural hazards
impacts financial planning and awareness.
The perception of ability to support the household is a particularly useful indicator of resilience and would
be important in determining the ways in which households adapt in the face of a natural / climate related
event.
0.0%
5.0%
10.0%
15.0%
20.0%
25.0%
30.0%
35.0%
40.0%
45.0%
Less than 1 month
1 - 3 months
4 - 6 months
7-9 months 10-12 months
More than 1 year
Natural Disaster Job Loss
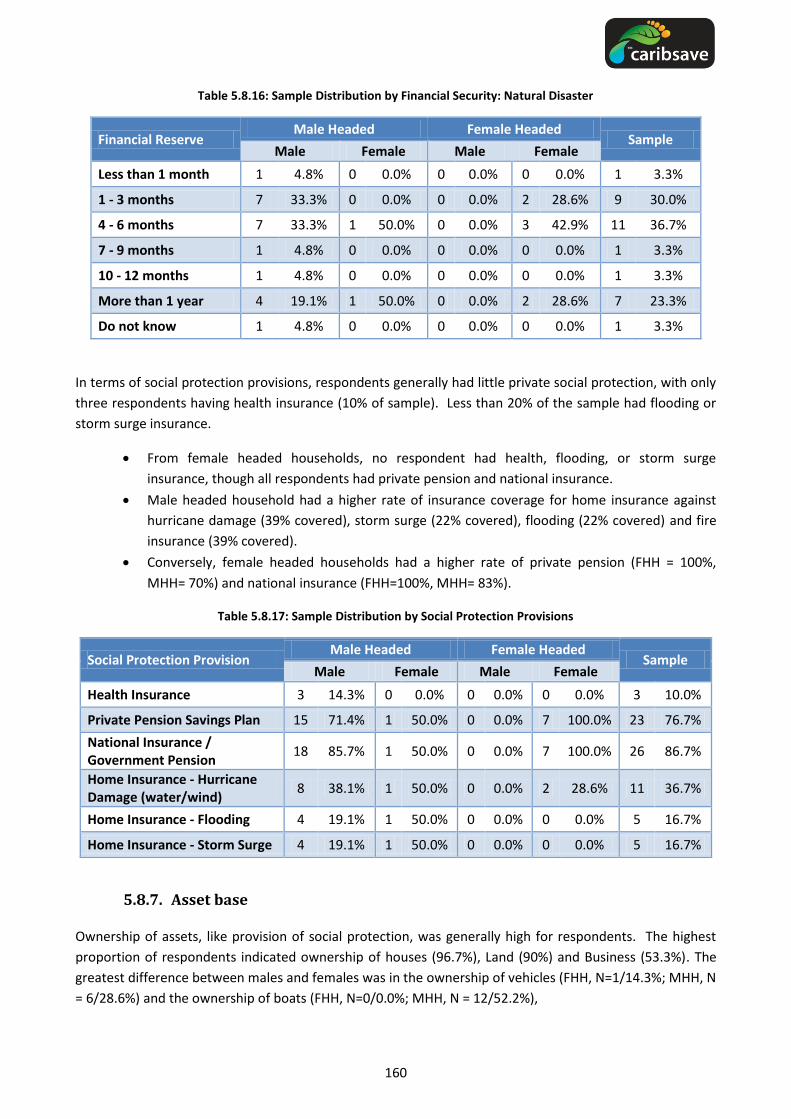
160
Table 5.8.16: Sample Distribution by Financial Security: Natural Disaster
Financial Reserve Male Headed Female Headed
Sample Male Female Male Female
Less than 1 month 1 4.8% 0 0.0% 0 0.0% 0 0.0% 1 3.3%
1 - 3 months 7 33.3% 0 0.0% 0 0.0% 2 28.6% 9 30.0%
4 - 6 months 7 33.3% 1 50.0% 0 0.0% 3 42.9% 11 36.7%
7 - 9 months 1 4.8% 0 0.0% 0 0.0% 0 0.0% 1 3.3%
10 - 12 months 1 4.8% 0 0.0% 0 0.0% 0 0.0% 1 3.3%
More than 1 year 4 19.1% 1 50.0% 0 0.0% 2 28.6% 7 23.3%
Do not know 1 4.8% 0 0.0% 0 0.0% 0 0.0% 1 3.3%
In terms of social protection provisions, respondents generally had little private social protection, with only
three respondents having health insurance (10% of sample). Less than 20% of the sample had flooding or
storm surge insurance.
From female headed households, no respondent had health, flooding, or storm surge
insurance, though all respondents had private pension and national insurance.
Male headed household had a higher rate of insurance coverage for home insurance against
hurricane damage (39% covered), storm surge (22% covered), flooding (22% covered) and fire
insurance (39% covered).
Conversely, female headed households had a higher rate of private pension (FHH = 100%,
MHH= 70%) and national insurance (FHH=100%, MHH= 83%).
Table 5.8.17: Sample Distribution by Social Protection Provisions
Social Protection Provision Male Headed Female Headed
Sample Male Female Male Female
Health Insurance 3 14.3% 0 0.0% 0 0.0% 0 0.0% 3 10.0%
Private Pension Savings Plan 15 71.4% 1 50.0% 0 0.0% 7 100.0% 23 76.7%
National Insurance / Government Pension
18 85.7% 1 50.0% 0 0.0% 7 100.0% 26 86.7%
Home Insurance - Hurricane Damage (water/wind)
8 38.1% 1 50.0% 0 0.0% 2 28.6% 11 36.7%
Home Insurance - Flooding 4 19.1% 1 50.0% 0 0.0% 0 0.0% 5 16.7%
Home Insurance - Storm Surge 4 19.1% 1 50.0% 0 0.0% 0 0.0% 5 16.7%
5.8.7. Asset base
Ownership of assets, like provision of social protection, was generally high for respondents. The highest
proportion of respondents indicated ownership of houses (96.7%), Land (90%) and Business (53.3%). The
greatest difference between males and females was in the ownership of vehicles (FHH, N=1/14.3%; MHH, N
= 6/28.6%) and the ownership of boats (FHH, N=0/0.0%; MHH, N = 12/52.2%),
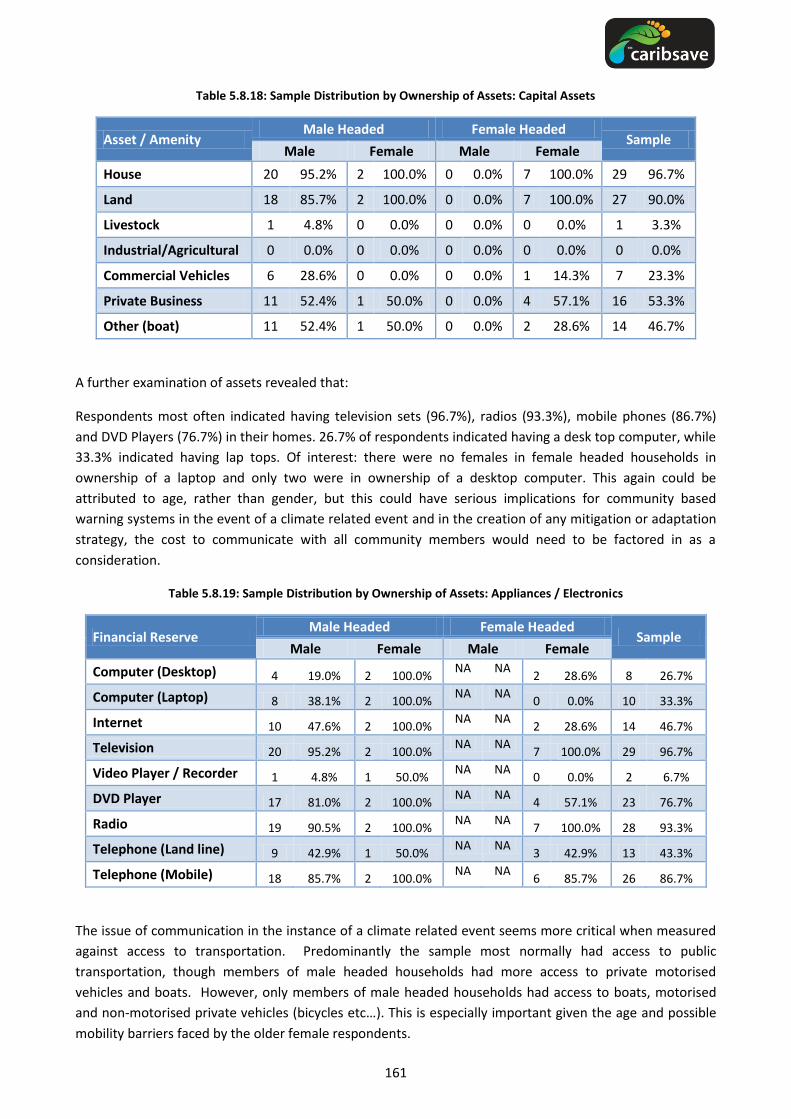
161
Table 5.8.18: Sample Distribution by Ownership of Assets: Capital Assets
Asset / Amenity Male Headed Female Headed
Sample Male Female Male Female
House 20 95.2% 2 100.0% 0 0.0% 7 100.0% 29 96.7%
Land 18 85.7% 2 100.0% 0 0.0% 7 100.0% 27 90.0%
Livestock 1 4.8% 0 0.0% 0 0.0% 0 0.0% 1 3.3%
Industrial/Agricultural 0 0.0% 0 0.0% 0 0.0% 0 0.0% 0 0.0%
Commercial Vehicles 6 28.6% 0 0.0% 0 0.0% 1 14.3% 7 23.3%
Private Business 11 52.4% 1 50.0% 0 0.0% 4 57.1% 16 53.3%
Other (boat) 11 52.4% 1 50.0% 0 0.0% 2 28.6% 14 46.7%
A further examination of assets revealed that:
Respondents most often indicated having television sets (96.7%), radios (93.3%), mobile phones (86.7%)
and DVD Players (76.7%) in their homes. 26.7% of respondents indicated having a desk top computer, while
33.3% indicated having lap tops. Of interest: there were no females in female headed households in
ownership of a laptop and only two were in ownership of a desktop computer. This again could be
attributed to age, rather than gender, but this could have serious implications for community based
warning systems in the event of a climate related event and in the creation of any mitigation or adaptation
strategy, the cost to communicate with all community members would need to be factored in as a
consideration.
Table 5.8.19: Sample Distribution by Ownership of Assets: Appliances / Electronics
Financial Reserve Male Headed Female Headed
Sample Male Female Male Female
Computer (Desktop) 4 19.0% 2 100.0% NA NA
2 28.6% 8 26.7%
Computer (Laptop) 8 38.1% 2 100.0% NA NA
0 0.0% 10 33.3%
Internet 10 47.6% 2 100.0% NA NA
2 28.6% 14 46.7%
Television 20 95.2% 2 100.0% NA NA
7 100.0% 29 96.7%
Video Player / Recorder 1 4.8% 1 50.0% NA NA
0 0.0% 2 6.7%
DVD Player 17 81.0% 2 100.0% NA NA
4 57.1% 23 76.7%
Radio 19 90.5% 2 100.0% NA NA
7 100.0% 28 93.3%
Telephone (Land line) 9 42.9% 1 50.0% NA NA
3 42.9% 13 43.3%
Telephone (Mobile) 18 85.7% 2 100.0% NA NA
6 85.7% 26 86.7%
The issue of communication in the instance of a climate related event seems more critical when measured
against access to transportation. Predominantly the sample most normally had access to public
transportation, though members of male headed households had more access to private motorised
vehicles and boats. However, only members of male headed households had access to boats, motorised
and non-motorised private vehicles (bicycles etc…). This is especially important given the age and possible
mobility barriers faced by the older female respondents.
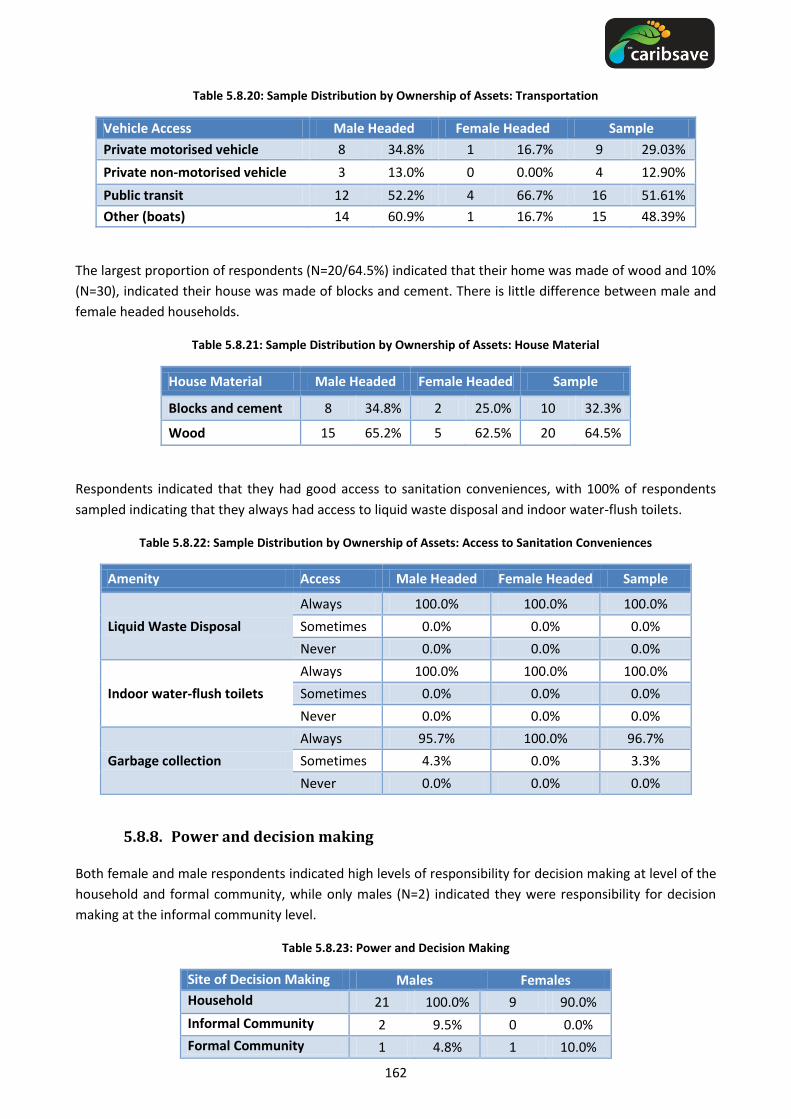
162
Table 5.8.20: Sample Distribution by Ownership of Assets: Transportation
Vehicle Access Male Headed Female Headed Sample
Private motorised vehicle 8 34.8% 1 16.7% 9 29.03%
Private non-motorised vehicle 3 13.0% 0 0.00% 4 12.90%
Public transit 12 52.2% 4 66.7% 16 51.61%
Other (boats) 14 60.9% 1 16.7% 15 48.39%
The largest proportion of respondents (N=20/64.5%) indicated that their home was made of wood and 10%
(N=30), indicated their house was made of blocks and cement. There is little difference between male and
female headed households.
Table 5.8.21: Sample Distribution by Ownership of Assets: House Material
House Material Male Headed Female Headed Sample
Blocks and cement 8 34.8% 2 25.0% 10 32.3%
Wood 15 65.2% 5 62.5% 20 64.5%
Respondents indicated that they had good access to sanitation conveniences, with 100% of respondents
sampled indicating that they always had access to liquid waste disposal and indoor water-flush toilets.
Table 5.8.22: Sample Distribution by Ownership of Assets: Access to Sanitation Conveniences
Amenity Access Male Headed Female Headed Sample
Liquid Waste Disposal
Always 100.0% 100.0% 100.0%
Sometimes 0.0% 0.0% 0.0%
Never 0.0% 0.0% 0.0%
Indoor water-flush toilets
Always 100.0% 100.0% 100.0%
Sometimes 0.0% 0.0% 0.0%
Never 0.0% 0.0% 0.0%
Garbage collection
Always 95.7% 100.0% 96.7%
Sometimes 4.3% 0.0% 3.3%
Never 0.0% 0.0% 0.0%
5.8.8. Power and decision making
Both female and male respondents indicated high levels of responsibility for decision making at level of the
household and formal community, while only males (N=2) indicated they were responsibility for decision
making at the informal community level.
Table 5.8.23: Power and Decision Making
Site of Decision Making Males Females
Household 21 100.0% 9 90.0%
Informal Community 2 9.5% 0 0.0%
Formal Community 1 4.8% 1 10.0%

163
Table 5.8.24: Power and Decision Making: Intra Household
Site of Decision Making
Male Headed Female Headed
Male Female Total Male Female Total
Household 21 100.0% 1 50.0% 22 95.7% 0 0.0% 7 100.0% 7 100.0%
Informal Community 2 9.5% 0 0.0% 2 8.7% 0 0.0% 0 0.0% 0 0.0%
Formal Community 1 4.8% 0 0.0% 1 4.3% 0 0.0% 0 0.0% 0 0.0%
5.8.9. Social networks and social capital
Both male and female respondents were moderately active in their community. 30% of females and 28.6%
of male respondents reported belonging to a social group within the community.
Table 5.8.25: Social Networks: Community Involvement
Membership Male Female
Yes 6 28.6% 3 30.0%
No 14 66.7% 7 70.0%
With regards to support systems:
Male respondents tended to rely on relatives outside their households for physical help, personal advice
and financial assistance. Female respondents relied more heavily on religious organisation for personal
advice, but also relied on friends and family for physical, personal and financial help. Of note, other than
for financial assistance, Government Agencies were not indicated as being utilised for physical help or
personal advice.
Table 5.8.26: Social Networks: Support Systems
Support System Physical Help Personal Advice Financial Assistance
Male Female Male Female Male Female
Relative (within the household) 19.0% 30.0% 4.8% 0.0% 4.8% 0.0%
Relative (outside the household) 61.9% 80.0% 42.9% 30.0% 61.9% 40.0%
Family friend 23.8% 10.0% 33.3% 30.0% 23.8% 50.0%
Religious Organisation 4.8% 0.0% 14.3% 40.0% 0.0% 20.0%
Non-religious Charity 0.0% 0.0% 0.0% 0.0% 0.0% 0.0%
Government Agency 0.0% 0.0% 0.0% 0.0% 9.5% 10.0%
5.8.10. Use of natural resources
Other than in the instance of the sea, coral reefs and mangroves, respondents generally indicated a low
level of use for natural resources, with more than 55% of respondents indicating that other resources were
of not of particular importance to them for either their subsistence or livelihoods. Generally coastal
resources are important for livelihoods.

164
When further disaggregated on the basis of sex, there was little disparity in the use of natural assets, where
a slightly larger proportion of male respondents were dependent on coastal natural resources for livelihood
and subsistence. Females were slightly more dependent on agricultural lands than male respondents.
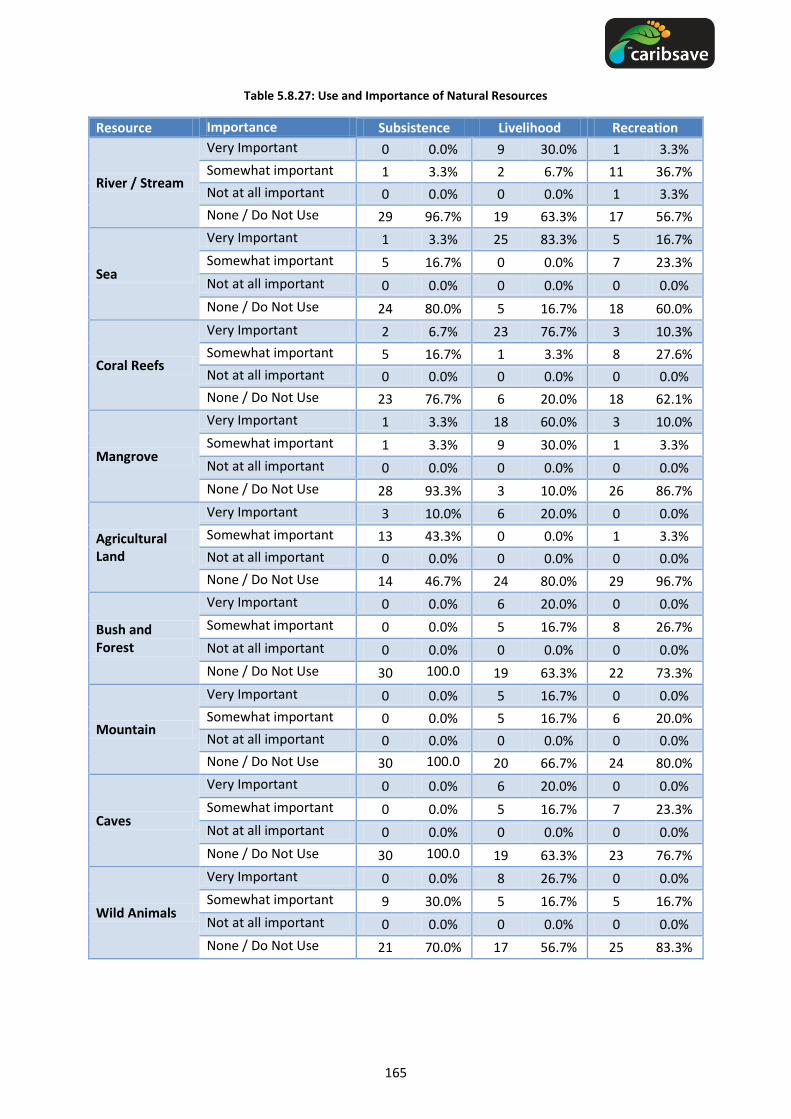
165
Table 5.8.27: Use and Importance of Natural Resources
Resource Importance Subsistence Livelihood Recreation
River / Stream
Very Important 0 0.0% 9 30.0% 1 3.3%
Somewhat important 1 3.3% 2 6.7% 11 36.7%
Not at all important 0 0.0% 0 0.0% 1 3.3%
None / Do Not Use 29 96.7% 19 63.3% 17 56.7%
Sea
Very Important 1 3.3% 25 83.3% 5 16.7%
Somewhat important 5 16.7% 0 0.0% 7 23.3%
Not at all important 0 0.0% 0 0.0% 0 0.0%
None / Do Not Use 24 80.0% 5 16.7% 18 60.0%
Coral Reefs
Very Important 2 6.7% 23 76.7% 3 10.3%
Somewhat important 5 16.7% 1 3.3% 8 27.6%
Not at all important 0 0.0% 0 0.0% 0 0.0%
None / Do Not Use 23 76.7% 6 20.0% 18 62.1%
Mangrove
Very Important 1 3.3% 18 60.0% 3 10.0%
Somewhat important 1 3.3% 9 30.0% 1 3.3%
Not at all important 0 0.0% 0 0.0% 0 0.0%
None / Do Not Use 28 93.3% 3 10.0% 26 86.7%
Agricultural Land
Very Important 3 10.0% 6 20.0% 0 0.0%
Somewhat important 13 43.3% 0 0.0% 1 3.3%
Not at all important 0 0.0% 0 0.0% 0 0.0%
None / Do Not Use 14 46.7% 24 80.0% 29 96.7%
Bush and Forest
Very Important 0 0.0% 6 20.0% 0 0.0%
Somewhat important 0 0.0% 5 16.7% 8 26.7%
Not at all important 0 0.0% 0 0.0% 0 0.0%
None / Do Not Use 30 100.0%
19 63.3% 22 73.3%
Mountain
Very Important 0 0.0% 5 16.7% 0 0.0%
Somewhat important 0 0.0% 5 16.7% 6 20.0%
Not at all important 0 0.0% 0 0.0% 0 0.0%
None / Do Not Use 30 100.0%
20 66.7% 24 80.0%
Caves
Very Important 0 0.0% 6 20.0% 0 0.0%
Somewhat important 0 0.0% 5 16.7% 7 23.3%
Not at all important 0 0.0% 0 0.0% 0 0.0%
None / Do Not Use 30 100.0%
19 63.3% 23 76.7%
Wild Animals
Very Important 0 0.0% 8 26.7% 0 0.0%
Somewhat important 9 30.0% 5 16.7% 5 16.7%
Not at all important 0 0.0% 0 0.0% 0 0.0%
None / Do Not Use 21 70.0% 17 56.7% 25 83.3%

166
Table 5.8.28: Use and Importance of Natural Resources, by Sex of Respondent
Resource Importance Subsistence Livelihood Recreation
Male Female Male Female Male Female
River / Stream
Very Important 0.0% 0.0% 33.3%%
22.2% 4.8% 0.0%
Somewhat important 4.8% 0.0% 9.5% 0.0% 33.3%%
44.4%
Not at all important 0.0% 0.0% 0.0% 0.0% 4.8% 0.0%
None / Do Not Use 95.24%
100% 57.1% 77.8% 57.1% 55.6%
Sea
Very Important 4.8% 0.0% 85.7% 77.8% 23.8% 0.0%
Somewhat important 23.8% 0.0% 0.0% 0.0% 28.6% 11.1%
Not at all important 0.0% 0.0% 0.0% 0.0% 0.0% 0.0%
None / Do Not Use 71.43%
100% 14.3% 22.2% 47.6% 88.9%
Coral Reefs
Very Important 9.5% 0.0% 81.0% 66.7% 15.00%
0.0%
Somewhat important 23.8% 0.0% 0.0% 11.1% 35.00%
11.1%
Not at all important 0.0% 0.0% 0.0% 0.0% 0.0% 0.0%
None / Do Not Use 66.7% 100% 19.1% 22.2% 50.0% 88.9%
Mangrove
Very Important 4.8% 0.0% 62.0% 55.6% 14.3% 0.0%
Somewhat important 4.8% 0.0% 33.3%%
22.2% 0.0% 11.1%
Not at all important 0.0% 0.0% 0.0% 0.0% 0.0% 0.0%
None / Do Not Use 90.48%
100% 4.8% 22.2% 85.7% 88.9%
Agricultural Land
Very Important 9.5% 11.1% 14.3% 33.3%%
0.0% 0.0%
Somewhat important 47.6% 33.3%%
0.0% 0.0% 0.0% 11.1%
Not at all important 0.0% 0.0% 0.0% 0.0% 0.0% 0.0%
None / Do Not Use 42.86%
55.6% 85.7% 66.7% 100% 88.9%
Bush and Forest
Very Important 0.0% 0.0% 19.1% 22.2% 0.0% 0.0%
Somewhat important 0.0% 0.0% 23.8% 0.0% 23.8% 33.3%% Not at all important 0.0% 0.0% 0.0% 0.0% 0.0% 0.0%
None / Do Not Use 100% 100% 57.1% 77.8% 76.19%
66.7%
Mountain
Very Important 0.0% 0.0% 14.3% 22.2% 0.0% 0.0%
Somewhat important 0.0% 0.0% 19.1% 11.1% 19.1% 22.2%
Not at all important 0.0% 0.0% 0.0% 0.0% 0.0% 0.0%
None / Do Not Use 100% 100% 66.7% 66.7% 81.0% 77.8%
Caves
Very Important 0.0% 0.0% 19.1% 22.2% 0.0% 0.0%
Somewhat important 0.0% 0.0% 19.1% 11.1% 23.8% 22.2%
Not at all important 0.0% 0.0% 0.0% 0.0% 0.0% 0.0%
None / Do Not Use 100% 100% 62.0% 66.7% 76.2% 77.8%
Wild Animals
Very Important 0.0% 0.0% 28.6% 22.2% 0.0% 0.0%
Somewhat important 33.3%%
22.2% 19.1% 11.1% 14.3% 22.2%
Not at all important 0.0% 0.0% 0.0% 0.0% 0.0% 0.0%
None / Do Not Use 66.7% 77.8% 53.4% 66.7% 85.7% 77.8%

167
Agriculture
Only three respondents indicated they were involved in the agriculture sectors and all indicated they
always had access to reliable water.
Table 5.8.29: Involvement in Agriculture: Access to Water
Reliability of Water
Male Headed Female Headed Sample
Always 2 100.00%
1 100.00%
3 100.00% Sometimes 0 0.00% 0 0.00% 0 0.00%
Never 0 0.00% 0 0.00% 0 0.00%
5.8.11. Knowledge, exposure and experience of climate related events
Respondents indicated very good levels of knowledge in relation to hurricanes (96.7%) and average or very
good knowledge of flooding (average = 56.7% and very good = 43.3%) and storm surge (average = 36.7%
and very good = 60.0%) However, knowledge was not quite as comprehensive in relation to landslides or
drought.
When examined on the basis of household structure and headship:
- In the instance of flooding, 56.5% of respondents from male headed households indicated that their
knowledge was very good, compared to 0% from female headed households. Similar results are seen in
terms of storm surges, 78.3% of respondents from male headed households indicated that their knowledge
was very good, compared to 0% from female headed households.
Table 5.8.30: Knowledge of Climate Related Events
Event Knowledge SAMPLE1 MALE HEADED FEMALE HEADED
Male Female Total Male Female Total
Hurricane
Poor 0.0% 0.0% 0.0% 0.0% 0.0% 0.0% 0.0%
Average 3.3% 0.0% 50.0% 4.3% 0.0% 0.0% 0.0%
Very Good 96.7% 100.0% 50.0% 95.7% 0.0% 100.0% 100.0%
Flooding
Poor 0.0% 0.0% 0.0% 0.0% 0.0% 0.0% 0.0%
Average 56.7% 38.1% 100.0% 43.5% 0.0% 100.0% 100.0%
Very Good 43.3% 61.9% 0.0% 56.5% 0.0% 0.0% 0.0%
Storm Surge
Poor 3.3% 0.0% 50.0% 4.3% 0.0% 0.0% 0.0%
Average 36.7% 14.3% 50.0% 17.4% 0.0% 100.0% 100.0%
Very Good 60.0% 85.7% 0.0% 78.3% 0.0% 0.0% 0.0%
Drought
Poor 43.3% 38.1% 50.0% 39.1% 0.0% 57.1% 57.1%
Average 50.0% 52.4% 50.0% 52.2% 0.0% 42.9% 42.9%
Very Good 6.7% 9.5% 0.0% 8.7% 0.0% 0.0% 0.0%
Landslides
Poor 46.7% 42.9% 50.0% 43.5% 0.0% 57.1% 57.1%
Average 46.7% 47.6% 50.0% 47.8% 0.0% 42.9% 42.9%
Very Good 6.7% 9.5% 0.0% 8.7% 0.0% 0.0% 0.0%
1: Where respondents did not indicate an option, the total percentage of respondents sum up to less than 100%

168
Despite knowledge gaps with regards to the technical aspects of the various climate related events,
respondents showed various levels of awareness of the appropriate course of action to be taken in the
instance such an event occurred:
In the event of a Hurricane, all but one respondent was aware of what to do, without having to ask
for assistance.
In the instance of Flooding, a slightly less proportion of respondents sampled (73.3%) were aware
of appropriate action to take, without asking for assistance.
In the event of a Landslide, only one respondent was aware of what should be done.
Of note, respondents from male headed households consistently were more aware of the appropriate
response to climate related events, than respondents from female headed households. This could have
serious implications for the development of adaptation and mitigation strategies for members of these
households.
Table 5.8.31: Knowledge of Appropriate Response to Climate Related Events
Event Knowledge SAMPLE1 MALE HEADED FEMALE HEADED
Male Female Total Male Female Total
Hurricane
Yes 96.7% 95.2% 100.0% 95.7% 0.0% 100.0% 100.0%
No 0.0% 0.0% 0.0% 0.0% 0.0% 0.0% 0.0%
Don't Know 3.3% 4.8% 0.0% 4.3% 0.0% 0.0% 0.0%
Flooding
Yes 73.3% 85.7% 100.0% 87.0% 0.0% 28.6% 28.6%
No 16.7% 4.8% 0.0% 4.3% 0.0% 57.1% 57.1%
Don't Know 10.0% 9.5% 0.0% 8.7% 0.0% 14.3% 14.3%
Storm Surge
Yes 73.3% 85.7% 100.0% 87.0% 0.0% 28.6% 28.6%
No 20.0% 9.5% 0.0% 8.7% 0.0% 57.1% 57.1%
Don't Know 6.7% 4.8% 0.0% 4.3% 0.0% 14.3% 14.3%
Drought
Yes 10.0% 14.3% 0.0% 13.0% 0.0% 0.0% 0.0%
No 66.7% 57.1% 50.0% 56.5% 0.0% 100.0% 100.0%
Don't Know 23.3% 28.6% 50.0% 30.4% 0.0% 0.0% 0.0%
Landslides
Yes 3.3% 4.8% 0.0% 4.3% 0.0% 0.0% 0.0%
No 80.0% 71.4% 100.0% 73.9% 0.0% 100.0% 100.0%
Don't Know 6.7% 9.5% 0.0% 8.7% 0.0% 0.0% 0.0% 1: Where respondents did not indicate an option, the total percentage of respondents sum up to less than 100%
When questioned around the perceived risk of climate related events to their households, respondents
most often indicated a High Risk of Storm Surge (63.3%) and Hurricanes (57.7%), though this was slightly
more so in the case of respondents from female headed households (storm surge = 71.4%, hurricane =
85.7%) than those from male headed households (storm surge = 60.9%, hurricane = 47.8%). Similarly,
respondents from female headed households reported higher levels of risk for Flooding (42.9%) than
respondents from male headed households, where 17.4% reported high levels of risk of flooding. There was
no risk of drought reported by survey respondents and only one respondent indicated there was a risk of
landslides.

169
Table 5.8.32: Perceived Level of Risk of Climate Related Events: Household
Event Perception of Risk Level
SAMPLE1 MALE HEADED FEMALE HEADED
Male Female Total Male Female Total
Hurricane
No Risk 0.0% 0.0% 0.0% 0.0% 0.0% 0.0% 0.0%
Low Risk 43.3% 52.4% 50.0% 52.2% 0.0% 14.3% 14.3%
High Risk 56.7% 47.6% 50.0% 47.8% 0.0% 85.7% 85.7%
Flooding
No Risk 23.3% 28.6% 50.0% 30.4% 0.0% 0.0% 0.0%
Low Risk 53.3% 57.1% 0.0% 52.2% 0.0% 57.1% 57.1%
High Risk 23.3% 14.3% 50.0% 17.4% 0.0% 42.9% 42.9%
Storm Surge
No Risk 0.0% 0.0% 0.0% 0.0% 0.0% 0.0% 0.0%
Low Risk 36.7% 38.1% 50.0% 39.1% 0.0% 28.6% 28.6%
High Risk 63.3% 61.9% 50.0% 60.9% 0.0% 71.4% 71.4%
Drought
No Risk 63.3% 71.4% 50.0% 69.6% 0.0% 42.9% 42.9%
Low Risk 33.3% 23.8% 50.0% 26.1% 0.0% 57.1% 57.1%
High Risk 0.0% 0.0% 0.0% 0.0% 0.0% 0.0% 0.0%
Landslides
No Risk 73.3% 90.5% 50.0% 87.0% 0.0% 28.6% 28.6%
Low Risk 20.0% 4.8% 0.0% 4.3% 0.0% 71.4% 71.4%
High Risk 3.3% 0.0% 50.0% 4.3% 0.0% 0.0% 0.0%
1: Where respondents did not indicate an option, the total percentage of respondents sum up to less than 100%
Of interest respondents reported higher levels of risk to climate related event for the community than they
did for their own households with regards to hurricanes and drought. For all other risks, respondents
reported lower levels of risk to climate related event for the community than they did for their own
households.
Similar to patterns observed in relation to perceived risk to respondents’ households, respondents from
female headed households indicated higher levels of risk to their community in the instance of hurricane,
flooding and storm surge than respondents from male headed households.

170
Table 5.8.33: Perceived Level of Risk of Climate Related Events: Community
Event Perception of Risk Level
SAMPLE1 MALE HEADED FEMALE HEADED
Male Female Total Male Female Total
Hurricane
No Risk 0.0% 0.0% 0.0% 0.0% 0.0% 0.0% 0.0%
Low Risk 3.3% 4.8% 0.0% 4.3% 0.0% 0.0% 0.0%
High Risk 96.7% 95.2% 100.0% 95.7% 0.0% 100.0% 100.0%
Flooding
No Risk 16.7% 19.0% 50.0% 21.7% 0.0% 0.0% 0.0%
Low Risk 60.0% 66.7% 50.0% 65.2% 0.0% 42.9% 42.9%
High Risk 23.3% 14.3% 0.0% 13.0% 0.0% 57.1% 57.1%
Storm Surge
No Risk 0.0% 0.0% 0.0% 0.0% 0.0% 0.0% 0.0%
Low Risk 13.3% 9.5% 0.0% 8.7% 0.0% 28.6% 28.6%
High Risk 26.7% 4.8% 100.0% 13.0% 0.0% 71.4% 71.4%
Drought
No Risk 36.7% 42.9% 50.0% 43.5% 0.0% 14.3% 14.3%
Low Risk 56.7% 52.4% 0.0% 47.8% 0.0% 85.7% 85.7%
High Risk 6.7% 4.8% 50.0% 8.7% 0.0% 0.0% 0.0%
Landslides
No Risk 60.0% 71.4% 50.0% 69.6% 0.0% 28.6% 28.6%
Low Risk 26.7% 14.3% 0.0% 13.0% 0.0% 71.4% 71.4%
High Risk 3.3% 0.0% 50.0% 4.3% 0.0% 0.0% 0.0%
1: Where respondents did not indicate an option, the total percentage of respondents sum up to less than 100%
The disparity (between perceived risk at the household and community level) was greatest in the instance
of hurricanes: for which 56.7% of respondents indicated a High Risk for their households, compared to
96.7% of whom indicated a high risk for their respective community.
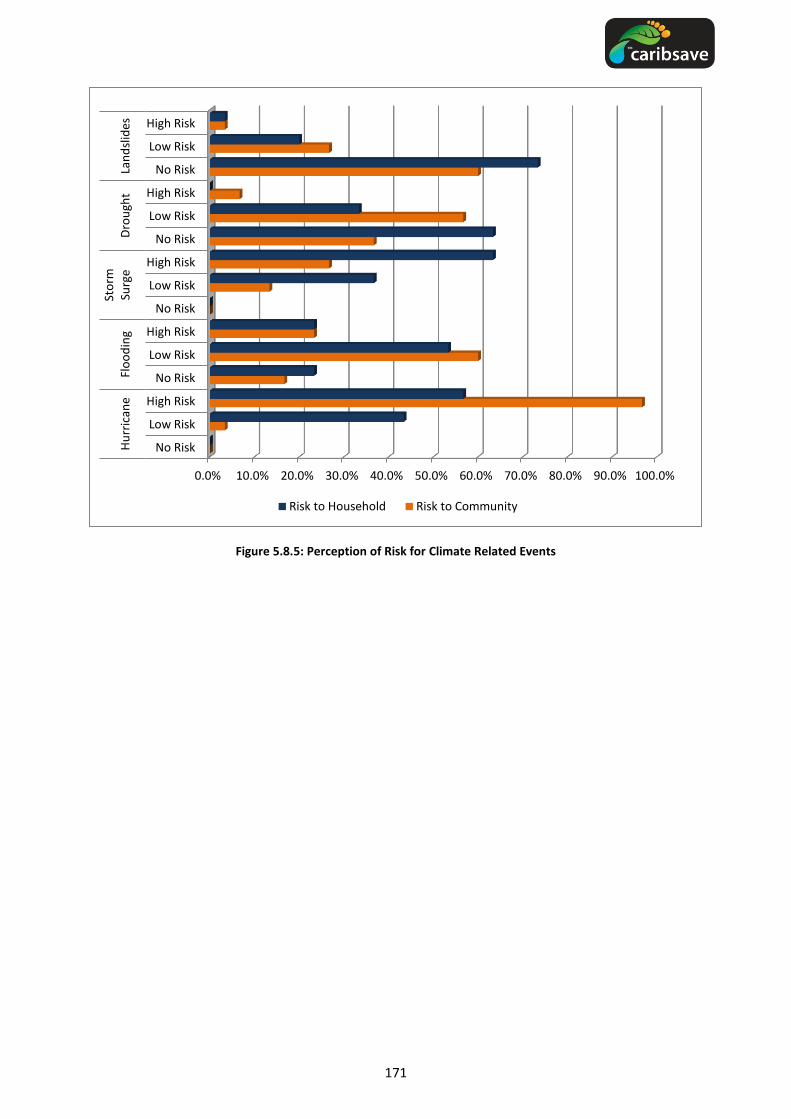
171
Figure 5.8.5: Perception of Risk for Climate Related Events
0.0% 10.0% 20.0% 30.0% 40.0% 50.0% 60.0% 70.0% 80.0% 90.0% 100.0%
No Risk
Low Risk
High Risk
No Risk
Low Risk
High Risk
No Risk
Low Risk
High Risk
No Risk
Low Risk
High Risk
No Risk
Low Risk
High Risk H
urr
ican
e Fl
oo
din
g St
orm
Su
rge
Dro
ugh
t La
nd
slid
es
Risk to Household Risk to Community
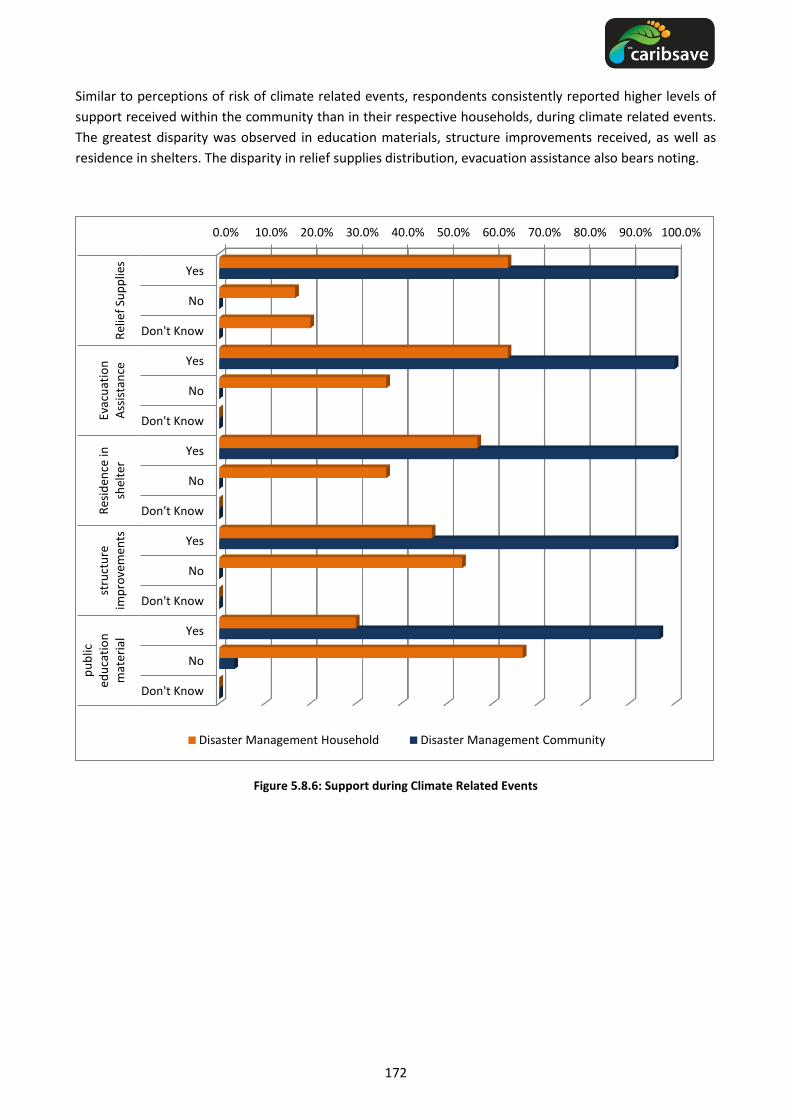
172
Similar to perceptions of risk of climate related events, respondents consistently reported higher levels of
support received within the community than in their respective households, during climate related events.
The greatest disparity was observed in education materials, structure improvements received, as well as
residence in shelters. The disparity in relief supplies distribution, evacuation assistance also bears noting.
Figure 5.8.6: Support during Climate Related Events
0.0% 10.0% 20.0% 30.0% 40.0% 50.0% 60.0% 70.0% 80.0% 90.0% 100.0%
Yes
No
Don't Know
Yes
No
Don't Know
Yes
No
Don't Know
Yes
No
Don't Know
Yes
No
Don't Know
Rel
ief
Sup
plie
s Ev
acu
atio
n
Ass
ista
nce
R
esid
ence
in
shel
ter
stru
ctu
re
imp
rove
men
ts
pu
blic
ed
uca
tio
n
mat
eria
l
Disaster Management Household Disaster Management Community
173
6. RECOMMENDED STRATEGIES AND INITIAL ACTION PLAN
The following recommendations have been developed in consultation with national and community
stakeholders through the use of various participatory tools. They support the main objective of the CCCRA
which is to provide a scientific (physical and social) basis to support decision making, policy and planning by
governments, communities and the private sector that increase resilience of economies and livelihoods to
climate change. The recommendations are also consistent with the strategies and programmes identified in
the Climate Change and the Caribbean: A Regional Framework for Achieving Development Resilient to
Climate Change endorsed by the CARICOM Heads of State.
Recommendations are presented as an initial plan of action with a brief description of the intervention, the
national and/or local stakeholders involved and the expected benefits, and are categorised according to
short-, medium- and long-term interventions. All recommendations are considered ‘No-regret’ or ‘Low-
regret’ strategies. 'No-regret' strategies seek to maximise positive and minimise negative outcomes for
communities and societies in climate-sensitive areas such as agriculture, food security, water resources and
health. This means taking climate-related decisions or actions that make sense in development terms,
whether or not a specific climate threat actually materialises in the future. ‘Low-regret’ adaptation options
are those where moderate levels of investment increase the capacity to cope with future climate risks.
Typically, these involve over-specifying components, for example installing larger diameter drains or
hurricane shutters at the time of initial construction or refurbishment (World Bank, 2012).
Each one or a group of recommendations can be further developed into a concept note or project proposal
with a full action plan, with much of the supporting information found in this document. Earlier sections of
this report have provided the rationale for recommended interventions based on the vulnerabilities and
adaptive capacity identified for key sectors.
6.1. Cross-Cutting Actions
The following activities must be undertaken in the short-term, across a number of sectors, to ensure the
success of the more specific and practical recommendations presented in later sections. These cross-cutting
actions provide the necessary foundation, in terms of information and data, development policy,
awareness raising and cross-sectoral linkages from which wider actions to combat the threat of climate
change on future development can be legitimized. With this foundation, future actions and the allocation
of resources to adaptation and mitigation activities are more easily justified because decisions can be based
on current information, as well as common goals and a widespread understanding of the severity of the
threat.
6.1.1. Implementing and Strengthening Data Collection, Monitoring and
Evaluation Activities
It is evident in a number of sectors that the lack of data and inadequate monitoring and evaluation
procedures inhibit the ability of the relevant agencies to plan and manage a number of resources.
Monitoring and evaluation is essential if progress is to be demonstrated. By collecting and sharing the
information gathered, Section 6.1.3, it is possible to gain even greater support amongst stakeholders.
Specific areas and suggestions for data collection, monitoring and evaluation include:

174
Detailed surveying of groundwater resources and well infrastructure: Groundwater is highly significant in
Belize with 95% of rural communities dependent on it as their primary source of freshwater. The lack of
information regarding groundwater leads to a difficulty in the management of future water resources
under climate change and increases the vulnerability of communities. The BWS in coordination with
academia and local village water boards should seek to conduct a detail survey of groundwater resources
and well infrastructure to facilitate better planning and management.
Energy audits: Only few countries and businesses assess and monitor their tourism-related energy use and
emissions. National- as well as company-specific inventories to assess energy use and related emissions are
a precondition for any work to reduce energy use. It is therefore recommended that capacity assessments
be undertaken and the necessary training provided to ensure that Belize has the personnel capable of
undertaking energy and carbon audits. Companies should then engage these services to carry out the
audits. Energy- and carbon labelling of a wide range of products and services should also be policy goals. As
for instance Meade and Pringle (2001) have shown, engaging in environmental management systems can
have a significant cost-saving impact and be an avenue to engage stakeholders. Notably, the economically
important tourism system in Belize may be far more energy-dependent than currently anticipated. This
should also be investigated on a more detailed basis through a national energy audit.
Assessments focusing on the links between health, tourism and climate change: Literature on tourism and
climate change is growing as the economic importance of the latter on the former is more and more being
realised and emphasized (Hamilton and Tol, 2004). So too are the parallels between tourism and climate
change with health. There is a need for assessments to better understand the links between the
epidemiology of diseases in Belize with climate change using local climate data. The consequences of air
travel and the cost of health incurred to tourists could also be assessed. Exit Surveys can be conducted to
investigate potential health concerns, and to determine the perception of tourists on the relationships
between travel, health and climate change in Belize. Input would be required from the Ministry of Health
and departments within (such as the Department of Public Health, medical laboratories), the Ministry of
Natural Resources and the Environment, and the Belize National Meteorological Service. These
assessments can lead to a better understanding of the implications for tourists entering the region
contracting diseases, particularly communicable diseases; and the likelihood of destination substitution.
Monitoring, evaluation and research publishing in the Health sector: In order to address the problem of
the ‘grey’ literature used in this review it is recommended that a greater effort be made by the
Government of Belize to have data better analysed, peer reviewed and published in general, but especially
within the Health sector. If more research of climate related disease can be conducted this will provide the
evidence that epidemics and climatic variables are related. This effort requires collaboration between the
Health Departments, the National Meteorology Service and the academic community. It would further
develop a “culture” for systematic review and the conversion of knowledge into policy and planning.
Management, monitoring and regulation compliance in coastal development and resource use activities:
The Government has taken an important first step by reinstating the Coastal Zone Management Authority
and Institute (CZMAI). Now, it needs to invest in CZMAI and other science-based efforts to expand
monitoring activities and assess the state and use of coastal resources. Additional resources for tightening
and enforcing fishing regulations are also badly needed.
Inventory of existing coastal protection defences, as well as their design range and maintenance status:
The analysis of the vulnerability of tourism infrastructure was hindered by inadequate data on existing
coastal structures, their type, design specifications and expected lifetime. Future assessments of the costs

175
and benefits of coastal protection require this information to provide a more accurate estimate of the
resources required for SLR adaptation, and should be considered by CZMAI.
6.1.2. Mainstreaming Climate Change in Planning, Policy and Practice
Due to the time scales required for the removal of GHG from the atmosphere and the thermal inertia of the
oceans, the effects of prior emissions will ensure that climate change impacts will persist for more than a
millennium (Areces-Mallea, et al., 1999; ECCB, 2009). It is therefore vital to not only recognize the
vulnerabilities, but to anticipate and prepare for future implications. More than implementing a technology
or building a structure, mainstreaming climate change becomes a critical element of adaptation if it is to be
successful. It involves awareness raising, information sharing, planning and design, implementation, and
perhaps most importantly, evaluation (Linham & Nicholls, 2010). Noting gaps or room for improvement in
some areas, the following recommendations are outlined for consideration by the respective stakeholders
in addressing the issue of mainstreaming climate change:
Work with relevant tourism stakeholders to develop and implement the existing sustainable tourism
plans with attention paid to disaster risk reduction and climate change adaptation, and with a focus on
diversification of the tourism product toward the interior: Tourism infrastructure is currently
concentrated in the coastal zone where the risk of storm surge, tsunami and coastal erosion is greatest.
These hazards will degrade the tourism product (e.g. beach, coral reef) and also expose tourists to higher
risks than would occur if they were staying at a place of accommodation in the interior of the country.
Climate change threatens to degrade and possibly destroy the Caribbean tourism industry and impacts in
one country may be transferred to other countries, since tourists often view the region as one destination.
As such, Belize must work to continue building tourism infrastructure in the interior and there is potential
for marketing a more environmentally-friend tourism product. Furthermore, the integration of feasible and
flexible adaptive and risk reduction strategies is paramount to building the resilience of the large cross-
section of tourism players, and the tourism sector at large to the impacts of climate change. Input would
come from numerous sectors, but key stakeholders in this effort would include the Belize Tourism Board,
the Belize Hotel Association and NEMO.
Integrate SLR considerations in local land use and development planning, with special consideration for
vulnerable coastal areas and tourism hot-spots to reduce or avoid impacts: This will require national-level
consultation with land use management, coastal zone management and tourism stakeholders – in
particular, the Housing and Planning Department, the Ministry of Natural Resources and the Environment
(Department of Environment, CZMAI, Land and Surveys Department), the Belize Tourism Board and the
Ministry of Tourism – to utilise the broad scale results of this study and higher-resolution local scale studies
to guide reviews and updates of official land use and tourism master plans. Additionally, the Government of
Belize should:
Commence coastal adaptation planning early, by working with local stakeholders on the
development of coastal protection systems. The detailed local level planning for coastal protection
needs to begin within the next 15 years if the environmental assessments, financing, land
acquisition, and construction is to be completed by mid-Century, so that the economic benefits of
damage prevention are optimised.
Consider the development of official SLR risk maps to further guide future coastal development.
Assess all projects that involve building, maintaining, or modifying infrastructure in coastal areas at
risk from SLR and ensure that the new development plans take the most recent estimates of SLR

176
from the scientific community into account. The cost of reconstruction after flood damage is often
higher than modifying structures in the design phase.
Work with insurance companies to develop policies that take into account the unique risks faced by
coastal areas which will enable landowners to properly assess coastal protection and retreat
options.
Provide subsidies for appropriate and sustainable adaptation measures that will result in long term
economic benefits for both the tourism sector and the country as a whole.
Mainstream gender and poverty into climate change and related policies: Gender and poverty
considerations are not specifically recognised within the Government of Belize Policy on Adaptation to
Global Climate Change (Government of Belize, 2008). Challenges of poverty reduction and climate change
need to be addressed in a coherent and synergistic way. It needs to draw on the lessons and progress in
development policy and particularly the recognition of the importance of gender differences if policies are
to be sustainable, effective and benefit all sectors of the population. Higher poverty rates and lower labour
force participation and employment of women and poor women in particular; contribute to their overall
vulnerability(Buvinic, Vega, Bertrand, Urban, Grynspan, & Truitt, 1999).
Achieving sustainable and effective responses to climate change, therefore, requires attention to the
underlying power relations and gender equalities which create vulnerability both to poverty and climate
hazards and a more gender-sensitive approach which takes into account and evaluates the differing and
potentially inequitable access which men and women have to economic, ecological, social and human
resources, institutions, governance and infrastructure. Jointly supported initiatives (listed below) with
participation from entities such as the Women’s and Human Services Departments, NEMO and the National
Climate Change Committee can be implemented in support of gender mainstreaming:
Provide gender disaggregated data and evidence on the impacts of climate change to show how
men and women are being affected differently by climate related changes. This could be done for
direct impacts, such as extreme weather conditions or disasters, water shortages, food insecurity or
changes in land use. This could also be done for indirect secondary impacts, such as access to
energy, changes in employment opportunities, sectoral impacts (e.g. agriculture, tourism and
fisheries) and increased migration or conflict.
Conduct a gender analysis on the social impacts of current policies on adaptation and mitigation
and how they may benefit or adversely affect men and women in different ways. Even when
policies have clear gender-related statements or objectives, rarely do they have the mechanisms in
place to integrate gender at a programme level or to measure the impact of the policies from a
gendered perspective. Economic cost-benefit analyses often overlook the social implications and
there is a lack of methodology for measuring the gendered impacts of current policies.
Improve institutional capacity in key agencies to implement gender sensitive policy or gather
gendered data. This is needed due to the lack of gender experts involved in policy design and
implementation around climate change; the lack of awareness or gender training of key staff in
ministries and statistics offices responsible for climate change data and policies; and a general
disconnect between the reality of poor people’s (and particularly under-represented women’s)
lives and policy makers.
177
6.1.3. Building and Strengthening Information Sharing and Communication
Systems and Networks
It is essential that a tri-partite approach is taken when developing the full action plans for the
recommended strategies given. A number of relevant studies have been undertaken in Belize in the past,
but the recommendations are frequently not implemented for a number of reasons, lack of resources being
commonly cited. By establishing a framework by which government, private sector entities and civil society
can work more effectively together, the probability of implementation and widespread ‘buy-in’ to the
numerous initiatives increases. It is not possible for any one group to achieve the changes that are needed
alone and government must ensure that national policy goals and challenges faced are shared so that
solutions can be discussed and negotiated between groups. Gaining support for initiatives is also facilitated
through education and awareness, Section 6.1.4. For instance, government can:
Undertake broad consultation on the BEST (2009) recommendations for water resources:
Particular consideration should be given to: (a) water conservancy management systems and the
protection of watersheds; (b) the development of efficient irrigation practices in agriculture; (c) the
promotion of tourism inland as an alternative to coastal tourism; and (d) the incorporation of
climate change into tourism management plans.
The data and information produced through the various initiatives described in Section 6.1.1 must be
communicated and made available through networks in each sector and across sectors. This is especially
true for the idea of a green economy that will require the restructuring of economic systems towards
establishing a low-carbon society. It is thus important to document and communicate progress to create
positive opinion in large parts of society.
National level data should be made available to regional clearing houses where they exist and, where they
don’t exist, thought should be given to establishing them. Some areas for consideration include:
Epidemiology data with climate signals: Moreno (2006) has suggested the establishment of a
central clearing house containing information on diseases whose transmission are modified by
climate change as well relevant environmental data. Implementation of such a collective
information centre could be valuable in the exchanging of information in the Caribbean. The
Caribbean Epidemiology Centre (CAREC) is one regional institution that has summarised such
statistics, but it is noted that some statistics may be politically sensitive, resulting in some
resistance to this recommendation (Moreno, 2006). Other regional institutions that might be suited
to housing such a repository include CEHI, CCCCC and UWI.
Biodiversity data: The creation of a user-friendly online database, similar to BERDS, for the region’s
biological data will benefit not only environmental managers but all other economic sectors that
rely on natural resources (agriculture, fisheries, tourism). In order to address the limited human
resources that constrain data collection, Section 6.1.1, the e-repository will take the form of a wiki
allowing the database to be populated by researchers, students, eco-tourists and the general
population. The regional e-repository for biodiversity will:
o Integrate biodiversity research facilities in the region
o Facilitate the sharing of data
o Encourage public participation in data collection and monitoring
The Caribbean Marine Atlas is one example of a suitable online database that could be expanded
and further developed to include this type of information

178
6.1.4. Climate Change Education and Awareness
The previous section on communication and networking relates directly to the sharing of information to
assist decision making and planning. However, without education and awareness raising on climate change
and the likely impacts of climate change on specific sectors the information shared will be meaningless. The
research in a number of sectors highlighted specific areas that need additional efforts in education and
awareness:
Disaster risk reduction and emergency preparedness at the household level;
Water conservation, rain water harvesting and other collection techniques for households, as well
as water treatment;
The importance of energy and the role of emissions in climate change, specifically knowledge about
energy, its generation, and the economic and environmental importance of energy;
Climate-related diseases and health promotion, particularly malaria and diarrhoea and the
development of linkages with the agricultural sector to reduce malnutrition and improve food
security. Controlling malaria, dengue fever, gastroenteritis and other food and water borne
diseases can greatly reduce the financial burden to the health sector;
Impacts and costs of SLR to communities, but also to the public and private sectors, because of
these damages have implications for livelihoods and sustainable development.
Due to the interrelated nature of some environmental issues and natural processes collaboration between
different sectors can reinforce learning amongst the general public while also providing synergistic benefits
for resources The International Federation of the Red Cross has a strong history of effective work with
community capacity building and disaster risk reduction activities. NEMO, by working with the Red Cross,
can develop a culturally appropriate communication plan that will not only communicate the vital
information Belizean need to reduce their vulnerability, but be in a format that individuals will listen to and
take note of. Through the use of music or mobile phone technology, the communication strategy can reach
a wide range of persons, especially during emergency situations. Research at the community level revealed
that not all persons have cell phones, so this technique requires complementary messages to be
transmitted through more traditional mediums, radio and television. In addition, building awareness of the
issues mentioned above can be better embraced when the message is conveyed by a respected figure.
Children and youth have been found to be good transmitters of basic environmental information.
Education and awareness initiatives should not only be limited to locals but should include visitors to Belize
as well. Short videos encouraging visitors and residents to be more conscious of their impacts on the fragile
ecosystems can be shown during in-bound international flights and on local TV networks. The films will
focus on positive actions that individuals can take to minimize negative impacts on the environment by
decreasing energy and water consumption and wastage and by highlighting good environmental practices
and promoting awareness of national laws. Film production will engage as much local expertise as possible
as, including actors, cameramen, and technicians, amongst others.
6.2. Water Quality and Availability
Belize is a water-rich country yet issues exist in the distribution and management of resources. The priority
must be the development of mechanisms for integrated water resources management, which would then
facilitate the implementation of other recommended initiatives.

179
Short Term Actions
Consider the development of mechanisms to facilitate Integrated Water Resources Management (IWRM)
directives outlined in the National Integrated Water Resources Management Policy for Belize: The basis
of IWRM is that different users of water are interdependent: IWRM encourages a move away from a uni-
sectoral water management approach to one which allows participatory decision-making including
different user groups. Such an approach allows an equitable management of water resources, which will be
particularly important with declining water resources under climate change. The main components of
IWRM are: managing water resources at the lowest possible level (at the river basin or watershed scale);
optimising supply and managing demand; providing equitable access to water resources through
participatory and transparent governance and management; establishing improved and integrated policy,
regulatory and institutional frameworks; utilising an inter-sectoral approach to decision making; integrating
management means that multiple benefits are received from a single intervention. The National Integrated
Water Resources Management Policy provides the basis, and announces the development of action plans
for implementing IWRM, which requires that platforms be developed to allow different stakeholders to
work together. Institutional and legislative frameworks at all stages of water planning and management
should be revisited, assessed and, if necessary, amended.
Assess the possibility of broad scale implementation of rain water harvesting, localised waste water
recycling schemes and legislation, including for agricultural irrigation: Reducing the required fresh water
for household and hotel use would alleviate pressure on groundwater systems. There are a number of
sectors/activities that demand considerable quantities of water, for instance the tourism industry and in
particular, cruise ships. Belize Water Services and the Department of Public Health, with input from private
sector entities (e.g. specialists in water resource recovery) can investigate the feasibility of recycling waste
water from the domestic and tourism use to produce irrigation water, either for agriculture or the irrigation
of golf courses. This would alleviate the pressure on groundwater and reduce the need for desalination.
Water infrastructure should be developed to increase access to sanitation facilities and safe water, and
reduce vulnerability during drought events and after major storms and hurricanes: In particular, (i) water
storage should be encouraged through incentives and every new building should have its own stored water
and rainwater harvesting infrastructure; (ii) the viability of additional storage facilities should be assessed,
allowing improved access to potable water in different communities; (iii) losses in water distribution should
be reduced through pipe replacement; and (iv) water distribution infrastructure should be developed to
include communities currently without access. These efforts would require input from Belize Water
Services, Public Utilities Commission, Department of Public Health and the Housing and Planning
Department.
Medium Term Actions
Develop pilot projects to assess artificial recharge of aquifers and conduct feasibility studies explore the
possibility of additional projects: Low lying aquifers in Belize, particularly coastal areas and those of the
Cayes, are vulnerable to contamination through poor sewer construction or the intrusion of salt water. As
suggested in the Initial National Communication on Climate Change to the UNFCCC, injection of water into
aquifers could buffer against the effects of saline intrusion. Aquifers act as large reservoirs of fresh water
which reduce vulnerability during periods of drought. Upstream injection increases recharge volumes and
downstream recharge increases the barrier between saline and freshwater. Maintaining sufficient
groundwater recharge would reduce the risk of saline intrusion and help to maintain water quality. In this
regard, the BWS could investigate the feasibility of this option, in conjunction with the Ministry of Health,

180
as the source of water used for artificial recharge should be selected carefully to avoid issues with nitrates
entering groundwater.
6.3. Energy Supply and Distribution
Consistent with the issues and future directions outlined in proposals for the National Energy Policy, the
following section suggests a set of measures to reduce energy consumption and emissions in tourism:
Short Term Actions
Define national action plans: Once national policy goals have been agreed upon for tourism, an action plan
to avoid energy use, increase efficiency and to use a greater share of renewable energy sources needs to be
written and implemented. This plan needs to combine savings potentials (energy management; cf. Gössling,
2010) as well as technological restructuring. Valuable information on the potential of wind- and solar
power can for instance be found in Bishop and Amaratunga (2008), Chen et al., (1990), Chen et al., (1994)
and Headley (1998). The action planning should reflect on the assessment of Belize’s energy systems as a
priority (OAS, 2011), especially in the case of future renewable energy sources that depend on climate and
priority coastal infrastructure such as power plants. Planning activities should also incorporate outputs
from climate change modelling scenarios and involve energy sector authorities (e.g. Geology and Petroleum
Department, Public Utilities Commission) and national and regional specialists (e.g. BEST) with support from
international organisations where necessary.
Medium Term Actions
Pursue the concept of a ‘Green Economy’: The benefits of these efforts will be immense: there is a very
low likelihood of energy prices decreasing over the longer-term, and a very high likelihood that these will in
fact increase. Building a green tourism economy is likely to lead to a renewed cycle of growth, while making
the country less dependent on imports of resources, and in particular oil. Many of the principles of a Green
Economy will already have been addressed in the National Energy Policy discussions and development
process, even though it is not presented as such. However, a Green Economy reaches beyond energy
considerations alone and includes efforts to adjust procurement procedures, level the playing field for
greener products, removal of counter-productive subsidies etc.
Stabilise energy pricing to influence energy use and emissions: Taxes, emission trading and other
economic instruments are needed to steer energy use and emissions, conveying clear, long-term market
signals. It is important for these economic instruments to significantly increase the costs of fossil fuels and
emissions. The Ministry of Finance and Public Utilities Commission should investigate this option. Price
levels also need to be stable (not declining below a given level), progressive (increasing at a significant rate
per year) and foreseeable (be implemented over longer time periods), to allow companies to integrate
energy costs in long-term planning and decision-making. Recommendations by the Public Utilities
Commission to reduce energy prices in Belize are contrary to this and should be re-considered.
Use regulation to stimulate changes and adaptation: While carbon pricing is the most efficient tool to
stimulate behavioural change and changes in production, market failures justify additional policy
intervention (see also Francis et al., 2007). Energy-intense forms of tourism and transport as well as
behavioural change can be addressed through other measures, such as speed limits, bans of jet skis, quads,
or other motorised transport at the destination level. Moreover, regulation can include building codes and
other minimum standards to reduce emissions, also with a view on adaptation. Actual enforcement of
existing environmental regulations needs to be ensured.

181
Create incentives for low-carbon technology use: The introduction of low-carbon technology needs to be
supported through incentive structures. An ecological tax reform, for instance, could shift tax burdens from
labour to energy and natural resources and thus “reward” users of low-carbon technology. Other incentives
could include financial support, reward mechanisms or awards. There is also a range of examples of bonus-
malus systems in tourism and transport, rewarding those choosing to pollute less.
6.4. Agriculture and Food Security
Medium Term Actions
Crop-growing for Climate Change: CARIBSAVE recommends a “Crop-growing for Climate Change” project
to build Belizean farmers’ capacity to grow produce using good agricultural practices and to introduce them
to new technologies that will improve the quality and yield of their crops under existing pedoclimatic
conditions. Delivery of training courses should be farm-based, practical and should target organised groups
such as women farmers, youth and farmers’ associations based in agricultural districts. This programme
should enhance the work conducted through the Ministry of Agriculture and Fisheries Extension
Programme.
Rural Education Agricultural Programme: A second recommendation is the revival of the “Rural Education
Agricultural Programme” which existed in previous years. The Rural Education and Agriculture Programme
(REAP) originally initiated in response to perceived deficiencies in the rural primary schools of Belize. The
scheme involved practical applications on REAP school farms with gardens, coops, hutches, etc. With
Collaboration from the Ministries of Agriculture and Fisheries, and Education and Youth, this medium can
be used to revive youth interest in agriculture, as an avenue for increasing agricultural knowledge and skills
among young people and an opportunity to build entrepreneurial skills for at-risk youth.
6.5. Human Health
Medium Term Actions
Build up a supply of public health resources for the surveillance, prevention and control of Vector Borne
Diseases: Gubler (2002) has stated that the resurgence of diseases and particularly vector borne diseases
has been “compounded by complacency about infectious diseases in general and vector-borne diseases in
particular and a lack of public health resources for research, surveillance, prevention and control
programs.” In Belize, it has been noted that “the intensity and quality of data collection and recording,
varies over time and among health regions” (Government of Belize, 2011). This has the outputs that can be
derived from modelling dengue fever occurrence. It is therefore recommended that the Integrated Vector
Management (IVM) Programme approach of the WHO be adopted and spearheaded by the Ministry of
Health, with input from the Ministry of Natural Resources and the Environment.
The items of the approach are listed as follows which were taken from the Report of WHO consultation on
IVM (WHO, 2007):
1. Advocacy, social mobilization and legislation
2. Collaboration within the health sector and with other sectors
3. Integrated approach
4. Evidence-based decision-making
5. Capacity-building

182
The Caribbean region, as part of the WHO Region of the Americas has the potential to chart a course that
includes IVM in diseases that have a climate change signal. Those that have been highlighted for Belize
include malaria and dengue fever. In this region limited human resources, poor vector and disease
surveillance are the major challenges to adopting an IVM approach.
Long Term Actions
Improve the use of technology in the Health Sector: There are various aspects of technology that can be
developed in the health sector.
1. An Early Disease Warning Systems that considers temperature signatures for vector borne diseases,
however these must be validated (Chen et al., 2006) and be site-specific (Ebi et al., 2006). Other
signatures could be further researched such as the use of the pre-seasonal treatment (Chadee,
2009).
2. More reliable water storage and distribution will provide the population with quality water and
protect against numerous sanitation problems that Belize is vulnerable to. Increased use of
irrigation technology for agriculture will also decrease the dependence on rain-fed irrigation and
reduce the vulnerability to drought conditions.
6.6. Marine and Terrestrial Biodiversity and Fisheries
Medium Term Actions
Improve the management and resilience of Marine Protected Areas and fish sanctuaries in Belize: Belize’s
MPA system is among the best in the world, but it is suffering from uneven funding and management. To
avoid a continuing decline in the health of coral reefs and fish populations in MPAs, Belize should increase
overall investment, improve fee collection, strengthen monitoring and enforcement efforts and establish a
permanent source of funding to support the valuable MPA system. Strategic planning at the system level is
also needed to address disparities and gaps in the current structure. The government, private sector, NGO
entities and communities with interest in the MPAs should come together to create a strategy for:
establishing a more effective fish sanctuary management and enforcement system for coastal
communities;
for enhancing the capacity of resource managers and users to be more resilient to climate change;
and
establishing a sustainable finance mechanism for supporting fish sanctuary management.
The strategy should increase the involvement of the tourism sector in supporting community-based MPAs,
as well as provide opportunities for alternative livelihoods and technologies for public education. Some
local MPAs already have strong and well-established systems for monitoring and management in place.
MPA sites without these structures can also learn from the experiences of more established MPA
management programmes.
Mangrove Restoration and Protection: Reforestation of the mangrove stands will protect coastal areas and
also improve the health of fish nurseries and coral reefs thus benefitting the livelihoods of those engaged in
marine-based activities. Proposed MPAs will benefit from the presence of mangrove trees, which filter
pollutants and provide protection to fish and crustaceans allowing them to increase in size and abundance.

183
The Riley Encased Methodology (REM) has proven successful in Belize and overcomes some of the
difficulties in mangrove rehabilitation in exposed locations. The Ministry of Natural Resources and the
Environment can promote an initiative with local NGOs and CBOs who can implement a network of projects
at the community level.
Incorporate climate change and biodiversity conservation into the primary, secondary and tertiary school
curricula: one of the shortcomings in the country’s adaptive capacity has been identified as a shortage of
trained personnel in biodiversity management. The Government has reduced its support for tertiary level
education and the cost of seeking such education outside of the country is prohibitive for many. Belize, like
many other countries of the Region, are challenged to meet commitments to MEAs and to sustainably
manage biodiversity because of this lack of human resources. Research on climate change and
development of technologies to monitor, mitigate and adapt to climate change are hampered by lack of
adequate data, infrastructure development and trained human expertise. The Ministry of Education and
Youth in tandem with departments in the Ministry of Natural Resources and the Environment should seek
to incorporate climate change and biodiversity issues into school curricula starting at the primary level will
help to improve public awareness, while building adaptive capacity through knowledge and training. Doing
so at the primary, secondary and tertiary levels will encourage students to view environmental
management as a viable career choice and address the lack of trained personnel in this field.
Long Term Actions
Plan and implement development sensibly: The Government needs to enforce existing land-use and
development regulations in the coastal zone. Minimizing the loss of mangroves along the shoreline will be
increasingly important, as they provide critical habitat and protect the coast from storms. Longer-term
tourism and development strategies should incorporate the ecosystem services provided by coral reefs and
mangroves. For instance, decisions on development permits, sewage and waste disposal regulations and
the balance between cruise and overnight tourism should all include consideration of potential impacts on
the flow of benefits from coastal resources.
6.7. Sea Level Rise and Storm Surge Impacts on Coastal Infrastructure
and Settlements
Short Term Actions
Conduct a thorough cost-benefit analysis of coastal protection at a local level: Cost-benefit analysis of
coastal protection will be informed by the estimated cost of damage to specific infrastructure and
properties. The specific location of infrastructure is important for estimating impacts to a high level of
fidelity. Similarly, property values are highly dependent on exact location, for example in some areas the
most expensive property values may be on the coast, whereas in others they may be located on a hillside.
A detailed analysis of property prices by location is required as part of local level studies. The Government
of Belize, local resort owners and local building authorities are encouraged to collaborate with members of
the research community to help develop a cost benefit analysis of coastal protection. In addition to refining
estimates of costs to rebuild infrastructure (particularly in areas with high-density coastal development),
there is an important need to investigate the response of international tourists and the private sector to
the impacts of coastal erosion to test adaptation strategies in the tourism sector. By completing a cost-
benefit analysis, decision makers will able to identify the best adaptation options to adopt and can begin to
move forward in reducing the vulnerability of settlements and infrastructures in vulnerable areas.
184
Medium Term Actions
Complete a focused analysis of the vulnerability of secondary and tertiary economies to SLR and
determine the economic impacts of these damages for the tourism sector: Tourism infrastructure is
vulnerable in Belize. With tourism contributing a large proportion to the national economy, the capacity of
the economy to absorb and recover from proportionately higher economic losses in that sector is expected
to be low. Determining the secondary and tertiary economic impacts of damages to the tourism sector and
possible adaptation strategies for Belize should be a priority for future research. This will enable the
identification of the degree to which the economy of Belize and its citizens are economically and socially
vulnerable to SLR. In the event that this study finds tourism to be economically vulnerable to the impacts
of SLR, then action plans could be developed to diversify the economy and provide training and tools to
help workers transition to other sectors that may be less vulnerable.
Assess the adaptive capacity of the tourism sector to SLR: Tourism is the single most important sector in
Belize. Given the close proximity of the tourism infrastructure to the coast, it is highly dependent on the
attractiveness of the natural coastal environment, which has been shown to be vulnerable to SLR. More
detailed analysis of the impacts of SLR for major tourism resorts, critical beach assets and supporting
infrastructure (e.g. transportation) is needed to accurately assess the implications for inundation and
erosion protection. A necessary part of this evaluation is to identify the land that can be used for tourism
infrastructure and future development under a managed retreat response to SLR.
Long Term Actions
Review and develop policies and legal framework to support coordinated retreat from high-risk coastal
areas: The Government of Belize must review existing policy and legal frameworks to assess the
responsibilities of the state and landowners for the decommissioning of coastal properties damaged by the
impacts of SLR. The Government should also examine the utilisation of adaptive development permits that
will allow development based on current understanding of SLR, but stipulate the conditions for longer-term
coastal retreat if sea level increases to a specified level. Current coastal set-back regulations need to be
reassessed in light of new SLR projections to ensure that new developments are not built in vulnerable
coastal areas.
6.8. Comprehensive Natural Disaster Management
Following the national review for the Hazard Mitigation Plan, many strengths and weaknesses have been
identified in Belize and in NEMO particularly. The following recommendations are complementary to those
and in some cases add further detail in an effort to enhance vulnerability and risk reduction efforts as well
as permitting for effective climate change adaptation.
Medium Term Actions
Conduct capacity building and technical training programs for NEMO employees so that the current
technical deficiencies can be remedied and skills gained. To achieve CDEMA’s goals under the
Comprehensive Disaster Management Strategy and Plan, the prioritisation of technical training within the
Participating States’ disaster offices should be encouraged. While Belize has good data on vulnerabilities
and hazards from recent studies and assessments, it is also important to maintain personnel with the skills
to update those databases. Therefore, this recommendation is to build capacity at the local and national
level. In this way, the NEMO and their district disaster committees can manage risks better and also have
an understanding of the current and changing vulnerability in communities across Belize.

185
Lead the way for the Tsunami Early Warning System integration in the Caribbean region. Although other
countries in the region have started planning and testing tsunami early warning systems, full integration is
needed. Belize faces increased risk due to the earthquake risk in Central America. Belize also has an
opportunity for cooperation with a regional body, the CCCCC. Opportunities for collaboration and
partnership should be explored with the goal of sharing resources, equipment, tools and knowledge for the
improvement of hazard risk reduction and climate change adaptation in Belize and the wider Caribbean.
Long Term Actions
Update building regulations and hire building inspectors, in permanent positions, with the responsibility
of reviewing all construction across the country. Across the Caribbean housing structures are highly
vulnerable to damages from disasters such as hurricanes and tropical storms. A regional standard on
building materials and practices would help to reduce losses to individual families and also take some of the
pressure off of shelters because this would mean that some people would be able to stay in their own
homes during emergencies. Belize should certainly continue to assist with the development of a regional
code, however, since national regulations or building codes do exist, the problem is actually one of
enforcement. NEMO, along with the Central Building Authority must collaborate to conduct a needs
assessment with the objective of identifying financial resource availability, personnel requirements that
would improve enforcement and physical and technical requirements for hiring more building inspectors.
6.9. Community Livelihoods, Gender, Poverty and Development
Strategies are intended to contribute to development objectives (including poverty reduction) at all levels
within the country, based on the Vulnerability and Adaptive Capacity assessment. More specifically, the
strategies will address the following:
1. Promotion of climate-resilient livelihoods strategies and capacity building for adaptive capacity and
action planning.
2. DRR strategies to reduce the effects of climate related impacts, particularly on vulnerable households
and tourism-related livelihoods.
3. Capacity development for local civil society and Governmental institutions so that they can provide
better support to communities, households and individuals in their adaptation efforts.
4. Advocacy and social mobilisation to address the underlying causes of vulnerability, such as poor
governance, lack of control over resources, or limited access to basic services.
During the consultations, community residents highlighted various strengths and gaps in their ability to
adapt to climate change and also put forward recommendations to increase their resilience. Many of these
recommendations are inter-related, so that concerted effort on one area should have a positive feedback
effect in other areas.
Short Term Actions
Promote the use of kitchen/micro-gardens to improve self-sufficiency: Very little agriculture is practiced
in Placencia resulting in heavy reliance on imports, which comes at a very high price. Community and/or
household gardens would help to reduce household food costs and provide opportunities for residents to
supply other households, hotels and restaurants with fresh produce that may be in surplus. There is a
concern that the soil composition would not allow for crops to be cultivated. In this instance, community

186
residents will need guidance and advice on the best methods to use to overcome this obstacle (e.g. using
plastic containers/drums with soil to plant smaller crops).
Promote efforts to reduce pollution and improve solid waste management: There are many concerns
regarding the pollution and solid waste disposal issues that plague the community and surrounding natural
environment. While plastic disposal is harder to manage, recycling efforts should be implemented or
amplified, if already existing, to reduce the amount of waste which may eventually clog drains and litter the
marine environment. The use of biodegradable or reusable materials should be substituted for plastic
where possible. Pollution of the lagoon and marine environment is believed to stem from the presence of
shrimp farms along the coastline, which may be dumping their effluent in these areas. Regulatory controls
for the treatment of such effluent exist, but are not properly enforced. Given the importance of the marine
environment to several livelihoods in the community, it is vital that they are protected. As such, greater
efforts should be placed on regulating the disposal practices of the shrimp farms and exploring more
suitable, less damaging alternatives for disposal.
Medium Term Actions
Re-establish once common practices in water catchment and energy conservation in Placencia: Rainwater
harvesting would provide households in the community with an alternative source of water for non-potable
uses (for toilets, irrigation, washing cars, etc...) Rainwater harvesting efforts should not only be limited to
the household and community level, but should expand to include large commercial, industrial and
administrative buildings. Consideration can also be given to implementing energy saving practices (e.g.
using fluorescent light bulbs) widely. These activities will have multiple results, but most importantly
resource conservation and less demand on the public supply, which also translates to less expenditure on
public amenities.
Infrastructural improvement actions: Residents are concerned that the only access road to and from the
community is extremely vulnerable to flooding and in the event that the bridge is inundated, the entire
community is relatively cut off from the remainder of the country, unless water transport can be provided.
A recommendation has been put forward to assess the current condition of the access road/bridge to
determine if any remedial actions can be taken to resolve the poor drainage issue. This particular issue
needs to be taken into strong consideration, given the implications for the community if flooding becomes
a more frequent occurrence. Residents also noted that the sewage systems need to be improved, which
falls under the broader scope of infrastructural improvements.
Develop an emergency response plan for fishers: There is no facility for small vessel storage or shelter in
the event of inclement weather. Currently, fishers have resolved to removing the stern from the water
(instead of the whole structure, since it is the heaver part of the vessel) to protect against the likelihood of
sinking. Assistance is needed for this group to source and acquire the necessary equipment which can be
used to haul vessels out of the water in preparation for storm activity. An area will also need to be
designated for storing these vessels. This will be an expensive venture, but boats and related assets are
very crucial for fishermen and boat tour operators. Any damages or destruction expenses these two groups
significantly, interrupts their livelihood activities and results in a loss of income.
Improve the structural integrity of buildings that are used as provisional shelters: Strong and durable
public buildings are normally used as provisional hurricane shelters in the event that members of the public
feel unsafe in their own dwellings and wish to take shelter elsewhere. This is especially the case with low-
to middle-income households whose housing structures are perceptibly less able to withstand physical
hurricane impacts. Structural assessments and repairs should be conducted on buildings used as hurricane

187
shelters in the area to improve their integrity and minimise possible damage and discomfort of occupants
during a hurricane.
Identify opportunities for community-level disaster management activities that can be implemented
through collaboration between the National Emergency Management Organisation (NEMO), the District
Disaster Committee (for the Stan Creek District) and the local community: Community based disaster
management groups or organisations can be effective mechanisms for engaging and directing entire
communities in all stages of disaster management: preparation, mitigation, response and recovery; and
acting as a liaison body between national emergency and disaster management entities and the
community. A network of organisations with responsibility for disaster management at the community level
is becoming a popular strategy amongst Caribbean countries and has been highly recognised on previous
occasions for quick response and efforts in minimising hazard impacts at the community level, thereby
reducing the demand and strain on national response resources.
Disaster management falls under the purview of NEMO and the District Committee, but there is no
community disaster group. The establishment of the disaster group in Placencia will help build community
cohesion, while at the same time increasing the community’s resilience to weather-related hazards. This
group can also assume responsibility for ensuring that all existing emergency protocols pertaining to the
community are executed properly and as needed. Relationships can be built with other organisations such
as the Belize Red Cross Society and emergency service providers to facilitate training and education
activities. Further to this, a needs assessment should be undertaken to determine resource gaps in the
community and funding sought to support community level disaster mitigation initiatives. These might take
the form of tree planting on unstable slopes, construction of gabion walls, clearing of drains, development
of early warning systems and evacuation planning. Outside of Government support, the community can
explore options from non-governmental and international aid organisations which sponsor overall
community development programmes.
188
7. CONCLUSION
7.1. Climate Modelling
Recent and future changes in climate in Belize have been explored using a combination of observations and
climate model projections. Whilst this information can provide some very useful indications of the changes
to the characteristics of regional climate that might be expected under a warmer global climate, it must be
interpreted with due attention to its limitations.
Limited spatial and temporal coverage restricts the deductions that can be made regarding the
changes that have already occurred. Those trends that might be inferred from a relatively short
observational record may not be representative of a longer term trend, particularly where inter-
annual or multi-year variability is high. Gridded datasets, from which estimates of country-scale
observed changes are made, are particularly sparse in their coverage over much of the Caribbean,
because spatial averages draw on data from only a very small number of local stations combined
with information from more remote stations.
Whilst climate models have demonstrable skill in reproducing the large-scale characteristics of the
global climate dynamics, there remain substantial deficiencies that arise from limitations in
resolution imposed by available computing power and deficiencies in scientific understanding of
some processes. Uncertainty margins increase when moving from continental/regional scale to the
local scale as donein these studies. The limitations of climate models have been discussed in the
context of tropical storms/hurricanes and SLR in the earlier sections of this report. Other key
deficiencies in climate models that will also have implications for this work include:
Difficulties in reproducing the characteristics of the El Niño – Southern Oscillation (ENSO)
which exerts an influence of the inter-annual and multi-year variability in climate in the
Caribbean and on the occurrence of tropical storm and hurricanes.
Deficiencies in reliably simulating tropical precipitation, particularly the position of the
Inter-tropical Convergence Zone (ITCZ) which drives the seasonal rainfalls in the tropics.
Limited spatial resolution restricts the representation of many of the smaller Caribbean
Islands, even in the relatively high resolution Regional Climate Models.
A combination of GCM and RCM projections are used in the investigations of climate change for a country
and at a destination in order to make use of the information about uncertainty that can be gained from a
multi-model ensemble, together with the higher-resolution simulations that are only currently available
from two sets of model simulations. Further information about model uncertainty at the local level might
be drawn if additional regional model simulations based on a range of differing GCMs and RCMs were
generated for the Caribbean region in the future.

189
7.2. Water Quality and Availability
Belize is a country rich in surface water sources including streams and rivers as well as many groundwater
aquifers found in calcareous rock (Tollner, 2007). The main source of freshwater in rural areas is
predominantly groundwater, where approximately 95% of freshwater is extracted from groundwater
supplies (Frutos, 2003). In general, access to safe water is limited, particularly in rural areas (BEST, 2009;
WMB, 2011). Belize Water Services Ltd. (BWS), is the sole service provider in Belize, providing water and
sewerage to 46,610 (BWS, 2010) and accounts for an approximate demand of some 150 million US gallons
of water per month (BWS, 2009). Most villages are otherwise serviced by a village water board and some
also have access to a water tower (Mustafa and Reeder, 2009; WMB, 2011). Water not provided through
piping is usually collected rainwater or river water treated with bleach (WMB, 2011).
Tourism is the largest contributor to GDP in Belize. Tourist expenditures reached BZ $400 million dollars in
2006, which is approximately 16.8% of GDP (BTB, 2008). Combined, tourists visiting by cruise ships and
overnight visitors reached almost one million in 2006. The largest tourism destinations in Belize are
Ambergris Caye, Caye Caulker and the Cayo District. All three locations are serviced by the Belize Water
Services Ltd. (BWS). Most of the hotels, resorts and guesthouses that are not supported by the BWS use
rainwater as one of their main water sources for drinking and washing (Belize.com, 2011).
Belize is a country well endowed with water resources. However, recent issues with water scarcity and
water quality have become more commonplace as various stresses on water resources increase. Key issues
with water vulnerability in Belize are the uneven distribution of water resources. The southern region has
the lowest population, with the highest amount of freshwater availability, whereas the central and
northern regions both have much large populations and much less water resources (BEST, 2009). Several
Cayes have become popular tourist destinations but have low availabilities of freshwater.
Groundwater has been declining steadily in recent years, due to several factors. Some of these factors
include intensive uses of water resources by sectors such as agriculture and industry and a growing tourist
industry (BEST 2009). However, the amount of decline has not been quantified as it is unclear what the
extent of underground aquifers is (ECLAC, 2006; BEST, 2009). In groundwater aquifers that are in use,
particularly in coastal aquifers, issues of over abstraction are important to take into account. Groundwater
sources are reported to be low during dry season, which leads to an increase in the possibility of salt water
intrusion and thus the up taking of brackish water rather than freshwater.
The following recommendations are made:
1. Assess the possibility of broad scale implementation of rain water harvesting, localised waste water
recycling schemes and legislation, including for agricultural irrigation.
2. Water infrastructure should be developed to increase access to sanitation facilities and safe water
and reduce vulnerability during drought events and after major storms and hurricanes.
3. Develop pilot projects to assess artificial recharge of aquifers and conduct feasibility studies explore
the possibility of additional projects.
4. Consider the development of mechanisms to facilitate Integrated Water Resources Management
(IWRM).
5. Undertake broad consultation on the BEST (2009) recommendations for water resources.
6. Undertake detailed surveying of groundwater resources and well infrastructure and increase
coordination between the BWS and local village water boards.
7. Undertake public education in water resources.

190
7.3. Energy Supply and Distribution
There can be little doubt that tourism is an important and growing energy consuming sector in the
Caribbean. If this growth continues, vulnerabilities associated with higher energy prices as well as global
climate policy will grow concomitantly.
Any Caribbean nation’s ambition should thus be to reduce its energy use and to increasingly use renewable
energy produced in the region. In practice, this appears to be hampered by the lack of detailed databases
on energy use by sub-sectors, which is a precondition for restructuring energy systems. To this end, Francis
et al. (2007: 1231) suggest that:
Finally, given the absence of a more detailed database on energy consumption and GDP in
Haiti, Barbados and Trinidad and Tobago, further research can be directed at two important
issues. First, with wider data on energy consumption and GDP (total and sectoral), a
decomposition analysis could be undertaken, which can add value by identifying the main
drivers, a useful approach to the formulation of effective policies.
These insights also apply for other nations. While an energy and emissions database would thus be
paramount to the understanding, monitoring and strategic reduction of greenhouse gases, it also appears
clear that energy demand in all countries could be substantially reduced at no cost, simply because the
tourism sector in particular is wasteful of energy and because carbon management allows for the
restructuring of markets. Furthermore, technological options to develop renewable energy sources exist
and can be backed up financially by involving carbon markets as well as voluntary payments by tourists. In
order to move the tourism sector forward to make use of these potentials, it appears essential that policy
frameworks focusing on regulation, market-based instruments and incentives be implemented.
7.4. Agriculture and Food Security
The state of agriculture and food security in Belize as they relate to climate change revolves around several
key priorities which include:
Diversification of the agricultural economy as a means of reducing reliance on banana revenue
Building local farmers’ capacity to increase food production under existing climatic conditions
Increasing youth involvement in agriculture.
The Government of Belize has demonstrated its commitment to agricultural diversification and research. Its
policies create an enabling environment for dealing with climate change issues. Belizean farmers have
performed creditably in light of existing challenges, but the mission now is to increase levels of food
production, with some measure of consistency and in sufficient quantities to reduce the level of food
insecurity in the country.
7.5. Human Health
The current epidemiological trend involves a decline in communicable disease rates with lower mortality
rates while chronic life style diseases are more commonly reported. The direct and indirect efforts to
address poverty have aided improvements in the health sector. However, there is much room for further
improvements in the health sector as environmental degradation combined with weather related events
have demonstrated the extent to which the sector is vulnerable. By extension this resilience will be

191
important in a changing climate and the added unpredictability provided by the possible contributions from
climate change.
The vulnerabilities of human health to climate change in Belize are similar to other Caribbean territories, if
not more complicated due to its size. These include a number of emerging and re-emerging communicable
diseases such as dengue, malaria, gastroenteritis and food- and water- borne illnesses. Based on the
combination of hard data and ‘grey’ data used to inform the vulnerability and adaptive capacity sections of
this report it is very difficult to make definitive statements about the Health Sector of Belize. It is further
evident that these factors impact on multiple sectors, such as water and agriculture sectors as is the case
for many Caribbean nations.
While Belize does not rely as heavily on tourism as other countries in the region, the impact of health on
the tourism sector should be fully evaluated as Belize is dependent on the revenue already it already
receives from the sector and as the Government further develops the sector. Increased research and
validation of data for example with diseases of low but consistent prevalence such as leptospirosis and
Chagas diseases should not be neglected. While it is acknowledged that resources are limited, such
research is crucial in strengthening the base to inform policy and planning and adaptation to new
epidemiological challenges in the future as the climate changes.
7.6. Marine and Terrestrial Biodiversity and Fisheries
Belize is home to a rich and diverse biodiversity and to marine and terrestrial ecosystems that are of global
importance. It forms part of the Mesoamerican Biological Corridor, which comprises a network of protected
areas linked by biological corridors, stretching from Mexico to Panamá. Belize has two large blocks of intact
virgin rainforest that are perhaps the last strongholds for species that require large, undisturbed areas for
their long-term survival, such as the jaguar. The Mesoamerican Barrier Reef System, stretching the full
length of the country's coastline, is the largest unbroken coral reef complex in the Western hemisphere and
a World Heritage Site, in recognition of its global importance.
These natural resources are critically important to the economy and communities of Belize and need to be
protected from the increasing pressures placed on from a growing population and from unsustainable
practices. According to a recent economic valuation (Cooper, Burke and Bood, 2009) the value of coral reef-
and mangrove-related fisheries, tourism and shoreline protection services in Belize is estimated to be US
$395 – $559 million per year (As a reference point, Belize’s GDP totalled US $1.3 billion in 2007). The
Government of Belize should be praised for its efforts in managing and protecting its environment and
overcoming many of the challenges associated with being a small country with very limited resources. The
internationally recognized success of Belize’s network of protected areas is largely due to policies that
encourage a participatory approach to governance and resource management and to the active
involvement of many NGOs, CBOs and local stakeholders. It is also helped by innovative financing
mechanisms and institutional frameworks (e.g. PACT) that promote research, international collaboration
and coordinated programmes of education and community participation. Studies have shown that Belize's
protected areas have been extremely effective in protecting the country's forests, with only some 6.4% of
forests inside of legally declared protected areas cleared between 1980 and 2010, compared to over a
quarter of forests outside of protected areas lost between 1980 and 2010. The marine protected areas also
have had some outstanding success, though the enforcement of fisheries laws outside of the protected
areas has been weak. An unusually high frequency of intense storms in the last few years, including
Hurricane Mitch (1998), Hurricane Keith (2000), Hurricane Iris (2001), Hurricane Dean (2007) and Hurricane

192
Richard (2010), combined with mass coral bleaching events in 1995 and 1998, have had serious impacts on
the coral reefs, mangroves and beaches.
The projected annual changes in temperature by the 2080s indicate a potential increase spanning 1.0 -
4.1˚C (for the GCM ensemble Regional Climate Model projections driven by ECHAM4 and HadCM3). The
projections also indicate a 32% decrease (RCM driven by EHCAM4; 26% decrease when using driven by
HadCM3) in annual rainfall, with the largest proportional decrease of 67% in JJA. These potentially very
substantial changes in temperature and rainfall will have profound effects on the Belize’s ecosystems and
biodiversity.
Low lying cayes and coastal areas will be very vulnerable to projected SLR and perhaps impossible to save.
In some areas, migration of mangroves and beaches inland may be possible, if the topography and coastal
infrastructure permit it. Efforts to build coastal defences in tourism destinations and urban areas, are
already underway and these should be designed and planned to allow – where and when possible –
ecosystems to continue functioning effectively and providing essential goods and services.
Belize’s impressive commitment to and capacity for, natural resource management are being hampered by
a chronic lack financial resources and by increasing pressures from expanding populations in neighbouring
countries. The impacts of climate change, already visible in the region, are projected to accelerate rapidly
in the coming decades. The ability of ecosystems to adapt to these changes will depend largely on the
magnitude of other stressors that weaken, damage or destroy habitats and species. To reduce these
stressors and build the resilience of its biodiversity, Belize will require a new level of investment and
commitment in environmental management. As a country with a relatively high forest cover and a low
deforestation rate, Belize has significant potential for participation in initiatives such as REDD, which could
provide much needed financial support for forest conservation. Other financing mechanism and adaptation
funds for community-based conservation programmes should be explored as a matter of priority. As the
country that leads that CARICOM region in matters of conservation, the ability of Belize to succeed in this
endeavour is of critical and strategic importance to Belizeans and to Caribbean people as a whole.
7.7. Sea Level Rise and Storm Surge Impacts on Coastal Infrastructure
and Settlements
With its development along the coast and reliance on coastal resources, the tourism sector in Belize is
vulnerable to climate change and SLR. Tourism, a very large and important sector of the economy, is also
the key activity taking place in the country’s coastal areas. Given the importance of tourism, Belize will be
particularly affected with annual costs as a direct result of SLR. If action is not taken to, the current and
projected vulnerabilities of the tourism sector to SLR, including coastal inundation and increased beach
erosion, will result in significant economic losses for the country and its people. Adaptations to minimize
the vulnerabilities of the Belize will require revisions to development plans and major investment and
policy decisions. These considerations must be based on the best available information regarding the
specific coastal infrastructure and ecosystem resources along the coast, in addition to the resulting
economic and non-market impacts. Decisions regarding where retreat policies should be implemented
versus what should be protected needs to be a priority if Belize is to help curb development in vulnerable
areas and protect vulnerable tourism assets.
The Government of the Belize needs to execute and adhere to the coastal zone policies that aim to regulate
coastal development and also identify and inventory vulnerabilities of coastal lands and infrastructure to
weather and climate related hazards. This work needs to be advanced to include in greater detail the

193
implications of and application of climate change adaptation measures and strategies, to ensure that
coastal resources and infrastructure of Belize do not suffer from the consequences of potential increased
SLR. Continued development and an increasing reliance on the tourism sector will only magnify the
vulnerabilities faced, placing additional assets and people at risk, while simultaneously raising the damage
estimates and the costs to protect the coastline. It is vital to recognize the vulnerabilities from current SLR
and SLR induced erosion, as well as to anticipate and prepare for future SLR implications. There is an urgent
need for serious, comprehensive and urgent action to be taken to address the challenges of adapting to SLR
in Belize.
7.8. Comprehensive Natural Disaster Management
Belize is a country threatened by both hydro-meteorological and geological hazards. The low-lying coastal
region is home to a large population so many people and homes are at risk to storm surges and flooding.
Furthermore, while efforts have been made to move much of the central Government to Belmopan so it is
away from this coastal hazard, there is some risk to continuity. Further risk to the coastal region came after
an earthquake in neighbouring Honduras when a tsunami was predicted. The rest of the country is not
immune to disasters and hazards, but the risks are not as severe nor are they likely to be as frequent.
The management, policy and technology employed within the disaster management system in Belize
demonstrate a solid understanding of the dynamic nature of natural processes. Legislation for hazard
mitigation, building and disaster preparedness and response is fairly comprehensive, although there are
challenges with overlap and further progress is needed to integrated disaster risk management efforts
across sectors. The Hazard Mitigation Policy and Plan have provided vulnerability assessments and
institutional and legislative assessments in recent years. Critical assessments such as this provide Belize
with the information on strengths, weaknesses and gaps in their disaster management system so that they
can improve national efforts in disaster risk reduction and also find synergies in their national climate
change adaptation activities.
7.9. Community Livelihoods, Gender, Poverty and Development
Tourism has become a major player in the Belize economy and as such, numerous livelihoods are based in
the industry, which helps to support families and communities near tourism centre. Placencia is one such
community, with fairly rapid tourism growth occurring in the area, with some benefits redounding to some
of the community members.
For a community that depends significantly on the natural resource base, the threat of climate change is a
major concern. The community is well aware and are already observing changes in climate patterns and the
resulting changes in seasons, agricultural production and loss of biodiversity. Tourism is the community
lifeline and any negative impacts on the industry would have ripple effects throughout the community. The
coastal location and geography of the community predisposes it to relatively high susceptibility to hurricane
and storm surge impacts. The community was severely affected in 2001 by Hurricane Iris, with an extended
period of recovery. All livelihoods, especially in the growing tourism sector, were impacted negatively.
Existing social conditions of some residents in Placencia also exacerbate their vulnerability to these events.
Women working in tourism are more likely to be employed in low-paying positions for unskilled labour,
whereas men have a more favourable position in the tourism labour market in general. Home insurance
coverage is particularly low and financial security and support varies with household.

194
In the face of climate change and the threat that it poses to Caribbean societies and economies, the
comprehensive integration of poverty, gender and livelihood issues into climate change impact and
vulnerability assessment and planning processes is essential to developing appropriate adaptation
strategies. Preparation and adaptation therefore need to be prioritised for these groups to minimise future
impacts on stability and development. Recommendations put forward to address vulnerability and adaptive
capacity concerns include resource conservation, infrastructural assessments and developments, disaster
management activities and policy reform to incorporate gender and poverty lenses. These are only some of
the activities that can be implemented in the short and long term and will require efforts at all levels and
across sectors to build the resilience of the Placencia community to the impacts of climate change.

195
REFERENCES
7 News Belize. (May 19, 2011). The Great Drought of 2011….Who Knew? Retrieved 29/07/2011 from,
http://www.7newsbelize.com/sstory.php?nid=19683&frmsrch=1
Alcamo, J., Moreno, J. M., Nováky, B., Bindi, M., Corobov, R., Devoy, R. J., et al. (2007). Europe. (M. L. Parry,
O. F. Canziani, J. P. Palutikof, P. J. van der Linden, & C. E. Hanson, Eds.) Climate Change 2007: Impacts,
Adaptation and Vulnerability. Contribution of Working Group II to the Fourth Assessment Report of the
Intergovernmental Panel on Climate Change , 541-580.
Allwinn, R., Hofknecht, N. and Doerr, H. W. (2008). Dengue in Travellers Is Still Underestimated.
Intervirology, 51(2), 96-100.
Amarakoon, D., Stennett, R. and Chen, A. (2004). Climate Variability and Disease Patterns in Two South
Eastern Caribbean Countries. Climate Studies Group Mona, Department of Physics, University of the
West Indies. Kingston
AOSIS. (2009). Aosis Climate Change Declaration. Retrieved April 30, 2011, from Alliance of Small Island
States:
http://www.sidsnet.org/aosis/documents/AOSIS%20Summit%20Declaration%20Sept%2021%20FINAL.p
df
APAMO and MT. (2010). Belize’s National Policy on Responsible Tourism. Association of Protected Areas
Management Organization (APAMO) and Ministry of Tourism (MT), Government of Belize
AT. (2011). Ambergris Today: Ambergris Caye’s Finest News Source. Retrieved 29/07/2011 from Ambergris
Today (AT), http://ambergristoday.com/content/stories/2011/may/27/drought-belize-needs-rain
Babb, C. (n.d.). Disaster Risk Reduction in Belize's Education Sector. Retrieved 11/14/2011, from ECLAC:
http://www.eclac.cl/portofspain/noticias/paginas/2/38002/Presentation_MoE_DRR_-_Belize.pdf
Barnett, C., Catzim‐Sanchez, A., & Humes, D. (2010). Report of the National Consultations on Horizon 2030.
Belize City: Barnett & Co. Ltd.
Barnett, C., Catzim‐Sanchez, A., & Humes, D. (2011). Second Progress Report of the National Consultations
on Horizon 2030. Belize City: Barnett & Co. Ltd.
Barnett, J., & Adger, W. (2007). Climate Change, Human Security and Violent Conflict. Political Geography ,
639-655.
Barr, S., Shaw, G., Coles, T. and Prillwitz, J. (2010). ‘A holiday is a holiday’: practicing sustainability, home
and away. Journal of Transport Geography 18: 474-481.
Bates, B., Kundzewicz, Z. W., Wu, S. and (Eds), J. P. (2008). Climate Change and Water. Technical Paper of
the Intergovernmental Panel on Climate Change (pp. 210). Geneva: IPCC Secretariat.
Becken, S. (2008). Developing indicators for managing tourism in the face of peak oil’, Tourism
Management 29: 695-705.
BEL (2009). 2009 Belize Electricity Limited Annual Report. Belize City, Belize: Belize Electricity Limited
BEL. (2011). 2010 Belize Electricity Limited Annual Report. Belize City, Belize: Belize Electricity Limited .

196
Belize Development Trust. (2001). How the Primitive Rural Foothill Ketchi Maya of Belize beat the Most
Modern Agricultural Scientists in Practical Research and Development. REPORT #452. Caye Caulker: BDT.
Belize Fisheries Department. (2008). Fisheries production and export statistics for 2007. Belize Fisheries
Department. 2007. Glover’s Reef Marine Reserve: 2006 Yearly Report.
Belize Natural Energy Ltd. (2010). Belize Natural Energy. Retrieved June, 2011, from Belize Natural Energy
Limited: http://www.belizenaturalenergy.bz/ index.html
Belize Public Utilities Commission. (2005). National Energy Plan for Belize. Retrieved November 2010, from
Public Utilities Commission: http://www.puc.bz/nep.asp
Belize Sustainable Tourism Project. (2011). Tourism Planning for Sustainable Growth. Retrieved
11/14/2011, from Belize Sustainable Tourism Project: http://www.sustainabletourismbz.org
Belize.com. (2011). Belize Eco Tourism-Conserving water and electricity. Retrieved 07/07/2011 from
http://www.belize.com/eco.html
Bengtssen L., K. I. Hodges, M. Esch, N. Keenlyside, L. Kornblueh, J-J Luo and T. Yamagata, (2007): How may
tropical cyclones change in a warmer climate? Tell us Series A-Dynamic Meteorology and Oceanography,
59(4), 539-561.
BERDS. (2011). Watersheds. Retrieved 07/07/2011 from the Biodiversity and Environmental Resource Data
System (BERDS) of Belize: http://www.biodiversity.bz/find/watershed/
BEST. (2008). National Integrated Water Resource Management Policy (Including Climate Change) for
Belize. Prepared by the Belize Enterprise for Sustainable Technology (BEST) for the CCCCC. Available
online (CCCCC website).
BEST. (2009). National Adaptation Strategy to Address Climate Change in the Water Sector in Belize
Strategy and Action Plan. Belmopan, Belize: Belize Enterprise for Sustainable Technology (BEST).
Bezanilla et al. (In preparation) Tropical-cyclone-like-vortices in the Caribbean according the regional
climate model PRECIS.
Bindoff, N. L., J. Willebrand, V. Artale, A. Cazenave, J. Gregory, S. Gulev, K. Hanawa, C. Le Quéré, S. Levitus,
Y. Nojiri, C.K. Shum, L. D. Talley and A. Unnikrishnan, (2007): Observations: Oceanic Climate Change and
Sea Level. In: Climate Change 2007: The Physical Science Basis. Contribution of Working Group I to the
Fourth Assessment Report of the Intergovernmental Panel on Climate Change. Solomon, S., D. Qin, M.
Manning, Z. Chen, M. Marquis, K. B. Averyt, M. Tignor and H. L. Miller (eds.), Cambridge University
Press, Cambridge, United Kingdom and New York, New York, USA.
Bishop, J.D.K. and Amaratunga, G.A.J. (2008). Evaluation of small wind turbines in distributed arrangement
as sustainable wind energy options for Barbados. Energy Conversion and Management 49: 1652-1661.
Booba, A. G. (2002). Numerical modelling of salt-water intrusion due to human activities. Hydrological
Sciences Journal, 47((S)August 2002), 67 - 80.
Bood, N. (2008). Commuity Level Climate Change Vulnerability Assessment: A Case Study. World Wildlife
Fund (WWF), Belize City, Belize.
197
Bows, A. anderson, K., & Footitt, A. (2009). Aviation in a low-carbon EU. In S. Gossling, & P. Upham, Climate
Change and Aviation. London, UK: Earthscan. pp. 89-109.
Brewster, A. (2005). Caribbean Electricity Restructuring: An Assessment. Public Administration and
Development 25: 175-184.
Brooks, N., & Adger, W. N. (2005). Assessing and enhancing adaptive capacity. Cambridge: UNDP-GEF.
Brune, S., & Sanders, A. (2008). SocMon: Vulnerability and Perceptions in the Coastal Communities of Belize
- Case Study of San Pedro, Placencia and Port Loyola. Honduras: EAP Zamorano.
BTB. (2008). Belize Tourism Statistics- Travel and Tourism Statistics 2008. Retrieved 08/07/2011 from the
Belize Tourism Board (BTB). http://www.belizetourism.org/
BTB. (2009). Travel and Tourism Statistics 2008. Belize City: Belize Tourism Board.
BTB. (2010). Belize Tourism Board Action Plan 2010-2012. Belize City: Belize Tourism Board.
Bueno, R., Herzfeld, C., Stanton, E. A., & Ackerman, F. (2008). The Caribbean and Climate Change: The Costs
of Inaction. Massachusetts, USA: Stockholm Environment Institute-US Center, Global Development and
Environment Institute, Tufts University.
Burton, I. (1996). The Growth of Adaptation Capacity: Practice and Policy. In J. N. Smith, Bhatti, G.
Menzhulin, R. Benioff, M. Budyko, M. Campos, et al., Adapting to Climate Change: An International
Perspective (pp. 55–67). New York, NY, USA: Springer- Verlag.
Buvinic, M., Vega, G., Bertrand, M., Urban, A.-M., Grynspan, R., & Truitt, G. (1999). Hurricane Mitch:
Women's Needs and Contributions. Sustainable Development Department Technical Paper Series .
Washington, D.C.: Inter-American Development Bank.
BWS (Belize Water Services Limited). (2009). Corporate Profile, Service Locations and 2010 Annual Report.
Retrieved 11/07/2011 from http://www.bws.bz/
BWS. (n.d.). Corporate Profile. Retrieved April 23, 2012, from Belize Water Services:
http://www.bws.bz/about-us/
Campbell, D., Barker, D. and McGregor, D. (2011). Dealing with drought: Small farmers and environmental
hazards in southern St. Elizabeth, Jamaica. Applied Geography, 31(1), 146-158.
Campbell, S. J., McKenzie, L. J., & Kerville, S. P. (2006). Photosynthetic responses of seven tropical
seagrasses to elevated seawater temperature. Journal of Experimental Marine Biology and Ecology , 330
(2), 455-468.
CAREC. (2007). Caribbean Epidemiology Centre Annual Report 2006. Port-of-Spain: Caribbean Epidemiology
Centre/PAHO/WHO.
CAREC. (2008a). Caribbean Epidemiology Centre Annual Report 2007 (pp. 121). Port-of-Spain
CAREC/PAHO/WHO.
CAREC. (2008b). Dengue Fever (DF) and Dengue Haemorrhagic Fever/Dengue Shock Syndrome (DHF/DSS),
Morbidity Review of Communicable Diseases in CAREC Member Countries, 1980 – 2005 Morbidity
Reviews. Port-of-Spain.

198
CAREC. (2008c). Malaria - Morbidity Review of Communicable Diseases in CAREC Member Countries, 1980
– 2005, Morbidity Reviews (pp. 6): Caribbean Epidemiology Centre, CAREC/PAHO/WHO.
CAREC. (2010). Caribbean Epidemiology Centre Annual Report 2009 (pp. 84). Port-of-Spain: Caribbean
Epidemiology Centre/PAHO/WHO.
Caribbean Tourism Organisation. (n.d.). Individual Country Statistics. Retrieved April 29, 2011, from One
Caribbean: http://www.onecaribbean.org/statistics/countrystats/
CBB. (2004). Central Bank of Belize Annual Report and Accounts 2003. Belmopan, Belize: Central Bank of
Belize.
CBB. (2005). Annual Report 2004. Belmopan, Belize: Central Bank of Belize.
CBB. (2010). Central Bank of Belize Annual Report 2009. Belize City, Belize: Central Bank of Belize.
CCB. (2004). Official Caye Caulker Website: About Caye Caulker. Retrieved 06/07/2011 from Caye Caulker
Belize: http://www.cayecaulkerbelize.net/about_caye_caulker.php
CCCCC. (2009). Climate Change and the Caribbean: A Regional Framework for Achieving Development
Resilient to Climate Change (2009-2015). Belmopan, Belize: Caribbean Community Climate Change
Centre.
CCRIF. (2011). CCRIF News March 2011 Volume 2#3. Grand Cayman: Caribbean Castrophe Risk Insurance
Facility.
CDEMA. (2010). Caribbean Disaster Emergency Management Agency. Retrieved 11/1/2010, from CDEMA:
www.cdema.org
CDERA. (2007). The Regional Disaster Risk Management for Sustainable Tourism in the Caribbean Project
(Summary document). Caribbean Disaster Emergency Response Agency and Inter-American
Development Bank.
CDERA. (2008). WORKSHOP REPORT: Development of a Disaster Risk Management Strategy and Plan of
Action for the Tourism Sector in the Caribbean. Consulting Engineers Partnership Ltd; Tourism Global Inc
& Franklyn Michael for Caribbean Disaster Emergency Response Agency.
CDERA. (2011). About CDERA and Country Reports. Retrieved 08/07/2011 from the Caribbean Disaster
Emergency Management Agency. http://www.cdera.org/index.php
Chadee, D. D. (2009). Impact of pre-seasonal focal treatment on population densities of the mosquito
Aedes aegypti in Trinidad, West Indies: A preliminary study. Acta Tropica, 109(3), 236-240.
Chen, A. A., Chadee, D. D. and Rawlins, S.C. (2006). Climate Change Impact on Dengue: The Caribbean
Experience: Climate Studies Group Mona, University of the West Indies.
Chen, A. A., Chin, P. N., Forrest, W., McLean, P. and Grey, C. (1994). Solar radiation in Barbados. Solar
Energy 53(5): 455-460.
Chen, A. A., Daniel, A. R., Daniel, S. T. and Gray, C. R. (1990). Wind Power in Barbados. Solar Energy 44(6):
355-365.

199
Chen, Z., Grasby, S. E. and Osadetz, K. G. (2004). Relation between climate variability and groundwater
levels in the upper carbonate aquifer, southern Manitoba, Canada. Journal of Hydrology, 290(1-2), 43-
62.
Cherrington, E.A., Ek, E., Cho, P., Howell, B.F., Hernandez, B.E. anderson, E.R., Flores, A.I., Garcia, B.C.,
Sempris, E. and D.E. Irwin. (2010a). “Forest Cover and Deforestation in Belize: 1980–2010.” Water
Center for the Humid Tropics of Latin America and the Caribbean. Panama City, Panama. 42 pp
Cherrington, E.A., Hernandez, B.E., Trejos, N.A., Smith, O.A. anderson, E.R., Flores, A.I. and B.C. Garcia.
(2010b). "Identification of Threatened and Resilient Mangroves in the Belize Barrier Reef System."
Technical report to the World Wildlife Fund. Water Center for the Humid Tropics of Latin America and
the Caribbean (CATHALAC) / Regional Visualization & Monitoring System (SERVIR). 28 pp.
Church, J. A. and N. J. White, (2006): A 20th Century acceleration in global sea level rise. Geophysical
Research Letters, 33, L01602, doi:10.1029/2005GL024826, 4pp.
Church, J. A., & White, N. J. (2006). A 20th Century acceleration in global SLR. Geophysical Research Letters,
33(1).
CIPORE. (2009). Belize. Retrieved November 2010, from Caribbean Information Portal on Renewable Energy
(CIPORE): http://cipore.org/participating-countries/belize/
Clinton, W. (2006). Lessons Learned from Tsunami Recovery: Key Propositions for Building Back Better.
Special Envoy for Tsunami Recovery. New York: United Nations.
Collins, M. and the CMIP Modelling Groups, (2005): El Nino- or La Nina-like climate change? Climate
Dyanamics, 24(1), 89-104.
Colls, A., Ash, N., & Ikkala, N. (2009). Ecosystem-based Adaptation: a natural response to climate change.
Gland, Switzerland:: IUCN.
Confalonieri, U., Menne, B., Akhtar, R., Ebi, K. L., Hauengue, M., Kovats, R. Sari, et al. (2007). Human health.
Climate Change 2007: Impacts, Adaptation and Vulnerability. Contribution of Working Group II to the
Fourth Assessment Report of the Intergovernmental Panel on Climate Change. In M.L. Parry, O.F.
Canziani, J.P. Palutikof, P.J. van der Linden & C.E. Hanson (Eds.), (pp. 391 - 431). Cambridge, UK:
Cambridge University Press.
Consejo Belize. (2011). Hurricanes and Tropical Storms Affectomg Belize since 1930. Retrieved November
2011, from Consejo Belize: http://consejo.bz/weather/storms.html
Contreras-Lisperguer, R., & de Cuba, K. (2008). The Potential Impact of Climate Change on the Energy Sector
in the Caribbean Region. Washington, D.C.: Department of Sustainable Development, Organisation of
American States (OAS).
Cooper, E., L. Burke and N. Bood. 2009. “Coastal Capital: Belize. The Economic Contribution of Belize’s Coral
Reefs and Mangroves.” WRI Working Paper. World Resources Institute, Washington DC. 53 pp. Available
online at http://www.wri.org/publications
CTA & IICA (Technical Centre for Agricultural and Rural Cooperation and Inter-American Institute for
Cooperation on Agriculture) 2007. High Level Seminar: Expanding Bio-Energy Opportunities in the
Caribbean Region. Seminar Report, October 2007.

200
CTO. (2010). 2009 Country Statistics and Analysis: Belize Caribbean Travel Organization.
CW. (2011). Consolidated Water (Belize) Limited at Ambergris Caye Service Location Info Sheet. Retrieved
05/07/2011 from Consolidated Water: http://www.cwco.com/html/AmbergrisCaya.html
Dalton, G.J., Lockington, D.A. and Baldock, T.E. (2008) Feasibility analysis of stand-alone renewable energy
supply options for a large hotel. Renewable Energy 33: 1475-1490.
Dalton, G.J., Lockington, D.A. and Baldock, T.E. (2009) Case study feasibility analysis of renewable energy
supply options for small to medium-sized tourist accommodations. Renewable Energy 34: 1134-1144.
Deitrich, A. 2006. “The Belize Coastal Tourism Project: An Assessment of the Environmental, Socio- Cultural
and Economic Impacts of Tourism in Coastal Communities in Belize.” Project Summary and
Recommendations. Kingston, RI: University of Rhode Island and the Oak Foundation.
Denby, J., J. Drake, J. Tan, M. Whittington. 2007. “Glover’s Reef Marine Reserve: Financial Sustainability
Report.” Belize City: University of California, Berkeley, WCS and USAID.
Deo, A. A., Ganer, D. W., & Nair, G. (2011). Tropical cyclone activity in global warming scenario. Natural
Hazards.
Department for Environment, Food and Rural Affairs (DEFRA) (2010).Greenhouse gas (GHG) conversion
factors. Retrieved 5/3/2011 from
http://www.defra.gov.uk/environment/business/reporting/conversion-factors.pdf
Development Solutions Ltd. (2006). Belize National Hazard Mitigation Plan. Caribbean Disaster Emergency
Response Agency and Caribbean Development Bank.
Doganis, R. (2006). The Airline Business, 2nded, London: Routledge.
Döll, P. (2002). Impact of climate change and variability on irrigation requirements: a global perspective.
Climate Change, 54, 269 - 293.
Donner, S. W.-G. (2005). Global assessment of coral bleaching and required rates of adaptation under
climate change. Global Change Biology (11), 2251-2265.
Dulal, H., Shah, K. U., & Ahmad, N. (2009). Social equity considerations in the implementation of Caribbean
climate change adaptation policies. Sustainability, 1 (3), 363-383.
Ebi, K. L., Lewis, N. D. and Corvalan, C. (2006). Climate Variability and Change and their Potential Health
Effects in Small Island States: Information for Adaptation Planning in the Health Sector. Environmental
Health Perspectives, 114(12), 1957-1963.
ECLAC, UNIFEM and UNDP. (2005). Grenada: A Gender Impact Assessment of Hurricane Ivan - Making the
Invisible Visible. Port-of-Spain, Trinidad and Tobago: Economic Commission for Latin America and the
Caribbean: Sub-regional Headquarters for the Caribbean.
ECLAC. (2006). Report on the Workshop on Damage and Loss Assessment and the Impact of Disasters in
Belize conducted by the Economic Commission for Latin America and the Caribbean.
ECLAC. (2010a). Statistical Yearbook for Latin America and the Caribbean. Santiago, Chile: United Nations.
201
ECLAC. (2010b). Economic Survey of Latin America and the Caribbean 2009-2010. Santiago, Chile: United
Nations.
EconomyWatch. (2010). Belize Economic Statistics and Indicators. Retrieved November 2010, from
EconomyWatch: http://www.economywatch.com/economic-statistics/country/Belize/
Eijgelaar, E., Thaper, C. & Peeters, P. (2010) Antarctic cruise tourism: the paradoxes of ambassadorship, last
chance tourism' and greenhouse gas emissions. Journal of Sustainable Tourism, 18 (3), 337 - 354.
Elliott, W., & Simmonds, M. (2007). Whales in hot water? The impact of a changing climate on whales,
dolphins and porpoises: a call for action. Gland Switzerland, Chippenham UK: WWF-International WDCS.
Emanuel, K. (2005). Increasing destructiveness of tropical cyclones over the past 30 years. Nature,
436(7051), 686-688.
Emanuel, K., R. Sundararajan and J. Williams, (2008): Hurricanes and global warming - Results from
downscaling IPCC AR4 simulations. Bulletin of the American Meteorological Society, 89(3), 347-367.
Energy Information Administration of the US Department of Energy (2010) - Belize Energy Profile.
http://tonto.eia.doe.gov/country/country_energy_data.cfm?fips=BH
Epstein, P. R. (2001). Climate Change and emerging infections diseases. Microbes and infection, 3, 747-754.
Epstein, P. R., Diaz, H. F., Elias, S., Grabherr, G., Graham, N. E., Martens, W. J. M., et al. (1998). Biological
and Physical Signs of Climate Change Focus on Mosquito borne Diseases. Bulletin of the American
Meteorological Society, 79(3), 409-417.
Ernst & Young. (2010). Action amid uncertainty: the business response to climate change. Retrieved
5/3/2011 from:
http://www.ey.com/Publication/vwLUAssets/Action_amid_uncertainty:_the_business_response_to_cli
mate_change/$FILE/Action_amid_uncertainty.pdf
EurActiv (2009) EU carbon tax on new Commission’s agenda early next year – 11.4.2009. Retrieved
5/3/2011 from http://www.euractiv.com/en/climate-change/eu-carbon-tax-new-commission-agenda-
early-year/article-187029
Fang, H., Cheng, Y. and Songkai, Y. (2011). Optimization on Water Resource System Operation Policy during
Drought. Journal of Water Resource and Protection, 03(02), 140-146.
Fedler, A. 2008. “Economic Impact of Recreational Fishing for Bonefish, Permit and Tarpon in Belize for
2007.” Gainesville FL: Human Dimensions Consulting and Friends of Turneffe Atoll.
Food and Agriculture Organization of the United Nations (FAO). (2000). FAO Country Profiles – AQUASTAT
for Belize. Retrieved 08/07/2011 from
http://www.fao.org/nr/water/aquastat/countries/belize/index.stm
Food and Agriculture Organization of the United Nations (FAO). 2005. Fishery and Aquaculture country
profile: Belize. Online at: http://www.fao.org/fishery/countrysector/FI-CP_BZ/en Gibson, J and S. Hoare.
2006. “Preliminary Results of a Long-term, Fishery-Independent Monitoring Program at Glover’s Reef
Marine Reserve.” Wildlife Conservation Society (WCS), Belize City, Belize.

202
Food and Agriculture Organization. (2011). Country Programming Framework for Belize: 2011 – 2012.
Belmopan City: FAO.
Forest Department. (2000). Belize's First National Report on the Implementation of the United Nations
Convention to Combat Desertification (UNCCD). Belmopan, Belize: Forest Department, Ministry of
Natural Resources, Environment and Industry.
Francis, B.M., Moseley, L. and Iyare, S. O. (2007). Energy consumption and projected growth in selected
Caribbean countries. Energy Economics 29: 1224-1232.
Frei, C., Schiir, C., Liithi, D. and Davies, H. C. (1998). Heavy precipitation processes in a warmer climate.
Geophysical Research Letters, 25(9), 1431 - 1434.
Frutos, R. (2003). Progress and Constraints in Developing Integrated Water Resources Management in
Belize. Hydrology Unit, National Meteorological Service of Belize. Retrieved 04/07/2011 from
http://www.hydromet.gov.bz/Hydrological_Report.htm
German Advisory Council. (2007). World in Transition: Climate Change as a Security Risk. Berlin, Germany:
German Advisory Council on Global Change.
GFDRR. (2010). Disaster Risk Management in Latin America and the Caribbean Region: GFDRR Country
Notes, Belize. Washington, USA: Global Facility for Disaster Reduction and Recovery.
GGCA. (2009). Training Manual on Gender and Climate Change. International Union for Conservation of
Nature (IUCN), United Nations Development Programme (UNDP) and the Global Gender and Climate
Alliance (GGCA).
Gibson, J. (ed.) and D. Lizama. (2006). “Report on the Socio-economic Monitoring Survey for Glover’s Reef
Atoll, Belize.” Belize City: Wildlife Conservation Society (WCS), USAID and the Belize Audubon Society.
Gibson, J., D. Lizama and R. Pomeroy. (2005). “Establishing a Socio-economic Monitoring Program for
Glover’s Reef Atoll, Belize.” Wildlife Conservation Society (WCS), Belize City, Belize.
Giddens, A. (2009). The Politics of Climate Change. Cambridge, UK: Polity Press.
Gillett, V. (2003). The Fisheries of Belize. Fisheries Centre Research Reports. 11(6): 141-147.
Githeko, A. K. and A.Woodward. (2003). International consensus on the science of climate and health: the
IPCC Third Assessment Report. In A.J. McMichael, D.H. Campbell-Lendrum, C.F. Corvalán, K.L. Ebi, A.K.
Githeko, J.D. Scheraga and A. Woodward (Eds.), Climate Change and Human health Risks and Responses
(pp. 43-57). Geneva: World Health Organization
Global Humanitarian Forum. (2009). GHF-GE.org. Retrieved April 29, 2011, from Human Impact Report -
Climate Change: http://www.ghf-geneva.org/Portals/0/pdfs/2009forumreport.pdf
Gössling, S. (2005). Tourism's contribution to global environmental change: space, energy, disease and
water. In J. Higham C. M. Hall (Ed.), Aspects of Tourism: Tourism, recreation and climate change (pp. 286
- 295).
Gössling, S. (2010). Carbon Management in Tourism: Mitigating the Impacts on Climate Change. London:
Routledge.
203
Gössling, S. and Schumacher, K. (2010). Implementing carbon neutral destination policies: issues from the
Seychelles. Journal of Sustainable Tourism 18(3), 377-391.
Gössling, S. and Upham, P. (2009). Introduction: Aviation and Climate Change in Context. In Gössling, S. and
Upham, P. (eds) Climate Change and Aviation. Earthscan, pp. 1-23.
Gössling, S., Peeters, P. and Scott, D. (2008).Consequences of climate policy for international tourist arrivals
in developing countries.Third World Quarterly, 29(5): 873-901.
Gössling, S., Peeters, P., Ceron, J.-P., Dubois, G., Pattersson, T. and Richardson, R. (2005).The Eco-efficiency
of tourism.Ecological Economics 54(4): 417-434.
Government of Belize. (2000). Disaster Preparedness and Response Act Chapter 145. Belmopan:
Government Printer, Government of Belize.
Government of Belize. (2002). First National Communication to the Conference of the Parties of the United
Nations Framework Convention on Climate Change: Ministry of Natural Resources, the Environment,
Commerce and Industry, Government of Belize.
Government of Belize. (2003). Belize Building Act. Belmopan: Government of Belize.
Government of Belize. (2008). Government of Belize Policy on Adaptation to Global Climate Change - Draft.
Belize: Government of Belize.
Government of Belize. (2009). Government of Belize Budget Estimates – 2009/2010 Budget Presentation.
Retrieved 13/07/2011 from the Government of Belize: http://www.belize.gov.bz
Government of Belize. (2010a). 2009 Country Poverty Assessment Volume 1. Main Report: National Human
Development Advisory Committee, Ministry of Economic Development, Commerce and Industry and
Consumer Protection, Government of Belize.
Government of Belize. (2010b). Belize Basic Health Indicators 2009: Office of the Director of Health
Services, The Epidemiology Unit, Ministry of Health, Government of Belize.
Government of Belize. (2010c). Recovery Today, Prosperity Tomorrow Budget Presentation for the Fiscal
Year 2010/2011 Presented by the Hon. Dean Barrow Prime Minister and Minister of Finance Belmopan
Monday, 15 March, 2010: Ministry of Finance, Government of Belize.
Government of Belize. (2011). Belize Second National Communication to the Conference of the Parties of
the United Nations Framework Convention on Climate Change. Belmopan: Ministry of Natural Resources
and the Environment.
Graham, R., R. Carcamo, K. Rhodes, C. Roberts and N. Requena. 2007. Historical and contemporary
evidence of a mutton snapper (Lutjanus analis Cuvier, 1828) spawning aggregation fishery in decline.
Coral Reefs. 27(2): 311-319(9).
Green, E. D. (2000). Belize’s First National Report on the Implementation of the United Nations Convention
to Combat Desertification. (UNCCD). Belmopan: Forest Department, Ministry of Natural Resources,
Environment & Industry.

204
Green, E. D. (2000). Belize’s First National Report On The Implementation Of The United Nations
Convention To Combat Desertification (UNCCD). Forest Department - Ministry of Natural Resources,
Environment and Industry. Belmopan, Belize.
Green, E. D. (2007). Climate Change and National Food Security. Belmopan: Caribbean Community Climate
Change Centre.
Gubler, D. J. (2002). Epidemic dengue dengue hemorrhagic fever as a public health problem. TRENDS in
Microbiology 10(2), 100-103.
Gulf and Caribbean Fisheries Institute (GCFI) On-line Resources for Lionfish:
http://www.gcfi.org/Lionfish/Lionfish.html
GWI. (2011). Pinsent Masons Water Yearbook 2010-2011: Part II- Country Analysis- Belize. Retrieved
07/07/2011 from Global Water Intelligence. Available online at
http://www.globalwaterintel.com/pinsent-masons-yearbook/2010-2011/part2/
Halcrow Group Limited. (2010). Country Poverty Assessment: Final Report Volume 1. Main Report. London,
UK: Halcrow Group Limited.
Hales, S., Weinstein, P. and Woodward, A. (1996). Dengue fever epidemics in the South Pacific: driven by El
Nino Southern Oscillation? The Lancet, 348(9042), 1664-1665.
Hales, S., Wet, N. de, Maindonald, J. and Woodward, A. (2002). Potential effect of population and climate
changes on global distribution of dengue fever. The Lancet 360(9336), 830-834.
Hall, C.M., Scott, D. and Gössling, S. (2009). Tourism, development and climate change. In: D'Mello, C.,
Minninger, S. and McKeown, J. (eds) Disaster Prevention in Tourism - Climate Justice and Tourism.
Chiang Mai: Ecumenical Coalition on Tourism and German Church Development Service (EED), pp. 136-
161.
Hall, T. M., Waugh, D. W., Haine, T. W., Robbins, P. E., & Khatiwala, S. (2004). Estimates of anthropogenic
carbon in the Indian Ocean with allowance for mixing and time varying air-sea CO2 disequilibrium.
Global Biogeochemical Cycles , 18.
Hallock, P. (2005). Global Climate Change and Modern Coral Reefs New opportunities to understand
shallow-water carbonate depositional processes. Sedimentary Geology, 175 (1-4), 19-33.
Hamilton, J. M. and Tol, R. S.J. (2004). The impact of Climate Change on Tourism and Recreation. Working
Papers FNU-52. Research Unit Sustainability and Global Change, Centre for Marine and Climate
Research, University of Hamburg. Hamburg.
Haraksingh, I. (2001). Renewable energy policy development in the Caribbean. Renewable Energy, 24: 647-
655.
Harvey, M. and Pilgrim, S. (2011). The new competition for land: food, energy and climate change. Food
Policy 36, Supplement 1: S40-S51.
Hasegawa, A. and S. Emori, (2005): Tropical cyclones and associated precipitation over the western North
Pacific: T106 atmospheric GCM simulation for present-day and doubles CO2 climates. Scientific Online
Letters on the Atmosphere, 1, 145-148.
205
Headley, O.St.C. (1998). Solar thermal applications in the West Indies. Renewable Energy 15: 257-263.
Heyman, W. and R. Graham (eds). 2000. “The Voice of the Fishermen of Southern Belize.” Punta Gorda,
Belize: Toledo Institute for Environment and Development (TIDE).
Hickman, R., & Banister, D. (2007). Looking over the horizon: Transport and reduced CO2 emissions in the
UK by 2030. Transport Policy, 14 (5), 377-387.
HM Revenue & Customs.(2008). Air Passenger Duty – introduction. Retrieved 5/3/2011 from
http://customs.hmrc.gov.uk/channelsPortalWebApp/channelsPortalWebApp.portal?_nfpb=true&_page
Label=pageExcise_InfoGuides&id=HMCE_CL_001170&propertyType=document
Hofmann, G. E., Barry, J. P., Edmunds, P. J., Gates, R. D., Hutchins, D. A., Klinger, T., et al. (2010). The effect
of ocean acidification on calcifying organisms in marine ecosystems: An organism-to-ecosystem
perspective. Annual Review of Ecology Evolution and Systematics, 41, 127 -147.
Holder, G. (2009). Good Practices Implementation Plan for DRR, Belize. Rome: FAO.
Hopkins, J. .J., Allison, H. M., Walmsley, C. A., Gaywood, M. and Thurgate, G. (2007). Conserving biodiversity
in a changing climate: Guidance on building capacity to adapt. UK: DEFRA, on behalf of the UK
Biodiversity Partnership
Hopp, M. J. and Foley, J. A. (2001). Global Scale Relationships Between Climate and The Dengue Fever
Vector, Aedes Aegypti. Climate Change, 48, 441-463.
Horton, R., C. Herweijer, C. Rosenzweig, J. Liu, V. Gornitz and A. C. Ruane, (2008): Sea level rise projections
for current generation CGCMs based on the semi-empirical method. Geophysical Research Letters, 35,
L02715
Hsieh, Y. H. and Chen, C. W. S. (2009). Turning points, reproduction number and impact of climatological
events for multi-wave dengue outbreaks. Tropical Medicine & International Health, 14(6), 628-638.
Hu, A., Meehl, G., Han, W., & Yin, J. (2009). Transient response of the MOC and climate to potential melting
of the Greenland Ice Sheet in the 21st Century. Geophysical Research Letters, 36, L10707.
Huitric, M. 2005. Lobster and conch fisheries of Belize: A history of sequential exploitation. Ecology and
Society. 10 (1): 21. Online at: http://www.ecologyandsociety.org/vol10/iss1/art21/
Hyde, K. M., Maier, H. R. and Colby, C. B. (1994). Water-Supply operations during drought Journal of Water
Resources Planning and Management, 120(5), 613 - 629.
IATA (2007) New IATA Financial Forecast Predicts 2008 Downturn. International Air Transport Association.
Retrieved 2/8/2008 from: http://www.iata.org/pressroom/pr/2007-12-12-01.
IATA (2008). Jet Fuel Price Monitor. International Air Transport Association. Retrieved 2/8/2008 from:
http://www.iata.org/whatwedo/economics/fuel_monitor/index.htm.
IATA (2009) The IATA Technology Roadmap Report. International Air Transport Association. Retrieved
5/3/2011 from
http://www.iata.org/SiteCollectionDocuments/Documents/Technology_Roadmap_May2009.pdf.
IEA. (2009). World Energy Outlook 2009. Paris: International Energy Agency.
206
IEA. (2010). Press Release: Recent policy moves a start, but much stronger action is needed to accelerate the
transformation of the global energy system, says the IEA's latest World Energy Outlook. Retrieved 5.3.2011
from http://www.iea.org/press/pressdetail.asp?PRESS_REL_ID=402
IFAD. (2008). Belize Community-initiated Agriculture and Resource Management Project Completion
Evaluation. Rome: International Fund for Agricultural Development.
IPCC. (2001). Climate change 2001: impacts, adaptation and vulnerability. Contribution of Working Group II
to the Third Assessment Report of the Intergovernmental Panel on Climate Change, edited by J. J.
McCarthy, O. F. Canziani, N. A. Leary, D. J. Dokken and K. S. White (eds). Cambridge University Press,
Cambridge, UK and New York, USA,
IPCC. (2007a). Summary for Policymakers. In S. Solomon, D. Qin, M. Manning, Z. Chen, M. Marquis, K.
Averyt, et al., Climate Change 2007: The Physical Science Basis. Contribution of Working Group I to the
Fourth Assessment Report of the Intergovernmental Panel on Climate Change. Cambridge, United
Kingdom and New York, NY, USA: Cambridge University Press.
IPCC. (2007b). Climate Change 2007: Impacts, Adaptation and Vulnerability. In M. Parry, O. Canziani, J.
Palutikof, P. van der Linden, & H. C.E., Contribution of Working Group II to the Fourth Assessment Report
of the Intergovernmental Panel on Climate Change. Cambridge, UK: Cambridge University Press.
IPCC. (2007c). Fourth Assessment Report, Climate Change 2007: Synthesis Report, An Assessment of the
Intergovernmental Panel on Climate Change. Cambridge, UK: Cambridge University Press.
ISDR. (2005). Hyogo Framework for Action 2005-2015: Building the Resilience of Nations and Communities
to Disaster. Kobe, Japan: International Strategy for Disaster Reduction.
Jelinek, T. (2000). Dengue fever in international travelers. Clinical Infectious Diseases, 31, 144-147.
Jevrejeva, S., Moore, J., & Grinsted, A. (2008). Recent Global Sea Level Acceleration Started over 200 years
ago? Geophysical Research Letters , 35, L08715.
Kambon, A. (2005). Caribbean Small States, Vulnerability and Development (WP/2005/3). Paper presented
at the sixth Annual Sir Arthur Lewis Institute of Social and Economic Studies (SALISES) conference:
Governance, Institutions and Economic Growth: Reflections on W. Arthur Lewis' Theory of Economic
Growth. Kingston, Jamaica: University of the West Indies, Mona Campus.
Kambon, A., Hendrickson, M., Little, V., Smith, D., Gay, D., Blommestein, E., et al. (2011). Macro socio-
economic and environmental assessment of the damage and losses caused by Hurricane Tomas: A geo-
environmental disaster towards resilience. Port Of Spain: ECLAC.
Karanjac, J. (2004). Seawater Intrusion in Coastal Aquifers – A Danger to Sustainable Water Supply and
Economy of the Island Countries. Paper presented at the BALWOIS, First International Conference on
Water Observation and Information System for Decision Support, Ohrid, FY Republic of Macedonia, 25-
29th May, 2004.
Kettle, K. C., Hogan, C., & Saul, L. (n.d.). Climate Change and Poverty. South-east Asian Ministers of
Education Organization (SEAMEO).
Kishore, R., J. Finlay, M. Clarke-Marshall, H. Ramsundar, G. de Souza and H. Heylock. 2006. “Political
organisation and socio-economics of fishing communities in Trinidad and Tobago, Grenada and Belize.”
Chapter 7 in Y. Breton et al. (eds.). Coastal Resource Management in the Wider Caribbean. Resilience,
207
Adaptation and Community Diversity. Ian Randle/IDRC. Online at: http://www.idrc.ca/en/ev-102785-
201-1- DO_TOPIC.html
Knutson, T. R. and R. E. Tuleya. 2004. Impact of CO2-induced warming on simulated hurricane intensity and
precipitation: Sensitivity to the choice of climate model and convective parameterization. Journal of
Climate, 17(18), 3477-3495.
Knutson, T. R., J. J. Sirutis, S. T. Garner, G. A. Vecchi and I. M. Held, (2008): Simulated reduction in Atlantic
hurricane frequency under twenty-first-century warming conditions. Nature Geoscience 1(6), 359-364.
Kossin, J. P., K. Knapp, D. J. Vimont, R. J. Murnane and B. A. Harper, (2007): A globally consistent reanalysis
of hurricane variability and trends. Geophysical Research Letters, 34(4), 6pp.
Kramer P.A. and P.R. Kramer (2000). “Ecological status of the Mesoamerican Barrier Reef: impacts of
Hurricane Mitch and 1998 coral bleaching.” Final report to the World Bank.
Krauss, N., & McDougal, W. (1996). The effects of sea-walls on the Beach: an updated literature review.
Journal of Coastal Research, 12(3), 691-701.
Lambert, E., Hunter, C., Pierce, G. J., & MacLeod, C. D. (2010). Sustainable whale-watching tourism and
climate change: towards a framework of resilience. Journal of Sustainable Tourism, 18 (3), 409-427.
Lasco, R., Cruz, R., Pulhin, J., & Pulhin, F. (2006). Tradeoff analysis of adaptation strategies for natural
resources, water resources and local institutions in the Philippines. Washington: International START
Secretariat.
Lee, D.S., Fahey, D.W., Forster, P.M., Newton, P.J., Wit, R.C.N., Lim, L.L., Owen, B. and Sausen, R. (2009).
Aviation and global climate change in the 21st Century. Atmospheric Environment 43:3520–3537.
Lewsey, C., Cid, G. and Kruse, E. (2004). Assessing climate change impacts on coastal infrastructure in the
Eastern Caribbean. Marine Policy, 28(5), 393-409.
Lindberg, K. 2001. “Visitors to Belize’s Marine Protected Areas: Characteristics, Evaluations and
Responsiveness to Entrance Fees.” Report of the 2001 visitor survey conducted as part of the TIES/PFB
MPA Revenue Generation Project funded by the Summit Foundation.
Linham, M., & Nicholls, R. (2010). Technologies for Climate Change adaptation – Coastal Erosion and
Flooding. TNA Guidebook Series, University of Southampton.
Lorde, T., Waithe, K. and Francis, B. (2010). The importance of electrical energy for economic growth in
Barbados. Energy Economics 32: 1411-1420.
Luers, A.L. and S.C. Moser (2006). Preparing for the Impacts of Climate Change in California: Advancing the
Debate on Adaptation. Report prepared for the California Energy Commission, Public Interest Energy
Research Program and the California Environmental Protection Agency, Sacramento, CA, CEC-500-2005-
198-SF
Mann, M. E., J. D. Woodruff, J. P. Donnelly and Z. Zhang, (2009): Atlantic hurricanes and climate over the
past 1500 years. Nature, 460, 880-883.
Martens, W. J. M., Jetten, T. H. and Focks, D. A. (2007). Sensitivity of Malaria, Schistosomiasis and Dengue
to Global Warming. Climate Change, 35, 145-156.
208
Martin, D. & Manzano, O. (2010) Towards a Sustainable and Efficient State - The Development Agenda of
Belize. Managua: Inter-American Development Bank.
Mayor, K. and Tol, R.S.J. (2007). The impact of the UK aviation tax on carbon dioxide emissions and visitor
numbers. Transport Policy 14: 507-513.
Mayor, K. and Tol, R.S.J. (2008). The impact of the EU-US Open Skies agreement on international travel and
carbon dioxide emissions. Journal of Air Transport Management 14: 1-7.
Mayor, K. and Tol, R.S.J. (2009). Aviation and the environment in the context of the EU-US Open Skies
agreement. Journal of Air Transport Management 15: 90-95.
Mayor, K. and Tol, R.S.J. (2010a). Scenarios of carbon dioxide emissions from aviation. Global
Environmental Change 20: 65-73.
Mayor, K. and Tol, R.S.J. (2010b). The impact of European climate change regulations on international
tourist markets. Transportation Research Part D - Transport and Environment 15: 26-36.
McAller, M., Shareef, R. and da Veiga, B. (2005). Managing Daily Tourism Tax Revenue Risk for the Maldives
Retrieved 5/3/2011 from http://www.mssanz.org.au/modsim05/papers/mcaleer.pdf
McField M., N. Bood, A. Fonseca, A. Arrivillaga, A.F. Rinos and R.M. Loreto Viruel 2008. “Status of the
Mesoamerican Reef after the 2005 coral bleaching event.” Chapter 5 in C. Wilkinson and D. Souther
(eds.). Status of Caribbean coral reefs after bleaching and hurricanes in 2005. Townsville, Australia:
Global Coral Reef Monitoring Network and Reef and Rainforest Research Centre.
McField, M. and N. Bood. 2007. “Our reef in peril – Can we use it without abusing it?” Chapter 6 in B.
Balboni and J. Palacio (eds). Taking stock: Belize at 25 years of Independence: Economy, Environment,
Society and Culture.
McLeod, E., & Salm, R. V. (2006). Managing Mangroves for Resilience to Climate Change. Gland,
Switzerland: IUCN.
McSweeney, C., New M. and Lizcano. G. (2011). UNDP Climate Change Country Profiles: Belize. Retrieved
11/07/2011 from http://country-profiles.geog.ox.ac.uk/
Meade, B. And Pringle, J. (2001). Environmental Management Systems for Caribbean Hotels and Resorts: A
Case Study of Five Properties in Barbados. Journal of Quality Assurance in Hospitality and Tourism 2(3):
149-159.
Meehl, G. A., C. Covey, T. Delwoth, M. Latif, B. McAvaney, J. F. B. Mitchell, R. J. Stouffer and K. E. Taylor,
(2007a): The WCRP CMIP3 multi-model dataset: A new era in climate change research. Bulletin of the
American Meteorological Society, 88, 1383-1394.
Meehl, G. A., T. F. Stocker, W. D. Collins, P. Friedlingstein, A. T. Gaye, J. M. Gregory, A. Kitoh, R. Knutti, J. M.
Murphy, A. Noda, S. C. B. Raper, I. G. Watterson, A. J. Weaver and Z.-C. Zhao, (2007b): Global climate
projections. In: Climate Change 2007: The Physical Science Basis. Contribution of Working Group I to the
Fourth Assessment Report of the Intergovernmental Panel on Climate Change. Solomon, S., D. Qin, M.
Manning, Z. Chen, M. Marquis, K. B. Averyt, M. Tignor and H. L. Miller, (eds.), Cambridge University
Press, Cambridge, United Kingdom and New York, NY, USA.
209
Meerman, J. & Cherrington, E. (2005). Preliminary Survey of Land Degradation in Belize. Belmopan: Ministry
of Natural Resources, Local Government & the Environment.
Merrill, R. (2010). Ministry of Agriculture and Fisheries 2010 Annual General Meeting Report. Cayo District:
Ministry of Agriculture and Fisheries.
Mimura, N., Nurse, L., McLean, R., Agard, J., Briguglio, P., Payet, R., et al. (2007). Small Islands. Climate
Change 2007: Impacts, Adaptation and Vulnerability. In M. Parry, O. Canziani, J. Palutikof, P. van der
Linden, & H. C.E., Contribution of Working Group II to the Fourth Assessment Report of the
Intergovernmental Panel on Climate Change (pp. 687-716). Cambridge, United Kingdom: Cambridge
University Press.
Min, S., Zhang, X., Zwiers, F. W. and Hegerl, G. C. (2011). Human contribution to more-intense precipitation
extremes. Nature, 470(7334), 378-381.
Ministry of Agriculture and Fisheries. (2009). Agricultural Development Management and Operational
Strategy (TCP/BELIZE/2003A). Belize City: MOAF.
Ministry of Natural Resources and the Environment. (2007). National Emergency Management Organization
Damage Assessment and Needs Analysis - Preliminary Report Version 3, Hurricane Dean, Belize. Belize
City: Ministry of Natural Resources and the Environment.
MONRECI. (2002). First National Communication to the Conference of the Parties of the United Nations
Framework Convention on Climate Change. Belize: Ministry of Natural Resources, the Environment,
Commerce and Industry, Government of Belize.
Moreno, A. R. (2006). Climate change and human health in Latin America: drivers, effects and policies.
Regional Environmental Change, 6(3), 157-164.
Mustafa, D. & Reeder, P. (2009). ‘People Is All That Is Left to Privatize’: Water Supply Privatization,
Globalization and Social Justice in Belize City, Belize. International Journal of Urban and Regional
Research, 33(3), 789-808.
National Meteorological Service. (2011). Retrieved 11/14/2011, from Belize National Meteorological
Service: http://www.hydromet.gov.bz/
Neal, D., Ariola, E., Muschamp, W. (2008). Vulnerability Assessment of the Belize Coastal Zone - Enabling
Activities for the preparation of Belize’s Second National Communication (SNC) to the United Nations
Framework Convention on Climate Change (UNFCCC) Project. Available on the CCCCC website.
Nelson, V. (2010). Investigating energy issues in Dominica’s accommodations. Tourism and Hospitality
Research 10(4): 345-358.
NEMO. (2010a). Damage Assessment and Needs Analysis Hurricane Richard: Initial Situation Assessment
Report. National Emergency Management Office.
NEMO. (2010b). Damage Assessment and Needs Analysis: Initial Damage Assessment Report Hurricane
Richard. Belize City: National Emergency Management Organization.
NEMO. (2011). Belize National Emergency Management Organization - About us and District Organizations.
Retrieved 12/07/2011 from the National Emergency Management Organization:
http://www.nemo.org.bz/
210
NEMO. (2011). Belize National Emergency Management Organization. Retrieved 11/14/2011, from
http://www.nemo.org.bz/
Nicholls, R., & Mimura, N. (1998). Regional issues raised by sea-level rise and their policy implications.
Climate Research, 11(1), 5-18.
Nicholls, R.J., P.P. Wong, V.R. Burkett, J.O. Codignotto, J.E. Hay, R.F. McLean, S. Ragoonaden and C.D.
Woodroffe. (2007). Coastal systems and low-lying areas. Climate Change 2007: Impacts, Adaptation and
Vulnerability. Contribution of Working Group II to the Fourth Assessment Report of the
Intergovernmental Panel on Climate Change, M.L. Parry, O.F. Canziani, J.P. Palutikof, P.J. van der Linden
and C.E. Hanson, Eds., Cambridge University Press, Cambridge, UK, 315-356.
NMS. (2011). The Mission of the National Meteorological Services. Retrieved 07/07/2011 from the National
Meteorological Services: http://www.hydromet.gov.bz
NMS. (n.d.). The Climate of Belize. Retrieved May 27, 2011, from Belize National Meteorological Service:
http://www.hydromet.gov.bz/Climate_Summary.htm
NPDC. (2004). Belize National Hazard Mitigation Policy. Belmopan: National Policy Development
Committee, Government of Belize, Caribbean Disaster Emergency Response Agency and Caribbean
Development Bank.
Nygren, E., Aleklett, K. & Höök, M. (2009). Aviation fuel and future oil production scenarios. Energy Policy
37 (10), 4003-4010.
OECD and UNEP. (2011). Sustainable Tourism Development and Climate Change: Issues and Policies.
Organization of Economic Co-operation and Development (OECD) and United Nations Environment
Programme (UNEP). Paris: OECD.
OECD. (2009).The Economics of Climate Change Mitigation. Paris: Organization of Economic Co-operation
and Development.
OECD. (2010).Taxation, Innovation and the Environment. Paris: Organization of Economic Co-operation and
Development.
Oouchi, K., J. Yoshimura, H. Yoshimura, R. Mizuta, S. Kusunoki and A. Noda, (2006): Tropical cyclone
climatology in a global-warming climate as simulated in a 20 km-mesh global atmospheric model:
Frequency and wind intensity analyses. Journal of the Meteorological Society of Japan 84(2), 259-276.
Organization of American States (OAS). (2002). Atlas of Probable Storm Effects in the Caribbean Sea.
Washington DC: USAID Office of Foreign Disaster Assistance and the Caribbean Regional Program.
Online at: http://www.oas.org/CDMP/document/reglstrm/index.htm.
Organization of American States (OAS). (2009). Feasibility Study on the Cellulosic Ethanol Market Potential
in Belize. March 2009.
Organisation of American States (OAS). (2011). Towards a National Energy Policy: Assessment of the Belize
Energy Sector. Department of Sustainable Development of the Executive Secretariat for Integral
Development of the Organization of American States.
Orlove, B. (2005). Human adaptation to climate change: a review of three historical cases and some general
perspectives. Environmental Science and Policy, 8, 589-600.

211
Orr, J. et al. 2005. “Anthropogenic ocean acidification over the twenty-first century and its impact on
calcifying organisms.” Nature 437 (29): 681-686. Pendleton, L. (ed.). 2008. “The Economic and Market
Value of Coasts and Estuaries: What’s at Stake?”
PAHO. (2008). Health in the Americas, 2007. Volume II - Belize. Washington D. C.: Pan American Health
Organization.
Parry, M., Arnell, N., Berry, P., Dodman, D., Fankhauser, S., Hope, C., et al. (2009). Assessing the Coasts of
Adaptation to Climate Change: A Review of the UNFCCC and Other Recent Estimate. London, UK:
International Institute for Environment and Development and Grantham Institute for Climate Change.
Patel, S. (2006). Climate science: A sinking feeling. Nature, 440, 734-736.
Patz, J. A., McGeehin, M. A., Bernard, S. M., Ebi, K. L., Epstein, P. R., Grambsch, A., et al. (2000). The
potential health impacts of climate variability and change for the United States. Executive summary of
the report of the health sector of the U.S. National Assessment. Environmental Health Perspectives,
108(4), 367-376.
Peninsula Citizens for Sustainable Development (PCSD). (2011). Environmental threats and Challenges in
Tourism. Retrieved 13/07/2011 from http://www.saveourpeninsula.org/tourism/tourism.html
Pentelow, L. and Scott, D. (2010). The Implications of Climate Change Mitigation Policy and Oil Price
Volatility for Tourism Arrivals to the Caribbean. Tourism and Hospitality Planning and Development, 7(3):
301-315.
PH. (2011). Paradise Hunter website – Belize phones and utilities information. Retrieved 07/07/2011 from
Paradise Hunter: http://www.paradisehunter.com/CountryInformation/Belize/Living-There/Phones-
%26-Utilities
Pimentel, D., Houser, J., Preiss, E., White, O., Fang, H., Mesnick, et al. (1997). Water resources: agriculture
the environment and society. Bioscience 47(2), 97 - 106.
Poesen, J., Nachtergaele, J., Verstraeten, G. andValentin, C. (2003). Gully erosion and environmental change
- importance and research needs. Catena 50(4-2), 91 - 133.
PricewaterhouseCoopers. (2010). Appetite for Change. Global business perspectives on tax and regulation
for a low carbon economy. Retrieved 5/3/2011 from www.pwc.com/appetiteforchange
Public Utilities Commission. (2003a). Energy for Sustainable Development. Toward a National Energy
Strategy for Belize. Energy Sector Diagnostic. November 5, 2003.
Public Utilities Commission. (2003b). Formulation of a National Energy Plan for Belize. Energy Policy
Recommendations. UNDP, Public Utilities Commission. December 2003.
PUC. (2011). About-Publications. Retrieved 07/07/2011 from the Public Utilities Commission:
http://www.puc.bz/
Rahmstorf, S., (2007): A semi-empirical approach to projecting future sea level rise. Science, 315 (5810),
368-370.

212
Rappaport, E. N., Fernandez-Partagas, J., & Beven, J. (1997). The Deadliest Tropical Atlantic Cyclones, 1492-
1996. Retrieved November 2011, from National Hurricane Center - National Oceanic and Atmospheric
Administration: http://www.nhc.noaa.gov/pastdeadlyappref.shtml?text
Rathcke, B., & Landry, C. (2003). Dispersal and recruitment of White Mangrove on San Salvador Island,
Bahamas after Hurricane Flloyd. In D. L. Smith, S. Smith, & V. J. Voegeli (Ed.), Proceedings of the ninth
symposium on the natural history of The Bahamas (pp. 34-40). San Slavador, Bahamas: Gerace Research
Centre.
Rawlins, S. C., Hinds, A. and Rawlins, J. M. (2008). Malaria and vectors in the Caribbean: The continuing
challenge of the disease forty-five years after eradication from the islands. West Indian Medical Journal,
57(5), 462-469.
Research and Policy Unit. (2011). Economic & Social Review 2010. Castries, Saint Lucia: Ministry of Finance,
Economic Affairs and National Development, Government of Saint Lucia.
Richardson, R. (2007). Tourism in Belize Vulnerability and Capacity Assessment. Michigan, USA: Michigan
State University
Rigau-Pérez, J. G., Clark, G. G., Gubler, D. J., Reiter, P., Sanders, E. J. and Vorndam, A. V. (1998). Dengue and
dengue haemorrhagic fever. The Lancet, 352(9132), 971-977.
Rignot, E. and P. Kanagaratnam, (2006): Changes in the velocity structure of the Greenland Ice Sheet.
Science, 311(5763), 986-990.
Rothengatter, W. (2009). Climate Change and the Contribution of Transport: Basic Facts and the Role of
Aviation. Transportation Research, Part D, Transport and Environment, 15(1): 5–13.
Sanford, C. (2004). Urban medicine: threats to health of travelers to developing world cities. Journal of
travel medicine, 11(5), 313-327.
Scanlon, B. R., Reedy, R. C., Stonestrom, D. A., Prudic, D. E. and Dennehy, K. F. (2005). Impact of land use
and land cover change on groundwater recharge and quality in the southwestern US. Global Change
Biology, 11(10), 1577-1593.
Schiff, A. and Becken, S. (2010). Demand elasticity estimates for New Zealand tourism. Tourism
Management 32(3): 564-575.
Scott, D., Peeters, P., & Gössling, S. (2010). Can tourism 'seal the deal'of its mitigation commitments? The
challenge of achieving 'aspirational'emission reduction targets. Journal of Sustainable Tourism , 18 (2).
Shih, J. and Revelle, C. (1994). Water supply operations during drought: Continuous Hedging Rule. Journal
of Water Resources Planning and Management, 120(5), 613 - 629.
Silvester, R., & Hsu, J. (1993). Coastal Stabilization-Innovative Concepts. New Jersey: Prentice Hall.
Simpson, M., Gossling, S., & Scott, D. (2008). Report on the International Policy and Market Response to
Global Warming and the Challenges and Opportunities that Climate Change Issues Present for the
Caribbean Tourism Sector. Barbados: Caribbean Regional Sustainable Tourism Development Programme,
Caribbean Tourism Organisation.
213
Simpson, M., Scott, D., Harrison, M., Sim, R., Silver, N., O’Keeffe, E., et al. (2010). Quantification and
Magnitude of Losses and Damages Resulting from the Impacts of Climate Change: Modelling the
Transformational Impacts and Costs of Sea Level Rise in the Caribbean (Full Document). United Nations
Development Programme (UNDP), Barbados, West Indies.
Singh, R. H., Rankine, L.B., & Seepersad, G. (2005). A Review of Agricultural Policies: CASE STUDY OF BELIZE.
Report Prepared for the CARICOM Secretariat. St. Augustine: UWI.
Spalding, M., Ravilious, C., & Green, E. (2001). World Atlas of Coral Reefs. UNEP Word Conservation
Monitoring Centre. Berkeley, USA: University of California Press.
Statistical Institute of Belize (2008). Labour Force by Industry and Sex and Occupation by Sex. Retrieved
11/07/2011. Available at http://www.statisticsbelize.org.bz/
Statistical Institute of Belize (SIB). (2010). 2010 Population Census. Retrieved 11/07/2011. Available at
http://www.statisticsbelize.org.bz/
Statistical Institute of Belize. (2011). Document Managment System. Retrieved May 27, 2011, from
Statistical Institute of Belize:
http://www.statisticsbelize.org.bz/dms20uc/dynamicdata/docs/20110511165337_2.pdf
Stern, N. (2006). The Economics of Climate Change. Cambridge, UK: Cambridge University Press.
Sterner, T. (2007) Fuel taxes: An important instrument for climate policy. Energy Policy 35: 3194-3202.
Tapiador, F. J., (2008): Hurricane footprints in Global Climate Models. Entropy, 10(4), 613-620.
Tester, P. A., Feldman, R. L., Naua, A., Kibler, S. R., & Litaker, R. W. (2010). Ciguatera fish poisoning and sea
surface temperatures in the Caribbean Sea and the West Indies. Toxicon , 698-710.
The Belize Audubon Society. (2008). An Environmental Agenda for Belize 2008–2013. Belize City: BAS.
The World Bank. (2009). Belize Rapid Assessment of Agricultural Risks. Washington: World Bank.
Titus, V. (2007). Building Permit Requirements in Belize. Retrieved 11/16/2011, from Consejo Belize:
http://consejo.bz/building_in_belize/permit.html
Tollner, E. (Topic Editor). (2007). Water profile of Belize. In: Encyclopedia of Earth. Eds. Cutler J. Cleveland
(Washington, D.C.: Environmental Information Coalition, National Council for Science and the
Environment). Retrieved 04/07/2011 from http://www.eoearth.org/article/Water_profile_of_Belize
Trenberth, K. (2005). Uncertainty in hurricanes and global warming. Paleobiology, 308(June), 1753 - 1754.
Trenberth, K. E., P. D. Jones, P. Ambenje, R. Bojariu, D. Easterling, A. Klein Tank, D. Parker, F. Rahimzadeh, J.
A. Renwick, M. Rusticucci, B. Soden and P. Zhai, (2007): Observations: Surface and Atmospheric Climate
Change. In: Climate Change 2007: The Physical Science Basis. Contribution of Working Group I to the
Fourth Assessment Report of the Intergovernmental Panel on Climate Change. Solomon, S., D. Qin, M.
Manning, Z. Chen, M. Marquis, K. B. Averyt, M. Tignor and H. L. Miller, (eds.), Cambridge University
Press, Cambridge, United Kingdom and New York, NY, USA.
Trotz, U., Rogers, C., de Romilly, G., & Clarke, J. (2004). Adapting to a Changing Climate in the Caribbean
and South Pacific Regions: Guide to the Integration of Climate Change Adaptation in the Environmental
Impact Assessment (EIA) Process. Bridgetown: Caribbean Community Secretariat.
214
Tsutsui, (2002): Implications of anthropogenic climate change for tropical cyclone activity: A case study with
the NCAR CCM2. Journal of the Meteorological Society of Japan, 80(1), 45-65.
U.S. Department of Energy/National Energy Technology Laboratory. (2007). Potential Impacts of Climate
Change on the Energy Sector. U.S. Department of Energy/National Energy Technology Laboratory.
UK Energy Research Centre (UKERC) (2009) Global Oil Depletion: An assessment of the evidence for a near-
term peak in global oil production. Retrieved 5/3/2011 from http://www.ukerc.ac.uk/support/tiki-
index.php?page=Global+Oil+Depletion.
UNDAF. (2010). UN Development Assistance Framework Belize, 2007 - 2011 Mid Term Review Report:
United Nations Development Assistance Framework.
UNEP. (2007). Environment and Vulnerability: Emerging Perspectives. UN International Strategy for Disaster
Reduction- Environment and Disaster Working Group. Geneva: United Nations Environment
Programme.
UNESCO. (n.d.). Wise practices for coping with beach erosion. Fisheries Division; Development Control,
University of Puerto Rico; Caribbean Development Bank.
UNFPA. (2007). Population, Poverty and Climate Change. Retrieved May 04, 2011, from United Nations:
http://www.un.org/climatechange/pdfs/bali/unfpa-bali07-18.pdf
UN-OHRLLS. (2009). The Impact of Climate Change on the Development Prospects of the Least Developed
Countries and Small Island Developing States. New York, USA: Office of the High Representative for the
Least Developed Countries, Landlocked Developing Countries and Small Island Developing States
UNWTO, UNEP, WMO. (2008). Climate Change and Tourism: Responding to Global Challenges. Madrid:
United Nations World Tourism Organization; Paris: United Nations Environment Programme; Geneva:
World Meteorological Organization.
UNWTO. (2010). World Tourism Organization Statement Regarding Mitigation of Greenhouse Gas
Emissions from Air Passenger Transport. The International Civil Aviation Organization Assembly 37th
Session Working Paper. United Nations World Tourism Organization
Upham, P., Tomei, J. and Boucher, P. (2009) Biofuels, Aviation and Sustainability: Prospects and Limits. In
Gössling, S. and Upham, P. Climate Change and Aviation: Issues, Challenges and Solutions, Earthscan Ltd,
London.
Vanzie, E. (2008). Assessment of the Impact of Climate Change on Belize's Health Sector: Dengue and
Dengue Hemorrhagic Fever, Belize Second National Communication (SNC) Project.
Vecchi, G. A. and B. J. Soden, (2007): Effect of remote sea surface temperature change on tropical cyclone
potential intensity. Nature, 450, 1066-1070.
Vermeer, M., & Rahmstorf, S. (2009). Global sea level linked to global temperature. National Academy of
Sciences, 106(51), 21527–21532.
Walker, L. (2006). Towards a the Development of a Coastal Zone Management Strategy and Action Plan for
Saint Lucia. Retrieved April 20, 2011, from
http://www.un.org/Depts/los/nippon/unnff_programme_home/fellows_pages/fellows_papers/walker_
0506_stlucia.pdf
215
Wason, A. (2002). Status of Building Codes in the Caribbean (as of August 2001). Organisation of American
States (http://www.oas.org/pgdm/document/codemtrx.htm).
WCS. (2008). Catch per Unit Effort, Glover’s Reef. Final Report (unpublished). Wildlife Conservation Society
WEF (World Economic Forum). (2009). Climate Policies: From Kyoto to Copenhagen. Retrieved 5/3/2011
from
http://www.cstt.nl/images/can%20tourism%20%27seal%20the%20deal%27%20of%20its%20mitigation
%20commitments,%20paul.pdf
White, N. J. (2005). Coastal and global averaged sea level rise for 1950 to 2000. Geophysical Research
Letters, 32(1).
WHO. (2007). Report of the WHO consultation on Integrated Vector Control management (IVM) WHO
headquarters 1-4 May, 2007. Geneva, Switzerland World Health Organization.
WHO. (2010a). Belize World Malaria Report. Geneva: World Health Organization.
WHO. (2010b). Gender, Climate Change and Health: Draft Discussion Paper. World Health Organization.
WHO. (2011a). Belize: National Health Accounts, Programmes and Projects Retrieved 21/11/2011, from
http://apps.who.int/nha/database/StandardReport.aspx?ID=REP_WEB_MINI_TEMPLATE_WEB_VERSIO
N&COUNTRYKEY=84006
WHO. (2011b). World Health Statistics 2010. Geneva: World Health Organization.
Wichmann, O., Mühlberger, N., & Jelinek, T. (2003). Dengue - the underestimated risk in travellers. In
Chusak Prasittisuk (Ed.), Dengue Bulletin, The South-East Asia and Western Pacific Region (Vol. 27, pp.
126-137). Geneva WHO.
Wilbanks, T. J., Lankao, P. R., Bao, M., Berkhout, F., Cairncross, S., Ceron, J.-P., et al. (2007). Industry,
settlement and society. (M. L. Parry, O. F. Canziani, J. P. Palutikof, P. J. van der Linden, & C. E. Hanson,
Eds.) Climate Change 2007: Impacts, Adaptation and Vulnerability. Contribution of Working Group II to
the Fourth Assessment Report of the Intergovernmental Panel on Climate Change , 357-390.
Wilder-Smith, A., & Schwartz, E. (2005). Dengue in Travellers. The New England Journal of Medicine, 353,
924-932.
Wildtracks / Wildlife Conservation Society. 2007. “Management Plan: Glover’s Reef Marine Reserve World
Heritage Site: 2008 – 2013.” Wildlife Conservation Society (WCS), Belize City, Belize.
Williams, J. E., & Bunkley-Williams, L. (2000). Marine Major Ecological Disturbances of the Caribbean. The
Infectious Disease Review - microbes of man, animals and the environment, 110-127.
Williams, J. L. (2010). WTRG Economics. Retrieved 5/3/2011 from www.wtrg.com.
Williams, R. (2009). Belize: Belize Tsunami Early Warning System - existing monitoring networks, needs and
proposals – November 24. Managua, Nicaragua
Wisser, D., Frolking, S., Douglas, E. M., Fekete, B. M., Vörösmarty, C. J. and Schumann, A. H. (2008). Global
irrigation water demand: Variability and uncertainties arising from agricultural and climate data sets.
Geophysical Research Letters, 35(24).

216
WMB. (2011). Water Missions Belize – Projects, the Need and About Us. Retrieved 12/07/ 2011 from Water
Missions Belize: http://watermissionsbelize.org/
Woodworth, P. L., N. J. White, S. Jevrejeva, S. J. Holgate, J. A. Church and W. R. Gehrels, (2009): Evidence
for the accelerations of sea level on multi-decade and century timescales. International Journal of
Climatology, 29, 777-789.
World Bank. (2012) The World Bank Adaptation Guidance Notes - Key Words and Definitions. Retrieved
February 14, 2012 from http://climatechange.worldbank.org/climatechange/content/adaptation-
guidance-notes-key-words-and-definitions.
Yoshimura, J., S. Masato and N. Akira, (2006): Influence of greenhouse warming on tropical cyclone
frequency. Journal of the Meteorological Society of Japan 84(2), 405-428.
Zhang, K., Douglas, B., & Leatherman, S. (2004). Global warming and coastal erosion. Climatic Change, 64,
41-58
Zhang, Y. and Schilling, K. (2006). Effects of land cover on water table, soil moisture, evapotranspiration and
groundwater recharge: A Field observation and analysis. Journal of Hydrology, 319(1-4), 328-338.
Zisman, S.A. 1998. "Sustainability or Status Quo: Elite Influence and the Political Ecology of Mangrove
Exploitation in Belize." Doctoral dissertation, Department of Geography, University of Edinburgh.
Edinburgh, Scotland