Embed Size (px)
Citation preview
The CARDS System Description and
Algorithms
CAnadian Radar Decision Support
Paul JoeMeteorological Service of Canada
Outline
• Introduction
• Requirements / Issues
• The CARDS Solution
• Algorithms, Products, Functionality
• Example of Usage
Introduction
TITAN = Thunderstorm Initiation, Analysis and Nowcasting (NCAR “free*”)
WDSS II = Warning Decision Support System (NSSL “free*” )
CARDS = Canadian Radar Decision Support (EC “free**”)
•*Download from web
•** Discuss
Introduction
• Operational system of the Meteorological Service of Canada
• Single radar processing systems for multiple uses
• In transition, being integrated with forecaster workstation (NinJo)

The Requirements
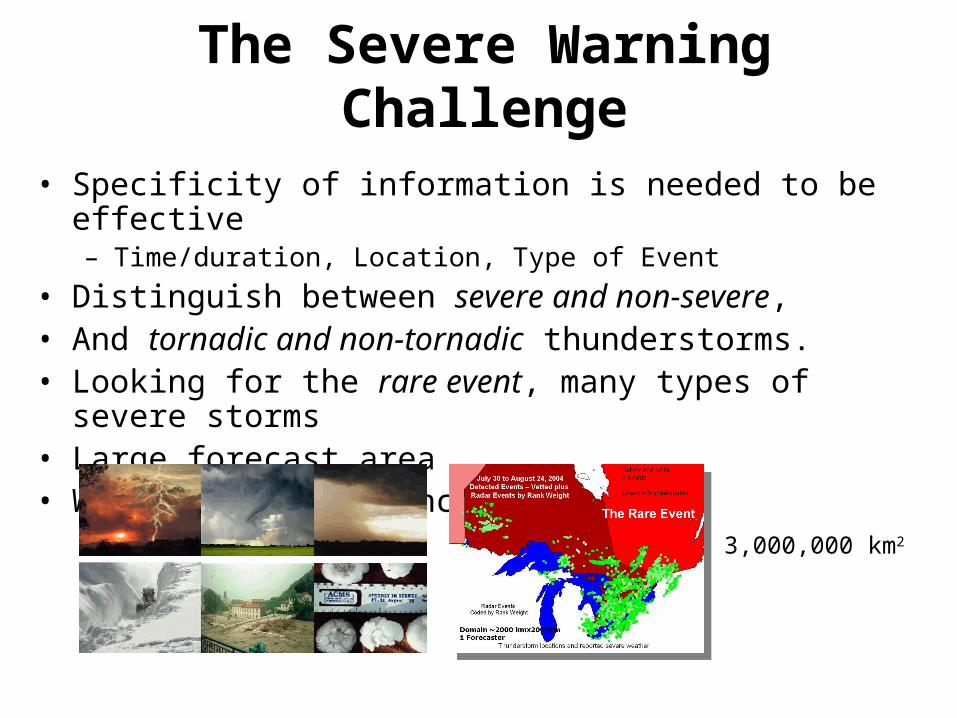
The Severe Warning Challenge
• Specificity of information is needed to be effective– Time/duration, Location, Type of Event
• Distinguish between severe and non-severe, • And tornadic and non-tornadic thunderstorms.• Looking for the rare event, many types of severe storms• Large forecast area • Work Load, Efficiency
3,000,000 km2
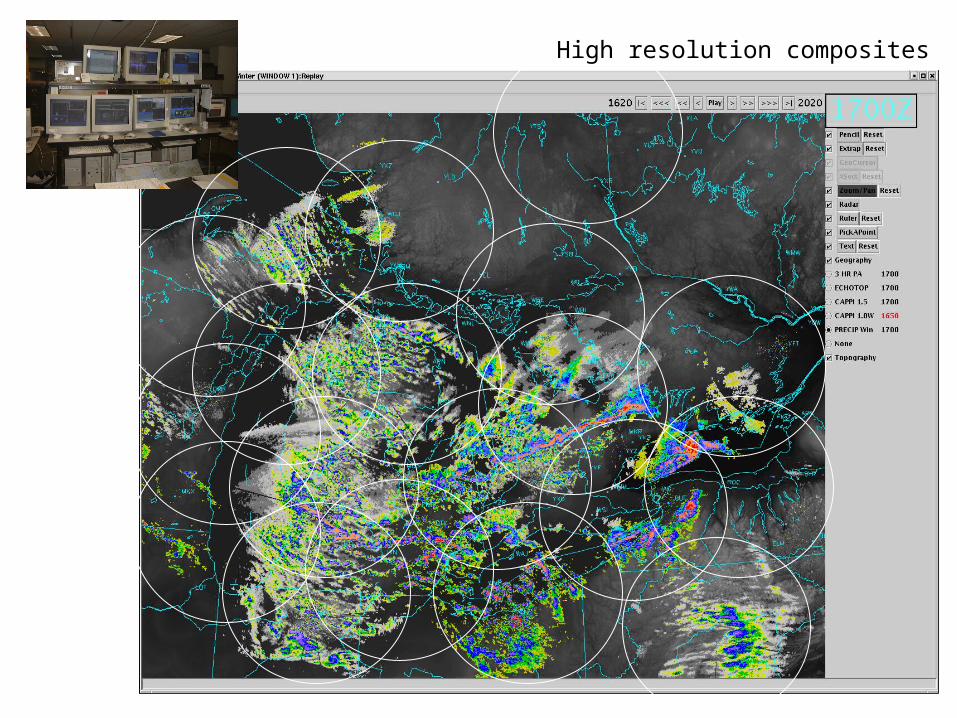
High resolution composites
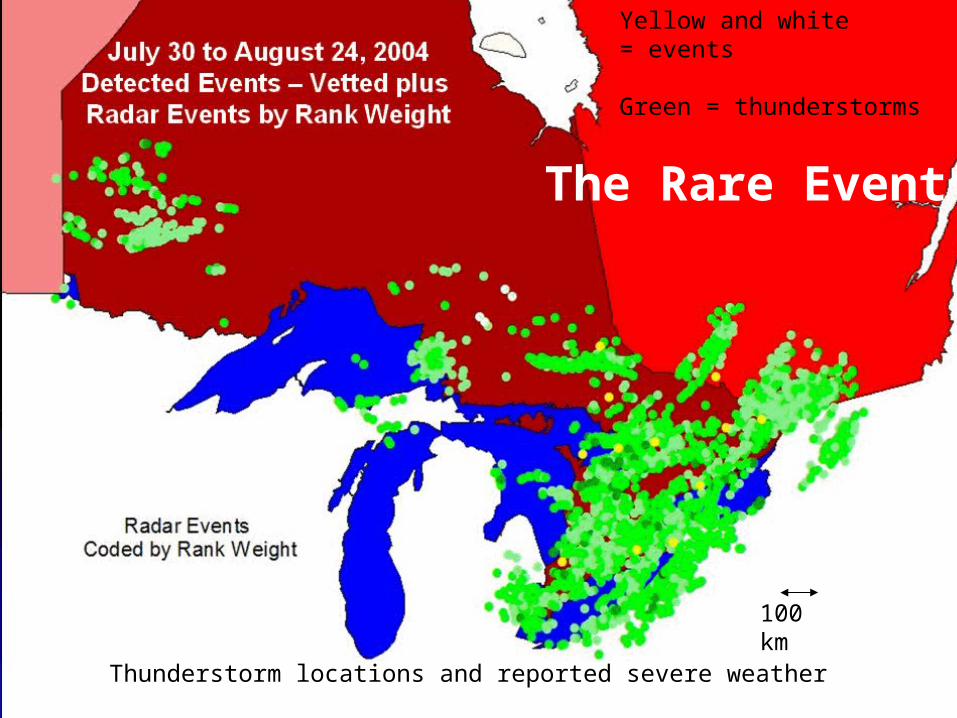
Thunderstorm locations and reported severe weather
The Rare Event
Yellow and white= events
Green = thunderstorms
100 km
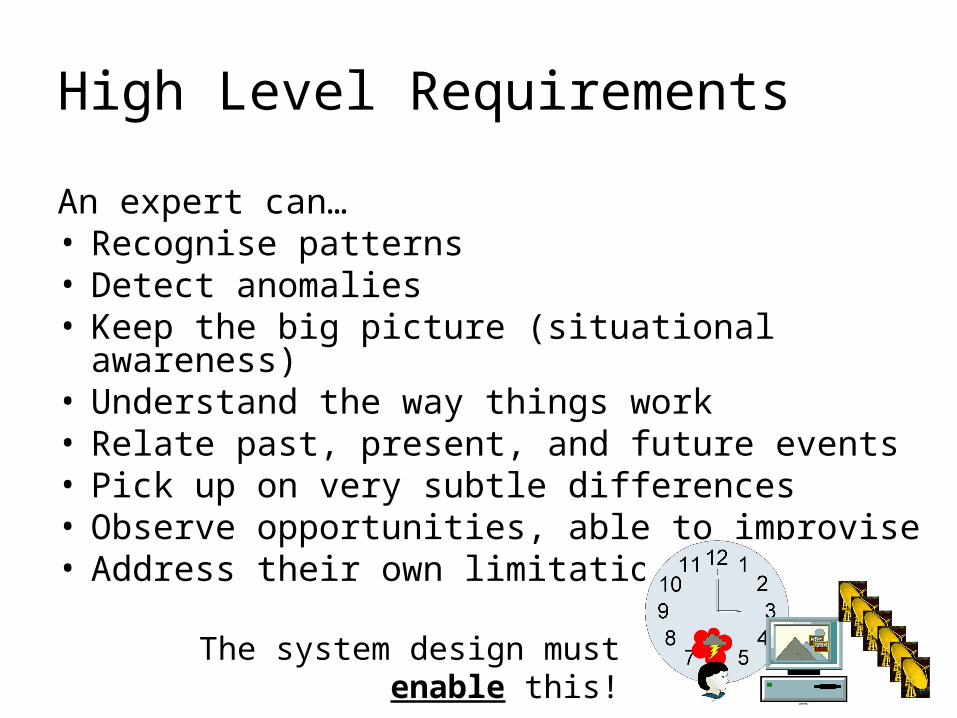
High Level Requirements
An expert can…• Recognise patterns• Detect anomalies• Keep the big picture (situational awareness)• Understand the way things work• Relate past, present, and future events• Pick up on very subtle differences• Observe opportunities, able to improvise• Address their own limitations
The system design must enable this!
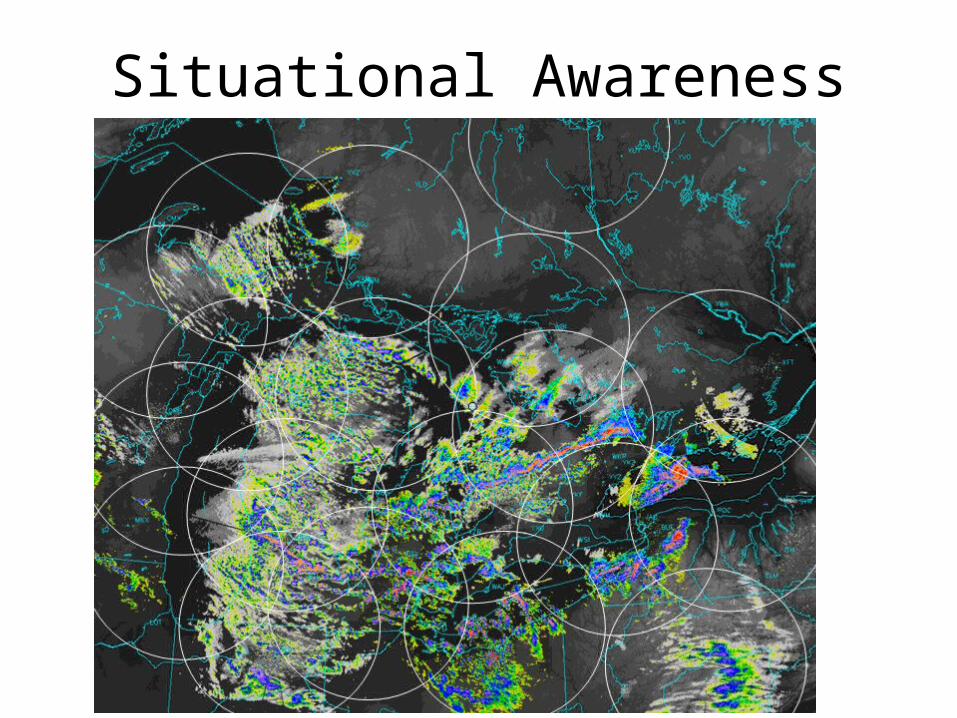
Situational Awareness
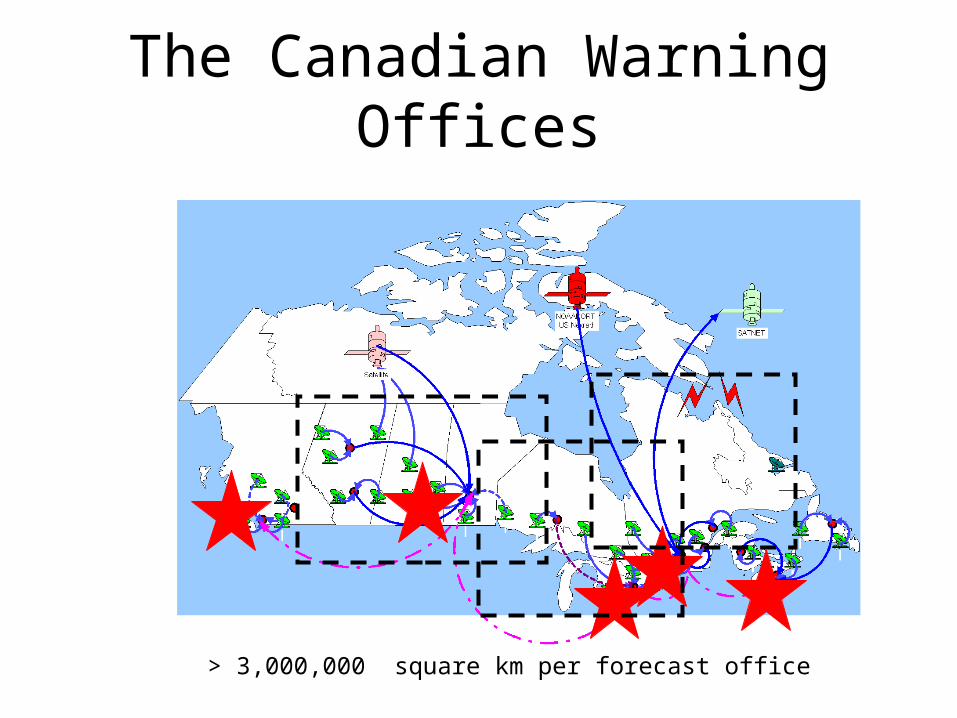
The Canadian Warning Offices
> 3,000,000 square km per forecast office
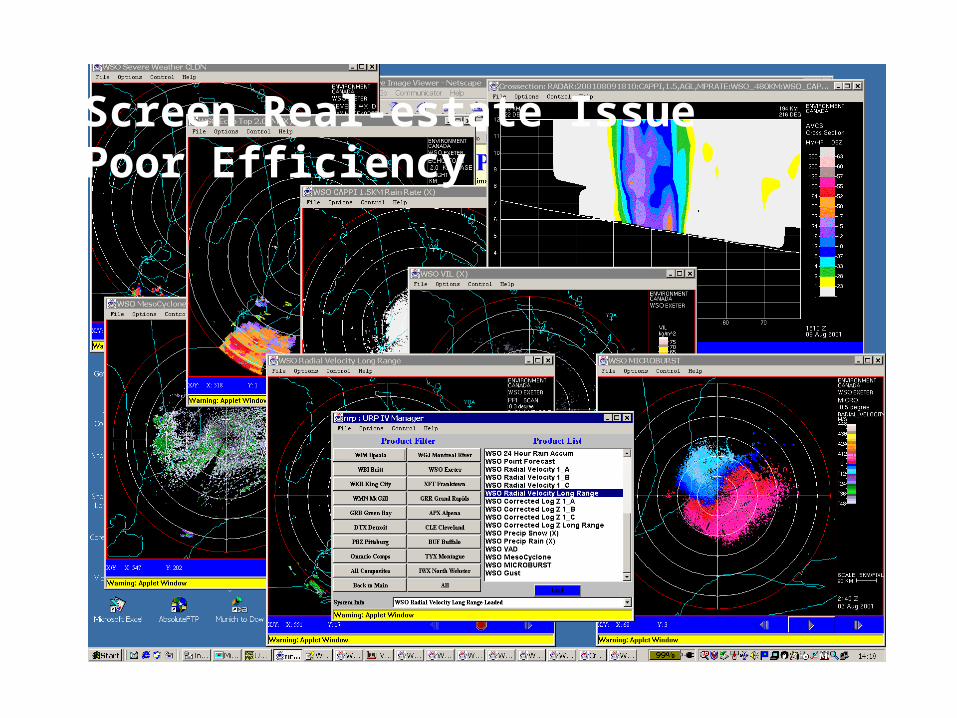
Screen Real-estate IssuePoor Efficiency
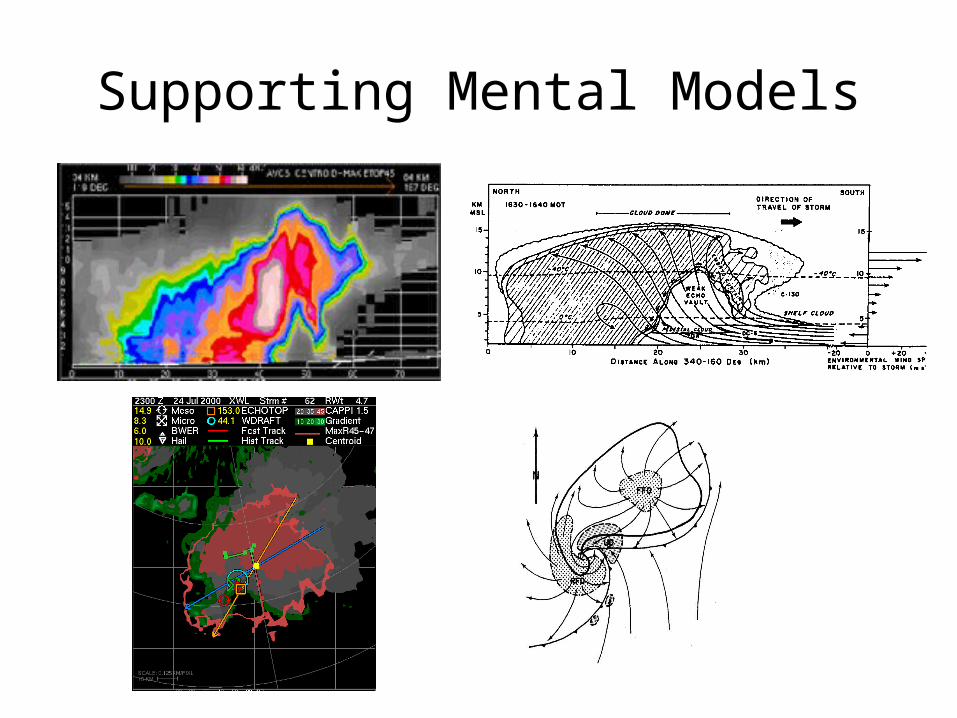
Supporting Mental Models
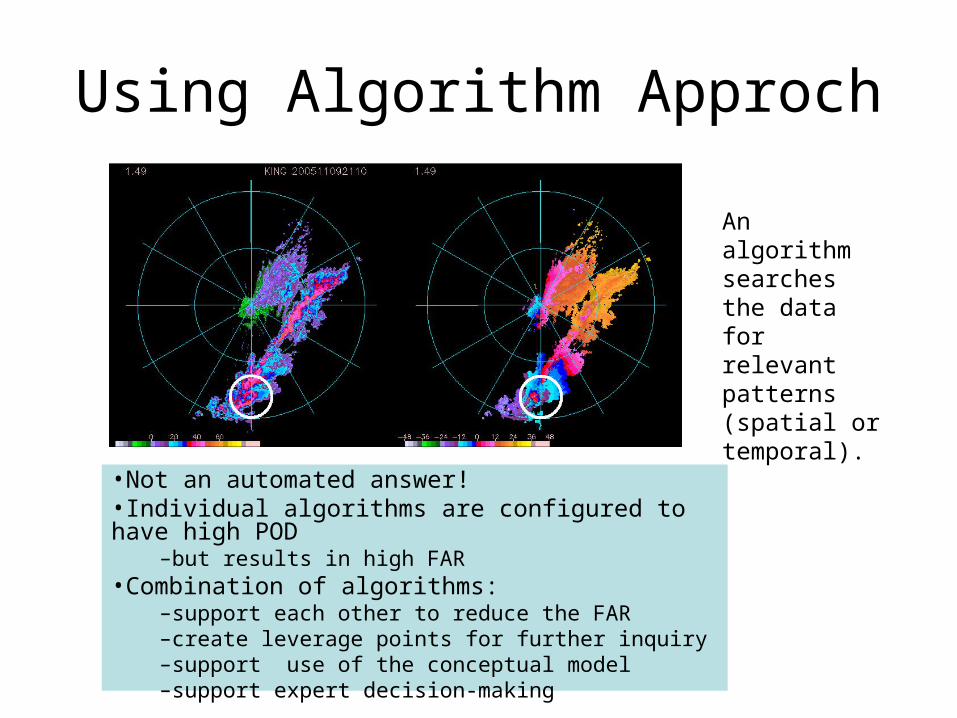
Using Algorithm Approch
•Not an automated answer!•Individual algorithms are configured to have high POD
–but results in high FAR•Combination of algorithms:
–support each other to reduce the FAR–create leverage points for further inquiry–support use of the conceptual model–support expert decision-making
An algorithm searches the data for relevant patterns (spatial or temporal).
Enabling Expertise
• Can not do anything if only the answer is provided!– This will make anyone dumb!– Self-fulfilling prophesy
• Must be able to “access or drill down” to the underlying data
Functionality
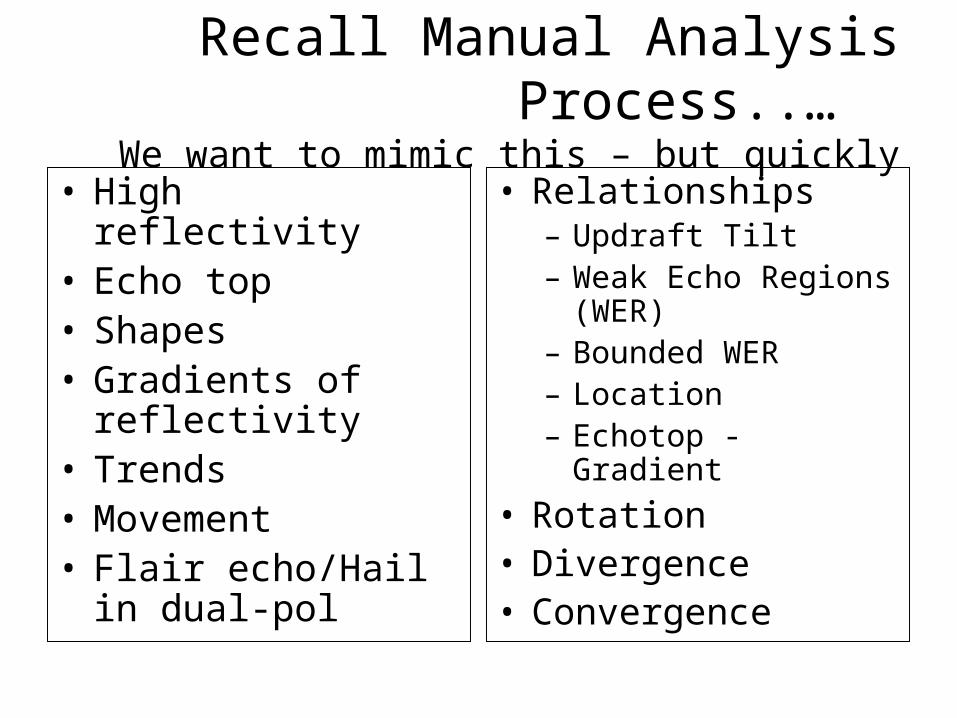
Recall Manual Analysis Process..…
We want to mimic this – but quickly• High reflectivity• Echo top• Shapes• Gradients of
reflectivity• Trends • Movement• Flair echo/Hail in
dual-pol
• Relationships – Updraft Tilt– Weak Echo Regions
(WER)– Bounded WER– Location– Echotop - Gradient
• Rotation• Divergence• Convergence
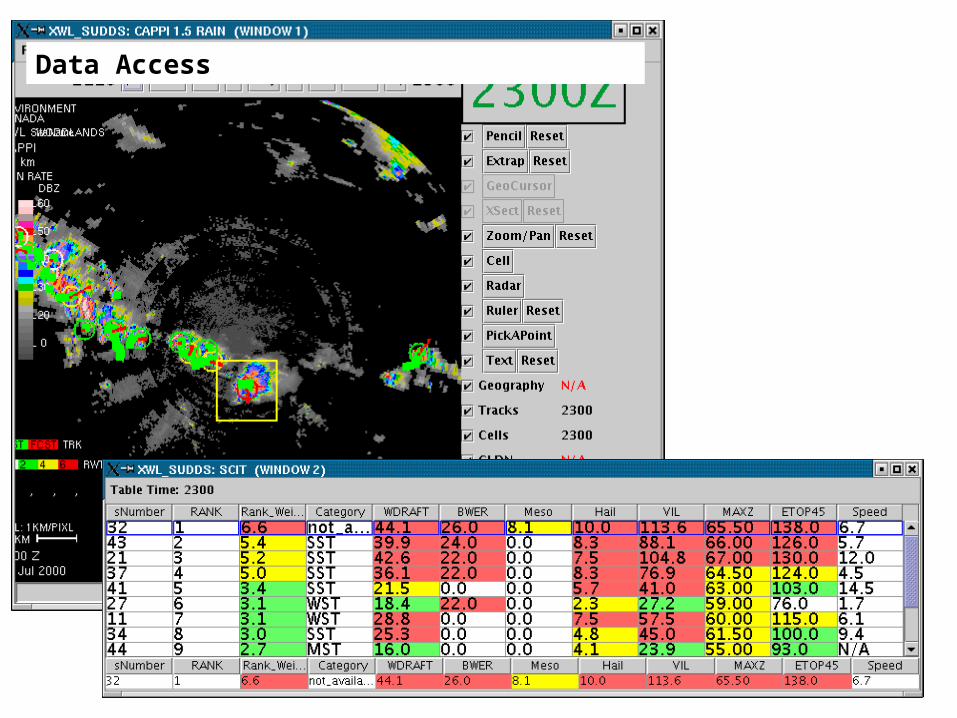
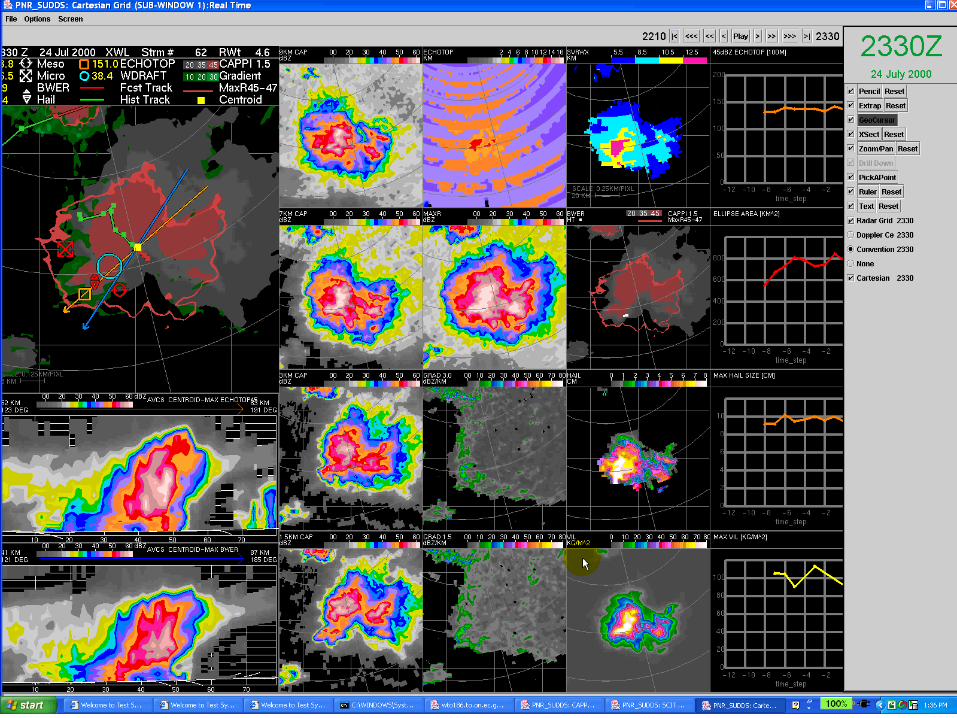
Data Access
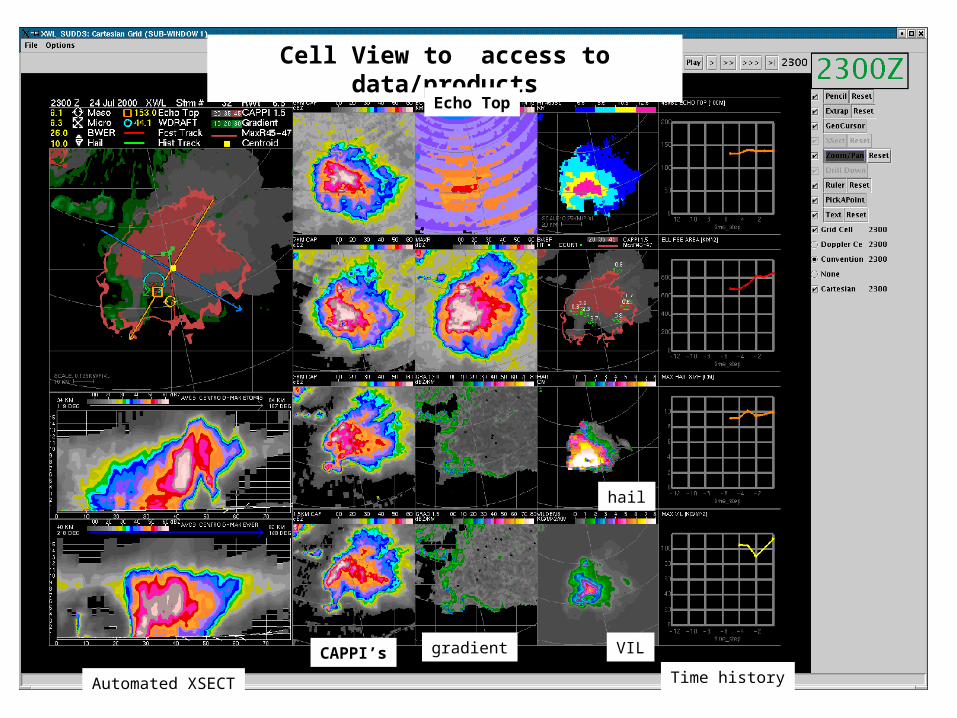
Cell ViewCell View to access to data/products
CAPPI’s
Echo Top
gradient
hail
VIL
Time historyAutomated XSECT
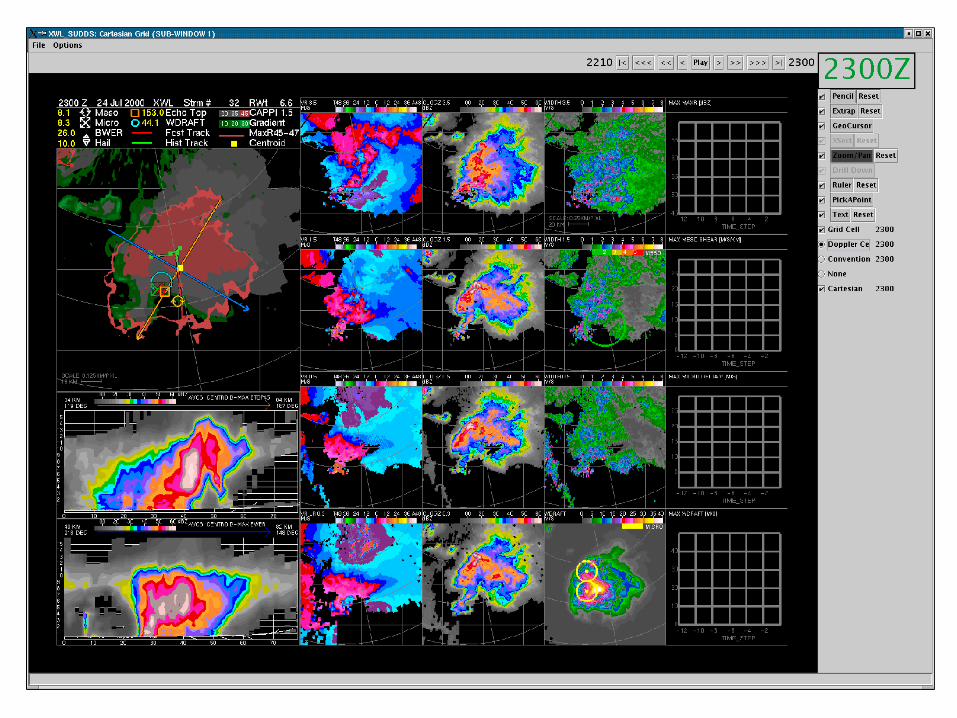
Animation to show the functionality and use of cell views
Algorithms Approach
•Not the answer! but …•Create “Leverage” Points•Support your Conceptual Model•Support Decision Making
Algorithm
• A set of computer procedures or steps
• Attempts to match human visual/pattern recognition skills
• Software that identifies a feature in the data that represents a meteorological feature (e.g., a thunderstorm cell, a cell track)
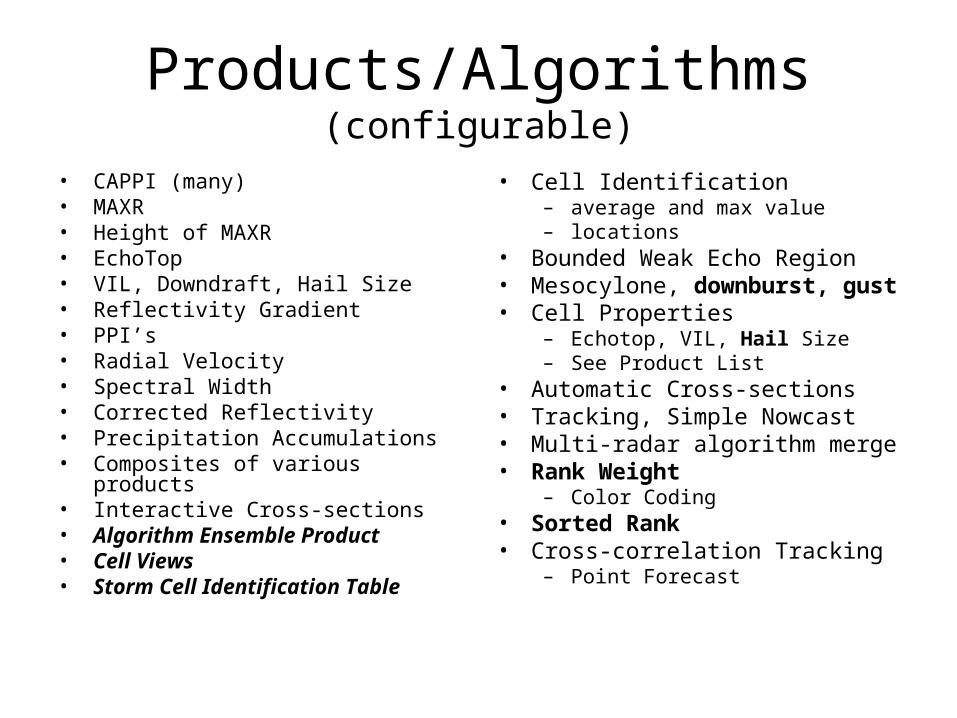
Products/Algorithms(configurable)
• CAPPI (many)• MAXR• Height of MAXR• EchoTop• VIL, Downdraft, Hail Size• Reflectivity Gradient• PPI’s• Radial Velocity• Spectral Width• Corrected Reflectivity• Precipitation Accumulations• Composites of various products• Interactive Cross-sections• Algorithm Ensemble Product• Cell Views• Storm Cell Identification Table
• Cell Identification– average and max value– locations
• Bounded Weak Echo Region• Mesocylone, downburst, gust• Cell Properties
– Echotop, VIL, Hail Size– See Product List
• Automatic Cross-sections• Tracking, Simple Nowcast• Multi-radar algorithm merge• Rank Weight
– Color Coding• Sorted Rank• Cross-correlation Tracking
– Point Forecast
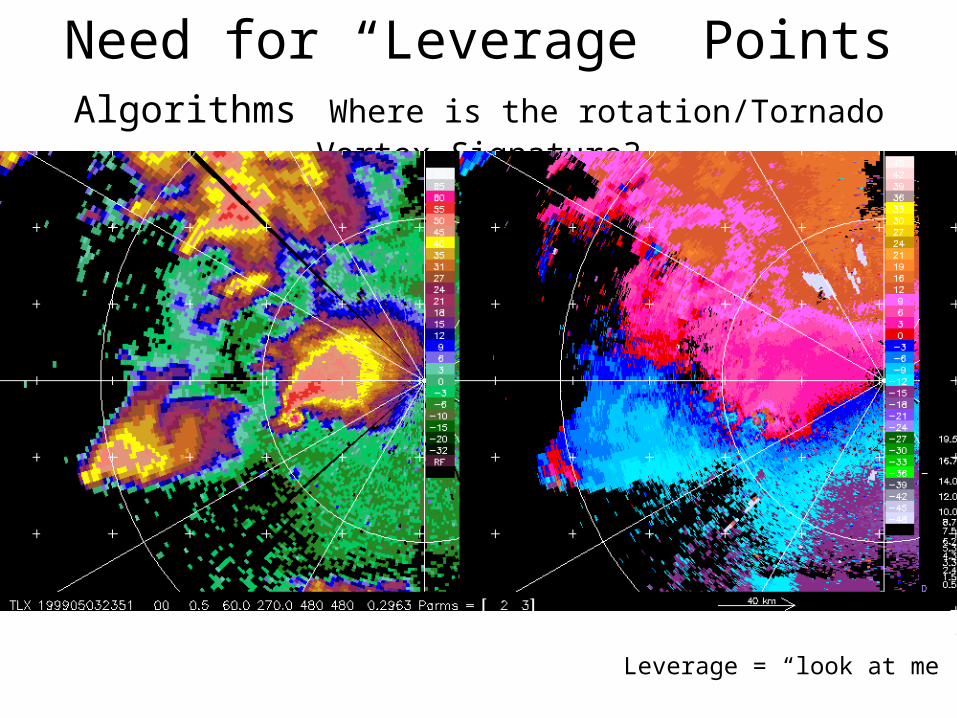
Need for “Leverage” Points Algorithms Where is the rotation/Tornado Vortex Signature?
Leverage = “look at me”
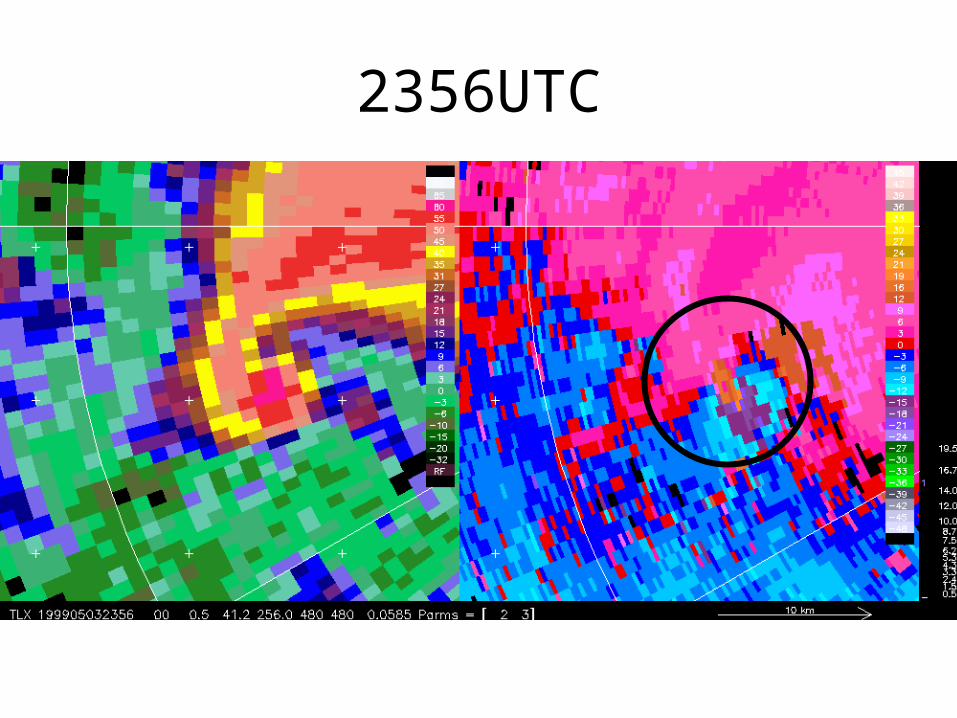
2356UTC
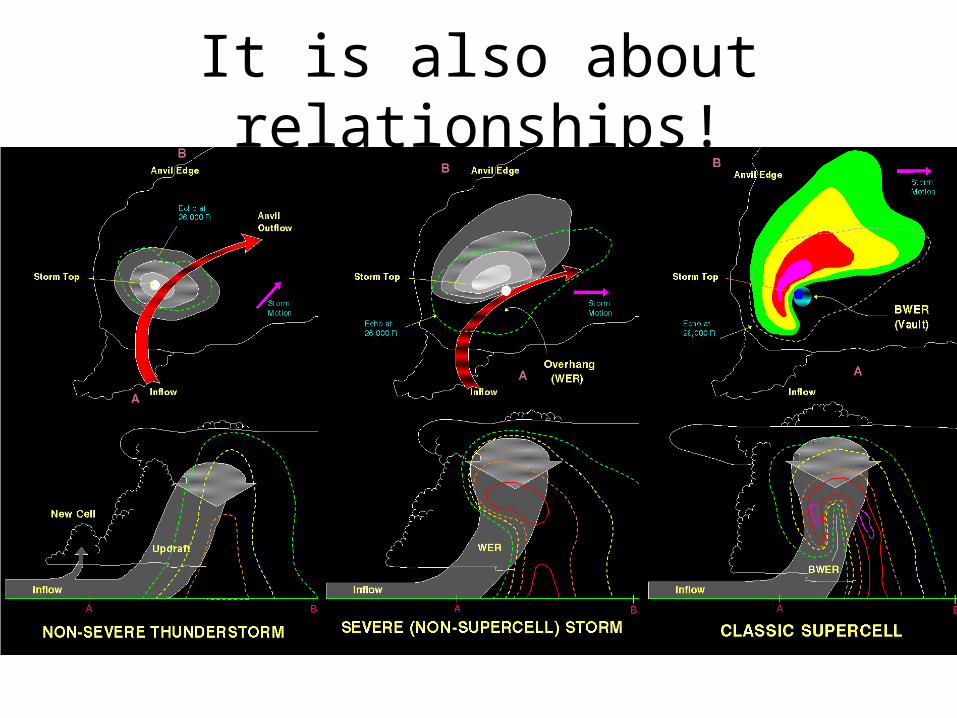
It is also about relationships!
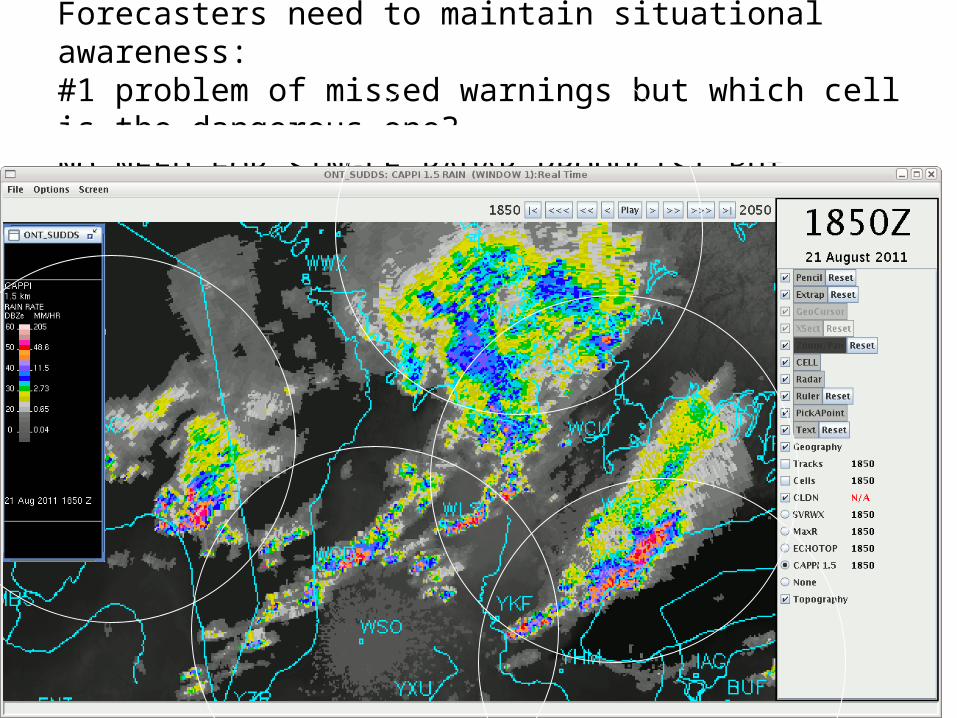
Forecasters need to maintain situational awareness:#1 problem of missed warnings but which cell is the dangerous one? NO NEED FOR SINGLE RADAR PRODUCTS! But…
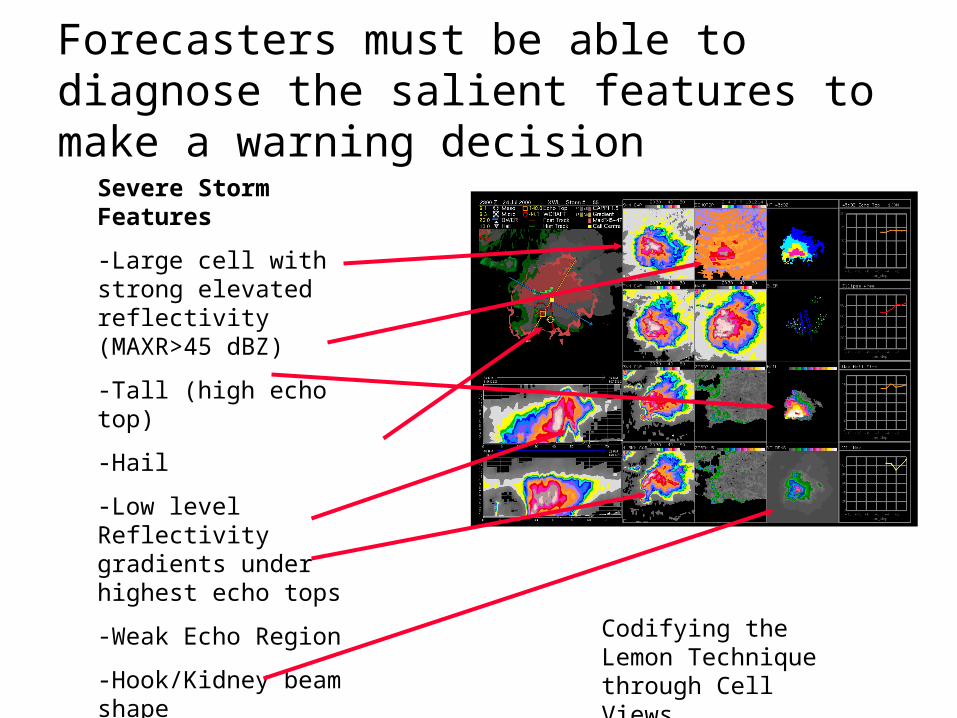
Forecasters must be able to diagnose the salient features to make a warning decision
Severe Storm Features
-Large cell with strong elevated reflectivity (MAXR>45 dBZ)
-Tall (high echo top)
-Hail
-Low level Reflectivity gradients under highest echo tops
-Weak Echo Region
-Hook/Kidney beam shape
-Mesocyclones
-Downdrafts
Codifying the Lemon Technique through Cell Views
Some of the Algorithms
•Hail•Downdraft Algorithm•Storm Classification Identification and Tracking•Ranking Storms
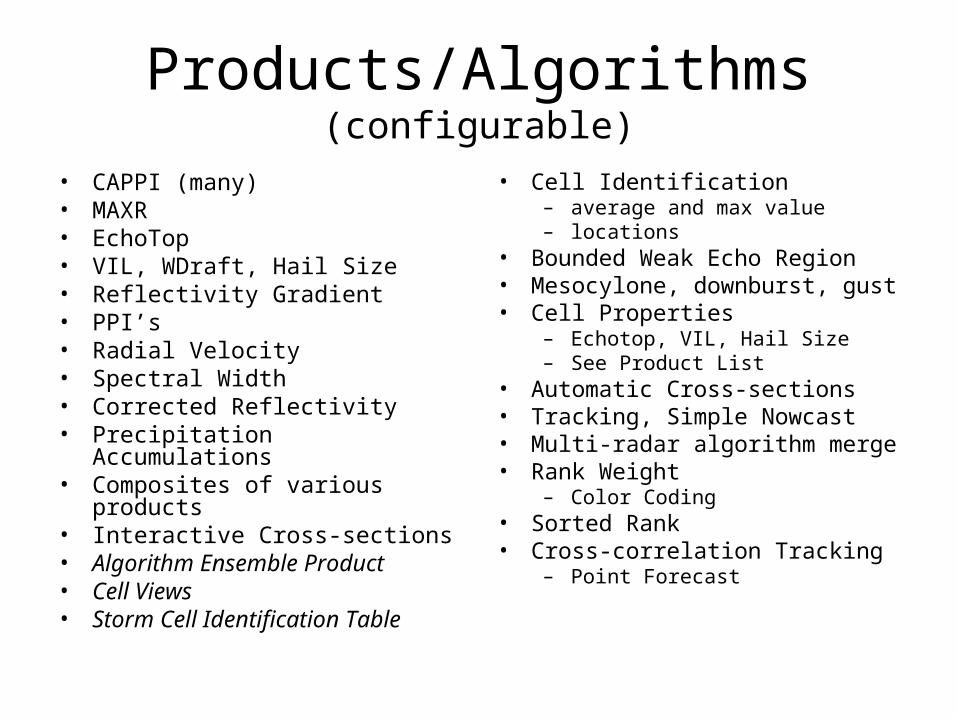
Products/Algorithms(configurable)
• CAPPI (many)• MAXR• EchoTop• VIL, WDraft, Hail Size• Reflectivity Gradient• PPI’s• Radial Velocity• Spectral Width• Corrected Reflectivity• Precipitation Accumulations• Composites of various products• Interactive Cross-sections• Algorithm Ensemble Product• Cell Views• Storm Cell Identification Table
• Cell Identification– average and max value– locations
• Bounded Weak Echo Region• Mesocylone, downburst, gust• Cell Properties
– Echotop, VIL, Hail Size– See Product List
• Automatic Cross-sections• Tracking, Simple Nowcast• Multi-radar algorithm merge• Rank Weight
– Color Coding• Sorted Rank• Cross-correlation Tracking
– Point Forecast
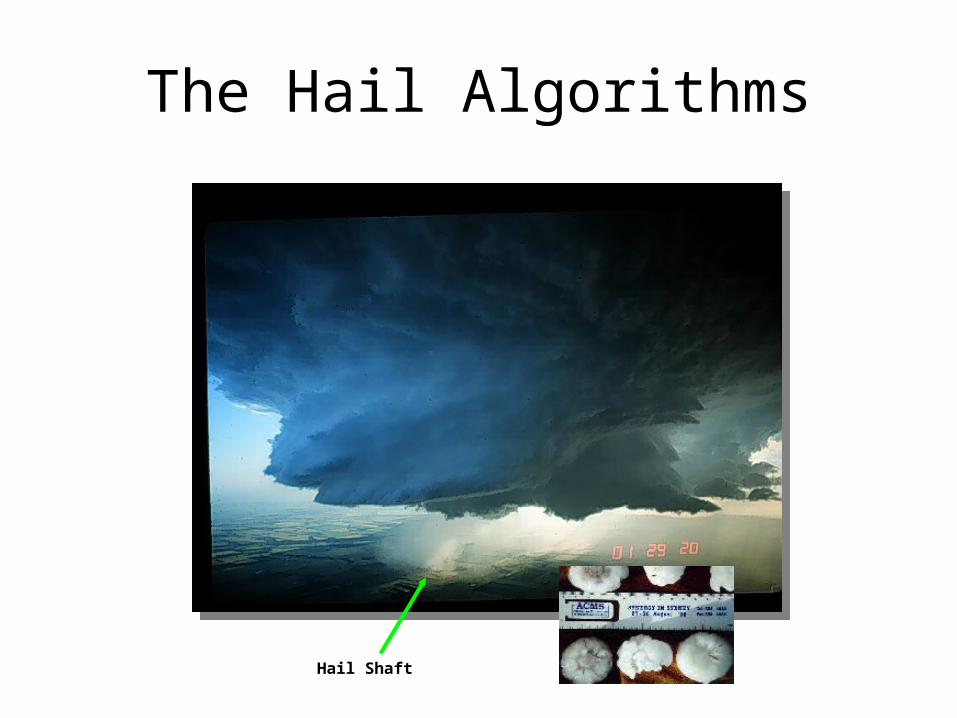
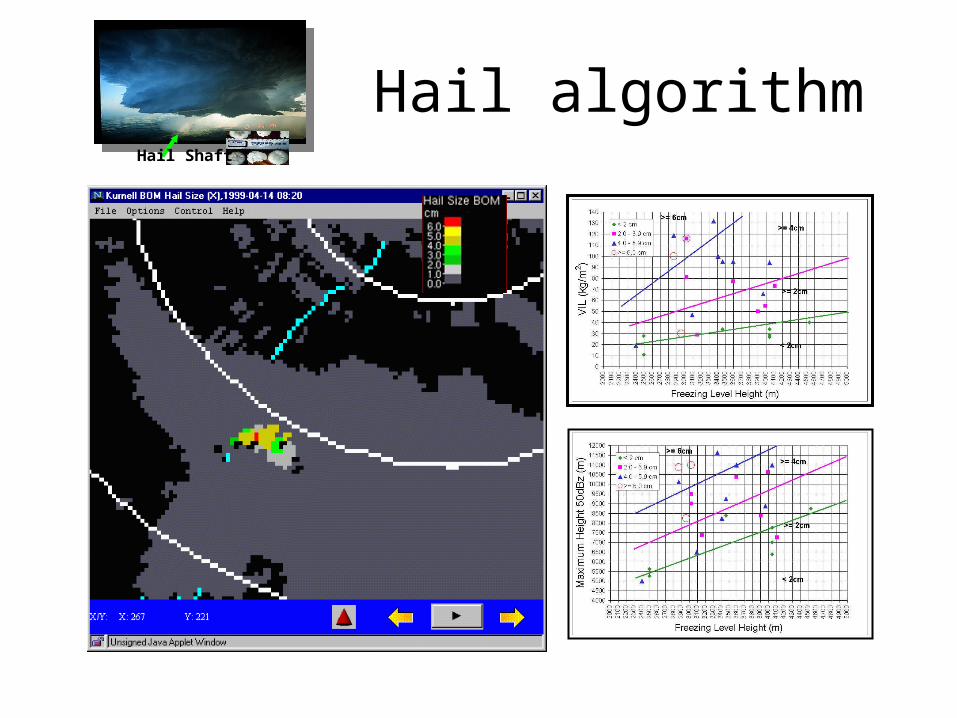
The Hail Algorithms
Hail Shaft
S2K Hail Products
• Polarimetric, BOM/MSC, WDSS• BOM/Treloar Empirical Algorithm
– Uses height of 50 dBZ echo, VIL and freezing level
• WDSS– Uses height diff of freezing level and 45 dBZ top,
VIL, hail kinetic energy (fn of dBZ), temperature profile
– Probability of severe hail– SHI
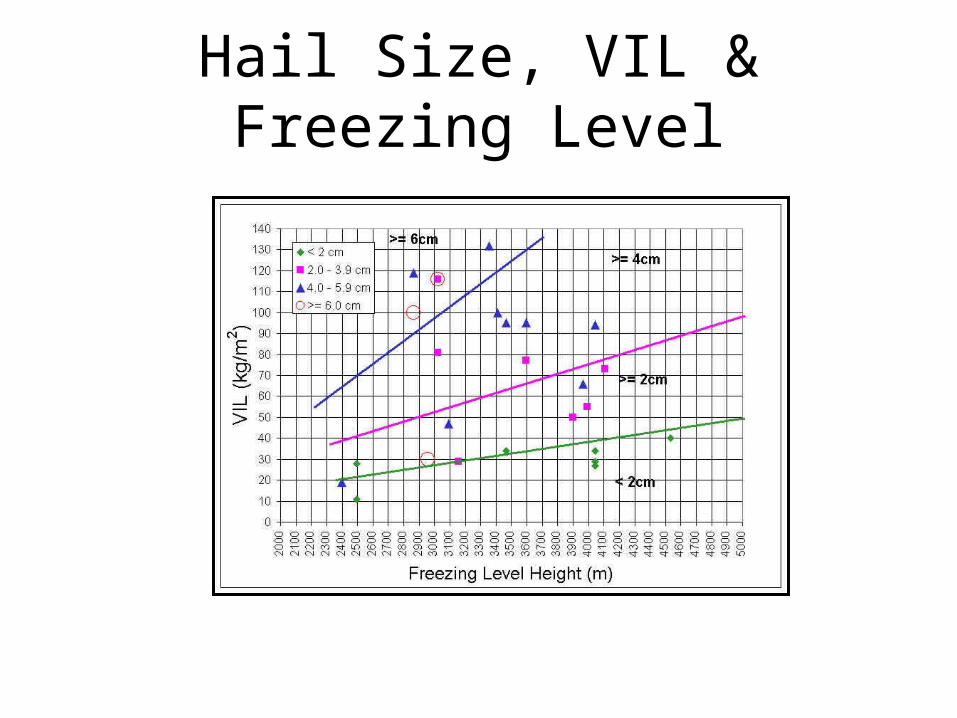
Hail Size, VIL & Freezing Level
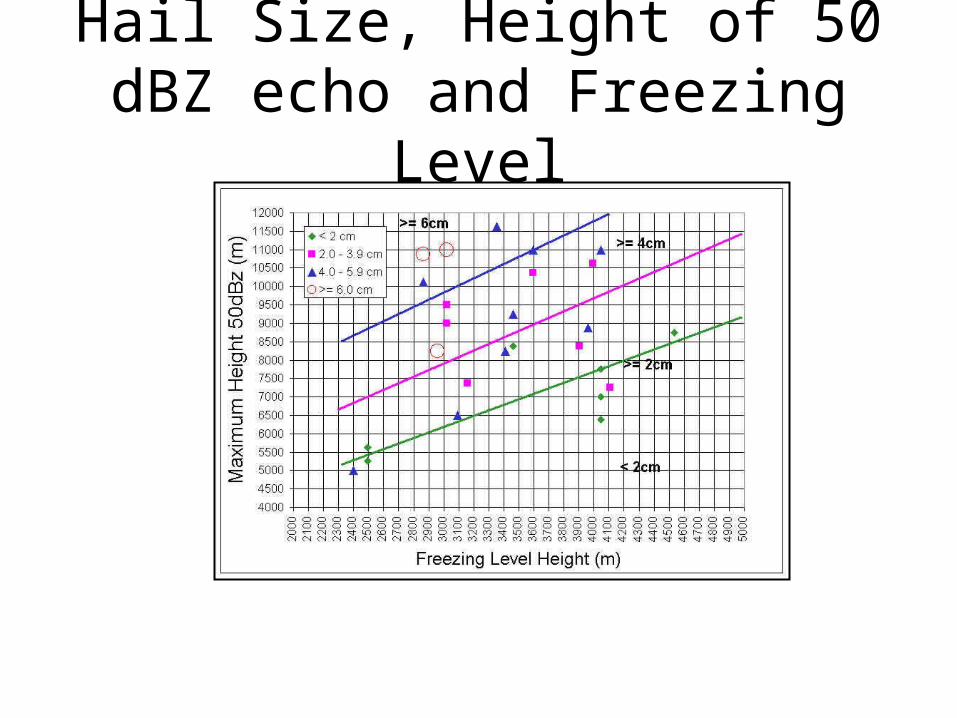
Hail Size, Height of 50 dBZ echo and Freezing Level
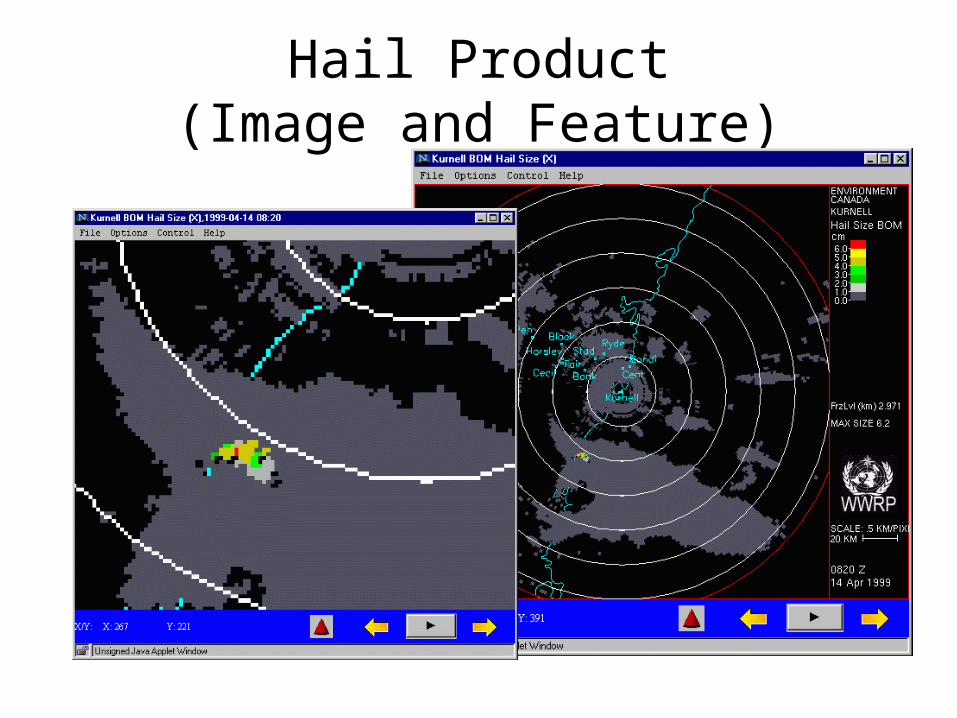
Hail Product(Image and Feature)
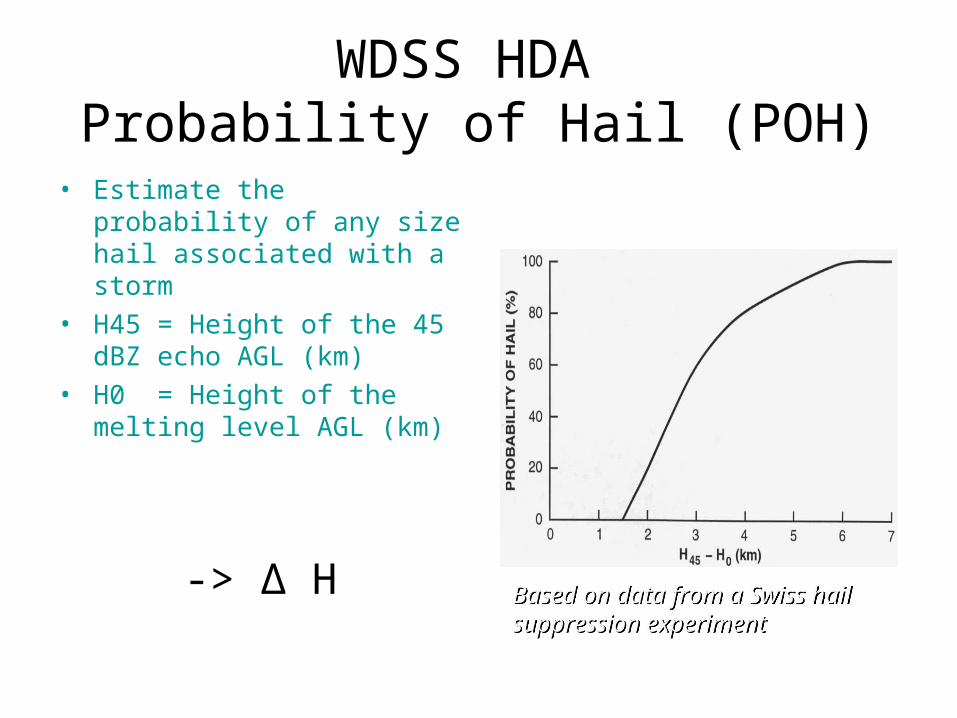
WDSS HDA Probability of Hail (POH)
• Estimate the probability of any size hail associated with a storm
• H45 = Height of the 45 dBZ echo AGL (km)
• H0 = Height of the melting level AGL (km)
Based on data from a Swiss hail suppression experiment Based on data from a Swiss hail suppression experiment
-> Δ H
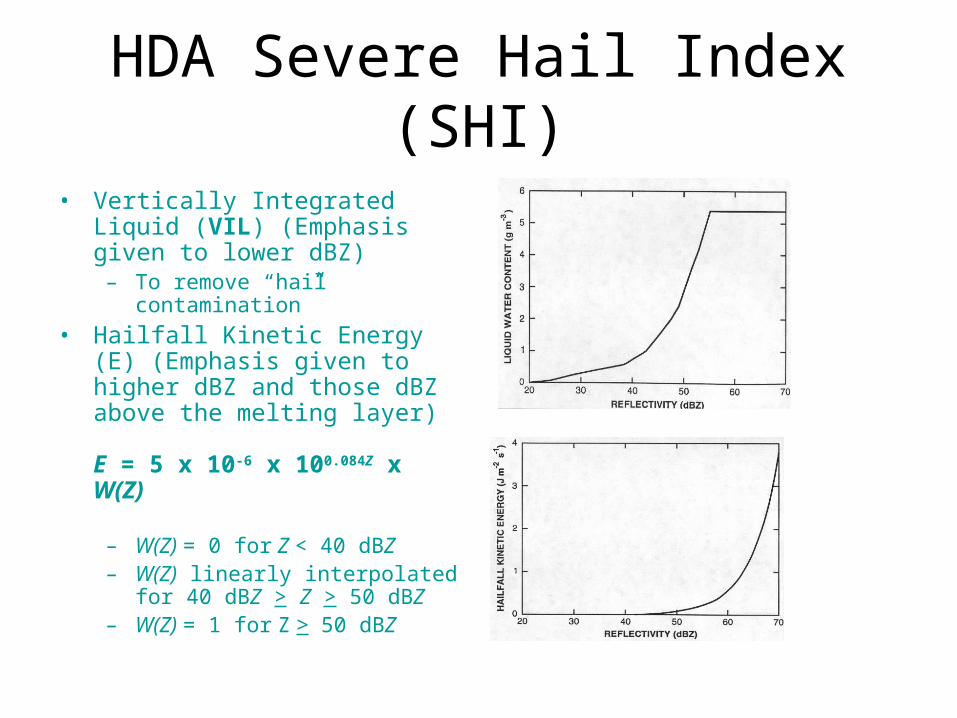
HDA Severe Hail Index (SHI)
• Vertically Integrated Liquid (VIL) (Emphasis given to lower dBZ)
– To remove “hail contamination”
• Hailfall Kinetic Energy (E) (Emphasis given to higher dBZ and those dBZ above the melting layer)
E = 5 x 10-6 x 100.084Z x W(Z)
– W(Z) = 0 for Z < 40 dBZ– W(Z) linearly interpolated for 40
dBZ > Z > 50 dBZ– W(Z) = 1 for Z > 50 dBZ
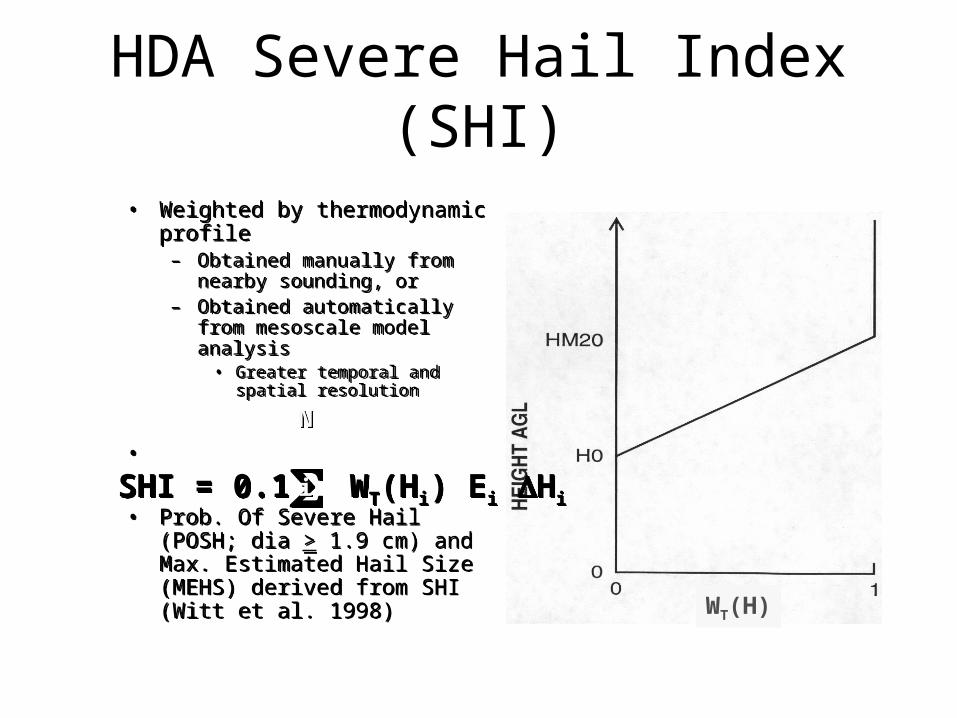
• Weighted by thermodynamic profile
– Obtained manually from nearby sounding, or
– Obtained automatically from mesoscale model analysis
• Greater temporal and spatial resolution
•
• Prob. Of Severe Hail (POSH; dia > 1.9 cm) and Max. Estimated Hail Size (MEHS) derived from SHI (Witt et al. 1998)
• Weighted by thermodynamic profile
– Obtained manually from nearby sounding, or
– Obtained automatically from mesoscale model analysis
• Greater temporal and spatial resolution
•
• Prob. Of Severe Hail (POSH; dia > 1.9 cm) and Max. Estimated Hail Size (MEHS) derived from SHI (Witt et al. 1998)
HDA Severe Hail Index (SHI)
WT(H)
SHI = 0.1WT(Hi) Ei HiSHI = 0.1WT(Hi) Ei Hi
NN
ii
Hail algorithmHail Shaft
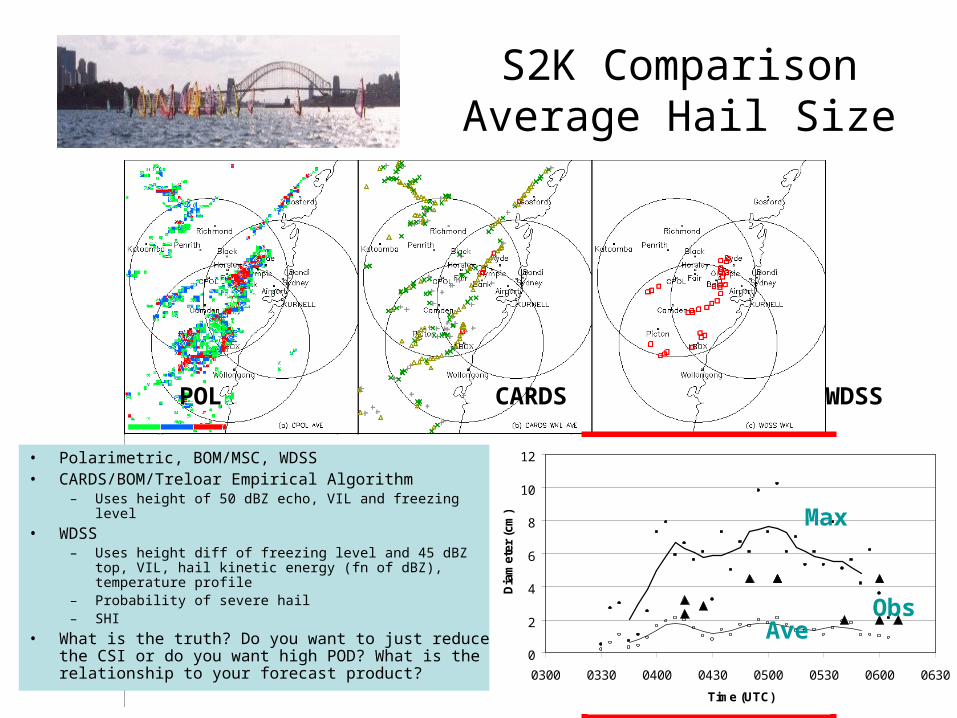
S2K ComparisonAverage Hail Size
POL CARDS WDSS
OBS
• Polarimetric, BOM/MSC, WDSS• CARDS/BOM/Treloar Empirical Algorithm
– Uses height of 50 dBZ echo, VIL and freezing level
• WDSS– Uses height diff of freezing level and 45 dBZ top, VIL,
hail kinetic energy (fn of dBZ), temperature profile– Probability of severe hail– SHI
• What is the truth? Do you want to just reduce the CSI or do you want high POD? What is the relationship to your forecast product?
0
2
4
6
8
10
12
0300 0330 0400 0430 0500 0530 0600 0630
Time (UTC)
Dia
met
er (
cm) Max
AveObs
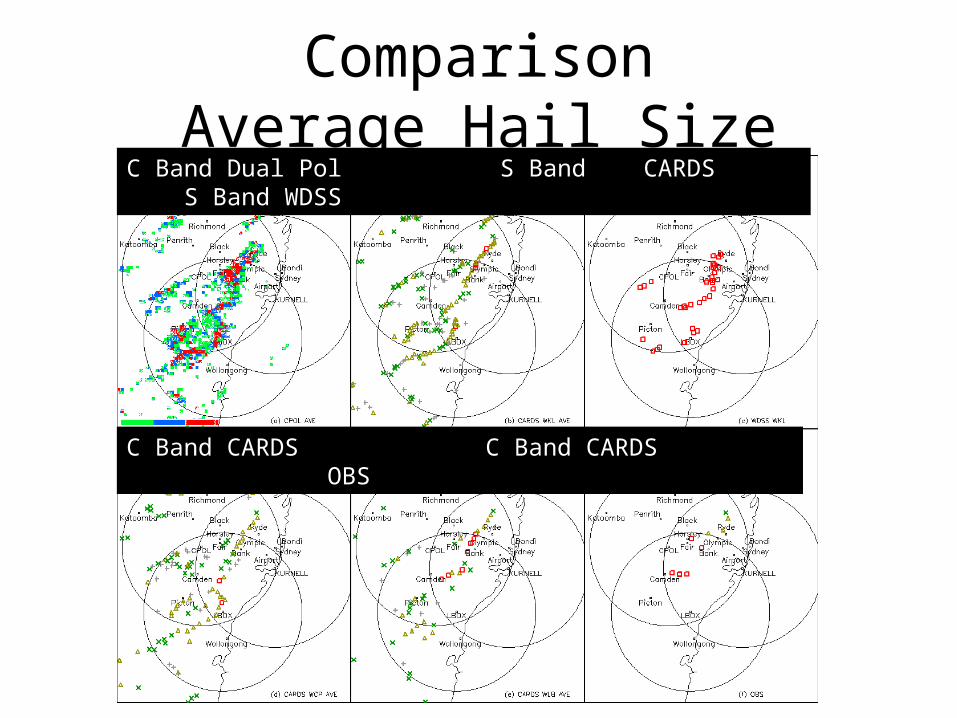
ComparisonAverage Hail Size
C Band Dual Pol S Band CARDS S Band WDSS
C Band CARDS C Band CARDS OBS
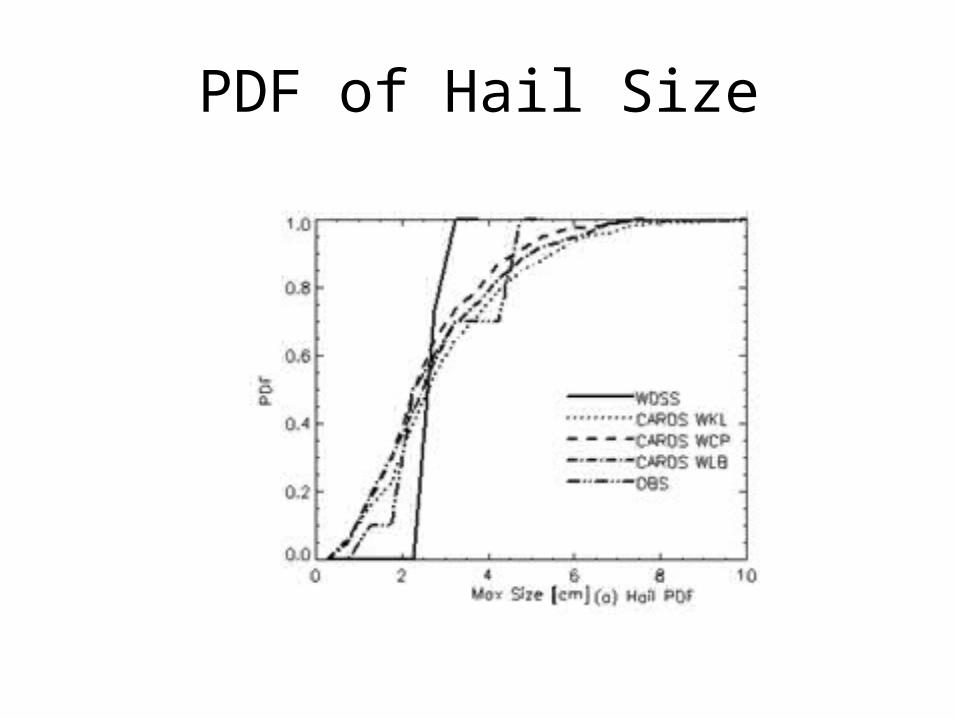
PDF of Hail Size
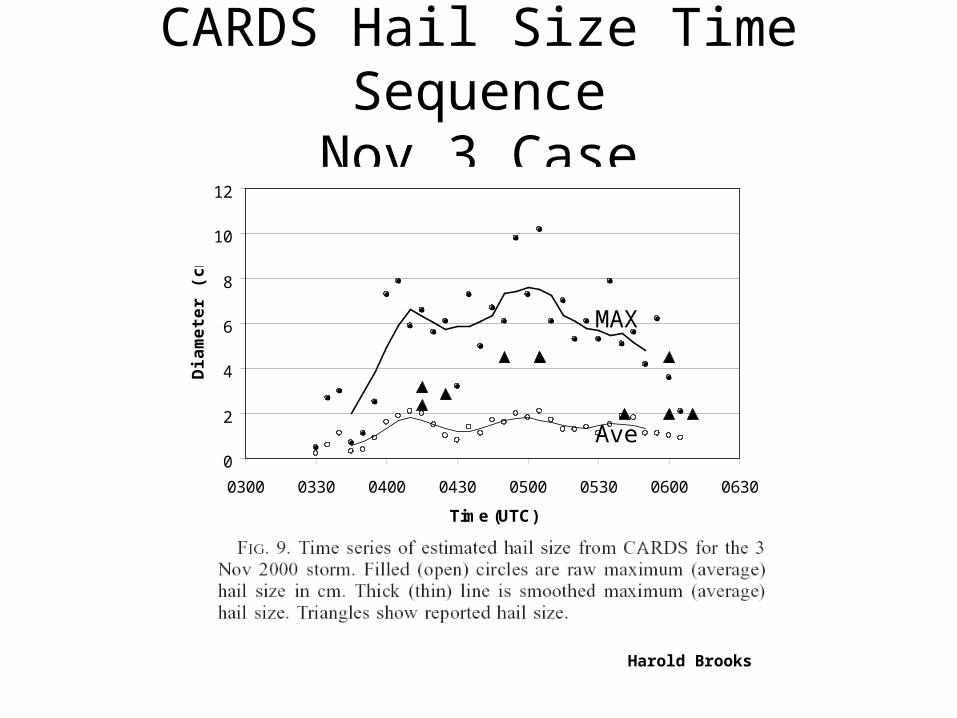
CARDS Hail Size Time SequenceNov 3 Case
0
2
4
6
8
10
12
0300 0330 0400 0430 0500 0530 0600 0630
Time (UTC)
Dia
me
ter
(cm
)
Harold Brooks
MAX
Ave
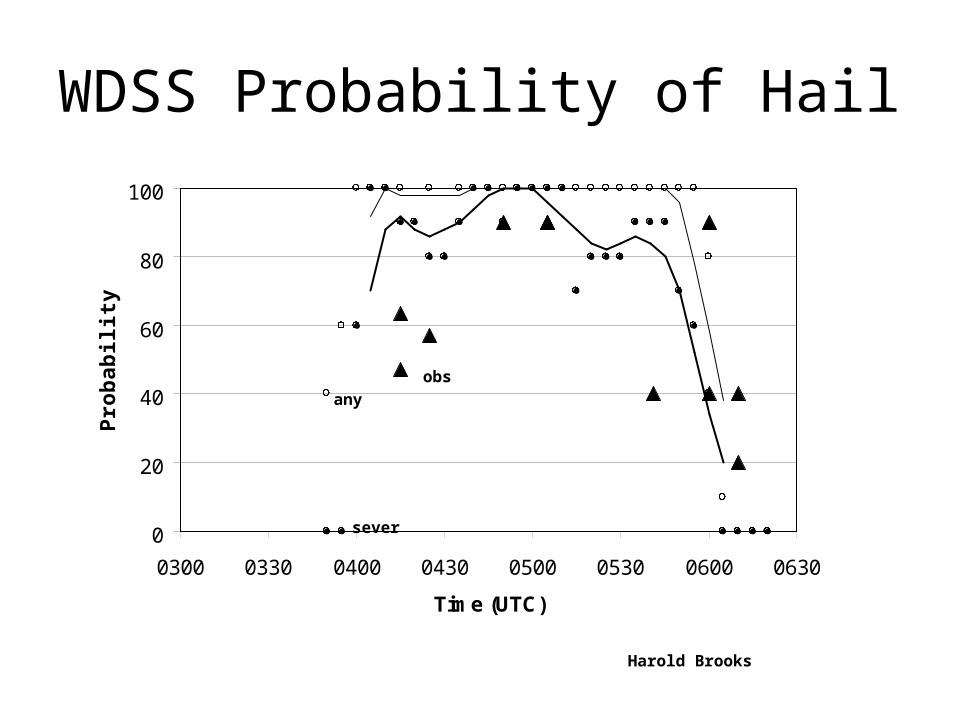
WDSS Probability of Hail
0
20
40
60
80
100
0300 0330 0400 0430 0500 0530 0600 0630
Time (UTC)
Pro
ba
bil
ity
(%
)
sever
any
obs
Harold Brooks
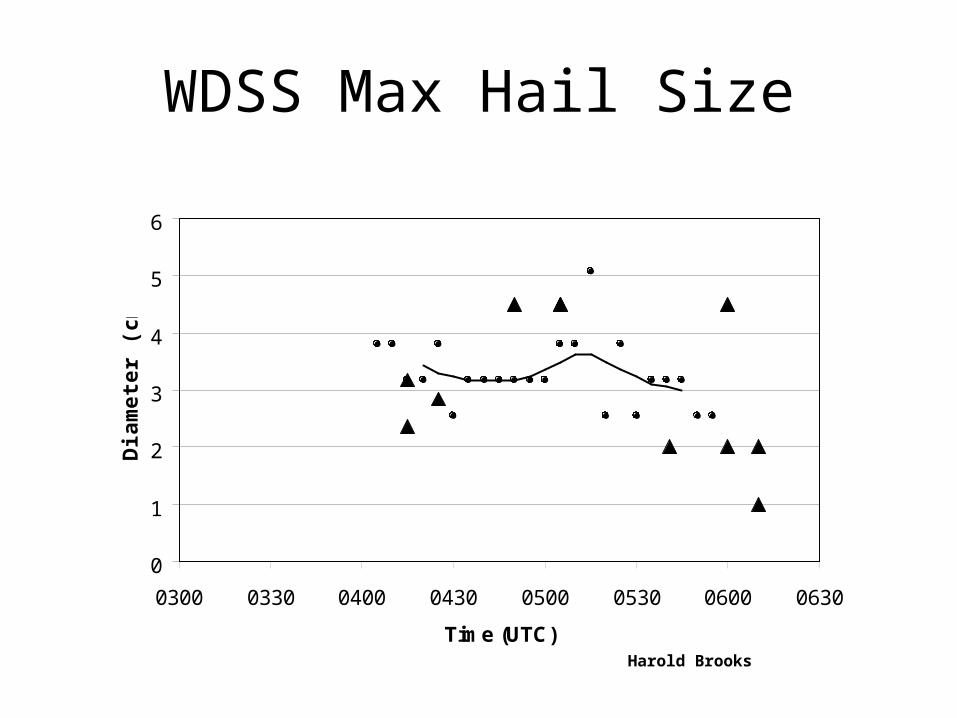
WDSS Max Hail Size
0
1
2
3
4
5
6
0300 0330 0400 0430 0500 0530 0600 0630
Time (UTC)
Dia
me
ter
(cm
)
Harold Brooks
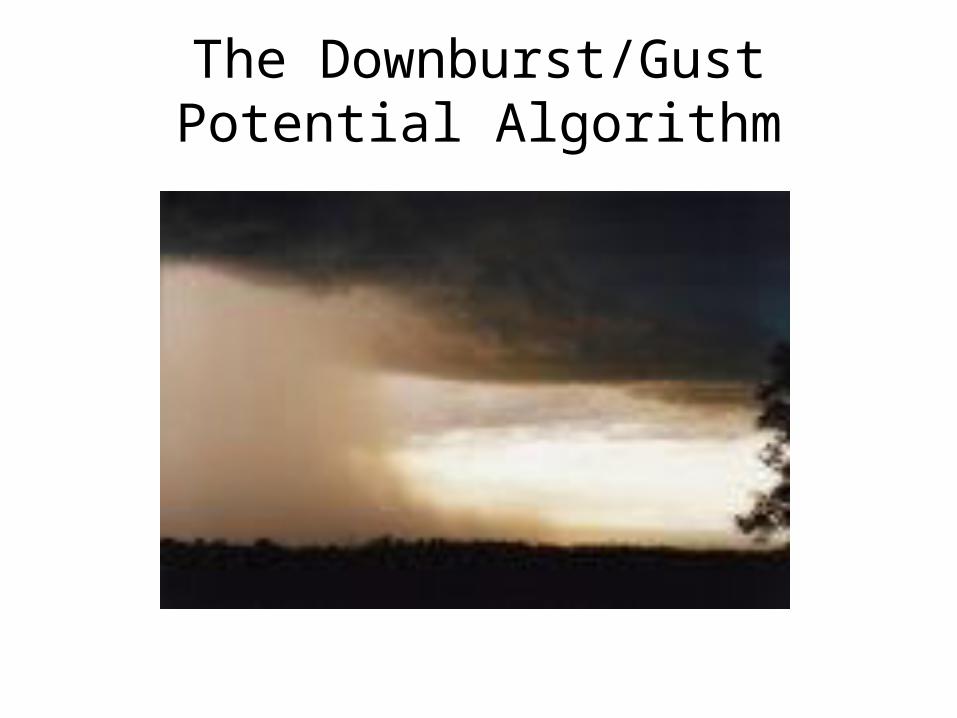
The Downburst/Gust Potential Algorithm
WDraft ProductSpeed of the outflow
• Theoretically based on work by Emmanuel• Empirically adapted by Stewart, OU• VIL -> downdraft strength -> outflow strength• Earlier warning than just the surface divergence
product• Uses volume scan reflectivity data
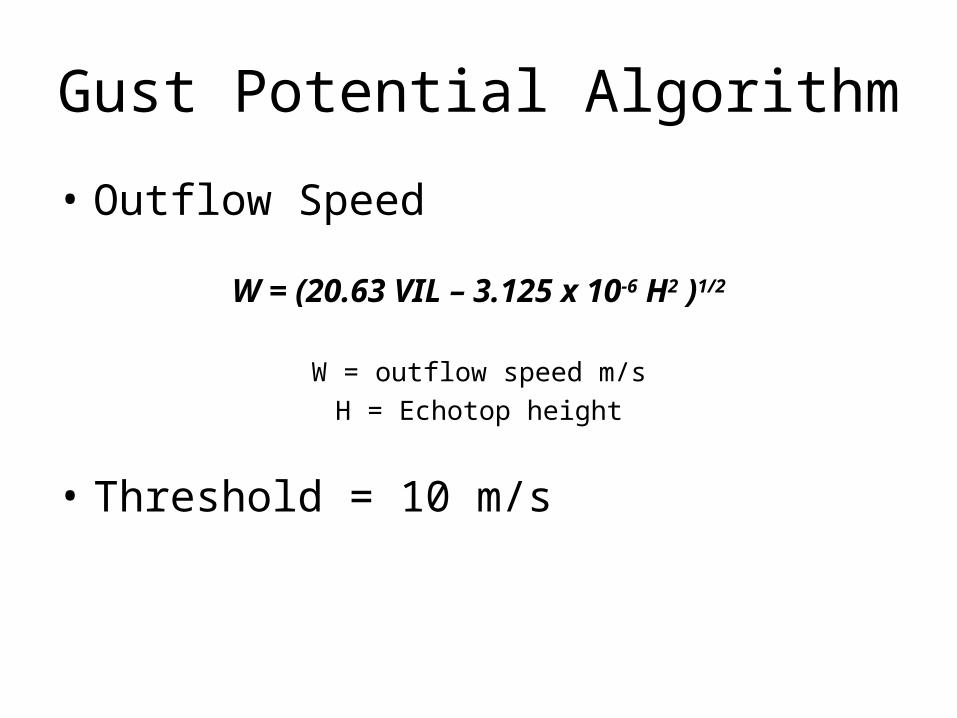
Gust Potential Algorithm
• Outflow Speed
W = (20.63 VIL – 3.125 x 10⁻⁶ H2 )1/2
W = outflow speed m/s
H = Echotop height
• Threshold = 10 m/s
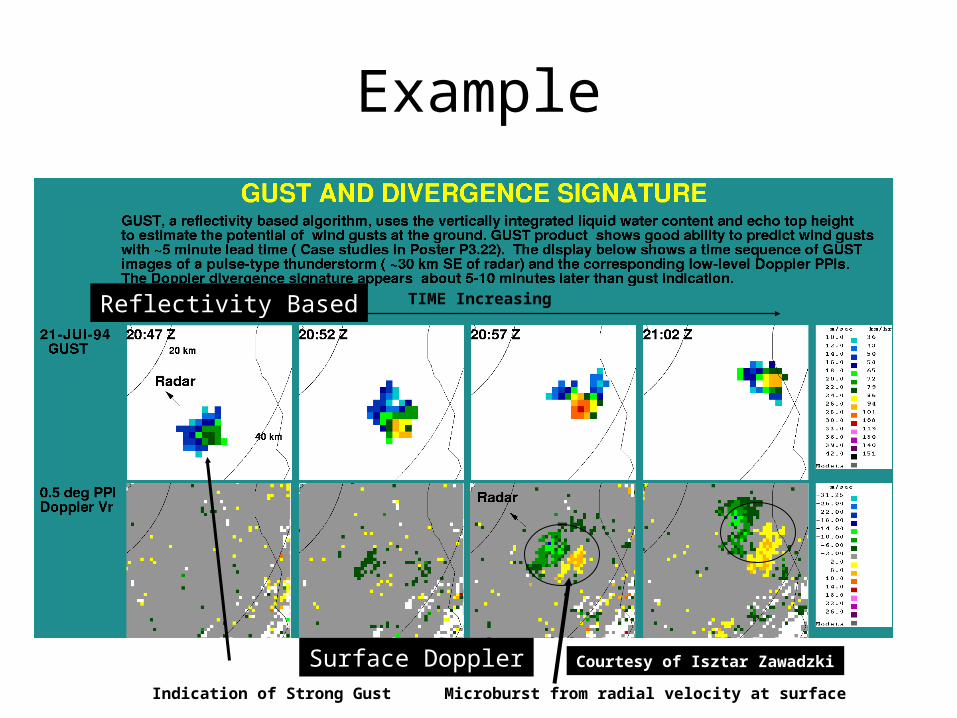
Example
Courtesy of Isztar Zawadzki
Microburst from radial velocity at surfaceIndication of Strong Gust
TIME Increasing
Surface Doppler
Reflectivity Based
Storm Classification Identification and Tracking
Ranking
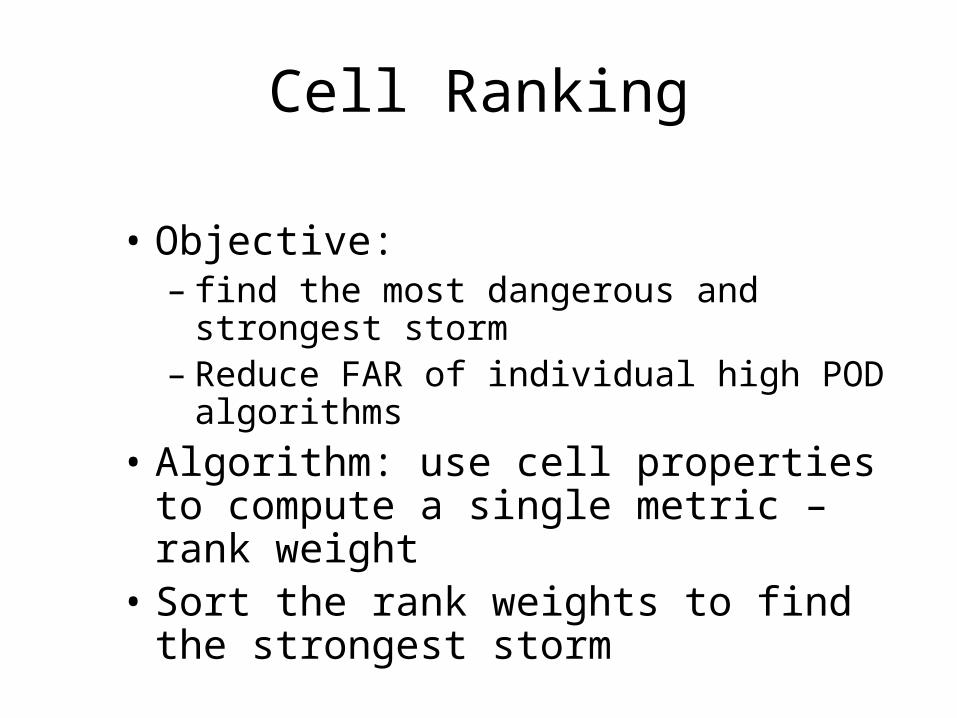
Cell Ranking
• Objective: – find the most dangerous and strongest
storm– Reduce FAR of individual high POD
algorithms
• Algorithm: use cell properties to compute a single metric – rank weight
• Sort the rank weights to find the strongest storm
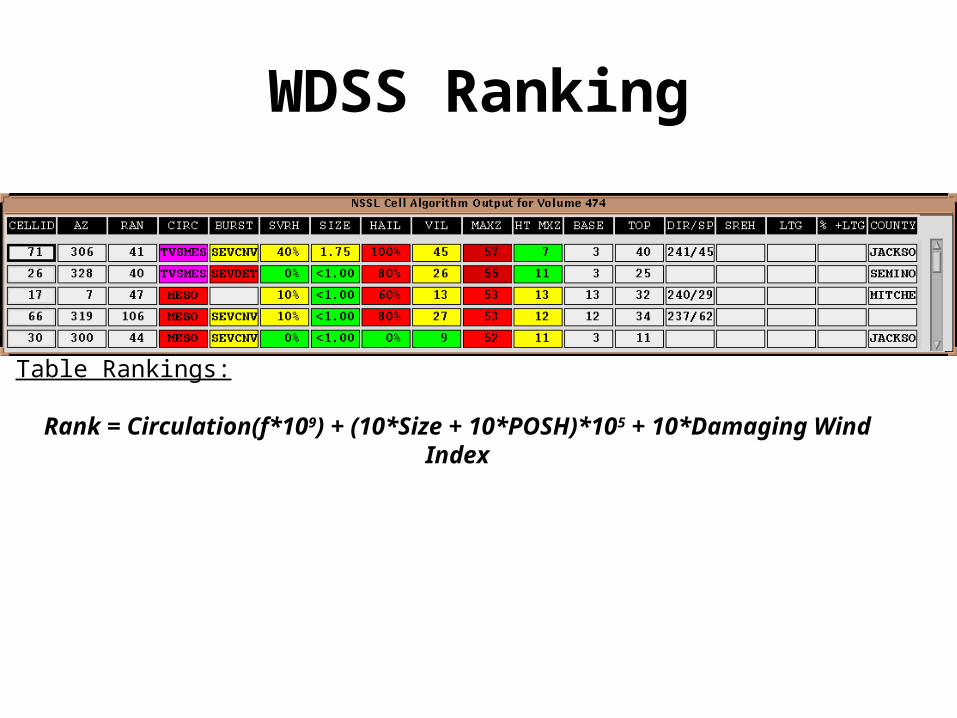
Table Rankings:
Rank = Circulation(f*109) + (10*Size + 10*POSH)*105 + 10*Damaging Wind Index
WDSS Ranking
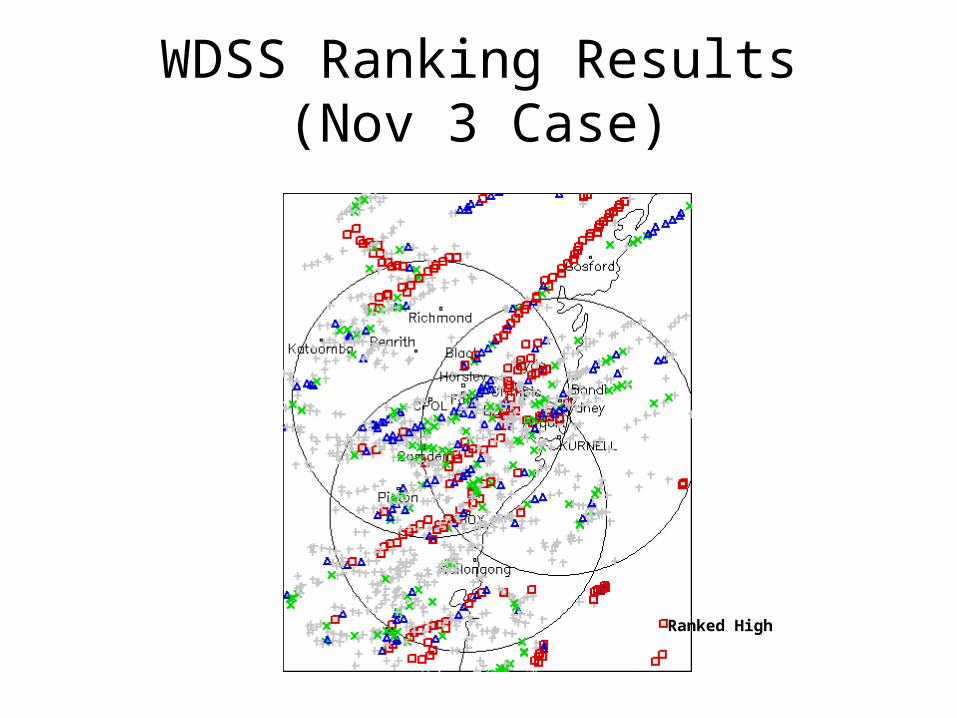
WDSS Ranking Results(Nov 3 Case)
Ranked High
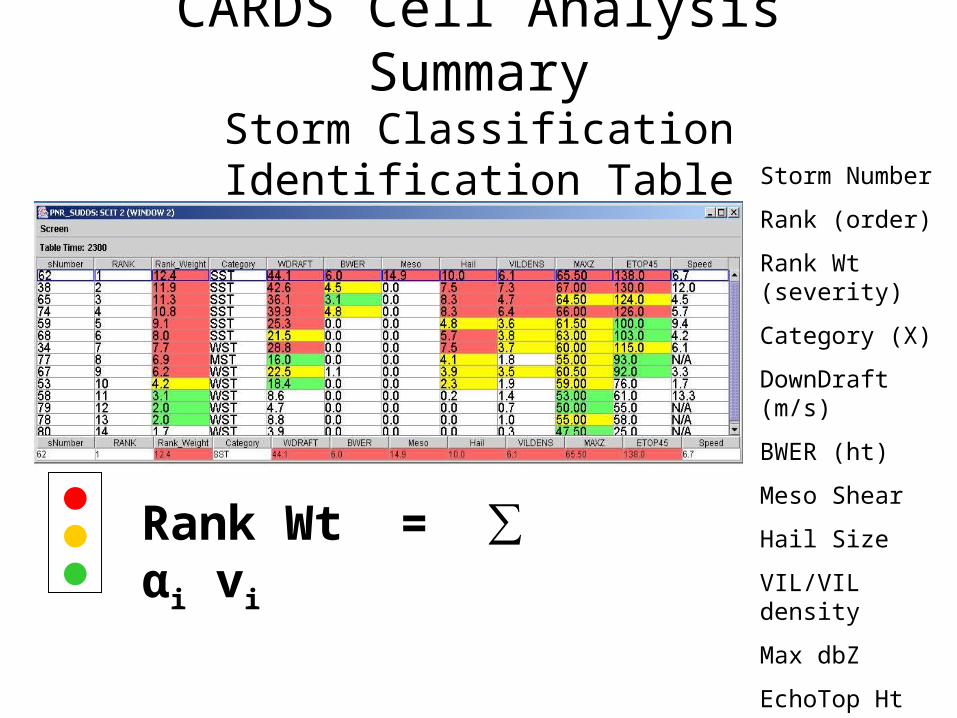
CARDS Cell Analysis SummaryStorm Classification Identification Table
Rank Wt = ∑ αi vi
Storm Number
Rank (order)
Rank Wt (severity)
Category (X)
DownDraft (m/s)
BWER (ht)
Meso Shear
Hail Size
VIL/VIL density
Max dbZ
EchoTop Ht
Speed
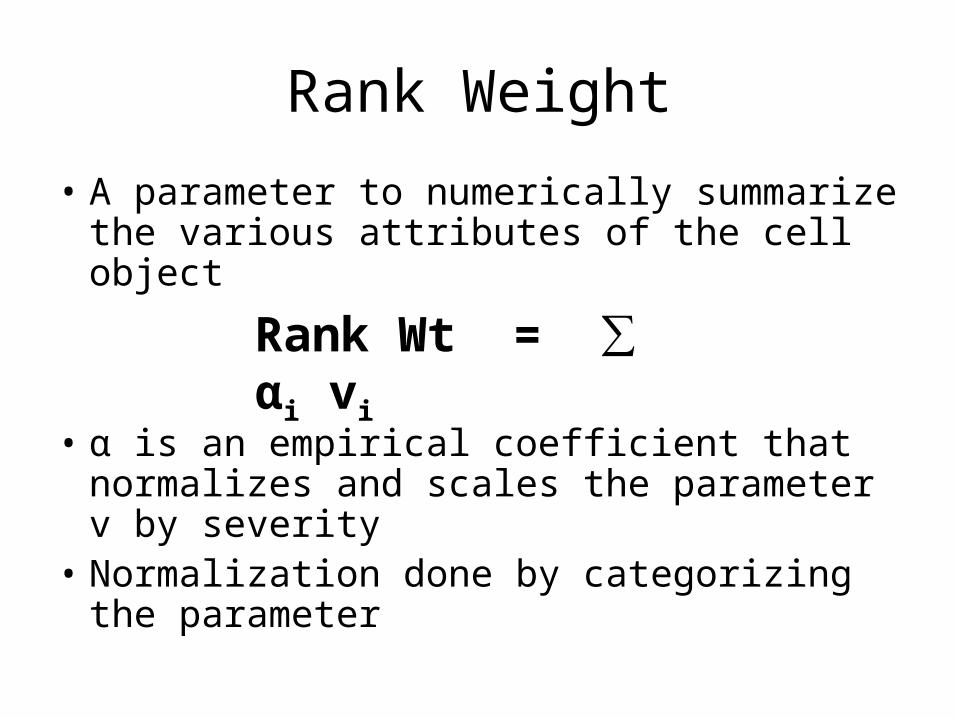
Rank Weight
• A parameter to numerically summarize the various attributes of the cell object
• α is an empirical coefficient that normalizes and scales the parameter v by severity
• Normalization done by categorizing the parameter
Rank Wt = ∑ αi vi
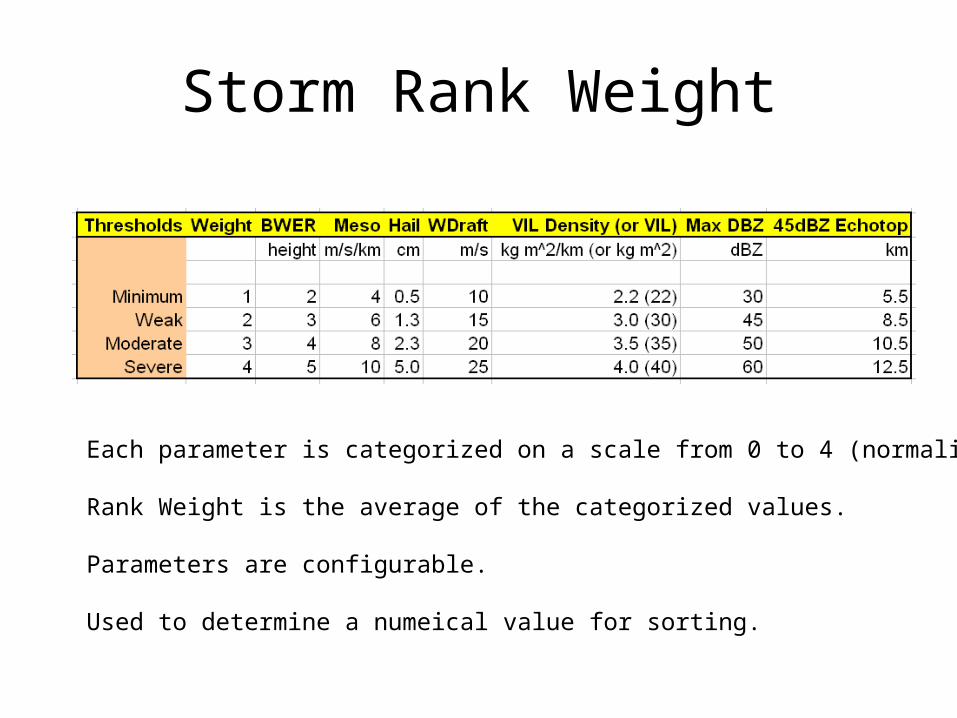
Storm Rank Weight
Each parameter is categorized on a scale from 0 to 4 (normalizing)
Rank Weight is the average of the categorized values.
Parameters are configurable.
Used to determine a numeical value for sorting.

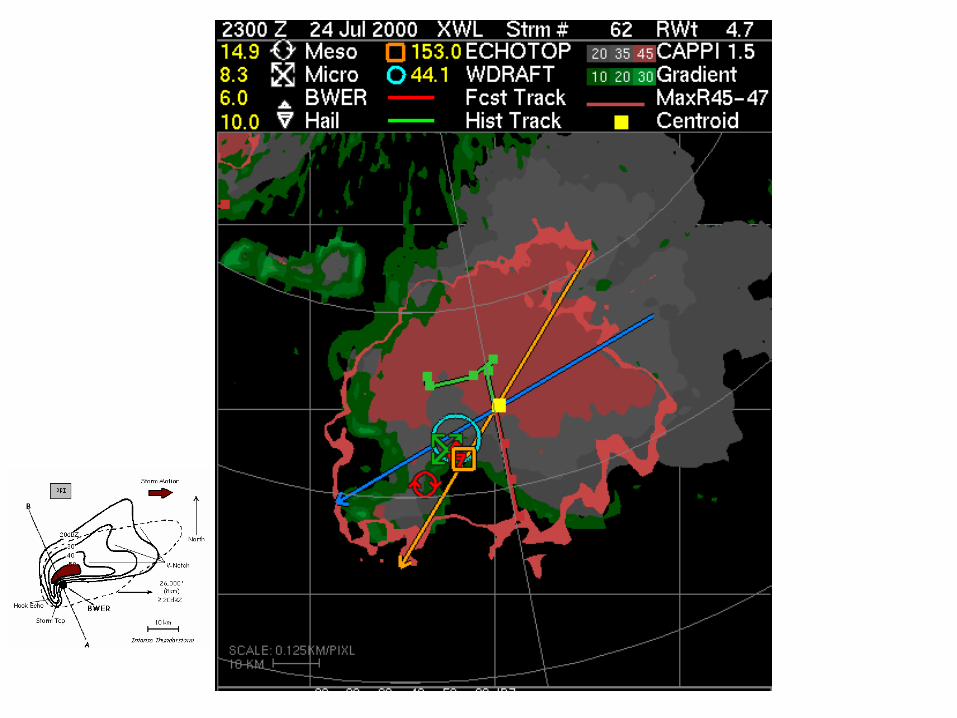
CARDS
Supporting the Mental Model
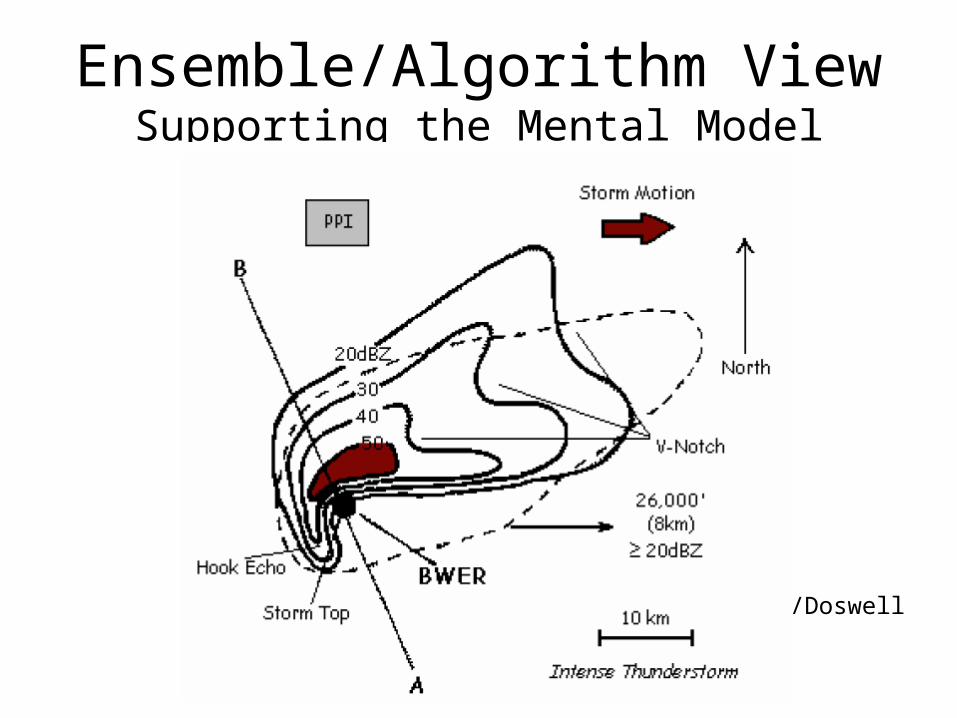
Ensemble/Algorithm ViewSupporting the Mental Model
Lemon/Doswell
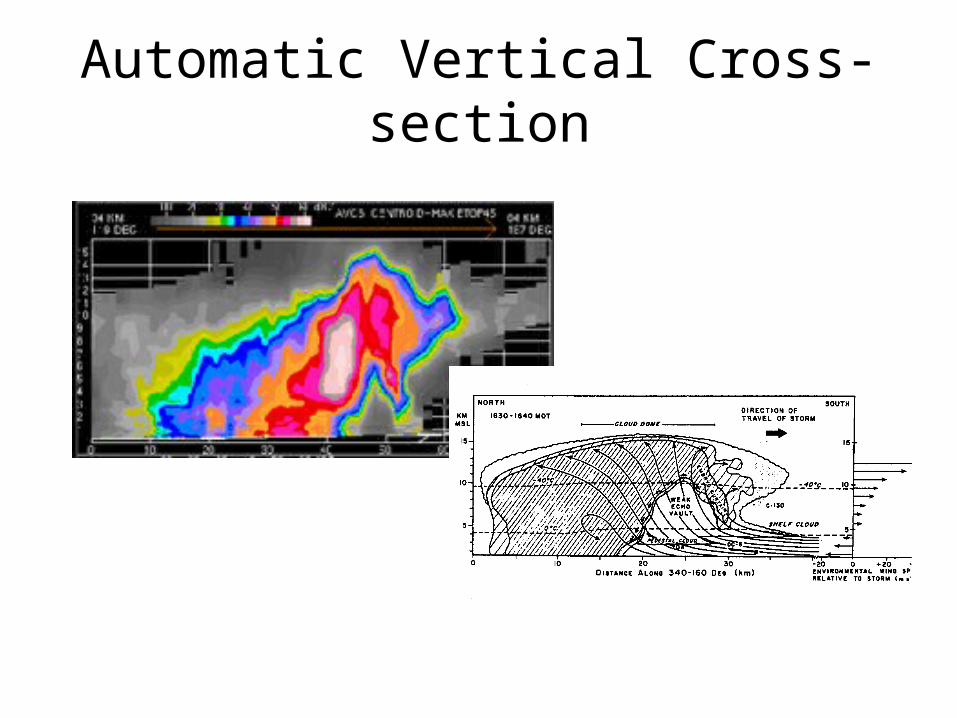
Automatic Vertical Cross-section

More???
G96
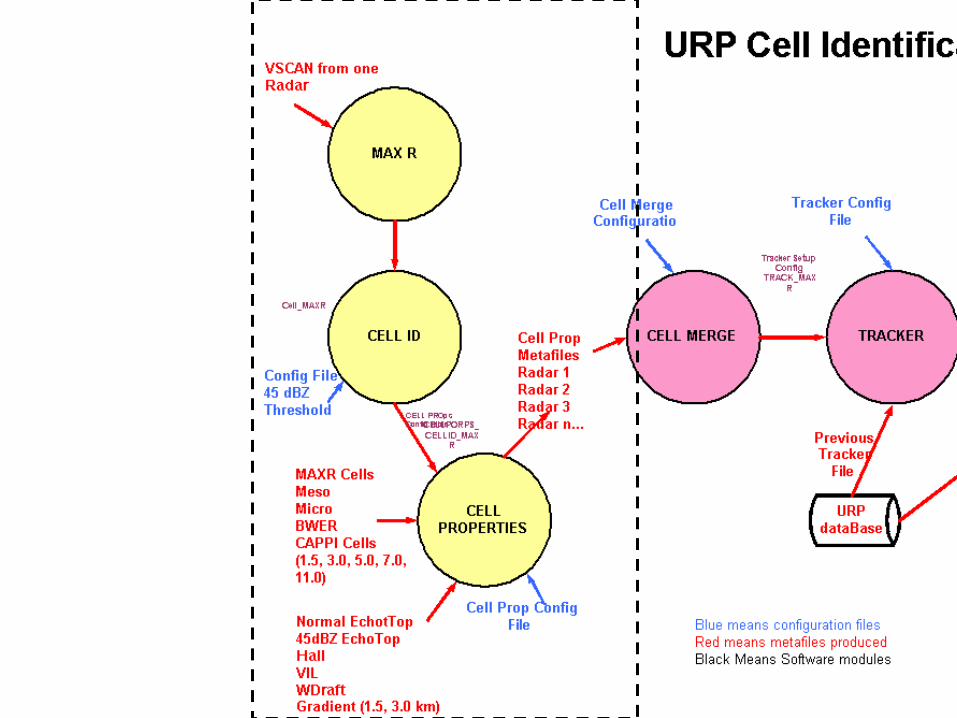
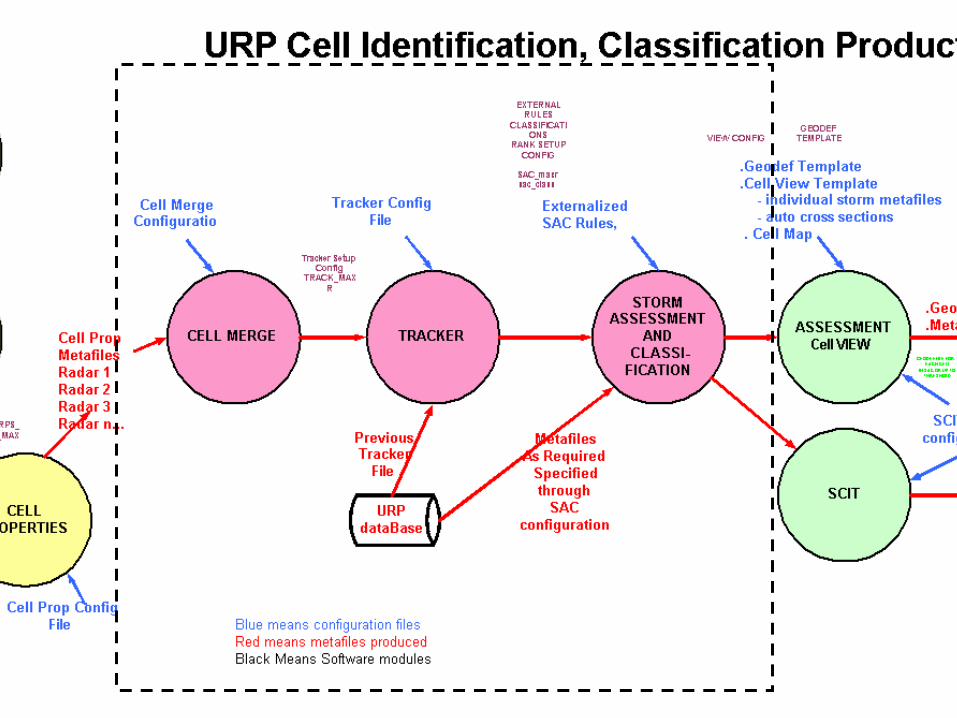
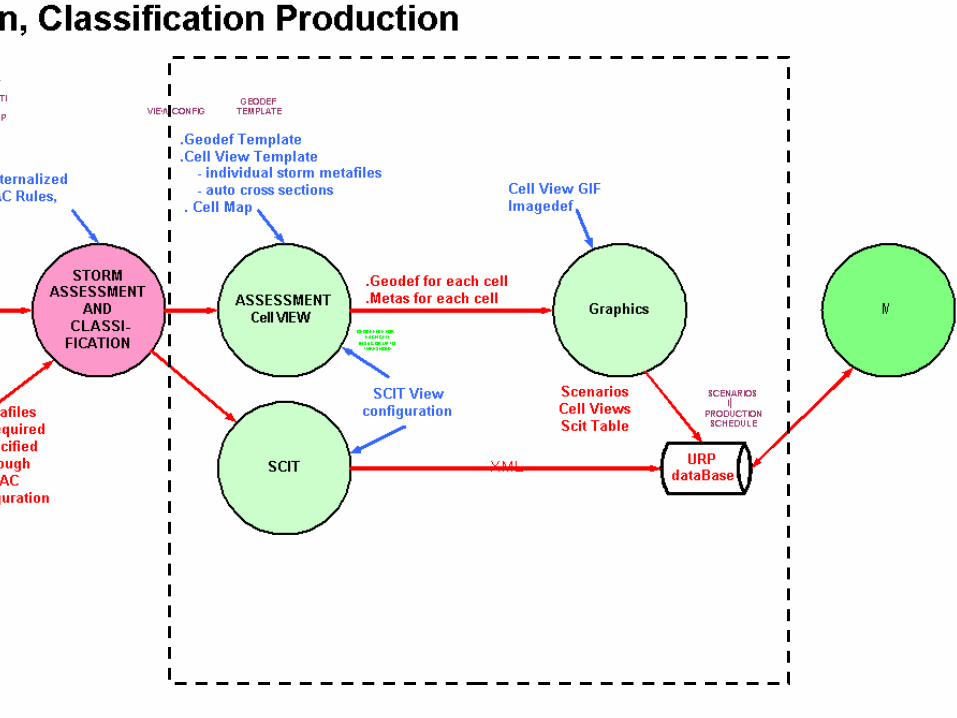
System Design
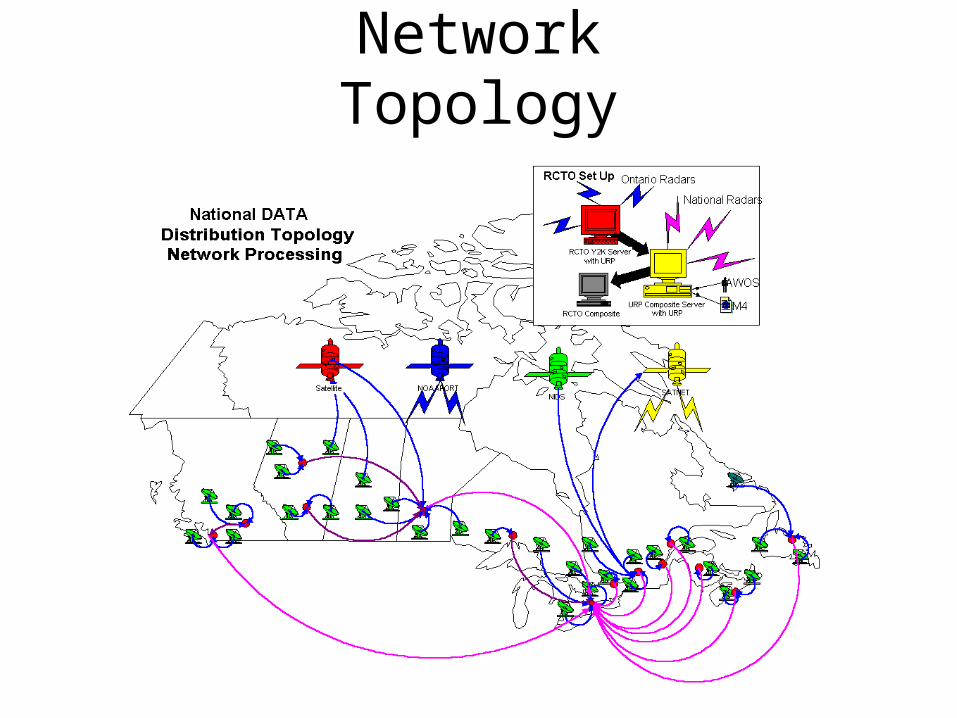
Network Topology
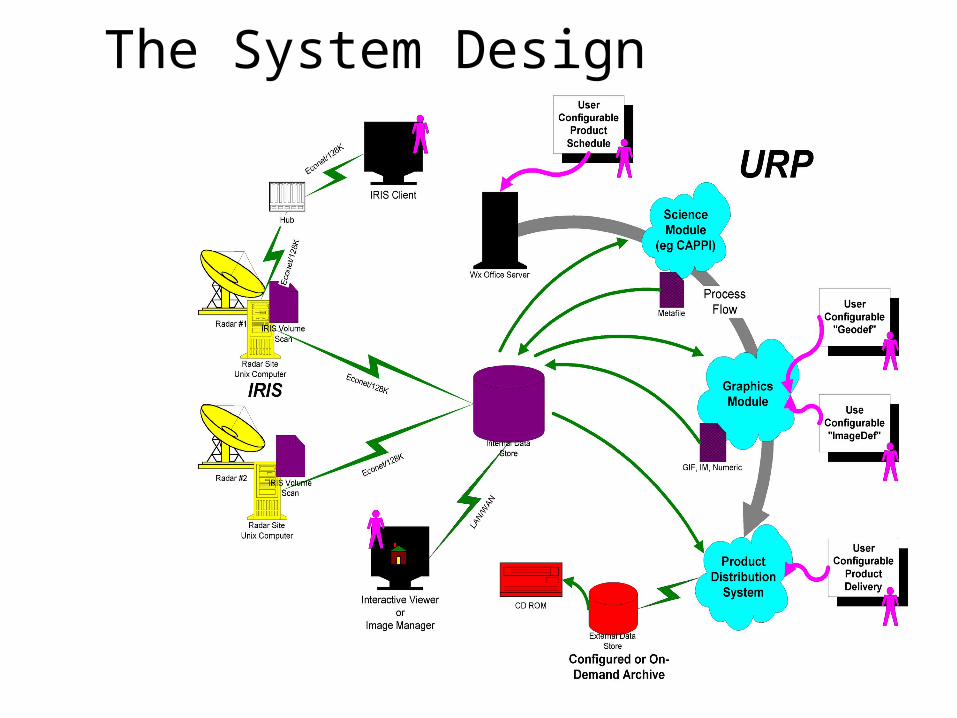
The System Design
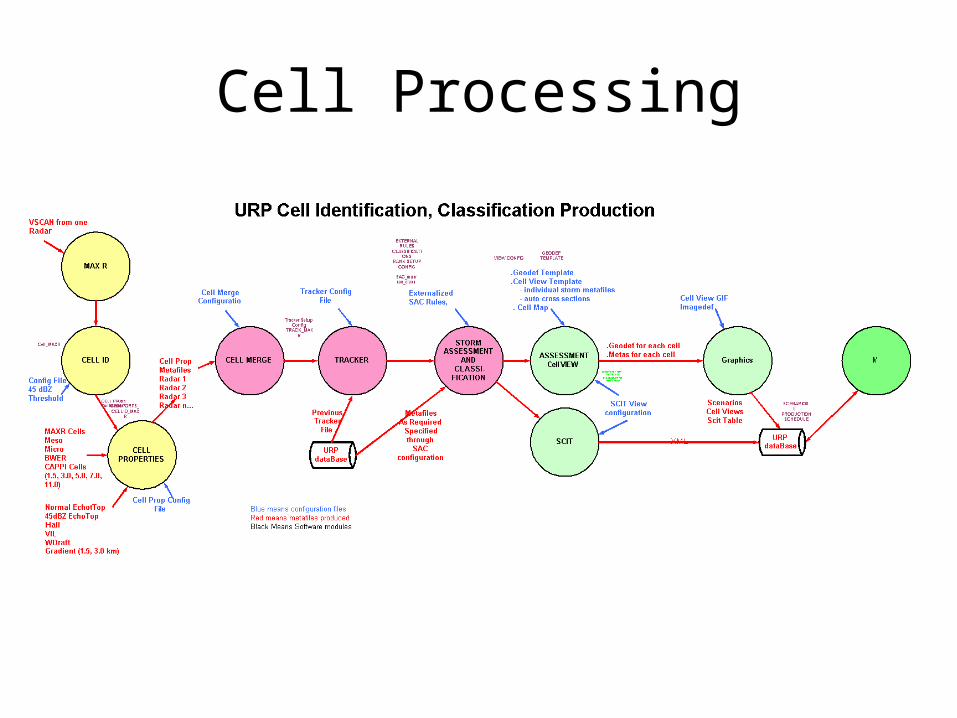
Cell Processing
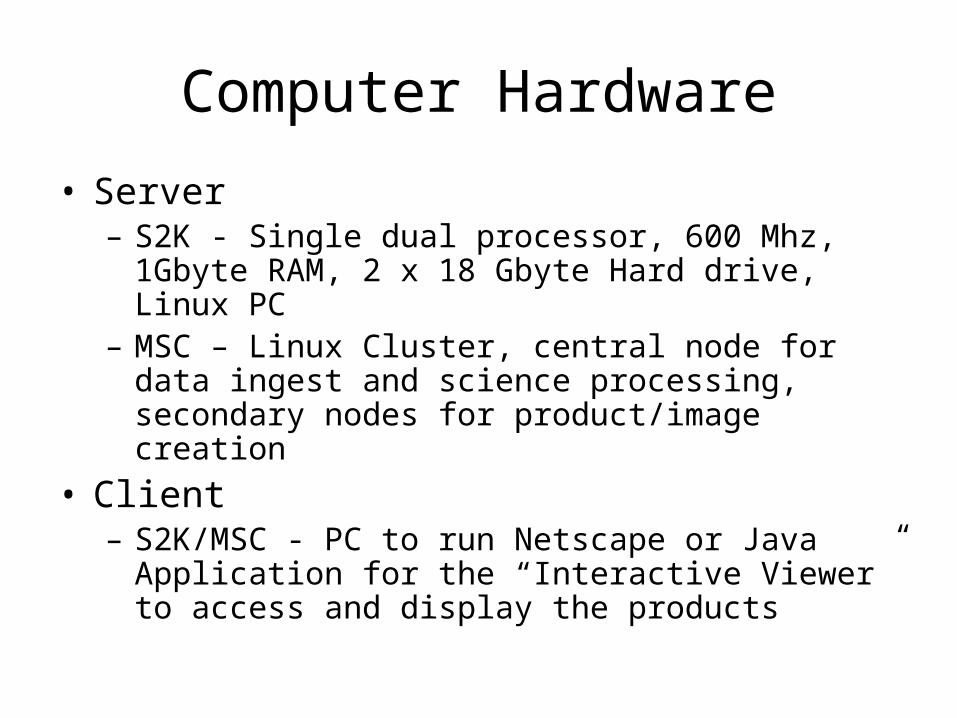
Computer Hardware
• Server– S2K - Single dual processor, 600 Mhz, 1Gbyte RAM,
2 x 18 Gbyte Hard drive, Linux PC– MSC – Linux Cluster, central node for data ingest and
science processing, secondary nodes for product/image creation
• Client– S2K/MSC - PC to run Netscape or Java Application
for the “Interactive Viewer” to access and display the products
Region Growing Algorithm
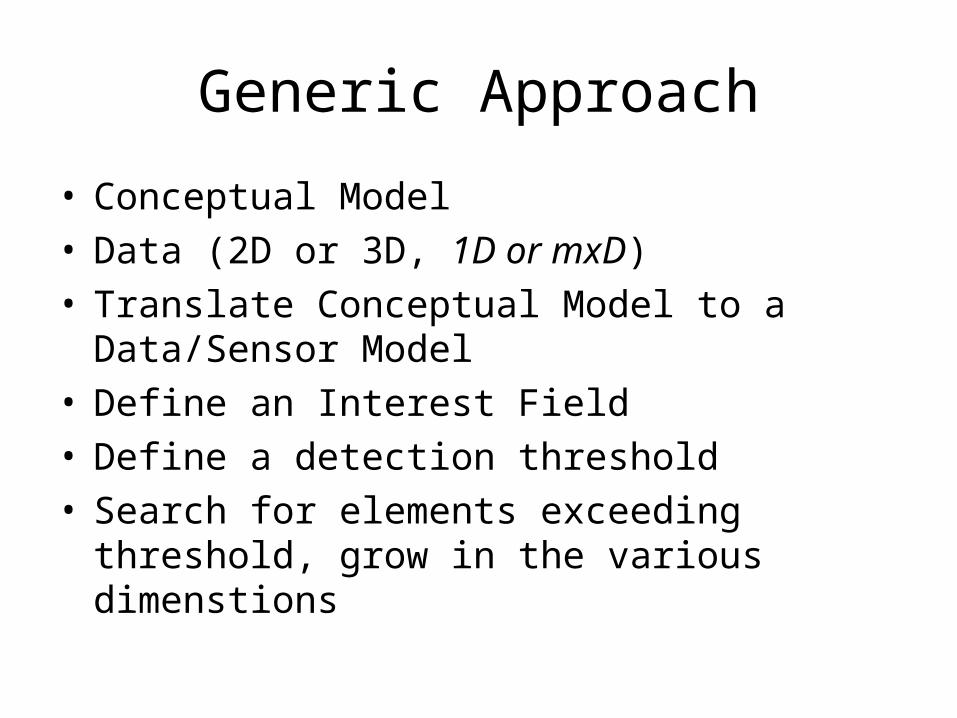
Generic Approach
• Conceptual Model• Data (2D or 3D, 1D or mxD)• Translate Conceptual Model to a Data/Sensor
Model• Define an Interest Field• Define a detection threshold• Search for elements exceeding threshold, grow
in the various dimenstions
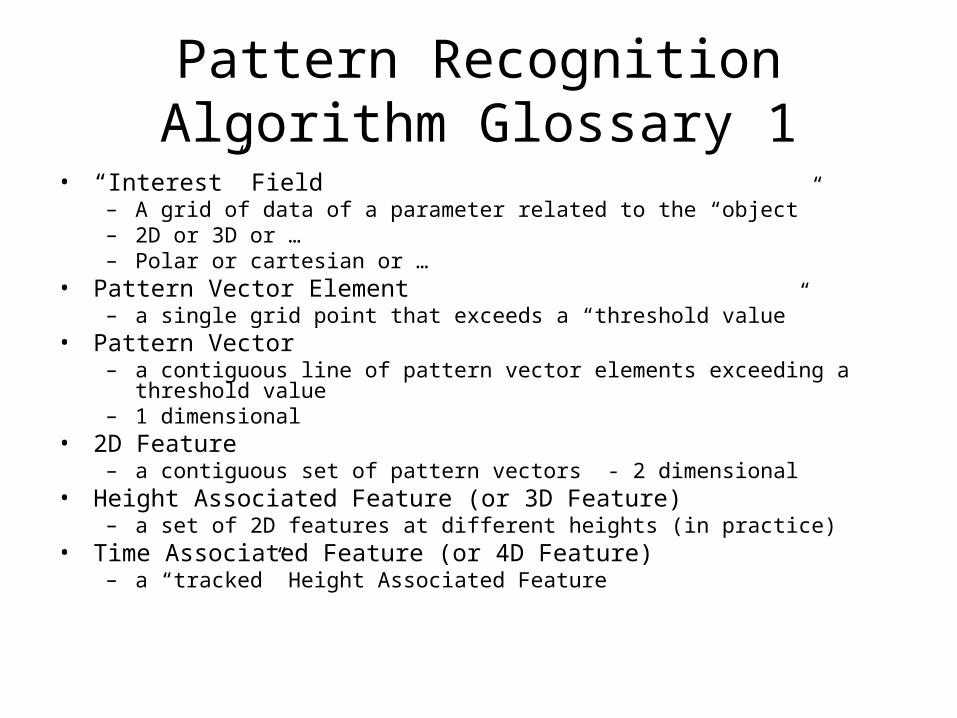
Pattern Recognition Algorithm Glossary 1
• “Interest” Field– A grid of data of a parameter related to the “object”– 2D or 3D or …– Polar or cartesian or …
• Pattern Vector Element– a single grid point that exceeds a “threshold value”
• Pattern Vector– a contiguous line of pattern vector elements exceeding a threshold value– 1 dimensional
• 2D Feature– a contiguous set of pattern vectors - 2 dimensional
• Height Associated Feature (or 3D Feature)– a set of 2D features at different heights (in practice)
• Time Associated Feature (or 4D Feature)– a “tracked” Height Associated Feature
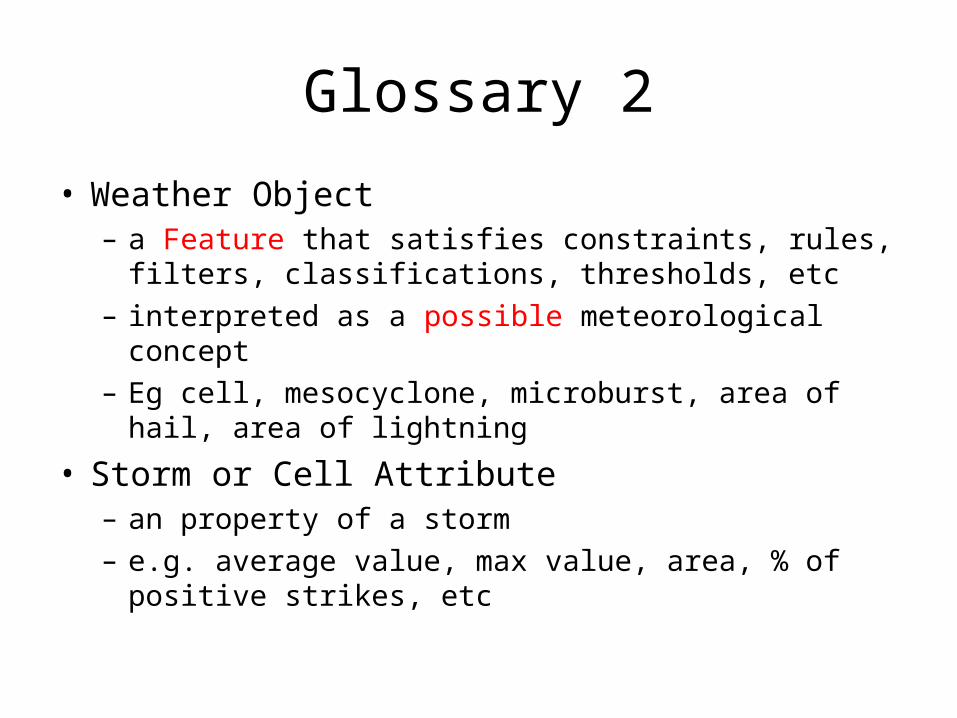
Glossary 2
• Weather Object– a Feature that satisfies constraints, rules, filters,
classifications, thresholds, etc – interpreted as a possible meteorological concept– Eg cell, mesocyclone, microburst, area of hail, area of
lightning
• Storm or Cell Attribute– an property of a storm– e.g. average value, max value, area, % of positive
strikes, etc
Glossary 3
• Field– a two dimensional array of a (radar or
derived) parameter– eg PPI of reflectivities, echotop heights
• Template– a two dimensional area defined by the extents
of the pattern vectors of a feature– Subset of a field
Cell or Feature Identification
Example of the Approach
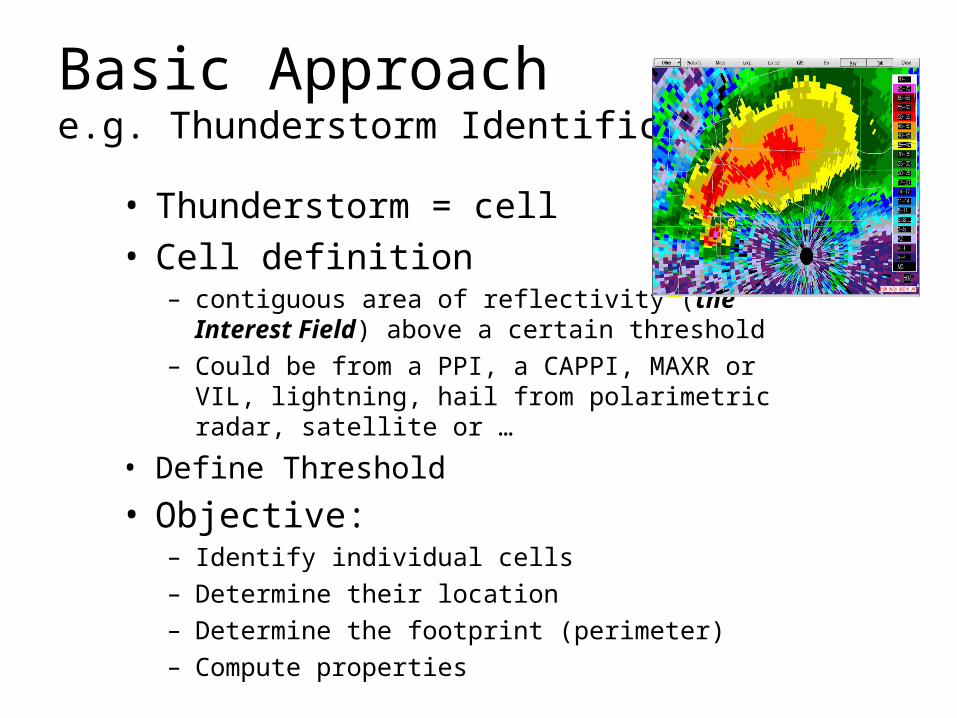
Basic Approach e.g. Thunderstorm Identification
• Thunderstorm = cell • Cell definition
– contiguous area of reflectivity (the Interest Field) above a certain threshold
– Could be from a PPI, a CAPPI, MAXR or VIL, lightning, hail from polarimetric radar, satellite or …
• Define Threshold
• Objective: – Identify individual cells– Determine their location– Determine the footprint (perimeter)– Compute properties
Interest Fields and Thresholds Summary
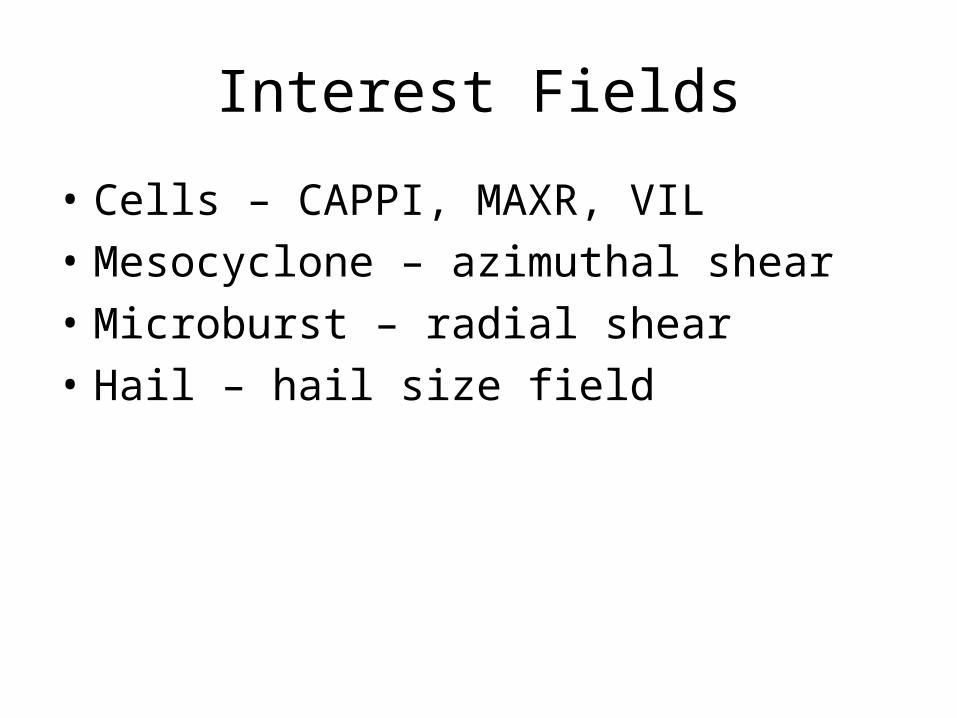
Interest Fields
• Cells – CAPPI, MAXR, VIL
• Mesocyclone – azimuthal shear
• Microburst – radial shear
• Hail – hail size field
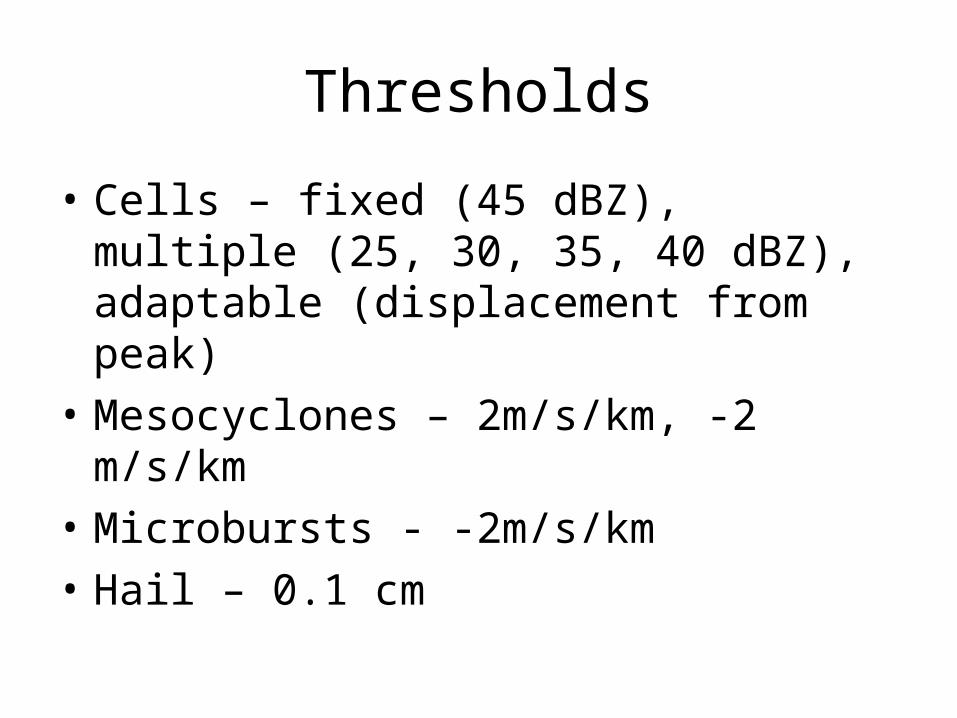
Thresholds
• Cells – fixed (45 dBZ), multiple (25, 30, 35, 40 dBZ), adaptable (displacement from peak)
• Mesocyclones – 2m/s/km, -2 m/s/km
• Microbursts - -2m/s/km
• Hail – 0.1 cm
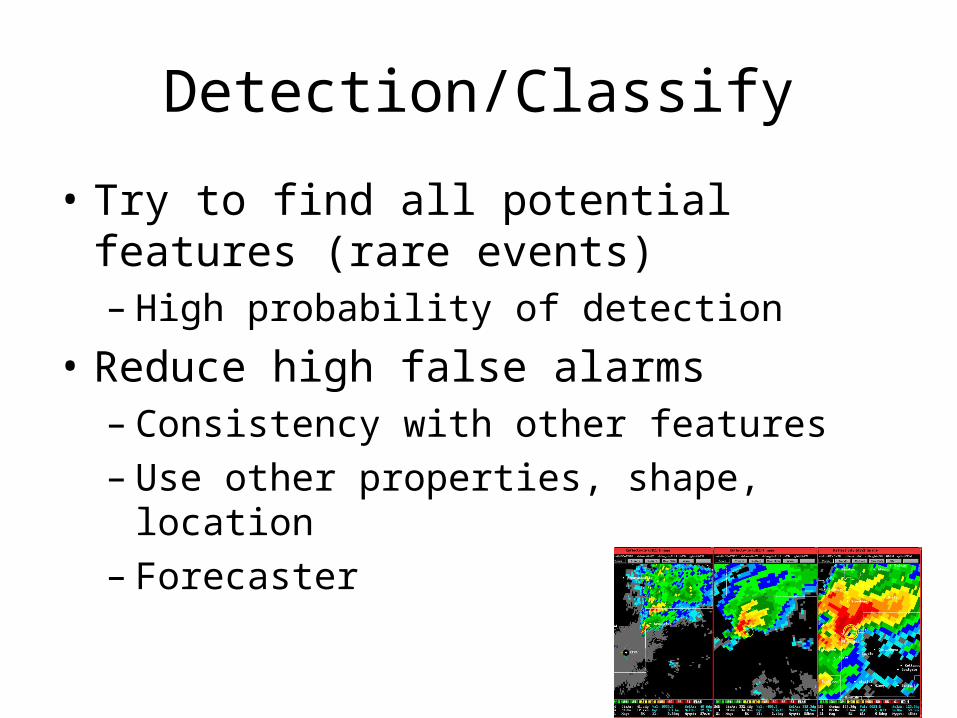
Detection/Classify
• Try to find all potential features (rare events)– High probability of detection
• Reduce high false alarms– Consistency with other features– Use other properties, shape, location– Forecaster
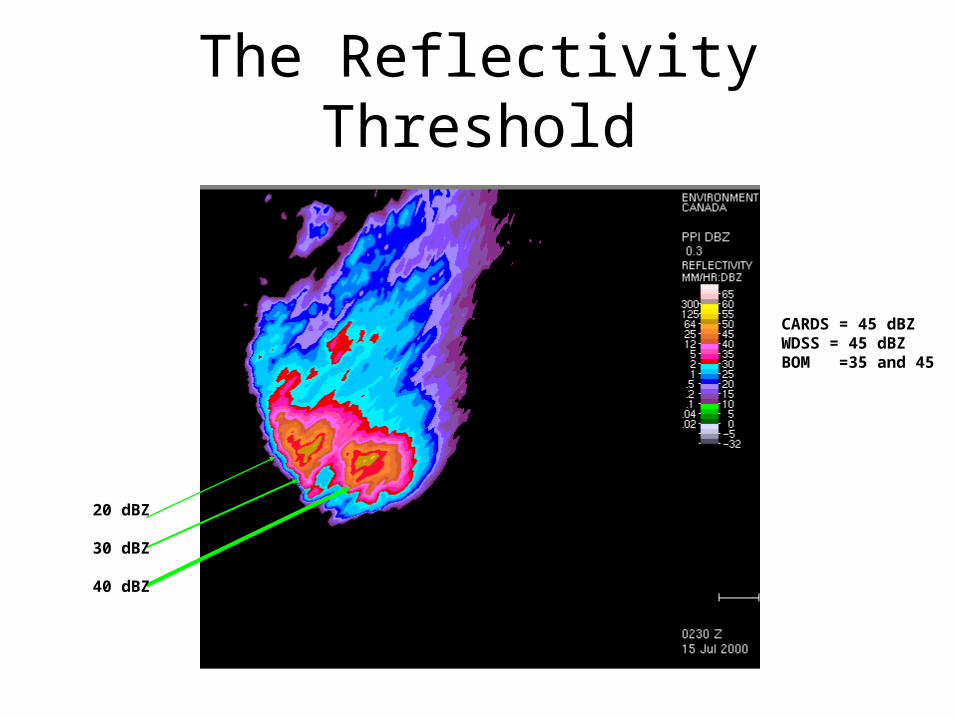
The Reflectivity Threshold
20 dBZ
30 dBZ
40 dBZ
CARDS = 45 dBZWDSS = 45 dBZBOM =35 and 45
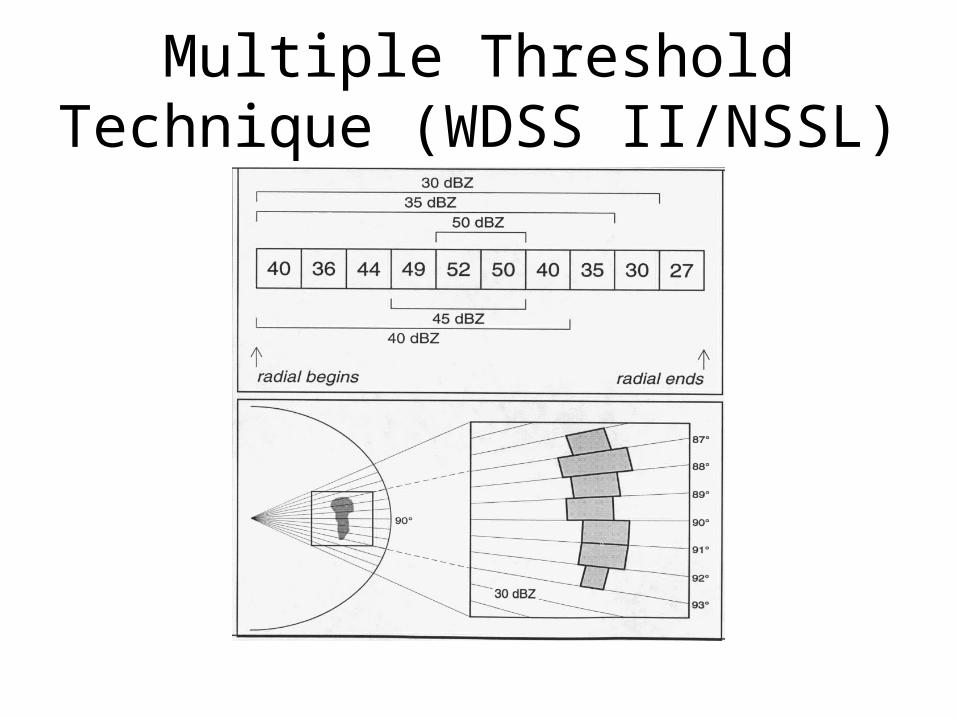
Multiple Threshold Technique (WDSS II/NSSL)
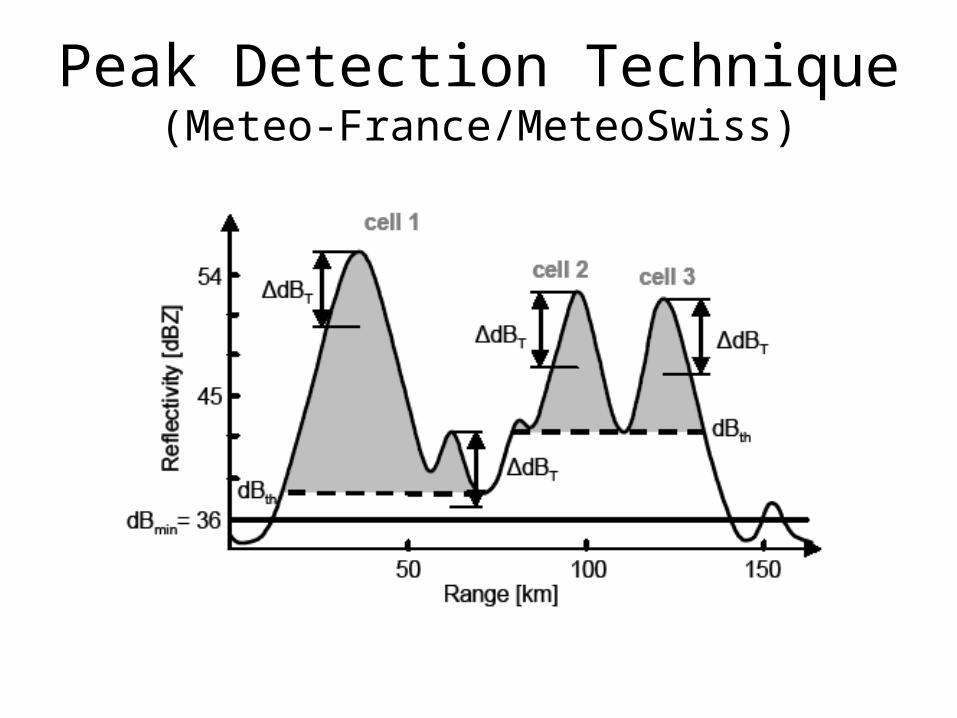
Peak Detection Technique(Meteo-France/MeteoSwiss)
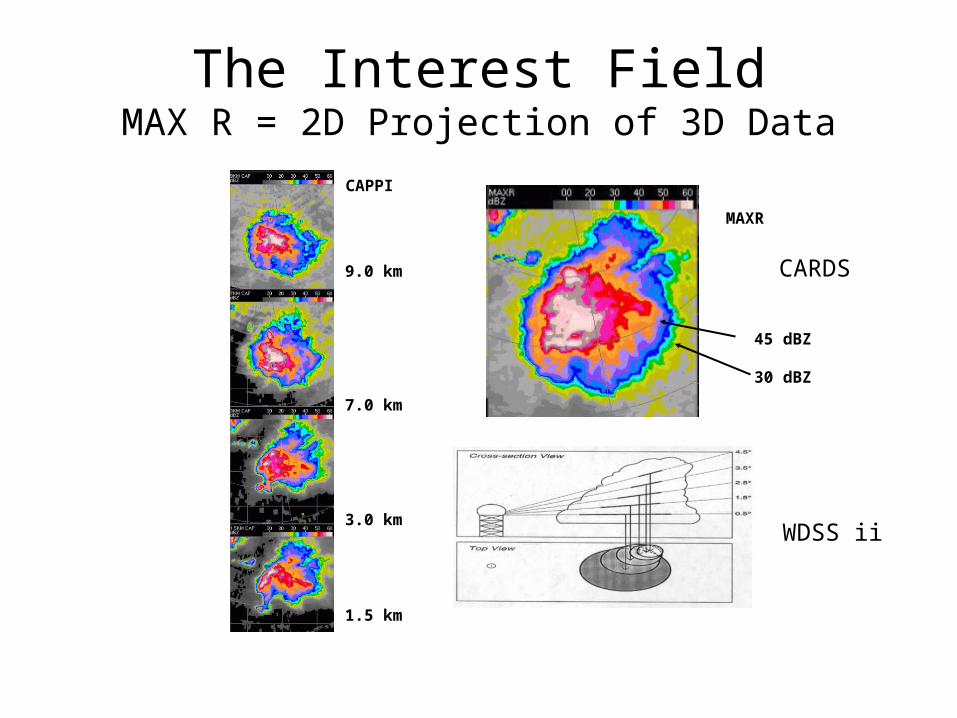
The Interest FieldMAX R = 2D Projection of 3D Data
9.0 km
7.0 km
3.0 km
1.5 km
CAPPI
MAXR
45 dBZ
30 dBZ
WDSS ii
CARDS

The Region Growing Algorithm
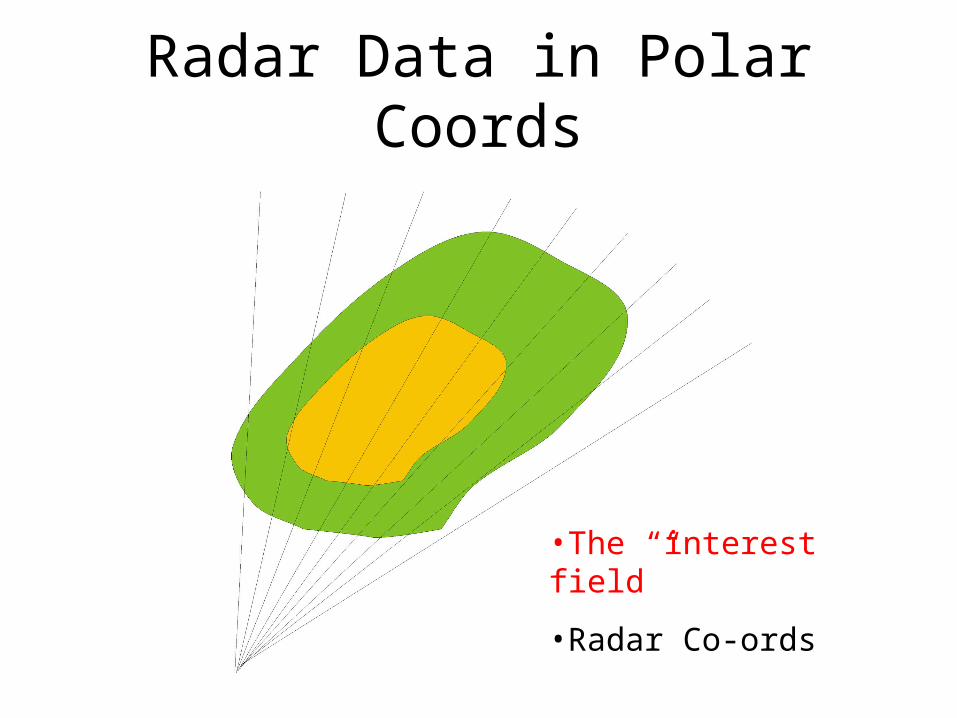
Radar Data in Polar Coords
•The “interest field”
•Radar Co-ords
Region Growing Algorithm
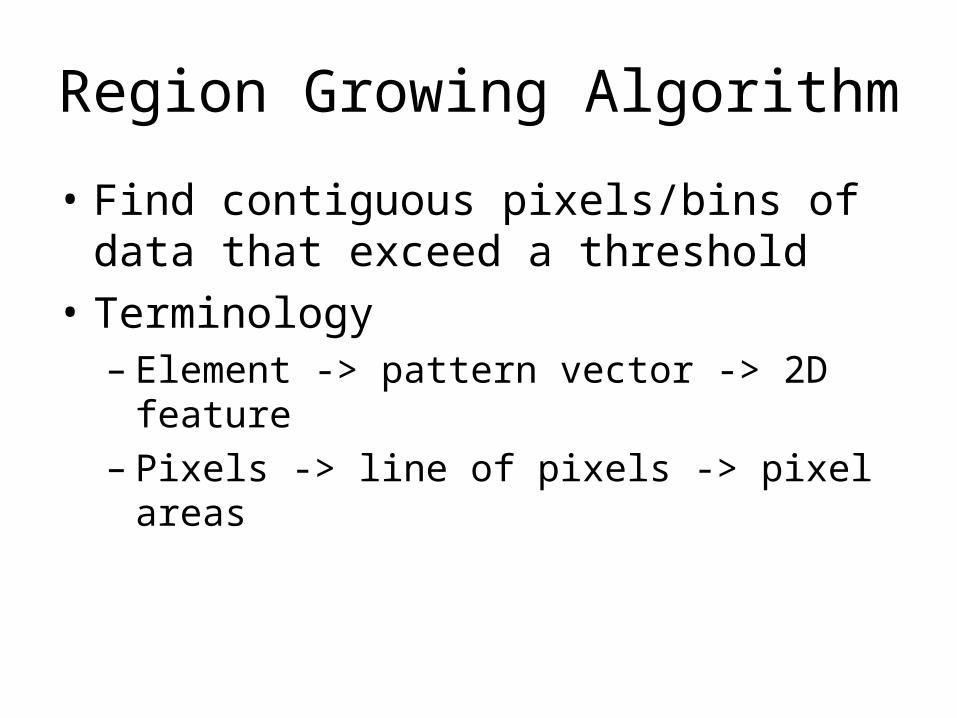
• Find contiguous pixels/bins of data that exceed a threshold
• Terminology– Element -> pattern vector -> 2D feature– Pixels -> line of pixels -> pixel areas
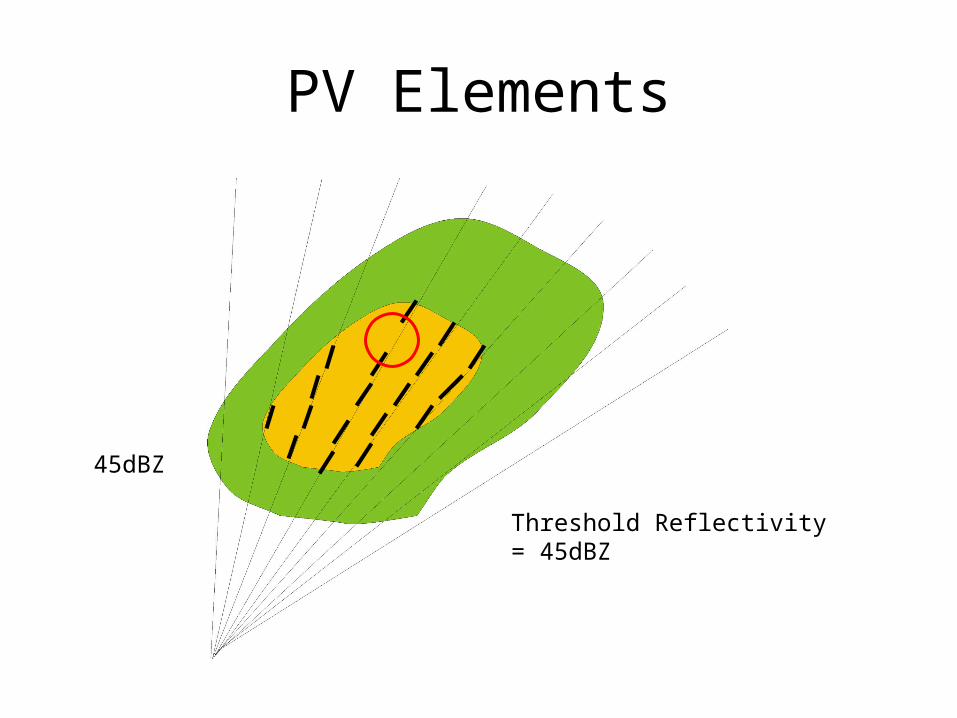
PV Elements
Threshold Reflectivity = 45dBZ
45dBZ
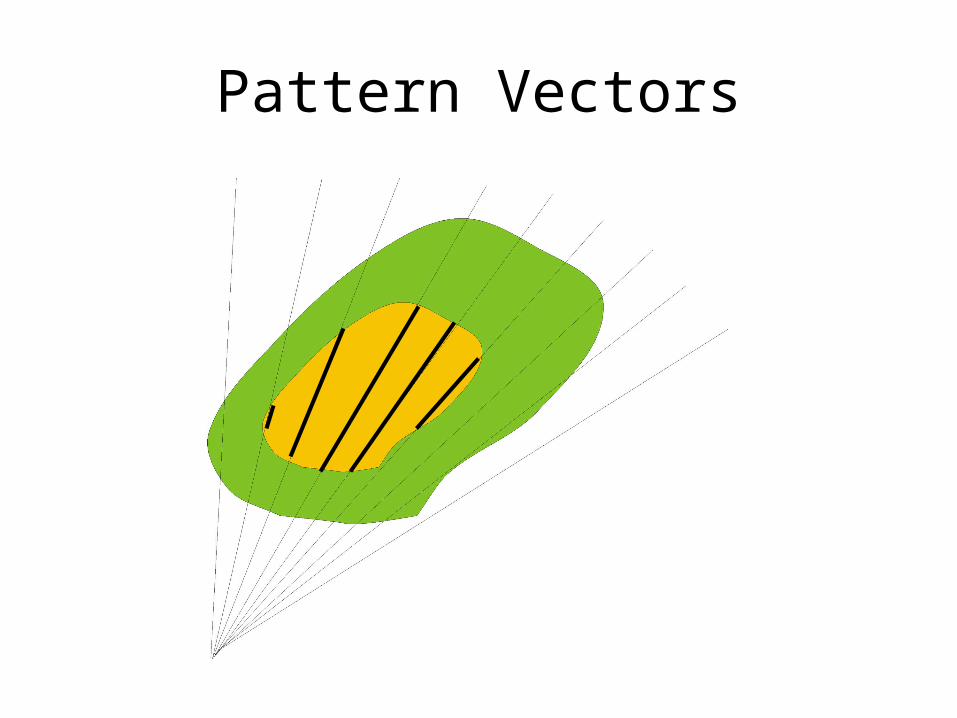
Pattern Vectors
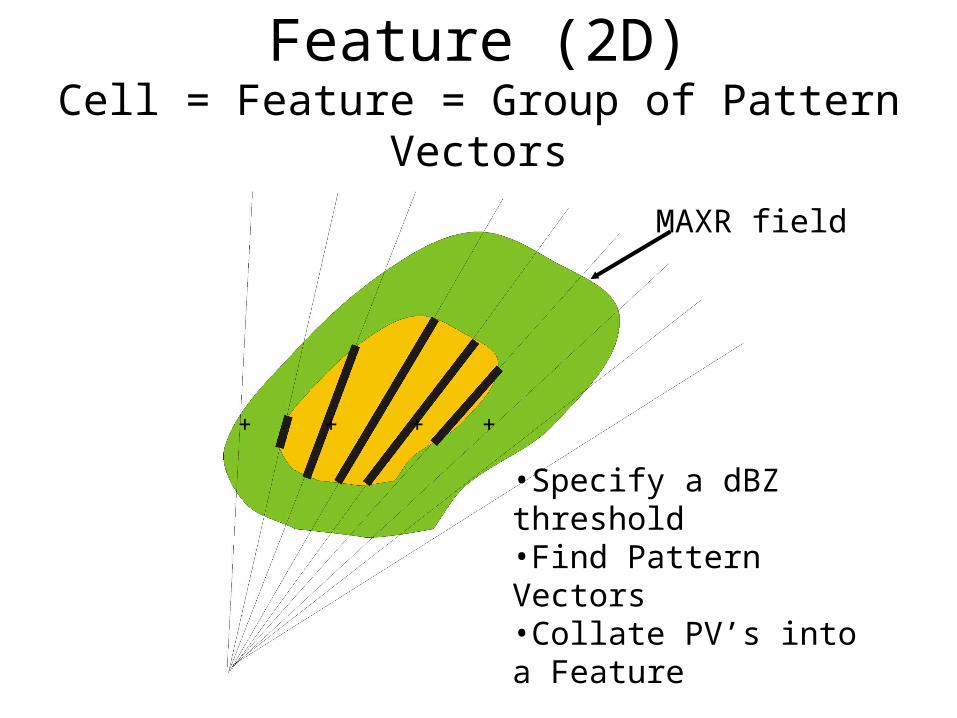
Feature (2D)Cell = Feature = Group of Pattern Vectors
•Specify a dBZ threshold•Find Pattern Vectors•Collate PV’s into a Feature
MAXR field
+ + + +
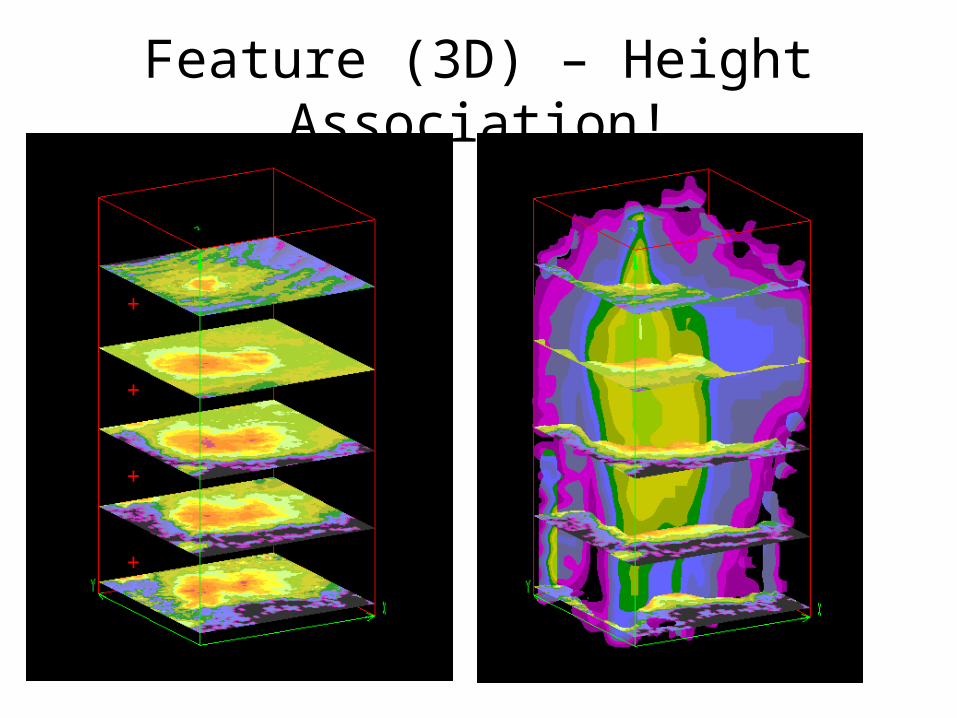
Feature (3D) – Height Association!
+
+
+
+
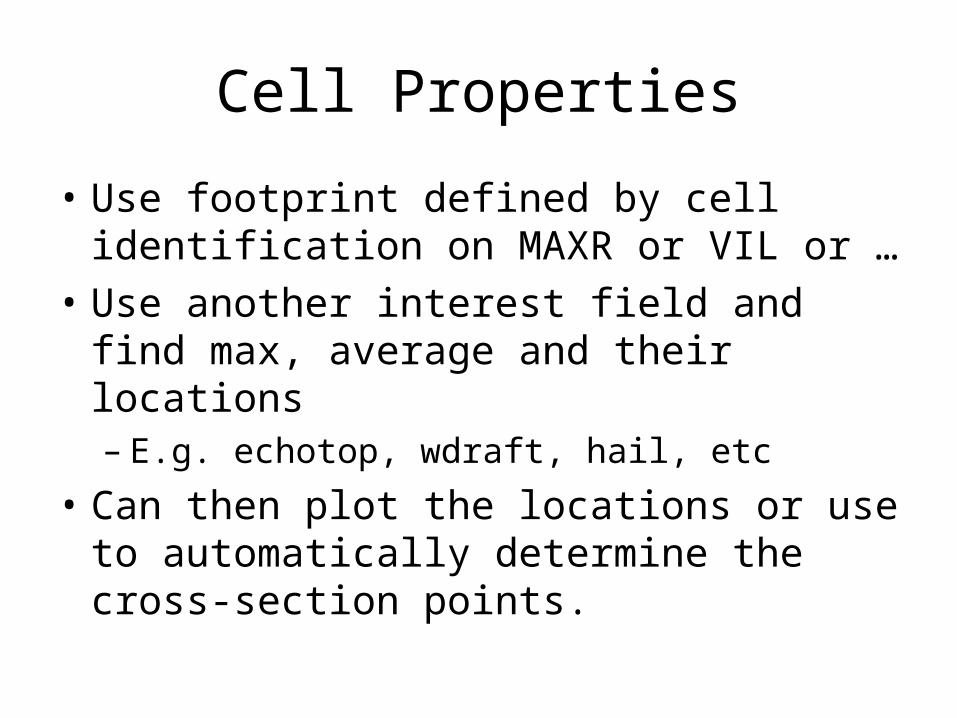
Cell Properties
• Use footprint defined by cell identification on MAXR or VIL or …
• Use another interest field and find max, average and their locations– E.g. echotop, wdraft, hail, etc
• Can then plot the locations or use to automatically determine the cross-section points.
Summary
• Brief description of the CARDS system• Setup for high probability of detection, results in high
false alarm rate• Use the combination of algorithm outputs to determine
the most intense storms.• Fuzzy logic storm ranking• Rapid access to products• \Assume expert user
– Maintain situational awareness– Provide guidance/leverage products, drill down to data, hint at
where and what to look for in detail, require forecaster for final decision making